Attached files
| file | filename |
|---|---|
| 8-K - FORM 8-K - Ameris Bancorp | v422641_8k.htm |
| EX-99.1 - EXHIBIT 99.1 - Ameris Bancorp | v422641_ex99-1.htm |
Exhibit 99.2
Ameris Bancorp 3 rd Quarter 2015 Earnings Presentation Edwin W. Hortman, Jr. – President & CEO Dennis J. Zember, Jr. – EVP & CFO

This presentation contains certain performance measures determined by methods other than in accordance with accounting principles generally accepted in the United States of America (“GAAP”) . Management of Ameris Bancorp (the “Company”) uses these non - GAAP measures in its analysis of the Company’s performance . These measures are useful when evaluating the underlying performance and efficiency of the Company’s operations and balance sheet . The Company’s management believes that these non - GAAP measures provide a greater understanding of ongoing operations, enhance comparability of results with prior periods and demonstrate the effects of significant gains and charges in the current period . The Company’s management believes that investors may use these non - GAAP financial measures to evaluate the Company’s financial performance without the impact of unusual items that may obscure trends in the Company’s underlying performance . These disclosures should not be viewed as a substitute for financial measures determined in accordance with GAAP, nor are they necessarily comparable to non - GAAP performance measures that may be presented by other companies . Tangible common equity and Tier 1 capital ratios are non - GAAP measures . The Company calculates the Tier 1 capital using current call report instructions . The Company’s management uses these measures to assess the quality of capital and believes that investors may find them useful in their evaluation of the Company . These capital measures may, or may not be necessarily comparable to similar capital measures that may be presented by other companies . This presentation may contain statements that constitute “forward - looking statements” within the meaning of Section 27 A of the Securities Act of 1933 , as amended, and Section 21 E of the Securities Exchange Act of 1934 , as amended . The words “believe”, “estimate”, “expect”, “intend”, “anticipate” and similar expressions and variations thereof identify certain of such forward - looking statements, which speak only as of the dates which they were made . The Company undertakes no obligation to publicly update or revise any forward - looking statements, whether as a result of new information, future events or otherwise . Readers are cautioned that any such forward - looking statements are not guarantees of future performance and involve risks and uncertainties and that actual results may differ materially from those indicated in the forward - looking statements as a result of various factors . Readers are cautioned not to place undue reliance on these forward - looking statements and are referred to the Company’s periodic filings with the Securities and Exchange Commission for a summary of certain factors that may impact the Company’s results of operations and financial condition . Cautionary Statements

Corporate Profile • Headquartered in Moultrie, Georgia • Founded in 1971 as American Banking Company • Historically grown through acquisitions of smaller banks in areas close to existing operations • Recently announced acquisition of Jacksonville Bancorp in Jacksonville, Florida. • Recent growth through acquisition of Merchants & Southern (Gainesville, FL) and 18 branches from Bank of America. • Four state footprint with 103 offices 3

Achieving the metrics we projected improves ROA, ROTCE and Efficiency by considerable margins ▪ Deploy the liquidity in higher quality assets with little incremental overhead burden ▪ Achieve the cost savings we identified from branch closures after conversion Current Focus Integrate Acquisitions & Achieve Announced Metrics M&A Opportunities Seeking opportunities in our larger markets that improve our franchise and operating results Avoid auctions as much as possible where the buyer does not give any credit to our culture Earn a Peer Level Valuation on our Earnings Develop more consistency in our earnings Manage to higher ROAs and ROTCEs, lower efficiency ratios

3 rd Quarter Operating Results • Net Operating Income (excluding one time charges) of $ 15 . 9 million, up 13 . 3 % vs . 3 Q 14 • Operating EPS of $ 0 . 49 per share, up $ 0 . 06 per share from 3 Q 14 . Impacted by 5 . 3 million additional shares . • Total Revenue increased 27 % vs . year ago period . • Spread income up 21 % vs . a year ago . • Non - interest income, driven by mortgage success and BoA deposit charges, increased 40 % to $ 25 million per quarter . • Core Operating Expenses (before merger and credit costs) were up $ 12 . 0 million or 34 % . • LOB costs up $ 1 . 5 million . • Core Bank opex up $ 10 . 5 million . • Credit costs of $ 2 . 1 million, lower by $ 0 . 8 million . 3Q 2015 Highlights 3Q15 3Q14 Chg 3Q15 3Q14 Chg Int Inc before Accretion 48,158$ 40,222$ 20% 129,023$ 111,403$ 16% Accretion income 3,037 2,964 2% 8,769 8,263 6% Interest Expense 3,796 4,054 -6% 10,873 10,786 1% Net Interest Income 47,399 39,132 21% 126,919 108,880 17% Provision (1) 986 1,669 -41% 4,711 4,760 -1% Non-Interest Income 24,978 17,901 40% 63,179 46,474 36% Non-Interest Expense 48,396 38,579 25% 146,087 109,136 34% Income before taxes 22,995 16,785 37% 39,300 41,458 -5% Income tax expense 7,368 5,315 39% 12,601 13,315 -5% Preferred Dividends - - 0% - 286 -100% Net Income 15,627$ 11,470$ 36% 26,699$ 27,857$ -4% Reported EPS $0.48 $0.42 14% $0.84 $1.07 -22% Non-Operating Items (a/t) 3Q15 3Q14 Chg 3Q15 3Q14 Chg Investment security gains (75) (86) (137) -$138 Merger/conversion 283 358 6,163 $3,873 Credit related charges - - 6,416 Total Non-Core Charges 209 272 12,442 $3,735 Operating Net Income $15,836 $11,743 35% $39,141 $31,592 24% OPERATING EPS $0.49 $0.43 13% $1.22 $1.21 1% Avg Diluted Shares 32,553 27,161 13% 31,962 26,099 22% (1) - excludes amounts seen below related to one time charges Quarter to date results Year to date results

Revenues – 3Q15 17 . 5 % improvement over linked quarter ( 2 Q 15 ) resulted from : • Progress in deployment of liquidity from recent M&A deals . • In - line deposit service charges resulting from recent transactions . Total deposit related service charges on two recent deals totaled approximately $ 4 . 35 million in 3 Q 15 . • Steady improvement in mortgage, warehouse and SBA revenues . 3 Q Improvement in T otal Revenue • Anticipate continued shift in earning assets as we look to end the year with fully deployed liquidity . • Mortgage typically slows somewhat but recent hires are building pipelines that should mute the seasonal slow - down . • Strong pipelines in SBA 4 th Quarter Expectations $38.7 $47.6 $48.9 $54.6 $53.6 $53.8 $59.3 $69.7 $72.1 $20.0 $40.0 $60.0 $80.0 4Q 13 1Q 14 2Q 14 3Q 14 4Q 14 1Q 15 2Q 15 3Q 15 4Q Proj Total Quarterly Revenue (in millions)

Non - Interest Income – 3Q15 Earnings from Mortgage and SBA increased 73 % and totaled $ 4 . 0 million in 2 Q 15 vs . $ 2 . 3 million in 2 Q 14 . Earnings growing faster than revenue . 3Q15 2Q15 3Q14 Mortgage production (000's) 311,007 285,611 217,694 Mortgage GOS (1) - retail 3.51% 3.67% 3.46% Open Pipeline 105,290 115,890 81,468 SBA Production: 14,432 9,500 19,185 SBA sold loans 8,842 12,300 11,948 SBA GOS % 11% 12% 10% SBA Pipeline 40,196 41,000 29,990 • Service charges in 3 Q 15 up 62 % over 3 Q 14 • BoA and M&S added $ 4 . 35 million per quarter vs . original forecast of $ 4 . 0 million • Mortgage non - interest income in 2 Q 15 up 39 % over 3 Q 14 • Mortgage profitability margins much higher than industry average . • Still focused on relationships with builders, brokers and R/E agents . 1 – GOS – “gain on sale” of loans $5.9 $5.6 $6.9 $10.3 $12.0 $10.7 $11.8 $15.2 $15.9 $0.0 $4.0 $8.0 $12.0 $16.0 3Q 13 1Q 14 3Q 14 1Q 15 3Q 15 Mortgage & SBA Revenues (in millions) 1.57% 1.45% 1.81% 1.80% 1.63% 1.72% 1.85% 1.91% 1.0% 1.5% 2.0% 4Q 13 1Q 14 2Q 14 3Q 14 4Q 14 1Q 15 2Q 15 3Q 15 Non - Interest Income as a % of Average Assets (in millions)

Expenses – 3Q15 • Expenses in LOBs up 21 % vs . last year . Revenue is up 32 % over same period . 39 % on incremental revenue . • Mortgage expenses up mostly in higher commissions . Additional hires have been made in Florida and around recent M&A transactions . • Warehouse LOB leverages existing relationships in mortgage . Still a lot of growth potential for this highly profitable and efficient LOB . • SBA aggressively recruiting experienced, high volume producers . Target is 12 - 15 bankers, currently have 9 bankers on staff . • 3 Q Bank level Opex includes non - integrated costs of BoA and M&S • 10 announced branch consolidations expected to save $ 1 . 25 million per quarter • M&S consolidation expected to save additional $ 0 . 75 million per quarter . • Other expense initiatives underway to slow the rate of growth in Opex despite rapid growth from organic sources and acquisitions . 1 – Core operating expenses exclude Problem loan and OREO costs as well as merger - related charges Bank Level Opex LOB Opex $20.8 $22.5 $25.8 $24.9 $27.7 $29.4 $30.7 $31.1 $38.6 $4.5 $5.5 $4.8 $6.7 $7.1 $7.0 $7.0 $8.9 $8.7 $0.0 $10.0 $20.0 $30.0 $40.0 $50.0 3Q 13 1Q 14 3Q 14 1Q 15 3Q 15 Core Operating Expenses (in millions) Bank Opex LOB Opex

Expenses – Credit Related Costs • Still anticipating approximately $ 2 . 5 million per quarter in credit costs (provision and OREO charges) • Believe we continue to move CQ ratios while maintaining lower levels of costs 1 – Credit costs include provision for loan losses and OREO related costs. Reliable levels of Credit Expenses $5.9 $6.8 $3.9 $4.2 $4.9 $6.2 $4.2 $13.9 $2.1 $- $4.0 $8.0 $12.0 $16.0 3Q 13 4Q 13 1Q 14 2Q 14 3Q 14 4Q 14 1Q 15 2Q 15 3Q 15 Credit Costs, Including Provision (in millions)
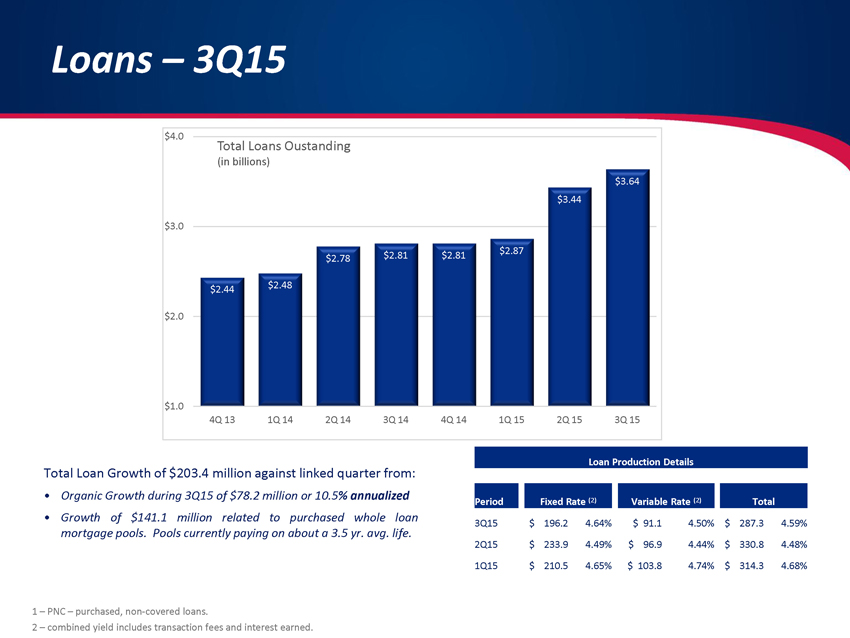
Loans – 3Q15 Total Loan Growth of $ 203 . 4 million against linked quarter from : • Organic Growth during 3 Q 15 of $ 78 . 2 million or 10 . 5 % annualized • Growth of $ 141 . 1 million related to purchased whole loan mortgage pools . Pools currently paying on about a 3 . 5 yr . avg . life . 1 – PNC – purchased, non - covered loans. 2 – combined yield includes transaction fees and interest earned. Loan Production Details Period Fixed Rate (2) Variable Rate (2) Total 3Q15 $ 196.2 4.64% $ 91.1 4.50% $ 287.3 4.59% 2Q15 $ 233.9 4.49% $ 96.9 4.44% $ 330.8 4.48% 1Q15 $ 210.5 4.65% $ 103.8 4.74% $ 314.3 4.68% $2.44 $2.48 $2.78 $2.81 $2.81 $2.87 $3.44 $3.64 $1.0 $2.0 $3.0 $4.0 4Q 13 1Q 14 2Q 14 3Q 14 4Q 14 1Q 15 2Q 15 3Q 15 Total Loans Oustanding (in billions)

Loans – Purchased Mortgage Pools 1 – PNC – purchased, non - covered loans. 2 – combined yield includes transaction fees and interest earned. Purchased mortgage pools have the following characteristics: • Seasoned pools of 5/1, 7/1 and 10/1 adjustable rate mortgages. • LTVs in the 60% range or below • Yields of 3.0% to 3.35% beat comparable mortgage backed yields by 75bps – 125bps. • No mark - to - market risk as rates rise versus a comparable mortgage backed portfolio Anticipate additional purchases of this product through the end of 2015. Modeling 3 – 4 year durations to reinvest the cash flows into higher yielding commercial assets. Balance Price Book Value WAL Yield LTV DTI FICO Pool 1 $39,425 102.9 $40,550 3.6 3.54% 59.5 38.8 759 Pool 2 $124,892 101.3 $126,527 3.4 3.61% 49.0 35.6 724 Pool 3 $90,663 102.2 $92,692 3.7 3.21% 71.4 36.7 747 Pool 4 $18,567 101.0 $18,745 2.9 3.12% 71.9 29.2 765 Pool 5 $128,510 102.4 $131,558 3.5 3.00% 68.1 32.0 749 Total $402,057 102.0 $410,072 3.4 3.29% 62.3 34.7 743

Deposits – 3Q15 Deposit mix has materially improved our interest rate risk profile . In the last 12 months, we have grown : • Approximately $ 459 million in NIB checking . • Approximately $ 767 million in total non - rate sensitive deposits Not all of the growth in NIB is in M&A . Organic growth accounts for $ 188 million or 41 % of the growth . • Non - rate sensitive deposits continue to climb, now at 53 . 7 % of total deposits • Percentage of fixed rate loans funded with non - rate sensitive deposits improved from 86 % at 3 Q 13 to 116 % at 3 Q 15 . Improved Sensitivity to Interest Rates Non - Rate Sensitive Deposits include NIB, NOW and Savings Accounts. $669 $699 $791 $817 $839 $967 $1,280 $1,276 $0 $400 $800 $1,200 $1,600 4Q 13 1Q 14 2Q 14 3Q 14 4Q 14 1Q 15 2Q 15 3Q 15 NIB Demand Deposits (in millions) 50.4% 50.4% 49.7% 51.1% 53.2% 53.4% 53.7% 54.9% 44% 48% 52% 56% 4Q 13 1Q 14 2Q 14 3Q 14 4Q 14 1Q 15 2Q 15 3Q 15 Non - Rate Sensitive Deposits as a % of Total Deposits

Credit Quality – 3Q15 • 28 % decline in NPAs in 3 Q 2015 vs . same period in 2014 . • $ 9 . 7 million decline in 3 Q 2015 vs . the end of 2 Q 2015 . • Approx $ 11 million of additional assets under contract or already resolved since quarter end . Non - Rate Sensitive Deposits include NIB, NOW and Savings Accounts. 2.72% 2.47% 2.29% 2.22% 2.03% 1.23% 1.00% 2.00% 3.00% 1Q 13 3Q 13 1Q 14 3Q 14 1Q 15 3Q 15 Non - Performing Assets to Total Assets 0.76% 0.73% 0.54% 0.32% 0.26% 0.16% 0.00% 0.20% 0.40% 0.60% 0.80% 1Q 13 3Q 13 1Q 14 3Q 14 1Q 15 3Q 15 Net Charge - offs to Loans • Net Charge - offs declining to pre - cycle levels • Management believes this reflects a more balanced and diversified loan portfolio

Capital and TBV – 3Q15 Combination of Capital Raise and 2 M&A deals: – TBV up 15.3% since 3Q 2014. – Projected TBV at end of 2016 is $14.92 per share (assumes consensus earnings and $0.05 quarterly dividend) • 25 bps – 30 bps of capital build per quarter • Expect slower level of asset growth as we “re - mix” earning assets over next 12 - 18 months . • No need for capital raises or debt offerings to facilitate M&A or organic growth . Looking Back: $10.39 $10.31 $10.26 $10.68 $10.99 $13.01 $11.81 $12.31 $6.0 $8.5 $11.0 $13.5 4Q 13 1Q 14 2Q 14 3Q 14 4Q 14 1Q 15 2Q 15 3Q 15 Tangible Book Value 6.83% 7.53% 7.04% 7.27% 7.42% 10.26% 7.46% 7.76% 4.0% 8.0% 12.0% 4Q 13 1Q 14 2Q 14 3Q 14 4Q 14 1Q 15 2Q 15 3Q 15 Tangible Common Equity to Tangible Assets

• Material discount to our peer group . • The overhangs causing discounted P/E are behind us . • Lift in operating performance ratios and lower volatility in earnings will drive higher multiples . Investment Rationale Discounted P/E valuation • Top Quartile ROA and ROTCE once we deploy the liquidity and achieve the cost savings projected . • Diversified revenue sources ( 66 % spread, 34 % non - interest income) . Operating Performance M&A Opportunities • Disciplined Acquirer • Announced/Executed low risk deals • Enough conversations underway so that we can avoid auctions • Strong Capital Ratios support additional M&A • Regulatory reputation presents no hurdle