Attached files
| file | filename |
|---|---|
| 8-K - 8-K - CoreSite Realty Corp | a15-21447_18k.htm |
| EX-99.1 - EX-99.1 - CoreSite Realty Corp | a15-21447_1ex99d1.htm |
Exhibit 99.2
Earnings Release and Supplemental Information Quarter ended September 30, 2015 ®2015 CoreSite Realty Corporation, All Rights Reserved.

Overview Earnings Release 3 Company Profile 7 Summary of Financial Data 9 Financial Statements Consolidated Balance Sheets 10 Consolidated Statements of Operations 11 Reconciliations of Net Income to FFO, AFFO, EBITDA and Adjusted EBITDA 12 Operating Portfolio Operating Properties 13 Leasing Statistics 14 Geographic and Vertical Diversification 16 10 Largest Customers 17 Development Capital Expenditures and Completed Pre-Stabilized Projects 18 Development Summary 19 Capital Structure Market Capitalization and Debt Summary 20 Interest Summary and Debt Covenants 21 Components of Net Asset Value 22 2015 Guidance 23 Appendix 24 Table of Contents 2

2015 FFO guidance increased to a range of $2.82 to $2.86 per share DENVER, CO – OCTOBER 22, 2015 CoreSite Realty Corporation (NYSE:COR), a premier provider of secure, reliable, high-performance data center solutions across the U.S., today announced financial results for the third quarter ended September 30, 2015. Quarterly Highlights • Reported third-quarter funds from operations (“FFO”) of $0.74 per diluted share and unit, representing 34.5% growth year over year • Reported third-quarter total operating revenues of $86.6 million, representing a 22.7% increase year over year; total data center revenues of $84.6 million increased 23.5% year over year • Executed 64,087 net rentable square feet (NRSF) of new and expansion data center leases representing $8.8 million of annualized GAAP rent at a rate of $138 per square foot • Commenced 66,330 net rentable square feet of new and expansion leases representing $9.3 million of annualized GAAP rent at a rate of $139 per square foot • Realized rent growth on signed renewals of 4.2% on a cash basis and 9.7% on a GAAP basis and recorded rental churn of 1.4% Tom Ray, CoreSite’s Chief Executive Officer, commented, “We are pleased that our sales momentum carried into the second half of the year and that our Q3 financial results reflect our work to increase efficiencies and scale our business.” Mr. Ray continued, “Further, we continued to execute upon our strategic priorities, including increasing transaction count; enhancing the network and cloud density of our portfolio; and diversifying our customer base with a record number of new logos in the quarter. As we look forward, we believe the growth potential of our business remains highly attractive and we believe in our ability to continue to execute upon our growth plans and deliver superior returns on capital.” Financial Results CoreSite reported FFO per diluted share and unit of $0.74 for the three months ended September 30, 2015, an increase of 34.5% compared to $0.55 per diluted share and unit for the three months ended September 30, 2014. On a sequential-quarter basis, FFO per diluted share and unit increased 8.8%. Total operating revenues for the three months ended September 30, 2015, were $86.6 million, a 22.7% increase year over year and an increase of 6.3% on a sequential-quarter basis. Total data center revenues for the three months ended September 30, 2015, were $84.6 million, a 23.5% increase year over year and an increase of 6.4% on a sequential-quarter basis. CoreSite reported net income attributable to common shares of $6.9 million, or $0.26 per diluted share. Sales Activity CoreSite executed 149 new and expansion data center leases representing $8.8 million of annualized GAAP rent during the third quarter, comprised of 64,087 NRSF at a weighted-average GAAP rental rate of $138 per NRSF. CORESITE REPORTS THIRD-QUARTER REVENUE AND FFO PER SHARE YEAR OVER YEAR GROWTH OF 23% AND 35%, RESPECTIVELY 3 OVERVIEW FINANCIAL STATEMENTS OPERATING PORTFOLIO DEVELOPMENT CAPITAL STRUCTURE Components of NAV 2015 GUIDANCE APPENDIX

CoreSite’s third-quarter data center lease commencements totaled 66,330 NRSF at a weighted average GAAP rental rate of $139 per NRSF, which represents $9.3 million of annualized GAAP rent. CoreSite’s renewal leases signed in the third quarter totaled $10.5 million in annualized GAAP rent, comprised of 72,031 NRSF at a weighted-average GAAP rental rate of $145 per NRSF, reflecting a 4.2% increase in rent on a cash basis and 9.7% increase on a GAAP basis. The third-quarter rental churn rate was 1.4%. Development Activity Santa Clara –During the third quarter, CoreSite commenced construction of Phase 1 of SV7, comprised of a 230,000 square-foot powered shell plus 80,000 square feet of turn-key data center capacity within the shell. CoreSite expects to invest $110 million to complete Phase 1 and expects to substantially complete construction in the second quarter of 2016. Additionally, as of September 30, 2015, CoreSite had incurred $10.9 million of the estimated $30.0 million required to complete the previously-announced 136,580 square-foot SV6 build-to-suit development. CoreSite expects to substantially complete SV6 and commence the associated lease in the first half of 2016. Northern Virginia – As of September 30, 2015, CoreSite had 96,274 NRSF of data center space under construction in Phase 3 and Phase 4 at VA2 and had incurred $11.0 million of the estimated $32.5 million required to complete these projects. CoreSite expects to complete construction on Phase 3 in the fourth quarter of 2015 and Phase 4 in the first quarter of 2016. Additional markets – During the third quarter, CoreSite placed into service 12,500 NRSF at LA2 in Los Angeles, of which 64.8% is currently leased. CoreSite also placed into service 11,704 NRSF at CH1 in Chicago, of which 53.9% is leased. As of September 30, 2015, CoreSite had 14,031 NRSF of turn-key data center capacity under construction at BO1 in Boston. As of the end of the third quarter, CoreSite had incurred $3.0 million of the estimated $11.0 million required to complete this project, and expects to complete construction in the first quarter of 2016. Balance Sheet and Liquidity As of September 30, 2015, CoreSite had net debt of $350.8 million, correlating to 2.0 times third-quarter annualized adjusted EBITDA, and net debt and preferred stock outstanding of $465.8 million, correlating to 2.7 times third-quarter annualized adjusted EBITDA. At quarter end, CoreSite had $9.5 million of cash available on its balance sheet and $233.4 million of capacity available under its revolving credit facility. Dividend On August 31, 2015, CoreSite announced a dividend of $0.42 per share of common stock and common stock equivalents for the third quarter of 2015. The dividend was paid on October 15, 2015, to shareholders of record on September 30, 2015. CoreSite also announced on August 31, 2015, a dividend of $0.4531 per share of Series A preferred stock for the period July 15, 2015, to October 14, 2015. The preferred dividend was paid on October 15, 2015, to shareholders of record on September 30, 2015. Quarter Ended September 30, 2015 4 OVERVIEW FINANCIAL STATEMENTS OPERATING PORTFOLIO DEVELOPMENT CAPITAL STRUCTURE Components of NAV 2015 GUIDANCE APPENDIX

2015 Guidance CoreSite is increasing its 2015 guidance of FFO per diluted share and unit to a range of $2.82 to $2.86 from the previous range of $2.75 to $2.83, an increase of 1.8% at the midpoint. In addition, CoreSite is increasing its 2015 guidance for net income attributable to common shares to a range of $0.98 to $1.02 from the previous range of $0.93 to $1.01 per diluted share, with the difference between FFO and net income being real estate depreciation and amortization. This outlook is predicated on current economic conditions, internal assumptions about CoreSite’s customer base, and the supply and demand dynamics of the markets in which CoreSite operates. The guidance does not include the impact of any future financing, investment or disposition activities beyond what has already been disclosed. Upcoming Conferences and Events CoreSite will participate in NAREIT’s REITWorld conference on November 17 and November 18 at the Wynn Las Vegas in Las Vegas, Nevada. Conference Call Details CoreSite will host a conference call on October 22, 2015, at 12:00 p.m., Eastern Time (10:00 a.m., Mountain Time), to discuss its financial results, current business trends and market conditions. The call can be accessed live over the phone by dialing 877-407-3982 for domestic callers or 201-493-6780 for international callers. A replay will be available shortly after the call and can be accessed by dialing 877-870-5176 for domestic callers or 858-384-5517 for international callers. The passcode for the replay is 13620908. The replay will be available until October 29, 2015. Interested parties may also listen to a simultaneous webcast of the conference call by logging on to CoreSite’s website at www.CoreSite.com and clicking on the “Investors” link. The on-line replay will be available for a limited time beginning immediately following the call. About CoreSite CoreSite Realty Corporation (NYSE:COR) delivers secure, reliable, high-performance data center solutions across eight key North American markets. More than 800 of the world’s leading enterprises, network operators, cloud providers, and supporting service providers choose CoreSite to connect, protect and optimize their performance-sensitive data, applications and computing workloads. Our scalable, flexible solutions and 350+ dedicated employees consistently deliver unmatched data center options — all of which leads to a best-in-class customer experience and lasting relationships. For more information, visit www.CoreSite.com. CoreSite Investor Relations Contact Greer Aviv CoreSite Investor Relations Director +1 303.405.1012 +1 303.222.7276 Greer.Aviv@CoreSite.com Quarter Ended September 30, 2015 5 OVERVIEW FINANCIAL STATEMENTS OPERATING PORTFOLIO DEVELOPMENT CAPITAL STRUCTURE Components of NAV 2015 GUIDANCE APPENDIX
Forward Looking Statements This earnings release and accompanying supplemental information may contain forward-looking statements within the meaning of the federal securities laws. Forward-looking statements relate to expectations, beliefs, projections, future plans and strategies, anticipated events or trends and similar expressions concerning matters that are not historical facts. In some cases, you can identify forward-looking statements by the use of forward-looking terminology such as “believes,” “expects,” “may,” “will,” “should,” “seeks,” “approximately,” “intends,” “plans,” “pro forma,” “estimates” or “anticipates” or the negative of these words and phrases or similar words or phrases that are predictions of or indicate future events or trends and that do not relate solely to historical matters. Forward-looking statements involve known and unknown risks, uncertainties, assumptions and contingencies, many of which are beyond CoreSite’s control, that may cause actual results to differ significantly from those expressed in any forward-looking statement. These risks include, without limitation: the geographic concentration of the company’s data centers in certain markets and any adverse developments in local economic conditions or the demand for data center space in these markets; fluctuations in interest rates and increased operating costs; difficulties in identifying properties to acquire and completing acquisitions; significant industry competition; the company’s failure to obtain necessary outside financing; the company’s failure to qualify or maintain its status as a REIT; financial market fluctuations; changes in real estate and zoning laws and increases in real property tax rates; and other factors affecting the real estate industry generally. All forward-looking statements reflect the company’s good faith beliefs, assumptions and expectations, but they are not guarantees of future performance. Furthermore, the company disclaims any obligation to publicly update or revise any forward-looking statement to reflect changes in underlying assumptions or factors, of new information, data or methods, future events or other changes. For a further discussion of these and other factors that could cause the company’s future results to differ materially from any forward-looking statements, see the section entitled “Risk Factors” in the company’s most recent annual report on Form 10-K, and other risks described in documents subsequently filed by the company from time to time with the Securities and Exchange Commission. Quarter Ended September 30, 2015 6 OVERVIEW FINANCIAL STATEMENTS OPERATING PORTFOLIO DEVELOPMENT CAPITAL STRUCTURE Components of NAV 2015 GUIDANCE APPENDIX
Company Profile CoreSite delivers secure, reliable, high-performance data center solutions across eight key North American markets. NY2 SILICON VALLEY SV1 SV3 SV5 SV2 SV4 SV6 SV7 LOS ANGELES LA1 LA2 DENVER HQ DE1 DE2 CHICAGO CH1 N VIRGINIA/DC VA1 DC1 VA2 BOSTON BO1 MIAMI MI1 NEW YORK NY1 NY2 7 OVERVIEW FINANCIAL STATEMENTS OPERATING PORTFOLIO DEVELOPMENT CAPITAL STRUCTURE Components of NAV 2015 GUIDANCE APPENDIX

Company Profile Secure, Reliable and Compliant Six 9s uptime for four consecutive years Physical security standards enable regulatory compliance requirements Payment Card Industry certification Rigorous internal security training Operational excellence in security and environmental controls Scalable Newest data centers, NY2 and VA2, and two new data centers on the Santa Clara campus expected to be delivered in 2016 2.5+ million gross square feet and 17 operating data centers in eight of the US’ largest commercial and data center markets Ability to nearly double occupied data center footprint on land and buildings currently owned, including current space unoccupied, under construction and held for development High-Performance Cloud-enabled, network-rich data center campuses Over 275 network service providers supported by robust IX services to key public clouds 20,000+ interconnections Enabling enterprise with support ecosystems Best-in-Class Customer Experience 350+ professionals with dedicated industry expertise Experienced and committed operations and facilities personnel Dedicated implementation resources to ensure a seamless onboarding process 24/7 customer support and remote hands 8 OVERVIEW FINANCIAL STATEMENTS OPERATING PORTFOLIO DEVELOPMENT CAPITAL STRUCTURE Components of NAV 2015 GUIDANCE APPENDIX VA2

Summary of Financial Data (in thousands, except per share, NRSF and MRR data) 9 OVERVIEW FINANCIAL STATEMENTS OPERATING PORTFOLIO DEVELOPMENT CAPITAL STRUCTURE Components of NAV 2015 GUIDANCE APPENDIX Three Months Ended Nine Months Ended September 30, 2015 June 30, 2015 September 30, 2014 September 30, 2015 September 30, 2014 Summary of Results Operating revenues $ 86,555 $ 81,456 $ 70,515 $ 242,768 $ 199,928 Data center revenues 84,608 79,487 68,499 236,718 193,946 Net income 14,530 12,882 8,990 39,472 27,746 Net income attributable to common shares 6,920 5,538 3,147 17,026 9,763 Funds from operations (FFO) to shares and units 35,264 32,140 25,894 97,597 75,480 Adjusted funds from operations (AFFO) 25,644 26,116 19,111 76,914 60,046 EBITDA 41,098 38,722 31,286 116,008 90,010 Adjusted EBITDA 43,698 40,559 32,853 122,208 97,023 Per share - diluted: Net income attributable to common shares $ 0.26 $ 0.22 $ 0.14 $ 0.69 $ 0.45 FFO per common share and OP unit $ 0.74 $ 0.68 $ 0.55 $ 2.06` $ 1.60 As of September 30, 2015 June 30, 2015 March 31, 2015 December 31, 2014 September 30, 2014 Dividend Activity Dividends declared per share and OP unit $ 0.42 $ 0.42 $ 0.42 $ 0.42 $ 0.35 AFFO payout ratio 77.6% 76.1% 79.1% 85.4% 86.2% Operating Portfolio Statistics Operating data center properties 17 17 17 17 16 Stabilized data center NRSF 1,474,472 1,449,498 1,354,235 1,323,210 1,334,914 Stabilized data center NRSF occupied 1,337,015 1,303,274 1,194,994 1,156,486 1,153,345 Stabilized data center % occupied 90.7% 89.9% 88.2% 87.4% 86.4% Turn-Key Data Center (“TKD”) Same Store Statistics MRR per Cabinet Equivalent $ 1,441 $ 1,420 $ 1,408 $ 1,413 $ 1,390 Data center NRSF % occupied 86.0% 84.9% 83.1% 80.2% 78.4% Market Capitalization, Debt & Preferred Stock Total enterprise value $ 2,918,547 $ 2,620,743 $ 2,755,403 $ 2,273,458 $ 1,967,868 Total debt outstanding 360,250 352,250 333,750 318,500 305,250 Total debt and preferred stock outstanding 475,250 467,250 448,750 433,500 420,250 Net Debt to: Annualized Adjusted EBITDA 2.0x 2.1x 2.1x 2.1x 2.3x Enterprise Value 12.0% 13.2% 11.7% 13.5% 15.0% Net Debt & Preferred Stock to: Annualized Adjusted EBITDA 2.7x 2.8x 2.9x 2.9x 3.1x Enterprise Value 16.0% 17.5% 15.8% 18.6% 20.9%

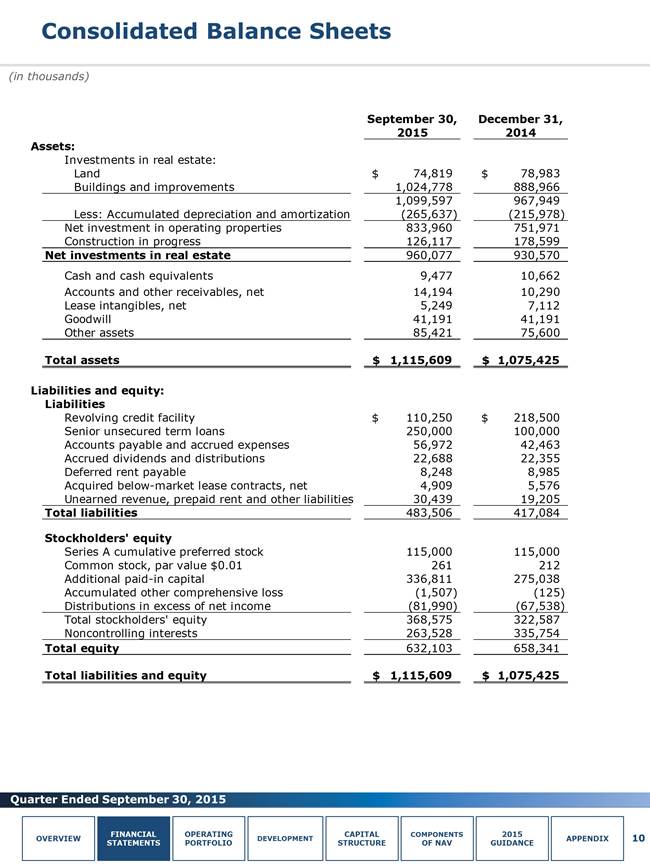
Consolidated Balance Sheets (in thousands) 10 OVERVIEW FINANCIAL STATEMENTS OPERATING PORTFOLIO DEVELOPMENT CAPITAL STRUCTURE Components of NAV 2015 GUIDANCE APPENDIX September 30, 2015 December 31, 2014 Assets: Investments in real estate: Land $ 74,819 $ 78,983 Buildings and improvements 1,024,778 888,966 1,099,597 967,949 Less: Accumulated depreciation and amortization (265,637) (215,978) Net investment in operating properties 833,960 751,971 Construction in progress 126,117 178,599 Net investments in real estate 960,077 930,570 Cash and cash equivalents 9,477 10,662 Accounts and other receivables, net 14,194 10,290 Lease intangibles, net 5,249 7,112 Goodwill 41,191 41,191 Other assets 85,421 75,600 Total assets $ 1,115,609 $ 1,075,425 Liabilities and equity: Liabilities Revolving credit facility $ 110,250 $ 218,500 Senior unsecured term loans 250,000 100,000 Accounts payable and accrued expenses 56,972 42,463 Accrued dividends and distributions 22,688 22,355 Deferred rent payable 8,248 8,985 Acquired below-market lease contracts, net 4,909 5,576 Unearned revenue, prepaid rent and other liabilities 30,439 19,205 Total liabilities 483,506 417,084 Stockholders’ equity Series A cumulative preferred stock 115,000 115,000 Common stock, par value $0.01 261 212 Additional paid-in capital 336,811 275,038 Accumulated other comprehensive loss (1,507) (125) Distributions in excess of net income (81,990) (67,538) Total stockholders’ equity 368,575 322,587 Noncontrolling interests 263,528 335,754 Total equity 632,103 658,341 Total liabilities and equity $ 1,115,609 $ 1,075,425
Consolidated Statements of Operations (in thousands, except share and per share data) 11 OVERVIEW FINANCIAL STATEMENTS OPERATING PORTFOLIO DEVELOPMENT CAPITAL STRUCTURE Components of NAV 2015 GUIDANCE APPENDIX Three Months Ended Nine Months Ended September 30, 2015 June 30, 2015 September 30, 2014 September 30, 2015 September 30, 2014 Operating revenues: Data center revenue: Rental revenue $ 47,135 $ 44,824 $ 38,315 $ 133,282 $ 110,152 Power revenue 23,716 21,792 18,687 65,177 51,264 Interconnection revenue 11,400 10,595 9,169 32,210 25,819 Tenant reimbursement and other 2,357 2,276 2,328 6,049 6,711 Total data center revenue 84,608 79,487 68,499 236,718 193,946 Office, light-industrial and other revenue 1,947 1,969 2,016 6,050 5,982 Total operating revenues 86,555 81,456 70,515 242,768 199,928 Operating expenses: Property operating and maintenance 24,376 22,204 20,043 66,360 54,866 Real estate taxes and insurance 3,216 3,270 3,073 8,421 5,059 Depreciation and amortization 24,347 24,046 20,914 71,209 58,300 Sales and marketing 3,775 4,256 3,806 11,813 11,141 General and administrative 8,644 7,952 7,145 24,461 21,582 Rent 5,440 5,007 5,113 15,690 15,249 Impairment of internal-use software — — — — 1,959 Transaction costs 6 45 49 51 62 Total operating expenses 69,804 66,780 60,143 198,005 168,218 Operating income 16,751 14,676 10,372 44,763 31,710 Gain on real estate disposal — — — 36 — Interest income 1 2 1 5 5 Interest expense (2,188) (1,730) (1,361) (5,183) (3,949) Income before income taxes 14,564 12,948 9,012 39,621 27,766 Income tax expense (34) (66) (22) (149) (20) Net income 14,530 12,882 8,990 39,472 27,746 Net income attributable to noncontrolling interests 5,526 5,259 3,759 16,193 11,730 Net income attributable to CoreSite Realty Corporation 9,004 7,623 5,231 23,279 16,016 Preferred stock dividends (2,084) (2,085) (2,084) (6,253) (6,253) Net income attributable to common shares $ 6,920 $ 5,538 $ 3,147 $ 17,026 $ 9,763 Net income per share attributable to common shares: Basic $ 0.26 $ 0.23 $ 0.15 $ 0.71 $ 0.46 Diluted $ 0.26 $ 0.22 $ 0.14 $ 0.69 $ 0.45 Weighted average common shares outstanding: Basic 26,126,332 24,536,583 21,214,825 24,029,106 21,113,700 Diluted 26,549,537 25,055,195 21,708,759 24,544,612 21,679,931

Reconciliations of Net Income to FFO, AFFO, EBITDA and Adjusted EBITDA (in thousands, except per share data) Reconciliation of Net Income to FFO Reconciliation of FFO to AFFO Reconciliation of Net Income to EBITDA and Adjusted EBITDA 12 OVERVIEW FINANCIAL STATEMENTS OPERATING PORTFOLIO DEVELOPMENT CAPITAL STRUCTURE Components of NAV 2015 GUIDANCE APPENDIX Three Months Ended Nine Months Ended September 30, 2015 June 30, 2015 September 30, 2014 September 30, 2015 September 30, 2014 Net income $ 14,530 $ 12,882 $ 8,990 $ 39,472 $ 27,746 Real estate depreciation and amortization 22,818 21,343 18,988 64,414 53,987 Gain on real estate disposal — — — (36) — FFO $ 37,348 $ 34,225 $ 27,978 $ 103,850 $ 81,733 Preferred stock dividends (2,084) (2,085) (2,084) (6,253) (6,253) FFO available to common shareholders and OP unit holders $ 35,264 $ 32,140 $ 25,894 $ 97,597 $ 75,480 Weighted average common shares outstanding - diluted 26,550 25,055 21,709 24,545 21,680 Weighted average OP units outstanding - diluted 20,861 22,344 25,361 22,839 25,361 Total weighted average shares and units outstanding - diluted 47,411 47,399 47,070 47,384 47,041 FFO per common share and OP unit - diluted $ 0.74 $ 0.68 $ 0.55 $ 2.06 $ 1.60 Three Months Ended Nine Months Ended September 30, 2015 June 30, 2015 September 30, 2014 September 30, 2015 September 30, 2014 FFO available to common shareholders and unit holders $ 35,264 $ 32,140 $ 25,894 $ 97,597 $ 75,480 Adjustments: Amortization of deferred financing costs 413 292 448 999 1,477 Non-cash compensation 1,944 1,792 1,518 5,305 4,766 Non-real estate depreciation 1,529 2,703 1,926 6,795 4,313 Straight-line rent adjustment (2,993) (2,755) (1,709) (6,812) (3,523) Amortization of above and below market leases (129) (130) (256) (387) (438) Impairment of internal-use software — — — — 1,959 Recurring capital expenditures (667) (852) (1,125) (3,500) (4,175) Tenant improvements (1,692) (2,282) (666) (6,171) (3,453) Capitalized leasing costs (8,025) (4,792) (6,919) (16,912) (16,360) AFFO available to common shareholders and OP unit holders $ 25,644 $ 26,116 $ 19,111 $ 76,914 $ 60,046 Three Months Ended Nine Months Ended September 30, 2015 June 30, 2015 September 30, 2014 September 30, 2015 September 30, 2014 Net income $ 14,530 $ 12,882 $ 8,990 $ 39,472 $ 27,746 Adjustments: Interest expense, net of interest income 2,187 1,728 1,360 5,178 3,944 Income taxes 34 66 22 149 20 Depreciation and amortization 24,347 24,046 20,914 71,209 58,300 EBITDA $ 41,098 $ 38,722 $ 31,286 $ 116,008 $ 90,010 Non-cash compensation 1,944 1,792 1,518 5,305 4,766 Gain on real estate disposal — — — (36) — Transaction costs / litigation 656 45 49 931 288 Impairment of internal-use software — — — — 1,959 Adjusted EBITDA $ 43,698 $ 40,559 $ 32,853 $ 122,208 $ 97,023

Operating Properties 13 OVERVIEW FINANCIAL STATEMENTS OPERATING PORTFOLIO DEVELOPMENT CAPITAL STRUCTURE Components of NAV 2015 GUIDANCE APPENDIX See Appendix for definitions. Data Center Operating NRSF Annualized Stabilized Pre-Stabilized Total Held for Rent Percent Percent Percent NRSF Under Development Market/Facilities ($000)(1) Total Occupied(2) Total Occupied(2) Total Occupied(2) Construction NRSF Total NRSF San Francisco Bay SV1 $ 6,792 84,045 82.8 % - - % 84,045 82.8 % - - 84,045 SV2 8,140 76,676 85.8 - - 76,676 85.8 - - 76,676 Santa Clara campus(3) 33,886 252,173 96.6 - - 252,173 96.6 216,580 150,000 618,753 San Francisco Bay Total 48,818 412,894 91.8 - - 412,894 91.8 216,580 150,000 779,474 Los Angeles One Wilshire campus LA1* 25,682 139,053 83.3 - - 139,053 83.3 - - 139,053 LA2 21,093 191,202 88.8 46,211 15.1 237,413 74.5 - 187,478 424,891 Los Angeles Total 46,775 330,255 86.5 46,211 15.1 376,466 77.7 - 187,478 563,944 Northern Virginia VA1 28,327 201,719 92.5 - - 201,719 92.5 - - 201,719 VA2 4,937 69,010 100.0 23,163 50.0 92,173 87.4 96,274 - 188,447 DC1* 3,133 22,137 88.8 - - 22,137 88.8 - - 22,137 Northern Virginia Total 36,397 292,866 94.0 23,163 50.0 316,029 90.7 96,274 - 412,303 Boston BO1 14,611 166,026 99.5 - - 166,026 99.5 14,031 73,619 253,676 Chicago CH1 14,350 166,703 87.1 11,704 - 178,407 81.4 - - 178,407 New York NY1* 5,853 48,404 76.1 - - 48,404 76.1 - - 48,404 NY2 5,883 16,130 100.0 85,612 54.2 101,742 61.5 - 134,508 236,250 New York Total 11,736 64,534 82.1 85,612 54.2 150,146 66.2 - 134,508 284,654 Miami MI1 1,867 30,176 81.4 - - 30,176 81.4 - 13,154 43,330 Denver DE1* 1,106 5,878 92.2 - - 5,878 92.2 - - 5,878 DE2* 325 5,140 76.9 - - 5,140 76.9 - - 5,140 Denver Total 1,431 11,018 85.1 - - 11,018 85.1 - - 11,018 Total Data Center Facilities $ 175,985 1,474,472 90.7 % 166,690 39.0 % 1,641,162 85.4 % 326,885 558,759 2,526,806 Office & Light-Industrial 6,462 324,648 77.1 - - 324,648 77.1 - - 324,648 Total Portfolio $ 182,447 1,799,120 88.2 % 166,690 39.0 % 1,965,810 84.0 % 326,885 558,759 2,851,454 * Indicates properties in which we hold a leasehold interest(1).On a gross basis, our total portfolio annualized rent was approximately $187.5 million as of September 30, 2015, which reflects the addition of $5.1 million in operating expense reimbursements to contractual net rent under modified gross and triple-net leases. (2) Includes customer leases that have commenced and are occupied as of September 30, 2015. If all leases signed during the current and prior periods had commenced, the percent occupied would have been as follows: Percent Leased Stabilized Pre-Stabilized Total Total Data Center Facilities 91.1% 51.5% 87.1% Total Portfolio 89.0% 51.5% 85.8% (3) The annualized rent for the Santa Clara campus includes amounts associated with a restructured lease agreement involving a customer that has vacated the majority of its leased space and is paying discounted rent payments that may be applied to new lease arrangements elsewhere in the portfolio on a dollar-for-dollar basis until the terms expire. The amounts payable pursuant to this agreement are scheduled to expire as follows: $2.6 million in Q4 2015, $1.9 million in Q2 2016, and $4.2 million in Q2 2017.

Leasing Statistics Data Center Leasing Activity MRR per Cabinet Equivalent (TKD Same Store) 14 OVERVIEW FINANCIAL STATEMENTS OPERATING PORTFOLIO DEVELOPMENT CAPITAL STRUCTURE Components of NAV 2015 GUIDANCE APPENDIX 6.2% y-o-y 5.4% y-o-y 5.2% y-o-y 5.1% y-o-y 4.1% y-o-y 5.4% y-o-y 5.2% y-o-y 5.1% y-o-y 4.1% y-o-y 3.7% y-o-y $1,390 $1,413 $1,408 $1,420 $1,441 $1,300 $1,350 $1,400 $1,450 Q3'14 Q4'14 Q1'15 Q2'15 Q3'15 GAAP GAAP Leasing Number Annualized Total Annualized Rental Cash GAAP Activity of Rent Leased Rent per Churn Rent Rent Period Leases(1) (000's) NRSF Leased NRSF Rate Growth Growth New/expansion leases commenced YTD 2015 367 $ 33,591 249,999 $ 134 (2) Q3 2015 150 9,250 66,330 139 Q2 2015 107 15,117 122,872 123 (2) Q1 2015 110 9,224 60,797 152 Q4 2014 106 4,943 34,009 145 Q3 2014 115 6,066 45,014 135 New/expansion leases signed YTD 2015 371 $ 37,310 361,949 $ 103 (3) Q3 2015 149 8,825 64,087 138 Q2 2015 122 19,624 243,477 81 (3) Q1 2015 100 8,861 54,385 163 Q4 2014 96 11,075 91,662 121 (2) Q3 2014 118 7,607 54,123 141 Renewal leases signed YTD 2015 422 $ 24,199 147,749 $ 164 5.1% 4.9% 10.1% Q3 2015 165 10,460 72,031 145 1.4% 4.2% 9.7% Q2 2015 135 6,517 35,272 185 1.6% 5.7% 9.1% Q1 2015 122 7,222 40,446 179 2.2% 5.3% 11.4% Q4 2014 78 6,705 43,863 153 1.4% 2.6% 5.2% Q3 2014 123 12,078 55,262 219 1.2% 3.0% 10.6%

Leasing Statistics Lease Expirations (total portfolio, including total data center and office and light-industrial “OLI”) Lease Distribution (total portfolio, including total data center and office and light-industrial “OLI”) 15 OVERVIEW FINANCIAL STATEMENTS OPERATING PORTFOLIO DEVELOPMENT CAPITAL STRUCTURE Components of NAV 2015 GUIDANCE APPENDIX Total Percentage Percentage Number Percentage Operating of Total of of All NRSF of Operating NRSF Under Lease Leases Leases Leases NRSF Annualized Rent ($000) of Total Annualized Rent Unoccupied data center - - % 239,153 12.2 % $ - - % Unoccupied OLI - - 74,443 3.8 - - Data center NRSF: 5,000 or less 1,586 90.2 512,738 26.1 84,494 46.3 5,001 - 10,000 33 1.9 223,695 11.4 30,612 16.8 10,001 - 25,000 17 1.0 234,323 11.9 27,334 15.0 Greater than 25,000 4 0.2 134,073 6.8 14,444 7.9 Powered shell and other(1) 17 1.0 297,180 15.1 19,101 10.5 OLI 101 5.7 250,205 12.7 6,462 3.5 Portfolio Total 1,758 100.0 % 1,965,810 100.0 % $ 182,447 100.0 % Total Number Operating Percentage Percentage Annualized Annualized Annualized Rent Per of NRSF of of Total Leases Expiring Operating Year of Lease Expiration Expiring(1) Leases NRSF Annualized Rent ($000) of Total Annualized Rent Rent Per Rent at Leased Leased Expiration NRSF at NRSF(2) ($000)(3) Expiration(2) Unoccupied data center - 239,153 12.2 % $ - - % $ - $ - $ - Unoccupied OLI - 74,443 3.8 - - - - - 2015 224 97,133 4.9 16,526 9.1 144 16,667 145 2016 608 252,442 12.8 40,324 22.2 152 40,386 153 2017 437 239,908 12.2 43,476 23.8 164 47,247 180 2018 236 284,407 14.5 35,098 19.2 123 40,021 141 2019 81 179,952 9.2 15,482 8.5 86 18,981 105 2020-Thereafter 71 348,167 17.7 25,079 13.7 72 36,928 106 OLI (4) 101 250,205 12.7 6,462 3.5 26 6,882 28 Portfolio Total / Weighted Average 1,758 1,965,810 100.0 % $ 182,447 100.0 % $ 105 $ 207,112 $ 120 NRSF of Annualized Expiring Rent Year Leases ($000) 2015 5,132 $ 108 2016 39,879 980 2017 10,651 305 2018 8,152 191 2019 32,332 798 2020-Thereafter 154,059 4,080 Total OLI 250,205 $ 6,462

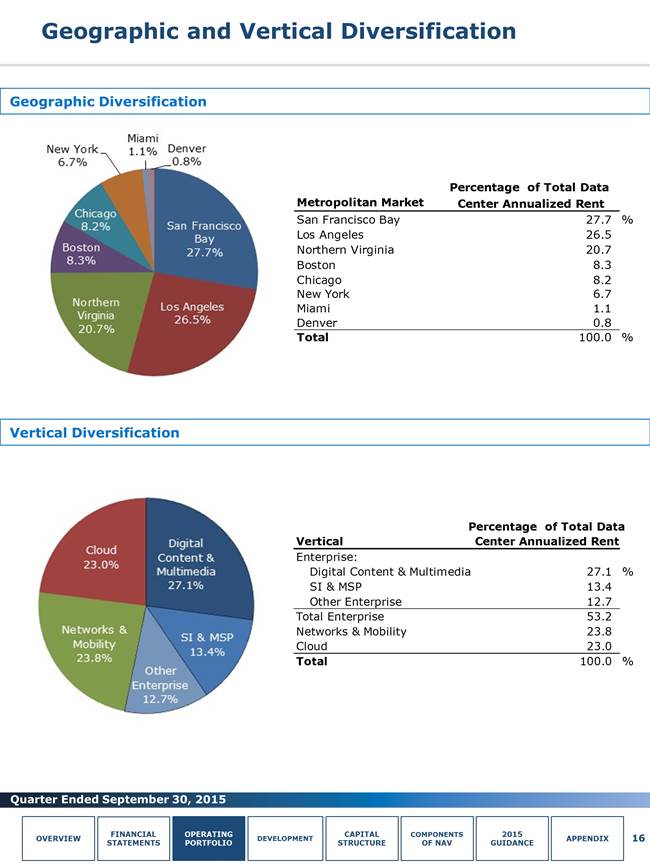
Geographic and Vertical Diversification Geographic Diversification Vertical Diversification 16 OVERVIEW FINANCIAL STATEMENTS OPERATING PORTFOLIO DEVELOPMENT CAPITAL STRUCTURE Components of NAV 2015 GUIDANCE APPENDIX Percentage of Total Data Metropolitan Market Center Annualized Rent San Francisco Bay 27.7 % Los Angeles 26.5 Northern Virginia 20.7 Boston 8.3 Chicago 8.2 New York 6.7 Miami 1.1 Denver 0.8 Total 100.0 % Percentage of Total Data Vertical Center Annualized Rent Enterprise: Digital Content & Multimedia 27.1 % SI & MSP 13.4 Other Enterprise 12.7 Total Enterprise 53.2 Networks & Mobility 23.8 Cloud 23.0 Total 100.0 %
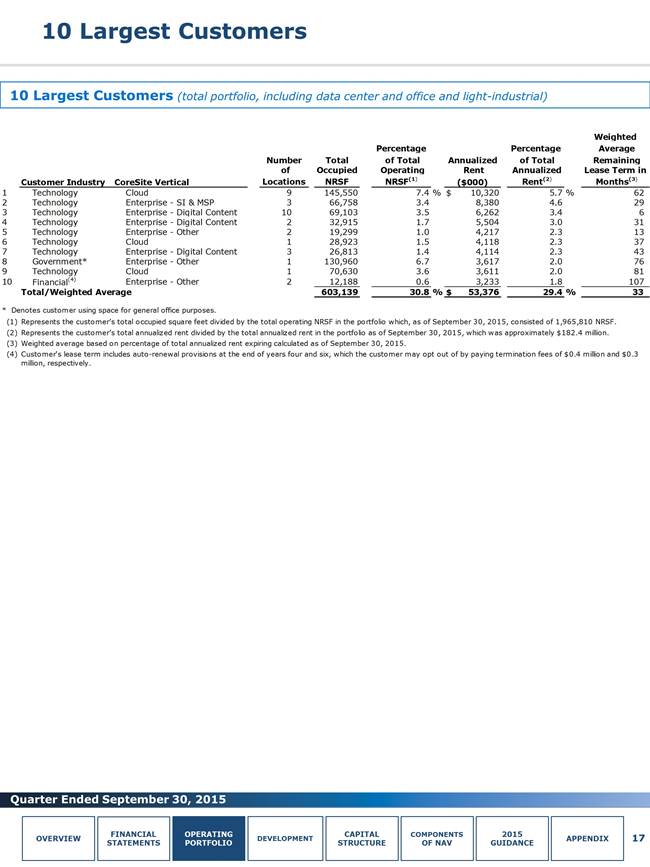
10 Largest Customers 10 Largest Customers (total portfolio, including data center and office and light-industrial) 17 OVERVIEW FINANCIAL STATEMENTS OPERATING PORTFOLIO DEVELOPMENT CAPITAL STRUCTURE Components of NAV 2015 GUIDANCE APPENDIX Weighted Percentage Percentage Average Number Total of Total of Occupied Operating Customer Industry CoreSite Vertical Locations NRSF NRSF(1) Annualized Rent ($000) of Total Remaining Annualized Lease Term in Rent(2) Months(3) 1 Technology Cloud 9 145,550 7.4 % $ 10,320 5.7 % 62 2 Technology Enterprise - SI & MSP 3 66,758 3.4 8,380 4.6 29 3 Technology Enterprise - Digital Content 10 69,103 3.5 6,262 3.4 6 4 Technology Enterprise - Digital Content 2 32,915 1.7 5,504 3.0 31 5 Technology Enterprise - Other 2 19,299 1.0 4,217 2.3 13 6 Technology Cloud 1 28,923 1.5 4,118 2.3 37 7 Technology Enterprise - Digital Content 3 26,813 1.4 4,114 2.3 43 8 Government* Enterprise - Other 1 130,960 6.7 3,617 2.0 76 9 Technology Cloud 1 70,630 3.6 3,611 2.0 81 10 Financial(4) Enterprise - Other 2 12,188 0.6 3,233 1.8 107 Total/Weighted Average 603,139 30.8 % $ 53,376 29.4 % 33
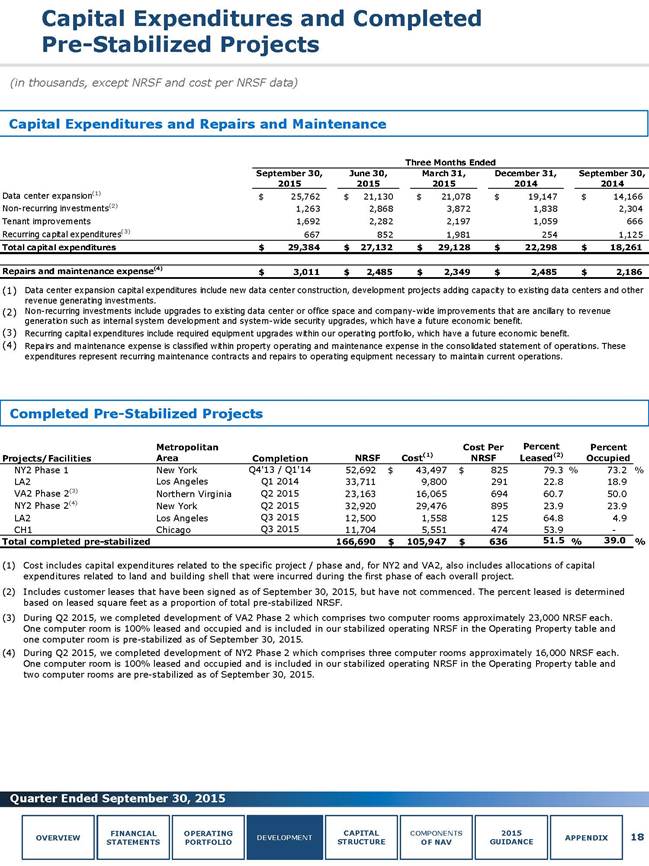
Capital Expenditures and Completed Pre-Stabilized Projects (in thousands, except NRSF and cost per NRSF data) Completed Pre-Stabilized Projects Capital Expenditures and Repairs and Maintenance 18 OVERVIEW FINANCIAL STATEMENTS OPERATING PORTFOLIO DEVELOPMENT CAPITAL STRUCTURE Components of NAV 2015 GUIDANCE APPENDIX Three Months Ended September 30, 2015 June 30, 2015 March 31, 2015 December 31, 2014 September 30, 2014 Data center expansion(1) $ 25,762 $ 21,130 $ 21,078 $ 19,147 $ 14,166 Non-recurring investments(2) 1,263 2,868 3,872 1,838 2,304 Tenant improvements 1,692 2,282 2,197 1,059 666 Recurring capital expenditures(3) 667 852 1,981 254 1,125 Total capital expenditures $ 29,384 $ 27,132 $ 29,128 $ 22,298 $ 18,261 Repairs and maintenance expense(4) $ 3,011 $ 2,485 $ 2,349 $ 2,485 $ 2,186 Projects/Facilities Metropolitan Area Completion NRSF Cost(1) Cost Per NRSF Percent Leased(2) Percent Occupied NY2 Phase 1 New York Q4'13 / Q1'14 52,692 $ 43,497 $ 825 79.3 % 73.2 % LA2 Los Angeles Q1 2014 33,711 9,800 291 22.8 18.9 VA2 Phase 2(3) Northern Virginia Q2 2015 23,163 16,065 694 60.7 50.0 NY2 Phase 2(4) New York Q2 2015 32,920 29,476 895 23.9 23.9 LA2 Los Angeles Q3 2015 12,500 1,558 125 64.8 4.9 CH1 Chicago Q3 2015 11,704 5,551 474 53.9 - Total completed pre-stabilized 166,690 $ 105,947 $ 636 51.5 % 39.0 %
Development Summary (in thousands, except NRSF and cost per NRSF data) Data Center Projects Under Construction 19 OVERVIEW FINANCIAL STATEMENTS OPERATING PORTFOLIO DEVELOPMENT CAPITAL STRUCTURE Components of NAV 2015 GUIDANCE APPENDIX Held for Development(1) Costs Metropolitan Projects/Facilities Area Estimated Completion NRSF Incurred to- date Estimated Total Per NRSF Percent Leased TKD VA2 Phase 3(1) Northern Virginia Q4 2015 48,137 $ 10,481 $ 24,500 $ 509 48.1 % VA2 Phase 4(1) Northern Virginia Q1 2016 48,137 514 8,000 166 - BO1 Boston Q1 2016 14,031 3,023 11,000 784 - SV7 Phase 1 San Francisco Bay Q2 2016 80,000 178 110,000 1,375 43.8 Total / average TKD 190,305 $ Powered shell 14,196 $ 153,500 $ 807 30.6 % SV6(2) San Francisco Bay Q1 - Q2 2016 136,580 $ 10,851 $ 30,000 $ 220 100.0 % Total TKD and powered shell 326,885 $ 25,047 $ 183,500 59.6 % Projects/Facilities Metropolitan Area Estimated NRSF New construction Estimated Sellable Power (Megawatts) Estimated Incremental Costs Estimated Incremental Cost per MW Santa Clara Campus(2) San Francisco Bay 150,000 5.0 - 17.0 Secaucus, NJ New York 47,211 - 147,211 5.0 - 15.0 Incremental capacity in existing facilities NY2 (Phases 3-4) New York 87,297 8.5 $ 57,000 $ 6,706 BO1 Boston 73,619 6.0 40,000 6,667 LA2 Los Angeles 187,478 13.0 73,000 5,615 MI1 Miami 13,154 1.0 7,500 7,500 Total incremental capacity 361,548 28.5 $ 177,500 $ 6,228 Total new construction and incremental capacity 558,759 - 658,759 38.5 - 60.5

Market Capitalization and Debt Summary (in thousands, except per share data) Market Capitalization Debt Maturities Debt Summary (1) 20 OVERVIEW FINANCIAL STATEMENTS OPERATING PORTFOLIO DEVELOPMENT CAPITAL STRUCTURE Components of NAV 2015 GUIDANCE APPENDIX Shares or Equivalents Outstanding Market Price / Liquidation Value as of September 30, 2015 Market Value Equivalents Common shares 26,637 $51.44 $ 1,370,207 Operating partnership units 20,861 $51.44 1,073,090 Liquidation value of preferred stock 4,600 $25.00 115,000 Total equity 2,558,297 Total debt 360,250 Total enterprise value $ 2,918,547 Net debt to enterprise value 12.0% Net debt and preferred stock to enterprise value 16.0% Maturity Outstanding as of: Maturity Date with September 30, December 31, Instrument Rate Date Extension 2015 2014 Revolving credit facility (2) 1.75% 6/24/2019 6/24/2020 $ 110,250 $ 218,500 2019 Senior unsecured term loan (3) 3.23% 1/31/2019 1/31/2019 100,000 100,000 2020 Senior unsecured term loan (4) 2.32% 6/24/2020 6/24/2020 150,000 - Total Debt Weighted average debt rate 2.40% $ 360,250 $ 318,500 Preferred Stock 7.25% N/A N/A 115,000 115,000 Total Debt and Preferred Stock $ 475,250 $ 433,500 Floating rate vs. fixed rate debt 51% / 49% 67% / 33% Floating rate vs. fixed rate debt and preferred stock 39% / 61% 50% / 50%

Interest Summary and Debt Covenants (in thousands) Interest Expense Components Debt Covenants 21 OVERVIEW FINANCIAL STATEMENTS OPERATING PORTFOLIO DEVELOPMENT CAPITAL STRUCTURE Components of NAV 2015 GUIDANCE APPENDIX Three Months Ended Nine Months Ended September 30, 2015 June 30, 2015 September 30, 2014 September 30, 2015 September 30, 2014 Interest expense and fees $ 2,392 $ 2,466 $ 2,105 $ 7,083 $ 5,865 Amortization of deferred financing costs 413 292 448 999 1,477 Capitalized interest (617) (1,028) (1,192) (2,899) (3,393) Total interest expense $ 2,188 $ 1,730 $ 1,361 $ 5,183 $ 3,949 Percent capitalized 22.0% 37.3% 46.7% 35.9% 46.2% Revolving Credit Facility and Senior Unsecured Term Loans September 30, Required Compliance 2015 June 30, 2015 March 31, 2015 December 31, 2014 September 30, 2014 Fixed charge coverage ratio Greater than 1.70x 9.3x 8.4x 8.8x 8.4x 7.7x Total indebtedness to gross asset value Less than 60% 17.5% 17.9% 17.1% 17.2% 17.5% Secured debt to gross asset value Unhedged variable rate debt to gross asset value Less than 40% 0.0% 0.0% 0.0% 0.0% 0.0% Less than 30% 8.4% 8.3% 11.8% 11.6% 11.5% Revolving credit facility availability $350,000 $350,000 $405,000 $405,000 $405,000 Borrowings outstanding (110,250) (102,250) (233,750) (218,500) (205,250) Outstanding letters of credit (6,330) (6,330) (7,330) (7,330) (7,330) Current availability $233,420 $241,420 $163,920 $179,170 $192,420

Components of Net Asset Value (NAV) (in thousands) 22 OVERVIEW FINANCIAL STATEMENTS OPERATING PORTFOLIO DEVELOPMENT CAPITAL STRUCTURE Components of NAV 2015 GUIDANCE APPENDIX Cash Net Operating Income Development Projects Other Assets and Liabilities (in thousands) Cash Net Operating Income Reconciliation of Net Operating Income (NOI) Q3 2015 Annualized Operating Income Adjustments: $ 16,751 $ 67,004 Depreciation and amortization 24,347 97,388 General and administrative 8,644 34,576 Transaction costs / litigation 656 2,624 Net Operating Income $ 50,398 $ 201,592 Cash Net Operating Income (Cash NOI) Net Operating Income Adjustments: $ 50,398 $ 201,592 Straight-line rent (2,993) (11,972) Amortization of above and below-market leases (129) (516) Cash NOI $ 47,276 $ 189,104 Cash NOI with backlog (85.8% leased)(1) Cash stabilized NOI (93% leased) $ 50,500 $ $ 54,738 $ 202,000 218,952 Development Projects Data Center Projects Under Construction Construction in progress(2) $ 25,047 Remaining spend(2) 158,453 Total $ 183,500 Targeted annual yields 12% - 16% Annualized pro forma NOI range $22,000 - $29,000 Other Assets and Liabilities Other Assets Remaining construction in progress(3) $ 101,070 Cash and cash equivalents 9,477 Accounts and other receivables 14,194 Other tangible assets 21,079 Total other assets $ 145,820 Liabilities Debt $ 360,250 Accounts payable, accrued and other liabilities 110,099 Preferred equity 115,000 Total liabilities $ 585,349 Weighted average common shares and units - diluted 47,411

2015 Guidance (in thousands, except per share amounts) 23 OVERVIEW FINANCIAL STATEMENTS OPERATING PORTFOLIO DEVELOPMENT CAPITAL STRUCTURE Components of NAV 2015 GUIDANCE APPENDIX Projected per share and OP unit information: 2015 Implied Low High Mid 2014 Growth(1) Net income attributable to common shares $ 0.98 $ 1.02 $ 1.00 $ 0.66 52% Real estate depreciation and amortization 1.84 1.84 1.84 1.58 Gain on land disposal - - - (0.02) FFO Non-recurring items: $ 2.82 $ 2.86 $ 2.84 $ 2.22 Q2 benefit from real estate tax accrual true-up - - - (0.08) Q1 and Q2 charges for software impairment - - - 0.04 FFO - excluding non-recurring items(2) $ 2.82 $ 2.86 $ 2.84 $ 2.18 30% Projected operating results: Total operating revenues $ 329,000 $ 333,000 $ 331,000 $ 272,420 22% Data center revenue 321,000 325,000 323,000 264,578 22% General and administrative expenses 31,000 33,000 32,000 27,842 15% Adjusted EBITDA(3) 165,000 169,000 167,000 129,634 29% Guidance drivers: Annual rental churn rate 8.0% 9.0% 8.5% 5.6% Cash rent growth on data center renewals 4.0% 5.0% 4.5% 2.9% Capital expenditures: Data center expansion $ 120,000 $ 145,000 $ 132,500 $ 84,312 Non-recurring investments 10,000 15,000 12,500 12,527 Tenant improvements 5,000 10,000 7,500 4,512 Recurring capital expenditures 5,000 10,000 7,500 4,429 Total capital expenditures $ 140,000 $ 180,000 $ 160,000 $ 105,780

Appendix Definitions This document includes certain non-GAAP financial measures that management believes are helpful in understanding our business, as further described below. Our definition and calculation of non-GAAP financial measures may differ from those of other REITs and therefore may not be comparable. The non-GAAP measures should not be considered an alternative to net income as an indicator of our performance and should be considered only a supplement to net income, cash flows from operating, investing or financing activities as a measure of profitability and/or liquidity, computed in accordance with GAAP. Funds From Operations (“FFO”) is a supplemental measure of our performance which should be considered along with, but not as an alternative to, net income and cash provided by operating activities as a measure of operating performance and liquidity. We calculate FFO in accordance with the standards established by the National Association of Real Estate Investment Trusts (“NAREIT”). FFO represents net income (loss) (computed in accordance with GAAP), excluding gains (or losses) from sales of property and undepreciated land and impairment write-downs of depreciable real estate, plus real estate related depreciation and amortization (excluding amortization of deferred financing costs) and after adjustments for unconsolidated partnerships and joint ventures. FFO attributable to common shares and units represents FFO less preferred stock dividends declared during the period. Our management uses FFO as a supplemental performance measure because, in excluding real estate related depreciation and amortization and gains and losses from property dispositions, it provides a performance measure that, when compared year over year, captures trends in occupancy rates, rental rates and operating costs. We offer this measure because we recognize that FFO will be used by investors as a basis to compare our operating performance with that of other REITs. However, because FFO excludes depreciation and amortization and captures neither the changes in the value of our properties that result from use or market conditions, nor the level of capital expenditures and capitalized leasing commissions necessary to maintain the operating performance of our properties, all of which have real economic effect and could materially impact our financial condition and results from operations, the utility of FFO as a measure of our performance is limited. FFO is a non-GAAP measure and should not be considered a measure of liquidity, an alternative to net income, cash provided by operating activities or any other performance measure determined in accordance with GAAP, nor is it indicative of funds available to fund our cash needs, including our ability to pay dividends or make distributions. In addition, our calculations of FFO are not necessarily comparable to FFO as calculated by other REITs that do not use the same definition or implementation guidelines or interpret the standards differently from us. Investors in our securities should not rely on these measures as a substitute for any GAAP measure, including net income. 24 OVERVIEW FINANCIAL STATEMENTS OPERATING PORTFOLIO DEVELOPMENT CAPITAL STRUCTURE Components of NAV 2015 GUIDANCE APPENDIX

Appendix Adjusted Funds From Operations “AFFO” is a non-GAAP measure that is used as a supplemental operating measure specifically for comparing year over year ability to fund dividend distribution from operating activities. AFFO is used by us as a basis to address our ability to fund our dividend payments. We calculate adjusted funds from operations by adding to or subtracting from FFO: Plus: Amortization of deferred financing costs Plus: Non-cash compensation Plus: Non-real estate depreciation Plus: Impairment charges Plus: Below market debt amortization Less: Straight line rents adjustment Less: Amortization of above and below market leases Less: Recurring capital expenditures Less: Tenant improvements Less: Capitalized leasing costs AFFO is not intended to represent cash flow from operations for the period, and is only intended to provide an additional measure of performance by adjusting the effect of certain items noted above included in FFO. AFFO is a widely reported measure by other REITs, however, other REITs may use different methodologies for calculating AFFO and, accordingly, our AFFO may not be comparable to other REITs. Earnings before Interest, Taxes, Depreciation and Amortization (EBITDA) and Adjusted EBITDA - EBITDA is defined as earnings before interest, taxes, depreciation and amortization. We calculate adjusted EBITDA by adding our non-cash compensation expense, transaction costs and litigation expense to EBITDA as well as adjusting for the impact of impairment charges, gains or losses from sales of property and undepreciated land and gains or losses on early extinguishment of debt. Management uses EBITDA and adjusted EBITDA as indicators of our ability to incur and service debt. In addition, we consider EBITDA and adjusted EBITDA to be appropriate supplemental measures of our performance because they eliminate depreciation and interest, which permits investors to view income from operations without the impact of non-cash depreciation or the cost of debt. However, because EBITDA and adjusted EBITDA are calculated before recurring cash charges including interest expense and taxes, and are not adjusted for capital expenditures or other recurring cash requirements of our business, their utilization as a cash flow measurement is limited. 25 OVERVIEW FINANCIAL STATEMENTS OPERATING PORTFOLIO DEVELOPMENT CAPITAL STRUCTURE Components of NAV 2015 GUIDANCE APPENDIX Capitalized leasing costs include commissions payable to third party brokers and leasing agents and internal sales commissions payable to employees. Capitalized leasing costs are accrued and deducted from AFFO generally in the period that the lease is executed. Leasing costs are generally paid to a) third party brokers and internal sales employees 50% at customer lease signing and 50% at lease commencement and b) leasing agents monthly over the lease term as and to the extent the Company receives payment from the end customer.
Appendix Net Operating Income (“NOI”) and Cash NOI – NOI, and cash NOI are supplemental measures for the operating performance of the company’s portfolio. NOI is operating revenues less operating expenses and adjusted for items such as depreciation and amortization, general and administrative expenses, transaction costs and litigation expenses. Cash NOI is NOI less straight-line rents and above and below market rent amortization. Data Center Net Rentable Square Feet (“NRSF”) Both occupied and available data center NRSF includes a factor to account for a customer’s proportionate share of required data center support space (such as the mechanical, telecommunications and utility rooms) and building common areas, which may be updated on a periodic basis to reflect the most current build-out of our properties. Stabilized and Pre-Stabilized NRSF Data center projects and facilities that recently have been developed and are in the initial lease-up phase are classified as pre-stabilized NRSF until they reach 85% occupancy or have been in service for 24 months. Pre-stabilized projects and facilities become stabilized operating properties at the earlier of achievement of 85% occupancy or 24 months after development completion and are included in the stabilized operating NRSF. Annualized Rent Monthly contractual rent under existing commenced customer leases as of quarter-end, multiplied by 12. This amount reflects total annualized base rent before any one-time or non-recurring rent abatements and excludes power revenue, interconnection revenue and operating expense reimbursement. NRSF Under Construction Represents NRSF for which substantial activities are ongoing to prepare the property for its intended use following development. The NRSF reflects managements estimate of engineering drawings and required support space and is subject to change based on final demising of space. Estimated costs of completion are based on actual costs at quarter-end and management’s estimate of remaining projects costs. 26 OVERVIEW FINANCIAL STATEMENTS OPERATING PORTFOLIO DEVELOPMENT CAPITAL STRUCTURE Components of NAV 2015 GUIDANCE APPENDIX

Appendix NRSF Held for Development Represents incremental data center capacity that may be constructed in existing facilities and entitled land in our portfolio that requires significant capital investment in order to develop new data center facilities. In addition to entitled land, we may develop an additional 100,000 NRSF at NY2 upon our receipt of the necessary entitlements. Turn-Key Same Store Includes turn-key data center space that was leased or available to be leased to our colocation customers as of December 31, 2013, at each of our properties, and excludes powered shell data center space, SV3 data center space, office and light-industrial space and space for which development was completed and became available to be leased after December 31, 2013. The turn-key same store space as of December 31, 2013, is 1,067,665 NRSF. We track same store on a computer room basis within each data center facility. Monthly Recurring Revenue per Cabinet Equivalent Represents the turn-key monthly recurring colocation revenue (“MRR”) per cabinet equivalent billed. MRR is defined as recurring contractual revenue under existing commenced customer leases. MRR per cabinet equivalent is calculated as (current quarter MRR/3) divided by ((quarter-end cabinet equivalents billed plus prior quarter-end cabinet equivalents billed)/2). Cabinet equivalents are calculated as cage-usable square feet (turn-key leased NRSF/NRSF factor) divided by 25. Data Center Leasing Metrics Rental Churn Rate – represents data center leases which are not renewed or are terminated during the period. Rental churn is calculated based on the annualized rent of data center expired leases terminated in the period, compared with total portfolio annualized rent at the beginning of the period. Cash and GAAP Rent Growth – represents the increase in rental rates on renewed data center leases signed during the period, as compared with the previous rental rates for the same space. Cash and GAAP rent growth is calculated based on annualized rent from the renewed data center license compared to annualized rent from the expired data center license. 27 OVERVIEW FINANCIAL STATEMENTS OPERATING PORTFOLIO DEVELOPMENT CAPITAL STRUCTURE Components of NAV 2015 GUIDANCE APPENDIX