Attached files
| file | filename |
|---|---|
| 8-K - FORM 8-K - ALLIANCE DATA SYSTEMS CORP | form_8k.htm |
Exhibit 99.1

©2015 ADS Alliance Data Systems, Inc. Confidential and Proprietary Earnings Release | October 22, 2015 Alliance Data NYSE: ADS Q3 2015 ResultsOctober 22, 2015

©2015 ADS Alliance Data Systems, Inc. Confidential and Proprietary Earnings Release | October 22, 2015 Agenda Speakers: Ed Heffernan President and CEO Charles Horn EVP and CFO Bryan Kennedy CEO – Epsilon/Conversant Third Quarter 2015 Consolidated ResultsSegment Results2015 Guidance and Critical GoalsInitial 2016 Guidance 1

©2015 ADS Alliance Data Systems, Inc. Confidential and Proprietary Earnings Release | October 22, 2015 Third Quarter 2015 Consolidated Results(MM, except per share) Quarter Ended September 30, Quarter Ended September 30, Quarter Ended September 30, 2015 2014 % Change Revenue $ 1,589 $ 1,319 +20% EPS $ 2.08 $ 2.74 -24% Core EPS $ 3.95 $ 3.47 +14% Adjusted EBITDA $ 497 $ 416 +19% Adjusted EBITDA, net $ 453 $ 376 +20% Diluted shares outstanding 61.8 59.9 Strong organic revenue growth of 12 percent.Unfavorable FX rates were a $59 million and $0.13 drag to revenue and core EPS, respectively. Constant currency growth rates of 25 percent for revenue and 18 percent for core EPS.EPS was negatively impacted by a $0.65 FDIC-related charge principally for the years 2008 to 2013. 2

©2015 ADS Alliance Data Systems, Inc. Confidential and Proprietary Earnings Release | October 22, 2015 LoyaltyOne® (MM) Revenue and adjusted EBITDA increased 10 percent and 11 percent, respectively, on a constant currency basis. Issuance growth of 5 percent in Canada. Expect negative growth in the fourth quarter of 2015 due to difficult comparable.Canadian $ weakened further during the third quarter. Quarter Ended September 30, Quarter Ended September 30, Quarter Ended September 30, 2015 2014 % Change Revenue $ 299 $ 325 -8% Adjusted EBITDA 72 78 -8% Non-controlling interest -7 -8 Adjusted EBITDA, net $ 65 $ 70 -7% Adjusted EBITDA % 24% 24% 0% Constant currency revenue $ 358 $ 325 +10% Constant currency adjusted EBITDA $ 86 $ 78 +11% Average CDN FX rate 0.76 0.92 -17% Average Euro FX rate 1.11 1.32 -16% 3
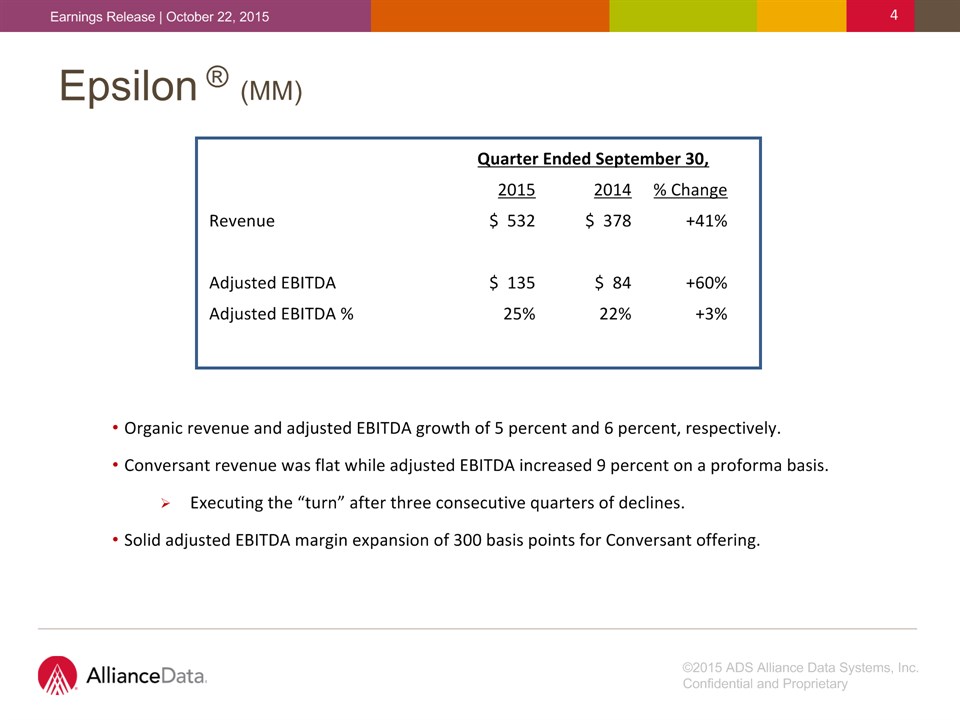
©2015 ADS Alliance Data Systems, Inc. Confidential and Proprietary Earnings Release | October 22, 2015 Epsilon ® (MM) Organic revenue and adjusted EBITDA growth of 5 percent and 6 percent, respectively. Conversant revenue was flat while adjusted EBITDA increased 9 percent on a proforma basis.Executing the “turn” after three consecutive quarters of declines. Solid adjusted EBITDA margin expansion of 300 basis points for Conversant offering. Quarter Ended September 30, Quarter Ended September 30, Quarter Ended September 30, 2015 2014 % Change Revenue $ 532 $ 378 +41% Adjusted EBITDA $ 135 $ 84 +60% Adjusted EBITDA % 25% 22% +3% 4

©2015 ADS Alliance Data Systems, Inc. Confidential and Proprietary Earnings Release | October 22, 2015 Conversant Year-Over-Year Growth Revenue Adj. EBITDA ADS Purchase 5

©2015 ADS Alliance Data Systems, Inc. Confidential and Proprietary Earnings Release | October 22, 2015 Card Services (MM) Strong revenue growth driven by 30 percent growth in average card receivables during Q3.Substantial growth in card receivables drove solid expense leveraging. The provision for loan losses increased significantly due to card receivables growth and an uptick in principal loss rates due to seasoning. Quarter Ended September 30, Quarter Ended September 30, Quarter Ended September 30, 2015 2014 % Change Revenue $ 764 $ 622 +23% Operating expenses 266 221 +20% Provision for loan losses 172 115 +50% Funding costs 37 31 +20% Adjusted EBITDA, net $ 289 $ 255 +14% Adjusted EBITDA, net % 38% 41% -3% 6

©2015 ADS Alliance Data Systems, Inc. Confidential and Proprietary Earnings Release | October 22, 2015 Card Services (MM) Majority of gross yield compression is due to mix (co-brand vs. PLCC). Loss rates were up 40 basis points due to seasoning of new vintages. Core1 spending remains strong, up 9 percent. Ending reserve of 5.7 percent of reservable receivables at September 30, 2015. Quarter Ended September 30, Quarter Ended September 30, Quarter Ended September 30, Key metrics: 2015 2014 Change Credit sales $ 6,000 $ 4,479 +34% Average credit card receivables 11,369 8,737 +30% Total gross yield 26.9% 28.5% -1.6% Principal loss rates 4.4% 4.0% +0.4% Delinquency rate 4.5% 4.4% +0.1% 7 1 Pre - 2012 programs.

©2015 ADS Alliance Data Systems, Inc. Confidential and Proprietary Earnings Release | October 22, 2015 2015 Guidance and Critical Goals Double-digit growth in revenue and adjusted EBITDANorth American expansionAIR MILES reward miles issuance growth returns to mid-single digits Revenue growth flows through to adj. EBITDA growthComplete internal transformation towards data (first-half)Return to solid organic growth (second-half)Exceptional portfolio growth (> 25 percent)Strong, double-digit revenue and adjusted EBITDA, net growthSign new $2 billion vintage Deliver full digital suite (mobile apps, etc.)Organic revenue growth of 3x GDP; 20 percent plus overall revenue growth$1.3 billion in free cash flowPlay through FX headwinds though over-performance and share buybacks 8 BrandLoyalty Canada Epsilon Conversant Overall

©2015 ADS Alliance Data Systems, Inc. Confidential and Proprietary Earnings Release | October 22, 2015 2015 Guidance($MM, except per share) 9 2014 2015 ’15 / ’14 Increase Actual Guidance Revenue $ 5,303 $6,500 +23% Core EPS $ 12.56 $15.00 +19% Diluted shares outstanding 62.4 62.8 Organic revenue growth rate of 14 percent (constant currency).Expected drag of $250 million to revenue and $0.50 to core EPS from FX.

©2015 ADS Alliance Data Systems, Inc. Confidential and Proprietary Earnings Release | October 22, 2015 Initial 2016 Guidance Overall High single-digit to low double-digit growth in revenue and adjusted EBITDA on a constant currency basisNorth American expansion provides upside for BrandLoyaltyMid-single digit issuance growth in CanadaMid to high-single digit growth in revenue and adjusted EBITDA Complete internal transformation towards data-driven modelDrive an additional $70 million in cross-sell revenue25 percent growth in card receivablesDouble-digit revenue and adjusted EBITDA, net growthSign new $2 billion vintage Principal loss rates up 20 – 30 basis points Double-digit revenue and core EPS growthOrganic revenue growth above 3x GDP target> $1.4 billion in free cash flowFX headwinds will likely continue, but at levels less than 2015 10

©2015 ADS Alliance Data Systems, Inc. Confidential and Proprietary Earnings Release | October 22, 2015 Initial 2016 Guidance($MM, except per share) 2015 2016 ’16 / ’15 Increase Constant Currency Revenue $ 6,500 $7,200 +11% Core EPS $ 15.00 $17.00 +13% Diluted shares outstanding 62.8 62.1 CDN$ 0.79 Euro 1.09 11

©2015 ADS Alliance Data Systems, Inc. Confidential and Proprietary Earnings Release | October 22, 2015 Q & A

©2015 ADS Alliance Data Systems, Inc. Confidential and Proprietary Earnings Release | October 22, 2015 Safe Harbor Statement and Forward Looking Statements This presentation may contain forward-looking statements within the meaning of Section 27A of the Securities Act of 1933, as amended, and Section 21E of the Securities Exchange Act of 1934, as amended. Such statements may use words such as “anticipate,” “believe,” “continue,” “could,” “estimate,” “expect,” “intend,” “may,” “predict,” “project,” “would” and similar expressions as they relate to us or our management. When we make forward-looking statements, we are basing them on our management’s beliefs and assumptions, using information currently available to us. Although we believe that the expectations reflected in the forward-looking statements are reasonable, these forward-looking statements are subject to risks, uncertainties and assumptions, including those discussed in our filings with the Securities and Exchange Commission. If one or more of these or other risks or uncertainties materialize, or if our underlying assumptions prove to be incorrect, actual results may vary materially from what we projected. Any forward-looking statements contained in this presentation reflect our current views with respect to future events and are subject to these and other risks, uncertainties and assumptions relating to our operations, results of operations, growth strategy and liquidity. We have no intention, and disclaim any obligation, to update or revise any forward-looking statements, whether as a result of new information, future results or otherwise, except as required by law. “Safe Harbor” Statement under the Private Securities Litigation Reform Act of 1995: Statements in this presentation regarding Alliance Data Systems Corporation’s business which are not historical facts are “forward-looking statements” that involve risks and uncertainties. For a discussion of such risks and uncertainties, which could cause actual results to differ from those contained in the forward-looking statements, see “Risk Factors” in the Company’s Annual Report on Form 10-K for the most recently ended fiscal year. Risk factors may be updated in Item 1A in each of the Company’s Quarterly Reports on Form 10-Q for each quarterly period subsequent to the Company’s most recent Form 10-K.

©2015 ADS Alliance Data Systems, Inc. Confidential and Proprietary Earnings Release | October 22, 2015 Financial Measures In addition to the results presented in accordance with generally accepted accounting principles, or GAAP, the Company may present financial measures that are non-GAAP measures, such as constant currency financial measures, adjusted EBITDA, adjusted EBITDA margin, adjusted EBITDA, net of funding costs and non-controlling interest, core earnings and core earnings per diluted share (core EPS). The Company believes that these non-GAAP financial measures, viewed in addition to and not in lieu of the Company’s reported GAAP results, provide useful information to investors regarding the Company’s performance and overall results of operations. These metrics are an integral part of the Company’s internal reporting to measure the performance of reportable segments and the overall effectiveness of senior management. Reconciliations to comparable GAAP financial measures are available in the accompanying schedules and on the Company’s website. The financial measures presented are consistent with the Company’s historical financial reporting practices. Core earnings and core earnings per diluted share represent performance measures and are not intended to represent liquidity measures. The non-GAAP financial measures presented herein may not be comparable to similarly titled measures presented by other companies, and are not identical to corresponding measures used in other various agreements or public filings.