Attached files
| file | filename |
|---|---|
| 8-K - 8-K - SOUTHWEST BANCORP INC | oksb-20151020x8k.htm |
| EX-99.1 - EX-99.1 - SOUTHWEST BANCORP INC | oksb-20151020ex99145382b.htm |
 2015 Third Quarter Earnings Presentation October 21, 2015 NASDAQ: OKSB
 Forward Looking Statements 2 We make forward-looking statements in this presentation that are subject to risks and uncertainties. We intend these statements to be covered by the safe harbor provision for forward-looking statements contained in the Private Securities Litigation Reform Act of 1995. These forward-looking statements include: •Statements of Southwest's goals, intentions, and expectations; •Estimates of risks and of future costs and benefits; •Expectations regarding our future financial performance and the financial performance of our operating segments; •Expectations regarding regulatory actions; •Expectations regarding our ability to utilize tax loss benefits; •Expectations regarding our stock repurchase program; •Expectations regarding dividends; •Expectations regarding acquisitions and divestitures; •Assessments of loan quality, probable loan losses, and the amount and timing of loan payoffs; •Estimates of the value of assets held for sale or available for sale; and •Statements of our ability to achieve financial and other goals. These forward-looking statements are subject to significant uncertainties because they are based upon: the amount and timing of future changes in interest rates, market behavior, and other economic conditions; future laws, regulations, and accounting principles; changes in regulatory standards and examination policies, and a variety of other matters. These other matters include, among other things, the direct and indirect effects of economic conditions on interest rates, credit quality, loan demand, liquidity, and monetary and supervisory policies of banking regulators. Because of these uncertainties, the actual future results may be materially different from the results indicated by these forward-looking statements. In addition, Southwest's past growth and performance do not necessarily indicate our future results. For other factors, risks, and uncertainties that could cause actual results to differ materially from estimates and projections contained in forward-looking statements, please read the “Risk Factors” contained in Southwest’s reports to the Securities and Exchange Commission. We do not intend, or undertake no obligation, to update or revise any forward-looking statements contained in this presentation, whether as a result of differences in actual results, changes in assumptions, or changes in other factors affecting said statements, except as required by law.
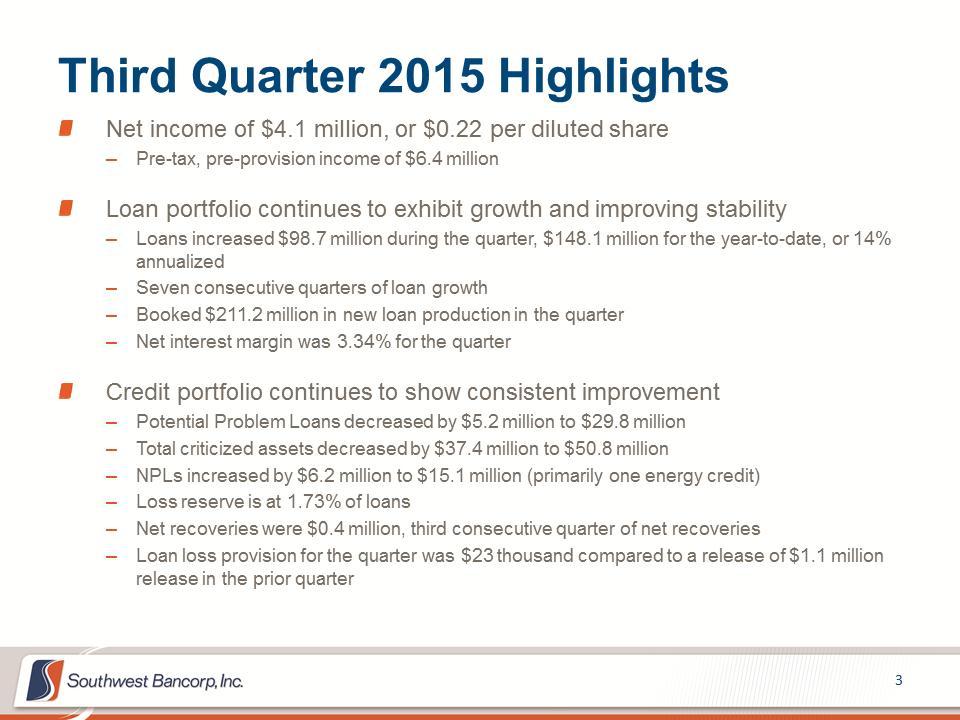 Net income of $4.1 million, or $0.22 per diluted share –Pre-tax, pre-provision income of $6.4 million Loan portfolio continues to exhibit growth and improving stability –Loans increased $98.7 million during the quarter, $148.1 million for the year-to-date, or 14% annualized –Seven consecutive quarters of loan growth –Booked $211.2 million in new loan production in the quarter –Net interest margin was 3.34% for the quarter Credit portfolio continues to show consistent improvement –Potential Problem Loans decreased by $5.2 million to $29.8 million –Total criticized assets decreased by $37.4 million to $50.8 million –NPLs increased by $6.2 million to $15.1 million (primarily one energy credit) –Loss reserve is at 1.73% of loans –Net recoveries were $0.4 million, third consecutive quarter of net recoveries –Loan loss provision for the quarter was $23 thousand compared to a release of $1.1 million release in the prior quarter Third Quarter 2015 Highlights 3
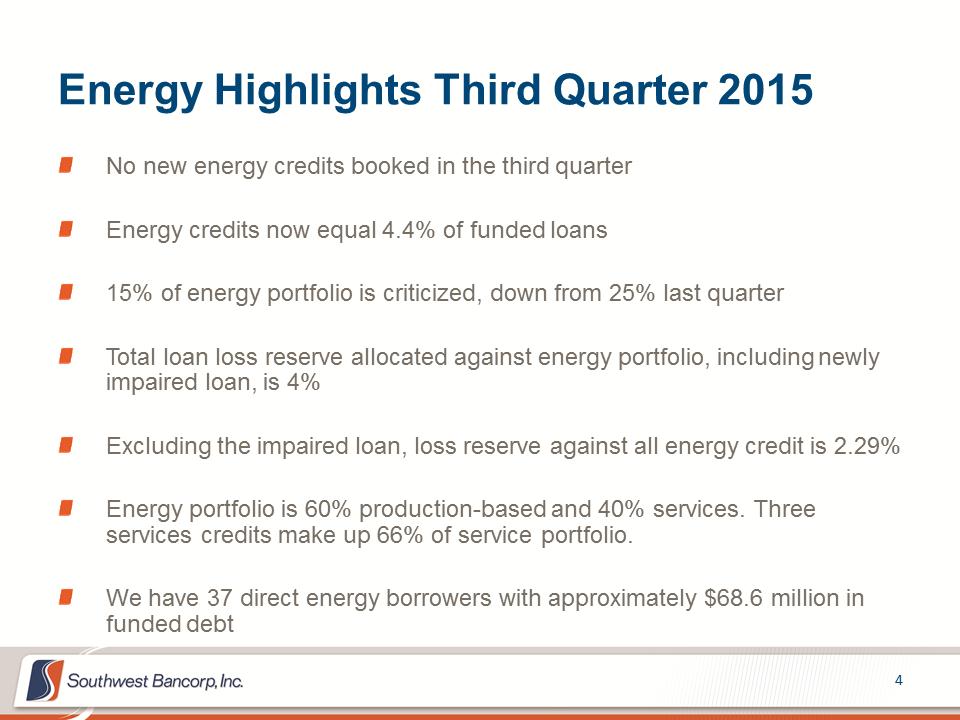 Energy Highlights Third Quarter 2015 No new energy credits booked in the third quarter Energy credits now equal 4.4% of funded loans 15% of energy portfolio is criticized, down from 25% last quarter Total loan loss reserve allocated against energy portfolio, including newly impaired loan, is 4% Excluding the impaired loan, loss reserve against all energy credit is 2.29% Energy portfolio is 60% production-based and 40% services. Three services credits make up 66% of service portfolio. We have 37 direct energy borrowers with approximately $68.6 million in funded debt 4
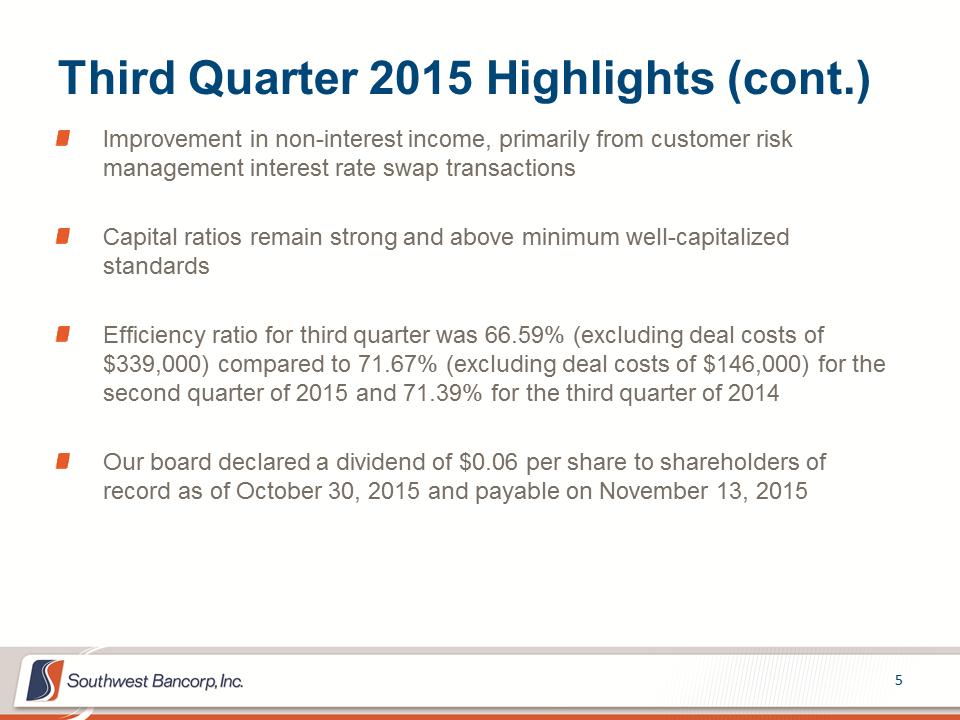 Third Quarter 2015 Highlights (cont.) Improvement in non-interest income, primarily from customer risk management interest rate swap transactions Capital ratios remain strong and above minimum well-capitalized standards Efficiency ratio for third quarter was 66.59% (excluding deal costs of $339,000) compared to 71.67% (excluding deal costs of $146,000) for the second quarter of 2015 and 71.39% for the third quarter of 2014 Our board declared a dividend of $0.06 per share to shareholders of record as of October 30, 2015 and payable on November 13, 2015 5
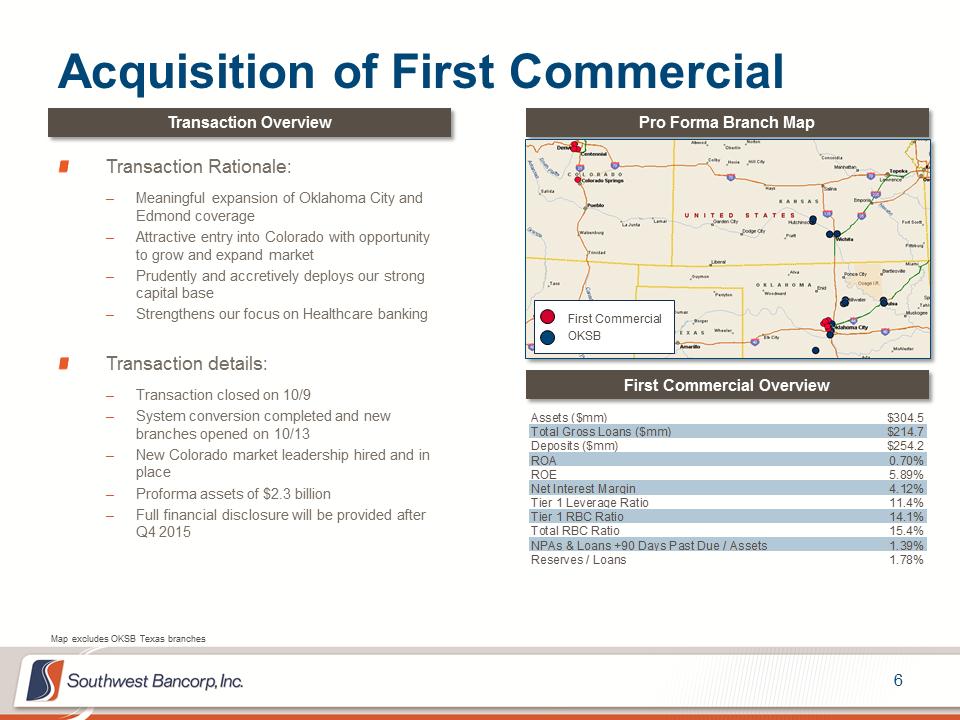 Acquisition of First Commercial 6 Map excludes OKSB Texas branches Transaction Rationale: –Meaningful expansion of Oklahoma City and Edmond coverage –Attractive entry into Colorado with opportunity to grow and expand market –Prudently and accretively deploys our strong capital base –Strengthens our focus on Healthcare banking Transaction details: –Transaction closed on 10/9 –System conversion completed and new branches opened on 10/13 –New Colorado market leadership hired and in place –Proforma assets of $2.3 billion –Full financial disclosure will be provided after Q4 2015 Transaction Overview Pro Forma Branch Map First Commercial Overview First Commercial OKSB Assets ($mm)$304.5Total Gross Loans ($mm)$214.7Deposits ($mm)$254.2ROA0.70%ROE5.89%Net Interest Margin4.12%Tier 1 Leverage Ratio11.4%Tier 1 RBC Ratio14.1%Total RBC Ratio15.4%NPAs & Loans +90 Days Past Due / Assets1.39%Reserves / Loans1.78%
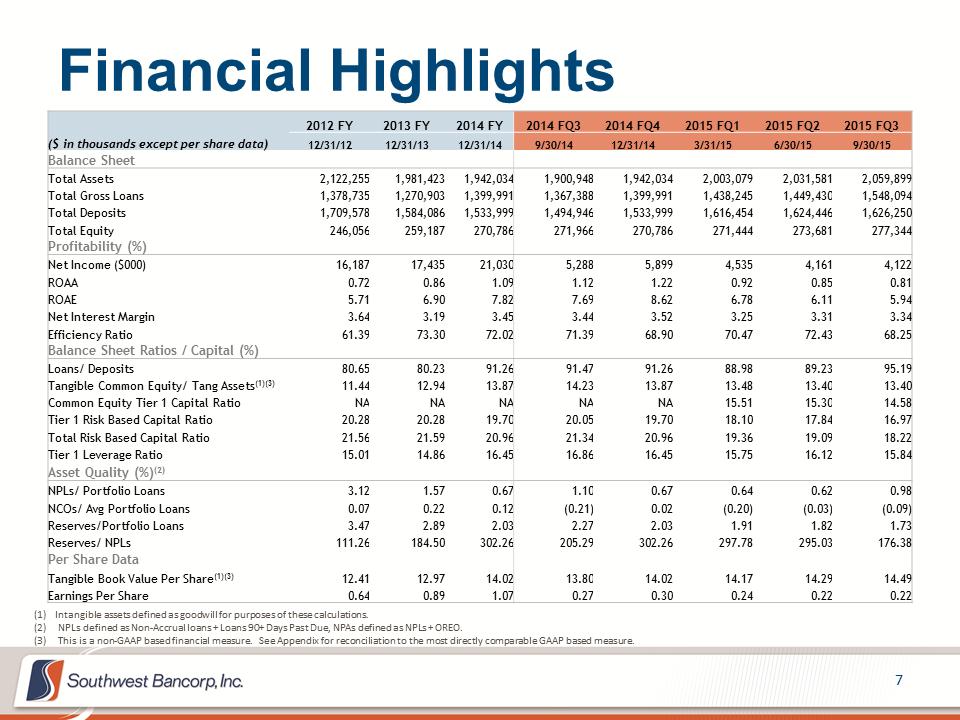 Financial Highlights 7 2012 FY 2013 FY 2014 FY 2014 FQ3 2014 FQ4 2015 FQ1 2015 FQ2 2015 FQ3 ($ in thousands except per share data) 12/31/12 12/31/13 12/31/14 9/30/14 12/31/14 3/31/15 6/30/15 9/30/15 Balance Sheet Total Assets 2,122,255 1,981,423 1,942,034 1,900,948 1,942,034 2,003,079 2,031,581 2,059,899 Total Gross Loans 1,378,735 1,270,903 1,399,991 1,367,388 1,399,991 1,438,245 1,449,430 1,548,094 Total Deposits 1,709,578 1,584,086 1,533,999 1,494,946 1,533,999 1,616,454 1,624,446 1,626,250 Total Equity 246,056 259,187 270,786 271,966 270,786 271,444 273,681 277,344 Profitability (%) Net Income ($000) 16,187 17,435 21,030 5,288 5,899 4,535 4,161 4,122 ROAA 0.72 0.86 1.09 1.12 1.22 0.92 0.85 0.81 ROAE 5.71 6.90 7.82 7.69 8.62 6.78 6.11 5.94 Net Interest Margin 3.64 3.19 3.45 3.44 3.52 3.25 3.31 3.34 Efficiency Ratio 61.39 73.30 72.02 71.39 68.90 70.47 72.43 68.25 Balance Sheet Ratios / Capital (%) Loans/ Deposits 80.65 80.23 91.26 91.47 91.26 88.98 89.23 95.19 Tangible Common Equity/ Tang Assets(1)(3) 11.44 12.94 13.87 14.23 13.87 13.48 13.40 13.40 Common Equity Tier 1 Capital Ratio NA NA NA NA NA 15.51 15.30 14.58 Tier 1 Risk Based Capital Ratio 20.28 20.28 19.70 20.05 19.70 18.10 17.84 16.97 Total Risk Based Capital Ratio 21.56 21.59 20.96 21.34 20.96 19.36 19.09 18.22 Tier 1 Leverage Ratio 15.01 14.86 16.45 16.86 16.45 15.75 16.12 15.84 Asset Quality (%)(2) NPLs/ Portfolio Loans 3.12 1.57 0.67 1.10 0.67 0.64 0.62 0.98 NCOs/ Avg Portfolio Loans 0.07 0.22 0.12 (0.21) 0.02 (0.20) (0.03) (0.09) Reserves/Portfolio Loans 3.47 2.89 2.03 2.27 2.03 1.91 1.82 1.73 Reserves/ NPLs 111.26 184.50 302.26 205.29 302.26 297.78 295.03 176.38 Per Share Data Tangible Book Value Per Share(1)(3) 12.41 12.97 14.02 13.80 14.02 14.17 14.29 14.49 Earnings Per Share 0.64 0.89 1.07 0.27 0.30 0.24 0.22 0.22 (1) Intangible assets defined as goodwill for purposes of these calculations. (2)NPLs defined as Non-Accrual loans + Loans 90+ Days Past Due, NPAs defined as NPLs + OREO. (3)This is a non-GAAP based financial measure. See Appendix for reconciliation to the most directly comparable GAAP based measure.
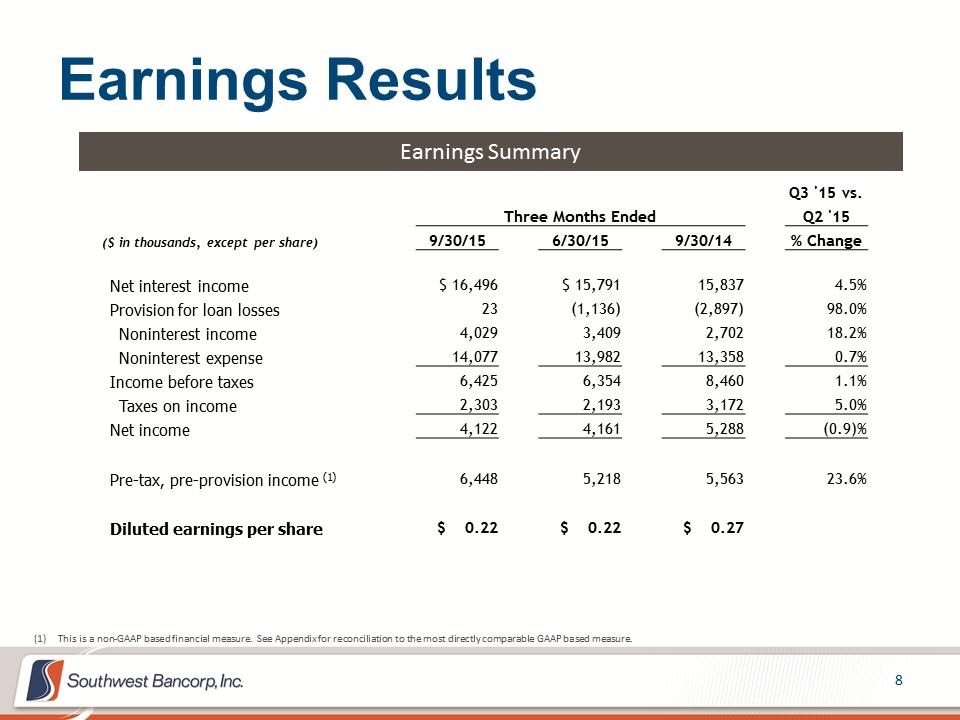 Earnings Results 8 Earnings Summary Q3 '15 vs. Three Months Ended Q2 '15 ($ in thousands, except per share) 9/30/15 6/30/15 9/30/14 % Change Net interest income $ 16,496 $ 15,791 15,837 4.5% Provision for loan losses 23 (1,136) (2,897) 98.0% Noninterest income 4,029 3,409 2,702 18.2% Noninterest expense 14,077 13,982 13,358 0.7% Income before taxes 6,425 6,354 8,460 1.1% Taxes on income 2,303 2,193 3,172 5.0% Net income 4,122 4,161 5,288 (0.9)% Pre-tax, pre-provision income (1) 6,448 5,218 5,563 23.6% Diluted earnings per share $ 0.22 $ 0.22 $ 0.27 (1)This is a non-GAAP based financial measure. See Appendix for reconciliation to the most directly comparable GAAP based measure.
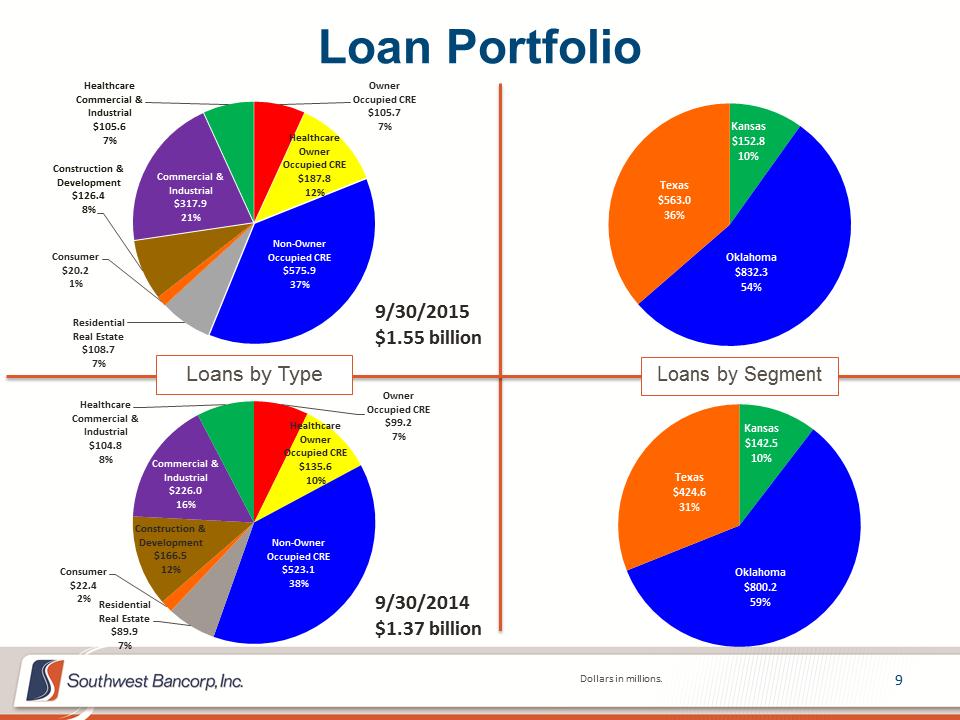 Owner Occupied CRE $105.7 7% Healthcare Owner Occupied CRE $187.8 12% Non-Owner Occupied CRE $575.9 37% Residential Real Estate $108.7 7% Consumer $20.2 1% Construction & Development $126.4 8% Commercial & Industrial $317.9 21% Healthcare Commercial & Industrial $105.6 7% Loan Portfolio 9 Dollars in millions. Loans by Type Loans by Segment Owner Occupied CRE $99.2 7% Healthcare Owner Occupied CRE $135.6 10% Non-Owner Occupied CRE $523.1 38% Residential Real Estate $89.9 7% Consumer $22.4 2% Construction & Development $166.5 12% Commercial & Industrial $226.0 16% Healthcare Commercial & Industrial $104.8 8% 9/30/2015 $1.55 billion 9/30/2014 $1.37 billion Kansas $152.8 10% Oklahoma $832.3 54% Texas $563.0 36% Kansas $142.5 10% Oklahoma $800.2 59% Texas $424.6 31%
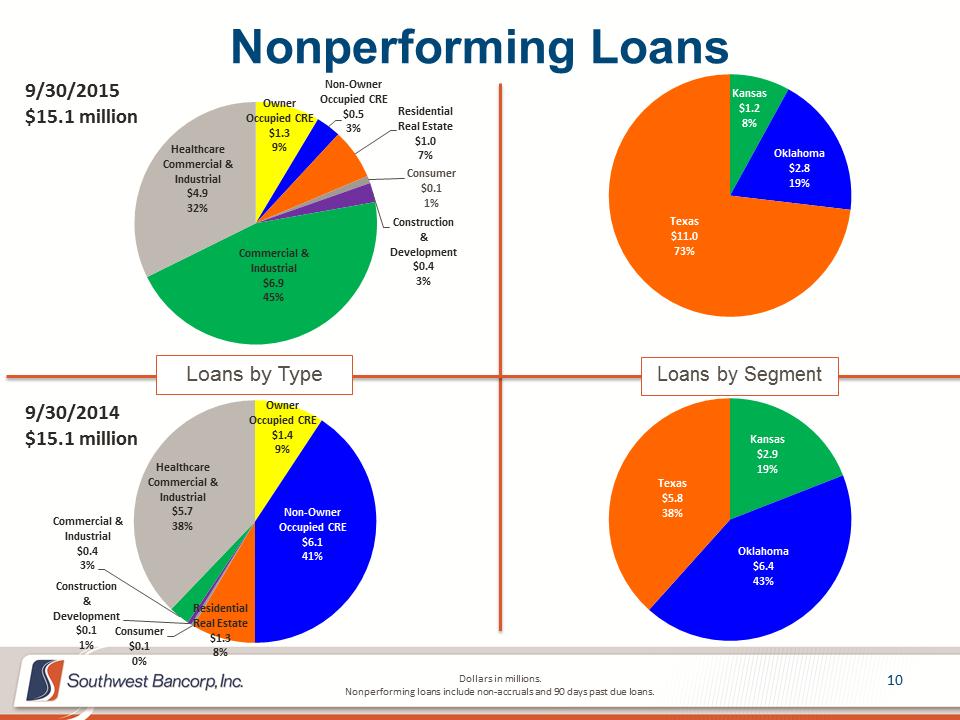 Owner Occupied CRE $1.3 9% Non-Owner Occupied CRE $0.5 3% Residential Real Estate $1.0 7% Consumer $0.1 1% Construction & Development $0.4 3% Commercial & Industrial $6.9 45% Healthcare Commercial & Industrial $4.9 32% Nonperforming Loans 10 Dollars in millions. Nonperforming loans include non-accruals and 90 days past due loans. Loans by Type Loans by Segment Owner Occupied CRE $1.4 9% Non-Owner Occupied CRE $6.1 41% Residential Real Estate $1.3 8% Consumer $0.1 0% Construction & Development $0.1 1% Commercial & Industrial $0.4 3% Healthcare Commercial & Industrial $5.7 38% 9/30/2015 $15.1 million 9/30/2014 $15.1 million Kansas $1.2 8% Oklahoma $2.8 19% Texas $11.0 73% Kansas $2.9 19% Oklahoma $6.4 43% Texas $5.8 38%
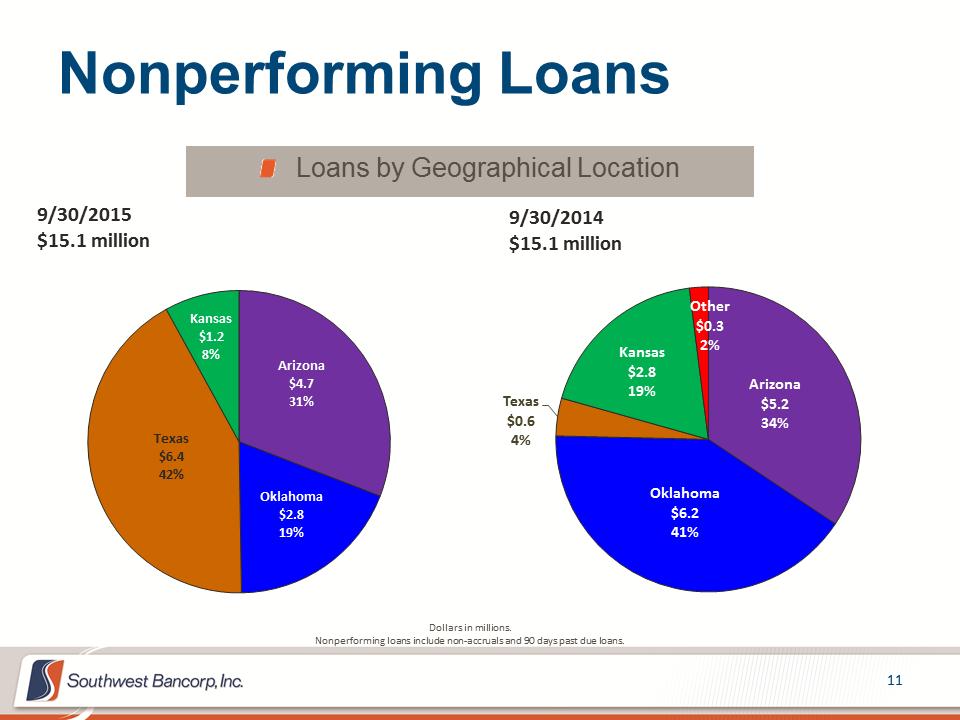 Nonperforming Loans Loans by Geographical Location Dollars in millions. Nonperforming loans include non-accruals and 90 days past due loans. Arizona $4.7 31% Oklahoma $2.8 19% Texas $6.4 42% Kansas $1.2 8% 11 Arizona $5.2 34% Oklahoma $6.2 41% Texas $0.6 4% Kansas $2.8 19% Other $0.3 2% 9/30/2015 $15.1 million 9/30/2014 $15.1 million
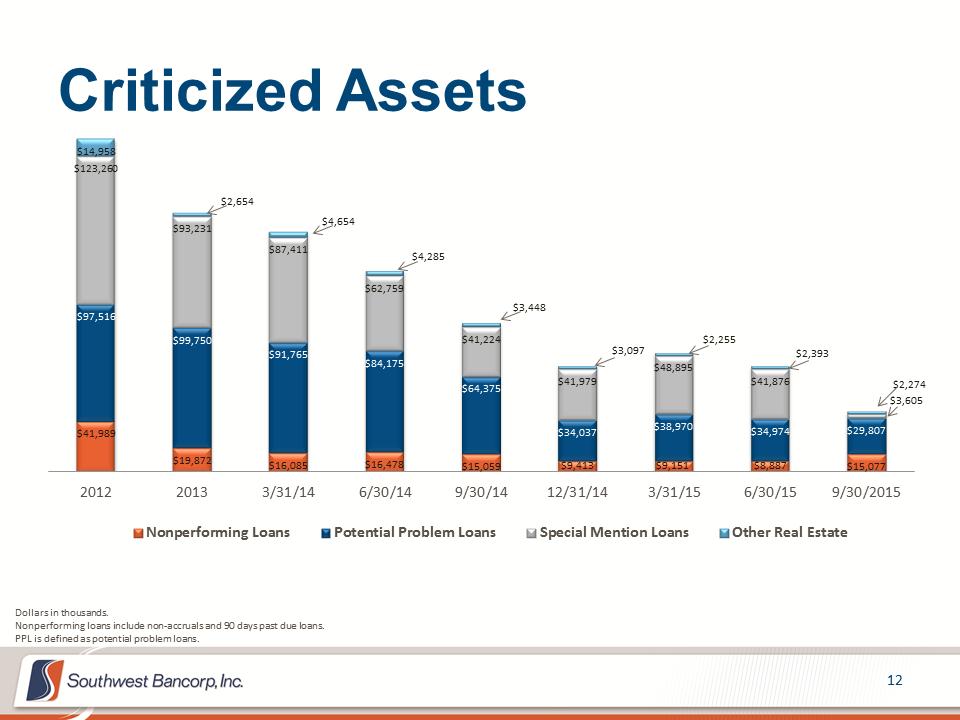 Criticized Assets 12 $41,989 $19,872 $16,085 $16,478 $15,059 $9,413 $9,151 $8,887 $15,077 $97,516 $99,750 $91,765 $84,175 $64,375 $34,037 $38,970 $34,974 $29,807 $123,260 $93,231 $87,411 $62,759 $41,224 $41,979 $48,895 $41,876 $3,605 $14,958 $2,654 $4,654 $4,285 $3,448 $3,097 $2,255 $2,393 $2,274 201220133/31/146/30/149/30/1412/31/143/31/156/30/159/30/2015Nonperforming LoansPotential Problem LoansSpecial Mention LoansOther Real EstateDollars in thousands. Nonperforming loans include non-accruals and 90 days past due loans. PPL is defined as potential problem loans.
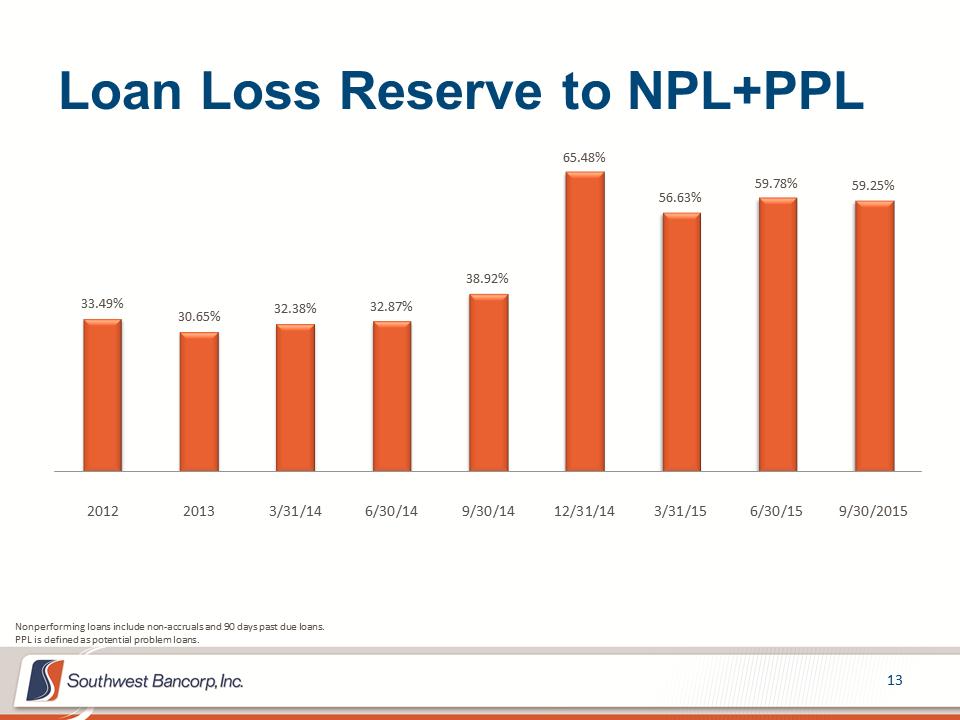 Loan Loss Reserve to NPL+PPL 13 33.49% 30.65% 32.38% 32.87% 38.92% 65.48% 56.63% 59.78% 59.25% 201220133/31/146/30/149/30/1412/31/143/31/156/30/159/30/2015Nonperforming loans include non-accruals and 90 days past due loans. PPL is defined as potential problem loans.
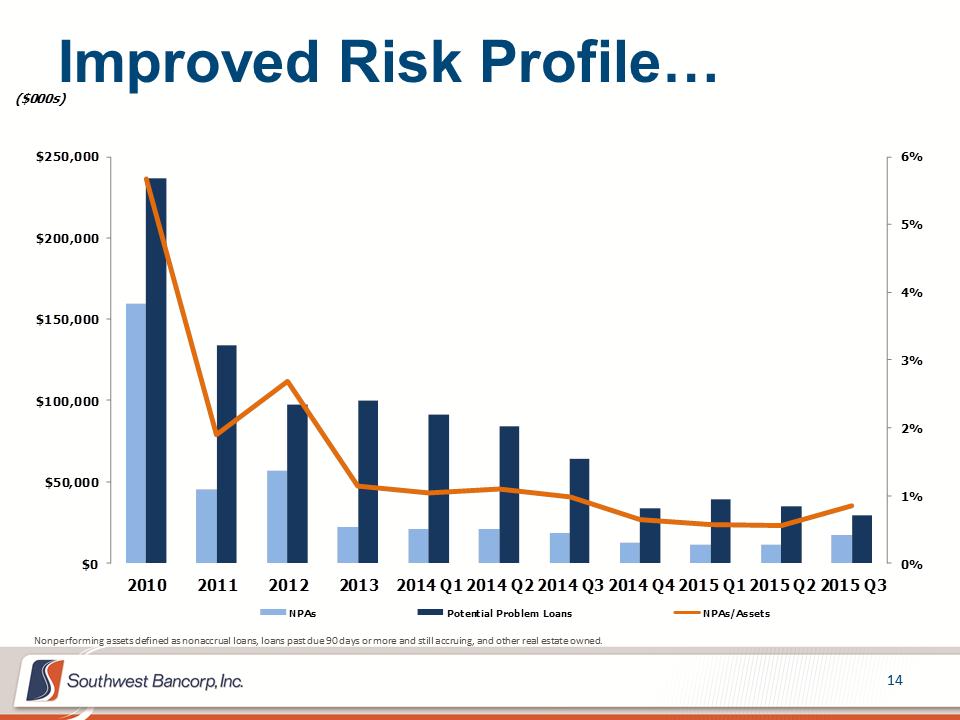 Improved Risk Profile… 14 Nonperforming assets defined as nonaccrual loans, loans past due 90 days or more and still accruing, and other real estate owned. 0%1%2%3%4%5%6%$0$50,000$100,000$150,000$200,000$250,00020102011201220132014 Q12014 Q22014 Q32014 Q42015 Q12015 Q22015 Q3($000s)NPAsPotential Problem LoansNPAs/Assets
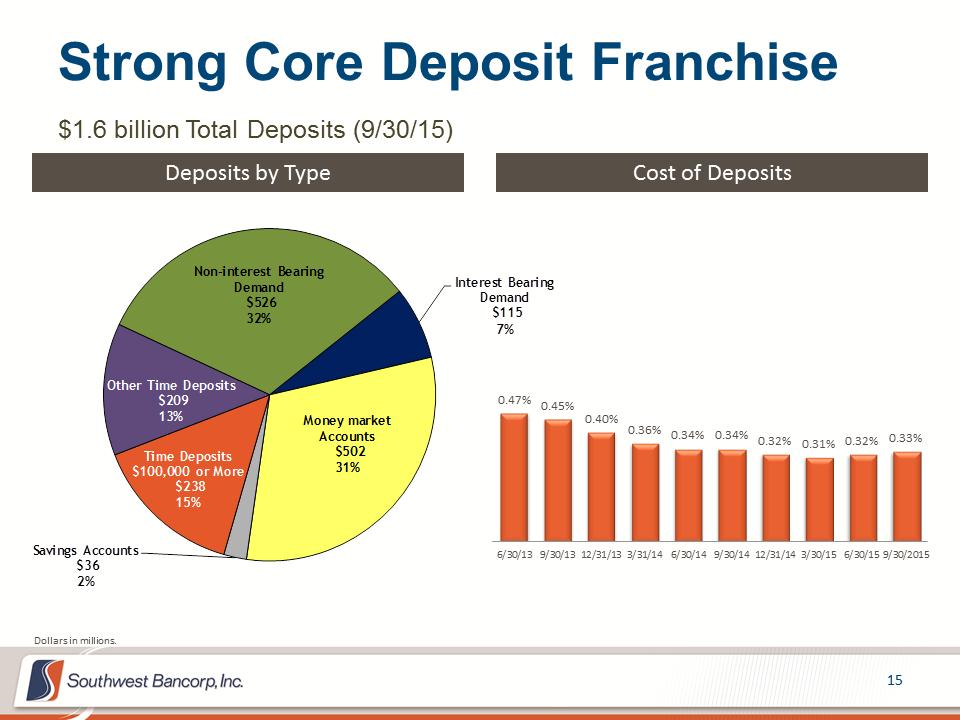 Strong Core Deposit Franchise 15 $1.6 billion Total Deposits (9/30/15) Deposits by Type Cost of Deposits 0.47% 0.45% 0.40% 0.36% 0.34% 0.34% 0.32% 0.31% 0.32% 0.33% 6/30/139/30/1312/31/133/31/146/30/149/30/1412/31/143/30/156/30/159/30/2015Non-interest Bearing Demand$526 32%Interest Bearing Demand$115 7%Money market Accounts$502 31%Savings Accounts$36 2%Time Deposits $100,000 or More$238 15%Other Time Deposits$209 13%Dollars in millions.
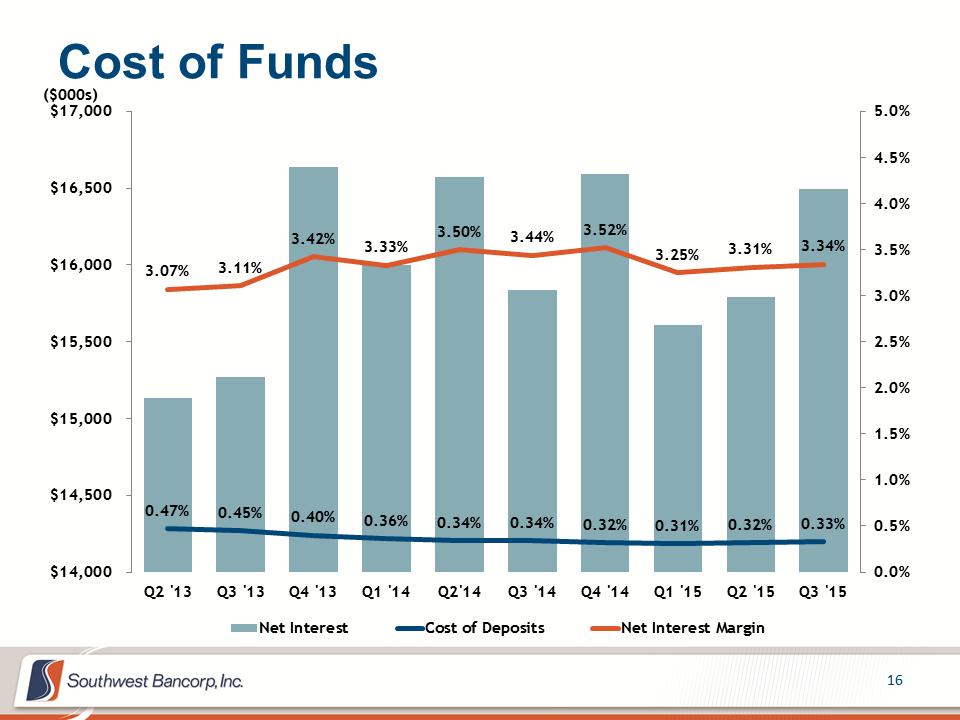 Cost of Funds 16 0.47% 0.45% 0.40% 0.36% 0.34% 0.34% 0.32% 0.31% 0.32% 0.33% 3.07% 3.11% 3.42% 3.33% 3.50% 3.44% 3.52% 3.25% 3.31% 3.34% 0.0%0.5%1.0%1.5%2.0%2.5%3.0%3.5%4.0%4.5%5.0% $14,000 $14,500 $15,000 $15,500 $16,000 $16,500 $17,000Q2 '13Q3 '13Q4 '13Q1 '14Q2'14Q3 '14Q4 '14Q1 '15Q2 '15Q3 '15($000s) Net InterestCost of DepositsNet Interest Margin
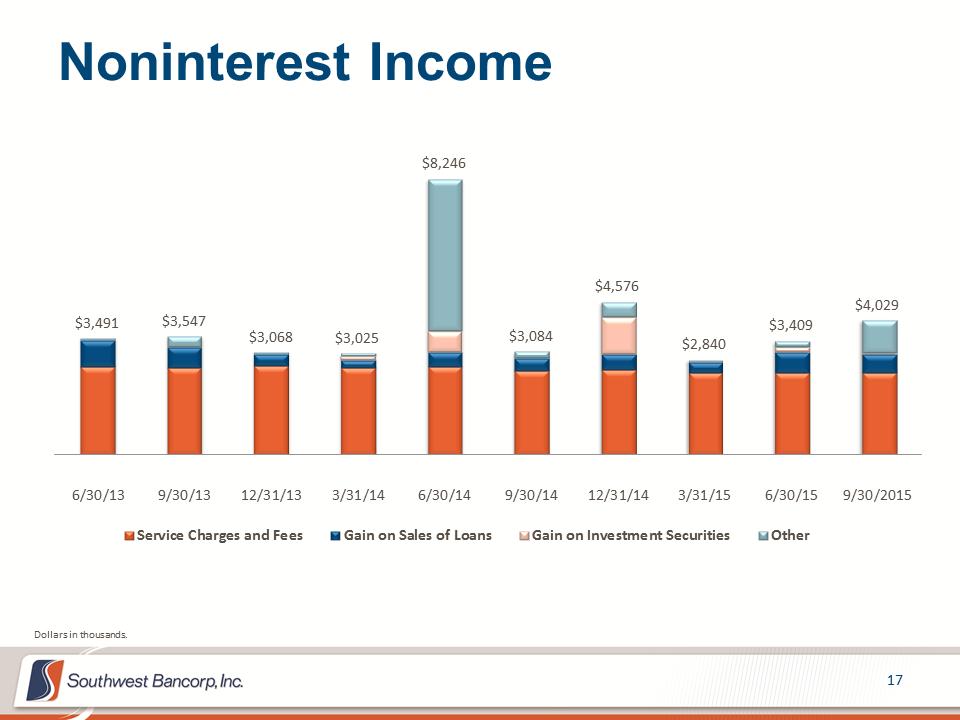 Noninterest Income 17 $3,491 $3,547 $3,068 $3,025 $8,246 $3,084 $4,576 $2,840 $3,409 $4,029 6/30/139/30/1312/31/133/31/146/30/149/30/1412/31/143/31/156/30/159/30/2015Service Charges and FeesGain on Sales of LoansGain on Investment SecuritiesOtherDollars in thousands.
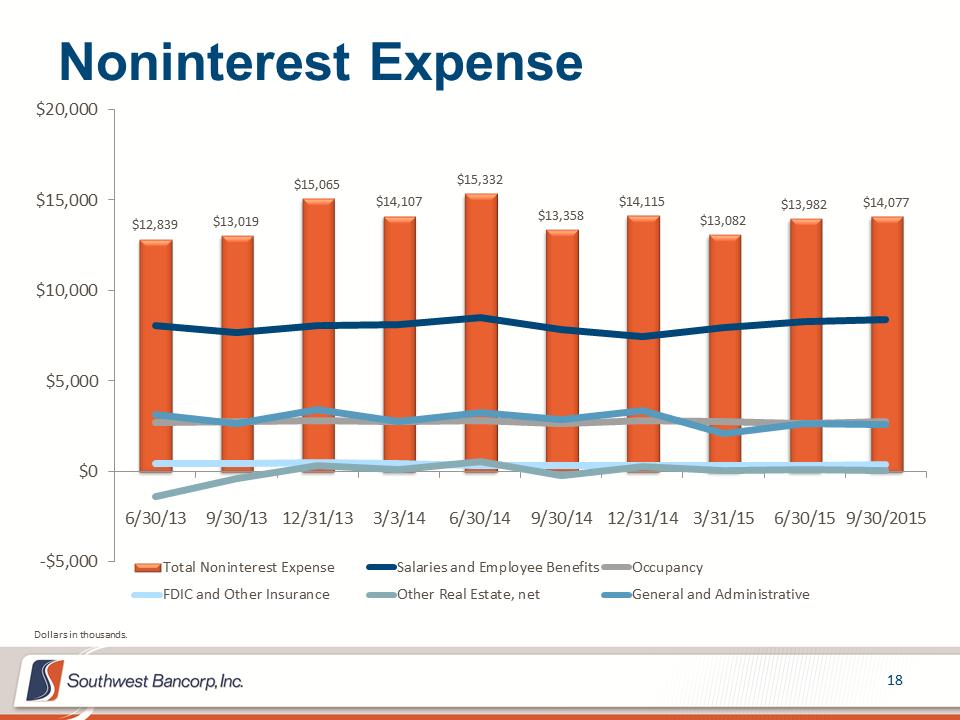 $12,839 $13,019 $15,065 $14,107 $15,332 $13,358 $14,115 $13,082 $13,982 $14,077 -$5,000$0$5,000$10,000$15,000$20,0006/30/139/30/1312/31/133/3/146/30/149/30/1412/31/143/31/156/30/159/30/2015Total Noninterest ExpenseSalaries and Employee BenefitsOccupancyFDIC and Other InsuranceOther Real Estate, netGeneral and AdministrativeNoninterest Expense 18 Dollars in thousands.
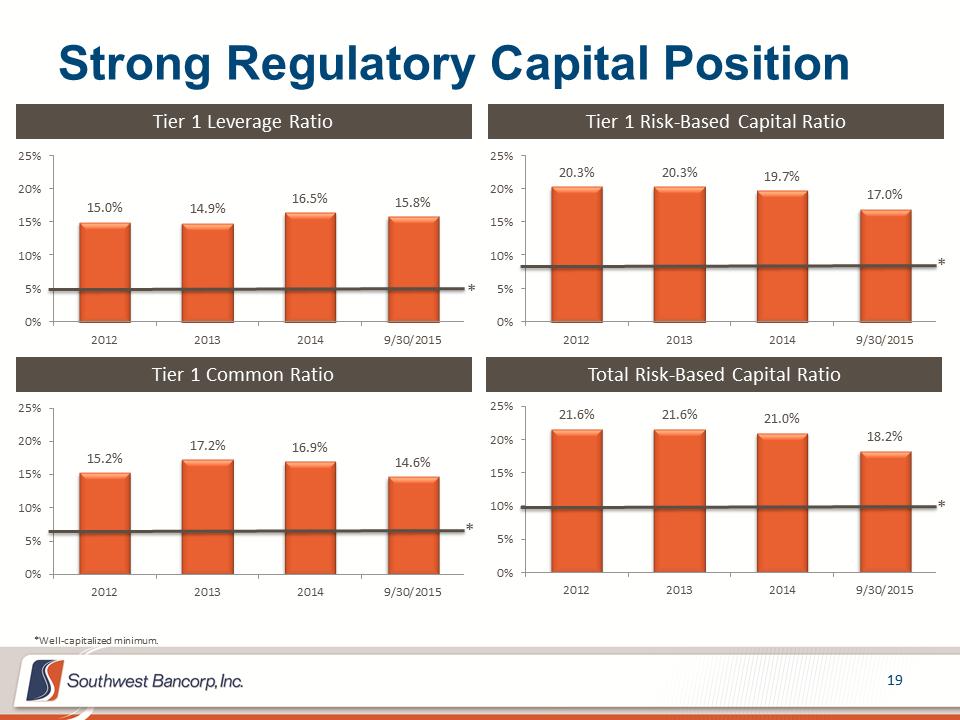 Strong Regulatory Capital Position 19 20.3% 20.3% 19.7% 17.0% 0%5%10%15%20%25%2012201320149/30/201515.0% 14.9% 16.5% 15.8% 0%5%10%15%20%25%2012201320149/30/2015Tier 1 Leverage Ratio Tier 1 Risk-Based Capital Ratio Total Risk-Based Capital Ratio Tier 1 Common Ratio 15.2% 17.2% 16.9% 14.6% 0%5%10%15%20%25%2012201320149/30/2015* * * * *Well-capitalized minimum. 21.6% 21.6% 21.0% 18.2% 0%5%10%15%20%25%2012201320149/30/2015
 2015 Priorities: Successfully closed and completed the acquisition and completed integration of First Commercial Bank Aggressively seek ways to efficiently and profitably deploy our excess capital, including strategic acquisitions, selective de-novo branching and product investments Identify and acquire talented individuals and teams that will enhance our presence and profitability in select business segments and markets Continue to improve credit quality and balance sheet strength Maintain high credit standards while accelerating loan growth focused in areas of expertise, i.e. real estate, healthcare, commercial and energy Improve internal operating efficiency while providing superior customer service. This includes investment in core operating systems and people Strengthen and invest in business lines that produce non-interest income and effectively scale them across our geographic footprint Drive a culture that produces consistent, conservative, and sustainable revenue and earnings growth 20
 ADDITIONAL FINANCIAL INFORMATION 21
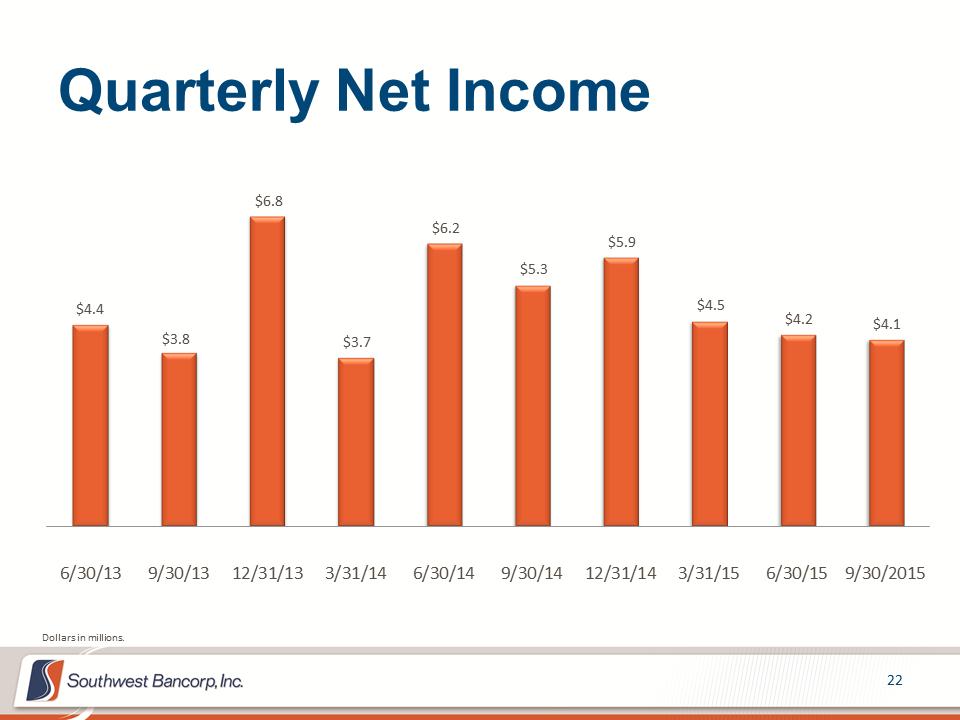 Quarterly Net Income 22 $4.4 $3.8 $6.8 $3.7 $6.2 $5.3 $5.9 $4.5 $4.2 $4.1 6/30/139/30/1312/31/133/31/146/30/149/30/1412/31/143/31/156/30/159/30/2015Dollars in millions.
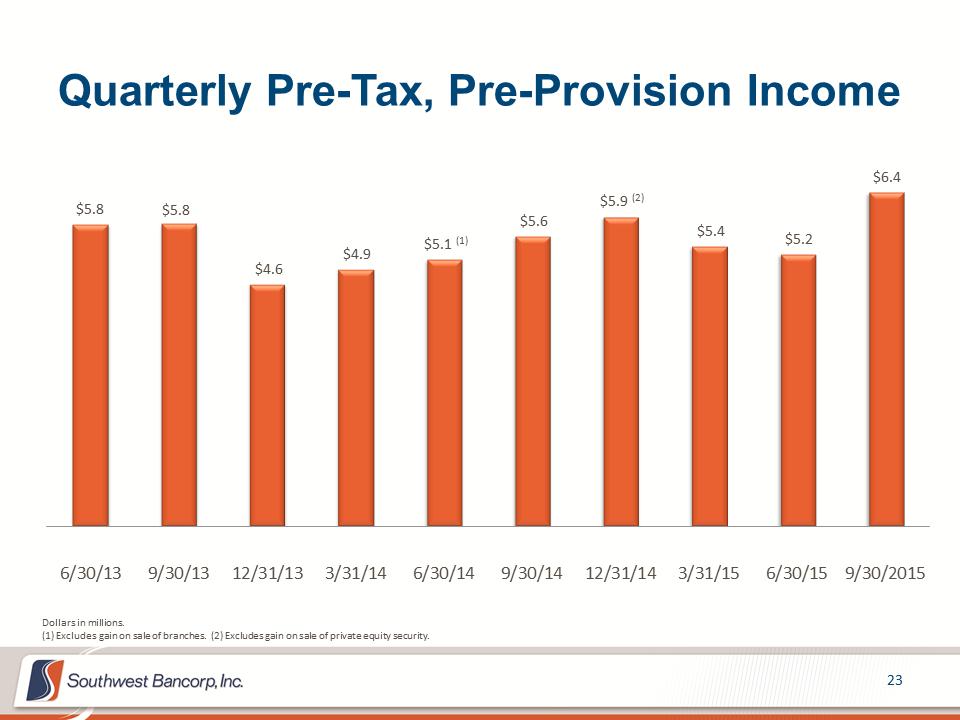 Quarterly Pre-Tax, Pre-Provision Income 23 $5.8 $5.8 $4.6 $4.9 $5.1 (1) $5.6 $5.9 (2) $5.4 $5.2 $6.4 6/30/139/30/1312/31/133/31/146/30/149/30/1412/31/143/31/156/30/159/30/2015Dollars in millions. (1) Excludes gain on sale of branches. (2) Excludes gain on sale of private equity security.
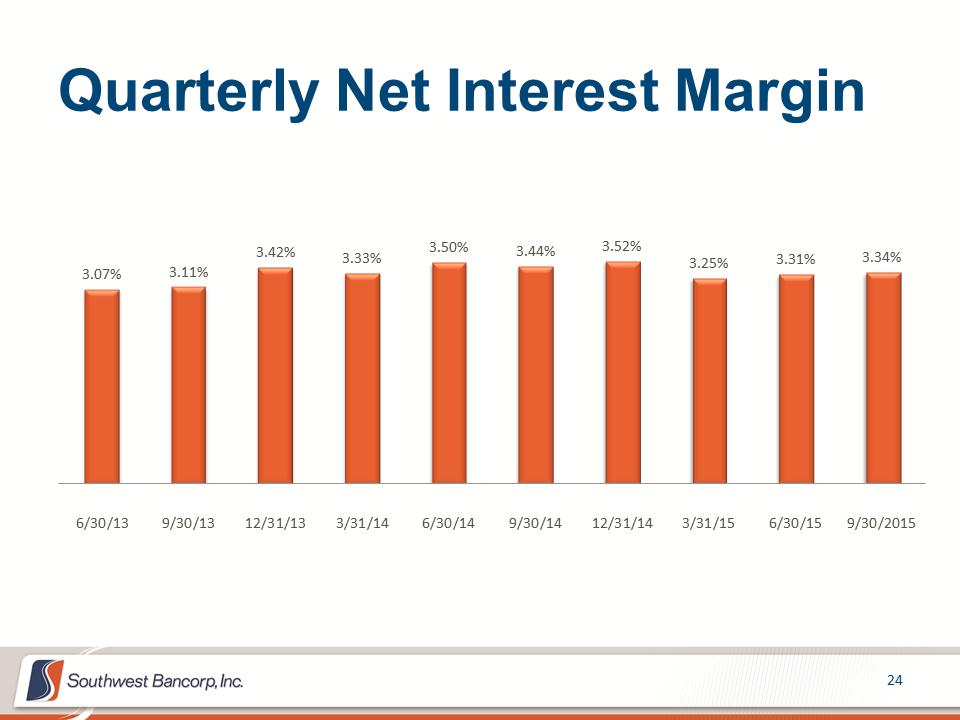 Quarterly Net Interest Margin 24 3.07% 3.11% 3.42% 3.33% 3.50% 3.44% 3.52% 3.25% 3.31% 3.34% 6/30/139/30/1312/31/133/31/146/30/149/30/1412/31/143/31/156/30/159/30/2015
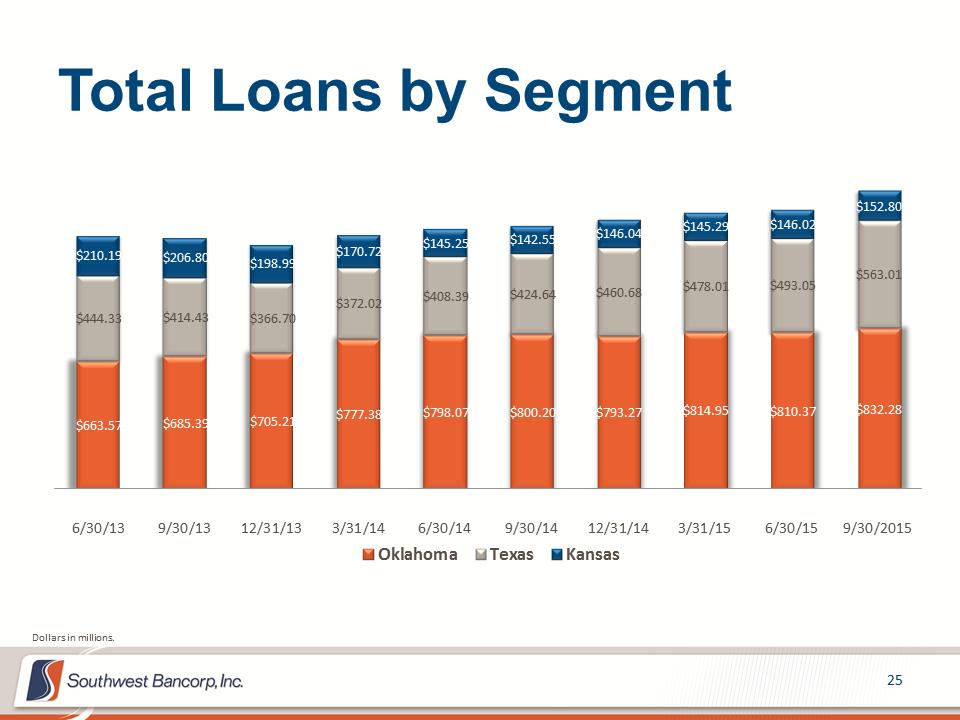 Total Loans by Segment 25 $663.57 $685.39 $705.21 $777.38 $798.07 $800.20 $793.27 $814.95 $810.37 $832.28 $444.33 $414.43 $366.70 $372.02 $408.39 $424.64 $460.68 $478.01 $493.05 $563.01 $210.19 $206.80 $198.99 $170.72 $145.25 $142.55 $146.04 $145.29 $146.02 $152.80 6/30/139/30/1312/31/133/31/146/30/149/30/1412/31/143/31/156/30/159/30/2015OklahomaTexasKansasDollars in millions.
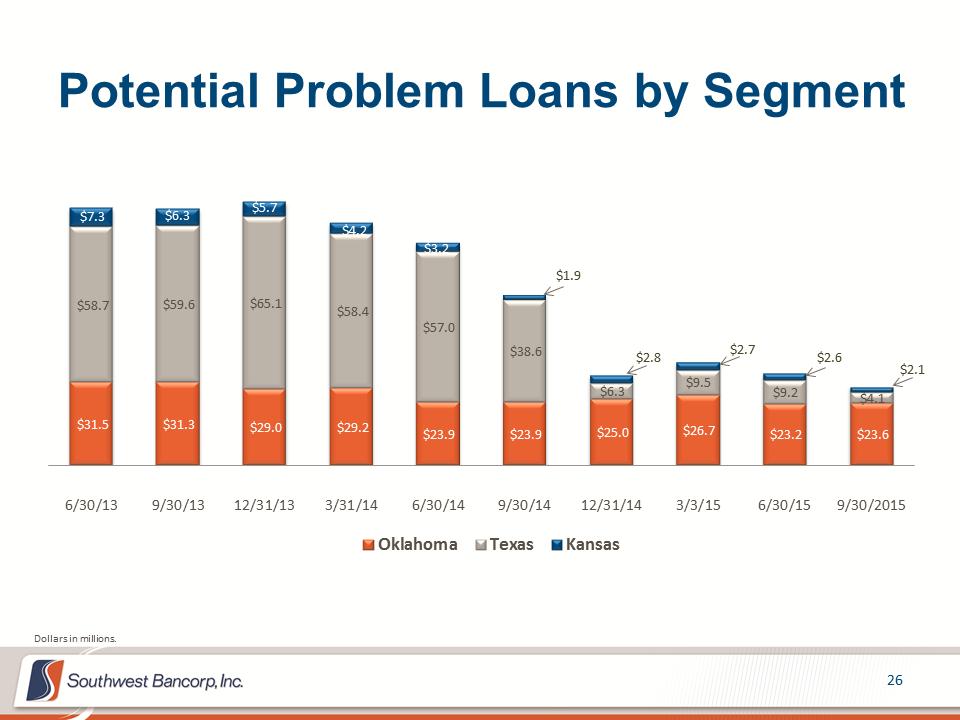 Potential Problem Loans by Segment 26 $31.5 $31.3 $29.0 $29.2 $23.9 $23.9 $25.0 $26.7 $23.2 $23.6 $58.7 $59.6 $65.1 $58.4 $57.0 $38.6 $6.3 $9.5 $9.2 $4.1 $7.3 $6.3 $5.7 $4.2 $3.2 $1.9 $2.8 $2.7 $2.6 $2.1 6/30/139/30/1312/31/133/31/146/30/149/30/1412/31/143/3/156/30/159/30/2015OklahomaTexasKansasDollars in millions.
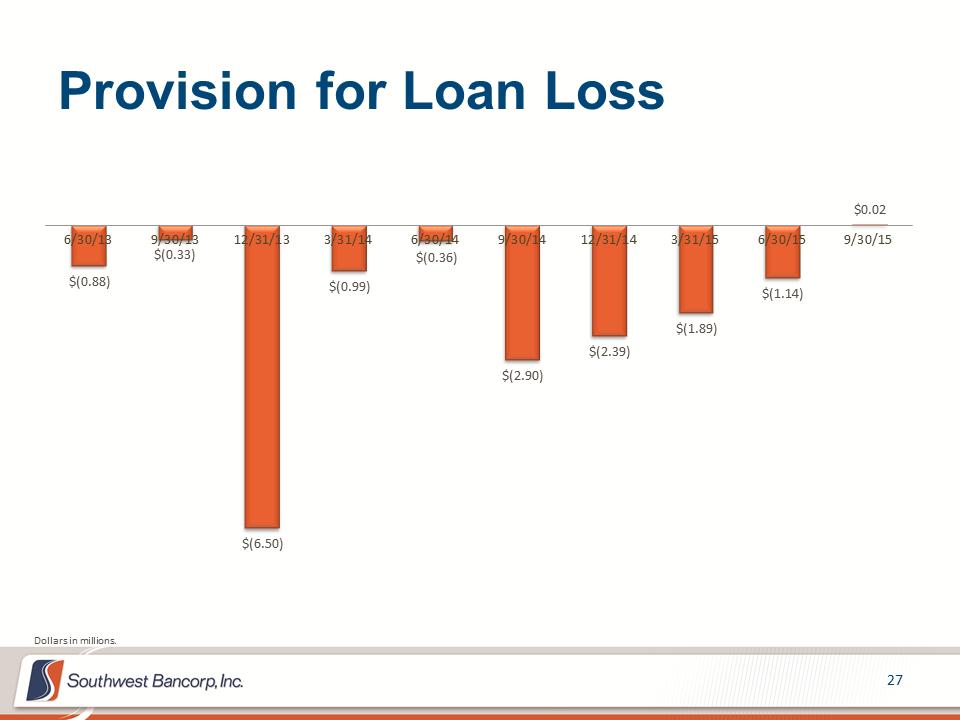 Provision for Loan Loss 27 $(0.88) $(0.33) $(6.50) $(0.99) $(0.36) $(2.90) $(2.39) $(1.89) $(1.14) $0.02 6/30/139/30/1312/31/133/31/146/30/149/30/1412/31/143/31/156/30/159/30/15Dollars in millions.
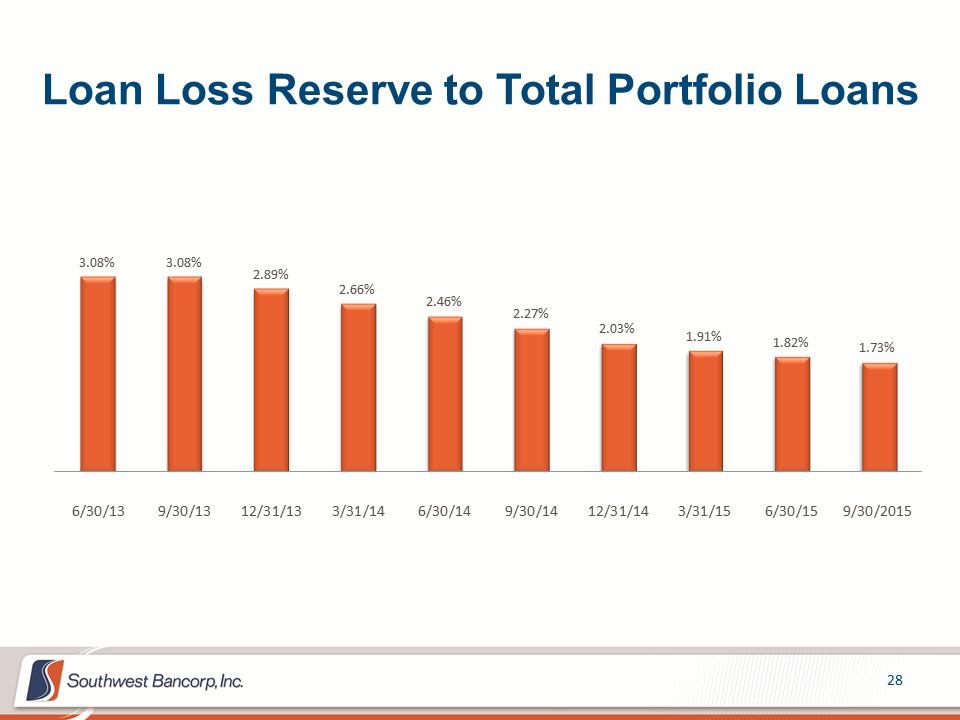 Loan Loss Reserve to Total Portfolio Loans 28 3.08% 3.08% 2.89% 2.66% 2.46% 2.27% 2.03% 1.91% 1.82% 1.73% 6/30/139/30/1312/31/133/31/146/30/149/30/1412/31/143/31/156/30/159/30/2015
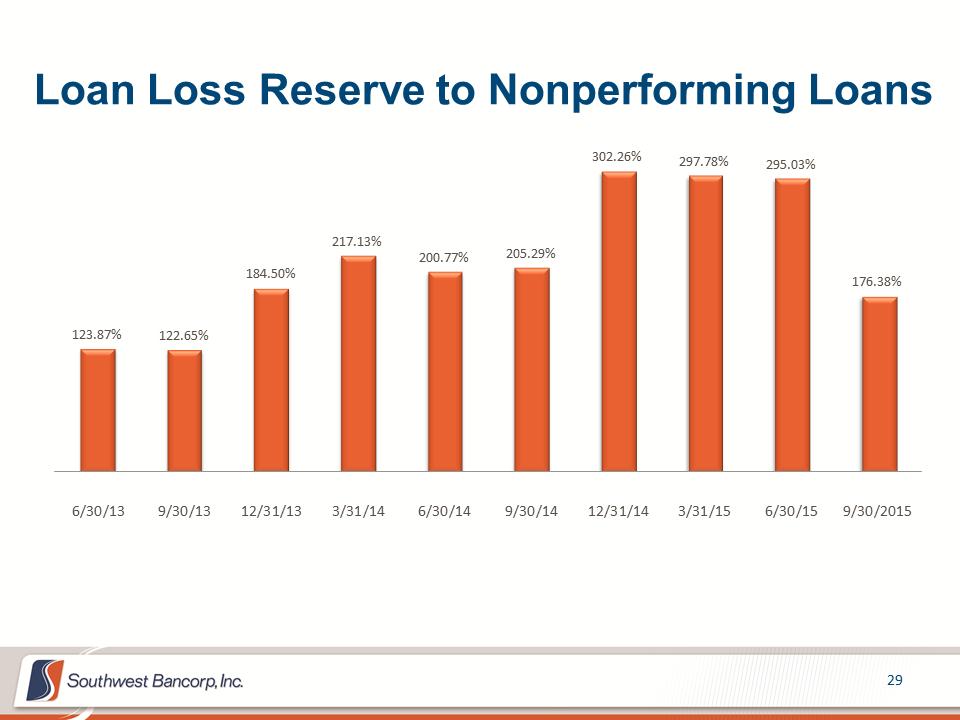 Loan Loss Reserve to Nonperforming Loans 29 123.87% 122.65% 184.50% 217.13% 200.77% 205.29% 302.26% 297.78% 295.03% 176.38% 6/30/139/30/1312/31/133/31/146/30/149/30/1412/31/143/31/156/30/159/30/2015
 APPENDIX 30
 The subsequent tables present non-GAAP reconciliations of the following calculations: –Tangible Common Equity (TCE) to Tangible Assets (TA) ratio –Tangible Book Value per Share –Pre-tax, Pre-provision Income 31
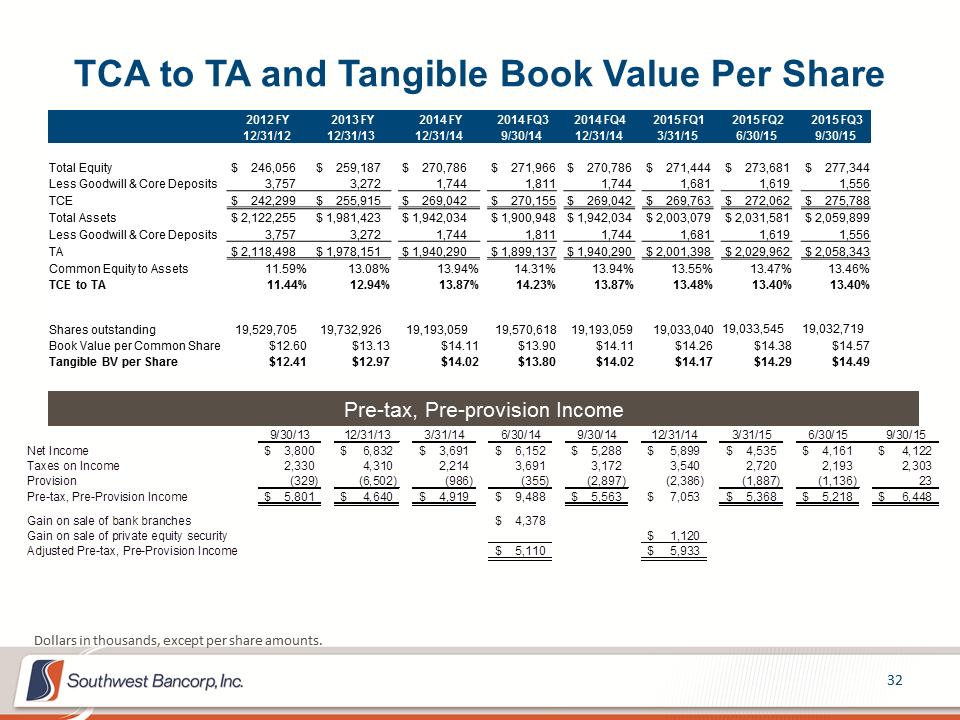 TCA to TA and Tangible Book Value Per Share 32 Dollars in thousands, except per share amounts. Pre-tax, Pre-provision Income 2012 FY 2013 FY 2014 FY 2014 FQ3 2014 FQ4 2015 FQ1 2015 FQ2 2015 FQ3 12/31/12 12/31/13 12/31/14 9/30/14 12/31/14 3/31/15 6/30/15 9/30/15 Total Equity $ 246,056 $ 259,187 $ 270,786 $ 271,966 $ 270,786 $ 271,444 $ 273,681 $ 277,344 Less Goodwill & Core Deposits 3,757 3,272 1,744 1,811 1,744 1,681 1,619 1,556 TCE $ 242,299 $ 255,915 $ 269,042 $ 270,155 $ 269,042 $ 269,763 $ 272,062 $ 275,788 Total Assets $ 2,122,255 $ 1,981,423 $ 1,942,034 $ 1,900,948 $ 1,942,034 $ 2,003,079 $ 2,031,581 $ 2,059,899 Less Goodwill & Core Deposits 3,757 3,272 1,744 1,811 1,744 1,681 1,619 1,556 TA $ 2,118,498 $ 1,978,151 $ 1,940,290 $ 1,899,137 $ 1,940,290 $ 2,001,398 $ 2,029,962 $ 2,058,343 Common Equity to Assets 11.59% 13.08% 13.94% 14.31% 13.94% 13.55% 13.47% 13.46% TCE to TA 11.44% 12.94% 13.87% 14.23% 13.87% 13.48% 13.40% 13.40% Shares outstanding 19,529,705 19,732,926 19,193,059 19,570,618 19,193,059 19,033,040 19,033,545 19,032,719 Book Value per Common Share $12.60 $13.13 $14.11 $13.90 $14.11 $14.26 $14.38 $14.57 Tangible BV per Share $12.41 $12.97 $14.02 $13.80 $14.02 $14.17 $14.29 $14.49 9/30/1312/31/133/31/146/30/149/30/1412/31/143/31/156/30/159/30/15Net Income3,800$ 6,832$ 3,691$ 6,152$ 5,288$ 5,899$ 4,535$ 4,161$ 4,122$ Taxes on Income2,330 4,310 2,214 3,691 3,172 3,540 2,720 2,193 2,303 Provision(329) (6,502) (986) (355) (2,897) (2,386) (1,887) (1,136) 23 Pre-tax, Pre-Provision Income5,801$ 4,640$ 4,919$ 9,488$ 5,563$ 7,053$ 5,368$ 5,218$ 6,448$ Gain on sale of bank branches4,378$ Gain on sale of private equity security1,120$ Adjusted Pre-tax, Pre-Provision Income5,110$ 5,933$
2015 Third Quarter Earnings Presentation October 21, 2015 NASDAQ: OKSB