Attached files
| file | filename |
|---|---|
| 8-K - 8-K - United Financial Bancorp, Inc. | a8-k20150930.htm |
| EX-99.1 - EXHIBIT 99.1 - United Financial Bancorp, Inc. | ex-99120150930.htm |
Third Quarter 2015 EarningsNASDAQ Global Select Market: UBNK Create Your Balance

2NASDAQ: UBNK This Presentation contains forward-looking statements that are within the meaning of the Private Securities Litigation Reform Act of 1995. Such statements are based upon the current beliefs and expectations of our management and are subject to significant risks and uncertainties. These risks and uncertainties could cause our results to differ materially from those set forth in such forward-looking statements. Forward-looking statements can be identified by the fact that they do not relate strictly to historical or current facts. Words such as “believes,” “anticipates,” “expects,” “intends,” “plans,” “estimates,” “targeted” and similar expressions, and future or conditional verbs, such as “will,” “would,” “should,” “could” or “may” are intended to identify forward-looking statements but are not the only means to identify these statements. Forward-looking statements involve risks and uncertainties. Actual conditions, events or results may differ materially from those contemplated by a forward-looking statement. Factors that could cause this difference — many of which are beyond our control — include without limitation the following: Any forward-looking statements made by or on behalf of us in this Presentation speak only as of the date of this Presentation. We do not undertake to update forward-looking statements to reflect the impact of circumstances or events that arise after the date the forward-looking statement was made. The reader should; however, consult any further disclosures of a forward-looking nature we may make in future filings. With regard to presentations compared to peer institutions, the peer companies include: BHLB, BNCL, BPFH, BRKL, CBU, CUBI, DCOM, EGBN, FCF, FFIC, INDB, KRNY, NBTB, NPBC, NWBI, PFS, SASR, STBA, TMP, TRST, WSFS Data for peers is sourced from SNL Financial LLC. NON-GAAP FINANCIAL MEASURES This presentation references non-GAAP financial measures incorporating tangible equity and related measures, and operating earnings excluding non-recurring costs. These measures are commonly used by investors in evaluating financial condition. GAAP earnings are lower than core earnings primarily due to non- recurring conversion, balance sheet restructuring and cost cutting initiative related expenses. The efficiency ratio represents the ratio of non-interest expenses to the sum of net interest income before provision for loan losses and non-interest income, exclusive of net gain (loss) on limited partnership investments. The pre-provision net revenue to average assets ratio represents the ratio of net interest income, on a fully tax-equivalent basis, fees and other noninterest income, net of non-credit-related expenses as a percent of total average assets. The pre-provision net revenue to average equity ratio represents the ratio of net interest income, on a fully tax-equivalent basis, fees and other noninterest income, net of non-credit-related expenses as a percent of total average equity. Reconciliations are in earnings releases at www.unitedfinancialinc.com. Forward Looking Statements
3NASDAQ: UBNK Corporate Contacts William H. W. Crawford, IV Chief Executive Officer Eric R. Newell, CFA Executive Vice President, Chief Financial Officer Investor Information: Marliese L. Shaw Executive Vice President, Corporate Secretary/Investor Relations Officer 860-291-3622 or mshaw@bankatunited.com
4NASDAQ: UBNK Table of Contents Page Quarter Highlights 5 Peer Group 6 Mortgage Banking 8 Pipelines 9 Balance Sheet 10 Asset Quality 11 Net Interest Income Simulation 13 Appendix 14
5NASDAQ: UBNK Quarter Highlights • Third Quarter net income of $13.4 million, or $0.27 per diluted share • Tangible book value per share increased to $10.06 from $9.87 in the linked quarter • ROA of 0.93% for the third quarter • ROE of 8.68% for the third quarter • ROTCE of 11.08% for the third quarter • Non-Interest Expense/Average Assets (NIE/AA) of 2.22% • Efficiency ratio of 61% Loan Production Highlights • 13% annualized total loan growth • 16% annualized commercial loan growth compared to the linked quarter • Three consecutive quarters of strong mortgage banking activity income
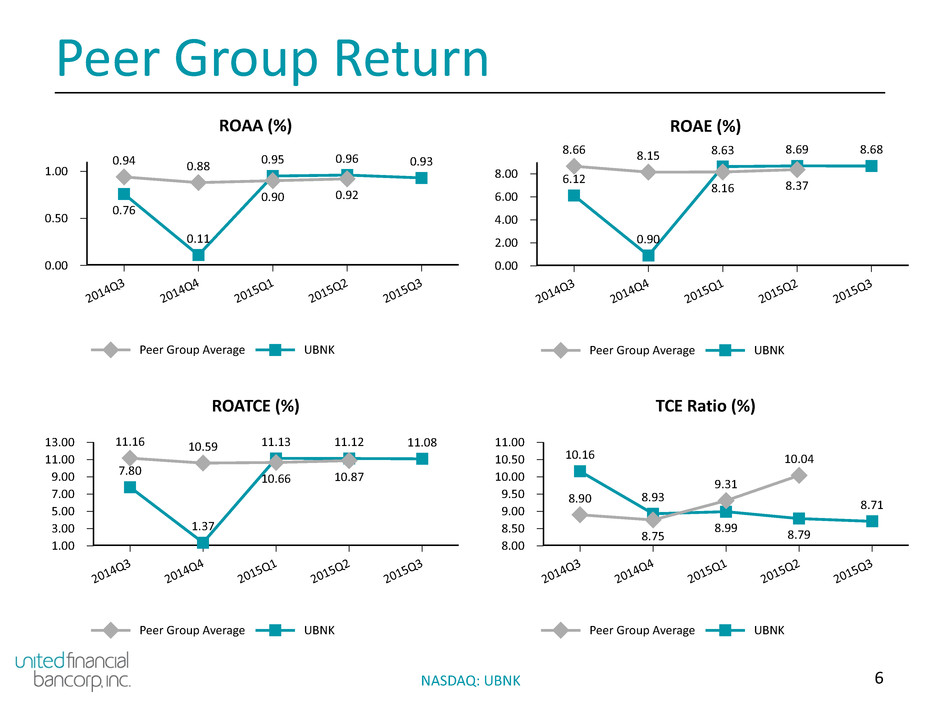
6NASDAQ: UBNK Peer Group Return Peer Group Average UBNK ROAA (%) 1.00 0.50 0.00 201 4Q3 201 4Q4 201 5Q1 201 5Q2 201 5Q3 0.94 0.88 0.90 0.92 0.76 0.11 0.95 0.96 0.93 Peer Group Average UBNK ROAE (%) 8.00 6.00 4.00 2.00 0.00 201 4Q3 201 4Q4 201 5Q1 201 5Q2 201 5Q3 8.66 8.15 8.16 8.37 6.12 0.90 8.63 8.69 8.68 Peer Group Average UBNK ROATCE (%) 13.00 11.00 9.00 7.00 5.00 3.00 1.00 201 4Q3 201 4Q4 201 5Q1 201 5Q2 201 5Q3 11.16 10.59 10.66 10.877.80 1.37 11.13 11.12 11.08 Peer Group Average UBNK TCE Ratio (%) 11.00 10.50 10.00 9.50 9.00 8.50 8.00 201 4Q3 201 4Q4 201 5Q1 201 5Q2 201 5Q3 8.90 8.75 9.31 10.0410.16 8.93 8.99 8.79 8.71
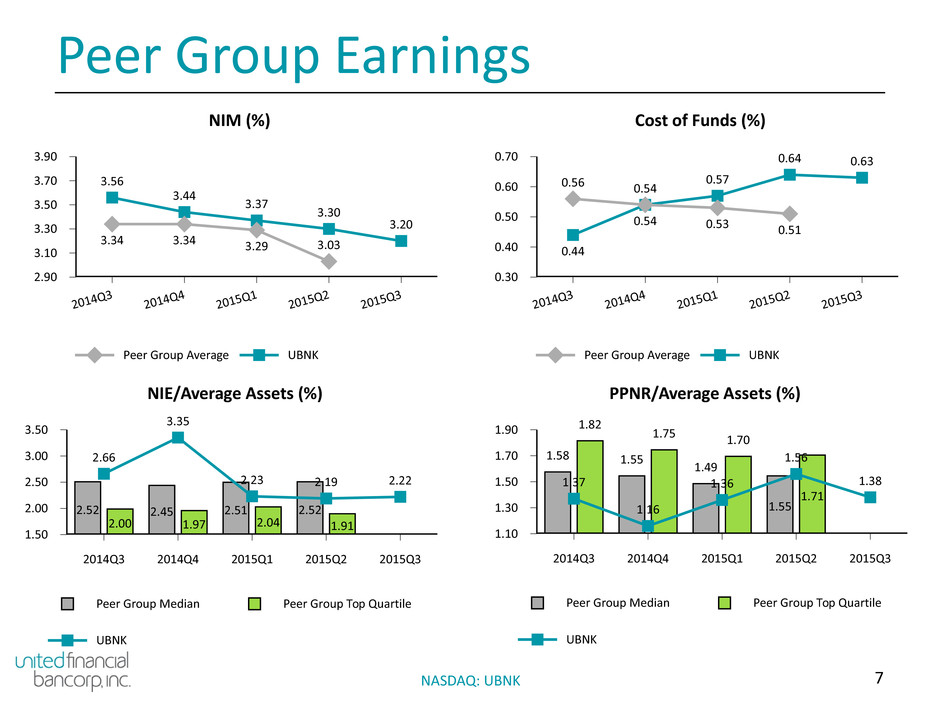
7NASDAQ: UBNK Peer Group Earnings Peer Group Average UBNK NIM (%) 3.90 3.70 3.50 3.30 3.10 2.90 2014Q 3 2014Q 4 2015Q 1 2015Q 2 2015Q 3 3.34 3.34 3.29 3.03 3.56 3.44 3.37 3.30 3.20 Peer Group Average UBNK Cost of Funds (%) 0.70 0.60 0.50 0.40 0.30 2014Q 3 2014Q 4 2015Q 1 2015Q 2 2015Q 3 0.56 0.54 0.53 0.51 0.44 0.54 0.57 0.64 0.63 Peer Group Median Peer Group Top Quartile UBNK NIE/Average Assets (%) 3.50 3.00 2.50 2.00 1.50 2014Q3 2014Q4 2015Q1 2015Q2 2015Q3 2.52 2.45 2.51 2.52 2.00 1.97 2.04 1.91 2.66 3.35 2.23 2.19 2.22 Peer Group Median Peer Group Top Quartile UBNK PPNR/Average Assets (%) 1.90 1.70 1.50 1.30 1.10 2014Q3 2014Q4 2015Q1 2015Q2 2015Q3 1.58 1.55 1.49 1.55 1.82 1.75 1.70 1.71 1.37 1.16 1.36 1.56 1.38
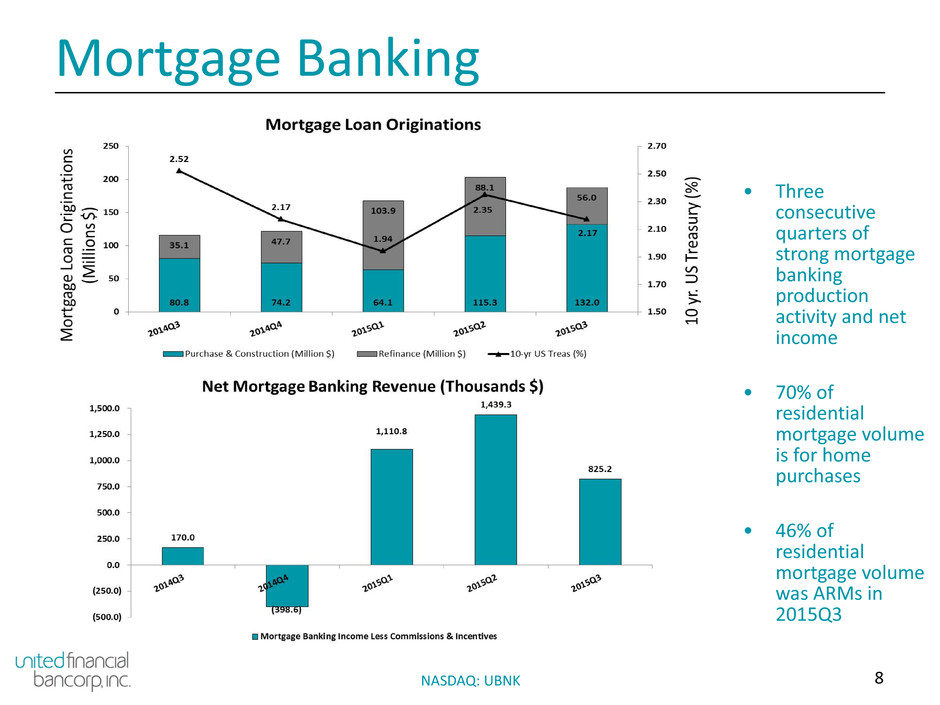
8NASDAQ: UBNK Mortgage Banking • Three consecutive quarters of strong mortgage banking production activity and net income • 70% of residential mortgage volume is for home purchases • 46% of residential mortgage volume was ARMs in 2015Q3
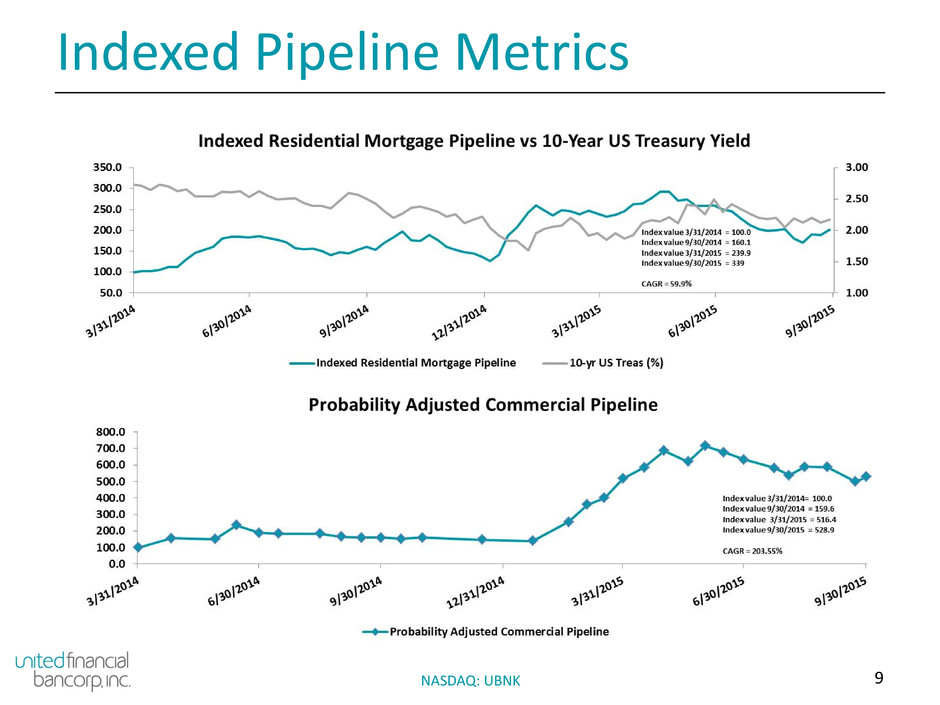
9NASDAQ: UBNK Indexed Pipeline Metrics
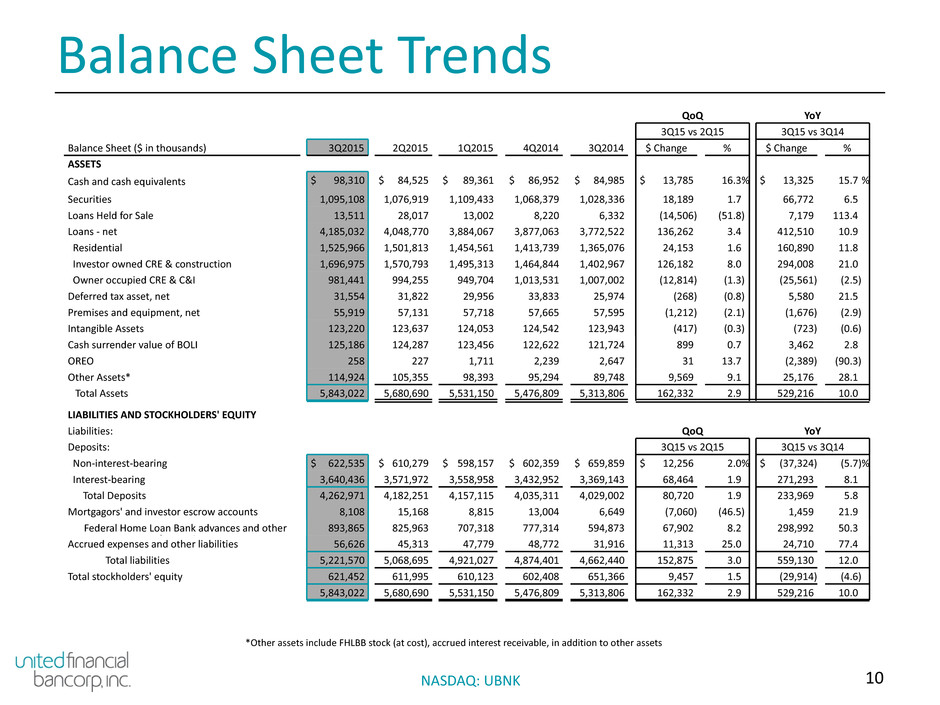
10NASDAQ: UBNK Balance Sheet Trends QoQ YoY 3Q15 vs 2Q15 3Q15 vs 3Q14 Balance Sheet ($ in thousands) 3Q2015 2Q2015 1Q2015 4Q2014 3Q2014 $ Change % Change $ Change % ChangeASSETS Cash and cash equivalents $ 98,310 $ 84,525 $ 89,361 $ 86,952 $ 84,985 $ 13,785 16.3% $ 13,325 15.7 % Securities 1,095,108 1,076,919 1,109,433 1,068,379 1,028,336 18,189 1.7 66,772 6.5 Loans Held for Sale 13,511 28,017 13,002 8,220 6,332 (14,506) (51.8) 7,179 113.4 Loans - net 4,185,032 4,048,770 3,884,067 3,877,063 3,772,522 136,262 3.4 412,510 10.9 Residential 1,525,966 1,501,813 1,454,561 1,413,739 1,365,076 24,153 1.6 160,890 11.8 Investor owned CRE & construction 1,696,975 1,570,793 1,495,313 1,464,844 1,402,967 126,182 8.0 294,008 21.0 Owner occupied CRE & C&I 981,441 994,255 949,704 1,013,531 1,007,002 (12,814) (1.3) (25,561) (2.5) Deferred tax asset, net 31,554 31,822 29,956 33,833 25,974 (268) (0.8) 5,580 21.5 Premises and equipment, net 55,919 57,131 57,718 57,665 57,595 (1,212) (2.1) (1,676) (2.9) Intangible Assets 123,220 123,637 124,053 124,542 123,943 (417) (0.3) (723) (0.6) Cash surrender value of BOLI 125,186 124,287 123,456 122,622 121,724 899 0.7 3,462 2.8 OREO 258 227 1,711 2,239 2,647 31 13.7 (2,389) (90.3) Other Assets* 114,924 105,355 98,393 95,294 89,748 9,569 9.1 25,176 28.1 Total Assets 5,843,022 5,680,690 5,531,150 5,476,809 5,313,806 162,332 2.9 529,216 10.0 LIABILITIES AND STOCKHOLDERS' EQUITY Liabilities: QoQ YoY Deposits: 3Q15 vs 2Q15 3Q15 vs 3Q14 Non-interest-bearing $ 622,535 $ 610,279 $ 598,157 $ 602,359 $ 659,859 $ 12,256 2.0% $ (37,324) (5.7)% Interest-bearing 3,640,436 3,571,972 3,558,958 3,432,952 3,369,143 68,464 1.9 271,293 8.1 Total Deposits 4,262,971 4,182,251 4,157,115 4,035,311 4,029,002 80,720 1.9 233,969 5.8 Mortgagors' and investor escrow accounts 8,108 15,168 8,815 13,004 6,649 (7,060) (46.5) 1,459 21.9 Federal Home Loan Bank advances and other borrowings 893,865 825,963 707,318 777,314 594,873 67,902 8.2 298,992 50.3 Accrued expenses and other liabilities 56,626 45,313 47,779 48,772 31,916 11,313 25.0 24,710 77.4 Total liabilities 5,221,570 5,068,695 4,921,027 4,874,401 4,662,440 152,875 3.0 559,130 12.0 Total stockholders' equity 621,452 611,995 610,123 602,408 651,366 9,457 1.5 (29,914) (4.6) 5,843,022 5,680,690 5,531,150 5,476,809 5,313,806 162,332 2.9 529,216 10.0 *Other assets include FHLBB stock (at cost), accrued interest receivable, in addition to other assets
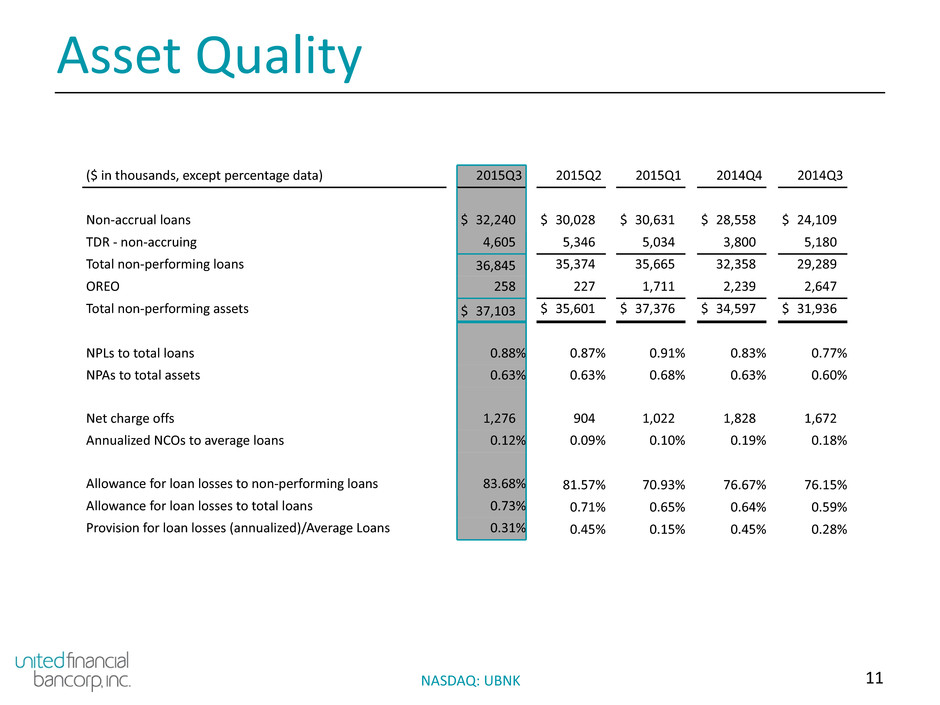
11NASDAQ: UBNK Asset Quality ($ in thousands, except percentage data) 2015Q3 2015Q2 2015Q1 2014Q4 2014Q3 Non-accrual loans $ 32,240 $ 30,028 $ 30,631 $ 28,558 $ 24,109 TDR - non-accruing 4,605 5,346 5,034 3,800 5,180 Total non-performing loans 36,845 35,374 35,665 32,358 29,289 OREO 258 227 1,711 2,239 2,647 Total non-performing assets $ 37,103 $ 35,601 $ 37,376 $ 34,597 $ 31,936 NPLs to total loans 0.88% 0.87% 0.91% 0.83% 0.77% NPAs to total assets 0.63% 0.63% 0.68% 0.63% 0.60% Net charge offs 1,276 904 1,022 1,828 1,672 Annualized NCOs to average loans 0.12% 0.09% 0.10% 0.19% 0.18% Allowance for loan losses to non-performing loans 83.68% 81.57% 70.93% 76.67% 76.15% Allowance for loan losses to total loans 0.73% 0.71% 0.65% 0.64% 0.59% Provision for loan losses (annualized)/Average Loans 0.31% 0.45% 0.15% 0.45% 0.28%
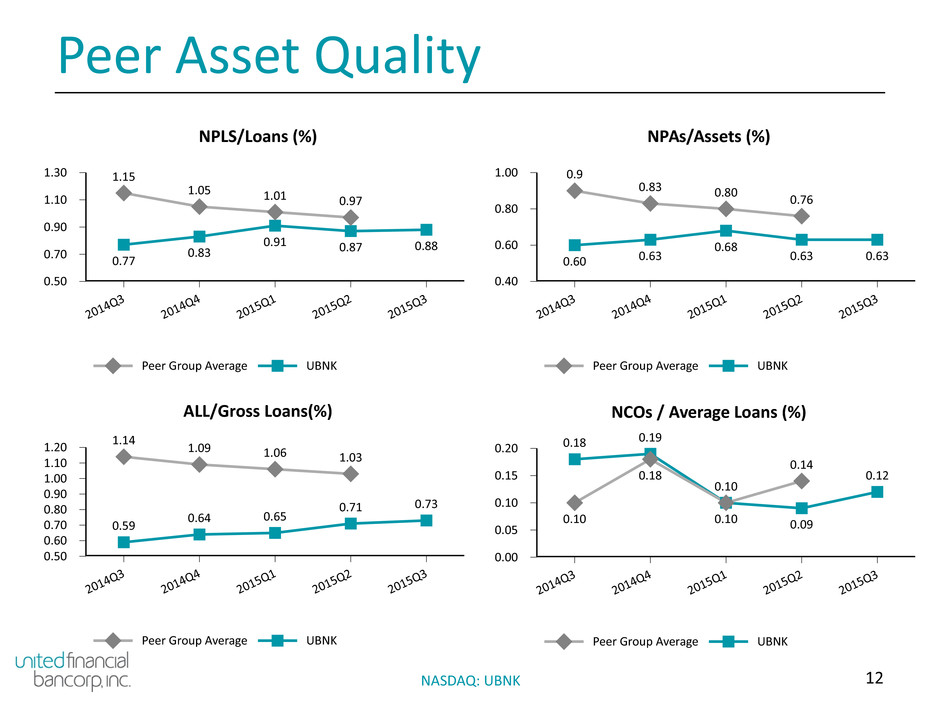
12NASDAQ: UBNK Peer Asset Quality Peer Group Average UBNK NPLS/Loans (%) 1.30 1.10 0.90 0.70 0.50 201 4Q3 201 4Q4 201 5Q1 201 5Q2 201 5Q3 1.15 1.05 1.01 0.97 0.77 0.83 0.91 0.87 0.88 Peer Group Average UBNK NPAs/Assets (%) 1.00 0.80 0.60 0.40 201 4Q3 201 4Q4 201 5Q1 201 5Q2 201 5Q3 0.9 0.83 0.80 0.76 0.60 0.63 0.68 0.63 0.63 Peer Group Average UBNK ALL/Gross Loans(%) 1.20 1.10 1.00 0.90 0.80 0.70 0.60 0.50 201 4Q3 201 4Q4 201 5Q1 201 5Q2 201 5Q3 1.14 1.09 1.06 1.03 0.59 0.64 0.65 0.71 0.73 Peer Group Average UBNK NCOs / Average Loans (%) 0.20 0.15 0.10 0.05 0.00 201 4Q3 201 4Q4 201 5Q1 201 5Q2 201 5Q3 0.10 0.18 0.10 0.14 0.18 0.19 0.10 0.09 0.12
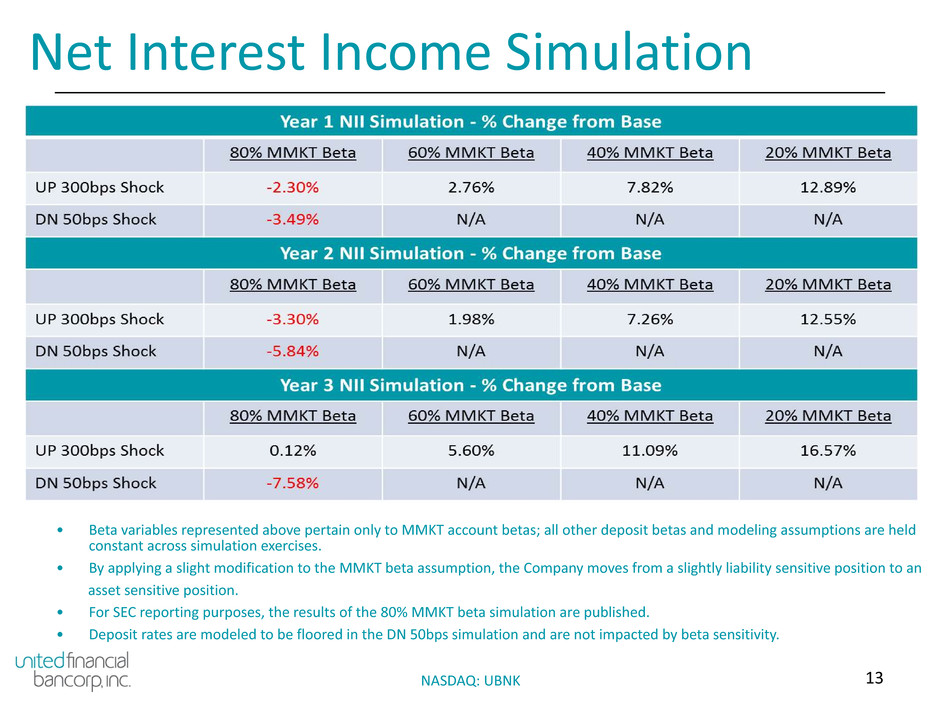
13NASDAQ: UBNK Net Interest Income Simulation • Beta variables represented above pertain only to MMKT account betas; all other deposit betas and modeling assumptions are held constant across simulation exercises. • By applying a slight modification to the MMKT beta assumption, the Company moves from a slightly liability sensitive position to an asset sensitive position. • For SEC reporting purposes, the results of the 80% MMKT beta simulation are published. • Deposit rates are modeled to be floored in the DN 50bps simulation and are not impacted by beta sensitivity.
14NASDAQ: UBNK APPENDIX
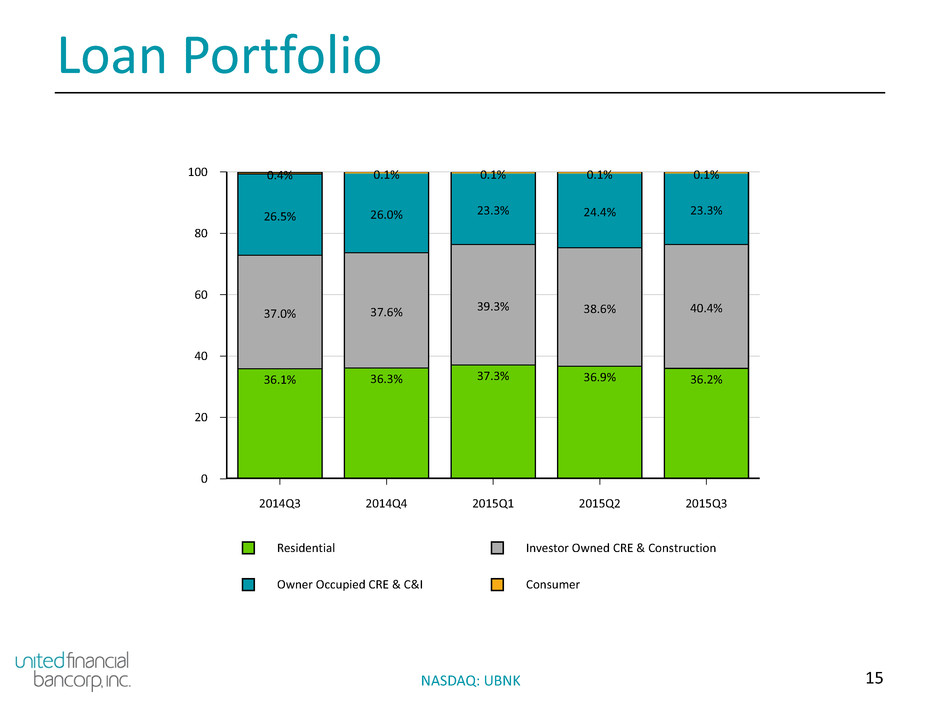
15NASDAQ: UBNK Loan Portfolio Residential Investor Owned CRE & Construction Owner Occupied CRE & C&I Consumer 100 80 60 40 20 0 2014Q3 2014Q4 2015Q1 2015Q2 2015Q3 36.1% 36.3% 37.3% 36.9% 36.2% 37.0% 37.6% 39.3% 38.6% 40.4% 26.5% 26.0% 23.3% 24.4% 23.3% 0.4% 0.1% 0.1% 0.1% 0.1%
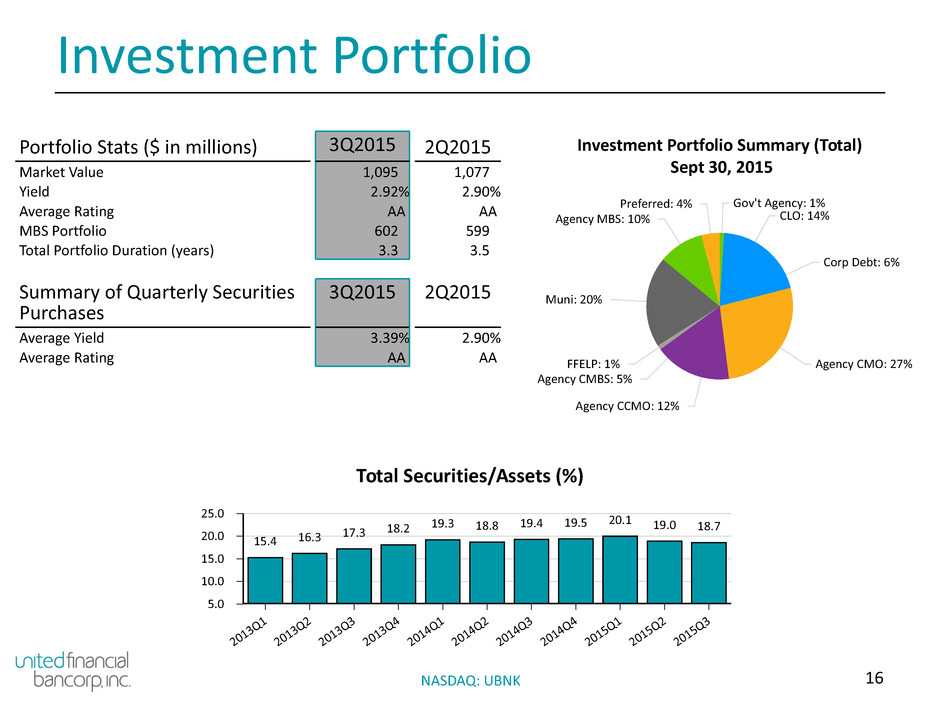
16NASDAQ: UBNK Investment Portfolio Portfolio Stats ($ in millions) 3Q2015 2Q2015 Market Value 1,095 1,077 Yield 2.92% 2.90% Average Rating AA AA MBS Portfolio 602 599 Total Portfolio Duration (years) 3.3 3.5 Summary of Quarterly Securities Purchases 3Q2015 2Q2015 Average Yield 3.39% 2.90% Average Rating AA AA Total Securities/Assets (%) 25.0 20.0 15.0 10.0 5.0 201 3Q 1 201 3Q 2 201 3Q 3 201 3Q 4 201 4Q 1 201 4Q 2 201 4Q 3 201 4Q 4 201 5Q 1 201 5Q 2 201 5Q 3 15.4 16.3 17.3 18.2 19.3 18.8 19.4 19.5 20.1 19.0 18.7 Investment Portfolio Summary (Total) Sept 30, 2015 Gov't Agency: 1% CLO: 14% Corp Debt: 6% Agency CMO: 27% Agency CCMO: 12% Agency CMBS: 5% FFELP: 1% Muni: 20% Agency MBS: 10% Preferred: 4%
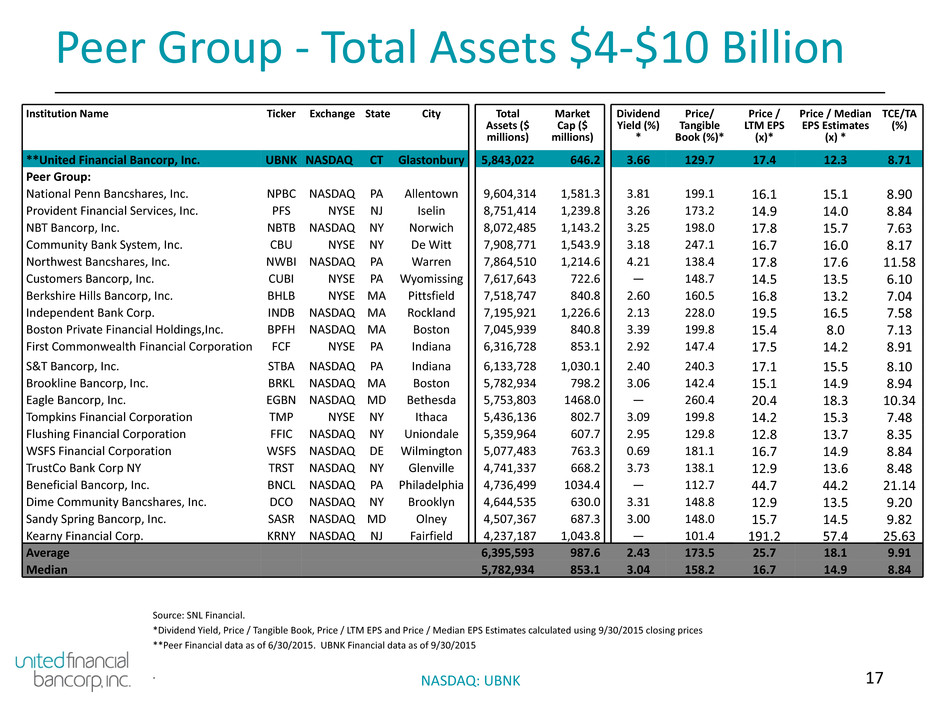
17NASDAQ: UBNK Peer Group - Total Assets $4-$10 Billion Source: SNL Financial. *Dividend Yield, Price / Tangible Book, Price / LTM EPS and Price / Median EPS Estimates calculated using 9/30/2015 closing prices **Peer Financial data as of 6/30/2015. UBNK Financial data as of 9/30/2015 . Institution Name Ticker Exchange State City Total Assets ($ millions) Market Cap ($ millions) Dividend Yield (%) * Price/ Tangible Book (%)* Price / LTM EPS (x)* Price / Median EPS Estimates (x) * TCE/TA (%) **United Financial Bancorp, Inc. UBNK NASDAQ CT Glastonbury 5,843,022 646.2 3.66 129.7 17.4 12.3 8.71 Peer Group: National Penn Bancshares, Inc. NPBC NASDAQ PA Allentown 9,604,314 1,581.3 3.81 199.1 16.1 15.1 8.90 Provident Financial Services, Inc. PFS NYSE NJ Iselin 8,751,414 1,239.8 3.26 173.2 14.9 14.0 8.84 NBT Bancorp, Inc. NBTB NASDAQ NY Norwich 8,072,485 1,143.2 3.25 198.0 17.8 15.7 7.63 Community Bank System, Inc. CBU NYSE NY De Witt 7,908,771 1,543.9 3.18 247.1 16.7 16.0 8.17 Northwest Bancshares, Inc. NWBI NASDAQ PA Warren 7,864,510 1,214.6 4.21 138.4 17.8 17.6 11.58 Customers Bancorp, Inc. CUBI NYSE PA Wyomissing 7,617,643 722.6 — 148.7 14.5 13.5 6.10 Berkshire Hills Bancorp, Inc. BHLB NYSE MA Pittsfield 7,518,747 840.8 2.60 160.5 16.8 13.2 7.04 Independent Bank Corp. INDB NASDAQ MA Rockland 7,195,921 1,226.6 2.13 228.0 19.5 16.5 7.58 Boston Private Financial Holdings,Inc. BPFH NASDAQ MA Boston 7,045,939 840.8 3.39 199.8 15.4 8.0 7.13 First Commonwealth Financial Corporation FCF NYSE PA Indiana 6,316,728 853.1 2.92 147.4 17.5 14.2 8.91 S&T Bancorp, Inc. STBA NASDAQ PA Indiana 6,133,728 1,030.1 2.40 240.3 17.1 15.5 8.10 Brookline Bancorp, Inc. BRKL NASDAQ MA Boston 5,782,934 798.2 3.06 142.4 15.1 14.9 8.94 Eagle Bancorp, Inc. EGBN NASDAQ MD Bethesda 5,753,803 1468.0 — 260.4 20.4 18.3 10.34 Tompkins Financial Corporation TMP NYSE NY Ithaca 5,436,136 802.7 3.09 199.8 14.2 15.3 7.48 Flushing Financial Corporation FFIC NASDAQ NY Uniondale 5,359,964 607.7 2.95 129.8 12.8 13.7 8.35 WSFS Financial Corporation WSFS NASDAQ DE Wilmington 5,077,483 763.3 0.69 181.1 16.7 14.9 8.84 TrustCo Bank Corp NY TRST NASDAQ NY Glenville 4,741,337 668.2 3.73 138.1 12.9 13.6 8.48 Beneficial Bancorp, Inc. BNCL NASDAQ PA Philadelphia 4,736,499 1034.4 — 112.7 44.7 44.2 21.14 Dime Community Bancshares, Inc. DCO NASDAQ NY Brooklyn 4,644,535 630.0 3.31 148.8 12.9 13.5 9.20 Sandy Spring Bancorp, Inc. SASR NASDAQ MD Olney 4,507,367 687.3 3.00 148.0 15.7 14.5 9.82 Kearny Financial Corp. KRNY NASDAQ NJ Fairfield 4,237,187 1,043.8 — 101.4 191.2 57.4 25.63 Average 6,395,593 987.6 2.43 173.5 25.7 18.1 9.91 Median 5,782,934 853.1 3.04 158.2 16.7 14.9 8.84
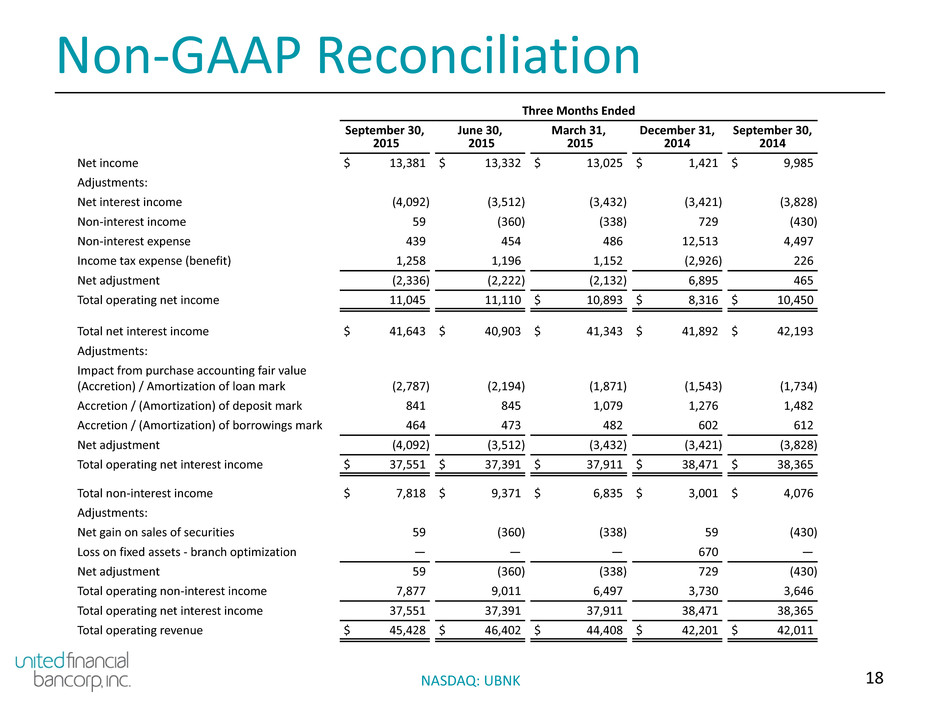
18NASDAQ: UBNK Non-GAAP Reconciliation Three Months Ended September 30, 2015 June 30, 2015 March 31, 2015 December 31, 2014 September 30, 2014 Net income $ 13,381 $ 13,332 $ 13,025 $ 1,421 $ 9,985 Adjustments: Net interest income (4,092) (3,512) (3,432) (3,421) (3,828) Non-interest income 59 (360) (338) 729 (430) Non-interest expense 439 454 486 12,513 4,497 Income tax expense (benefit) 1,258 1,196 1,152 (2,926) 226 Net adjustment (2,336) (2,222) (2,132) 6,895 465 Total operating net income 11,045 11,110 $ 10,893 $ 8,316 $ 10,450 Total net interest income $ 41,643 $ 40,903 $ 41,343 $ 41,892 $ 42,193 Adjustments: Impact from purchase accounting fair value (Accretion) / Amortization of loan mark (2,787) (2,194) (1,871) (1,543) (1,734) Accretion / (Amortization) of deposit mark 841 845 1,079 1,276 1,482 Accretion / (Amortization) of borrowings mark 464 473 482 602 612 Net adjustment (4,092) (3,512) (3,432) (3,421) (3,828) Total operating net interest income $ 37,551 $ 37,391 $ 37,911 $ 38,471 $ 38,365 Total non-interest income $ 7,818 $ 9,371 $ 6,835 $ 3,001 $ 4,076 Adjustments: Net gain on sales of securities 59 (360) (338) 59 (430) Loss on fixed assets - branch optimization — — — 670 — Net adjustment 59 (360) (338) 729 (430) Total operating non-interest income 7,877 9,011 6,497 3,730 3,646 Total operating net interest income 37,551 37,391 37,911 38,471 38,365 Total operating revenue $ 45,428 $ 46,402 $ 44,408 $ 42,201 $ 42,011
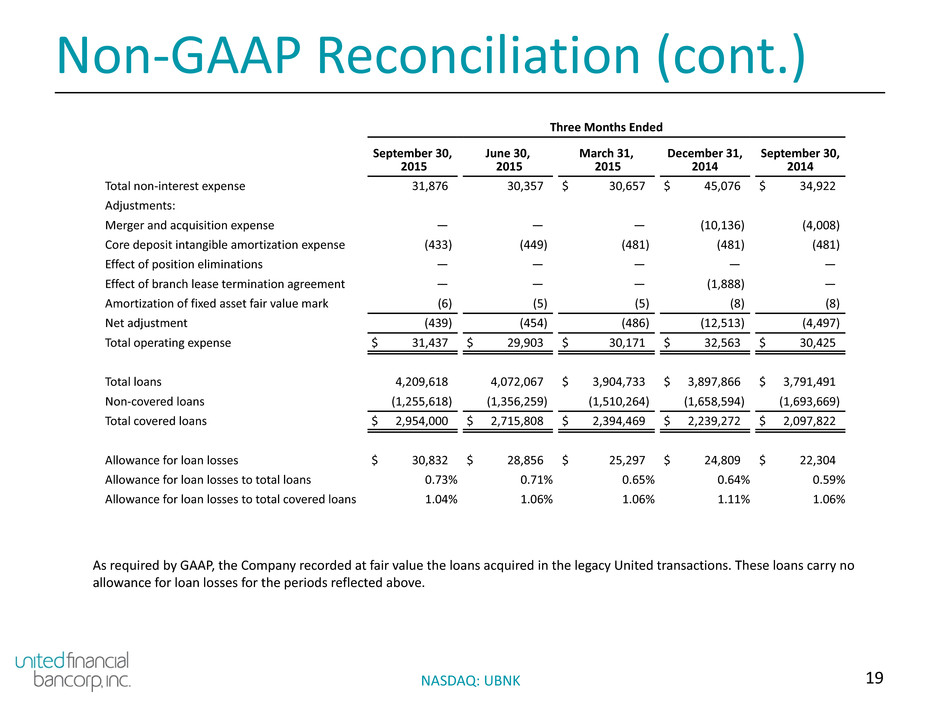
19NASDAQ: UBNK Non-GAAP Reconciliation (cont.) Three Months Ended September 30, 2015 June 30, 2015 March 31, 2015 December 31, 2014 September 30, 2014 Total non-interest expense 31,876 30,357 $ 30,657 $ 45,076 $ 34,922 Adjustments: Merger and acquisition expense — — — (10,136) (4,008) Core deposit intangible amortization expense (433) (449) (481) (481) (481) Effect of position eliminations — — — — — Effect of branch lease termination agreement — — — (1,888) — Amortization of fixed asset fair value mark (6) (5) (5) (8) (8) Net adjustment (439) (454) (486) (12,513) (4,497) Total operating expense $ 31,437 $ 29,903 $ 30,171 $ 32,563 $ 30,425 Total loans 4,209,618 4,072,067 $ 3,904,733 $ 3,897,866 $ 3,791,491 Non-covered loans (1,255,618) (1,356,259) (1,510,264) (1,658,594) (1,693,669) Total covered loans $ 2,954,000 $ 2,715,808 $ 2,394,469 $ 2,239,272 $ 2,097,822 Allowance for loan losses $ 30,832 $ 28,856 $ 25,297 $ 24,809 $ 22,304 Allowance for loan losses to total loans 0.73% 0.71% 0.65% 0.64% 0.59% Allowance for loan losses to total covered loans 1.04% 1.06% 1.06% 1.11% 1.06% As required by GAAP, the Company recorded at fair value the loans acquired in the legacy United transactions. These loans carry no allowance for loan losses for the periods reflected above.
