Attached files
| file | filename |
|---|---|
| EX-99.1 - EX-99.1 - People's United Financial, Inc. | d13072dex991.htm |
| 8-K - 8-K - People's United Financial, Inc. | d13072d8k.htm |
 Third
Quarter 2015 Results October 15, 2015
NASDAQ: PBCT Exhibit 99.2 |
 1 Forward-Looking Statement Certain statements contained in this release are forward-looking in nature. These include all statements
about People's United Financial's plans, objectives, expectations and other statements that are not historical facts, and usually use words such as "expect," "anticipate," "believe," "should" and similar
expressions. Such statements represent management's current beliefs,
based upon information available at the time the statements are made,
with regard to the matters addressed. All forward-looking statements
are subject to risks and uncertainties that could cause People's United Financial's actual results or financial condition to differ materially from those expressed in or implied by such statements. Factors of
particular importance to People’s United Financial include, but are not limited
to: (1) changes in general, national or regional economic conditions; (2)
changes in interest rates; (3) changes in loan default and charge-off
rates; (4) changes in deposit levels; (5) changes in levels of income and expense in non- interest income and expense related activities; (6) changes in accounting and regulatory guidance
applicable to banks; (7) price levels and conditions in the public securities markets
generally; (8) competition and its effect on pricing, spending,
third-party relationships and revenues; and (9) changes in regulation
resulting from or relating to financial reform legislation. People's United Financial does not undertake any obligation to update or revise any forward-looking statements, whether as a result of new
information, future events or otherwise. |
 2 Third Quarter 2015 Overview • Operating earnings of $68.4 million or $0.23 per share, increases of 9% and 10%, respectively,
from the prior year quarter
• Net interest income 1 of $235 million, an increase of 2% • Net interest margin of 2.87%, a decrease of 1 basis point • Loan growth of $110 million, 2% annualized growth rate • Deposit growth of $845 million, 12% annualized growth rate • Non-interest income of $87 million, an increase of 5% • Operating expenses of $214 million, an increase of 3% • Efficiency ratio of 61.7%, an increase of 10 basis points • Net loan charge-offs of 0.06%, an increase of 1 basis point (Comparisons versus second quarter 2015, unless noted differently) 1 Net interest income on a fully taxable equivalent basis for 2Q 2015 and 3Q 2015 was $237.0 million and $241.1 million, respectively.
|
 2Q
2015 Originated
Loans Investments Calendar Day Acquired Loans Deposits Borrowings 3Q 2015 3 Net Interest Income ($ in millions) Linked Quarter Change $2.2 $230.4 $234.8 ($1.0) 1 Net interest income on a fully taxable equivalent basis for 2Q 2015 and 3Q 2015 was $237.0 million and $241.1 million, respectively.
$2.2 $1.7 ($0.6) ($0.1) 1 |
 4 Net Interest Margin 2Q 2015 Calendar Day Loan Yield & Mix Deposits 3Q 2015 Linked Quarter Change 0.02 bps 2.88% 2.87% (0.02 bps) (0.01 bp) |
 5 Loans ($ in millions) Linked Quarter Change $208 ($39) $27,562 $27,672 Annualized linked quarter change: +1.6% ($59) June 30, 2015 Retail Commercial Acquired Sept. 30, 2015 |
 6 Deposits Linked Quarter Change $883 ($38) Retail 2 $19,278 ($ in millions) Annualized linked quarter change: +12.3% Commercial 1 $8,157 Commercial 1 $9,040 $27,435 $28,280 Retail 2 $19,240 1 Commercial includes Municipal deposits of $1,459 at 6/30/2015 and $1,945 at 9/30/2015
2 Retail includes brokered deposits of $2,616 at 6/30/2015 and $2,676 at 9/30/2015
June 30, 2015 Commercial Retail Sept. 30, 2015 |
 7 Non-Interest Income ($ in millions) 2Q 2015 Insurance Customer Interest Rate Swap Income Bank Service Charges Commercial Banking Lending Fees Investment Management Fees Net Gains on Sales of Resi. Mortgage Loans Other 3Q 2015 Linked Quarter Change $2.6 $83.0 $87.1 ($0.5) $1.2 $1.0 $0.7 ($0.5) ($0.4) |
 8 Non-Interest Expense ($ in millions) 2Q 2015 Non-Operating Professional & Outside Services Compensation & Benefits Regulatory Assessments Occupancy & Equipment Other 3Q 2015 Linked Quarter Change $208.8 ($2.9) $214.1 $211.8 $214.2 Operating Non-Operating $0.1 $4.3 $3.0 ($0.3) $0.2 $0.3 $0.8 |
 9 Efficiency Ratio 61.4% 61.3% 61.9% 61.6% 61.7% 3Q 2014 4Q 2014 1Q 2015 2Q 2015 3Q 2015 |
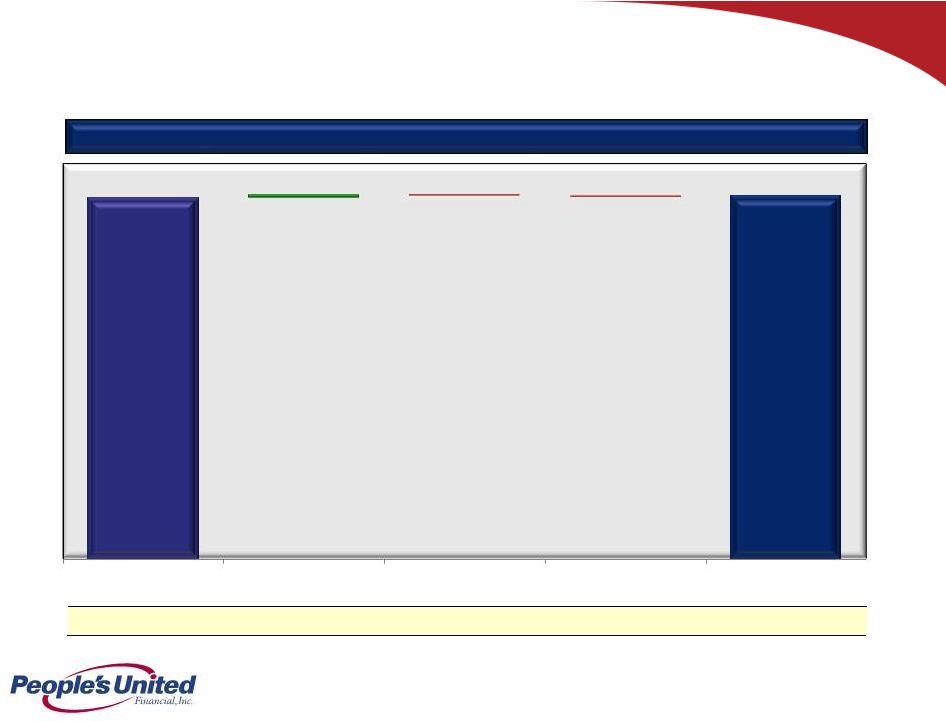
 10 Asset Quality NPAs / Loans & REO (%) 1 1 Non-performing assets (excluding acquired non-performing loans) as a percentage of originated loans plus all REO and repossessed assets; acquired non-performing loans excluded as risk of loss has been considered by virtue of (i) our estimate of acquisition-date fair
value, (ii) the existence of an FDIC loss sharing agreement, and/or
(iii) allowance for loan losses established subsequent to acquisition
Source: SNL Financial and Company filings
Notes: Top 50 Banks represents the largest 50 banks by total assets in each respective
quarter PBCT
Peer Group (Median) Top 50 Banks (Median) 0.78 0.5 1.0 1.5 2.0 2.5 3Q 2014 4Q 2014 1Q 2015 2Q 2015 3Q 2015 |
 11 Asset Quality Net Charge-Offs / Average Loans (%) 1 Excluding acquired loan charge-offs, PBCT’s charge-off ratio was 0.06%, 0.05%, 0.11%, 0.13% and 0.12%, in 3Q 2015, 2Q 2015, 1Q
2015, 4Q 2014, and 3Q 2014, respectively
Source: SNL Financial and Company filings
Notes: Top 50 Banks represents the largest 50 banks by total assets in each respective
quarter PBCT
Peer Group (Median) Top 50 Banks (Median) 1 0.06 0.0 0.1 0.2 0.3 0.4 3Q 2014 4Q 2014 1Q 2015 2Q 2015 3Q 2015 |
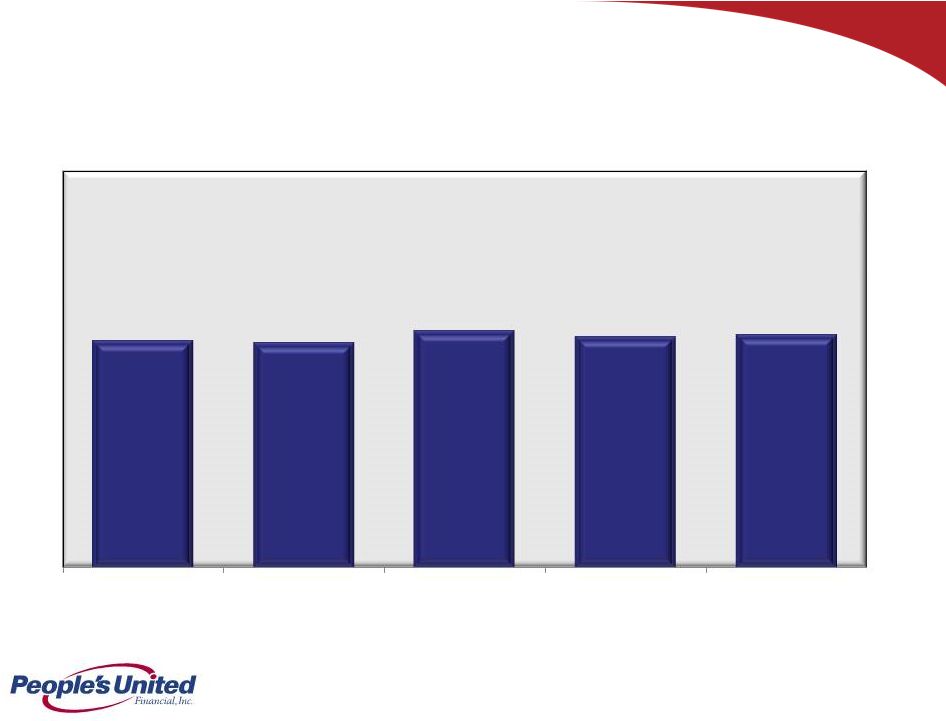
 12 Operating Return on Average Assets 0.74% 0.75% 0.71% 0.70% 0.73% 3Q 2014 4Q 2014 1Q 2015 2Q 2015 3Q 2015 |
 13 Operating Return on Average Tangible Equity 9.9% 10.1% 9.9% 9.8% 10.5% 3Q 2014 4Q 2014 1Q 2015 2Q 2015 3Q 2015 |
 14 Capital Ratios (Effective January 1, 2015, all ratios calculated in accordance with Basel III) Basel III Notes: 1. Tier 1 Leverage ratio represents Tier 1 Capital divided by Average Total Assets (less goodwill, other acquisition-related intangibles and
other deductions from Common Equity Tier 1 Capital) 2.
Common Equity Tier 1 Capital ratio represents total stockholder’s equity, excluding: (i) after-tax net unrealized gains (losses) on certain securities classified as available for sale; (ii) after-tax net unrealized gains (losses) on securities transferred to held to maturity; (iii) goodwill and other acquisition-related intangibles; and (iv) the amount recorded in accumulated other comprehensive income (loss) relating to pension and other postretirement benefits divided by Total Risk-Weighted Assets 3. Tier 1 Risk-Based Capital ratio represents Common Equity Tier 1 Capital plus additional Tier 1 Capital (together, "Tier 1 Capital")
divided by Total Risk-Weighted Assets 4.
Total Risk-Based Capital ratio represents Tier 1 Capital plus subordinated notes and
debentures, up to certain limits, and the allowance for loan losses, up to 1.25% of Total Risk-Weighted Assets, divided by Total Risk- Weighted Assets 5. Well capitalized limits under Basel III capital rules are: Tier 1 Leverage Ratio, 5%; Common Equity Tier 1 Capital Ratio, 6.5%; Tier 1
Risk-Based Capital Ratio, 8%; and Total Risk-Based Capital Ratio, 10%
3Q 2014 4Q 2014 1Q 2015 2Q 2015 3Q 2015 People’s United Financial Tang. Com. Equity/Tang. Assets 7.8% 7.5% 7.5% 7.4% 7.5% Tier 1 Leverage 1, 5 8.1% 7.9% 8.3% 8.2% 8.1% Common Equity Tier 1 Capital 2, 5 9.9% 9.8% 10.0% 9.9% 9.9% Tier 1 Risk-Based Capital 3, 5 9.9% 9.8% 10.0% 9.9% 9.9% Total Risk-Based Capital 4, 5 12.3% 12.2% 11.9% 11.8% 11.8% People’s United Bank Tier 1 Leverage 1, 5 8.8% 8.5% 8.8% 8.6% 8.5% Common Equity Tier 1 Capital 2, 5 10.7% 10.5% 10.6% 10.4% 10.4% Tier 1 Risk-Based Capital 3, 5 10.7% 10.5% 10.6% 10.4% 10.4% Total Risk-Based Capital 4, 5 13.3% 13.0% 13.1% 12.9% 12.8% |
 15 Interest Rate Risk Profile Net Interest Income (NII) Sensitivity 1 Yield curve twist pivot point is 18 month point on yield curve. Short End defined as overnight to 18 months.
Long End defined as terms greater than 18 months.
-1.6% 3.8% 7.2% 9.7% 11.9% -1.3% 4.0% 7.9% 10.7% 13.3% Down 25 Up 100 Up 200 Up 300 Up 400 -0.7% 1.6% 3.6% -4.5% 2.4% 4.2% -0.6% 2.0% 4.6% -3.8% 2.1% 3.9% Short End -25 Short End +100 Short End +200 Long End -100 Long End +100 Long End +200 Immediate Parallel Shock Est. Change in NII Yield Curve Twist 1 Est. Change in NII Sept. 30, 2015 June. 30, 2015 |
 16 Experienced leadership team Operate in large & attractive Northeast markets… …with significant knowledge at the local level Commitment to relationship-based banking Breadth of products & services Conservative & well- defined underwriting culture Premium brand built over 170 years Deep focus on expense management Summary A Uniquely Positioned Franchise |
 Appendix |
 18 Asset Quality Originated Portfolio Coverage Detail as of September 30, 2015 ALLLs / Loans NPLs / Loans ALLLs / NPLs Note – ALLLs: Commercial: $177 million, Retail: $21 million, Total: $198 million 0.91% 0.28% 0.74% Commercial Retail Total 0.64% 0.81% 0.68% Commercial Retail Total 143% 35% 108% Commercial Retail Total |
 19 Peer Group Firm Ticker City State 1 Associated ASB Green Bay WI 2 BancorpSouth BXS Tupelo MS 3 City National CYN Los Angeles CA 4 Comerica CMA Dallas TX 5 Commerce CBSH Kansas City MO 6 Cullen/Frost CFR San Antonio TX 7 East West EWBC Pasadena CA 8 First Niagara FNFG Buffalo NY 9 FirstMerit FMER Akron OH 10 Fulton FULT Lancaster PA 11 Huntington HBAN Columbus OH 12 M&T MTB Buffalo NY 13 New York Community NYCB Westbury NY 14 Signature SBNY New York NY 15 Synovus SNV Columbus GA 16 Valley National VLY Wayne NJ 17 Webster WBS Waterbury CT 18 Wintrust WTFC Lake Forest IL 19 Zions ZION Salt Lake City UT |
 For
more information, investors may contact: Andrew S. Hersom
(203) 338-4581 andrew.hersom@ peoples.com NASDAQ: PBCT |