Attached files
| file | filename |
|---|---|
| EX-5.1 - EX-5.1 - CPI Card Group Inc. | a2226209zex-5_1.htm |
| EX-15.1 - EX-15.1 - CPI Card Group Inc. | a2226209zex-15_1.htm |
| EX-23.1 - EX-23.1 - CPI Card Group Inc. | a2226209zex-23_1.htm |
| EX-23.2 - EX-23.2 - CPI Card Group Inc. | a2226209zex-23_2.htm |
| EX-23.3 - EX-23.3 - CPI Card Group Inc. | a2226209zex-23_3.htm |
Use these links to rapidly review the document
TABLE OF CONTENTS
[ALTERNATE PAGE FOR CANADIAN PROSPECTUS] TABLE OF CONTENTS
INDEX TO CONSOLIDATED FINANCIAL STATEMENTS
As filed with the Securities and Exchange Commission on October 7, 2015
Registration No. 333-206218
UNITED STATES
SECURITIES AND EXCHANGE COMMISSION
Washington, D.C. 20549
Amendment No. 5
to
Form S-1
REGISTRATION STATEMENT
Under
The Securities Act of 1933
CPI Card Group Inc.
(Exact name of Registrant as specified in its charter)
| Delaware (State or other jurisdiction of incorporation or organization) |
7374 (Primary Standard Industrial Classification Code Number) |
26-0344657 (IRS Employer Identification No.) |
CPI Card Group Inc.
10368 West Centennial Road
Littleton, CO 80127
(303) 973-9311
(Address, including zip code, and telephone number, including area code, of Registrant's principal executive offices)
Steven Montross
President and Chief Executive Officer
CPI Card Group Inc.
10368 West Centennial Road
Littleton, CO 80127
(303) 973-9311
(Name, address, including zip code, and telephone number, including area code, of agent for service)
| Please send copies of all communications to: | ||
Steven J. Gavin, Esq. Andrew J. McDonough, Esq. Arlene K. Lim, Esq. Winston & Strawn LLP 35 West Wacker Drive Chicago, Illinois 60601 (312) 558-5600 |
Christopher J. Cummings, Esq. Paul, Weiss, Rifkind, Wharton & Garrison LLP 77 King Street West, Suite 3100 Toronto, Ontario, Canada M5K 1J3 (416) 504-0522 |
|
Approximate date of commencement of proposed sale to the public:
As soon as practicable after the effective date of this Registration Statement.
If any of the securities being registered on this Form are to be offered on a delayed or continuous basis pursuant to Rule 415 under the Securities Act, check the following box: o
If this Form is filed to register additional securities for an offering pursuant to Rule 462(b) under the Securities Act, check the following box and list the Securities Act registration statement number of the earlier effective registration statement for the same offering. o
If this Form is a post-effective amendment filed pursuant to Rule 462(c) under the Securities Act, check the following box and list the Securities Act registration statement number of the earlier effective registration statement for the same offering. o
If this Form is a post-effective amendment filed pursuant to Rule 462(d) under the Securities Act, check the following box and list the Securities Act registration statement number of the earlier effective registration statement for the same offering. o
Indicate by check mark whether the registrant is a large accelerated filer, an accelerated filer, a non-accelerated filer, or a smaller reporting company. See the definitions of "large accelerated filer", "accelerated filer" and "smaller reporting company" in Rule 12b-2 of the Exchange Act. (Check one):
| Large accelerated filer o | Accelerated filer o | Non-accelerated filer ý (Do not check if a smaller reporting company) |
Smaller reporting company o |
CALCULATION OF REGISTRATION FEE
|
||||
| Title of Each Class of Securities to be Offered |
Proposed Maximum Aggregate Offering Price(1)(2) |
Amount of Registration Fee |
||
|---|---|---|---|---|
Common Stock, $0.001 par value per share |
$240,000,000 | $24,168(3) | ||
|
||||
- (1)
- Includes
additional shares that the underwriters have the option to purchase.
- (2)
- Estimated
solely for the purpose of computing the amount of the registration fee pursuant to Rule 457(o) under the Securities Act of
1933, as amended.
- (3)
- Previously paid.
The Registrant hereby amends this Registration Statement on such date or dates as may be necessary to delay its effective date until the Registrant shall file a further amendment which specifically states that this Registration Statement shall thereafter become effective in accordance with Section 8(a) of the Securities Act of 1933, as amended, or until the Registration Statement shall become effective on such date as the Commission acting pursuant to said Section 8(a) may determine.
The information in this preliminary prospectus is not complete and may be changed. Neither we nor the selling stockholders may sell these securities until the registration statement filed with the Securities and Exchange Commission is effective. This preliminary prospectus is not an offer to sell these securities and it is not soliciting an offer to buy these securities in any jurisdiction where the offer or sale is not permitted.
| PRELIMINARY PROSPECTUS | SUBJECT TO COMPLETION, DATED OCTOBER 7, 2015 |
16,000,000 Shares

CPI Card Group Inc.
Common Stock
$ per share
This is the initial public offering of our common stock. We are selling 12,216,000 shares of our common stock, and the selling stockholders named in this prospectus are selling 3,784,000 shares of our common stock. We currently expect the initial public offering price to be between $12.00 and $13.00 per share of our common stock. We will not receive any proceeds from the sale of shares by the selling stockholders.
Prior to this offering, there has been no public market for our common stock. We have applied to list our common stock on the NASDAQ Global Select Market under the symbol "PMTS." We have been conditionally approved to list our common stock on the Toronto Stock Exchange, or "TSX," under the symbol "PNT." Listing on the TSX will be subject to our fulfilling all of the listing requirements of the TSX.
We are an "emerging growth company" as that term is used in the Jumpstart our Business Startups Act of 2012, and as such, have elected to comply with certain reduced public company reporting requirements for this prospectus and future filings. See "Prospectus Summary—JOBS Act."
Investing in our common stock involves risks. See "Risk Factors" beginning on page 18.
| |
Per Share |
Total |
|||||
|---|---|---|---|---|---|---|---|
| | | | | | | | |
Initial Public Offering Price |
$ | $ | |||||
Underwriting Discount(1) |
$ | $ | |||||
Proceeds to Us (before expenses) |
$ | $ | |||||
Proceeds to the Selling Stockholders (before expenses) |
$ | $ | |||||
| | | | | | | | |
- (1)
- See "Underwriting" for a description of the compensation payable to the underwriters.
The selling stockholders have granted the underwriters an option to purchase up to 2,400,000 additional shares of our common stock within 30 days of the closing date of this offering to cover over-allotments.
Neither the Securities and Exchange Commission nor any state securities commission has approved or disapproved of these securities or determined if this prospectus is truthful or complete. Any representation to the contrary is a criminal offense.
The underwriters expect to deliver the shares to purchasers on or about , 2015 through the book-entry facilities of The Depository Trust Company.
| BMO Capital Markets | Goldman, Sachs & Co. | CIBC |
| Baird | William Blair | Raymond James | Scotiabank | GMP Securities |
Prospectus dated , 2015


[ALTERNATE PAGE FOR CANADIAN PROSPECTUS]
This prospectus has been filed under procedures in each of the provinces and territories of Canada that permit certain information about these securities to be determined after the prospectus has become final and that permit the omission of that information from this prospectus. The procedures require the delivery to purchasers of a supplemented PREP prospectus containing the omitted information within a specified period of time after agreeing to purchase any of these securities.
All of the information contained in the supplemented PREP prospectus that is not contained in the base PREP prospectus will be incorporated by reference into this base PREP prospectus as of the date of the supplemented PREP prospectus.
No securities regulatory authority has expressed an opinion about any information contained herein and it is an offence to claim otherwise. This prospectus constitutes a public offering of these securities only in those jurisdictions where they may be lawfully offered for sale and only by persons permitted to sell those securities.
We have filed a registration statement on Form S-1 with the United States Securities and Exchange Commission under the United States Securities Act of 1933, as amended, with respect to these securities.
Base PREP Prospectus
| Initial Public Offering And Secondary Offering |
October 7, 2015 |
US$
Common Stock
This prospectus (the "Prospectus") qualifies the distribution (the "Offering") of an aggregate of 16,000,000 shares of common stock (the "Common Shares") of CPI Card Group Inc. (the "Company" or "CPI"). We expect the public offering price to be between US$12.00 and US$13.00 per Common Share (the "Offering Price").
The Common Shares are being offered for sale concurrently in Canada under this Prospectus and in the United States under a registration statement on Form S-1 filed with the United States Securities and Exchange Commission. The Common Shares are being offered in Canada by BMO Nesbitt Burns Inc., Goldman Sachs Canada Inc., CIBC World Markets Inc., Raymond James Ltd., Scotia Capital Inc. and GMP Securities L.P. (the "Canadian Underwriters") and in the United States by BMO Capital Markets Corp., Goldman, Sachs & Co., CIBC World Markets Corp., Robert W. Baird & Co. Incorporated, William Blair & Company, L.L.C., Raymond James & Associates, Inc., Scotia Capital (USA) Inc. and Griffiths McBurney Corp. (the "US Underwriters," and together with the Canadian Underwriters, the "Underwriters"). 12,216,000 Common Shares are being offered by the Company and 3,784,000 Common Shares are being offered by selling stockholders named in this Prospectus. See "Principal and Selling Stockholders."
The Company has been conditionally approved to list the Common Shares on the Toronto Stock Exchange, or "TSX," under the symbol "PNT." Listing on the TSX will be subject to the Company's fulfilling all of the listing requirements of the TSX.
Affiliates of each of BMO Nesbitt Burns Inc., BMO Capital Markets Corp., Goldman Sachs Canada Inc., Goldman, Sachs & Co., CIBC World Markets Inc., CIBC World Markets Corp., Scotia Capital Inc. and Scotia Capital (USA) Inc. are lenders to the Company under its credit facility. Another affiliate of CIBC World Markets Inc. and CIBC World Markets Corp. and an affiliate of Scotia Capital Inc. and Scotia Capital (USA) Inc. are limited partners of Tricor Pacific Capital Partners (Fund IV), Limited Partnership, one of the selling stockholders named in this Prospectus. Consequently, the Company may be considered a "connected issuer" to each of BMO Nesbitt Burns Inc., BMO Capital Markets Corp., Goldman Sachs Canada Inc., Goldman, Sachs & Co., CIBC World Markets Inc., CIBC World Markets Corp., Scotia Capital Inc. and Scotia Capital (USA) Inc., and such selling stockholder may be considered a "connected issuer" to CIBC World Markets Inc., CIBC World Markets Corp., Scotia Capital Inc. and Scotia Capital (USA) Inc. in each case within the meaning of National Instrument 33-105—Underwriting Conflicts of the Canadian Securities Administrators. See "Underwriting—Conflicts of Interest".
|
|
||||
Price: US$ per Common Share |
||||
| |
Price to the Public(1) |
Underwriters' Commission(2)(3) |
Net Proceeds to CPI(2)(4) |
Net Proceeds to Selling Stockholders(3)(5) |
||||
|---|---|---|---|---|---|---|---|---|
Per Common Share |
US$ | US$ | US$ | US$ | ||||
Total |
US$ | US$ | US$ | US$ |
Notes:
- (1)
- The
Offering Price for the Common Shares has been determined by negotiation between the Company and the
Underwriters.
- (2)
- The
Underwriters will receive a commission (the "Commission") of % of the gross
amount raised in the Offering, payable in cash from the proceeds of the sale of the Common Shares. See "Underwriting" for a description of compensation
payable to the Underwriters.
- (3)
- The
selling stockholders under this offering are the following: Tricor Pacific Capital Partners (Fund IV), Limited Partnership, Tricor
Pacific Capital Partners (Fund IV) US, Limited Partnership, Steven Montross, Robert Pearce, Robert Clarke, Hayley C. Clarke 2008 Imagine Trust, McKenzie A. Clarke 2008 Imagine
Trust, Tyler L. Clarke 2008 Imagine Trust, James Galliher, Jerry Dreiling, Nicholas Cahn, Paul Boge, Docia Myer, William Dinker, Mary Martinez, Andrew Sappenfield, 9074-1448 Quebec Inc.,
Diane Jackson, David Ogonowski, Eric Savoy, Katherine Nevill, and Tom Hedrich (the "Selling Stockholders"). The Selling Stockholders have granted to the
Underwriters an option (the "Over-Allotment Option"), exercisable in whole or in part at any time until 30 days following the Closing Date (as
hereinafter defined), to purchase at the Offering Price up to 15% of the number of Common Shares purchased under the Offering to cover over-allotments, if any and for market stabilization purposes. If
the Over-Allotment Option is exercised in full, the total Price to the Public, Underwriters' Commission, Net Proceeds to the Company and Net Proceeds to Selling Stockholders will be
US$ , US$ , US$ and
US$ , respectively. See "Underwriting" and
"Principal and Selling Stockholders." This Prospectus qualifies the grant of the Over-Allotment Option and the distribution of the additional Common
Shares by the Selling Stockholders upon exercise of the Over-Allotment Option. A purchaser who acquires Common Shares forming part of the Underwriters' over-allocation position acquires those Common
Shares under this Prospectus, regardless of whether the over-allocation position is ultimately filled through the exercise of the Over-Allotment Option or secondary market purchases. See
"Underwriting."
- (4)
- After
deducting the Commission but before deducting the Offering expenses (the "Expenses"),
estimated at US$5.0 million.
- (5)
- The Selling Stockholders will pay the Underwriters' discounts and commissions in respect of the Common Shares sold by the Selling Stockholders. The portion of the Expenses that will be borne by the Selling Stockholders is $ .
The Canadian Underwriters, as principals, conditionally offer the Common Shares qualified under this Prospectus, subject to prior sale, if, as and when issued by CPI and accepted by the Canadian Underwriters in accordance with the conditions contained in the underwriting agreement referred to under "Underwriting" and subject to the approval of certain legal matters on behalf of CPI by Blake, Cassels & Graydon LLP, as to matters of Canadian law, and by Winston & Strawn LLP, as to matters of U.S. law, and on behalf of the Underwriters by Stikeman Elliott LLP, as to matters of Canadian law, and Paul, Weiss, Rifkind, Wharton & Garrison LLP, as to matters of U.S. law.
Underwriters' position
|
Maximum size or number of securities available |
Exercise period or acquisition date |
Exercise price or average acquisition price |
|||
|---|---|---|---|---|---|---|
Over-Allotment Option |
Option to acquire up to 2,400,000 Common Shares | Exercisable for a period of 30 days after the closing date of this Offering | US$ |
In connection with this Offering, the Underwriters may, subject to applicable laws, overallot or effect transactions that stabilize, maintain or otherwise affect the market price of the Common Shares at levels other than those which otherwise might prevail on the open market. Such transactions, if commenced, may be discontinued at any time. The Underwriters may offer the Common Shares at a lower price than stated above. See "Underwriting."
There is currently no market through which the Common Shares may be sold and purchasers may not be able to resell the Common Shares purchased under this Prospectus. This may affect the pricing of the Common Shares in the secondary market, the transparency and availability of trading prices, the liquidity of the securities and the extent of issuer regulation. See "Risk Factors".
Subscriptions for the Common Shares will be received subject to rejection or allotment in whole or in part and the right is reserved to close the subscription books at any time without notice. The Common Shares to be issued or sold in this Offering will be issued in registered form to CDS Clearing and Depositary Services Inc. ("CDS") or the Depositary Trust Company ("DTC"), and deposited with CDS or DTC on the closing date of this Offering which is expected to occur on or about October 13, 2015 or such later date as the Company and the Underwriters may agree, but in any event not later than November 5, 2015 (the "Closing Date"). A purchaser of the Common Shares in Canada will receive only a customer confirmation from a registered dealer that is a participant in CDS through which the Common Shares are purchased, unless such purchaser requests from the Company the issuance of a certificate evidencing such Common Shares.
Any "template version" of any "marketing materials" (as such terms are defined under Canadian securities laws) that are utilized by the Canadian Underwriters in connection with the Offering are not part of this prospectus to the extent that the contents of the template version of the marketing materials have been modified or superseded by a statement contained in this prospectus. Any template version of any marketing materials that has been, or will be, filed under the Company's profile on www.sedar.com before the termination of the distribution under the Offering (including any amendments to, or an amended version of, any template version of any marketing materials) is deemed to be incorporated into this prospectus.
The Company, the Company's auditor, the Selling Stockholders other than Tricor Pacific Capital Partners (Fund IV), Limited Partnership, Robert Pearce and 9074-1448 Quebec Inc. (the "Non-Canadian Selling Stockholders"), and each of Bradley Seaman, Nicholas Peters, Steven Montross and David Brush (collectively, the "Non-Canadian Directors and Signatories"), are incorporated, continued or otherwise organized under the laws of a foreign jurisdiction or resides outside of Canada. The Company, the Non-Canadian Selling Stockholders and the Non-Canadian Directors and Signatories have appointed the following agent for service of process:
Name of Person or Company
|
Name and Address of Agent | |
|---|---|---|
CPI Card Group Inc. |
Blakes Vancouver Services Inc. 595 Burrard Street, P.O. Box 49314 Suite 2600, Three Bentall Centre Vancouver, BC, V7X 1L3 Canada |
|
Non-Canadian Selling Stockholders |
Blakes Vancouver Services Inc. |
|
Non-Canadian Directors and Signatories |
Blakes Vancouver Services Inc. |
Purchasers are advised that it may not be possible for investors to enforce judgments obtained in Canada against any person or company that is incorporated, continued or otherwise organized under the laws of a foreign jurisdiction or resides outside of Canada, even if the party has appointed an agent for service of process.
INVESTMENT IN THE COMMON SHARES INVOLVES SIGNIFICANT RISKS. INVESTORS SHOULD CAREFULLY CONSIDER THE RISKS REFERRED TO UNDER THE HEADING "RISK FACTORS" STARTING ON PAGE 18 IN THIS PROSPECTUS.
We are responsible for the information contained in this prospectus and in any free-writing prospectus we have authorized. Neither we, the selling stockholders nor the underwriters have authorized anyone to provide you with different information, and neither we, the selling stockholders nor the underwriters take responsibility for any other information others may give you. Neither we, the selling stockholders nor the underwriters are making an offer to sell these securities in any jurisdiction where the offer or sale is not permitted. You should not assume that the information contained in this prospectus is accurate as of any date other than its date.
i
[ALTERNATE PAGE FOR CANADIAN PROSPECTUS]
TABLE OF CONTENTS
ii
iii
This summary highlights certain significant aspects of our business and this offering. This is a summary of information contained elsewhere in this prospectus, is not complete and does not contain all of the information that you should consider before making your investment decision. You should carefully read the entire prospectus, including the information presented under the sections entitled "Risk Factors," "Forward-Looking Statements" and "Management's Discussion and Analysis of Financial Condition and Results of Operations" and our consolidated financial statements and the notes thereto, before making an investment decision. This summary contains forward-looking statements that involve risks and uncertainties. Our actual results may differ significantly from future results contemplated in any forward-looking statements as a result of certain factors such as those set forth in the sections entitled "Risk Factors" and "Forward-Looking Statements." Unless the context otherwise requires, references to the "Company," "CPI," "us," "we" or "our" refer to CPI Card Group Inc. and its subsidiaries. References to "pro forma net sales" or "pro forma Adjusted EBITDA" mean after giving effect to our acquisition of EFT Source, Inc. as if such acquisition had occurred on January 1, 2014. References to "LTM" or the "LTM Period" refer to the twelve months ended June 30, 2015. LTM financial data is derived by adding financial data for the year ended December 31, 2014 to financial data for the six months ended June 30, 2015 and subtracting financial data for the six months ended June 30, 2014. See "Summary Consolidated Historical Financial Data." Refer to "Glossary of Industry Terms" on page 45 of this prospectus for the definitions of industry and other terms not otherwise defined herein. This prospectus contains information from a report we commissioned from First Annapolis Consulting, Inc. ("First Annapolis"), a leading advisory firm to the payments industry, in May 2015. See "Industry and Market Data."
Our Business
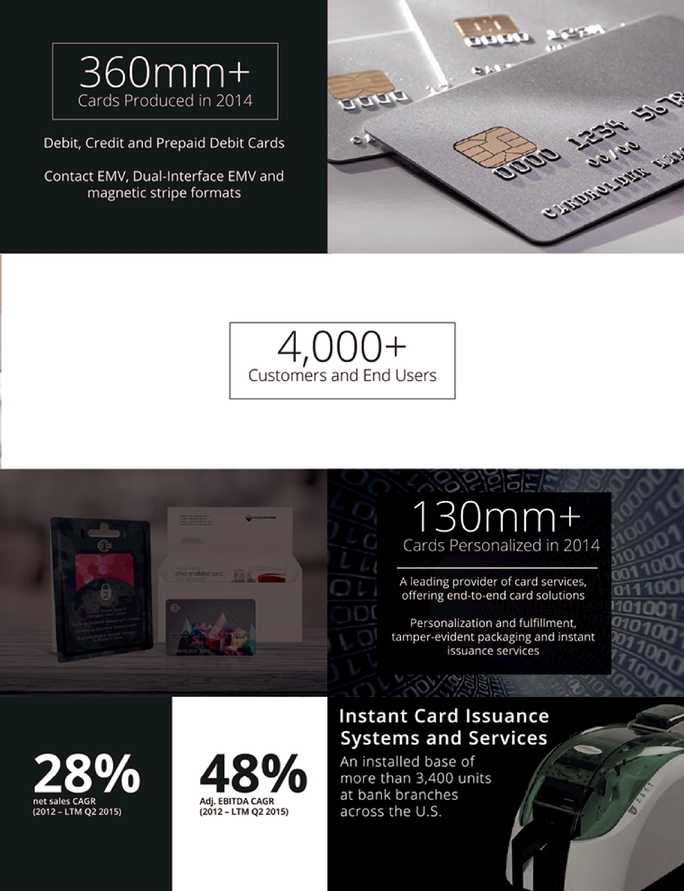
We are a leading provider of comprehensive Financial Payment Card solutions in North America. We define Financial Payment Cards as credit, debit and Prepaid Debit Cards issued on the networks of the Payment Card Brands (Visa, MasterCard, American Express and Discover) and Interac (in Canada). In 2014, we produced over 360 million Financial Payment Cards, provided integrated card services to over 3,200 card-issuing banks and Prepaid Debit Card issuers and personalized more than 130 million Financial Payment Cards. We have established a leading position in the Financial Payment Card market through more than 20 years of experience and are focused primarily on this growing subsector of the financial technology market. Our customers are primarily leading national and regional banks, independent community banks, credit unions, managers of prepaid debit programs, Group Service Providers and card processors. We serve a diverse set of over 4,000 direct and indirect customers, including many of the largest North American issuers of debit and credit cards such as JPMorgan Chase, Bank of America, American Express and Wells Fargo, the largest global managers of Prepaid Debit Card programs, including InComm, Green Dot, Blackhawk Network and American Express, as well as thousands of independent community banks, credit unions, Group Service Providers and card processors.
We serve our customers through a network of nine production and card services facilities, including seven high-security facilities in North America that are each certified by one or more of the Payment Card Brands and Interac (in Canada) and, where required by our customers, the Payment Card Industry Security Standards Council. We have the largest such network of high-security production facilities in North America, allowing us to optimize our solutions offerings to serve the needs of our diverse and long-term customer base.
We estimate that we produce approximately 35% of all Financial Payment Cards in the United States, which we believe gives us the #1 market position by unit volume. We believe we have:
- •
- the #1 position in the U.S. prepaid debit market (which represents the fastest growing subset of the Financial Payment Card market in the United States), serving the top five U.S. Prepaid Debit Card program managers;
1
- •
- a leading position in the U.S. large issuer market, serving the majority of the top 20 U.S. debit and credit card issuers; and
- •
- the #1 position in the highly attractive U.S. small issuer market, which includes independent community banks and credit unions, driven by our strong relationships, capabilities and technologies.
We have grown our business significantly over the past decade, both organically and through acquisitions. Over that time period, we have completed six acquisitions, significantly increasing our geographic and market coverage, solutions offerings and capacity. On March 9, 2010, we purchased certain assets of Premier Card Solutions, a leading provider of Financial Payment Cards, data personalization services and tamper-evident security packaging for Prepaid Debit Cards that utilize the payment networks of the Payment Card Brands. The Premier Card Solutions transaction significantly enhanced our offering to Prepaid Debit Card customers. On September 2, 2014, we acquired EFT Source, Inc. ("EFT Source"), a recognized leader in the financial technology industry that was named to American Banker and BAI's FinTech Forward 100 in both 2013 and 2014. The acquisition of EFT Source significantly enhanced our card services offering, added Card@Once® to our instant issuance card offering and expanded our end-to-end Financial Payment Card solutions.
In addition to our seven North American facilities, we have two facilities in the United Kingdom that produce retail cards, such as gift and loyalty cards that are not issued on the networks of the Payment Card Brands, and provide personalization services. For further information on our business, see "Business."
For the LTM Period, we generated net sales of $338.1 million, net income from continuing operations of $30.5 million and Adjusted EBITDA of $81.5 million, representing net income from continuing operations and Adjusted EBITDA margins of 9.0% and 24.1%, respectively. For the year ended December 31, 2014, we generated $261.0 million of net sales, which represented an increase of 32.9% as compared to the prior year, $16.0 million of net income from continuing operations, which represented an increase of 42.6% as compared to the prior year, and $54.2 million of Adjusted EBITDA, which represented an increase of 41.3% as compared to the prior year, and net income from continuing operations and Adjusted EBITDA margins of 6.1% and 20.8%, respectively. Our 2014 and LTM results include four and ten months of results from EFT Source, respectively. Adjusted EBITDA and Adjusted EBITDA margin are financial measures not presented in accordance with generally accepted accounting principles ("GAAP"). For a definition of Adjusted EBITDA and a reconciliation of Adjusted EBITDA to net income from continuing operations, the most comparable GAAP measure, see "Summary Consolidated Historical Financial Data."
EMV Conversion in the United States
As a leading provider of integrated Financial Payment Card solutions in North America, we are well-positioned to capitalize on the U.S. market conversion to EMV. The EMV standard for Financial Payment Cards, which is named after Europay, MasterCard and Visa, is a technologically advanced high security protocol that features a Financial Payment Card with an embedded microprocessor, commonly known as a "chip card." Depending on the features required by the issuer, EMV cards may sell for 5 to 10 times the average selling price of the magnetic stripe cards they are replacing. We estimate based on our experience that the industry-wide average selling prices per card, exclusive of services, are approximately as follows: magnetic stripe—$0.20 per card; Contact EMV—$1.00 per card; and Dual-Interface EMV—$2.00 per card. Comparing our costs to selling prices, we achieve similar gross margin percentages across these three card types. Actual per card pricing and margins will vary significantly depending on issuer size, order size, card features, finishes and EMV chip features selected by the issuer. According to First Annapolis, on a dollar basis, the U.S. Financial Payment Card market (excluding services) more than doubled from $180 million in 2013 to $371 million in 2014, and the conversion of U.S. Financial Payment Cards to the EMV standard is expected to further increase this
2
market size by more than three-fold to $1.2 billion by 2019. A number of factors have precipitated the ongoing conversion of Financial Payment Cards in the United States to the EMV standard:
- •
- The Liability Shift. In August 2011, Visa announced a
plan for the U.S. market to adopt the EMV standard for security on credit and debit cards. A key feature of Visa's announcement, which later became a coordinated effort among all of the Payment Card
Brands, was a card fraud liability shift effective October 1, 2015. After the October 1, 2015 deadline, the party that caused a non-EMV transaction to occur (i.e., either the non-EMV
card issuer or the merchant that does not have an EMV compatible POS system) will be the one held financially liable for any resulting counterfeit fraud losses.
- •
- Escalating U.S. Card Fraud. According to The Nilson
Report, the United States represents about one half of global Financial Payment Card and Private Label Credit Card fraudulent transactions (more than $5.3 billion annually), despite accounting
for only about one quarter of total card transactions. While a number of factors contribute to this imbalance, we believe counterfeit card fraud has migrated to countries that have lower EMV adoption
rates such as the United States, which is the last of the G-20 nations to begin to transition Financial Payment Cards from magnetic stripe technology to the more secure EMV standard.
- •
- Enhanced Security. EMV cards feature an embedded
microprocessor that, when paired with an EMV payment terminal, dynamically authenticates cardholder debit and credit card transactions using a cryptographic process that results in a significantly
more secure payment transaction environment. Card fraud and, in particular, Card-Present Fraud, has declined significantly in nations that have adopted the EMV standard.
- •
- High-Profile Data Breaches. In the last few years, a
number of large U.S. merchants, such as Target and Home Depot, and banks have reported major customer or client data breaches and other fraudulent activities, which have heightened awareness of data
security and increased demand for higher security solutions in payments systems, including accelerating the adoption of EMV. As a result, combating such data breaches and card fraud has become a board
of director level issue among many of the nation's largest merchants, card issuers and Payment Card Brands and has garnered significant attention from the U.S. Government.
- •
- Desire for Global Interoperability of the Acceptance Network. EMV is increasingly becoming the global standard for Financial Payment Cards outside the United States. The coordinated efforts of the Payment Card Brands to implement the liability shift in the United States reflect, in part, their desire to standardize payment systems technology globally to ensure cardholders' cards will be accepted by merchants anywhere on their global network and to provide a predictable and consistent experience for the cardholder.
EMV cards issued in the United States to date primarily have been Contact EMV cards. Globally, Dual-Interface EMV cards, which also enable contactless payment, are gaining popularity among card issuers, primarily because of the speed and convenience they offer to cardholders. For example, in Canada, we believe that the majority of all credit cards currently being issued are Dual-Interface EMV cards. Dual-Interface EMV cards are more complex to produce than Contact EMV cards and typically sell at a significantly higher price point. We believe that as the U.S. market migrates to the EMV standard, Dual-Interface EMV cards issued in the United States will gain share relative to Contact EMV cards, further expanding the dollar value of our market opportunity.
Our Market
Consumer payments in the United States and globally have shifted over the last several decades from paper-based media such as cash and checks to card-based media such as credit, debit and Prepaid Debit Cards, and electronic methods such as pre-authorized payments through ACH. The Nilson Report estimates that card-based payments have increased from 38.3% of U.S. transactions in 2005 to
3
56.5% in 2013, and electronic payments have increased from 4.3% to 7.2% over the same period. By 2018, card-based payments are projected to comprise 69.2% of U.S. transactions, with cash and checks accounting for 21.4% and electronic payments representing the remaining 9.4%. We believe that this long-term trend of card-based and electronic payments replacing cash and checks will continue.
According to First Annapolis, 976 million Financial Payment Cards were produced for the U.S. market in 2014 and this number is estimated to grow to 1.2 billion cards by 2019, representing a compound annual growth rate ("CAGR") of 4.3%. The primary driver of growth is an increasing adoption of Prepaid Debit Cards, along with steady growth in debit and credit cards. On a dollar basis, the U.S. Financial Payment Card market (excluding services) was $371 million in 2014 (up from $180 million in 2013) and is anticipated to grow to $1.2 billion by 2019, driven by the EMV conversion and unit volume growth. This market can be divided as follows:
- •
- Bank debit cards (368 million cards in 2014; 1.5% forecasted CAGR during
2014-2019). Bank debit cards generally are issued by financial institutions to their customers as a convenient way to access funds under
the custody of the issuer. Bank debit cards are issued on the networks of the Payment Card Brands and Interac (in Canada) or similar debit networks and are usable anywhere on the card network to
withdraw cash from ATMs or pay merchants for goods and services. There are over 10,000 banks, credit unions and other organizations that issue such cards in the United States.
- •
- General purpose credit cards (332 million cards in 2014; 4.0% forecasted CAGR during
2014-2019). General purpose credit cards are issued by financial institutions, as well as certain Payment Card Brands including American Express and Discover. All general
purpose credit cards are issued on the networks of the Payment Card Brands and usable anywhere on the card network to pay merchants for goods and services or to withdraw cash from ATMs. There
are over 4,800 banks, credit unions, card networks and other organizations that issue such cards in the United States.
- •
- Prepaid debit cards (276 million cards in 2014; 8.0% forecasted CAGR during 2014-2019). Prepaid debit cards share many of the functional features and conveniences of traditional bank debit cards; they are issued on the network of a Payment Card Brand and usable in the same manner as a bank debit card. However, these cards are not linked to a traditional bank account, are easier to acquire and require cardholders to load money onto the card in advance of any transaction. Prepaid Debit Cards are often issued for use as gift cards (in place of a cash or check gift), for payroll purposes (as an alternative to paper payroll checks), or by employers and government agencies for benefits or incentives. Additionally, GPR Cards, which are registered by the cardholder with the issuing bank or licensed money transmitter in order to reload the card's monetary value, have emerged as an important part of the Prepaid Debit Card market, particularly for low-income and younger consumers. The Prepaid Debit Card market is expected to experience the highest annual growth rate from 2014-2019 as adoption across Prepaid Debit Card products increases.
According to First Annapolis, the demand for bank debit and general purpose credit cards has been predictable and recurring in nature, with 88% of cards issued in 2014 directly replacing existing cards. This includes the regular renewal of cards (53% of 2014 issuances, which are generally renewed every three to five years due to fixed expiration dates), cards lost, stolen or replaced due to fraudulent usage (19% of 2014 issuances) and portfolio churn (16% of 2014 issuances, when cardholders move from one card program to another). The remaining demand is the issuance of cards in conjunction with net new account growth (12% of 2014 issuances). The issuance of Prepaid Debit Cards has represented a similarly predictable and recurring source of demand, as a majority of Prepaid Debit Cards have an average estimated card life of less than twelve months.
In addition, according to First Annapolis, outsourced card data personalization services for Financial Payment Cards represented a $417 million market in the United States in 2014 and is
4
estimated to grow to $604 million by 2019, representing a 7.7% CAGR. The process of personalization involves assigning unique identification numbers and encrypting authentication data (such as a cardholder's account number, name and other data) onto cards, embossing and encoding personal information onto the cards and distributing personal identification numbers ("PINs") and fully packaged cards to individual cardholders. We believe the value of the market for personalization services will grow over the next several years due to the growth of overall cards in circulation and the U.S. EMV conversion, which is expected to increase revenues for service providers as personalizing EMV cards incorporates higher value added services than the process for non-EMV cards.
Our Products and Services
Our leading market position is supported by our comprehensive end-to-end Financial Payment Card solutions offering which meets the stringent security requirements of the Payment Card Brands and our customers. This comprehensive offering of end-to-end solutions drives deep customer integration and long-term trusted relationships with our customers, many of which we have served for decades.
- •
- EMV Financial Payment Cards (Contact and Dual-Interface) (37% of LTM net
sales). We produce Contact EMV cards, which feature a microprocessor that interfaces with an EMV payment terminal over a contact plate
on the surface of the card when inserted into an EMV-enabled payment terminal. We also produce Dual-Interface EMV cards, which feature both the contact EMV technology and a RFID antenna that utilizes
near field communications ("NFC") technology to allow transactions to also be processed on a contactless basis when the card is brought within the requisite proximity to a NFC enabled payment
terminal.
- •
- Non-EMV Financial Payment Cards and Retail Gift Cards (22% of LTM net
sales). We produce non-EMV cards that utilize magnetic stripes, contactless cards which utilize NFC technology and cards that include
both magnetic stripes and NFC technology. In addition, we produce retail gift cards (which are not issued on the network of the Payment Card Brands) primarily in the U.K. and Canada.
- •
- Card Data Personalization (18% of LTM net sales). We
provide data preparation and card data personalization solutions for debit, credit and Prepaid Debit Cards in EMV and non-EMV card formats. Our personalization services are technology-driven and
provide a wide range of card customization options, using advanced processes to personalize (encode, program and emboss with data such as cardholder name and account number) and fulfill cards to
individual cardholders. In addition, we provide EMV data script development services for our customers and in certain cases generate PIN numbers and mailers on their behalf. We offer patented card
design software, known as MYCA™, which provides our customers and their cardholders the ability to design cards on the internet and customize cards with individualized digital images. We
also offer integrated business continuity services to card issuers that provide their own card issuance and personalization services, providing an alternate site to personalize and fulfill cards in
the event of a business disruption at their captive sites.
- •
- Tamper-Evident Security Packaging Solutions (19% of LTM net
sales). We offer specialized and innovative tamper-evident security packaging products and services to customers with a Prepaid Debit
Card offering that reduce fraud for Prepaid Debit Cards sold through the retail channel. The majority of the tamper-evident security packaging we produce is protected by our patents. In certain cases,
we also manage the fulfillment of fully-completed Prepaid Debit Card packages to retail locations on behalf of our customers utilizing this solution.
- •
- Instant Card Issuance Systems and Services (4% of LTM net sales). We offer Card@Once®, our proprietary and patented instant card issuance system and services, which provide our card issuing bank customers the ability to issue a completely personalized permanent debit card
5
within the bank branch to individual cardholders upon demand. Our instant issuance system generates both system sales and recurring revenue from software as a service, card personalization and sales of cards and consumables. As of June 30, 2015, we had over 3,400 instant issuance systems installed in bank and credit union branches across the United States. In addition, we provide instant issuance of debit cards to large financial institutions whereby we provide fully-personalized temporary debit cards which are issued to card holders upon opening a new account, and we manage the fulfillment and replenishment of these fully personalized cards directly to thousands of individual bank branches.
Our Competitive Strengths
- •
- Leading Market Position with Long-Term Customer Relationships. We estimate that we produce approximately 35% of all Financial Payment Cards in the United States, which we believe gives us the #1 market position by unit volume. We are a trusted partner across the markets we serve and believe we have the #1 position in the U.S. prepaid debit market (which represents the fastest growing subset of the Financial Payment Card market in the United States), serving the top five U.S. Prepaid Debit Card program managers, a leading position in the U.S. large issuer market, serving the majority of the top 20 U.S. debit and credit card issuers, and the #1 position in the highly attractive U.S. small issuer market, which includes independent community banks and credit unions, driven by our strong relationships, capabilities and technologies. As a market leader, CPI has long-standing trust-based relationships with our key customers and often deep process and technology integration, particularly in the case of customers who utilize our card services and instant issuance systems and services. The solutions that we provide require strict data integrity, and generally card issuers are reluctant to switch away from trusted providers due to the requirements for high-security and access to highly-sensitive cardholder information. As a result, our customers are selective about the partners with which they work and typically seek out partners who have a well-established reputation for trust and quality and are able to meet their service requirements.
- •
- Well Positioned for EMV Conversion in the United
States. As a leading provider of integrated credit, debit and Prepaid Debit Card solutions in North America, we are well-positioned to
capitalize on the U.S. market conversion to EMV. We serve our customers through a network of nine production and card services facilities, including seven high-security facilities in North America
that are each certified by one or more of the Payment Card Brands (Visa, MasterCard, American Express and Discover), Interac (in Canada) and, where required by our customers, the PCI Security
Standards Council. We have made significant investments in our physical infrastructure and equipment platform to prepare for the EMV conversion including opening a dedicated EMV technology center in
Colorado for EMV production and personalization and significant information technology, human capital and equipment upgrades across our network of facilities.
- •
- Comprehensive End-to-End Card Solutions Drive Deep Customer Integration. The foundation of our strong market position is our comprehensive end-to-end Financial Payment Card solutions. Our solutions provide a full suite of products and card services required to produce, personalize and fulfill Financial Payment Cards, while maintaining the most stringent security requirements
We serve a diverse set of over 4,000 direct and indirect customers, including many of the largest North American issuers of debit and credit cards such as JPMorgan Chase, Bank of America, American Express and Wells Fargo, as well as the largest global managers of Prepaid Debit Card programs, including InComm, Green Dot, Blackhawk Network and American Express. We have long-standing relationships with our customers, many of whom we have served for decades and provide a differentiated level of service. We also maintain important relationships with the Payment Card Brands to ensure our facilities and processes consistently meet their standards.
6
- •
- Certified Network of North American High-Security
Facilities. Our seven high-security North American facilities are each certified by one or more of the Payment Card Brands and Interac
(in Canada), forming the largest certified production facility network in North America. The Payment Card Brand certifications allow us to produce cards bearing these brands and provide relevant card
services for our issuer customers. Additionally, many of our facilities are also certified by the PCI Security Standards Council and individually by customers. These certification processes are long,
complex and costly, and our facilities must comply with the strictest standards of security in order to obtain and retain this designation, which are regularly verified by both the Payment Card Brands
and our customers.
- •
- Industry Experience and Proprietary and Patented
Solutions. Over the course of our long operating history, we have developed extensive technological, engineering and operational
expertise that we believe has made us a leader in our industry for product and process know-how. We believe that our technological and operational know-how, combined with our specific focus on the
Financial Payment Card market, gives us a competitive advantage and fosters a culture of innovation. We have developed and acquired significant intellectual property over our operating history and
hold 18 U.S. patents, as well as 27 pending U.S. and foreign patent applications, on our Financial Payment Card solutions, including patents on our tamper-evident security packaging used by our
customers that have Prepaid Debit Card and instant issuance offerings. We also hold exclusive production rights to certain products the Company has developed as well as patented software solutions
such as our MYCA™ offering, which is integrated into the websites of over 300 card issuing banks and other customers.
- •
- Strong Management Team. We have built a strong management team led by Steven Montross, our CEO and President. Mr. Montross has led CPI for six years and under his leadership we have completed three strategic acquisitions and our EBITDA has grown more than three-fold. Our management team, which collectively has more than 140 years of experience in our industry, has established a track record of recognizing and capitalizing on growth opportunities across the markets we serve. Management identified and drove our expansion into Prepaid Debit Card services during the early market adoption period of this card product, which has grown at an estimated 11.8% CAGR since 2009. Similarly, our management team devised and executed on a strategy to develop our card services offering, which was accelerated by our acquisition of EFT Source. Today, we have a card services customer base of more than 3,200 financial institutions and an installed base of more than 3,400 Card@Once® instant issuance systems in U.S. bank branches.
of the Payment Card Brands. We are integral to many of our customers' card programs, pairing card production with an end-to-end offering of card data personalization and card services that are deeply integrated within our customers operations. We provide card data personalization services for more than 3,200 financial institutions and managers of Prepaid Debit Card programs that require extensive technology integration, such as secure data links to transfer highly sensitive cardholder information. Similarly, our installed base of more than 3,400 instant issuance systems at bank and credit union branches across the United States require comparable levels of customer integration, as our Card@Once® instant issuance system utilizes only our secure technology to instantly personalize cards. Certain customers have also integrated our proprietary software into their customer-facing websites to offer card design and customization to their cardholders. We believe that our comprehensive solution allows our customers to choose a single trusted partner to address their card program needs in a cost-effective manner instead of managing multiple suppliers across a complex value chain. We believe our customers choose and retain us for these critical functions, which typically require integrations that are costly and difficult to unwind, due to our reputation as a trusted partner, our high levels of service and proven execution.
7
Our Growth Strategy
The key components of our strategy include:
- •
- Capitalize on U.S. EMV Conversion. The conversion to the
EMV standard in the United States is expected to increase the size (measured in dollars) of the Financial Payment Card market (excluding services) from $180 million in 2013 to
$1.2 billion by 2019, driven primarily by the increasing levels of card fraud in the United States, the Payment Card Brands' coordinated EMV conversion plan, including the liability shift
scheduled for October 1, 2015, and the need for a single global interoperable standard of card acceptance. The conversion of Financial Payment Cards in the United States from magnetic stripe
technology to the EMV standard began in earnest in the second half of 2014 and is expected to continue over the next several years, with full adoption in the credit and bank debit card markets
expected to be largely complete by 2017 and increasing levels of adoption of Prepaid Debit Cards and Private Label Credit Cards beyond 2017. We believe the conversion to EMV, and subsequently the
expected further adoption of the more complex and higher priced Dual-Interface EMV cards, will increase the size (measured in dollars) of our estimated addressable card market by four times over the
next decade. In anticipation of the EMV conversion, we invested significantly in our network of facilities (the most extensive in North America), technological infrastructure and human capital
resources. We believe our comprehensive solutions offering and proven track record ideally positions us to be our customers' partner of choice to successfully complete the EMV conversion.
- •
- Capitalize on Growth in Prepaid Debit Market. According
to First Annapolis, the Prepaid Debit Card market has grown at an 11.8% CAGR from 2009 to 2014 and is expected to continue to grow at an 8.0% CAGR from 2014 to 2019 as consumers increase adoption and
additional issuers introduce new products. We believe we are well positioned to capitalize on this continued growth due to our market leading position, supported by our industry expertise and patents
and comprehensive end-to-end card solutions. We have driven our leading market position through trust-based relationships with the largest global managers of Prepaid Debit Card programs, including
InComm, Green Dot, Blackhawk Network and American Express. Additionally, we have further developed proprietary production techniques which provide us a cost advantage and additional flexibility to
meet customer demands.
- •
- Capitalize on Growth in Instant Issuance Systems and Services
Market. We acquired our instant card issuance system, Card@Once®, through the acquisition of EFT Source in 2014 and have
continued to drive significant growth in sales of our instant issuance systems and related services revenue. We plan to continue to grow our installed base of instant issuance systems in bank branches
across the U.S., which was more than 3,400 as of June 30, 2015, to increase our opportunity for continued recurring revenue streams from card personalization which is delivered through our
software as a service offering. We believe the U.S. market is in the early stages of instant issuance adoption as, according to First Annapolis, only approximately 20% of U.S. bank branches are
equipped with instant issuance solutions.
- •
- Cross-Sell Expanded Services Offering Across Customer Base. We believe our leading market position in card production in North America, combined with recent enhancements to our card services platform, including our acquisition of EFT Source, represents a significant opportunity to cross-sell services across our customer base by offering a comprehensive end-to-end card solution. According to First Annapolis, the dollar value of the U.S. market for outsourced personalization services for Financial Payment Cards is expected to grow from $417 million in 2014 to $604 million in 2019, representing a 7.7% CAGR, and we believe that focused selling efforts of our card services to our existing customers and as part of a complete end-to-end solution, and continued investment in proprietary card services, represents a substantial revenue opportunity and means to further deepen our existing customer relationships. Through our
8
- •
- Continued Execution on Strategic Acquisitions. We have a strong track record of acquiring and integrating complementary businesses, completing six acquisitions since 2008, all of which have enhanced our market share, capabilities and capacity. We expect to continue to opportunistically execute strategic acquisitions that give us access to new markets and capabilities while providing a reasonable value proposition to our stockholders.
strong track record in card services, including providing card data personalization services for more than 3,200 financial institutions and managers of Prepaid Debit Card programs and personalizing more than 130 million Financial Payment Cards in 2014, we believe we have established a reputation as a trusted partner and advisor to our customers with the ability to securely manage significant amounts of sensitive and confidential customer data throughout our network. Due to the high costs of failure, such as a data breach, we expect that customers will continue to choose trusted vendors such as CPI that can provide high levels of security, service and certainty to manage these critical functions.
Risks Associated with our Business
As part of your evaluation of our company, you should take into consideration the risks described under "Risk Factors," including the following risks that we face in implementing or executing on our growth strategies and maintaining our profitability:
- •
- material breaches in the security of our systems;
- •
- market acceptance of developing technologies that make Financial Payment Cards less relevant;
- •
- a slower or less widespread adoption of EMV technology in the United States than we anticipate;
- •
- difficulties in our production processes;
- •
- defects in our software;
- •
- our failure to meet the standards of security imposed by our customers and the organizations to which they belong;
- •
- extension of Financial Payment Card expiration cycles;
- •
- failure to identify, attract and retain new customers or a failure to maintain our relationships with our major customers;
- •
- our substantial indebtedness; and
- •
- infringement on our intellectual property rights, or claims that our technology is infringing on third-party intellectual property.
See "Risk Factors" beginning on page 18 of this prospectus.
Recent Developments
New Credit Facility
On August 17, 2015, we entered into a first lien credit agreement (the "New Credit Agreement") with a syndicate of lenders providing for a $40 million revolving credit facility (the "New Revolving Credit Facility") with a five year maturity and a $435 million first lien term loan facility (the "New Term Loan Facility" and, together with the New Revolving Credit Facility, the "New Credit Facility") with a seven year maturity. Interest rates under the New Credit Facility are based, at our election, on either a Eurodollar rate plus a margin of 4.50% or a base rate plus a margin of 3.50%. See "Description of Certain Indebtedness." Upon the closing of the New Credit Facility, we drew down the full amount of the New Term Loan Facility and used the net proceeds therefrom to repay
9
$142.1 million of existing indebtedness, effect the Partial Preferred Redemption as described below, and pay related transaction fees and expenses.
Preferred Stock Redemption
On August 17, 2015, we redeemed 62,140 shares of our outstanding preferred stock on a pro rata basis (the "Partial Preferred Redemption") using borrowings under the New Term Loan Facility, for which we are liable, together with cash on hand. In connection with the Partial Preferred Redemption, we paid an aggregate of $276.3 million in return of capital and accrued dividends to holders of our preferred stock, net of the repayment of certain employee loans. We expect to redeem the remaining 2,576 shares of outstanding preferred stock using approximately $11.8 million of the proceeds from this offering. We also expect to use $115.0 million of the proceeds from this offering to repay borrowings under the New Term Loan Facility incurred in connection with the Partial Preferred Redemption. See "Use of Proceeds."
Principal Equityholder
Tricor Pacific Capital Partners (Fund IV), Limited Partnership and Tricor Pacific Capital Partners (Fund IV) US, Limited Partnership (collectively, the "Tricor Funds"), both investment funds managed by an affiliate of Tricor Pacific Capital, Inc. ("Tricor"), currently collectively own approximately 90.9% of our outstanding preferred stock and 82.6% of our fully diluted common stock. Following this offering, all of our preferred stock will be redeemed, and the Tricor Funds will collectively own approximately 58.4% of our fully diluted common stock (assuming no exercise of the underwriters' option to purchase additional shares). Tricor is a private equity firm with offices in Lake Forest, Illinois and Vancouver, British Columbia that has managed over $1.2 billion of investor capital to date. Since its founding in 1996, Tricor's investment funds have invested in the United States and Canada across a broad spectrum of industries, including the specialty manufacturing, business services and value-added distribution sectors.
JOBS Act
We are an "emerging growth company," as defined in the Jumpstart Our Business Startups Act of 2012. We will remain an emerging growth company until the earlier to occur of (1) the last day of the fiscal year (a) following the fifth anniversary of the completion of this offering, (b) in which we have total annual gross revenue of at least $1.0 billion or (c) in which we become a large accelerated filer, which means that we have been public for at least 12 months, have filed at least one annual report and the market value of our common stock that is held by non-affiliates exceeds $700 million as of the last day of our then most recently completed second fiscal quarter and (2) the date on which we have issued more than $1.0 billion in non-convertible debt during the prior three-year period. We refer to the Jumpstart Our Business Startups Act of 2012 as the "JOBS Act," and references to "emerging growth company" have the meaning given to such term in the JOBS Act.
An emerging growth company may take advantage of specified exemptions from various requirements that are otherwise generally applicable to public companies in the United States. These provisions include:
- •
- an exemption to include in an initial public offering registration statement less than five years of selected financial data; and
- •
- an exemption from the auditor attestation requirement in the assessment of the emerging growth company's internal control over financial reporting.
We have availed ourselves in this prospectus of the reduced reporting requirements described above with respect to selected financial data. As a result, the information that we are providing to you may be less comprehensive than what you might receive from other public companies.
10
In addition, the JOBS Act provides that an emerging growth company may delay adopting new or revised accounting standards until such time as those standards apply to private companies. We have irrevocably elected not to avail ourselves of this exemption and, therefore, we will be subject to the same new or revised accounting standards as other public companies that are not emerging growth companies.
Corporate Information
CPI Card Group Inc. is a Delaware corporation. We were initially formed as CPI Holdings I, Inc. in June 2007 and changed our name to CPI Card Group Inc. in August 2015. Our principal executive offices are located at 10368 West Centennial Road, Littleton, CO 80127, and our telephone number is (303) 973-9311. Our website is www.cpicardgroup.com. Information contained on our website is not incorporated by reference into this prospectus, and such information should not be considered to be part of this prospectus.
11
Common stock offered by us |
12,216,000 shares | |
Common stock offered by the selling stockholders |
3,784,000 shares |
|
Common stock to be outstanding after this offering |
53,692,116 shares |
|
Underwriters' option to purchase additional shares |
The selling stockholders have granted the underwriters an option to purchase up to 2,400,000 additional shares of common stock within 30 days of the closing date of this offering. See "Underwriting." |
|
Use of proceeds |
We estimate that our net proceeds from the sale of the common stock that we are offering will be approximately $140.1 million, assuming an initial public offering price of $12.50 per share, which is the midpoint of the price range set forth on the cover page of this prospectus, after deducting estimated underwriting discounts and commissions and estimated offering expenses payable by us. We will not receive any proceeds from the sale of common stock by the selling stockholders. |
|
|
We intend to use the net proceeds from this offering to redeem the remaining outstanding shares of our preferred stock, to terminate our phantom stock plan and to satisfy all liabilities due thereunder and to repay outstanding indebtedness under our New Credit Facility incurred in connection with the Partial Preferred Redemption. See "Use of Proceeds." |
|
Dividend Policy |
Following the consummation of this offering, we expect to pay quarterly cash dividends on our common stock beginning in the first quarter of 2016 in an initial amount of approximately $0.05 per share, subject to the sole discretion of our board of directors. |
|
|
Future cash dividends, if any, will be at the discretion of our board of directors and the amount of cash dividends per share will depend upon, among other things, our future operations and earnings, capital requirements and surplus, general financial condition, contractual restrictions, number of shares of common stock outstanding and other factors our board of directors may deem relevant. In addition, because we are a holding company, we are dependent on loans, dividends and other payments from our operating subsidiaries to generate the funds necessary to pay dividends on our common stock. We may be restricted from paying cash dividends on our common stock in certain circumstances, including by the covenants in our New Credit Facility, and may be further restricted by the terms of future debt or preferred securities. See "Dividend Policy." |
|
|
12
Exchange Listing |
It is a condition to the completion of this offering that our common stock be listed on the NASDAQ Global Select Market and the Toronto Stock Exchange (the "TSX"). We have applied to list our common stock on the NASDAQ Global Select Market under the symbol "PMTS." We have been conditionally approved to list our common stock on the TSX under the symbol "PNT." Listing on the TSX will be subject to our fulfilling all of the listing requirements of the TSX. |
|
Risk Factors |
You should read the "Risk Factors" section of this prospectus for a discussion of facts to consider carefully before deciding to invest in shares of our common stock. |
Unless otherwise indicated, all information in this prospectus relating to the number of shares of common stock:
- •
- assumes no exercise by the underwriters of their option to purchase up to 2,400,000 additional shares from us;
- •
- excludes 528,000 shares of common stock issuable upon exercise of options to purchase shares outstanding as of
September 1, 2015 under the CPI Holdings I, Inc. Amended and Restated 2007 Stock Option Plan (the "Option Plan") at a weighted average exercise price of $0.0003 per share;
- •
- excludes an aggregate of 4,000,000 shares of our common stock reserved for issuance under the CPI Card Group Inc. Omnibus
Incentive Plan that we intend to adopt in connection with this offering (the "Omnibus Plan"), including 770,450 shares of our common stock underlying stock options to be issued in connection
with this offering. See "Executive Compensation—IPO Stock Option Grants."; and
- •
- gives effect to the 22-for-1 stock split effected on September 3, 2015.
13
SUMMARY CONSOLIDATED HISTORICAL FINANCIAL DATA
The following tables set forth our summary consolidated historical financial data. You should read the information set forth below in conjunction with "Use of Proceeds," "Capitalization," "Management's Discussion and Analysis of Financial Condition and Results of Operations" and the consolidated historical financial statements and notes thereto of CPI included elsewhere in this prospectus. The historical statements of income data for the years ended December 31, 2014, 2013 and 2012 and the balance sheet data as of December 31, 2014 and 2013 are derived from our audited consolidated financial statements included elsewhere in this prospectus. The historical statements of income data for the six months ended June 30, 2015 and 2014 and the balance sheet data as of June 30, 2015 are derived from our unaudited condensed consolidated financial statements included elsewhere in this prospectus. Results of interim periods are not necessarily indicative of the results expected for a full year or for future periods. The historical statement of income data for the twelve months ended June 30, 2015 are derived by adding data from our audited statement of income for the year ended December 31, 2014 to data from our unaudited statement of income for the six months ended June 30, 2015 and subtracting data from our unaudited statement of income for the six months ended June 30, 2014. Results for the twelve months ended June 30, 2015 include ten months of results from EFT Source, which we acquired in September 2014. See "Index to Consolidated Financial Statements."
14
| |
Six Months Ended June 30, |
|
|
|
|
||||||||||||||
|---|---|---|---|---|---|---|---|---|---|---|---|---|---|---|---|---|---|---|---|
| |
Twelve Months Ended June 30, 2015 |
Year Ended December 31, | |||||||||||||||||
Statement of Income Data:
|
2015 | 2014 | 2014 | 2013 | 2012 | ||||||||||||||
| |
(unaudited) |
(unaudited) |
|
|
|
||||||||||||||
| |
(in thousands except share and per share data) |
||||||||||||||||||
Net sales |
|||||||||||||||||||
Products |
$ | 112,771 | $ | 58,905 | $ | 213,086 | $ | 159,220 | $ | 101,360 | $ | 98,969 | |||||||
Services |
60,075 | 36,862 | 124,999 | 101,786 | 95,010 | 84,817 | |||||||||||||
| | | | | | | | | | | | | | | | | | | | |
Total net sales |
172,846 | 95,767 | 338,085 | 261,006 | 196,370 | 183,786 | |||||||||||||
Cost of sales |
111,503 | 69,969 | 220,813 | 179,279 | 136,874 | 130,897 | |||||||||||||
| | | | | | | | | | | | | | | | | | | | |
Gross profit |
61,343 | 25,798 | 117,272 | 81,727 | 59,496 | 52,889 | |||||||||||||
Operating expenses |
29,959 | 16,262 | 60,952 | 47,255 | 33,347 | 32,985 | |||||||||||||
| | | | | | | | | | | | | | | | | | | | |
Income from operations |
31,384 | 9,536 | 56,320 | 34,472 | 26,149 | 19,904 | |||||||||||||
Other income (expense) |
|||||||||||||||||||
Interest, net |
(3,505 | ) | (3,444 | ) | (7,569 | ) | (7,508 | ) | (7,838 | ) | (5,765 | ) | |||||||
Foreign currency gain (loss) |
149 | (211 | ) | 236 | (124 | ) | (142 | ) | (279 | ) | |||||||||
Loss on debt modification and early extinguishment |
— | — | (476 | ) | (476 | ) | — | — | |||||||||||
Gain on purchase of ID Data |
— | — | — | — | — | 604 | |||||||||||||
Other income (expense) |
61 | 19 | (59 | ) | (101 | ) | 18 | 171 | |||||||||||
| | | | | | | | | | | | | | | | | | | | |
Income before income taxes |
28,089 | 5,900 | 48,452 | 26,263 | 18,187 | 14,635 | |||||||||||||
Provision for income taxes |
(9,974 | ) | (2,334 | ) | (17,931 | ) | (10,291 | ) | (6,988 | ) | (5,909 | ) | |||||||
| | | | | | | | | | | | | | | | | | | | |
Net income from continuing operations |
18,115 | 3,566 | 30,521 | 15,972 | 11,199 | 8,726 | |||||||||||||
Loss from discontinued operations, net of taxes(1) |
(606 | ) | (2,763 | ) | (513 | ) | (2,670 | ) | (2,612 | ) | (3,796 | ) | |||||||
Gain on sale of discontinued operation, net of taxes(1) |
887 | — | 887 | — | — | — | |||||||||||||
| | | | | | | | | | | | | | | | | | | | |
Net income |
$ | 18,396 | $ | 803 | $ | 30,895 | $ | 13,302 | $ | 8,587 | $ | 4,930 | |||||||
| | | | | | | | | | | | | | | | | | | | |
| | | | | | | | | | | | | | | | | | | | |
| | | | | | | | | | | | | | | | | | | | |
Net income (loss) per share:(2) |
|||||||||||||||||||
Basic and Diluted—Continuing Operations |
$ | (0.18 | ) | $ | (0.42 | ) | $ | (0.45 | ) | $ | (0.69 | ) | $ | (0.59 | ) | $ | (0.67 | ) | |
Basic and Diluted—Discontinued Operations |
0.01 | (0.07 | ) | 0.01 | (0.07 | ) | (0.06 | ) | (0.09 | ) | |||||||||
| | | | | | | | | | | | | | | | | | | | |
Total |
$ | (0.17 | ) | $ | (0.49 | ) | $ | (0.44 | ) | $ | (0.76 | ) | $ | (0.65 | ) | $ | (0.76 | ) | |
| | | | | | | | | | | | | | | | | | | | |
| | | | | | | | | | | | | | | | | | | | |
| | | | | | | | | | | | | | | | | | | | |
Weighted average shares outstanding: |
|||||||||||||||||||
Basic and Diluted |
41,312,854 | 41,113,952 | 41,297,872 | 41,199,246 | 41,072,350 | 41,264,828 | |||||||||||||
Other Financial Data: |
|||||||||||||||||||
Depreciation and amortization |
$ | 8,040 | $ | 5,614 | $ | 15,678 | $ | 13,252 | $ | 11,595 | $ | 10,514 | |||||||
Capital expenditures |
10,390 | 6,578 | 19,380 | 15,568 | 10,628 | 9,113 | |||||||||||||
EBITDA(3) |
39,634 | 14,958 | 71,699 | 47,023 | 37,620 | 30,914 | |||||||||||||
Adjusted EBITDA(3) |
41,897 | 14,577 | 81,538 | 54,219 | 38,372 | 30,589 | |||||||||||||
| |
|
|
As Further Adjusted(5) |
|
|
|||||||||||
|---|---|---|---|---|---|---|---|---|---|---|---|---|---|---|---|---|
| |
|
As Adjusted(4) | |
|
||||||||||||
| |
|
As of December 31, | ||||||||||||||
| |
As of June 30, 2015 |
As of June 30, 2015 |
As of June 30, 2015 |
|||||||||||||
Consolidated Balance Sheet Data:
|
2014 | 2013 | ||||||||||||||
| |
(unaudited) |
(unaudited) |
(unaudited) |
|
|
|||||||||||
| |
(in thousands) |
|||||||||||||||
Total current assets |
$ | 107,808 | $ | 90,532 | $ | 91,423 | $ | 88,719 | $ | 65,958 | ||||||
Net property, equipment and leasehold improvements |
48,431 | 48,431 | 48,431 | 44,772 | 36,650 | |||||||||||
Total assets |
287,784 | 287,716 | 283,268 | 266,624 | 171,867 | |||||||||||
Total debt |
167,420 | 444,000 | 329,000 | 179,424 | 122,306 | |||||||||||
Total stockholders' deficit |
(3,690 | ) | (224,762 | ) | (105,261 | ) | (21,694 | ) | (36,896 | ) | ||||||
15
| |
Six Months Ended June 30, |
Twelve Months Ended June 30, 2015 |
|
|
|
||||||||||||||
|---|---|---|---|---|---|---|---|---|---|---|---|---|---|---|---|---|---|---|---|
| |
Year Ended December 31, | ||||||||||||||||||
Other Data:
|
2015 | 2014 | 2014 | 2013 | 2012 | ||||||||||||||
| |
(in thousands) |
||||||||||||||||||
Financial Payment Card Shipments |
|||||||||||||||||||
EMV |
75,164 | 13,921 | 125,088 | 63,845 | 6,769 | 5,015 | |||||||||||||
Non-EMV |
111,240 | 157,018 | 251,607 | 297,385 | 297,862 | 323,817 | |||||||||||||
| | | | | | | | | | | | | | | | | | | | |
Total |
186,404 | 170,939 | 376,695 | 361,230 | 304,631 | 328,832 | |||||||||||||
| | | | | | | | | | | | | | | | | | | | |
| | | | | | | | | | | | | | | | | | | | |
| | | | | | | | | | | | | | | | | | | | |
- (1)
- We
sold our operating segment located in Nevada in January 2015. This operating segment primarily produced retail gift cards that are not
issued on the networks of the Payment Card Brands. Accordingly, our consolidated balance sheets, statements of operations and comprehensive income (loss), and statements of cash flows have been
reclassified to present this operating segment as a discontinued operation as of and for the years ended December 31, 2014, 2013 and 2012 and the six months ended June 30, 2015 and 2014.
See Note 4 (Discontinued Operation and Disposition) to our audited consolidated financial statements and Note 3 (Discontinued Operation and Disposition) to our unaudited condensed
consolidated financial statements, each appearing elsewhere in this prospectus.
- (2)
- For
a computation of historical basic and diluted earnings per share attributable to continuing and discontinued operations, see
Note 14 (Earnings per Share) to our audited consolidated financial statements and Note 13 (Earnings per Share) to our unaudited condensed consolidated financial statements, each appearing
elsewhere in this prospectus.
- (3)
- EBITDA is defined as income from continuing operations before interest expense, income taxes, depreciation and amortization. Adjusted EBITDA is defined as EBITDA plus adjustments for foreign currency gain or loss, loss on debt modification and early extinguishment, gain on purchase of ID Data, non-cash compensation expense related to our phantom stock plan that will be terminated in connection with this offering, performance bonuses in connection with the EFT Source acquisition and investment banking and related fees. EBITDA and Adjusted EBITDA are non-GAAP financial measures that do not have any standardized meaning prescribed by GAAP and are therefore unlikely to be comparable to similar measures presented by other issuers. EBITDA and Adjusted EBITDA (collectively, the "Non-GAAP Financial Measures") are the primary measures used by our management to evaluate operating performance. We believe the Non-GAAP Financial Measures are useful to investors because they provide a means to evaluate our operating performance on an ongoing basis using criteria that are used by our internal decision makers and because they are frequently used by investors and other interested parties when comparing companies in our industry that have different financing and capital structures and/or tax rates. We believe the Non-GAAP Financial Measures are meaningful measures because they present a transparent view of our recurring operating performance and allow management to readily view operating trends, perform analytical comparisons and identify strategies to improve operating performance. The Non-GAAP Financial Measures, however, are not measures of our liquidity or financial performance under GAAP and should not be considered as an alternative to net income (loss), income (loss) from operations, or any other performance measure derived in accordance with GAAP or as an alternative to cash flow from operating activities as a measure of our liquidity. The use of the Non-GAAP Financial Measures instead of net income (loss) has limitations as an analytical tool, including the inability to determine profitability; the exclusion of interest expense, interest income and associated significant cash requirements; and the exclusion of depreciation and amortization, which represent unavoidable operating costs. The Non-GAAP Financial Measures are not necessarily
16
comparable to other similarly titled captions of other companies due to potential inconsistencies in the methods of calculation.
- The following is a reconciliation of net income from continuing operations to EBITDA and Adjusted EBITDA:
| |
Six Months Ended June 30, |
|
|
|
|
||||||||||||||
|---|---|---|---|---|---|---|---|---|---|---|---|---|---|---|---|---|---|---|---|
| |
Twelve Months Ended June 30, 2015 |
Year Ended December 31, | |||||||||||||||||
| |
2015 | 2014 | 2014 | 2013 | 2012 | ||||||||||||||
| |
(in thousands) |
||||||||||||||||||
Net income from continuing operations |
$ | 18,115 | $ | 3,566 | $ | 30,521 | $ | 15,972 | $ | 11,199 | $ | 8,726 | |||||||
Depreciation and amortization |
8,040 | 5,614 | 15,678 | 13,252 | 11,595 | 10,514 | |||||||||||||
Interest, net |
3,505 | 3,444 | 7,569 | 7,508 | 7,838 | 5,765 | |||||||||||||
Provision for income taxes |
9,974 | 2,334 | 17,931 | 10,291 | 6,988 | 5,909 | |||||||||||||
| | | | | | | | | | | | | | | | | | | | |
EBITDA |
$ | 39,634 | $ | 14,958 | $ | 71,699 | $ | 47,023 | $ | 37,620 | $ | 30,914 | |||||||
Foreign currency (gain) loss |
(149 | ) | 211 | (236 | ) | 124 | 142 | 279 | |||||||||||
Loss on debt modification and early extinguishment(a) |
— | — | 476 | 476 | — | — | |||||||||||||
Gain on purchase of ID Data(b) |
— | — | — | — | — | (604 | ) | ||||||||||||
Non-cash compensation expense(c) |
1,503 | (591 | ) | 6,628 | 4,534 | 610 | — | ||||||||||||
EFT Source performance bonuses(d) |
500 | — | 500 | — | — | — | |||||||||||||
Investment banking and related fees(e) |
409 | — | 2,471 | 2,062 | — | — | |||||||||||||
| | | | | | | | | | | | | | | | | | | | |
Adjusted EBITDA |
$ | 41,897 | $ | 14,577 | $ | 81,538 | $ | 54,219 | $ | 38,372 | $ | 30,589 | |||||||
| | | | | | | | | | | | | | | | | | | | |
| | | | | | | | | | | | | | | | | | | | |
| | | | | | | | | | | | | | | | | | | | |
- (a)
- Represents
loss on the modification of our indebtedness in connection with the acquisition of EFT Source.
- (b)
- Represents
gain on our purchase of certain assets of ID Data, Limited.
- (c)
- Represents
compensation expense incurred in connection with our phantom stock plan. See "Management's Discussion and Analysis of Financial
Condition and Results of Operations—Critical Accounting Policies and Estimates—Phantom Stock Plan" and "Executive Compensation—CPI Acquisition, Inc. Phantom Stock
Plan."
- (d)
- Represents
performance bonuses earned in connection with the acquisition of EFT Source.
- (e)
- Includes investment banking, advisory and related professional fees and expenses incurred in connection with the EFT Source acquisition and our consideration of liquidity alternatives.
- (4)
- The
as adjusted balance sheet data gives effect to our entering into the New Credit Agreement, repaying borrowings under our previously
outstanding term loan facility and completing the Partial Preferred Redemption. See "Prospectus Summary—Preferred Stock Redemption."
- (5)
- The as further adjusted balance sheet data gives further effect to (i) the issuance of 12,216,000 shares of common stock in this offering and (ii) our application of the estimated net proceeds from the sale of shares of common stock offered by us in this offering at an assumed initial public offering price of $12.50 per share, the midpoint of the price range set forth on the cover of this prospectus, after deducting the estimated underwriting discounts and commissions and estimated offering expenses payable by us. See "Use of Proceeds." The as further adjusted information discussed above is illustrative only and will change based on the actual initial public offering price and other terms of this offering.
17
An investment in our common stock involves a high degree of risk and many uncertainties. You should carefully consider the specific factors listed below together with the other information included in this prospectus before purchasing our common stock in this offering. If any of the possibilities described as risks below actually occurs, our operating results and financial condition would likely suffer and the trading price of our common stock could fall, causing you to lose some or all of your investment. The following is a description of what we consider the key challenges and material risks to our business and an investment in our common stock.
Risks Related to Our Business
Material breaches in the security of our systems may have a significant effect on our business.
The reliability and security of our information technology (IT) infrastructure and our ability to protect sensitive and confidential information for our customers, which include many financial institutions, is critical to our business. Our handling of sensitive cardholder data, including cardholder names, account numbers and similar information, makes us a potential target of cyber attacks and threats to our secure IT systems. We may face attempts by others to penetrate our computer systems and networks to misappropriate this information or interrupt our business. Any system or network disruption could result in a loss of our intellectual property, the release of sensitive cardholder information, customer or employee personal data, or the loss of production capabilities at one or more of our production facilities. The protective measures we have in place may not prevent system or network disruptions and may be insufficient to prevent or limit the damage from any future security breaches.
In addition, our encryption systems are at risk of being breached or decoded. Smart cards are equipped with keys that encrypt and decode messages in order to secure transactions and maintain the confidentiality of data. The security afforded by this technology depends on the integrity of the encryption keys and the complexity of the algorithms used to encrypt and decode information. Any significant advances in technology that enable the breach of cryptographic systems, malicious software infiltration or allow for the exploitation of weaknesses in such systems, could result in a decline in the security we are able to provide through this technology. Any material breach of our secured systems could harm our competitive position, result in a loss of customer trust and confidence, and cause us to incur significant costs to remedy the damages caused by system or network disruptions, whether caused by cyber attacks, security breaches or otherwise, which could ultimately have an adverse effect on our business, financial condition and results of operations. In addition, as these threats continue to evolve, we may be required to invest significant additional resources to modify and enhance our information security and controls or to investigate and remediate any security vulnerabilities.
New and developing technology solutions and products could make our existing technology solutions and products obsolete or irrelevant, and if we are unable to introduce new products and services in a timely manner, our business could be adversely affected.
The markets for our products and services are subject to technological changes, frequent introductions of new products and services and evolving industry standards. In particular, the rise in the adoption in wireless payment systems or mobile payments may make physical cards less attractive as a method of payment. Although to date we have not seen any reduction in card-based payments resulting from the emergence of mobile payment applications, mobile payments offer consumers an alternative method to make purchases without the need to carry a physical card and could, if widely adopted, reduce the number of Financial Payment Cards issued to consumers. In addition, other new and developing technology solutions and products could make our existing technology solutions and products obsolete or irrelevant.
18
Our ability to enhance our current products and services and to develop and introduce innovative products and services that address the increasingly sophisticated needs of our customers will significantly affect our future success. We may not be successful in developing, marketing or selling new products and services that meet these changing demands. In addition, we may experience difficulties that could delay or prevent the successful development, introduction or marketing of these services, or our new services and enhancements may not adequately meet the demands of the marketplace or achieve market acceptance. We continually engage in significant efforts to innovate and upgrade our products and services. If we are unsuccessful in completing or gaining market acceptance of new products, services and technologies, it would likely have a material adverse effect on our ability to retain existing customers or attract new ones.
Our ability to develop and deliver new products and services successfully will depend on various factors, including our ability to:
- •
- identify and capitalize upon opportunities in new and emerging geographical and product markets effectively;
- •
- invest resources in innovation and research and development;
- •
- complete and introduce new products and integrated services solutions in a timely manner;
- •
- license any required third-party technology or intellectual property rights;
- •
- qualify for and obtain required industry certification for our products; and
- •
- comply with applicable data protection regulations.
Opportunities to bundle or package products and service offerings and the ability to cross-sell products and services are critical to remaining competitive in our industry. As a result, part of our business strategy is to develop new products and services that may be used in conjunction with or in addition to our existing offerings. If we are unable to identify adequate opportunities to cross-sell our products and services, our financial condition could be negatively impacted. Furthermore, if we are unable to develop and introduce new and innovative products in a cost-effective and timely manner, our product and service offerings could be rendered obsolete, which could have an adverse effect on our business, financial condition and results of operations.
The adoption of EMV technology and dual-interface capability in the United States may not be as rapid or widespread as we anticipate, which could adversely affect our growth.
We have made significant investments in our North American EMV production capabilities. In particular, in 2014, we opened a 50,000 square foot technology center in Colorado dedicated to EMV production and personalization and enhanced our EMV capabilities across our network. Our ability to grow depends significantly on whether U.S. card issuing banks incorporate EMV technology as part of their new technological standards and, following the initial conversion to EMV, whether such banks issue Dual-Interface EMV cards. Banks may be delayed in transitioning to the issuance of EMV cards or Dual-Interface EMV cards due to increased costs and other factors. If these entities do not continue to deploy EMV and Dual-Interface EMV technology or deploy such technology less quickly and/or completely than we expect, the consequence could have an adverse effect on our business, financial condition and results of operations.
Our business could suffer from production problems.
We produce our products using processes that are highly complex, require advanced and costly equipment and must continually be modified to improve yields and performance. Difficulties in the production process can reduce yields or interrupt production and, as a result of such problems, we may on occasion not be able to deliver products or do so in a timely or cost-effective manner. As the complexity of both our products and our technological processes has become more advanced,
19
production tolerances have been reduced and requirements for precision have become more demanding. We may suffer disruptions in our production, either due to production difficulties, such as machinery or technology failures, or as a result of external factors beyond our control, such as interruption of our electrical service or a natural disaster. Any such event could have an adverse effect on our business, financial condition and results of operations.
We may experience software defects, which could harm our business and reputation and expose us to potential liability.
Our services are based on sophisticated software and computing systems, and the software underlying our services may contain undetected errors or defects when first introduced or when new versions are released. In addition, we may experience difficulties in installing or integrating our technology on systems used by our clients. Defects in our software, errors or delays in the processing of electronic transactions or other difficulties could result in the interruption of business operations, delays in market acceptance, additional development and remediation costs, diversion of technical and other resources, loss of clients, negative publicity or exposure to liability claims. Although we attempt to limit our potential liability through disclaimers and limitation of liability provisions in our license and client agreements, we cannot be certain that these measures will successfully limit our liability.
Our failure to operate our business in accordance with the standards of the PCI Security Standards Council or other industry standards applicable to our customers, such as Payment Card Brand certification standards, could have a material adverse effect on our business.
Many of our customers issue their cards on the networks of the Payment Card Brands that are subject to the standards of the PCI Security Standards Council or other standards and criteria relating to service providers' and manufacturers' facilities, products and physical and logical security which we must satisfy in order to be eligible to supply products and services to these customers. Most of our contractual arrangements with our customers may be terminated if we fail to comply with these standards and criteria.
We make significant investments to our network of seven North American and one European high-security facilities in order to meet these standards and criteria, including investments required to satisfy changes adopted from time to time in their respective standards and criteria. Further investments may be costly, and if we are unable to continue to meet these standards and criteria, we may become ineligible to provide products and services that have constituted in the past an important part of our revenues and profitability. For the year ended December 31, 2014, the vast majority of the products we produced and services we provided were subject to certification with one or more of the Payment Card Brands. If we were to lose our certification from one or more of the Payment Card Brands, Interac (in Canada) or PCI certification for one or more of our facilities, we may lose the ability to produce cards for or provide services to banks issuing credit or debit cards on the networks of the Payment Card Brands. If we are not able to produce cards for or provide services to any or all of the issuers issuing debit or credit cards on such networks, we could lose a substantial number of our customers and our financial condition and results of operations would be adversely affected.
The continued adoption of EMV technology may cause our customers to extend their expiration cycles, which could reduce the volume of cards they purchase from us.
We estimate that, on average, bank debit cards and general purpose credit cards have historically been renewed every three years due to fixed expiration dates, and this regular renewal cycle is a significant driver of demand for Financial Payment Cards. As card issuers continue to adopt EMV technology, First Annapolis estimates that certain issuers of bank debit cards and general purpose credit cards will extend the length of time that each card may be active prior to expiration from three years to four or five years in order to reduce the costs associated with issuing more expensive EMV cards. As a result of this longer reissuance cycle, we may experience a decreased demand for bank
20
debit cards and general purpose credit cards. If the reissuance cycle is significantly extended beyond historical averages, demand from our customers for our products may decrease significantly and our business, financial condition and results of operations could be materially and adversely affected.
Demand for credit cards may be adversely impacted by U.S. and global market and economic conditions.
For the foreseeable future, we expect to continue to derive most of our revenue from products and services we provide to the financial services industry. Given this concentration, we are exposed to the economic conditions affecting the financial services industry in North America and Europe. In particular, prolonged economic downturns typically have resulted in significant reductions in the demand for general purpose credit cards due to tightening credit conditions. A prolonged poor economic environment could result in significant decreases in demand by current and potential customers for our products and services, which could have a material adverse effect on our business, results of operations and financial condition.
Failure to identify, attract and retain new customers or a failure to maintain our relationships with our major customers could adversely affect our business.
Our business is dependent upon our ability to identify, attract and retain new customers and to maintain our relationships with our existing customers. A decline in the business of our large customers or a failure to retain such customers may adversely affect our business, financial condition and results of operations.
A substantial portion of our net sales is derived from several large customers. Our top five customers as of December 31, 2014 accounted for approximately 33.9% of our pro forma net sales (37.8% of our reported net sales) for the year ended December 31, 2014, and our top customer accounted for approximately 10.1% of our pro forma net sales (11.3% of our reported net sales) for the same period. Our continued business relationship with these customers, and the renewal of key contracts by major customers, may be impacted by several factors beyond our control, including more attractive product offerings from our competitors, pricing pressures or the financial health of these customers. Many of our key customers operate in competitive businesses, and their demand and market positions may vary considerably. These customers depend on favorable macroeconomic conditions and are impacted by the availability of affordable credit and capital, the level and volatility of interest rates, inflation, employment levels and consumer confidence, among other factors.
With most of our key customers, we enter into long-term master agreements that govern the general terms and conditions of our commercial relationships. We then enter into purchase order or other short-term agreements that define the prices and the quantities of products to be delivered. Usually, our contractual arrangements include neither exclusivity clauses nor commitments from our customers to order any given quantities of products on a medium-term or longer basis.
Therefore, we may not be able to maintain our market share with our key customers, which in turn could affect the revenue streams upon which we currently rely. Furthermore, there is no guarantee that we will be able to renew or win significant contracts in a given year. If we were to lose important programs for our products with any of our key customers, or if any key customer were to reduce or change its contract, seek alternate suppliers, increase its product returns or become unable or otherwise fail to meet its payment obligations, our business, financial condition and results of operations could be materially adversely affected.
Our outstanding indebtedness may impact our business and may restrict our growth and results of operations.
As of August 17, 2015, we had $444.0 million of total indebtedness outstanding, including $435.0 million outstanding under our New Term Loan Facility. See "Management's Discussion and Analysis of Financial Condition and Results of Operations—Liquidity and Capital Resources" and "Description of Certain Indebtedness."
21
We may incur additional indebtedness in the future to help fund the growth of our business, subject to market and other conditions. Our substantial indebtedness and interest expense could have important consequences to us, including:
- •
- limiting our ability to use a substantial portion of our cash flow from operations in other areas of our business, including for
working capital, capital expenditures and other general business activities, because we must dedicate a substantial portion of these funds to service our debt;
- •
- requiring us to seek to incur further indebtedness in order to make the capital expenditures and other expenses or investments planned
by us to the extent our future cash flows are insufficient;
- •
- limiting our ability to obtain additional financing in the future for working capital, capital expenditures, debt service
requirements, acquisitions and the execution of our growth strategy, and other expenses or investments planned by us;
- •
- limiting our flexibility and our ability to capitalize on business opportunities and to react to competitive pressures and adverse
changes in government regulation, our business and our industry;
- •
- limiting our ability to satisfy our obligations under our indebtedness (which could result in an event of default and acceleration if
we fail to comply with the requirements of our indebtedness);
- •
- increasing our vulnerability to a downturn in our business and to adverse economic and industry conditions generally;
- •
- placing us at a competitive disadvantage as compared to our competitors that are less leveraged; and
- •
- limiting our ability, or increasing the costs, to refinance indebtedness.
The limitations described above could have a material adverse effect on our business, financial condition, results of operations, prospects, and ability to satisfy our obligations under our indebtedness.
We may be required to defend against alleged infringement of the intellectual property rights of others and/or may be unable to adequately protect or enforce our own intellectual property rights.
Companies in our industry aggressively protect and pursue their intellectual property rights. Our products may contain technology provided to us by other parties such as suppliers or customers. We may have little or no ability to determine in advance whether such technology infringes the intellectual property rights of a third party. From time to time, we receive notices that claim we have infringed upon, misappropriated or misused other parties' proprietary rights. Additionally, we receive notices that challenge the validity of our patents. Intellectual property litigation can be expensive, time consuming and distracting to management. An adverse determination in any of these types of disputes could prevent us from producing or offering some of our products and services or could prevent us from enforcing our intellectual property rights. Furthermore, settlements can involve royalty or other payments that could reduce our profit margins and adversely affect our financial results. Our suppliers, customers and licensors may not be required to indemnify us in the event that a claim of infringement is asserted against us, or they may be required to indemnify us only up to a maximum amount, above which we would be responsible for any further costs or damages. Any of these claims or litigation may materially and adversely affect our business, financial condition and results of operations.
We may also be required to indemnify some customers and strategic partners under our agreements if a third party alleges or if a court finds that our products or activities have infringed upon, misappropriated or misused another party's proprietary rights. Indemnification provisions may, in some circumstances, extend our liability beyond the products we provide and may include consequential damages and/or lost profits. Even if claims or litigation against us are not valid or successfully asserted,
22
these claims could result in significant costs and the diversion of the attention of management and other key employees to defend.
Furthermore, our success and future revenue growth will depend, in part, on our ability to protect our intellectual property. We depend significantly on patents and other intellectual property rights to protect our products, proprietary designs and technological processes against misappropriation by others. We may in the future have difficulty obtaining patents and other intellectual property protection, and the patents and intellectual property rights that we receive may be insufficient to provide us with meaningful protection or commercial advantage. Effective patent, trademark, service mark, copyright and trade secret protection may not be available in every country in which our services are made available. It is possible that competitors or other unauthorized third parties may obtain, copy, use or disclose our technologies and processes, or confidential employee, customer or supplier data. Any of our existing or future patents may be challenged, invalidated or circumvented. We engage in litigation to enforce or defend our intellectual property rights, protect our trade secrets and determine the validity and scope of the proprietary rights of others, including our customers. We also enter into confidentiality agreements with our consultants and strategic partners and control access to and distribution of our technologies, documentation and other proprietary information; however, such agreements may not be enforceable or provide us with an adequate remedy. Despite these efforts, internal or external parties may attempt to copy, disclose, obtain or use our products, services or technology without our authorization. If we cannot adequately protect our technology, our competitors may be able to offer certain products and/or services similar to ours.
Our software may be derived from open source software, which is generally made available to the public by its authors and/or other third parties. Open source software is often made available under licenses, which impose certain obligations in the event we distribute derivative works of the open source software. These obligations may require us to make source code for the derivative works available to the public and/or license such derivative works on terms different from those customarily used to protect our intellectual property. With respect to our proprietary software, we generally license such software under terms that prohibit combining it with open source software. Despite these restrictions, parties may combine our proprietary software with open source software without our authorization, in which case we might nonetheless be required to release the source code of our proprietary software. In addition to risks related to license requirements, usage of open source software can lead to greater risks than the use of third-party commercial software, as open source licensors generally do not provide warranties, controls on the origin or development of the software, or remedies against the licensors. Many of the risks associated with usage of open source software cannot be eliminated and could adversely affect our business.
Our efforts to prevent the misappropriation or infringement of our intellectual property or the intellectual property of our customers may not succeed. Although we actively seek to protect our proprietary rights, nevertheless, unauthorized parties may attempt to copy aspects of our products or technologies or to obtain and use information that we regard as proprietary. Identifying unauthorized use of our products and technologies is difficult and time consuming. The initiation of litigation as a result of the misappropriation or infringement of our intellectual property may adversely affect our relationships and agreements with certain customers that have a stake in the outcome of the litigation proceedings. Litigation is very expensive and may divert the attention of management and other key employees from the operation of our business, all of which could have an adverse effect on our business, financial condition and results of operations.
If we fail to meet customer demands in a timely manner, we could lose certain critical business relationships.
Our ability to provide products and services and meet very high quality standards in a timely manner is critical to our business success. For example, one of the key services that we offer our customers is the prompt and timely production and delivery of replacement bank cards. Orders for replacement bank cards are often placed on short notice and may require personalization. If we are
23
unable to offer these and our other products and services in a timely manner or due to software malfunction, logistical impediments at any of our facilities or economic, social, political or other challenges impacting the industry as a whole, our relationships with our customers may be adversely affected and we may lose major contracts, all of which could have an adverse effect on our business, financial condition and results of operations.
We face competition that may result in a loss of our market share and/or a decline in our profitability.
We expect our marketplace to continue to be highly competitive as new product markets develop, industry standards become well known and other competitors attempt to enter the markets in which we operate. In addition, we expect to encounter further consolidation in the markets in which we operate.
Some of our competitors have longer operating histories, and, when viewed globally, larger customer bases and significantly greater financial, sales and marketing, manufacturing, distribution, technical and other capabilities than we do. These competitors may be able to adapt more quickly to new or emerging technological requirements and changes in customer and/or regulatory requirements. They may also be able to devote greater resources to the promotion and sale of their products and services. We also face competition from newly established competitors, suppliers of products and customers who choose to develop their own products and services.
Existing or new competitors may develop products, technologies or services that more effectively address our markets with enhanced features and functionality, greater levels of integration and/or lower cost. Additionally, mobile payment technology could develop to replace the products and services we offer, which could render our offerings dated or obsolete, or existing alternative standards of secured mobile payment technology could gain widespread market acceptance, which could have an adverse impact on our business. As the technological sophistication of our competitors and the size of the market increase, competing low-cost producers could emerge and grow stronger. If our customers prefer low-cost alternatives to our products, our revenues and profitability could be adversely affected. Increased competition has historically resulted in, and is likely to continue to result in, declining average selling prices and reduced gross margins in certain of our businesses and the loss of market share in certain markets. We may not be able to continue to compete successfully against current or new competitors. If we fail to compete successfully, we may lose market share in our existing markets, which could have an adverse effect on our business, financial condition and results of operations.
The financial payment card industry may be subject to price erosion, which could have an adverse effect on our business.
One of the results of the rapid innovation in the financial payment card industry is that pricing pressure can be intense, in particular for large credit and debit card issuers and large card processors. Our large credit and debit card issuer customers face continued competitive pressure. As these issuers seek to reduce their expenses, we, in turn, may experience a decline in the prices at which our products can be sold and at which such services can be offered. In such instances, in order to continue to supply these products and services at competitive prices, we must reduce our production costs. Typically, we are able to accomplish this through leveraging our scale and production efficiencies. However, if we cannot continue to improve our efficiencies to a degree sufficient for maintaining the required margins, we may no longer be able to make a profit from the sale of these products and services. Moreover, we may not be able to cease production of such products, either due to our ongoing contractual obligations or the risk of losing our existing customer relationships, and as a result may be required to bear a loss on such products. Further competition in our core product and service markets may lead to price erosion, lower revenue growth rates and lower margins in the future. Should reductions in our production costs fail to keep pace with reductions in market prices for the products we sell, there could be an adverse effect on our business, financial condition and results of operations.
24
Our business may be adversely affected by costs relating to product defects, and we could be faced with product liability and warranty claims.
We offer highly complex services and products and, accordingly, there is a risk that defects may occur in any of our services or products. Such defects can give rise to significant costs, including expenses relating to recalling products, replacing defective items, writing down defective inventory and the loss of potential sales. In addition, the occurrence of such defects may give rise to product liability and warranty claims, including liability for damages caused by such defects. If we release defective products in the market, our reputation could suffer and we may lose sales opportunities and incur liability for damages, including damage claims from customers in excess of the amounts they pay us for our products, including consequential damages. In addition, our customers may recall their products if they prove to be defective or make compensatory payments in accordance with industry or business practice or in order to maintain good customer relationships. If such a recall or payment is caused by a defect in one of our products, our customers may seek to recover all or a portion of their losses from us. If any of these risks materialize, our reputation would be harmed and there could be an adverse effect to our business, financial condition and results of operations.
We rely on licensing arrangements in production and other fields, and actions taken by any of our licensing partners could adversely affect our business.
Many of our products integrate third-party technologies that we license or otherwise obtain the right to use, including software relating to smart card operating systems used in products such as EMV cards. As part of our strategy, we have entered into licensing agreements with other leading industry participants that provide us, among other benefits, with access to technology owned by third parties. For example, we license Java card technology from Oracle and Multos card technology from Multos International, a subsidiary of a competitor, for use in certain of our products, including in EMV cards. This Java and Multos card technology provides a secure environment for applications on smart cards and other devices with limited memory and processing capabilities, and we rely on our commercial arrangements with Oracle and Multos International for the continued use of the Java and Multos platforms, respectively. Oracle and Multos International may not continue to renew their licenses with us on similar terms or at all, which could negatively impact our net sales. We have also entered into cross-licensing agreements with certain of our competitors that provide for an exchange of intellectual property, including the sharing of certain patent rights in our respective portfolios. If we are unable to continue to successfully renew these agreements we may lose our access to certain technologies that we rely upon to develop certain of our products, which could adversely affect our operations.
All of our facilities are leased, in whole or in part, and our inability to renew our leases on commercially acceptable terms or at all may adversely affect our results of operations.
Each of our nine facilities, in whole or in part, is located on leased property. We may be unable to renew such leases on commercially acceptable terms or at all. Our inability to renew our leases, or a renewal of our leases with a rental rate higher than the prevailing rate under the applicable lease prior to expiration, may have an adverse impact on our operations, including disrupting our operations or increasing our cost of operations. In addition, in the event of non-renewal of any of our leases, we may be unable to locate suitable replacement properties for our facilities or we may experience delays in relocation that could lead to a disruption in our operations. Any disruption in our operations could have an adverse effect on our financial condition and results of operation.
The smart card systems developed by our competitors may put us at a competitive disadvantage.
Certain of our competitors have internally developed their own smart card operating systems. Ownership of these internal operating systems may give our competitors a cost advantage over us, as we utilize JavaCard and Multos systems in our EMV cards, which we must license from the owners of such technology. If our competitors are able to reduce the prices of their products and services as a result of the cost savings they might realize from using their own internally developed operating system,
25
our profitability may be adversely affected. Additionally, customers may prefer the operating systems of our competitors over the operating systems that we utilize in our EMV cards. If customers are more attracted to our competitors' internally developed operating systems, demand for our products and services may be reduced, thereby adversely affecting our results of operations.
Interruptions in our IT systems could adversely affect our business.
We rely on the efficient and uninterrupted operation of complex IT applications, systems and networks to operate our business. The reliability of our IT infrastructure and software, and our ability to expand and continually update technologies in response to our changing needs, are critical to our business. Any significant interruption in our business applications, systems or networks, including, but not limited to, new system implementations, facility issues or energy blackouts, could have a material adverse impact on our operations, sales and operating results.
Not only would we suffer damage to our reputation in the event of a system outage or data loss or interruption, but we may also be liable to third parties. Some of our contractual agreements with financial institutions require the payment of penalties if our systems do not meet certain operating standards. In addition, to successfully operate our business, we must be able to protect our processing and other systems from interruption, including from events that may be beyond our control. The protective measures we have adopted to avoid system or network disruptions may be insufficient to prevent or limit the damage from any future disruptions, and any such disruption could have an adverse effect on our business, financial condition and results of operations.
Our business depends on the continued viability of the card networks of the Payment Card Brands.
The vast majority of cards we produce and the services we provide are associated with one of the Payment Card Brands. As a result, we depend on the continued viability of the card networks of the Payment Card Brands, including their authorization, clearing and settlement systems. If one or more of the Payment Card Brands were to discontinue their services or otherwise experience a decline in the volume of cards bearing their brands, our results of operations could be adversely affected.
The terms of our New Credit Facility restrict, and covenants contained in agreements governing indebtedness in the future may restrict, our ability to operate our business and to pursue our business strategies.
Our New Credit Facility contains, and any future indebtedness of ours may contain, a number of restrictive covenants that impose customary operating and financial restrictions on us. Our New Credit Facility limits our ability and the ability of our restricted subsidiaries, among other things, to:
- •
- incur additional debt or contingent liabilities;
- •
- declare or pay dividends, redeem stock, or make other distributions to stockholders;
- •
- make loans, advances, guarantees or other investments;
- •
- create liens or use assets as security in other transactions;
- •
- merge or consolidate, or sell, transfer, lease or dispose of substantially all of our assets;
- •
- enter into transactions with affiliates; and
- •
- enter into certain asset sale transactions or other dispositions of assets.
In addition, as of the last day of any fiscal quarter, if the amount we have drawn under the New Revolving Credit Facility is greater than 50% of the aggregate principal amount of all commitments of the lenders thereunder, we are required to maintain a first lien net leverage ratio not in excess of 7.0x. Our failure to comply with any of these covenants could result in an event of default which, if not cured or waived, could result in the acceleration of all of our indebtedness under the New Credit Facility.
26
We are dependent on key executives, the loss of whom could adversely affect our business.
Our future success depends to a significant extent on the efforts of our senior management. We believe there are only a limited number of available and qualified executives with substantial experience in our industry. Accordingly, the loss of the services of one or more of the members of our senior management could delay or prevent us from fully implementing our business strategy and, consequently, significantly and negatively affect our business.
If any member of senior management dies or becomes incapacitated, or leaves the company to pursue employment opportunities elsewhere, we would need to locate an adequate replacement. To the extent that we are unable to locate an adequate replacement or are unable to do so within a reasonable period of time, our business may be significantly and negatively affected.
We rely on the timely supply of materials and products and our business could suffer if our suppliers fail to meet their delivery obligations or raise their prices.
Our production operations depend on deliveries of microchips and other materials in a timely manner and, in some cases, on a just-in-time basis. From time to time, suppliers may extend lead times, limit the amounts supplied to us or increase prices due to capacity constraints or other factors. We may not be able to meet the demands of our customers in a timely manner, or at all, due to shortages in the supply of critical materials. Additionally, certain product materials required in our production operations are only available from a limited number of suppliers, and we may not be able to find an adequate replacement for such materials if our suppliers are unable to meet their delivery obligations to us. In particular, we rely on a small group of suppliers for the provision the EMV microchips that we use in our Financial Payment Cards. For the year ended December 31, 2014, we obtained approximately 96.1% of our total purchased EMV microchips from five main suppliers. If any one of these EMV microchip suppliers, or any supplier of our other raw materials, fails to deliver our requirements, our production could be disrupted. In addition, as a result of a shortage, we may be compelled to delay shipments of our products, or devote additional resources to maintaining higher levels of inventory. Consequently, we may experience substantial period-to-period fluctuations in our cost of revenues and, therefore, in our future results of operations. If we are unable to obtain adequate supplies of quality materials in a timely manner or if there are significant increases in the cost of these materials, our business, financial condition and results of operations could be adversely affected.
We are required to comply with laws and regulations in other countries and are exposed to business risks associated with our international operations.
For the six months ended June 30, 2015 and the years ended December 31, 2014 and 2013, we derived 12.9%, 24.7% and 31.0%, respectively, of our net sales from outside the United States, primarily in Canada and the United Kingdom. As a result, we are subject to numerous evolving and complex laws and regulations which apply, among other things, to financial reporting standards, corporate governance, data privacy, tax, trade regulations, export controls, competitive practices, and labor and health and safety laws and regulations in each jurisdiction in which we operate. We are also required to obtain environmental permits and other authorizations or licenses from governmental authorities for certain of our operations and must protect our intellectual property worldwide. In the jurisdictions in which we operate, we need to comply with various standards and practices of different regulatory, tax, judicial and administrative bodies.
There are a number of risks associated with international business operations, including political instability (e.g., the threat of war, terrorist attacks or civil unrest), inconsistent regulations across jurisdictions, unanticipated changes in the regulatory environment, and import and export restrictions. Any of these events may affect our employees, reputation, business or financial results as well as our ability to meet our objectives, including the following international business risks:
- •
- negative economic developments in economies around the world and the instability of governments, or the downgrades in the debt ratings of certain major economies;
27
- •
- social and political instability;
- •
- complex regulations governing certain of our products;
- •
- potential terrorist attacks;
- •
- adverse changes in governmental policies, especially those affecting trade and investment;
- •
- foreign currency exchange, particularly with respect to the Canadian Dollar and British Pound Sterling; and
- •
- threats that our operations or property could be subject to nationalization and expropriation.
We may not be in full compliance at all times with the laws and regulations to which we are subject. Likewise, we may not have obtained or may not be able to obtain the permits and other authorizations or licenses that we need. If we violate or fail to comply with laws, regulations, permits, health and safety regulations or other authorizations or licenses, we could be fined or otherwise sanctioned by regulators. In such a case, or if any of these international business risks were to materialize, our business, financial condition and results of operations could be adversely affected.
Changes in laws, regulations and enforcement activities relating to the financial services industry may adversely affect the products, services and markets in which we operate.
We and our customers are subject to laws and regulations that affect the financial services industry in the many countries in which our products and services are used. In particular, our customers are subject to numerous laws and regulations applicable to banks, financial institutions and card issuers in the United States, Europe and other regions. The U.S. Government, for instance, has increased its scrutiny of a number of credit and debit card practices, from which some of our customers derive significant revenue. Regulation of the payments industry, including the Dodd-Frank Wall Street Reform and Consumer Protection Act (the "Dodd-Frank Act"), privacy and data security regulations such as the Gramm-Leach-Bliley Act (the "GLBA"), and other regulations applicable to us and our customers, has increased significantly in recent years. Our failure to comply with the laws and regulations applicable to our business may result in the suspension or revocation of our licenses or registrations, the limitation, suspension or termination of our services, and/or the imposition of consent orders or civil and criminal penalties, including fines, which could have an adverse effect on our business, financial condition and results of operations.
Environmental, health and safety laws and regulations expose us to liability and any such liability may adversely affect our business.
We are subject to environmental, health and safety laws and regulations in each jurisdiction in which we operate. Such regulations govern, among other things, emissions of pollutants into the air, wastewater discharges, waste disposal, the investigation and remediation of soil and groundwater contamination, and the health and safety of our employees. For example, our products and the raw materials we use in our production processes are subject to numerous environmental laws and regulations. We are also required to obtain environmental permits from governmental authorities for certain of our operations. We may not have been, nor may we be able to be at all times, in full compliance with such laws, regulations and permits. If we violate or fail to comply with these laws, regulations or permits, we could be fined or otherwise sanctioned by regulators.
As with other companies engaged in similar activities or that own or operate real property, we face inherent risks of environmental liability at our current and historical production facilities. Certain environmental laws impose strict and, in certain circumstances, joint and several liability on current or previous owners or operators of real property for the cost of the investigation, removal or remediation of hazardous substances as well as liability for related damages to natural resources. In addition, we
28
may discover new facts or conditions that may change our expectations or be faced with changes in environmental laws or their enforcement that would increase our liabilities. Furthermore, our costs of complying with current and future environmental and health and safety laws, or our liabilities arising from past or future releases of, or exposure to, regulated materials, may have a material adverse effect on our business, financial condition and results of operations.
The scientific examination of, political attention to, and rules and regulations on issues surrounding the existence and extent of climate change may result in an increase in our cost of production due to increases in the price of energy and/or the introduction of energy or carbon taxes. A variety of regulatory developments have been introduced that focus on restricting or managing the emission of carbon dioxide, methane and other greenhouse gasses. Companies such as ours may need to purchase at higher costs new equipment or raw materials with lower carbon footprints. These developments and further legislation that is likely to be enacted could negatively affect our operations. Changes in environmental regulations could increase our production costs, which could adversely affect our business, financial condition and results of operations.
Certain natural disasters, such as flooding, earthquakes, nuclear disasters, certain weather conditions and other catastrophic events, such as fire, may negatively impact our business.
The occurrence of severe weather events, such as rain, snow, wind, storms, hurricanes or other natural disasters, such as flooding, earthquakes, nuclear disasters, fire or a combination thereof, may negatively impact our business. If certain natural disasters, extreme weather conditions or other events such as fire were to directly damage, destroy or disrupt our production facilities, it could disrupt our operations, delay new production and shipments of existing inventory or result in costly repairs, replacements or other costs, all of which would negatively impact our business. Even if our production facilities are not directly damaged, a large natural disaster or fire may result in disruptions in distribution channels or supply chains and significantly increase the prices of the raw materials we use in our production processes. The impact of any such natural disasters, weather changes or other disasters such as fire depends on the specific geographic circumstances but could be significant, and we cannot predict the economic impact, if any, of natural disasters or climate change. Any such disruptions could have an adverse effect on our business, financial condition and results of operations.
Our revenue may be adversely affected by fluctuations in currency exchange rates.
A portion of our revenues, costs, assets and liabilities are denominated in foreign currencies, including the Canadian Dollar and the British Pound Sterling. However, we report our financial condition and results of operations in U.S. dollars. As a result, our results of operations and, in some cases, cash flows may in the future be adversely affected by certain movements in exchange rates. In particular, the exchange rate from the U.S. dollar to the Canadian Dollar has fluctuated substantially in the past and may continue to do so in the future. Though we may choose to hedge our exposure to foreign currency exchange rate changes in the future, there is no guarantee such hedging, if undertaken, will be successful.
Our insurance may be inadequate to cover future liabilities and our insurance premiums may increase substantially.
We may be subject to significant losses from claims, liabilities, hazards and disasters. While we currently maintain insurance which we believe is adequate and consistent with industry practice, we may experience losses in excess of our insurance coverage or claims not covered by our insurance. Furthermore, we may not be able to obtain insurance coverage in the future on acceptable terms, or at all. Any such losses not covered by insurance may have a material adverse effect on our business, financial condition and results of operations.
29
We face risks associated with our acquisition strategy.
Our future success may depend on acquiring businesses and technologies, making investments or forming joint ventures that complement, enhance or expand our current portfolio or otherwise offer us growth opportunities. The expansion of our business through acquisitions allows us to complement our existing product offerings and enhance our technological capabilities.
We face a number of challenges associated with our acquisition strategy that could disrupt our ongoing business and distract our management team, including:
- •
- lower gross margins, revenues and operating income than originally anticipated at the time of acquisition and other financial
challenges;
- •
- delays in the timing and successful integration of an acquired company's technologies;
- •
- the loss of key personnel; and
- •
- becoming subject to intellectual property, antitrust or other litigation.
Acquisitions can result in increased debt or contingent liabilities. Acquisitions can also result in adverse tax consequences, warranty or product liability exposure related to acquired assets, additional stock-based compensation expense, the write-up of acquired inventory to fair value, and the recording and later amortization of amounts related to certain purchased intangible assets, all of which can adversely affect our reported results. In addition, we have in the past and may in the future record goodwill and other purchased intangible assets in connection with an acquisition and incur impairment charges.
A failure to implement our acquisition strategy, obtain sufficient financing or integrate acquired businesses successfully could adversely affect our business, financial condition and results of operations.
Goodwill and other identifiable intangible assets represent a significant portion of our total assets, and we may never realize the full value of our intangible assets.
We have recorded a significant amount of goodwill. Total goodwill, which reflects, among other things, our market share and assembled workforce, our ability to develop future innovative technologies and seize business opportunities, was $73.8 million as of June 30, 2015, or 25.6% of our total assets.
We perform goodwill impairment testing on an annual basis on October 1 of each year. If we were to conclude that a future write-down of our goodwill is necessary, we would have to record the appropriate charge, which could result in a material adverse effect on our results of operations. A write-down of our goodwill may result from, among other things, deterioration in our performance and a decline in expected future cash flows and could have an adverse effect on our business, financial condition and results of operations.
The ability to recruit, retain and develop qualified personnel is critical to our success and growth.
Our business functions are complex and require wide-ranging expertise and intellectual capital. For us to successfully compete and grow, we must retain, recruit and develop personnel who can provide the needed expertise across the entire spectrum of our intellectual capital needs. In addition, we must develop our personnel to provide succession plans capable of maintaining continuity in the midst of the inevitable unpredictability of human capital. However, the market for qualified personnel is competitive and we may not succeed in recruiting additional personnel or may fail to effectively replace current personnel who depart with qualified or effective successors. Our efforts to retain and develop personnel may also result in significant additional expenses, which could adversely affect our profitability. Our key personnel may not continue to be employed or we may be unable to attract and retain qualified
30
personnel in the future. Such a failure to retain or attract key personnel could have an adverse effect on our business, financial condition and results of operations.
Our operating results may vary significantly from quarter to quarter and annually, and may differ significantly from our expectations or guidance.
Our operating results are affected by a wide variety of factors that could materially and adversely affect revenues and profitability or lead to significant variability in our operating results. These factors include, among others, the cyclicality of the financial card and electronic payment industries, capital requirements, inventory management, the availability of funding, competition, new product developments, technological changes and production problems. For example, if anticipated sales or shipments do not occur when expected, expenses and inventory levels in a given quarter can be disproportionately high, and our results of operations for that quarter, and potentially for future quarters, may be adversely affected. In addition, our effective tax rate currently takes into consideration certain favorable tax rates and incentives which, in the future, may not be available to us.
A number of other factors could lead to fluctuations in quarterly and annual operating results, including:
- •
- order cancellations or rescheduling by customers;
- •
- restructuring and impairment charges;
- •
- fluctuations in currency exchange rates, particularly between the U.S. dollar and the Canadian Dollar and British Pound Sterling;
- •
- intellectual property developments;
- •
- changes in distribution and sales arrangements;
- •
- the failure to win new projects;
- •
- production performance and yields;
- •
- product liability or warranty claims;
- •
- litigation;
- •
- taxation;
- •
- acquisitions or divestitures;
- •
- problems in obtaining adequate raw materials or production equipment on a timely basis;
- •
- property loss or damage or interruptions to our business, including as a result of fire, natural disasters or other disturbances at
our facilities or those of our customers and suppliers that may exceed the amounts recoverable under our insurance policies; and
- •
- changes in the market value or yield of the financial instruments in which we invest our liquidity.
Unfavorable changes related to certain of the above factors have in the past and any of the above factors may in the future adversely affect our operating results. Furthermore, in periods of industry overcapacity or when our key customers encounter difficulties in their end-markets, orders are more exposed to cancellations, reductions, price renegotiations or postponements, which in turn reduce our management's ability to forecast the next quarter or full-year production levels, net sales and margins. For these reasons, our net sales and operating results may differ materially from our expectations or guidance as visibility is reduced and have an adverse effect on our business, financial condition and results of operations.
31
Consolidations in the banking and financial services industry could eliminate existing or potential clients.
Failures, mergers and consolidations of financial institutions may reduce the number of our clients and potential clients, which could adversely affect our net sales. Further, if our clients fail, merge with or are acquired by other entities that are not our clients, or that use fewer of our services, they may discontinue or reduce their use of our services. It is also possible that the larger financial institutions that result from mergers or consolidations would have greater leverage in negotiating terms with us or could decide to perform in-house some or all of the services which we currently provide or could provide. Any of these developments could have an adverse effect on our business, results of operations and financial condition.
We are subject to the credit risk that our customers may be unable to satisfy their obligations to us.
A significant portion of our net sales are on an open credit basis, with typical payment terms of up to 60 days in some cases, and we are subject to the credit risk of our customers being unable to make payments to us. If any of our customers experience a bankruptcy or are otherwise unable to satisfy their payment obligations to us, any related losses, if incurred, could harm our business and have an adverse effect on our operating results and financial condition if they significantly exceed our reserve for losses on our balance sheet.
Our business depends upon our ability to obtain specialized equipment from third-party suppliers, and we may be subject to delayed deliveries and future price increases.
Our production processes depend on specialized equipment that we purchase and/or lease from third party suppliers. At times during the business cycle, there may be high demand for such equipment, with extended lead times to obtain such equipment. Further, there are a limited number of suppliers that manufacture and service the equipment we use. Should our current suppliers be unable or unwilling to provide the necessary equipment or otherwise fail to deliver or service such equipment in a timely manner, any resulting delays in our production processes could have an adverse effect on our business, financial condition, results of operations. In addition, the prices of the equipment we use may rise in the future, and any future price increases for this type of equipment could negatively impact our ability to purchase new equipment or to service existing equipment.
We have identified a material weakness in our internal controls over financial reporting. If we are unable to implement and maintain effective internal controls over financial reporting in the future, investors may lose confidence in the accuracy and completeness of our financial reports and the market price of our common stock may be negatively affected.
As a public company, we will be required to maintain internal controls over financial reporting and to report any material weaknesses in such internal controls. A material weakness is a deficiency, or a combination of deficiencies, in financial reporting such that there is a reasonable possibility that a material misstatement of a company's annual or interim financial statements will not be presented or detected on a timely basis. Section 404 of the Sarbanes-Oxley Act of 2002 (the "Sarbanes-Oxley Act") requires that we evaluate and determine the effectiveness of our internal controls over financial reporting and, beginning with our annual report for the fiscal year ending December 31, 2016, provide a management report on the internal controls over financial reporting. We are in the process of designing and implementing internal controls over financial reporting required to comply with this obligation, which process will be time consuming, costly and complicated. Such report must also be attested to by our independent registered public accounting firm to the extent we are no longer an "emerging growth company," as defined by the JOBS Act. We do not expect to have our independent registered public accounting firm attest to our management report on our internal controls over financial reporting for so long as we are an emerging growth company.
32
In connection with our preparation for this offering, we recently identified a material weakness in our internal controls over financial reporting related to a current lack of finance expertise that could result in a failure to properly account for non-routine and complex transactions in accordance with GAAP. With the oversight of senior management, we are taking steps to remediate the underlying causes of this material weakness, primarily through the hiring of additional finance personnel and through the development and implementation of formal policies and improved processes. Although we plan to complete this remediation process as quickly as possible, we cannot at this time estimate how long it will take, and our initiatives may not prove to be successful in remediating this material weakness.
If we are unable to remediate this material weakness, or if we identify other material weaknesses in our internal controls over financial reporting, we may not detect errors on a timely basis and our financial statements may be materially misstated. In addition, if we are unable to comply with the requirements of Section 404 of the Sarbanes-Oxley Act in a timely manner, if we are unable to assert that our internal controls over financial reporting are effective, or if our independent registered public accounting firm is not required to express an opinion due to the provisions of the JOBS Act or is unable to express an opinion as to the effectiveness of our internal controls over financial reporting, investors may lose confidence in the accuracy and completeness of our financial reports and the market price of our common stock could be negatively affected, and we could become subject to investigations by the stock exchange on which our common stock is listed, the Securities and Exchange Commission (the "SEC"), or other regulatory authorities, which could require additional financial and management resources.
We will incur significantly increased costs and devote substantial management time as a result of operating as a public company.
As a public company, we will incur significant legal, accounting and other expenses that we did not incur as a private company. For example, we will be subject to the reporting requirements of the Securities Exchange Act of 1934, as amended (the "Exchange Act"), and will be required to comply with the applicable requirements of the Sarbanes-Oxley Act and the Dodd-Frank Wall Street Reform and Consumer Protection Act, as well as rules and regulations subsequently implemented by the SEC, the Canadian Securities Administrators, the TSX and the NASDAQ Global Select Market, including the establishment and maintenance of effective disclosure and financial controls and changes in corporate governance practices, including the establishment and maintenance of a majority independent board of directors and required committees. In addition, depending on the composition of our board of directors and stockholder base, we may become subject to additional periodic reporting requirements under Canadian securities laws. We expect that compliance with these requirements will increase our legal and financial compliance costs and will make some activities more time consuming and costly. In addition, our management team and board of directors have limited experience implementing public company compliance requirements, and therefore we expect that our management and other personnel will need to divert attention from operational and other business matters to devote substantial time to such efforts. In particular, we expect to incur significant expenses and devote substantial management effort toward ensuring compliance with the requirements of Section 404 of the Sarbanes-Oxley Act, which will increase when we are no longer an emerging growth company, as defined in the JOBS Act. We will need to hire additional accounting and financial staff with appropriate public company experience and technical accounting knowledge and may need to establish an internal audit function. We cannot predict or estimate the amount of additional costs we may incur as a result of becoming a public company or the timing of such costs. We also expect that operating as a public company will make it more difficult and significantly more expensive for us to obtain director and officer liability insurance.
33
We are an "emerging growth company" and we cannot be certain if the reduced disclosure and other requirements applicable to emerging growth companies will make our common stock less attractive to investors.
We are an "emerging growth company," as defined in the JOBS Act, and we intend to take advantage of certain exemptions from various reporting requirements that are applicable to other public companies that are not "emerging growth companies" including, but not limited to, not being required to comply with the auditor attestation requirements of Section 404 of the Sarbanes-Oxley Act with respect to our internal control over financial reporting, reduced disclosure obligations regarding executive compensation in our periodic reports and proxy statements, and exemptions from the requirements of holding a non-binding advisory vote on executive compensation and stockholder approval of any golden parachute payments not previously approved. We may take advantage of these provisions for up to five years or such earlier time that we are no longer an "emerging growth company." We would cease to be an emerging growth company upon the earliest to occur of (i) the last day of the fiscal year (a) following the fifth anniversary of the completion of this offering, (b) in which we have total annual gross revenue of at least $1.0 billion or (c) in which we become a large accelerated filer, which means that we have been public for at least 12 months, have filed at least one annual report and the market value of our common stock that is held by non-affiliates exceeds $700 million as of the last day of our then most recently completed second fiscal quarter and (ii) the date on which we have issued more than $1.0 billion in non-convertible debt during the prior three-year period. We may choose to take advantage of some but not all of these reduced reporting and other burdens. To the extent we take advantage of any of the reduced reporting burdens in this prospectus or in future filings, the information that we provide our security holders may be different than the information such holders might get from other public companies in which they hold equity interests. We cannot predict if investors will find our common stock less attractive because we may rely on these exemptions. If some investors find our common stock less attractive as a result, there may be a less active trading market for our common stock and our stock price may be more volatile.
In addition, Section 107 of the JOBS Act provides that an "emerging growth company" can take advantage of the extended transition period provided in Section 7(a)(2)(B) of the Securities Act for complying with new or revised accounting standards. Stated another way, an "emerging growth company" can delay the adoption of certain accounting standards until those standards would otherwise apply to private companies. We are choosing to "opt out" of such extended transition period, however, and, as a result, we will comply with new or revised accounting standards on the relevant dates on which adoption of such standards is required for non-emerging growth companies. Section 107 of the JOBS Act provides that our decision to opt out of the extended transition period for complying with new or revised accounting standards is irrevocable.
Risks Related to Ownership of Our Common Stock
There is no existing market for our common stock, and we do not know if one will develop to provide you with adequate liquidity to sell our common stock at prices equal to or greater than the price you paid in this offering.
Prior to this offering, there has not been a public market for our common stock. We cannot predict the extent to which investor interest in our company will lead to the development of an active trading market on the NASDAQ Global Select Market or otherwise or how liquid that market might become. If an active trading market does not develop, you may have difficulty selling any of our common stock that you buy. The initial public offering price for the common stock will be determined by negotiations between us and the representatives of the underwriters and may not be indicative of prices that will prevail in the open market following this offering. Consequently, you may not be able to sell our common stock at prices equal to or greater than the price you paid in this offering, or at all.
34
The price of our common stock may fluctuate significantly, and you could lose all or part of your investment.
Volatility in the market price of our common stock may prevent you from being able to sell your shares at or above the price you paid for them. The market price for our common stock could fluctuate significantly for various reasons, including:
- •
- our operating and financial performance and prospects;
- •
- our quarterly or annual earnings or those of other companies in our industry;
- •
- the public's reaction to our press releases, our other public announcements and our filings with the SEC;
- •
- changes in, or failure to meet, earnings estimates or recommendations by research analysts who track our common stock or the stock of
other companies in our industry;
- •
- the failure of research analysts to cover our common stock;
- •
- general economic, industry and market conditions;
- •
- strategic actions by us, our customers or our competitors, such as acquisitions or restructurings;
- •
- new laws or regulations or new interpretations of existing laws or regulations applicable to our business;
- •
- changes in accounting standards, policies, guidance, interpretations or principles;
- •
- material litigation or government investigations;
- •
- changes in general conditions in the U.S. and global economies or financial markets, including those resulting from war, incidents of
terrorism or responses to such events;
- •
- changes in key personnel;
- •
- sales of common stock by us, our principal stockholders or members of our management team;
- •
- termination of lock-up agreements with our management team and principal stockholders;
- •
- the granting or exercise of employee stock options;
- •
- volume of trading in our common stock; and
- •
- impact of the facts described elsewhere in "Risk Factors."
In addition, in recent years, the stock market has regularly experienced significant price and volume fluctuations. This volatility has had a significant impact on the market price of securities issued by many companies, including companies in our industry. The changes frequently appear to occur without regard to the operating performance of the affected companies. Hence, the price of our common stock could fluctuate based upon factors that have little or nothing to do with us and these fluctuations could materially reduce our share price.
Our majority stockholders will have the ability to control significant corporate activities after the completion of this offering.
After the consummation of this offering, the Tricor Funds will collectively beneficially own approximately 59.0% of our common stock, assuming the underwriters do not exercise their option to purchase additional shares (or 55.2% if the underwriters exercise in full their option to purchase additional shares). As a result of its ownership, the Tricor Funds, so long as they hold a majority of our outstanding shares, will have the ability to control the outcome of matters submitted to a vote of stockholders and, through our board of directors, the ability to control decision-making with respect to our business direction and policies.
35
Matters over which the Tricor Funds will, directly or indirectly, exercise control following this offering include:
- •
- election of directors;
- •
- mergers and other business combination transactions, including proposed transactions that would result in our stockholders receiving a
premium price for their shares;
- •
- other acquisitions or dispositions of businesses or assets;
- •
- incurrence of indebtedness and the issuance of equity securities;
- •
- repurchases of stock and payment of dividends; and
- •
- the issuance of shares to management under our incentive plans.
Conflicts of interest may arise because directors who are principals of our largest stockholder constitute a majority of our board of directors.
Messrs. Seaman, Peters and Rowntree, who are officers or affiliates of Tricor, serve on our board of directors. The Tricor Funds, our majority stockholders (prior to and after giving effect to this offering), are funds controlled by Tricor and its affiliates. Tricor and entities controlled by it may in the future hold equity interests in entities that directly or indirectly compete with us, and companies in which it currently invests may begin directly or indirectly competing with us. As a result of these relationships, when conflicts between the interests of Tricor, on the one hand, and of other stockholders, on the other hand, arise, these directors may not be disinterested. Although our directors and officers have a duty of loyalty to us under Delaware law and our certificate of incorporation, transactions that we enter into in which a director or officer has a conflict of interest are generally permissible so long as (1) the material facts relating to the director's or officer's relationship or interest as to the transaction are disclosed to our board of directors and a majority of our disinterested directors approves the transaction, (2) the material facts relating to the director's or officer's relationship or interest as to the transaction are disclosed to our stockholders and a majority of our disinterested stockholders approve the transaction or (3) the transaction is otherwise fair to us. Our certificate of incorporation also provides that any principal, officer, member, manager and/or employee of Tricor or any entity that controls, is controlled by or under common control with Tricor (other than any company that is controlled by us) or any investment funds managed by Tricor will not be required to offer any transaction opportunity of which they become aware to us and could take any such opportunity for themselves or offer it to other companies in which they have an investment, unless such opportunity is offered to them solely in their capacities as our directors. See "Description of Capital Stock—Corporate Opportunity."
If you purchase shares of our common stock in our initial public offering, you will experience substantial and immediate dilution.
If you purchase shares of our common stock in our initial public offering, you will experience substantial and immediate dilution in the pro forma net tangible book value per share because the price that you pay will be substantially greater than the pro forma net tangible book value per share of the common stock that you acquire. This dilution is due in large part to the fact that our earlier investors paid substantially less than the initial public offering price when they purchased their shares of our capital stock. You will experience additional dilution upon exercise of options to purchase common stock under our equity incentive plans, upon vesting of options to purchase common stock under our equity incentive plans, if we issue restricted stock to our employees under our equity incentive plans, or if we otherwise issue additional shares of our common stock.
36
Our ability to pay regular dividends to our stockholders is subject to the discretion of our board of directors and may be limited by our holding company structure and applicable provisions of Delaware law.
We intend to pay regular cash dividends on our common stock. However, our board of directors may, in its sole discretion, change the amount or frequency of dividends or discontinue the payment of dividends entirely. In addition, because we are a holding company with no material direct operations, we are dependent on dividends and other payments from our operating subsidiaries to generate the funds necessary to pay dividends on our common stock. We expect to cause our subsidiaries to make distributions to us in an amount sufficient for us to pay dividends. However, their ability to make such distributions will be subject to their operating results, cash requirements and financial condition, the applicable provisions of Delaware law that may limit the amount of funds available for distribution and our ability to pay cash dividends, compliance with covenants and financial ratios related to existing or future indebtedness and other agreements with third parties. In addition, each of the companies in our corporate chain must manage its assets, liabilities and working capital in order to meet all of its cash obligations, including the payment of dividends or distributions. As a consequence of these various limitations and restrictions, we may not be able to make, or may have to reduce or eliminate, the payment of dividends on our common stock. Any change in the level of our dividends or the suspension of the payment thereof could adversely affect the market price of our common stock.
Future sales of our common stock, or the perception in the public markets that these sales may occur, may depress our stock price.
Sales of substantial amounts of our common stock in the public market after this offering, or the perception that these sales could occur, could adversely affect the price of our common stock and could impair our ability to raise capital through the sale of additional shares. Upon completion of this offering, there will be 53,692,116 shares of our common stock outstanding. Of these, the 16,000,000 shares being sold in this offering (or 18,400,000 shares if the underwriters exercise their option to purchase additional shares in full) will be freely tradable immediately after this offering (except for any shares purchased by affiliates, if any) and approximately 36,225,948 and 1,466,168 shares may be sold upon expiration of lock-up agreements beginning 180 days and one year, respectively, after the date of this prospectus (subject in some cases to volume limitations). See "Shares Eligible for Future Sale."
We also intend to register all common stock that we may issue under the Omnibus Plan or pursuant to outstanding options under the CPI Holdings I, Inc. Amended and Restated 2007 Stock Option Plan (the "Option Plan"), as described in "Executive Compensation—Incentive Plans—CPI Card Group Inc. Omnibus Incentive Plan." Effective upon the completion of this offering, an aggregate of 4,000,000 shares of our common stock will be reserved for future issuance under the Omnibus Plan, including 770,450 shares of common stock underlying stock options to be issued in connection with this offering, and 528,000 shares of common stock will be issuable upon the exercise of outstanding options under the Option Plan. Once we register these shares, which we plan to do shortly after the completion of this offering, they can be freely sold in the public market upon issuance, subject to the lock-up agreements referred to above. If a large number of these shares are sold in the public market, the sales could reduce the trading price of our common stock.
Certain provisions of our organizational documents and other contractual provisions may make it difficult for stockholders to change the composition of our board of directors and may discourage hostile takeover attempts that some of our stockholders may consider to be beneficial.
Certain provisions of our amended and restated certificate of incorporation and bylaws may have the effect of delaying or preventing changes in control if our board of directors determines that such changes in control are not in the best interests of us and our stockholders. The provisions in our
37
amended and restated certificate of incorporation and bylaws will include, among other things, the following:
- •
- the ability of our board of directors to issue shares of preferred stock and to determine the price and other terms, including
preferences and voting rights, of those shares without stockholder approval;
- •
- following the time that the Tricor Funds and their affiliates cease to beneficially own a majority of our common stock, stockholder
action may only be taken at a special or regular meeting and not by written consent, and special meetings may only be called by a majority of the total number of directors that we would have if there
were no vacancies on our board of directors;
- •
- advance notice procedures for nominating candidates to our board of directors or presenting matters at stockholder meetings;
- •
- following the time that the Tricor Funds and their affiliates cease to beneficially own a majority of our common stock, removal of
directors only for cause, and only upon the affirmative vote of 75% of our outstanding voting stock at a meeting of our stockholders called for that purpose;
- •
- allowing only our board of directors to fill vacancies on our board of directors; and
- •
- following the time that the Tricor Funds and their affiliates cease to beneficially own a majority of our common stock, super-majority voting requirements to amend our bylaws and certain provisions of our certificate of incorporation.
In connection with this offering, we will enter into a Director Nomination Agreement (the "Director Nomination Agreement") with the Tricor Funds that provides the Tricor Funds the right to designate nominees for election to our board of directors for so long as the Tricor Funds collectively beneficially own 5% or more of the total number of shares of our common stock then outstanding. The number of nominees that the Tricor Funds are entitled to designate under the Director Nomination Agreement will bear the same proportion to the total number of members of our board of directors as the number of shares of common stock beneficially owned by the Tricor Funds bears to the total number of shares of common stock outstanding, rounded up to the nearest whole number. In addition, the Tricor Funds shall be entitled to designate the replacement for any of its board designees whose board service terminates prior to the end of such designee's term regardless of the Tricor Funds' beneficial ownership at such time. The Tricor Funds shall also have the right to have their designees participate on committees of our board of directors, subject to compliance with applicable law and stock exchange rules. The Director Nomination Agreement will terminate at such time as the Tricor Funds collectively own less than 5% of our outstanding common stock.
We will elect in our certificate of incorporation not to be subject to Section 203 of the Delaware General Corporation Law (the "DGCL"), an anti-takeover law. In general, Section 203 prohibits a publicly held Delaware corporation from engaging in a business combination, such as a merger, with a person or group owning 15% or more of the corporation's voting stock for a period of three years following the date the person became an interested stockholder, unless (with certain exceptions) the business combination or the transaction in which the person became an interested stockholder is approved in a prescribed manner. Accordingly, we will not be subject to any anti-takeover effects of Section 203. However, our certificate of incorporation will contain provisions that have the same effect as Section 203, except that they will provide that the Tricor Funds, their affiliates (including any investment funds managed by Tricor) and any person that becomes an interested stockholder as a result of a transfer of 5% or more of our voting stock by the forgoing persons to such person are excluded from the "interested stockholder" definition in our certificate of incorporation and are therefore not subject to the restrictions set forth therein that have the same effect as Section 203.
38
While these provisions have the effect of encouraging persons seeking to acquire control of our company to negotiate with our board of directors, they could enable the board of directors to hinder or frustrate a transaction that some, or a majority, of our stockholders might believe to be in their best interests and, in that case, may prevent or discourage attempts to remove and replace incumbent directors.
In addition, these provisions may frustrate or prevent any attempts by our stockholders to replace or remove our current management by making it more difficult for stockholders to replace members of our board of directors, which is responsible for appointing the members of our management. For more information regarding these provisions, see "Description of Capital Stock."
Any issuance of preferred stock could make it difficult for another company to acquire us or could otherwise adversely affect holders of our common stock, which could depress the price of our common stock.
Upon completion of this offering, our board of directors will have the authority to issue preferred stock and to determine the preferences, limitations and relative rights of shares of preferred stock and to fix the number of shares constituting any series and the designation of such series, without any further vote or action by our stockholders. Our preferred stock could be issued with voting, liquidation, dividend and other rights superior to the rights of our common stock. The potential issuance of preferred stock may delay or prevent a change in control of us, discouraging bids for our common stock at a premium over the market price, and adversely affect the market price and the voting and other rights of the holders of our common stock.
Our business and stock price may suffer as a result of our lack of public company operating experience. In addition, if securities or industry analysts do not publish research or publish inaccurate or unfavorable research about our business, our stock price and trading volume could decline.
We are a privately-held company. Our lack of public company operating experience may make it difficult to forecast and evaluate our future prospects. If we are unable to execute our business strategy, either as a result of our inability to effectively manage our business in a public company environment or for any other reason, our business, prospects, financial condition and results of operations may be harmed. In addition, as a new public company we do not currently have and may never obtain research coverage by securities and industry analysts. If no securities or industry analysts commence coverage of our company, the trading price for our stock would be negatively impacted. If we obtain securities or industry analyst coverage and if one or more of the analysts who covers us downgrades our stock or publishes inaccurate or unfavorable research about our business, our stock price would likely decline. If one or more of these analysts ceases coverage of us or fails to publish reports on us regularly, demand for our stock could decrease, which could cause our stock price and trading volume to decline.
39
This prospectus contains forward-looking statements that involve risks and uncertainties, such as statements about our plans, objectives, expectations, assumptions or future events. In some cases, you can identify forward-looking statements by terminology such as "anticipate," "estimate," "plan," "project," "continuing," "ongoing," "expect," "believe," "intend," "may," "will," "should," "could" and similar expressions. Examples of forward-looking statements include, without limitation:
- •
- statements regarding our growth and other strategies, results of operations or liquidity;
- •
- statements concerning projections, predictions, expectations, estimates or forecasts as to our business, financial and operational
results and future economic performance;
- •
- statements regarding our industry, including statements related to industry volume and revenue growth, EMV and Dual-Interface EMV
adoption, fraud reduction, Financial Payment Card renewal and replacement rates, growing prevalence of card-based payments, growth of particular industry segments and mobile payment adoption rates;
- •
- statements of management's goals and objectives;
- •
- projections of revenue, earnings, capital structure and other financial items;
- •
- assumptions underlying statements regarding us or our business; and
- •
- other similar expressions concerning matters that are not historical facts.
Forward-looking statements should not be read as a guarantee of future performance or results and will not necessarily be accurate indications of the times at, or by, which such performance or results will be achieved. Forward-looking statements are based on information available at the time those statements are made or management's good faith belief as of that time with respect to future events and are subject to risks and uncertainties that could cause actual performance or results to differ materially from those expressed in or suggested by the forward-looking statements. Important factors that could cause such differences include, but are not limited to, factors discussed under the headings "Risk Factors," "Management's Discussion and Analysis of Financial Condition and Results of Operations" and "Business."
Forward-looking statements involve estimates, assumptions, known and unknown risks, uncertainties and other factors that could cause actual results to differ materially from any future results, performances, or achievements expressed or implied by the forward-looking statements. These risks include, but are not limited to, those listed below and those discussed in greater detail under the heading "Risk Factors" above:
- •
- material breaches in the security of our systems;
- •
- market acceptance of developing technologies that make Financial Payment Cards less relevant;
- •
- a slower or less widespread adoption of EMV and Dual-Interface EMV technology than we anticipate;
- •
- difficulties in our production processes;
- •
- defects in our software;
- •
- our failure to operate our business in accordance with the PCI security standards or other industry standards such as Payment Card
Brand certification standards;
- •
- extension of card expiration cycles;
- •
- a decline in U.S. and global market and economic conditions;
40
- •
- failure to identify, attract and retain new customers or a failure to maintain our relationships with our major customers;
- •
- our substantial indebtedness;
- •
- infringement on our intellectual property rights, or claims that our technology is infringing on third-party intellectual property;
- •
- failure to meet our customers' demands in a timely manner;
- •
- competition in the payment card industry;
- •
- price erosion in the financial payment card industry;
- •
- costs related to product defects;
- •
- our dependence on licensing arrangements;
- •
- inability to renew leases for our facilities;
- •
- competitive disadvantage caused by the smart card systems of our competitors;
- •
- interruptions in our IT systems or production capabilities;
- •
- our dependence on the viability of payment card brands;
- •
- the restrictive terms of our credit facility and covenants of future agreements governing indebtedness;
- •
- loss of our key executives;
- •
- failure by our suppliers to meet their delivery obligations to us;
- •
- non-compliance with, and changes in, laws in foreign jurisdictions in which we operate and sell our products;
- •
- changes in laws relating to the financial services industry;
- •
- our liability under environmental, health and safety laws and regulations;
- •
- the occurrence of natural disasters;
- •
- fluctuations in currency exchange rates;
- •
- inadequate insurance to cover future liabilities;
- •
- challenges related to our acquisition strategy;
- •
- that we may never realize the full value of our intangible assets;
- •
- our ability to recruit, retain and develop qualified personnel;
- •
- fluctuations in our results of operations;
- •
- consolidations in the banking industry eliminating clients;
- •
- the credit risk presented by our customers;
- •
- our dependence on specialized equipment from third party suppliers;
- •
- the inability to maintain effective internal controls over financial reporting;
- •
- the increased costs of operating as a public company; and
- •
- our status as an "emerging growth company" and its effect on investors.
41
Additional risks and uncertainties not currently known to us or that we currently deem to be immaterial also may materially adversely affect our business, financial condition or operating results. Forward-looking statements are based on assumptions made in light of management's perception of trends, current conditions and expected developments, which may prove to be incorrect. Certain assumptions have been made with respect to the following, among others:
- •
- the successful completion of this offering;
- •
- the correctness of our market research and industry data referenced elsewhere in this prospectus;
- •
- our ability to accurately assess and anticipate trends in our industry;
- •
- the absence of material adverse changes in our industry or the global economy;
- •
- our ability to raise sufficient debt or equity financing if required to support our continued growth;
- •
- our ability to generate revenue while controlling our costs and expenses;
- •
- our ability to maintain current operating expenses;
- •
- our ability to realize our business objectives and manage cash flow;
- •
- our ability to manage and integrate acquisitions;
- •
- our ability to protect our intellectual property rights;
- •
- our continued compliance with third-party license terms and non-infringement of third-party intellectual property rights;
- •
- our ability to develop solutions that keep pace with the continuing changes in technology, evolving industry standards, changes to the
regulatory environment, new product introductions by competitors and changing merchant preferences and requirements;
- •
- our ability to engage and retain qualified key personnel and employees;
- •
- our ability to maintain good business relationships with our merchants and vendors;
- •
- our customers entering into anticipated contracts with us; and
- •
- the ability of our customers to perform their obligations under existing contracts.
While we believe our assumptions are reasonable, we caution that it is very difficult to predict the impact of known factors, and we may not be able to anticipate all factors that could affect our actual results.
The forward-looking statements speak only as of the date on which they are made, and, except as required by law, we undertake no obligation to update any forward-looking statement to reflect events or circumstances after the date on which the statement is made or to reflect the occurrence of unanticipated events. In addition, we cannot assess the impact of each factor on our business or the extent to which any factor, or combination of factors, may cause actual results to differ materially from those contained in any forward-looking statements. Consequently, you should not place undue reliance on forward-looking statements.
This prospectus includes industry data, forecasts and information that we have prepared based, in part, upon data, forecasts and information obtained from independent industry publications and surveys and other information available to us. In particular, this prospectus includes statistical data extracted from a market research report prepared by First Annapolis Consulting, Inc. ("First Annapolis"), which
42
was commissioned by us and was issued in May 2015. First Annapolis provides consulting and investment banking services with a focus on payments-based industries. Unless otherwise indicated, all industry and market data presented in this prospectus is derived from data estimated and reported by First Annapolis or estimated by us using such data as the primary source. Additionally, certain data in this prospectus is derived from The Nilson Report, a publication covering global payment systems. The data presented in this prospectus, including data provided by First Annapolis and The Nilson Report, involves a number of assumptions and limitations and contains projections and estimates of the future performance of the industry in which we operate that are subject to a high degree of uncertainty. We caution you not to give undue weight to such projections, assumptions and estimates. Some data contained in this prospectus is also based on our good faith estimates, which are derived from management's knowledge of the industry and independent sources. Industry publications, surveys and forecasts generally state that the information contained therein has been obtained from sources believed to be reliable; however, we have not independently verified any of the data from third-party sources nor have we ascertained the underlying economic assumptions relied upon therein. In addition, statements as to our market position and projections, assumptions and estimates of our future performance and the future performance of our industry are based on data currently available to us, and such estimates involve risks and uncertainties and are subject to change based on various factors, including those discussed under the heading "Risk Factors" in this prospectus.
USE OF NON-GAAP FINANCIAL INFORMATION
In this prospectus, we present EBITDA, Adjusted EBITDA and Adjusted EBITDA margin (calculated as Adjusted EBITDA divided by total net sales) (collectively, the "Non-GAAP Financial Measures"), as supplemental measures of our operating performance. EBITDA, Adjusted EBITDA and Adjusted EBITDA margin are non-GAAP financial measures that do not have any standardized meaning prescribed by U.S. GAAP and are therefore unlikely to be comparable to similar measures presented by other issuers. EBITDA is defined as income from continuing operations before interest expense, income taxes, depreciation and amortization. Adjusted EBITDA is defined as EBITDA plus adjustments for foreign currency gain or loss, loss on debt modification and early extinguishment, gain on purchase of ID Data, non-cash compensation expense related to our phantom stock plan that will be terminated in connection with this offering, performance bonuses earned in connection with the EFT Source acquisition and investment banking and related fees. The Non-GAAP Financial Measures are the primary measures used by our management to evaluate operating performance. We believe the Non-GAAP Financial Measures are useful to investors because they provide a means to evaluate our operating performance on an ongoing basis using criteria that are used by our internal decision makers and because they are frequently used by investors and other interested parties when comparing companies in our industry that have different financing and capital structures and/or tax rates. We believe the Non-GAAP Financial Measures are meaningful measures because they present a transparent view of our recurring operating performance and allow management to readily view operating trends, perform analytical comparisons and identify strategies to improve operating performance.
The Non-GAAP Financial Measures have limitations as analytical tools, and you should not consider them in isolation, or as a substitute for analysis of our operating results or cash flows as reported under GAAP. Some of these limitations are:
- •
- they do not reflect our cash expenditures, or future requirements, for capital expenditures or contractual commitments;
- •
- they do not reflect changes in, or cash requirements for, our working capital needs;
- •
- they do not reflect the significant interest expense, or the cash requirements necessary to service interest or principal payments, on our debt;
43
- •
- although depreciation is a non-cash charge, the assets being depreciated will often have to be replaced in the future, and the
Non-GAAP Financial measures do not reflect any cash requirements for such replacements;
- •
- they are not adjusted for all non-cash income or expense items that are reflected in our statements of cash flows; and
- •
- other companies in our industry may calculate these measures differently than we do, limiting their usefulness as comparative measures.
Because of these limitations, the Non-GAAP Financial Measures should not be considered as an alternative to net income (loss), income (loss) from operations, or any other performance measure derived in accordance with GAAP or as an alternative to cash flow from operating activities as a measure of our liquidity. We compensate for these limitations by relying primarily on our GAAP results and using the Non-GAAP Financial Measures only for supplemental purposes. Please see our consolidated financial statements contained elsewhere in this prospectus. Our measures of EBITDA, Adjusted EBITDA and Adjusted EBITDA margin are not necessarily comparable to other similarly titled captions of other companies due to potential inconsistencies in the methods of calculation. Our presentation of the Non-GAAP Financial Measures should not be construed as an inference that our future results will be unaffected by unusual or nonrecurring items.
For a reconciliation of EBITDA and Adjusted EBITDA to net income from continuing operations, the most comparable GAAP measure, see "Summary Consolidated Historical Financial Data."
This prospectus contains references to our trademarks and service marks. Solely for convenience, trademarks and trade names referred to in this prospectus may appear without the ® or TM symbols, but such references are not intended to indicate, in any way, that we will not assert, to the fullest extent under applicable law, our rights or the rights of the applicable licensor to these trademarks and trade names. In addition, this prospectus contains trade names, trademarks and service marks of other companies, which we do not own. We do not intend our use or display of other companies' trade names, trademarks or service marks to imply a relationship with, or endorsement or sponsorship of us by, these other companies.
44
Set forth below is a glossary of industry and other terms used in this prospectus:
"Automated Clearing House" ("ACH") is an electronic clearing and settlement system for electronic financial transactions among participating U.S. commercial banks and depository institutions.
"Card Personalization" is the process of preparing a Financial Payment Card for the cardholder, including the encoding, programming and embossing of the card with the account-specific information and related data (such as an account number). In certain cases, this will also include the cardholder's name.
"Card-Not-Present Fraud" is the unauthorized use of Financial Payment Card or Private Label Credit Card information to make transactions without physically swiping or inserting a card into a POS terminal, often when the card and its information cannot be visually verified by a merchant. This type of fraud can be conducted over the Internet, by phone, by fax or by mail, or by manually inputting card information into a POS terminal.
"Card-Present Fraud" occurs when a Financial Payment Card or Private Label Credit Card is used to make an unauthorized transaction in a face-to-face setting, such as a retail store checkout lane. This type of fraud may involve the use of the actual stolen card or a fraudulent duplicated card made using card and cardholder information.
"Contact EMV" represents a Financial Payment Card with an embedded microprocessor, which interfaces with an EMV payment terminal over a contact plate on the surface of the card when inserted into the terminal. These cards are commonly referred to as "chip cards."
"Contactless Cards" are Financial Payment Cards with an RFID antenna, allowing transactions to be completed using Near Field Communication in proximity to an NFC-enabled payment terminal without having to physically insert the card into the terminal.
"Dual-Interface EMV" refers to cards which contain both "contact" and "contactless" EMV technology and functionalities.
"EMV" or "EMV standard," named for the original organizations that developed the standard (Europay, MasterCard and Visa), is a technologically advanced high-security protocol designed to reduce the fraud to which magnetic stripe cards are susceptible. The EMV standard for Financial Payment Cards utilizes an embedded microprocessor that, when paired with an EMV payment terminal, dynamically authenticates cardholder debit and credit card transactions using a cryptographic process that results in a significantly more secure payment transaction environment.
"Financial Payment Cards" are credit, debit and Prepaid Debit Cards issued on the network of one of the Payment Card Brands.
"General Purpose Reloadable Cards" ("GPR Cards") are a type of open-loop Prepaid Debit Card generally acquired through retail channels, both in-store and online. The user of a GPR card registers the card with the issuing bank or licensed money transmitter, determines the card's spending limit by adding money directly to the account and can reload the card with additional funds as needed. These cards lack the account requirements typically needed for a traditional debit or credit card (such as a credit check).
"Group Service Provider" is an organization that assists small issuers, such as credit unions, with managing their credit and debit card programs, including managing the Financial Payment Card issuance process.
"Large Issuer" is defined as the top 20 U.S. debit and credit card issuers, including financial institutions such as JPMorgan Chase, Bank of America, American Express and Wells Fargo.
45
"Liability Shift" is an agreement among the Payment Card Brands that, effective October 1, 2015, the party that caused a non-EMV transaction to occur (i.e., either the card issuer or the merchant) will be held financially liable for any resulting counterfeit fraud losses.
"Near Field Communications" ("NFC") is a wireless technology that uses radio waves to enable communication over short distances (e.g., 4 cm), such as between a Contactless Card and a point of sale terminal.
"Net Promoter Score" ("NPS") is a measure of customer loyalty calculated from customer surveys conducted by an independent research firm. Respondents judge how likely they would be willing to recommend a particular company to a colleague, answering on a scale of one to ten. NPS is calculated by taking the respondents who are enthusiastic promoters (a nine or a ten rating) and subtracting the percentage who are detractors (a one through six rating).
"Payment Card Brands" are the operators of the debit and credit financial payment networks: Visa; MasterCard; American Express and Discover.
"Payment Card Industry Security Standards Council" ("PCI") is an open global forum, launched in 2006, that is responsible for the development, management, education and awareness of the PCI Security Standards, including the Data Security Standard (PCI DSS), Payment Application Data Security Standard (PA-DSS) and PIN Transaction Security (PTS) requirements.
"Prepaid Debit Cards" share many of the functional features and conveniences of traditional bank debit cards; they are issued on the network of a Payment Card Brand and usable in the same manner as a bank debit card. However, these cards are not linked to a traditional bank account, are easier to acquire (they do not require a credit check) and require cardholders to load money onto the card in advance of any transaction. Prepaid debit cards are sometimes referred to as "open-loop cards" to denote their acceptance on a network of the Payment Card Brands and to contrast them to retail gift or loyalty cards that are referred to as "closed-loop cards" and can only be used at a merchant whose brand such card carries (e.g. a Starbucks card).
"Private Label Credit Cards" are credit cards that an individual merchant issues for exclusive use in its own stores. Such cards are generally not issued on the network of a Payment Card Brand and therefore do not constitute Financial Payment Cards.
"Point of Sale ("POS") Terminals" are physical hardware installed in merchant locations that enables the electronic processing of card payments by transmitting account information and sales data through a payment network operated by one of the Payment Card Brands (and often facilitated by a merchant acquirer and/or card processor) to the issuing institution of the Financial Payment Card. POS Terminals acquire cardholder account information by reading the data stored on a card's magnetic stripe, contactless chip, or EMV-enabled microprocessor or, alternatively, by manual entry.
"Radio-Frequency Identification" ("RFID") is a technology that uses electronic tags placed on objects to relay identifying information to an electronic reader by means of radio waves.
"Small Issuer" is defined as all issuers other than the Large Issuers, including financial institutions such as regional banks, independent community banks and credit unions that issue Financial Payment Cards.
"Trusted Service Manager" ("TSM") is a role within the ecosystem of NFC payments, acting as a neutral broker that coordinates the technical and business relationships of the various participants, including mobile network operators and service providers such as card-issuing banks. Trusted Service Managers can act either within a secure element, such as an embedded microprocessor, or in the cloud, via host card emulation technology.
"unbanked" refers to households or persons that do not hold an account at an institution insured by the Federal Deposit Insurance Corporation ("FDIC").
"underbanked" refers to households or persons that hold an account at an institution insured by the FDIC and have also used at least one of the following alternative financial services from non-bank providers in the last 12 months: money orders, check cashing, remittances, payday loans, refund anticipation loans, rent-to-own services, pawn shops loans or auto title loans.
46
We estimate that the net proceeds from our issuance and sale of 12,216,000 shares of common stock in this offering will be approximately $140.1 million, assuming an initial public offering price of $12.50 per share, which is the midpoint of the price range listed on the cover page of this prospectus, and after deducting underwriting discounts and commissions and offering expenses payable by us. The selling stockholders expect to receive net proceeds of approximately $44.9 million, assuming an initial public offering price of $12.50 per share, which is the midpoint of the price range listed on the cover page of this prospectus, and after deducting underwriting discounts and commissions and offering expenses payable by the selling stockholders (or if the underwriters exercise in full their over-allotment option, we estimate that the selling stockholders will receive net proceeds of approximately $73.4 million). Of the proceeds going to the selling stockholders, the Tricor Funds expect to receive net proceeds of approximately $36.1 million. We will not receive any proceeds from the sale of shares by the selling stockholders.
A $1.00 increase (decrease) in the assumed initial public offering price of $12.50 per share would increase (decrease) our net proceeds from this offering by approximately $11.6 million, assuming that the number of shares offered by us, as set forth on the cover page of this prospectus, remains the same and after deducting the underwriting discounts and commissions and offering expenses payable by us.
We intend to use approximately $11.8 million of the net proceeds from this offering to redeem the remaining outstanding shares of our preferred stock, approximately $13.3 million of the net proceeds to terminate our phantom stock plan and to satisfy all liabilities due thereunder and the remainder of the net proceeds to repay outstanding indebtedness under our New Term Loan Facility incurred in connection with the Partial Preferred Redemption. As of August 17, 2015, an aggregate of approximately $435.0 million of borrowings were outstanding under our New Term Loan Facility. The interest rate on the $435.0 million of borrowings outstanding under our New Term Loan Facility at August 17, 2015 was 5.5%. Our New Term Loan Facility matures on August 17, 2022. Borrowings under our New Credit Facility have been used to fund the Partial Preferred Redemption and to repay indebtedness under our previously outstanding term loan facility, and we expect to use our New Credit Facility in the future to fund capital expenditures, for acquisition activity and for general corporate purposes.
Redeeming the remaining outstanding shares of our preferred stock, terminating our phantom stock plan and repaying outstanding borrowings under our New Term Loan Facility will achieve the objective of optimizing our capital structure in connection with the offering. Subject to the use of the net proceeds described herein, we may use any remaining net proceeds for general corporate and working capital purposes.
47
Following the consummation of this offering, we expect to pay quarterly cash dividends on our common stock beginning in the first quarter of 2016 in an initial amount of approximately $0.05 per share, subject to the sole discretion of our board of directors and the considerations discussed below. We intend to fund any future dividends from distributions made by our operating subsidiaries from their available cash generated from operations.
Future cash dividends, if any, will be at the discretion of our board of directors and the amount of cash dividends per share will depend upon, among other things, our future operations and earnings, capital requirements and surplus, general financial condition, contractual restrictions, number of shares of common stock outstanding and other factors our board of directors may deem relevant. The timing and amount of future dividend payments will be at the discretion of our board of directors.
In addition, because we are a holding company with no material direct operations, we are dependent on loans, dividends and other payments from our operating subsidiaries to generate the funds necessary to pay dividends on our common stock. We may be restricted from paying cash dividends on our common stock in certain circumstances, including by the covenants in our New Credit Facility, and may be further restricted by the terms of future debt or preferred securities. See "Risk Factors—Risks Related to Ownership of our Common Stock—Our ability to pay regular dividends to our stockholders is subject to the discretion of our board of directors and may be limited by our holding company structure and applicable provisions of Delaware law" and "Description of Certain Indebtedness."
Our dividend policy entails certain risks and limitations, particularly with respect to liquidity. Although we expect to pay dividends according to our dividend policy, we may not pay dividends according to our policy, or at all, if, among other things, we do not have the cash necessary to pay our intended dividends. By paying cash dividends rather than saving or investing that cash, we risk, among other things, slowing the pace of our growth and having insufficient cash to fund our operations or unanticipated capital expenditures.
48
The following table sets forth our capitalization as of June 30, 2015:
- •
- on an actual basis;
- •
- on an adjusted basis to give effect to our entering into the New Credit Agreement, repaying borrowings under our previously
outstanding term loan facility and effecting the Partial Preferred Redemption; and
- •
- on a further adjusted basis to give further effect to (i) the issuance of 12,216,000 shares of common stock in this offering and (ii) our receipt of the estimated net proceeds from the sale of shares of common stock offered by us in this offering at an assumed initial public offering price of $12.50 per share, the midpoint of the price range set forth on the cover of this prospectus, after deducting the underwriting discounts and commissions and estimated offering expenses payable by us, and the application of the net proceeds as described in "Use of Proceeds."
This information should be read in conjunction with "Use of Proceeds," "Selected Consolidated Financial Data," "Management's Discussion and Analysis of Financial Condition and Results of Operations" and the historical consolidated financial statements and related notes appearing elsewhere in this prospectus.
| |
As of June 30, 2015 | |||||||||
|---|---|---|---|---|---|---|---|---|---|---|
| |
Actual | As Adjusted | As Further Adjusted(1) |
|||||||
| |
(in thousands except share data) |
|||||||||
Debt: |
||||||||||
Long-term debt (including current portion)(2) |
$ | 158,420 | $ | 435,000 | $ | 320,000 | ||||
EFT Sellers Note(3) |
9,000 | 9,000 | 9,000 | |||||||
| | | | | | | | | | | |
Total debt |
167,420 | 444,000 | 329,000 | |||||||
Commitments and contingencies: |
||||||||||
Series A preferred stock; par value $0.001 per share; 64,716 shares outstanding with liquidation preference of $281,005 on an actual basis; 2,576 shares outstanding with liquidation preference of $11,185 on an as adjusted basis and 0 shares outstanding on an as further adjusted basis(4) |
57,880 | 2,304 | — | |||||||
Stockholders' deficit:(5) |
||||||||||
Common stock, par value $0.001 per share; 75,000,000 authorized shares, 41,476,116 shares outstanding on an actual and as adjusted basis and 53,692,116 shares outstanding on an as further adjusted basis(6) |
2 | 2 | 14 | |||||||
Additional paid-in capital |
(24,848 | ) | (245,590 | ) | (114,998 | ) | ||||
Accumulated earnings |
24,194 | 23,756 | 12,653 | |||||||
Accumulated other comprehensive loss |
(2,930 | ) | (2,930 | ) | (2,930 | ) | ||||
Employee notes receivable |
(108 | ) | — | — | ||||||
| | | | | | | | | | | |
Total stockholders' deficit |
(3,690 | ) | (224,762 | ) | (105,261 | ) | ||||
| | | | | | | | | | | |
Total capitalization |
$ | 221,610 | $ | 221,542 | $ | 223,739 | ||||
| | | | | | | | | | | |
| | | | | | | | | | | |
| | | | | | | | | | | |
- (1)
- A $1.00 increase or decrease in the assumed initial public offering price of $12.50 per share, the midpoint of the price range set forth on the cover of this prospectus, would result in an approximately $11.6 million increase or decrease in each of long-term debt (including current portion), additional paid-in capital, total stockholders' equity and total capitalization, assuming that the number of shares offered by us set forth on the cover of this prospectus remains the same, and after deducting the underwriting discounts and commissions and estimated offering expenses payable by us. Each 1.0 million increase or decrease in the number of shares offered by us would increase or decrease, additional paid-in capital, total stockholders' deficit and total capitalization by approximately $11.9 million in total, assuming the initial public offering price of $12.50 per share, the midpoint of the price range set forth on the cover of this prospectus, remains the same, and after deducting the underwriting discounts and commissions and estimated offering expenses payable by us. The as further adjusted information discussed above is illustrative only and will change based on the actual initial public offering price and other terms of this offering.
49
- (2)
- Actual
long-term debt as of June 30, 2015 consists of borrowings under the Company's previously outstanding term loan facility, which
was repaid in connection with our entering into the New Credit Agreement. As Adjusted long-term debt consists of borrowings of $435.0 million under the New Term Loan Facility, which were used
to repay the remaining $158.4 million of borrowings outstanding under the Company's previous term loan facility, effect the Partial Preferred Redemption in the amount of $276.3 million,
and pay related transaction fees and expenses of $17.6 million. In conjunction with the Partial Preferred Redemption, the Company received $0.1 million in full settlement of the employee
notes receivable. The Company wrote off $0.4 million of deferred financing costs which were associated with the previous loan facility. As Further Adjusted long-term debt gives effect to the
repayment of $115.0 million of borrowings under the New Term Loan Facility using a portion of the net proceeds of this offering. As a result of the repayment of borrowings under the New Term
Loan Facility, $4.4 million of capitalized loan fees were written off to accumulated earnings. See "Management's Discussion and Analysis of Financial Condition and Results of
Operations—Liquidity and Capital Resources" and "Description of Certain Indebtedness."
- (3)
- As
partial consideration for the Company's acquisition of EFT Source, the Company issued a $9 million subordinated promissory note
bearing interest at 5% per annum, which matures on the earlier of (i) September 2, 2016, (ii) twelve months following the consummation of an initial public offering or
(iii) the occurrence of certain change of control events.
- (4)
- As
of June 30, 2015, 1,970 shares of Series A Preferred Stock were subject to a put, where employees holding these shares
upon termination of their employment have the option to require us to purchase the shares at the then current liquidation preference. As of June 30, 2015, the liquidation preference of the
Series A Preferred Stock had a value of approximately $4,342.12 per outstanding share for a total aggregate cumulative liquidation value of $281.0 million. On August 17, 2015, we
effected the Partial Preferred Redemption in which we redeemed 62,140 shares of preferred stock at an aggregate value of $276.3 million using a portion of the proceeds from the New
Credit Facility, as described in note 2 above. Of the $276.3 million, $55.6 million was a return of capital, which reduced the commitments and contingencies balance related to the
Series A Preferred Stock, and the remaining $220.7 million was treated as a dividend, which reduced the additional paid-in capital balance of stockholders' deficit. The impacts of the
Partial Preferred Redemption are reflected in the As Adjusted column of the table above. The As Further Adjusted column gives effect to the redemption of the remaining 2,576 shares of
Series A Preferred Stock at a liquidation value of $11.8 million using a portion of the net proceeds from this offering. The redemption of these shares includes a $2.3 million
return of capital, which reduces the Series A Preferred Stock, and the remaining $9.5 million is treated as a dividend, which reduces the additional paid-in capital balance of
stockholders' deficit.
- (5)
- The
As Further Adjusted column gives effect to the issuance of 12,216,000 shares of common stock for proceeds of $152.7 million,
at an assumed initial public offering price of $12.50 per share, the midpoint of the price range set forth on the cover of this prospectus. The gross proceeds of $152.7 million increased the
common stock by the associated par value, with the remainder increasing additional paid-in capital. The application of the proceeds is reflected as follows: $115.0 million to repay debt
(described in note 2 above), $11.8 million to redeem the remaining Series A Preferred Stock (described in note 4 above) and $13.3 million to satisfy all liabilities
under the Phantom Stock Plan (of which $6.6 million was accrued in other long-term liabilities and the remaining $6.7 million was charged to accumulated earnings) as we will be required
to record a compensation charge related to the acceleration of the vesting of the awards upon completion of our initial public offering. The total offering expenses of $12.6 million offset the
total proceeds received in conjunction with the offering and reduced additional paid-in capital. At June 30, 2015, the Company had paid $0.9 million of offering related costs, which are
included in other long term assets.
- (6)
- Numbers of shares of common stock outstanding reflect the 22-for-1 stock split effected on September 3, 2015. In connection with the stock split, we amended our certificate of incorporation to increase the number of authorized shares of common stock to 75,000,000. In connection with the consummation of this offering, we will adopt an amended and restated certificate of incorporation in which we will further increase the number of authorized shares of common stock to 100,000,000. See "Description of Capital Stock."
50
If you purchase our common stock in this offering, your ownership interest will be immediately diluted to the extent of the difference between the initial public offering price per share of our common stock and the net tangible book value per share of our common stock after this offering. Dilution results from the fact that the initial public offering price per share of our common stock is substantially in excess of the book value per share of common stock attributable to the existing stockholders for the currently outstanding shares of common stock.
Our pro forma net tangible book value as of June 30, 2015 was $(352.7) million, or $(8.54) per share of common stock after giving effect to our entry into the New Credit Agreement, repaying borrowings under our previously outstanding term loan facility, the Partial Preferred Redemption and the 22-for-1 stock split effected on September 3, 2015. Pro forma net tangible book value per share represents the amount of our total tangible assets less total liabilities, divided by the basic weighted average number of shares of common stock that will be outstanding immediately prior to the completion of the offering.
After giving effect to the sale of the 12,216,000 shares of common stock offered by us in this offering at an assumed initial public offering price of $12.50 per share, the midpoint of the price range set forth on the cover of this prospectus, less estimated underwriting discounts and commissions and estimated offering expenses payable by us, and the application of proceeds therefrom, our pro forma net tangible book value as of June 30, 2015 would have been approximately $(222.3) million, or $(4.14) per share of common stock after giving effect to this offering. This represents an immediate increase in net tangible book value to our existing stockholders of $4.40 per share and an immediate dilution to purchasers in this offering of $16.64 per share. The following table illustrates this pro forma per share dilution in net tangible book value to purchasers.
Assumed initial public offering price per share |
$ | 12.50 | ||||||
Pro forma net tangible book value (deficit) per share as of June 30, 2015 |
(8.54 | ) | ||||||
Increase per share attributable to purchasers in this offering |
4.40 | |||||||
Pro forma net tangible book value per share after giving effect to this offering |
(4.14 | ) | ||||||
| | | | | | | | | |
Dilution in pro forma net tangible book value per share to purchasers in this offering |
$ | 16.64 | ||||||
| | | | | | | | | |
| | | | | | | | | |
| | | | | | | | |
A $1.00 increase or decrease in the assumed initial public offering price of $12.50 per share, the midpoint of the price range set forth on the cover of this prospectus, would increase or decrease pro forma net tangible book value by $11.6 million, or $0.22 per share, and would increase or decrease the dilution per share to purchasers in this offering by $1.22, based on the assumptions set forth above.
The following table summarizes as of June 30, 2015, on an as adjusted basis, the number of shares of common stock purchased, the total consideration paid and the average price per share paid by purchasers in this offering, based upon an assumed initial public offering price of $12.50 per share, the midpoint of the initial public offering price range on the cover page of this prospectus, and before deducting estimated underwriting discounts and commissions and estimated offering expenses payable by us:
| |
|
|
Total consideration |
|
||||||||||||
|---|---|---|---|---|---|---|---|---|---|---|---|---|---|---|---|---|
| |
Shares purchased | |
||||||||||||||
| |
Average price per share |
|||||||||||||||
| |
Number | Percent | Amount | Percent | ||||||||||||
| |
(millions) |
|
(millions) |
|
|
|||||||||||
Existing stockholders |
37.7 | 70.2 | % | $ | 35.8 | 15.2 | % | $ | 1.09 | |||||||
New investors |
16.0 | 29.8 | 200.0 | 84.8 | 12.50 | |||||||||||
| | | | | | | | | | | | | | | | | |
Total |
53.7 | 100 | % | $ | 235.8 | 100 | % | |||||||||
51
Except as otherwise indicated, the discussion and tables above assume no exercise of the underwriters' option to purchase additional shares and no exercise of any outstanding options. If the underwriters' option to purchase additional shares is exercised in full, our existing stockholders would own approximately 65.7% and purchasers in this offering would own approximately 34.3% of the total number of shares of our common stock outstanding after this offering.
The tables and calculations above are based on 41,476,116 shares of common stock outstanding as of June 30, 2015. This number excludes, as of June 30, 2015, an aggregate of 4,000,000 shares of common stock reserved for issuance under the Omnibus Plan that we intend to adopt in connection with this offering, including 770,450 shares of common stock underlying stock options to be issued in connection with this offering, and 528,000 shares of common stock issuable upon the exercise of outstanding options under the Option Plan.
52
SELECTED CONSOLIDATED FINANCIAL DATA
The following tables set forth our selected consolidated historical financial data. You should read the information set forth below in conjunction with "Use of Proceeds," "Capitalization," "Management's Discussion and Analysis of Financial Condition and Results of Operations" and our consolidated historical financial statements and notes thereto included elsewhere in this prospectus. The statements of income data for the years ended December 31, 2014, 2013 and 2012 and the balance sheet data as of December 31, 2014 and 2013 are derived from our audited consolidated financial statements included elsewhere in this prospectus. The statements of income data for the six months ended June 30, 2015 and 2014 and the balance sheet data as of June 30, 2015 are derived from our unaudited condensed consolidated financial statements included elsewhere in this propectus. See "Index to Consolidated Financial Statements." Results of interim periods are not necessarily indicative of the results expected for a full year or for future periods.
| |
Six Months Ended June 30, |
Year Ended December 31, | ||||||||||||||
|---|---|---|---|---|---|---|---|---|---|---|---|---|---|---|---|---|
| |
2015 | 2014 | 2014 | 2013 | 2012 | |||||||||||
| |
(unaudited) |
|
|
|
||||||||||||
| |
(in thousands, except share and per share data) |
|||||||||||||||
Statement of Income Data: |
||||||||||||||||
Net sales |
||||||||||||||||
Products |
$ | 112,771 | $ | 58,905 | $ | 159,220 | $ | 101,360 | $ | 98,969 | ||||||
Services |
60,075 | 36,862 | 101,786 | 95,010 | 84,817 | |||||||||||
| | | | | | | | | | | | | | | | | |
Total net sales |
172,846 | 95,767 | 261,006 | 196,370 | 183,786 | |||||||||||
Cost of sales |
111,503 | 69,969 | 179,279 | 136,874 | 130,897 | |||||||||||
| | | | | | | | | | | | | | | | | |
Gross profit |
61,343 | 25,798 | 81,727 | 59,496 | 52,889 | |||||||||||
Operating expenses |
29,959 | 16,262 | 47,255 | 33,347 | 32,985 | |||||||||||
| | | | | | | | | | | | | | | | | |
Income from operations |
31,384 | 9,536 | 34,472 | 26,149 | 19,904 | |||||||||||
Other income (expense) |
||||||||||||||||
Interest, net |
(3,505 | ) | (3,444 | ) | (7,508 | ) | (7,838 | ) | (5,765 | ) | ||||||
Foreign currency gain (loss) |
149 | (211 | ) | (124 | ) | (142 | ) | (279 | ) | |||||||
Loss on debt modification and early extinguishment |
— | — | (476 | ) | — | — | ||||||||||
Gain on purchase of ID Data |
— | — | — | — | 604 | |||||||||||
Other income (expense) |
61 | 19 | (101 | ) | 18 | 171 | ||||||||||
| | | | | | | | | | | | | | | | | |
Income before taxes |
28,089 | 5,900 | 26,263 | 18,187 | 14,635 | |||||||||||
Provision for income taxes |
(9,974 | ) | (2,334 | ) | (10,291 | ) | (6,988 | ) | (5,909 | ) | ||||||
| | | | | | | | | | | | | | | | | |
Net income from continuing operations |
18,115 | 3,566 | 15,972 | 11,199 | 8,726 | |||||||||||
Loss from discontinued operations, net of taxes(1) |
(606 | ) | (2,763 | ) | (2,670 | ) | (2,612 | ) | (3,796 | ) | ||||||
Gain on sale of discontinued operation, net of taxes(1) |
887 | — | — | — | — | |||||||||||
| | | | | | | | | | | | | | | | | |
Net income |
$ | 18,396 | $ | 803 | $ | 13,302 | $ | 8,587 | 4,930 | |||||||
| | | | | | | | | | | | | | | | | |
| | | | | | | | | | | | | | | | | |
| | | | | | | | | | | | | | | | | |
Net income (loss) per share:(2) |
||||||||||||||||
Basic and Diluted—Continuing Operations |
$ | (0.18 | ) | $ | (0.42 | ) | $ | (0.69 | ) | $ | (0.59 | ) | (0.67 | ) | ||
Basic and Diluted—Discontinued Operations |
0.01 | (0.07 | ) | (0.07 | ) | (0.06 | ) | (0.09 | ) | |||||||
| | | | | | | | | | | | | | | | | |
Total |
$ | (0.17 | ) | $ | (0.49 | ) | $ | (0.76 | ) | $ | (0.65 | ) | $ | (0.76 | ) | |
| | | | | | | | | | | | | | | | | |
| | | | | | | | | | | | | | | | | |
| | | | | | | | | | | | | | | | | |
Weighted average shares outstanding: |
||||||||||||||||
Basic and Diluted |
41,312,854 | 41,113,952 | 41,199,246 | 41,072,350 | 41,264,828 | |||||||||||
Other Financial Data: |
||||||||||||||||
Depreciation and amortization |
$ | 8,040 | $ | 5,614 | $ | 13,252 | $ | 11,595 | $ | 10,514 | ||||||
Capital expenditures |
10,390 | 6,578 | 15,568 | 10,628 | 9,113 | |||||||||||
EBITDA(3) |
39,634 | 14,958 | 47,023 | 37,620 | 30,914 | |||||||||||
Adjusted EBITDA(3) |
41,897 | 14,577 | 54,219 | 38,372 | 30,589 | |||||||||||
53
| |
|
As of December 31, | ||||||||
|---|---|---|---|---|---|---|---|---|---|---|
| |
As of June 30, 2015 |
|||||||||
| |
2014 | 2013 | ||||||||
| |
(unaudited) |
|
|
|||||||
| |
(in thousands) |
|||||||||
Consolidated Balance Sheet Data: |
||||||||||
Cash and cash equivalents |
$ | 13,007 | $ | 12,941 | $ | 9,702 | ||||
Total current assets |
107,808 | 88,719 | 65,958 | |||||||
Net property, equipment and leasehold improvements |
48,431 | 44,772 | 36,650 | |||||||
Total assets |
287,784 | 266,624 | 171,867 | |||||||
Total debt |
167,420 | 179,424 | 122,306 | |||||||
Total stockholders' deficit |
(3,690 | ) | (21,694 | ) | (36,896 | ) | ||||
- (1)
- We
sold our operating segment located in Nevada in January 2015. This operating segment primarily produced retail gift cards that are not
issued on the networks of the Payment Card Brands. Accordingly, the Company's consolidated balance sheets, and statements of operations and comprehensive income (loss), and statements of cash flows
have been reclassified to present this operating segment as a discontinued operation as of and for the years ended December 31, 2014, 2013 and 2012 and the six months ended June 30, 2015
and 2014. See Note 4 (Discontinued Operation and Disposition) to our audited consolidated financial statements and Note 3 (Discontinued Operation and Disposition) to our unaudited
condensed consolidated financial statements, each appearing elsewhere in this prospectus.
- (2)
- For
a computation of historical basic and diluted earnings per share attributable to continuing and discontinued operations, see
Note 14 (Earnings per Share) to our audited consolidated financial statements and Note 13 (Earnings per Share) to our unaudited condensed consolidated financial statements, each
appearing elsewhere in this prospectus.
- (3)
- EBITDA is defined as income from continuing operations before interest expense, income taxes, depreciation and amortization. Adjusted EBITDA is defined as EBITDA plus adjustments for foreign currency gain or loss, loss on debt modification and early extinguishment, gain on purchase of ID Data, non-cash compensation expense related to our phantom stock plan that will be terminated in connection with this offering, performance bonuses earned in connection with the EFT Source acquisition and investment banking and related fees. EBITDA and Adjusted EBITDA are Non-GAAP Financial Measures that do not have any standardized meaning prescribed by GAAP and are therefore unlikely to be comparable to similar measures presented by other issuers. The Non-GAAP Financial Measures are the primary measures used by our management to evaluate operating performance. The Non-GAAP Financial Measures are the primary measures used by our management to evaluate operating performance. We believe the Non-GAAP Financial Measures are useful to investors because they provide a means to evaluate our operating performance on an ongoing basis using criteria that are used by our internal decision makers and because they are frequently used by investors and other interested parties when comparing companies in our industry that have different financing and capital structures and/or tax rates. We believe the Non-GAAP Financial Measures are meaningful measures because they present a transparent view of our recurring operating performance and allow management to readily view operating trends, perform analytical comparisons and identify strategies to improve operating performance. The Non-GAAP Financial Measures, however, are not measures of our liquidity or financial performance under GAAP and should not be considered as an alternative to net income (loss), income (loss) from operations, or any other performance measure derived in accordance with GAAP or as an alternative to cash flow from operating activities as a measure of our liquidity. The use of the Non-GAAP Financial Measures instead of net income (loss) has limitations as an analytical tool, including the inability to determine profitability; the exclusion of interest expense, interest income and associated significant cash requirements; and the exclusion of depreciation and amortization, which represent unavoidable operating costs. The Non-GAAP Financial Measures are not necessarily comparable to other similarly titled captions of other companies due to potential inconsistencies in the methods of calculation.
54
- The following is a reconciliation of net income from continuing operations to EBITDA and Adjusted EBITDA:
| |
Six Months Ended June 30, |
Year Ended December 31, | ||||||||||||||
|---|---|---|---|---|---|---|---|---|---|---|---|---|---|---|---|---|
| |
2015 | 2014 | 2014 | 2013 | 2012 | |||||||||||
| |
(in thousands) |
|||||||||||||||
Net income from continuing operations |
$ | 18,115 | $ | 3,566 | 15,972 | 11,199 | $ | 8,726 | ||||||||
Depreciation and amortization |
8,040 | 5,614 | 13,252 | 11,595 | 10,514 | |||||||||||
Interest, net |
3,505 | 3,444 | 7,508 | 7,838 | 5,765 | |||||||||||
Provision for income taxes |
9,974 | 2,334 | 10,291 | 6,988 | 5,909 | |||||||||||
| | | | | | | | | | | | | | | | | |
EBITDA |
39,634 | 14,958 | 47,023 | 37,620 | 30,914 | |||||||||||
Foreign currency (gain) loss |
(149 | ) | 211 | 124 | 142 | 279 | ||||||||||
Loss on debt modification and early extinguishment(a) |
— | — | 476 | — | — | |||||||||||
Gain on purchase of ID Data(b) |
— | — | — | — | (604 | ) | ||||||||||
Non-cash compensation expense(c) |
1,503 | (591 | ) | 4,534 | 610 | — | ||||||||||
EFT Source performance bonuses(d) |
500 | — | — | — | — | |||||||||||
Investment banking and related fees(e) |
409 | — | 2,062 | — | — | |||||||||||
| | | | | | | | | | | | | | | | | |
Adjusted EBITDA |
$ | 41,897 | $ | 14,577 | $ | 54,219 | $ | 38,372 | $ | 30,589 | ||||||
| | | | | | | | | | | | | | | | | |
| | | | | | | | | | | | | | | | | |
| | | | | | | | | | | | | | | | | |
- (a)
- Represents
loss on the modification of our indebtedness in connection with the acquisition of EFT Source.
- (b)
- Represents
gain on our purchase of certain assets of ID Data, Limited.
- (c)
- Represents
compensation expense incurred in connection with the Company's phantom stock plan. See "Management's Discussion and Analysis of
Financial Condition and Results of Operations—Critical Accounting Policies and Estimates—Phantom Stock Plan" and "Executive Compensation—CPI Acquisition, Inc.
Phantom Stock Plan."
- (d)
- Represents
performance bonuses earned in connection with the acquisition of EFT Source.
- (e)
- Includes investment banking, advisory and related professional fees and expenses incurred in connection with the EFT Source acquisition and our consideration of liquidity alternatives.
55
MANAGEMENT'S DISCUSSION AND ANALYSIS OF
FINANCIAL CONDITION AND RESULTS OF OPERATIONS
The following discussion and analysis of our financial condition and results of operations is intended to help prospective investors understand our business, results of operations, liquidity and capital resources and should be read in conjunction with our consolidated financial statements and related notes appearing elsewhere in this prospectus. This discussion and analysis contains forward-looking statements that involve risks, uncertainties and assumptions. Our actual results may differ materially from those anticipated in these forward-looking statements as a result of certain factors, including, but not limited to, those which are not within our control. See "Forward-Looking Statements." Our 2014 reported results include four months of results from EFT Source, and references to pro forma results give effect to our acquisition of EFT Source as if such acquisition occurred on January 1, 2014.
Company Overview
We are a leading provider of comprehensive Financial Payment Card solutions in North America. We define Financial Payment Cards as credit, debit and Prepaid Debit Cards issued on the networks of the Payment Card Brands (Visa, MasterCard, American Express and Discover) and Interac (in Canada). In 2014, we produced over 360 million Financial Payment Cards, provided integrated card services to over 3,200 card-issuing banks and Prepaid Debit Card issuers and personalized more than 130 million Financial Payment Cards. We have established a leading position in the Financial Payment Card market through more than 20 years of experience and are focused primarily on this growing subsector of the financial technology market. Our customers are primarily leading national and regional banks, independent community banks, credit unions, managers of prepaid debit programs, Group Service Providers and card processors. We serve a diverse set of over 4,000 direct and indirect customers, including many of the largest North American issuers of debit and credit cards such as JPMorgan Chase, Bank of America, American Express and Wells Fargo, the largest global managers of Prepaid Debit Card programs, including InComm, Green Dot, Blackhawk Network and American Express, as well as thousands of independent community banks, credit unions, Group Service Providers and card processors.
We serve our customers through a network of nine production and card services facilities, including seven high-security facilities in North America that are each certified by one or more of the Payment Card Brands and Interac (in Canada) and, where required by our customers, the PCI Security Standards Council. We have the largest such network of high-security production facilities in North America, allowing us to optimize our solutions offerings to serve the needs of our diverse and long-term customer base.
In addition to our seven North American facilities, we have two facilities in the United Kingdom that produce retail cards, such as gift and loyalty cards that are not issued on the networks of the Payment Card Brands, as well as provide personalization services.
For the six months ended June 30, 2015, we generated net sales of $172.8 million, which represented an increase of 80.5% as compared to the six months ended June 30, 2014, net income from continuing operations of $18.1 million, which represented an increase of 408.0% compared to the six months ended June 30, 2014 and Adjusted EBITDA of $41.9 million, which represented an increase of 183.6% compared to the six months ended June 30, 2014, representing net income from continuing operations and Adjusted EBITDA margins of 10.5% and 24.2%, respectively. For the year ended December 31, 2014, we generated $261.0 million of net sales, which represented an increase of 32.9% as compared to the prior year, $16.0 million of net income from continuing operations, which represented an increase of 42.6% as compared to the prior year, and $54.2 million of Adjusted EBITDA, which represented an increase of 41.3% as compared to the prior year, and net income from continuing operations and Adjusted EBITDA margins of 6.1% and 20.8%, respectively. Our 2014
56
reported results include four months of results from EFT Source. Adjusted EBITDA and Adjusted EBITDA margin are Non-GAAP Financial Measures. For a definition of Adjusted EBITDA and a reconciliation of Adjusted EBITDA to net income from continuing operations, the most comparable GAAP measure, see "—Key Performance Indicators—EBITDA, Adjusted EBITDA and Adjusted EBITDA Margin."
Segment Overview
Our business consists of three reportable segments: the U.S. Debit and Credit segment, the U.S. Prepaid Debit segment and the U.K. Limited segment.
U.S. Debit and Credit Segment
Our U.S. Debit and Credit segment primarily produces Financial Payment Cards and provides integrated card services to card-issuing banks in the United States. Products manufactured by this segment primarily include EMV and non-EMV credit cards, debit cards and Prepaid Debit Cards issued on the networks of the Payment Card Brands, Private Label Credit Cards that are not issued on the networks of the Payment Cards Brands and instant issuance systems. This segment also provides a variety of integrated card services, including card personalization and fulfillment services and instant issuance services. The U.S. Debit and Credit segment includes our operations in Colorado, Indiana and Tennessee, which are each certified by multiple global Payment Card Brands and, where required by our customers, the PCI Security Standards Council.
U.S. Prepaid Debit Segment
Our U.S. Prepaid Debit segment primarily provides integrated card services to Prepaid Debit Card issuers in the United States. Services provided include tamper-evident security packaging services and card personalization and fulfillment services. This segment also produces Financial Payment Cards issued on the networks of the Payment Card Brands that are included in the tamper-evident security packages mentioned above. The U.S. Prepaid Debit segment includes our operation in Minnesota which is certified by multiple global Payment Card Brands and the PCI Security Standards Council.
U.K. Limited Segment
Our U.K. Limited segment primarily produces retail gift and loyalty cards for customers in the United Kingdom and continental Europe. This segment also provides card personalization and fulfillment services. The U.K. Limited segment includes our operations in Colchester, United Kingdom and Liverpool, United Kingdom. Neither of our operations in this segment is certified by any of the Payment Card Brands, nor are they PCI certified.
Other
Our operations in Ontario, Canada and Petersfield, United Kingdom are not included in the three reportable segments listed above due to not meeting the materiality thresholds set forth in ASC 280. In July 2015, we ceased operations at our Petersfield facility. The Petersfield facility is not material to our business. These two operations comprise the "other" category in the discussion below. Also, our corporate headquarters is not included in our three reportable segments as required by ASC 280. See Note 19 (Segment Reporting) to our audited consolidated financial statements for certain additional information regarding our operating segments.
57
Trends and Key Factors Affecting our Financial Performance
Shift to Card-Based and Other Forms of Electronic Payments
Consumer payments in the United States and globally have shifted over the last several decades from paper-based media such as cash and checks to card-based media such as credit, debit and Prepaid Debit Cards, and electronic methods such as pre-authorized payments through Automated Clearing House ("ACH"). The Nilson Report estimates that card-based payments have increased from 38.3% of U.S. transactions in 2005 to 56.5% in 2013, and electronic payments have increased from 4.3% to 7.2% over the same period. By 2018, card-based payments are projected to comprise 69.2% of U.S. transactions, with cash and checks accounting for 21.4% and electronic payments representing the remaining 9.4%.
EMV Conversion in the United States
Our net sales are impacted by the changing technological trends in our industry and our ability to respond to such trends. In particular, issuers in the United States have begun the process of converting from the issuance of magnetic stripe Financial Payment Cards to the issuance of EMV Financial Payment Cards. The shift to EMV technology has been precipitated by a number of factors, including an impending shift of liability to the party in a transaction not utilizing EMV technology, escalating card fraud in the United States, the enhanced security offered by EMV cards, the recent occurrence of high-profile data breaches and the desire for global interoperability of the acceptance network. See "Business—EMV Conversion in the United States." In preparation for the EMV conversion, we have invested significantly in our network of facilities, technological infrastructure and human capital resources. In particular, during 2014 we opened a dedicated secure facility in Colorado for EMV production and personalization and made significant information technology and equipment upgrades across our network of facilities.
During the six months ended June 30, 2015, we produced and shipped 75.2 million EMV cards, as compared to 13.9 million during the six months ended June 30, 2014. During 2014, we produced and shipped 63.8 million EMV cards, as compared to 6.8 million during 2013. Of the 63.8 million EMV cards we shipped in 2014 (17.7% of the total Financial Payment Cards we shipped in 2014), over 50 million were shipped in the second half of 2014. We believe that demand for EMV cards increased sharply in the second half of 2014 primarily as a result of, among other things, the impending Liability Shift and occurrence of high-profile data breaches. See "Industry—EMV Conversion in the United States." We anticipate that this trend will continue and that an increasing number and proportion of the Financial Payment Cards that we ship in the future will be EMV Cards. The upgrade by our customers from magnetic stripe and contactless Financial Payment Cards to EMV Financial Payment Cards has resulted in significant changes to our financial profile including, but not limited to, the following:
- •
- Increased Net Sales—The conversion of non-EMV cards to EMV cards has driven growth in our net sales because EMV cards have
a higher selling price than comparable magnetic stripe cards.
- •
- Increased Cost of Goods Sold—The conversion of magnetic stripe cards to EMV cards also drove increases in our cost of
goods sold as EMV cards include an integrated circuit chip assembly and may also include an RFID inlay assembly, in the case of a Dual-Interface EMV card, which meaningfully increased our cost of
goods sold.
- •
- Increased Gross Profit and Gross Profit Margin—The conversion of magnetic stripe cards to EMV cards also drove an increase in our gross profit, as the gross profit generated by an EMV card is higher than the gross profit generated by an otherwise comparable magnetic stripe card. Likewise, the conversion of magnetic stripe cards to EMV cards resulted in an increase to our gross profit margins.
58
- •
- Increased Income from Operations and Operating Margin—The conversion of magnetic stripe cards to EMV cards drove an
increase in our income from operations, as the increased operating expenses required to support the increased production of EMV cards was less than the incremental gross profit generated. These
factors drove an increase in our operating margin.
- •
- Increased Working Capital Investment—The conversion of magnetic stripe cards to EMV cards resulted in increased investment
in working capital, particularly accounts receivable and inventory. This is a direct result of the increased levels of net sales and cost of goods sold discussed above.
- •
- Increased Capital Spending and Depreciation—We incurred elevated levels of capital investment to prepare for the U.S. EMV conversion, including investments in our network of facilities and technological infrastructure discussed above. We anticipate spending up to an additional $10 million in capital investment during 2015 in connection with our further EMV preparation. This will utilize cash from our operations and result in additional depreciation expense in future years.
Our ability to offer technologically relevant products and services and to remain responsive to the evolving demands of our customers are, we believe, key to maintaining our leading market position.
Acquisition of EFT Source, Inc.
On September 2, 2014, we acquired 100% of the stock of EFT Source. EFT Source provides data personalization services and instant issuance systems and services to issuers of Financial Payment Cards in the United States. Total consideration for EFT Source was $68.9 million. We paid cash consideration of $54.9 million and non-cash consideration consisting of a subordinated unsecured promissory note (the "EFT Sellers Note") of $9.0 million and the issuance of $5.0 million of our preferred and common stock. We also incurred additional indebtedness to fund the cash portion of the purchase price. The EFT Sellers Note bears interest at a rate of 5.0% per annum, payable quarterly in arrears and matures on September 2, 2016. The financial results of EFT Source from September 2, 2014 through December 31, 2014 are included in our 2014 financial results.
Card Expiration Cycle
An important driver of demand for bank debit cards and general purpose credit cards, which comprised approximately 71.7% of the U.S. market for Financial Payment Cards in 2014, is the length of time that cards are active prior to expiration. Approximately 53% of the demand for bank debit cards and general purpose credit cards in 2014 resulted from this regular renewal cycle. We estimate that bank debit and general purpose credit cards historically have been replaced on average every three years. However, First Annapolis believes that certain issuers of bank debit cards and general purpose credit cards have recently extended the expiration dates on their cards which may be due, in part, to the higher cost of EMV cards. This longer card expiration cycle would result in lower demand for bank debit cards and general purpose credit cards in the United States, and First Annapolis has taken this into consideration in estimating the growth rates of these markets. First Annapolis now estimates that bank debit and general purpose credit cards in the United States will be replaced on average every four years.
Discontinued Operation and Disposition
On January 12, 2015, we sold our operating segment in Nevada under an asset purchase agreement for $5.0 million in cash (the "Nevada Sale"). Assets classified as a discontinued operation include inventory and plant and equipment and leasehold improvements of $3.0 million and $2.9 million, respectively. We recognized a pre-tax loss of $4.1 million for the year ended December 31, 2014, which is included in Loss from discontinued operation, net of taxes in our consolidated statement of
59
operations for that period. After the Nevada Sale, we retained no continuing involvement in the operations in Nevada other than obligations under a 180-day transition services agreement.
Key Performance Indicators
To evaluate the performance of our business, in addition to our results of operations, we utilize a variety of financial and performance measures that we refer to as key performance indicators. These key performance indicators include Financial Payment Card Shipments by card type (EMV and non-EMV), Net sales—Services, EBITDA, Adjusted EBITDA and Adjusted EBITDA margin.
Financial Payment Card Shipments
Financial Payment Card Shipments represent the total number of Financial Payment Cards we ship during the period, and we further divide this into the following card types: EMV and non-EMV. We expect Financial Payment Card shipments to increase due to the growth in the market for Financial Payment Cards and non-EMV cards to be upgraded on an increasing basis to EMV cards due to the U.S. EMV Conversion. See "—Shift to Card-Based and Other Forms of Electronic Payments" and "—EMV Conversion in the United States."
EBITDA, Adjusted EBITDA and Adjusted EBITDA Margin
We use EBITDA, Adjusted EBITDA and Adjusted EBITDA margin as a supplemental measure of our performance. Adjusted EBITDA is also the basis for financial performance evaluation under our executive compensation programs. EBITDA is defined as income from continuing operations before interest expense, income taxes, depreciation and amortization. Adjusted EBITDA is defined as EBITDA plus adjustments for foreign exchange gain or loss, loss on debt modification and early extinguishment, gain on purchase of ID Data, non-cash compensation expense related to our phantom stock plan that will be terminated in connection with this offering, performance bonus earned in connection with the EFT Source acquisition and investment banking and related fees. We believe that Adjusted EBITDA is an appropriate measure of operating performance because it eliminates the impact of expenses that do not relate to ongoing business performance. We also evaluate Adjusted EBITDA margin, which is Adjusted EBITDA as a percentage of net sales. We use Adjusted EBITDA and Adjusted EBITDA margin measures to benchmark our performance versus prior periods and our annual operating plan.
EBITDA, Adjusted EBITDA and Adjusted EBITDA margin are Non-GAAP Financial Measures. The Non-GAAP Financial Measures as presented in this prospectus are supplemental measures of our performance that are neither required by, nor presented in accordance with, GAAP. The Non-GAAP Financial Measures should not be considered as a substitute for GAAP metrics such as net income or any other performance measures derived in accordance with GAAP. Also, in the future we may incur expenses or charges such as those added back to calculate Adjusted EBITDA and Adjusted EBITDA
60
margin. Our presentation of Adjusted EBITDA and Adjusted EBITDA margin should not be construed as an inference that our future results will be unaffected by unusual or nonrecurring items.
| |
Six Months Ended June 30, |
Year Ended December 31, |
|||||||||||
|---|---|---|---|---|---|---|---|---|---|---|---|---|---|
| |
2015 | 2014 | 2014 | 2013 | |||||||||
| |
(in thousands) |
||||||||||||
Financial Payment Card Shipments |
|||||||||||||
EMV |
75,164 | 13,921 | 63,845 | 6,769 | |||||||||
Non-EMV |
111,240 | 157,018 | 297,385 | 297,862 | |||||||||
| | | | | | | | | | | | | | |
Total |
186,404 | 170,939 | 361,230 | 304,631 | |||||||||
EBITDA(1) |
$ | 39,634 | $ | 14,958 | $ | 47,023 | $ | 37,620 | |||||
Adjusted EBITDA(1) |
41,897 | 14,577 | 54,219 | 38,372 | |||||||||
Adjusted EBITDA margin |
24.2 | % | 15.2 | % | 20.8 | % | 19.5 | % | |||||
- (1)
- The following is a reconciliation of net income from continuing operations to EBITDA and Adjusted EBITDA.
| |
Six Months Ended June 30, |
Year Ended December 31, |
|||||||||||
|---|---|---|---|---|---|---|---|---|---|---|---|---|---|
| |
2015 | 2014 | 2014 | 2013 | |||||||||
| |
(in thousands) |
||||||||||||
Net income from continuing operations |
$ | 18,115 | $ | 3,566 | $ | 15,972 | $ | 11,199 | |||||
Depreciation and amortization |
8,040 | 5,614 | 13,252 | 11,595 | |||||||||
Interest, net |
3,505 | 3,444 | 7,508 | 7,838 | |||||||||
Provision for income taxes |
9,974 | 2,334 | 10,291 | 6,988 | |||||||||
| | | | | | | | | | | | | | |
EBITDA |
39,634 | 14,958 | 47,023 | 37,620 | |||||||||
Foreign currency (gain) loss |
(149 | ) | 211 | 124 | 142 | ||||||||
Loss on debt modification and early extinguishment(a) |
— | — | 476 | — | |||||||||
Non-cash compensation expense(b) |
1,503 | (591 | ) | 4,534 | 610 | ||||||||
EFT performance bonuses(c) |
500 | — | — | — | |||||||||
Investment banking and related fees(d) |
409 | — | 2,062 | — | |||||||||
| | | | | | | | | | | | | | |
Adjusted EBITDA |
$ | 41,897 | $ | 14,577 | $ | 54,219 | $ | 38,372 | |||||
| | | | | | | | | | | | | | |
| | | | | | | | | | | | | | |
| | | | | | | | | | | | | | |
- (a)
- Represents
loss on the modification of the Company's indebtedness in connection with the acquisition of EFT Source.
- (b)
- Represents
compensation expense incurred in connection with the Company's phantom stock plan. See "Management's Discussion and Analysis of
Financial Condition and Results of Operations—Critical Accounting Policies and Estimates—Phantom Stock Plan" and "Executive Compensation—CPI
Acquisition, Inc. Phantom Stock Plan."
- (c)
- Represents performance bonuses earned in connection with the acquisition of EFT Source.
61
- (d)
- Includes investment banking, advisory and related professional fees and expenses incurred in connection with the EFT Source acquisition and the Company's consideration of liquidity alternatives.
Key Components of Results of Operations
Set forth below is a brief description of key line items of our consolidated statements of operations and comprehensive income.
Net Sales
Net sales reflect our revenue generated from the sale of products and services. Product net sales include the design and production of Financial Payment Cards in Contact EMV, Dual-Interface EMV, contactless and magnetic stripe formats. We also generate product revenue from the sale of our Card@Once® instant issuance systems, Private Label Credit Cards and retail gift cards. Services net sales include revenue from the personalization and fulfillment of Financial Payment Cards, the provision of tamper-evident security packaging, providing fulfillment services to Prepaid Debit Card program managers, and software as a service personalization of instant issuance debit cards. We also generate service revenue from personalizing retail gift cards (primarily in Canada and the United Kingdom) and from click-fees generated from our patented MYCA™ software.
Generally, we recognize net sales related to products upon shipment and services upon the provision of the service, when persuasive evidence of an arrangement exists, delivery has occurred, the fee is fixed or determinable, and collectability is reasonably assured. See "—Critical Accounting Policies and Estimates—Revenue Recognition."
Cost of Sales
Cost of sales includes the direct and indirect costs of the products we sell and the services that we provide. Product costs include the cost of raw materials, including microchip assemblies in the case of EMV cards and, additionally, RFID assemblies in the case of Dual-Interface EMV cards, labor costs, material costs, equipment and facilities costs, operation overhead, depreciation, leases and rental charges and transport costs. Product costs also include desktop card personalization terminals in the case of Card@Once® instant issuance system sales. Services costs include the cost of labor, raw materials in the case of tamper-evident security packaging, and equipment and facilities costs, operation overhead, depreciation, leases and rental charges and transport costs. Cost of sales can be impacted by many factors, including volume, operational efficiencies, promotional activity and employee relations.
Gross Profit and Gross Margin
Gross profit consists of our net sales less our cost of sales. Gross margin is gross profit as a percentage of net sales.
Operating Expenses
Operating expenses are primarily comprised of selling, general and administrative expenses ("SG&A") which generally consist of expenses for executive, finance, sales, marketing, legal, human resources and administrative personnel, including payroll, benefits and stock-based compensation expense, and outside legal and other advisory fees. Operating expense also includes depreciation and amortization expense, including the amortization of tangible and intangible assets. We anticipate increases in SG&A as we incur the costs of compliance associated with being a public company, including audit and consulting fees.
62
Income from Operations and Operating Margin
Income from operations consists of our gross profit less our operating expenses. Operating margin is income from operations as a percentage of net sales.
Other Income (Expense)
Other income (expense) consists primarily of interest expense and foreign currency gains and losses.
Net Income from Continuing Operations
Net income from continuing operations consists of our income from operations plus / less other income or expense and provision for income tax.
Results of Operations
Six Months Ended June 30, 2015 Compared With Six Months Ended June 30, 2014
The table below presents our results of operations for the six months ended June 30, 2015 compared with the six months ended June 30, 2014:
| |
Six Months Ended June 30, |
|
|
||||||||||
|---|---|---|---|---|---|---|---|---|---|---|---|---|---|
| |
2015 | 2014 | $ Change | % Change | |||||||||
| |
(dollars in thousands) |
||||||||||||
Net sales: |
|||||||||||||
Products |
$ | 112,771 | $ | 58,905 | $ | 53,866 | 91.4 | % | |||||
| | | | | | | | | | | | | | |
Services |
60,075 | 36,862 | 23,213 | 63.0 | % | ||||||||
Total net sales |
172,846 | 95,767 | 77,079 | 80.5 | % | ||||||||
| | | | | | | | | | | | | | |
Cost of sales |
111,503 | 69,969 | 41,534 | 59.4 | % | ||||||||
Gross profit |
61,343 | 25,798 | 35,545 | 137.8 | % | ||||||||
Operating expenses |
29,959 | 16,262 | 13,697 | 84.2 | % | ||||||||
Income from operations |
31,384 | 9,536 | 21,848 | 229.1 | % | ||||||||
| | | | | | | | | | | | | | |
Other income (expense): |
|||||||||||||
Interest, net |
(3,505 | ) | (3,444 | ) | (61 | ) | 1.8 | % | |||||
Foreign currency gain (loss) |
149 | (211 | ) | 360 | (170.6 | )% | |||||||
| | | | | | | | | | | | | | |
Other income |
61 | 19 | 42 | 221.1 | % | ||||||||
Income before taxes |
28,089 | 5,900 | 22,189 | 376.1 | % | ||||||||
| | | | | | | | | | | | | | |
Provision for income taxes |
(9,974 | ) | (2,334 | ) | (7,640 | ) | 327.3 | % | |||||
| | | | | | | | | | | | | | |
Net income from continuing operations |
18,115 | 3,566 | 14,549 | 407.9 | % | ||||||||
Loss from discontinued operations, net of taxes |
(606 | ) | (2,763 | ) | 2,157 | 78.1 | % | ||||||
Gain on sale of discontinued operations, net of taxes |
887 | — | 887 | — | |||||||||
| | | | | | | | | | | | | | |
Net income |
$ | 18,396 | $ | 803 | $ | 17,593 | 2,190.9 | % | |||||
| | | | | | | | | | | | | | |
| | | | | | | | | | | | | | |
| | | | | | | | | | | | | | |
63
Net Sales
| |
Six Months Ended June 30, | |
|
||||||||||
|---|---|---|---|---|---|---|---|---|---|---|---|---|---|
| |
2015 | 2014 | $ Change | % Change | |||||||||
| |
(dollars in thousands) |
||||||||||||
Net sales by segment: |
|||||||||||||
U.S Debit and Credit segment—Products |
$ | 103,161 | $ | 46,727 | $ | 56,434 | 120.8 | % | |||||
U.S Debit and Credit segment—Services |
20,244 | 2,543 | 17,701 | 696.1 | % | ||||||||
| | | | | | | | | | | | | | |
U.S Debit and Credit segment—Total |
123,405 | 49,270 | 74,135 | 150.5 | % | ||||||||
U.S. Prepaid Debit segment—Products |
— |
— |
— |
— |
|||||||||
U.S. Prepaid Debit segment—Services |
29,823 | 23,298 | 6,525 | 28.0 | % | ||||||||
| | | | | | | | | | | | | | |
U.S. Prepaid Debit segment—Total |
29,823 | 23,298 | 6,525 | 28.0 | % | ||||||||
U.K. Limited segment—Products |
9,231 |
11,142 |
(1,911 |
) |
(17.2 |
)% |
|||||||
U.K. Limited segment—Services |
4,687 | 5,188 | (501 | ) | (9.7 | )% | |||||||
| | | | | | | | | | | | | | |
U.K. Limited segment—Total |
13,918 | 16,330 | (2,412 | ) | (14.8 | )% | |||||||
Other—Products |
4,818 |
5,177 |
(359 |
) |
(6.9 |
)% |
|||||||
Other—Services |
5,104 | 6,006 | (902 | ) | (15.0 | )% | |||||||
| | | | | | | | | | | | | | |
Other—Total |
9,922 | 11,183 | (1,261 | ) | (11.3 | )% | |||||||
Inter-company eliminations |
(4,222 | ) | (4,314 | ) | 92 | (2.1 | )% | ||||||
| | | | | | | | | | | | | | |
Total |
$ | 172,846 | $ | 95,767 | $ | 77,079 | 80.5 | % | |||||
| | | | | | | | | | | | | | |
| | | | | | | | | | | | | | |
| | | | | | | | | | | | | | |
Net sales for the six months ended June 30, 2015 increased $77.1 million, or 80.5%, to $172.8 million compared to $95.8 million for the six months ended June 30, 2014. The increase in net sales during the six months ended June 30, 2015 as compared to the six months ended June 30, 2014 was due to growth in net sales of 150.5% and 28.0% in our U.S. Debit and Credit segment and U.S. Prepaid Debit segment, respectively, offset by a 14.8% decline in our U.K. Limited segment as compared to the same period in the prior year.
Net sales for the U.S. Debit and Credit segment for the six months ended June 30, 2015 increased $74.1 million, or 150.5%, to $123.4 million compared to $49.3 million for the six months ended June 30, 2014. The increase in net sales was driven by an increase in EMV related revenue of $59.0 million, a $15.5 million increase in card services revenue and a $7.3 million increase in instant issuance revenue, offset in part by a decline in magnetic stripe card revenue of $13.7 million. The increase in EMV revenue of $59.0 million was driven by our card issuing bank customers or end-users adopting EMV technology for debit and credit cards. For the six months ended June 30, 2015, we sold 74.7 million EMV cards at an Average Selling Price ("ASP") of $0.98 compared to 13.0 million EMV cards at an ASP of $1.08 for the six months ended June 30, 2014. The increase in card services revenue of $15.5 million was driven primarily by the impact of our acquisition of EFT Source on September 2, 2014. Likewise, the $7.3 million growth in instant issuance revenue was also driven by the acquisition of EFT Source, as well as continued growth of Card@Once® during the quarter. The $13.7 million decline in magnetic stripe revenue was primarily driven by our card issuing bank customers upgrading from magnetic stripe cards to EMV cards.
Net sales for the U.S. Prepaid Debit segment for the six months ended June 30, 2015 increased $6.5 million, or 28.0%, to $29.8 million compared to $23.3 million for the six months ended June 30, 2014. The increase was driven primarily by our largest customer for this segment refreshing its packaging designs, combined with growth in the overall market segment.
64
Net sales for the U.K. Limited segment for the six months ended June 30, 2015 declined $2.4 million, or 14.8%, to $13.9 million compared to $16.3 million for the six months ended June 30, 2014. The decrease in net sales was primarily driven by a decrease in retail gift and loyalty card product and services net sales.
Cost of Sales
| |
Six Months Ended June 30, |
|
|
||||||||||
|---|---|---|---|---|---|---|---|---|---|---|---|---|---|
| |
2015 | 2014 | $ Change | % Change | |||||||||
| |
(dollars in thousands) |
||||||||||||
Cost of sales by segment: |
|||||||||||||
U.S Debit and Credit segment |
$ | 78,098 | $ | 35,010 | $ | 43,088 | 123.1 | % | |||||
U.S. Prepaid Debit segment |
18,526 | 16,220 | 2,306 | 14.2 | % | ||||||||
U.K. Limited segment |
10,550 | 12,955 | (2,405 | ) | (18.6 | )% | |||||||
Other |
7,955 | 8,869 | (914 | ) | (10.3 | )% | |||||||
Eliminations |
(3,626 | ) | (3,085 | ) | (541 | ) | 17.5 | % | |||||
| | | | | | | | | | | | | | |
Total |
$ | 111,503 | $ | 69,969 | $ | 41,534 | 59.4 | % | |||||
| | | | | | | | | | | | | | |
| | | | | | | | | | | | | | |
| | | | | | | | | | | | | | |
Cost of sales for the six months ended June 30, 2015 increased $41.5 million, or 59.4%, to $111.5 million compared to $70.0 million for the six months ended June 30, 2014. Cost of sales for the U.S. Debit and Credit segment for the six months ended June 30, 2015 increased $43.1 million, or 123.1%, to $78.1 million compared to $35.0 million for the six months ended June 30, 2014. The increase in cost of sales was driven by a $19.0 million increase in technology materials (primarily EMV chip assemblies), a $7.0 million increase in other materials, a $13.3 million increase in overhead, a $1.6 million increase in labor and benefits costs and a $0.5 million increase in depreciation and amortization expense. The $19.0 million increase in technology materials was driven by the increased number of EMV cards shipped as noted above and is a direct result of U.S. card issuing banks upgrading to EMV debit and credit cards, which include an integrated circuit chip assembly, and in certain cases may also include an RFID inlay assembly. The $7.0 million increase in other materials and $13.3 million increase in overhead expenses were driven primarily by the EFT Source acquisition and, to a lesser extent, by new secure EMV production and card services capacity that became operational in the second quarter of 2014. The $1.6 million increase in labor and benefits costs was driven by the acquisition of EFT Source and additional labor costs associated with the production of EMV cards, which have a higher labor cost component due to their complexity. Finally, increases in depreciation and amortization expense were driven by the EFT Source acquisition and the new secure EMV production and card services capacity noted above.
Cost of sales for the U.S. Prepaid Debit segment for the six months ended June 30, 2015 increased $2.3 million, or 14.2%, to $18.5 million compared to $16.2 million for the six months ended June 30, 2014. The increase in cost of sales was driven by the increased level of net sales referenced above, partially offset by more efficient production.
Cost of sales for the U.K. Limited segment for the six months ended June 30, 2015 decreased $2.4 million, or 18.6%, to $10.6 million compared to $13.0 million for the six months ended June 30, 2014. The decrease in cost of sales was driven by the decreased level of net sales referenced above and more efficient production.
65
Gross Profit and Gross Profit Margin
| |
Six Months Ended June 30, | |
|
||||||||||||||||
|---|---|---|---|---|---|---|---|---|---|---|---|---|---|---|---|---|---|---|---|
| |
2015 | % of net sales |
2014 | % of net sales |
$ Change | % Change | |||||||||||||
| |
(dollars in thousands) |
||||||||||||||||||
Gross profit by segment: |
|||||||||||||||||||
U.S Debit and Credit segment |
$ | 45,307 | 36.7 | % | $ | 14,260 | 28.9 | % | $ | 31,047 | 217.7 | % | |||||||
U.S. Prepaid Debit segment |
11,297 | 37.9 | % | 7,078 | 30.4 | % | 4,219 | 59.6 | % | ||||||||||
U.K. Limited segment |
3,368 | 24.2 | % | 3,375 | 20.7 | % | (7 | ) | (0.2 | )% | |||||||||
Other |
1,371 | 24.1 | % | 1,085 | 15.8 | % | 286 | 26.4 | % | ||||||||||
| | | | | | | | | | | | | | | | | | | | |
Total |
$ | 61,343 | 35.5 | % | $ | 25,798 | 26.9 | % | $ | 35,545 | 137.8 | % | |||||||
| | | | | | | | | | | | | | | | | | | | |
| | | | | | | | | | | | | | | | | | | | |
| | | | | | | | | | | | | | | | | | | | |
Gross profit for the six months ended June 30, 2015 increased $35.5 million, or 137.8%, to $61.3 million compared to $25.8 million for the six months ended June 30, 2014. Gross profit margin for the six months ended June 30, 2015 increased to 35.5% compared to 26.9% for the six months ended June 30, 2014. Gross profit for the U.S. Debit and Credit segment for the six months ended June 30, 2015 increased $31.0 million, or 217.7%, to $45.3 million compared to $14.3 million for the six months ended June 30, 2014. Gross profit margin for the U.S. Debit and Credit segment for the six months ended June 30, 2015 increased to 36.7% compared to 28.9% for the six months ended June 30, 2014. Increases in gross profit were driven by the increased level of net sales referenced above and an $11.1 million increase from the EFT Source acquisition.
Gross profit for the U.S. Prepaid Debit segment for the six months ended June 30, 2015 increased $4.2 million, or 59.6%, to $11.3 million compared to $7.1 million for the six months ended June 30, 2014. The increase in gross profit was primarily driven by the increased level of net sales referenced above and improved production efficiencies. Gross profit margin for the U.S. Prepaid Debit segment for the six months ended June 30, 2015 increased to 37.9% compared to 30.4% for the six months ended June 30, 2014.
Gross profit for the U.K. Limited segment for the six months ended June 30, 2015 decreased 0.2% to $3.4 million. Gross profit margin for the U.K. Limited segment for the six months ended June 30, 2015 increased to 24.2% compared to 20.7% for the six months ended June 30, 2014. The decrease in gross profit was driven by decreases in retail gift and loyalty card product and services net sales, partially offset by more efficient production.
Operating Expenses
| |
Six Months Ended June 30, |
|
|
||||||||||
|---|---|---|---|---|---|---|---|---|---|---|---|---|---|
| |
2015 | 2014 | $ Change | % Change | |||||||||
| |
(dollars in thousands) |
||||||||||||
Operating expenses by segment: |
|||||||||||||
U.S Debit and Credit segment |
$ | 12,191 | $ | 4,923 | $ | 7,268 | 147.6 | % | |||||
U.S. Prepaid Debit segment |
2,773 | 2,519 | 254 | 10.1 | % | ||||||||
U.K. Limited segment |
2,932 | 3,199 | (267 | ) | (8.3 | )% | |||||||
Other |
3,254 | 2,653 | 601 | 22.7 | % | ||||||||
Corporate |
8,809 | 2,968 | 5,841 | 196.8 | % | ||||||||
| | | | | | | | | | | | | | |
Total |
$ | 29,959 | $ | 16,262 | $ | 13,697 | 84.2 | % | |||||
| | | | | | | | | | | | | | |
| | | | | | | | | | | | | | |
| | | | | | | | | | | | | | |
Operating expenses for the six months ended June 30, 2015 increased $13.7 million, or 84.2%, to $30.0 million compared to $16.3 million for the six months ended June 30, 2014. Excluding a charge of
66
$1.5 million and a benefit of $0.6 million for the six months ended June 30, 2015 and 2014, respectively, related to our phantom stock plan, $0.4 million of transaction costs for the six months ended June 30, 2015 and $0.5 million of accrued performance bonus charges in connection with the EFT Source acquisition in the six months ended June 30, 2015, operating expenses for the six months ended June 30, 2015 increased $10.7 million, or 65.5%. The increase in operating expenses was driven primarily by a $7.3 million increase in the U.S. Debit and Credit segment and a $5.8 million increase in our corporate expenses. The $7.3 million increase in the U.S. Debit and Credit segment was driven by a $6.1 million increase related to the EFT Source acquisition and the remaining increase was primarily attributable to additional salary and benefit expenses related to the elevated levels of segment net sales discussed above. The $5.8 million increase in corporate expenses was primarily driven by the $2.1 million increase in charges related to our phantom stock plan, $0.4 million of transaction costs, $0.5 million related to accrued performance bonus in connection with the EFT Source acquisition, a $2.5 million increase in depreciation and amortization expense and a $0.6 million increase in corporate salaries.
Income from Operations and Operating Margin
| |
Six Months Ended June 30, | |
|
||||||||||||||||
|---|---|---|---|---|---|---|---|---|---|---|---|---|---|---|---|---|---|---|---|
| |
2015 | % of net sales |
2014 | % of net sales |
$ Change | % Change | |||||||||||||
| |
(dollars in thousands) |
||||||||||||||||||
Income from operations by segment: |
|||||||||||||||||||
U.S Debit and Credit segment |
$ | 33,116 | 26.8 | % | $ | 9,337 | 19.0 | % | $ | 23,779 | 254.7 | % | |||||||
U.S. Prepaid Debit segment |
8,524 | 28.6 | % | 4,559 | 19.6 | % | 3,965 | 87.0 | % | ||||||||||
U.K. Limited segment |
436 | 3.1 | % | 176 | 1.1 | % | 260 | 147.7 | % | ||||||||||
Other |
(1,883 | ) | (19.0 | )% | (1,568 | ) | (14.0 | )% | (315 | ) | 20.1 | % | |||||||
Corporate |
(8,809 | ) | (2,968 | ) | (5,841 | ) | |||||||||||||
| | | | | | | | | | | | | | | | | | | | |
Total |
$ | 31,384 | 18.2 | % | $ | 9,536 | 10.0 | % | $ | 21,848 | 229.1 | % | |||||||
| | | | | | | | | | | | | | | | | | | | |
| | | | | | | | | | | | | | | | | | | | |
| | | | | | | | | | | | | | | | | | | | |
Income from operations for the six months ended June 30, 2015 increased $21.8 million, or 229.1%, to $31.4 million compared to $9.5 million for the six months ended June 30, 2014. Excluding a charge of $1.5 million and a benefit of $0.6 million, for the six months ended June 30, 2015 and 2014, respectively, related to our phantom stock plan, $0.4 million of transaction costs for the six months ended June 30, 2015 and $0.5 million of accrued performance bonuses in connection with the EFT Source acquisition in the six months ended June 30, 2015, income from operations for the six months ended June 30, 2015 increased $24.8 million, or 278.1%, relative to the six months ended June 30, 2014. Operating margins for the six months ended June 30, 2015 increased to 18.2% compared to 10.0% for the six months ended June 30, 2014. Excluding the charges related to our phantom stock plan and the EFT Source acquisition performance bonus charge discussed above, operating margins for the six months ended June 30, 2015 increased to 19.9% compared to 10.0% for the six months ended June 30, 2014.
Income from operations for the U.S. Debit and Credit segment for the six months ended June 30, 2015 increased $23.8 million, or 254.7%, to $33.1 million compared to $9.3 million for the six months ended June 30, 2014. Operating margins for the six months ended June 30, 2015 increased to 26.8% compared to 19.0% for the six months ended June 30, 2014. Income from operations for the U.S. Prepaid Debit segment for the six months ended June 30, 2015 increased $4.0 million, or 87.0%, to $8.5 million compared to $4.6 million for the six months ended June 30, 2014. Operating margins for the six months ended June 30, 2015 increased to 28.6% compared to 19.6% for the six months ended June 30, 2014. Income from operations for the U.K. Limited segment for the six months ended June 30, 2015 increased $0.2 million, or 147.3%, to $0.4 million compared to $0.2 million for the six
67
months ended June 30, 2014. Operating margins for the six months ended June 30, 2015 increased to 3.1% compared to 1.1% for the six months ended June 30, 2014.
Interest income (expense). Interest expense for the six months ended June 30, 2015 increased $0.1 million, or 1.8%, to $3.5 million compared to $3.4 million for the six months ended June 30, 2014. The increase in interest expense was driven by incremental indebtedness incurred in September 2014 in connection with the acquisition of EFT Source, partially offset by repayments of debt during the period.
Provision for income taxes. The provision for income taxes for the six months ended June 30, 2015 increased $7.7 million to $10.0 million compared to $2.3 million for the six months ended June 30, 2014, driven by the increase in income before taxes of $22.2 million.
Three Months Ended June 30, 2015 Compared With Three Months Ended June 30, 2014
The table below presents our results of operations for the three months ended June 30, 2015 compared with the three months ended June 30, 2014:
| |
Three Months Ended June 30, | |
|
||||||||||
|---|---|---|---|---|---|---|---|---|---|---|---|---|---|
| |
2015 | 2014 | Change | % Change | |||||||||
| |
(dollars in thousands) |
||||||||||||
Net Sales |
|||||||||||||
Products |
$ | 67,757 | $ | 33,574 | $ | 34,183 | 101.8 | % | |||||
Services |
27,779 | 19,662 | 8,117 | 41.3 | % | ||||||||
| | | | | | | | | | | | | | |
Total net sales |
95,536 | 53,236 | 42,300 | 79.5 | % | ||||||||
Cost of sales |
59,701 | 37,682 | 22,019 | 58.4 | % | ||||||||
| | | | | | | | | | | | | | |
Gross profit |
35,835 | 15,554 | 20,281 | 130.4 | % | ||||||||
Operating expenses |
16,148 | 8,685 | 7,463 | 85.9 | % | ||||||||
| | | | | | | | | | | | | | |
Income from operations |
19,687 | 6,869 | 12,818 | 186.6 | % | ||||||||
Other income (expense): |
|||||||||||||
Interest — net |
(1,616 | ) | (1,761 | ) | 145 | (8.2 | )% | ||||||
Foreign currency gain/(loss) |
27 | (33 | ) | 60 | (181.8 | )% | |||||||
Other income (expense) |
73 | 23 | 50 | 217.4 | % | ||||||||
| | | | | | | | | | | | | | |
Income before taxes |
18,171 | 5,098 | 13,073 | 256.4 | % | ||||||||
Provision for income taxes |
(6,016 | ) | (2,028 | ) | (3,988 | ) | 196.6 | % | |||||
| | | | | | | | | | | | | | |
Net income from continuing operations, net of taxes |
12,155 | 3,070 | 9,085 | 295.9 | % | ||||||||
Loss from discontinued operations, net of taxes |
— | (1,167 | ) | 1,167 | (100.0 | )% | |||||||
| | | | | | | | | | | | | | |
Net income |
$ | 12,155 | $ | 1,903 | $ | 10,252 | 538.7 | % | |||||
| | | | | | | | | | | | | | |
| | | | | | | | | | | | | | |
| | | | | | | | | | | | | | |
68
Net Sales
| |
Three Months Ended June 30, | |
|
||||||||||
|---|---|---|---|---|---|---|---|---|---|---|---|---|---|
| |
2015 | 2014 | Change | % Change | |||||||||
| |
(dollars in thousands) |
||||||||||||
Net sales by segment: |
|||||||||||||
U.S Debit and Credit segment — Products |
$ | 62,829 | $ | 27,291 | $ | 35,538 | 130.2 | % | |||||
U.S Debit and Credit segment — Services |
10,525 | 1,292 | 9,233 | 714.6 | % | ||||||||
| | | | | | | | | | | | | | |
U.S Debit and Credit segment — Total |
73,354 | 28,583 | 44,771 | 156.6 | % | ||||||||
U.S. Prepaid Debit segment — Products |
— | — | — | 0.0 | % | ||||||||
U.S. Prepaid Debit segment — Services |
12,392 | 13,015 | (623 | ) | (4.8 | )% | |||||||
| | | | | | | | | | | | | | |
U.S. Prepaid Debit segment — Total |
12,392 | 13,015 | (623 | ) | (4.8 | )% | |||||||
U.K. Limited segment — Products |
5,139 | 6,632 | (1,493 | ) | (22.5 | )% | |||||||
U.K. Limited segment — Services |
2,540 | 2,584 | (44 | ) | (1.7 | )% | |||||||
| | | | | | | | | | | | | | |
U.K. Limited segment — Total |
7,679 | 9,216 | (1,537 | ) | (16.7 | )% | |||||||
Other — Products |
2,924 | 2,403 | 521 | 21.7 | % | ||||||||
Other — Services |
2,895 | 2,839 | 56 | 2.0 | % | ||||||||
| | | | | | | | | | | | | | |
Other — Total |
5,819 | 5,242 | 577 | 11.0 | % | ||||||||
Inter-company eliminations |
(3,708 | ) | (2,820 | ) | (888 | ) | 31.5 | % | |||||
| | | | | | | | | | | | | | |
Total |
$ | 95,536 | $ | 53,236 | $ | 42,300 | 79.5 | % | |||||
| | | | | | | | | | | | | | |
| | | | | | | | | | | | | | |
| | | | | | | | | | | | | | |
Net sales for the three months ended June 30, 2015 increased $42.3 million, or 79.5%, to $95.5 million compared to $53.2 million for the three months ended June 30, 2014. The increase in net sales during the three months ended June 30, 2015 as compared to the three months ended June 30, 2014 was due to growth in net sales of 156.6% in our U.S. Debit and Credit segment, offset by a 4.8% and 16.7% decline in our U.S. Prepaid Debit segment and U.K. Limited segment, respectively, as compared to the same period in the prior year.
Net sales for the U.S. Debit and Credit segment for the three months ended June 30, 2015 increased $44.8 million, or 156.6%, to $73.4 million compared to $28.6 million for the three months ended June 30, 2014. The increase in net sales was driven by an increase in EMV related revenue of $38.6 million, a $8.7 million increase in card services revenue and a $2.9 million increase in instant issuance revenue, offset in part by a decline in magnetic stripe card revenue of $9.3 million. The increase in EMV revenue of $38.6 million was driven by our card issuing bank customers or end-users adopting EMV technology for debit and credit cards. For the three months ended June 30, 2015, we sold 49.8 million EMV cards at an ASP of $0.96 compared to 10.7 million EMV cards at an ASP of $0.94 for the three months ended June 30, 2014. The increase in card services revenue of $8.7 million was driven primarily by the impact of our acquisition of EFT Source on September 2, 2014. Likewise, the $2.9 million growth in instant issuance revenue was also driven by the acquisition of EFT Source, as well as continued growth of Card@Once® during the quarter. The $9.3 million decline in magnetic stripe revenue was primarily driven by our card issuing bank customers upgrading from magnetic stripe cards to EMV cards.
Net sales for the U.S. Prepaid Debit segment for the three months ended June 30, 2015 decreased $0.6 million, or 4.8%, to $12.4 million compared to $13.0 million for the three months ended June 30, 2014. The decrease was driven by our largest customer for this segment refreshing its packaging designs in 2014, which resulted in unusually large sales which did not reoccur at the same levels in 2015. The decrease was partially offset by growth in 2015 net sales for the rest of the U.S. Prepaid Debit segment.
69
Net sales for the U.K. Limited segment for the three months ended June 30, 2015 declined $1.5 million, or 16.7%, to $7.7 million compared to $9.2 million for the three months ended June 30, 2014. The decrease in net sales was primarily driven by a decrease in retail gift and loyalty card product and services revenue.
Cost of Sales
| |
Three Months Ended June 30, | |
|
||||||||||
|---|---|---|---|---|---|---|---|---|---|---|---|---|---|
| |
2015 | 2014 | Change | % Change | |||||||||
| |
(dollars in thousands) |
||||||||||||
Cost of sales by segment: |
|||||||||||||
U.S Debit and Credit segment |
$ | 44,842 | $ | 20,361 | $ | 24,481 | 120.2 | % | |||||
U.S. Prepaid Debit segment |
7,784 | 8,372 | (588 | ) | (7.0 | )% | |||||||
U.K. Limited segment |
5,638 | 6,929 | (1,291 | ) | (18.6 | )% | |||||||
Other |
4,476 | 3,598 | 878 | 24.4 | % | ||||||||
Eliminations |
(3,039 | ) | (1,578 | ) | (1,461 | ) | 92.6 | % | |||||
| | | | | | | | | | | | | | |
Total |
$ | 59,701 | $ | 37,682 | $ | 22,019 | 58.4 | % | |||||
| | | | | | | | | | | | | | |
| | | | | | | | | | | | | | |
| | | | | | | | | | | | | | |
Cost of sales for the three months ended June 30, 2015 increased $22.0 million, or 58.4%, to $59.7 million compared to $37.7 million for the three months ended June 30, 2014. The increases in cost of sales were driven by a $12.1 million increase in technology materials (primarily EMV chip assemblies), a $1.5 million increase in other materials, a $6.9 million increase in overhead, and a $0.4 million increase in depreciation and amortization expense. The $12.1 million increase in technology materials was driven by the increased number of EMV cards produced as noted above and is a direct result of U.S. card issuing banks upgrading to EMV debit and credit cards which include an integrated circuit chip assembly, and in certain cases, may also include an RFID inlay assembly. The $1.5 million increase in other materials and $6.9 million increase in overhead expenses was driven primarily by the EFT Source acquisition. Finally, increases in depreciation and amortization expense were driven by the EFT Source acquisition and the new secure EMV production and card services capacity noted above.
Cost of sales for the U.S. Debit and Credit segment for the three months ended June 30, 2015 increased $24.5 million, or 120.2%, to $44.8 million compared to $20.3 million for the three months ended June 30, 2014, driven by increased net sales as referenced above.
Cost of sales for the U.S. Prepaid Debit segment for the three months ended June 30, 2015 decreased $0.6 million, or 7.0%, to $7.8 million compared to $8.4 million for the three months ended June 30, 2014. The decrease in cost of sales was primarily driven by the decreased level of net sales referenced above.
Cost of sales for the U.K. Limited segment for the three months ended June 30, 2015 decreased $1.3 million, or 18.6%, to $5.6 million compared to $6.9 million for the three months ended June 30, 2014. The decrease in cost of sales was driven by the decreased level of net sales referenced above and more efficient production.
70
Gross Profit and Gross Profit Margin
| |
Three Months Ended June 30, | |
|
|
|
||||||||||||||
|---|---|---|---|---|---|---|---|---|---|---|---|---|---|---|---|---|---|---|---|
| |
2015 | % of net sales | 2014 | % of net sales | Change | % Change | |||||||||||||
| |
(dollars in thousands) |
||||||||||||||||||
Gross profit by segment: |
|||||||||||||||||||
U.S Debit and Credit segment |
$ | 28,512 | 38.9 | % | $ | 8,222 | 28.8 | % | $ | 20,290 | 246.8 | % | |||||||
U.S. Prepaid Debit segment |
4,608 | 37.2 | % | 4,644 | 35.7 | % | (36 | ) | (0.8 | )% | |||||||||
U.K. Limited segment |
2,041 | 26.6 | % | 2,287 | 24.8 | % | (246 | ) | (10.8 | )% | |||||||||
Other |
674 | 31.9 | % | 402 | 16.6 | % | 272 | 67.7 | % | ||||||||||
| | | | | | | | | | | | | | | | | | | | |
Total |
$ | 35,835 | 37.5 | % | $ | 15,555 | 29.2 | % | $ | 20,280 | 130.4 | % | |||||||
| | | | | | | | | | | | | | | | | | | | |
| | | | | | | | | | | | | | | | | | | | |
| | | | | | | | | | | | | | | | | | | | |
Gross profit for the three months ended June 30, 2015 increased $20.3 million, or 130.4%, to $35.8 million compared to $15.6 million for the three months ended June 30, 2014. Gross profit margin for the three months ended June 30, 2015 increased to 37.5% compared to 29.2% for the three months ended June 30, 2014. Gross profit for the U.S. Debit and Credit segment for the three months ended June 30, 2015 increased $20.3 million, or 246.8%, to $28.5 million compared to $8.2 million for the three months ended June 30, 2014. The increase in gross profit for the U.S. Debit and Credit segment was primarily a result of increased EMV revenues combined with the EFT Source acquisition. Gross profit margin for the U.S. Debit and Credit segment for the three months ended June 30, 2015 increased to 38.9% compared to 28.8% for the three months ended June 30, 2014.
Gross profit for the U.S. Prepaid Debit segment for the three months ended June 30, 2015 of $4.6 million was flat as compared to the three months ended June 30, 2014, with improved production efficiencies offsetting decreased net sales. Gross profit margin for the U.S. Prepaid Debit segment for the three months ended June 30, 2015 increased to 37.2% compared to 35.7% for the three months ended June 30, 2014.
Gross profit for the U.K. Limited segment for the three months ended June 30, 2015 decreased 10.8% to $2.0 million. Gross profit margin for the U.K. Limited segment for the three months ended June 30, 2015 increased to 26.6% compared to 24.8% for the three months ended June 30, 2014. Increases in gross profit was driven more efficient production partially offset by decreases in retail gift and loyalty card product and services net sales.
Operating Expenses
| |
Three Months Ended June 30, | |
|
||||||||||
|---|---|---|---|---|---|---|---|---|---|---|---|---|---|
| |
2015 | 2014 | Change | % Change | |||||||||
| |
(dollars in thousands) |
||||||||||||
Operating expenses by segment: |
|||||||||||||
U.S Debit and Credit segment |
$ | 6,372 | $ | 2,582 | $ | 3,790 | 146.8 | % | |||||
U.S. Prepaid Debit segment |
1,396 | 1,316 | 80 | 6.1 | % | ||||||||
U.K. Limited segment |
1,555 | 1,688 | (133 | ) | (7.9 | )% | |||||||
Other |
1,799 | 1,422 | 377 | 26.5 | % | ||||||||
Corporate |
5,026 | 1,677 | 3,349 | 199.7 | % | ||||||||
| | | | | | | | | | | | | | |
Total |
$ | 16,148 | $ | 8,685 | $ | 7,463 | 85.9 | % | |||||
| | | | | | | | | | | | | | |
| | | | | | | | | | | | | | |
| | | | | | | | | | | | | | |
Operating expenses for the three months ended June 30, 2015 increased $7.5 million, or 85.9%, to $16.1 million compared to $8.7 million for the three months ended June 30, 2014. The increase in operating expenses was driven primarily by a $3.8 million increase in the U.S. Debit and Credit
71
segment and a $3.3 million increase in our corporate expenses. The $3.8 million increase in the U.S. Debit and Credit segment was driven by a $3.2 million increase related to the EFT Source acquisition and the remaining increase was primarily attributable to additional salary and benefit expenses related to the elevated levels of segment net sales discussed above. The $3.3 million increase in corporate expenses was primarily driven by the $1.1 million increase in charges related to our phantom stock plan, $0.3 million related to accrued performance bonus in connection with the EFT Source acquisition, a $0.7 million increase in depreciation and amortization expense, a $0.2 million increase in corporate salaries and a $0.9 million increase in other general and administrative expenses.
Income from Operations and Operating Margin
| |
Three Months Ended June 30, | |
|
|
|
||||||||||||||
|---|---|---|---|---|---|---|---|---|---|---|---|---|---|---|---|---|---|---|---|
| |
2015 | % of net sales | 2014 | % of net sales | Change | % Change | |||||||||||||
| |
(dollars in thousands) |
||||||||||||||||||
Income from operations by segment: |
|||||||||||||||||||
U.S Debit and Credit segment |
$ | 22,140 | 30.2 | % | $ | 5,640 | 19.7 | % | $ | 16,500 | 292.6 | % | |||||||
U.S. Prepaid Debit segment |
3,212 | 25.9 | % | 3,327 | 25.6 | % | (115 | ) | (3.5 | )% | |||||||||
U.K. Limited segment |
486 | 6.3 | % | 599 | 6.5 | % | (113 | ) | (18.9 | )% | |||||||||
Other |
(1,125 | ) | (19.3 | )% | (1,020 | ) | (19.5 | )% | (105 | ) | 10.3 | % | |||||||
Corporate |
(5,026 | ) | (1,677 | ) | (3,349 | ) | |||||||||||||
| | | | | | | | | | | | | | | | | | | | |
Total |
$ | 19,687 | 20.6 | % | $ | 6,869 | 12.9 | % | $ | 12,818 | 186.6 | % | |||||||
| | | | | | | | | | | | | | | | | | | | |
| | | | | | | | | | | | | | | | | | | | |
| | | | | | | | | | | | | | | | | | | | |
Income from operations for the three months ended June 30, 2015 increased $12.8 million, or 186.6%, to $19.7 million compared to $6.9 million for the three months ended June 30, 2014. Excluding charges of $0.9 million and a benefit of $0.2 million, for the three months ended June 30, 2015 and 2014, respectively, related to our phantom stock plan and $0.3 million of accrued performance bonuses in connection with the EFT Source acquisition in the three months ended June 30, 2015, income from operations for the three months ended June 30, 2015 increased $14.2 million, or 213.2%, relative to the three months ended June 30, 2014. Operating margins for the three months ended June 30, 2015 increased to 20.6% compared to 12.9% for the three months ended June 30, 2014. Excluding the charges related to our phantom stock plan and the EFT Source acquisition performance bonus charge discussed above, operating margins for the three months ended June 30, 2015 increased to 21.9% compared to 12.5% for the three months ended June 30, 2014.
Income from operations for the U.S. Debit and Credit segment for the three months ended June 30, 2015 increased $16.5 million, or 292.6%, to $22.1 million compared to $5.6 million for the three months ended June 30, 2014. Operating margins for the three months ended June 30, 2015 increased to 30.2% compared to 19.7% for the three months ended June 30, 2014. Income from operations for the U.S. Prepaid Debit segment for the three months ended June 30, 2015 decreased $0.1 million, or 3.5%, to $3.2 million compared to $3.3 million for the three months ended June 30, 2014. Operating margins for the three months ended June 30, 2015 increased to 25.9% compared to 25.6% for the three months ended June 30, 2014. Income from operations for the U.K. Limited segment for the three months ended June 30, 2015 decreased $0.1 million, or 18.9%, to $0.5 million compared to $0.6 million for the three months ended June 30, 2014. Operating margins for the three months ended June 30, 2015 decreased to 6.3% compared to 6.5% for the three months ended June 30, 2014.
Interest income (expense). Interest expense for the three months ended June 30, 2015 decreased $0.2 million, or 8.2%, to $1.6 million compared to $1.8 million for the three months ended June 30, 2014 as a result of decreased debt levels.
72
Provision for income taxes. The provision for income taxes for the three months ended June 30, 2015 increased $4.0 million to $6.0 million compared to $2.0 million for the three months ended June 30, 2014, driven by the increase in income before taxes of $13.1 million.
Year Ended December 31, 2014 Compared With Year Ended December 31, 2013
The table below presents our results of operations for the years ended December 31, 2014 and 2013:
| |
Year Ended December 31, |
|
|
||||||||||
|---|---|---|---|---|---|---|---|---|---|---|---|---|---|
| |
2014 | 2013 | $ Change | % Change | |||||||||
| |
(dollars in thousands) |
||||||||||||
Net sales: |
|||||||||||||
Products |
$ | 159,220 | $ | 101,360 | $ | 57,860 | 57.1 | % | |||||
Services |
101,786 | 95,010 | 6,776 | 7.1 | % | ||||||||
| | | | | | | | | | | | | | |
Total net sales |
261,006 | 196,370 | 64,636 | 32.9 | % | ||||||||
Cost of sales |
179,279 | 136,874 | 42,405 | 31.0 | % | ||||||||
| | | | | | | | | | | | | | |
Gross profit |
81,727 | 59,496 | 22,231 | 37.4 | % | ||||||||
Operating expenses |
47,255 | 33,347 | 13,908 | 41.7 | % | ||||||||
| | | | | | | | | | | | | | |
Income from operations |
34,472 | 26,149 | 8,323 | 31.8 | % | ||||||||
Other income (expense): |
|||||||||||||
Interest, net |
(7,508 | ) | (7,838 | ) | 330 | 4.2 | % | ||||||
Foreign exchange gain (loss) |
(124 | ) | (142 | ) | 18 | 12.7 | % | ||||||
Loss on debt modification and early extinguishment |
(476 | ) | — | (476 | ) | — | |||||||
Other (expense) income |
(101 | ) | 18 | (119 | ) | (661.1 | )% | ||||||
| | | | | | | | | | | | | | |
Income before taxes |
26,263 | 18,187 | 8,076 | 44.4 | % | ||||||||
Provision for income taxes |
(10,291 | ) | (6,988 | ) | (3,303 | ) | (47.3 | )% | |||||
| | | | | | | | | | | | | | |
Net income from continuing operations |
15,972 | 11,199 | 4,773 | 42.6 | % | ||||||||
Loss from discontinued operations |
(2,670 | ) | (2,612 | ) | (58 | ) | (2.2 | )% | |||||
| | | | | | | | | | | | | | |
Net income |
$ | 13,302 | $ | 8,587 | $ | 4,715 | 54.9 | % | |||||
| | | | | | | | | | | | | | |
| | | | | | | | | | | | | | |
| | | | | | | | | | | | | | |
73
Net Sales
| |
Year Ended December 31, |
|
|
||||||||||
|---|---|---|---|---|---|---|---|---|---|---|---|---|---|
| |
2014 | 2013 | $ Change | % Change | |||||||||
| |
(dollars in thousands) |
||||||||||||
Net sales by segment: |
|||||||||||||
U.S. Debit and Credit segment—Products |
$ | 132,975 | $ | 86,302 | $ | 46,673 | 54.1 | % | |||||
U.S. Debit and Credit segment—Services |
20,040 | 5,324 | 14,716 | 276.4 | % | ||||||||
| | | | | | | | | | | | | | |
U.S. Debit and Credit segment—Total |
153,015 | 91,626 | 61,389 | 67.0 | % | ||||||||
U.S. Prepaid Debit segment—Products |
— |
— |
— |
— |
|||||||||
U.S. Prepaid Debit segment—Services |
59,271 | 65,895 | (6,624 | ) | (10.1 | )% | |||||||
| | | | | | | | | | | | | | |
U.S. Prepaid Debit segment—Total |
59,271 | 65,895 | (6,624 | ) | (10.1 | )% | |||||||
U.K. Limited segment—Products |
24,623 |
22,238 |
2,385 |
10.7 |
% |
||||||||
U.K. Limited segment—Services |
10,540 | 11,004 | (464 | ) | (4.2 | )% | |||||||
| | | | | | | | | | | | | | |
U.K. Limited segment—Total |
35,163 | 33,242 | 1,921 | 5.8 | % | ||||||||
Other—Products |
11,682 |
10,907 |
775 |
7.1 |
% |
||||||||
Other—Services |
12,226 | 13,771 | (1,545 | ) | (11.2 | )% | |||||||
| | | | | | | | | | | | | | |
Other—Total |
23,908 | 24,678 | (770 | ) | (3.1 | )% | |||||||
Inter-company eliminations |
(10,351 |
) |
(19,071 |
) |
8,720 |
(45.7 |
)% |
||||||
| | | | | | | | | | | | | | |
Total |
$ | 261,006 | $ | 196,370 | $ | 64,636 | 32.9 | % | |||||
| | | | | | | | | | | | | | |
| | | | | | | | | | | | | | |
| | | | | | | | | | | | | | |
Net sales for the year ended December 31, 2014 increased $64.6 million, or 32.9%, to $261.0 million compared to $196.4 million for the year ended December 31, 2013. The increase in net sales during 2014 was due to growth in net sales of 67.0% and 5.8% in our U.S. Debit and Credit segment and U.K. Limited segment, respectively, offset by a 10.1% decline in our U.S. Prepaid Debit segment as compared to 2013.
Net sales for the U.S. Debit and Credit segment for the year ended December 31, 2014 increased $61.4 million, or 67.0%, to $153.0 million compared to $91.6 million for the year ended December 31, 2013. The increase in net sales was driven by an increase in EMV related revenue of $58.2 million, a $14.7 million increase in card services revenue, a $7.4 million increase in instant issuance revenue and various other items, offset by declines in magnetic stripe card revenue of $12.0 million and contactless card revenue of $2.4 million. The increase in EMV revenue of $58.2 million was driven by our card issuing bank customers or end-users adopting EMV technology for debit and credit cards. For the year ended December 31, 2014, we sold 62.5 million EMV cards (approximately 5.7% of which were Dual-Interface EMV) at an average selling price of $1.06 per card compared to 5.6 million EMV cards (approximately 12.7% of which were Dual-Interface EMV) at an average selling price of $1.28 per card for the year ended December 31, 2013. The increase in card services revenue of $14.7 million was driven primarily by the impact of our acquisition of EFT Source on September 2, 2014, including new personalization customers coming onto our acquired service platform and services related to debit and credit cards reissued in response to data breaches at large U.S. retailers. Likewise, the $7.4 million growth in instant issuance revenue was also driven by the acquisition of EFT Source, as well as continued growth of Card@Once® in 2014. The $12.0 million decline in magnetic stripe revenue and the $2.4 million decline in contactless revenue were primarily driven by our card issuing bank customers upgrading from magnetic stripe cards and contactless cards to EMV cards.
74
Net sales for the U.S. Prepaid Debit segment for the year ended December 31, 2014 decreased $6.6 million, or 10.1%, to $59.3 million compared to $65.9 million for the year ended December 31, 2013. The decline was driven primarily by our largest customer for this segment drawing down inventory levels.
Net sales for the U.K. Limited segment for the year ended December 31, 2014 increased $1.9 million, or 5.8%, to $35.2 million compared to $33.2 million for the year ended December 31, 2013. The increase in sales was primarily driven by a $1.9 million increase in retail gift and loyalty card product and services revenue.
Cost of Sales
| |
Year Ended December 31, |
|
|
||||||||||
|---|---|---|---|---|---|---|---|---|---|---|---|---|---|
| |
2014 | 2013 | $ Change | % Change | |||||||||
| |
(dollars in thousands) |
||||||||||||
Cost of sales by segment: |
|||||||||||||
U.S. Debit and Credit segment |
$ | 103,555 | $ | 66,585 | $ | 36,970 | 55.5 | % | |||||
U.S. Prepaid Debit segment |
38,249 | 43,010 | (4,761 | ) | (11.1 | )% | |||||||
U.K. Limited segment |
26,992 | 25,576 | 1,416 | 5.5 | % | ||||||||
Other |
20,926 | 21,718 | (792 | ) | (3.6 | )% | |||||||
Eliminations |
(10,443 | ) | (20,015 | ) | 9,572 | 47.8 | % | ||||||
| | | | | | | | | | | | | | |
Total |
$ | 179,279 | $ | 136,874 | $ | 42,405 | 31.0 | % | |||||
| | | | | | | | | | | | | | |
| | | | | | | | | | | | | | |
| | | | | | | | | | | | | | |
Cost of sales for the year ended December 31, 2014 increased $42.4 million, or 31.0%, to $179.3 million compared to $136.9 million for the year ended December 31, 2013. Cost of sales for the U.S. Debit and Credit segment for the year ended December 31, 2014 increased $37.0 million, or 55.5%, to $103.6 million compared to $66.6 million for the year ended December 31, 2013. The increases in cost of sales were driven by a $21.2 million increase in technology materials (primarily EMV chip assemblies), a $4.4 million increase in other materials, a $6.8 million increase in overhead, a $5.3 million increase in labor and benefits costs and a $1.1 million increase in depreciation and amortization. The $21.2 million increase in technology materials was driven by the increased number of EMV cards shipped as noted above and is a direct result of U.S. card issuing banks upgrading debit and credit cards to EMV which include an integrated circuit chip assembly and in certain cases may also include an RFID inlay assembly. The $6.8 million increase in overhead expenses and the $4.4 million increase in other materials was driven primarily by the EFT Source acquisition and to a lesser extent by our new secure EMV production and card services facility that became operational in 2014. The $5.3 million increase in labor costs was driven by the acquisition of EFT Source and additional labor costs associated with the production of EMV cards which are more complex than non-EMV cards and therefore have a higher labor component. Finally, increases in depreciation and amortization expense were driven by the EFT Source acquisition and the new secure EMV production and card services facility noted above.
Cost of sales for the U.S. Prepaid Debit segment for the year ended December 31, 2014 decreased $4.8 million, or 11.1%, to $38.2 million compared to $43.0 million for the year ended December 31, 2013. The decrease in cost of sales was driven by the reduced level of net sales referenced above and more efficient production, partially offset by increased depreciation from elevated levels of capital investment during 2013 and 2014 to expand our tamper-evident security packaging capacity.
Cost of sales for the U.K. Limited segment for the year ended December 31, 2014 increased $1.4 million, or 5.5%, to $27.0 million compared to $25.6 million for the year ended December 31, 2013. Increases in cost of sales was driven by a $0.9 million increase in labor costs and a $0.7 million increase in materials costs which were partially offset by a decrease in depreciation and amortization.
75
The increase in labor and material expense was driven by the increased level of net sales in 2014, as compared to 2013, noted above.
Gross Profit and Gross Profit Margin
| |
Year Ended December 31, | |
|
||||||||||||||||
|---|---|---|---|---|---|---|---|---|---|---|---|---|---|---|---|---|---|---|---|
| |
2014 | % of net sales |
2013 | % of net sales |
$ Change | % Change | |||||||||||||
| |
(dollars in thousands) |
||||||||||||||||||
Gross profit by segment: |
|||||||||||||||||||
U.S. Debit and Credit segment |
$ | 49,460 | 32.3 | % | $ | 25,041 | 27.3 | % | $ | 24,419 | 97.5 | % | |||||||
U.S. Prepaid Debit segment |
21,022 | 35.5 | % | 22,885 | 34.7 | % | (1,863 | ) | (8.1 | )% | |||||||||
U.K. Limited segment |
8,171 | 23.2 | % | 7,666 | 23.1 | % | 505 | 6.6 | % | ||||||||||
Other |
3,074 | 12.9 | % | 3,904 | 15.8 | % | (830 | ) | (21.3 | )% | |||||||||
| | | | | | | | | | | | | | | | | | | | |
Total |
$ | 81,727 | 31.3 | % | $ | 59,496 | 30.3 | % | $ | 22,231 | 37.4 | % | |||||||
| | | | | | | | | | | | | | | | | | | | |
| | | | | | | | | | | | | | | | | | | | |
| | | | | | | | | | | | | | | | | | | | |
Gross profit for the year ended December 31, 2014 increased $22.2 million, or 37.4%, to $81.7 million compared to $59.5 million for the year ended December 31, 2013. Gross profit margin for the year ended December 31, 2014 increased to 31.3% compared to 30.3% for the year ended December 31, 2013. Gross profit for the U.S. Debit and Credit segment for the year ended December 31, 2014 increased $24.4 million, or 97.5%, to $49.5 million compared to $25.0 million for the year ended December 31, 2013. Gross profit margin for the U.S. Debit and Credit segment for the year ended December 31, 2014 increased to 32.3% compared to 27.3% for the year ended December 31, 2013. Increases in gross profit were driven by a $14.0 million contribution from increased EMV volumes (net of reduced gross profit from non-EMV cards) and a $10.5 million increase from the EFT Source acquisition.
Gross profit for the U.S. Prepaid Debit segment for the year ended December 31, 2014 decreased $1.9 million, or 8.1%, to $21.0 million compared to $22.9 million for the year ended December 31, 2013. The decrease in gross profit was primarily driven by a reduced level of net sales referenced above, partially offset by the improved production efficiencies at this segment. Gross profit margin for the U.S. Prepaid Debit segment for the year ended December 31, 2014 increased to 35.5% compared to 34.7% for the year ended December 31, 2013.
Gross profit for the U.K. Limited segment for the year ended December 31, 2014 increased $0.5 million, or 6.6%, to $8.2 million compared to $7.7 million for the year ended December 31, 2013. Gross profit margin for the U.K. Limited segment for the year ended December 31, 2014 increased to 23.2% compared to 23.1% for the year ended December 31, 2013. Increases in gross profit were driven by increased retail gift and loyalty card product and services revenue which drove a $0.5 million increase in gross profit.
76
Operating Expenses
| |
Year Ended December 31, |
|
|
||||||||||
|---|---|---|---|---|---|---|---|---|---|---|---|---|---|
| |
2014 | 2013 | $ Change | % Change | |||||||||
| |
(dollars in thousands) |
||||||||||||
Operating expenses by segment: |
|||||||||||||
U.S. Debit and Credit segment |
$ | 15,053 | $ | 9,730 | $ | 5,323 | 54.7 | % | |||||
U.S. Prepaid Debit segment |
5,266 | 4,976 | 290 | 5.8 | % | ||||||||
U.K. Limited segment |
6,396 | 6,301 | 95 | 1.5 | % | ||||||||
Other |
5,457 | 5,549 | (92 | ) | (1.7 | )% | |||||||
Corporate |
15,083 | 6,791 | 8,292 | 122.1 | % | ||||||||
| | | | | | | | | | | | | | |
Total |
$ | 47,255 | $ | 33,347 | $ | 13,908 | 41.7 | % | |||||
| | | | | | | | | | | | | | |
| | | | | | | | | | | | | | |
| | | | | | | | | | | | | | |
Operating expenses for the year ended December 31, 2014 increased $13.9 million, or 41.7%, to $47.2 million compared to $33.3 million for the year ended December 31, 2013. Excluding charges of $4.5 million and $0.6 million, in 2014 and 2013, respectively, related to our phantom stock plan and investment banking, advisory and related professional fees in 2014 of $2.1 million, operating expenses for the year ended December 31, 2014 increased $7.9 million, or 24.1%. The increase in operating expenses was driven primarily by a $5.3 million increase in the U.S. Debit and Credit segment and a $8.3 million increase in our corporate expenses. The $5.3 million increase in the U.S. Debit and Credit segment was driven by a $4.1 million increase related to the EFT Source acquisition and the remaining increase was primarily attributable to additional selling, salary and other expenses related to the elevated levels of segment net sales discussed above. The $8.3 million increase in corporate expenses was primarily driven by the $4.5 million charge related to our phantom stock plan, $2.1 million related to investment banking, advisory and related professional fees, and a $1.3 million increase in corporate salaries and management incentive payments.
Income from Operations and Operating Margin
| |
Year Ended December 31, | |
|
||||||||||||||||
|---|---|---|---|---|---|---|---|---|---|---|---|---|---|---|---|---|---|---|---|
| |
2014 | % of net sales |
2013 | % of net sales |
$ Change | % Change | |||||||||||||
| |
(dollars in thousands) |
||||||||||||||||||
Income from operations by segment: |
|||||||||||||||||||
U.S. Debit and Credit segment |
$ | 34,407 | 22.5 | % | $ | 15,311 | 16.7 | % | $ | 19,096 | 124.7 | % | |||||||
U.S. Prepaid Debit segment |
15,756 | 26.6 | % | 17,909 | 27.2 | % | (2,153 | ) | (12.0 | )% | |||||||||
U.K. Limited segment |
1,775 | 5.0 | % | 1,365 | 4.1 | % | 410 | 30.0 | % | ||||||||||
Other |
(2,383 | ) | (10.0 | )% | (1,645 | ) | (6.7 | )% | (738 | ) | (44.9 | )% | |||||||
Corporate |
(15,083 | ) | (6,791 | ) | (8,292 | ) | |||||||||||||
| | | | | | | | | | | | | | | | | | | | |
Total |
$ | 34,472 | 13.2 | % | $ | 26,149 | 13.3 | % | $ | 8,323 | 31.8 | % | |||||||
| | | | | | | | | | | | | | | | | | | | |
| | | | | | | | | | | | | | | | | | | | |
| | | | | | | | | | | | | | | | | | | | |
Income from operations for the year ended December 31, 2014 increased $8.3 million, or 31.8%, to $34.5 million compared to $26.2 million for the year ended December 31, 2013. Excluding the 2014 and 2013 charges of $4.5 million and $0.6 million, respectively, related to our phantom stock plan and investment banking, advisory and related professional fees in 2014 of $2.1 million, income from operations for the year ended December 31, 2014 increased $14.3 million, or 53.3%, relative to the year ended December 31, 2013. Operating margins for the year ended December 31, 2014 decreased to 13.2% compared to 13.3% for the year ended December 31, 2013. Excluding the 2014 and 2013 charges related to our phantom stock plan and investment banking, advisory and related professional fees discussed above, operating margins for the year ended December 31, 2014 increased to 15.7% compared to 13.6% for the year ended December 31, 2013.
77
Income from operations for the U.S. Debit and Credit segment for the year ended December 31, 2014 increased $19.1 million, or 124.7%, to $34.4 million compared to $15.3 million for the year ended December 31, 2013. Operating margins for the year ended December 31, 2014 increased to 22.5% compared to 16.7% for the year ended December 31, 2013. Income from operations for the U.S. Prepaid Debit segment for the year ended December 31, 2014 decreased $2.2 million, or 12.0%, to $15.8 million compared to $17.9 million for the year ended December 31, 2013. Operating margins for the year ended December 31, 2014 decreased to 26.6% compared to 27.2% for the year ended December 31, 2013. Income from operations for the U.K. Limited segment for the year ended December 31, 2014 increased $0.4 million, or 30.0%, to $1.8 million compared to $1.4 million for the year ended December 31, 2013. Operating margins for the year ended December 31, 2014 increased to 5.0% compared to 4.1% for the year ended December 31, 2013.
Interest income (expense). Interest expense for the year ended December 31, 2014 decreased $0.3 million, or 4.2%, to $7.5 million compared to $7.8 million for the year ended December 31, 2013. The decrease in interest expense was driven by a reduction in borrowing rates negotiated with our lenders in September 2014 which was partially offset by additional interest expense related to incremental indebtedness incurred in September 2014 in connection with the acquisition of EFT Source.
Loss on debt modification and early extinguishment. Loss on debt modification and early extinguishment for the year ended December 31, 2014 was $0.5 million driven by a write-off of capitalized debt expense in connection with the debt modification described above.
Provision for income taxes. The provision for income taxes for the year ended December 31, 2014 increased $3.3 million, to $10.3 million, compared to $7.0 million for the year ended December 31, 2013 driven by the increase in income before taxes of $8.1 million.
Fourth Quarter
Our fourth quarter net sales performance has historically been strong. Net sales for our U.S. Debit & Credit segment grew by 186.3% in the fourth quarter of 2014 versus a decline of 5.3% in the fourth quarter of 2013, compared to the prior year. Net sales for our U.S. Prepaid Debit segment declined by 14.8% in the fourth quarter of 2014 and 33.1% in the fourth quarter of 2013, compared to the prior year. Net sales for our U.K. Limited segment grew by 11.3% in the fourth quarter of 2014 and 0.4% in the fourth quarter of 2013, compared to the prior year.
Adjusted EBITDA margins in the fourth quarter of 2014 continued to improve over the fourth quarter of 2013 due to increased operating leverage driven by increased net sales. The increases in net sales have been primarily driven by an increase in the shipment of EMV Financial Payment Cards, which generally have higher selling prices and gross profits than the non-EMV Financial Payment Cards that they are replacing.
The fourth quarter of 2014 benefited from the EFT Source acquisition on September 2, 2014, which became part of our U.S. Debit and Credit segment. The fourth quarter of 2014 also benefited from a sharp increase in the shipment of EMV Financial Payment Cards as U.S. debit and credit card issuers began the process of upgrading non-EMV Financial Payment Cards to EMV Financial Payment Cards.
78
Year Ended December 31, 2013 Compared With Year Ended December 31, 2012
The table below presents our results of operations for the years ended December 31, 2013 and 2012:
| |
Year Ended December 31, | |
|
||||||||||
|---|---|---|---|---|---|---|---|---|---|---|---|---|---|
| |
2013 | 2012 | $ Change | % Change | |||||||||
| |
(dollars in thousands) |
||||||||||||
Net Sales |
|||||||||||||
Products |
$ | 101,360 | $ | 98,969 | $ | 2,391 | 2.4 | % | |||||
Services |
95,010 | 84,817 | 10,193 | 12.0 | % | ||||||||
| | | | | | | | | | | | | | |
Total net sales |
196,370 | 183,786 | 12,584 | 6.8 | % | ||||||||
Cost of sales |
136,874 | 130,897 | 5,977 | 4.6 | % | ||||||||
| | | | | | | | | | | | | | |
Gross profit |
59,496 | 52,889 | 6,607 | 12.5 | % | ||||||||
Operating expenses |
33,347 | 32,985 | 362 | 1.1 | % | ||||||||
| | | | | | | | | | | | | | |
Income from operations |
26,149 | 19,904 | 6,245 | 31.4 | % | ||||||||
Other income (expense): |
|||||||||||||
Interest, net |
(7,838 | ) | (5,765 | ) | (2,073 | ) | 36.0 | % | |||||
Foreign currency gain (loss) |
(142 | ) | (279 | ) | 137 | (49.1 | )% | ||||||
Gain on purchase of ID Data |
— | 604 | (604 | ) | (100.0 | )% | |||||||
Other income |
18 | 171 | (153 | ) | (89.5 | )% | |||||||
| | | | | | | | | | | | | | |
Income before taxes |
18,187 | 14,635 | 3,552 | 24.3 | % | ||||||||
Provision for income taxes |
(6,988 | ) | (5,909 | ) | (1,079 | ) | 18.3 | % | |||||
| | | | | | | | | | | | | | |
Net income from continuing operations |
11,199 | 8,726 | 2,473 | 28.3 | % | ||||||||
Loss from discontinued operations |
(2,612 | ) | (3,796 | ) | 1,184 | (31.2 | )% | ||||||
| | | | | | | | | | | | | | |
Net income |
$ | 8,587 | $ | 4,930 | $ | 3,657 | 74.2 | % | |||||
| | | | | | | | | | | | | | |
| | | | | | | | | | | | | | |
| | | | | | | | | | | | | | |
Net Sales
| |
Year Ended December 31, | |
|
||||||||||
|---|---|---|---|---|---|---|---|---|---|---|---|---|---|
| |
2013 | 2012 | $ Change | % Change | |||||||||
| |
(dollars in thousands) |
||||||||||||
Net sales by segment: |
|||||||||||||
U.S. Debit and Credit segment—Products |
$ | 86,302 | $ | 79,266 | $ | 7,036 | 8.9 | % | |||||
U.S. Debit and Credit segment—Services |
5,324 | 2,336 | 2,988 | 127.9 | % | ||||||||
| | | | | | | | | | | | | | |
U.S. Debit and Credit segment—Total |
91,626 | 81,602 | 10,024 | 12.3 | % | ||||||||
U.S. Prepaid Debit segment—Products |
— | — | — | ||||||||||
U.S. Prepaid Debit segment—Services |
65,895 | 64,624 | 1,271 | 2.0 | % | ||||||||
| | | | | | | | | | | | | | |
U.S. Prepaid Debit segment—Total |
65,895 | 64,624 | 1,271 | 2.0 | % | ||||||||
U.K. Limited segment—Products |
22,238 | 22,162 | 76 | 0.3 | % | ||||||||
U.K. Limited segment—Services |
11,004 | 11,973 | (969 | ) | (8.1 | )% | |||||||
| | | | | | | | | | | | | | |
U.K. Limited segment—Total |
33,242 | 34,135 | (893 | ) | (2.6 | )% | |||||||
Other—Products |
10,907 | 11,215 | (308 | ) | (2.7 | )% | |||||||
Other—Services |
13,771 | 7,277 | 6,494 | 89.2 | % | ||||||||
| | | | | | | | | | | | | | |
Other—Total |
24,678 | 18,492 | 6,186 | 33.5 | % | ||||||||
Inter-company eliminations |
(19,071 | ) | (15,067 | ) | (4,004 | ) | 26.6 | % | |||||
| | | | | | | | | | | | | | |
Total |
$ | 196,370 | $ | 183,786 | $ | 12,584 | 6.8 | % | |||||
| | | | | | | | | | | | | | |
| | | | | | | | | | | | | | |
| | | | | | | | | | | | | | |
79
Net sales for the year ended December 31, 2013 increased $12.6 million, or 6.8%, to $196.4 million compared to $183.8 million for the year ended December 31, 2012. The increase in net sales during the year ended December 31, 2013 as compared to the year ended December 31, 2012 was primarily due to growth in net sales of 12.3% in our U.S. Debit and Credit segment and 33.5% in our other operating segments.
Net sales for the U.S. Debit and Credit segment for the year ended December 31, 2013 increased $10.0 million, or 12.3%, to $91.6 million compared to $81.6 million for the year ended December 31, 2012. The increase in net sales was primarily driven by increases in Contactless Card related net sales of $7.0 million and card services net sales of $3.0 million.
Net sales for the U.S. Prepaid Debit segment for the year ended December 31, 2013 increased $1.3 million, or 2.0%, to $65.9 million compared to $64.6 million for the year ended December 31, 2012. The increase in net sales was due to increased demand for tamper-evident security packaging for Prepaid Debit Card customers.
Net sales for the U.K. Limited segment for the year ended December 31, 2013 declined $0.9 million, or 2.6%, to $33.2 million compared to $34.1 million for the year ended December 31, 2012. The decrease in net sales was primarily due to the strengthening U.S. dollar.
Net sales for the other operating segments for the year ended December 31, 2013 increased $6.2 million, or 33.5%, to $24.7 million compared to $18.5 million for the year ended December 31, 2012. The increase in net sales was primarily driven by the full-year impact of the ID Data acquisition.
Cost of Sales
| |
Year Ended December 31, | |
|
||||||||||
|---|---|---|---|---|---|---|---|---|---|---|---|---|---|
| |
2013 | 2012 | $ Change | % Change | |||||||||
| |
(dollars in thousands) |
||||||||||||
Cost of sales by segment: |
|||||||||||||
U.S. Debit and Credit segment |
$ | 66,585 | $ | 60,280 | $ | 6,305 | 10.5 | % | |||||
U.S. Prepaid Debit segment |
43,010 | 43,310 | (300 | ) | (0.7 | )% | |||||||
U.K. Limited segment |
25,576 | 26,001 | (425 | ) | (1.6 | )% | |||||||
Other |
21,718 | 16,146 | 5,572 | 34.5 | % | ||||||||
Eliminations |
(20,015 | ) | (14,840 | ) | (5,175 | ) | 34.9 | % | |||||
| | | | | | | | | | | | | | |
Total |
$ | 136,874 | $ | 130,897 | $ | 5,977 | 4.6 | % | |||||
| | | | | | | | | | | | | | |
| | | | | | | | | | | | | | |
| | | | | | | | | | | | | | |
Cost of sales for the year ended December 31, 2013 increased $6.0 million, or 4.6%, to $136.9 million compared to $130.9 million for the year ended December 31, 2012. Cost of sales for the U.S. Debit and Credit segment for the year ended December 31, 2013 increased $6.3 million, or 10.5%, to $66.6 million compared to $60.3 million for the year ended December 31, 2012. The increase in cost of sales was primarily driven by an increase in technology materials (primarily RFID inlay assemblies), as well as increases in labor and overhead related to the elevated level of Contactless Card net sales referenced above. The increase was also driven by costs associated with the increased levels of card services net sales.
Cost of sales for the U.S. Prepaid Debit segment for the year ended December 31, 2013 decreased $0.3 million, or 0.7%, to $43.0 million compared to $43.3 million for the year ended December 31, 2012. The decrease in cost of sales was driven by more efficient production.
Cost of sales for the U.K. Limited segment for the year ended December 31, 2013 decreased $0.4 million, or 1.6%, to $25.6 million compared to $26.0 million for the year ended December 31, 2012. The decrease in cost of sales was driven by the decreased level of net sales referenced above.
80
Cost of sales for the other operating segments for the year ended December 31, 2013 increased $5.6 million, or 34.5%, to $21.7 million compared to $16.1 million for the year ended December 31, 2012. The increase in cost of sales was primarily driven by the full-year impact of the ID Data acquisition.
Gross Profit and Gross Profit Margin
| |
Year Ended December 31, | |
|
|
|
||||||||||||||
|---|---|---|---|---|---|---|---|---|---|---|---|---|---|---|---|---|---|---|---|
| |
2013 | % of net sales |
2012 | % of net sales |
$ Change | % Change | |||||||||||||
| |
(dollars in thousands) |
|
|
||||||||||||||||
Gross profit by segment: |
|||||||||||||||||||
U.S. Debit and Credit segment |
$ | 25,041 | 27.3 | % | $ | 21,322 | 26.1 | % | $ | 3,719 | 17.4 | % | |||||||
U.S. Prepaid Debit segment |
22,885 | 34.7 | % | 21,314 | 33.0 | % | 1,571 | 7.4 | % | ||||||||||
U.K. Limited segment |
7,666 | 23.1 | % | 8,134 | 23.8 | % | (468 | ) | (5.8 | )% | |||||||||
Other |
3,904 | 15.8 | % | 2,119 | 11.5 | % | 1,785 | 84.2 | % | ||||||||||
| | | | | | | | | | | | | | | | | | | | |
Total |
$ | 59,496 | 30.3 | % | $ | 52,889 | 28.8 | % | $ | 6,607 | 12.5 | % | |||||||
| | | | | | | | | | | | | | | | | | | | |
| | | | | | | | | | | | | | | | | | | | |
| | | | | | | | | | | | | | | | | | | | |
Gross profit for the year ended December 31, 2013 increased $6.6 million, or 12.5%, to $59.5 million compared to $52.9 million for the year ended December 31, 2012. Gross profit margin for the year ended December 31, 2013 increased to 30.3% compared to 28.8% for the year ended December 31, 2012. Gross profit for the U.S. Debit and Credit segment for the year ended December 31, 2013 increased $3.7 million, or 17.4%, to $25.0 million compared to $21.3 million for the year ended December 31, 2012. Gross profit margin for the U.S. Debit and Credit segment for the year ended December 31, 2013 increased to 27.3% compared to 26.1% for the year ended December 31, 2012. Increases in U.S. Debit and Credit segment gross profit were driven by an increased level of net sales referenced above.
Gross profit for the U.S. Prepaid Debit segment for the year ended December 31, 2013 increased $1.6 million, or 7.4%, to $22.9 million compared to $21.3 million for the year ended December 31, 2012. The increase in gross profit was primarily driven by the increased level of net sales referenced above and improved production efficiencies. Gross profit margin for the U.S. Prepaid Debit segment for the year ended December 31, 2013 increased to 34.7% compared to 33.0% for the year ended December 31, 2012.
Gross profit for the U.K. Limited segment for the year ended December 31, 2013 decreased 5.8% to $7.7 million compared to $8.1 million for the year ended December 31, 2012. Gross profit margin for the U.K. Limited segment for the year ended December 31, 2013 decreased to 23.1% compared to 23.8% for the year ended December 31, 2012. The declines in gross profit were driven by the decrease in net sales referenced above.
Gross profit for the other operating segment for the year ended December 31, 2013 increased $1.8 million, or 84.2%, to $3.9 million compared to $2.1 million for the year ended December 31, 2012. The increase in gross profit was primarily driven by the full-year impact of the ID Data acquisition.
81
Operating Expenses
| |
Year Ended December 31, | |
|
||||||||||
|---|---|---|---|---|---|---|---|---|---|---|---|---|---|
| |
2013 | 2012 | $ Change | % Change | |||||||||
| |
(dollars in thousands) |
||||||||||||
Operating expenses by segment: |
|||||||||||||
U.S. Debit and Credit segment |
$ | 9,730 | $ | 9,455 | $ | 275 | 2.9 | % | |||||
U.S. Prepaid Debit segment |
4,976 | 4,643 | 333 | 7.2 | % | ||||||||
U.K. Limited segment |
6,301 | 5,989 | 312 | 5.2 | % | ||||||||
Other |
5,549 | 5,001 | 548 | 11.0 | % | ||||||||
Corporate |
6,791 | 7,897 | (1,106 | ) | (14.0 | )% | |||||||
| | | | | | | | | | | | | | |
Total |
$ | 33,347 | $ | 32,985 | $ | 362 | 1.1 | % | |||||
| | | | | | | | | | | | | | |
| | | | | | | | | | | | | | |
| | | | | | | | | | | | | | |
Operating expenses for the year ended December 31, 2013 increased $0.4 million, or 1.1%, to $33.3 million compared to $33.0 million for the year ended December 31, 2012. Excluding a charge of $0.6 million for the year ended 2013 related to our phantom stock plan, operating expenses for the year ended December 31, 2013 decreased $0.3 million, or 0.8%, to $32.7 million compared to $33.0 million for the year ended December 31, 2012.
Income from Operations and Operating Margin
| |
Year Ended December 31, | |
|
|
|
||||||||||||||
|---|---|---|---|---|---|---|---|---|---|---|---|---|---|---|---|---|---|---|---|
| |
2013 | % of net sales |
2012 | % of net sales |
$ Change | % Change | |||||||||||||
| |
(dollars in thousands) |
|
|
||||||||||||||||
Income from operations by segment: |
|||||||||||||||||||
U.S. Debit and Credit segment |
$ | 15,311 | 16.7 | % | $ | 11,867 | 14.5 | % | $ | 3,444 | 29.0 | % | |||||||
U.S. Prepaid Debit segment |
17,909 | 27.2 | % | 16,671 | 25.8 | % | 1,238 | 7.4 | % | ||||||||||
U.K. Limited segment |
1,365 | 4.1 | % | 2,145 | 6.3 | % | (780 | ) | (36.4 | )% | |||||||||
Other |
(1,645 | ) | (6.7 | )% | (2,882 | ) | (15.6 | %) | 1,237 | (42.9 | )% | ||||||||
Corporate |
(6,791 | ) | (7,897 | ) | 1,106 | ||||||||||||||
| | | | | | | | | | | | | | | | | | | | |
Total |
$ | 26,149 | 13.3 | % | $ | 19,904 | 10.8 | % | $ | 6,245 | 31.4 | % | |||||||
| | | | | | | | | | | | | | | | | | | | |
| | | | | | | | | | | | | | | | | | | | |
| | | | | | | | | | | | | | | | | | | | |
Income from operations for the year ended December 31, 2013 increased $6.2 million, or 31.4%, to $26.1 million compared to $19.9 million for the year ended December 31, 2012. Operating margins for the year ended December 31, 2013 increased to 13.3% compared to 10.8% for the year ended December 31, 2012.
Excluding charges of $0.6 million for the year ended December 31, 2013 related to our phantom stock plan, income from operations for the year ended December 31, 2013 increased $6.8 million, or 34.4%, to $26.7 million compared to $19.9 million for the year ended December 31, 2012. Excluding the charge related to our phantom stock plan discussed above, operating margins for the year ended December 31, 2013 increased to 13.6% compared to 10.8% for the year ended December 31, 2012.
Income from operations for the U.S. Debit and Credit segment for the year ended December 31, 2013 increased $3.4 million, or 29.0%, to $15.3 million compared to $11.9 million for the year ended December 31, 2012. Operating margins for the year ended December 31, 2013 increased to 16.7% compared to 14.5% for the year ended December 31, 2012. Income from operations for the U.S. Prepaid Debit segment for the year ended December 31, 2013 increased $1.2 million, or 7.4%, to $17.9 million compared to $16.7 million for the year ended December 31, 2012. Operating margins for the year ended December 31, 2013 increased to 27.2% compared to 25.8% for the year ended December 31, 2012. Income from operations for the U.K. Limited segment for the year ended
82
December 31, 2013 decreased $0.8 million, or 36.4%, to $1.4 million from $2.1 million for the year ended December 31, 2012. Operating margins for the year ended December 31, 2013 decreased to 4.1% compared to 6.3% for the year ended December 31, 2012.
Interest income (expense)
Interest expense for the year ended December 31, 2013 increased $2.1 million, or 36.0%, to $7.8 million compared to $5.8 million for the year ended December 31, 2012. The increase in interest expense was driven by incremental indebtedness incurred in November 2012 in connection with a redemption of preferred stock.
Provision for income taxes
The provision for income taxes for the year ended December 31, 2013 increased $1.1 million to $7.0 million compared to $5.9 million for the year ended December 31, 2012 driven by the increase in income before taxes of $3.6 million.
Liquidity and Capital Resources
As of June 30, 2015, we had $13.0 million of cash and cash equivalents. Of this amount, $1.9 million was held in accounts outside of the United States.
On August 17, 2015, we and certain of our wholly-owned subsidiaries entered into the New Credit Agreement with a syndicate of lenders providing for the New Credit Facility, consisting of the $435 million New Term Loan Facility and the $40 million New Revolving Credit Facility. The New Term Loan Facility and New Revolving Credit Facility mature on August 17, 2022 and August 17, 2020, respectively. We used proceeds from the New Term Loan Facility to effect the Partial Preferred Redemption and to refinance our previously outstanding credit facility.
Interest rates under our New Credit Facility are based, at the company's election, on either a Eurodollar rate plus a margin of 4.50% or a base rate plus a margin of 3.50%. Letters of credit are subject to a 0.125% fronting fee payable to the issuing bank and a fee payable to the revolving lenders equal to the margin applicable to Eurodollar revolving loans. In addition, we are required to pay an unused commitment fee ranging from 0.50% per annum to 0.375% per annum of the average unused portion of the revolving commitments. The unused commitment fee is determined on the basis of a grid that results in a lower unused commitment fee as our total net leverage ratio declines.
Our New Credit Facility contains customary covenants, including among other things, restrictions on indebtedness, issuance of liens, investments, dividends, redemptions and other distributions to equityholders, asset sales, certain mergers or consolidations, sales, transfers, leases or dispositions of substantially all of our assets, and affiliate transactions. See "Description of Certain Indebtedness."
We expect to use approximately $115.0 million of the proceeds from this offering to repay indebtedness under the New Term Loan Facility incurred in connection with the Partial Preferred Redemption. Following this offering and the use of proceeds therefrom, we expect to have approximately $40.0 million of availability under our New Credit Facility to fund working capital and other liquidity needs.
As of August 17, 2015, we were in compliance with all covenants under the New Credit Facility. As of August 17, 2015, we had no amounts drawn under the New Revolving Credit Facility and $435.0 million of outstanding borrowings under the New Term Loan Facility.
On August 17, 2015, we redeemed 62,140 shares of Series A Preferred Stock and paid an aggregate of $276.3 million in return of capital and accrued dividends, net of the repayment of certain employee loans. Following the Partial Preferred Redemption, we had 2,576 shares of Series A Preferred Stock outstanding. The Series A Preferred Stock has an initial liquidation preference equal to $1,000 per outstanding share. In addition, the Series A Preferred Stock liquidation preference accrues a
83
dividend of 20% per share per annum, payable when declared by the board of directors. Such dividends accrue on each share from the date of original issuance and accrue on a daily basis, whether or not declared. Such dividends are cumulative so that if such dividend in respect of any previous or current annual dividend period, at the annual 20% rate, has not been paid, the deficiency shall first be fully paid before any dividend or other distribution shall be paid or declared and set apart for the Common Stock. As of August 17, 2015, the liquidation preference of Series A Preferred Stock had a value of approximately $4,446.70 per outstanding share. We expect to use approximately $11.5 million of the proceeds from this offering to redeem the remaining outstanding shares of our preferred stock.
We believe that our cash flows from operations, combined with our current cash levels and available borrowing capacity, will be adequate to fund debt service requirements and provide cash, as required, to support our ongoing operations, capital expenditures, lease obligations, and working capital for at least the next 12 months.
Operating Activities
Cash provided by operating activities for the six months ended June 30, 2015 was $18.9 million, compared to $1.0 million for the six months ended June 30, 2014. Cash provided by operating activities increased during the six months ended June 30, 2015 compared to the same period in the prior year primarily as a result of a $21.5 million increase in cash operating net income (net income adjusted for changes in non-cash charges related to our phantom stock plan of $2.1 million, depreciation and amortization expense of $0.8 million and loss on sale of discontinued operation of $1.0 million), which was driven primarily by strong performance in our U.S. Debit and Credit and U.S. Prepaid segments, partially offset by increases in corporate spending. The increase in cash operating net income was reduced by a $7.0 million increase in cash used to pay taxes, offset by a $3.9 million net decrease in working capital investments.
Cash provided by operating activities for the year ended December 31, 2014 was $26.6 million, compared to $23.6 million for the year ended December 31, 2013. Cash provided by operating activities increased during the year ended December 31, 2014 primarily due to a $12.7 million increase in cash operating income (operating income from continuing and discontinued operations as adjusted for changes in non-cash charges related to our phantom stock plan of $3.9 million and depreciation and amortization expense of $0.5 million) which was primarily driven by the significant increase in operating income of the U.S. Debit and Credit segment and partially offset by decreases in operating income of the U.S. Prepaid Debit segment and increases in corporate spending. The increase in cash operating income was partially offset by a $3.2 million increase in current income tax expense driven by increased profit before tax and a $6.6 million increase in working capital and other non-significant items.
Cash provided by operating activities for the year ended December 31, 2013 was $23.6 million, compared to $21.3 million for the year ended December 31, 2012. Cash provided by operating activities increased during the year ended December 31, 2013 primarily due to a $10.4 million increase in cash operating income (operating income from continuing and discontinued operations as adjusted for changes in non-cash charges related to our phantom stock plan of $0.6 million and depreciation and amortization expense of $1.6 million) which was primarily driven by the increase in operating income of the U.S. Debit and Credit segment and to a lesser extent the increases in operating income of the U.S. Prepaid Debit segment, the other operating segments and decreases in operating losses from our discontinued operation in Nevada and corporate expenses as further explained above. The increase in cash operating income was partially offset by a $1.5 million increase in current income tax expense driven by increased profit before tax, a $2.0 million increase in interest expense driven by increased debt level, and a $4.2 million increase in working capital and other non-significant items.
Investing Activities
Cash used in investing activities for the six months ended June 30, 2015 was $5.5 million, compared to $8.2 million for the six months ended June 30, 2014. Cash used by investing activities
84
decreased by $2.6 million due to $5.0 million of cash provided from the sale of a discontinued operation during the six months ended June 30, 2015, partially offset by a $2.4 million increase in acquisition of plant, equipment and leasehold improvements for the six months ended June 30, 2015 as compared to the six months ended June 30, 2014. The increase in acquisition of plant, equipment and leasehold improvements primarily related to elevated capital spending to prepare for the U.S. EMV conversion. As of June 30, 2015, we had $5.5 million in commitments to make capital expenditures.
Cash used in investing activities for the year ended December 31, 2014 was $71.8 million, compared to $9.2 million for the year ended December 31, 2013. Cash used in investing activities increased by $54.9 million primarily due to the EFT Source acquisition, and $7.7 million due to increased acquisition of plant, equipment and leasehold improvements primarily related to elevated capital spending to prepare for the U.S. EMV conversion. As of December 31, 2014, we had $7.9 million in commitments to make capital expenditures.
Cash used by investing activities for the year ended December 31, 2013 was $9.2 million, compared to $12.2 million for the year ended December 31, 2012. Cash used by investing activities decreased $1.8 million due to reduced acquisition of plant, equipment and leasehold improvements for the year ended December 31, 2013 as compared to the year ended December 31, 2012. Cash used for investing activities was also $1.2 million lower for the year ended December 31, 2013 as compared to the year ended December 31, 2012 due to the acquisition of ID Data, Limited. which occurred during the year ended December 31, 2012 and had no effect on the year ended December 31, 2013.
Financing Activities
Cash used in financing activities for the six months ended June 30, 2015 was $13.3 million, compared to $3.0 million of cash provided by financing activities for the six months ended June 30, 2014. The $16.3 million decrease in cash provided by financing activities was comprised of a $4.5 million increase in cash used to repay long-term debt, $10.8 million in borrowings being repaid under our previously outstanding credit facility, $0.6 million of cash paid for costs associated with the anticipated issuance of stock and $0.4 million of cash used for the redemption of preferred and common stock.
Cash provided from financing activities for the year ended December 31, 2014 was $48.5 million, compared to $12.1 million of cash used by financing activities for the year ended December 31, 2013. The increase in cash provided from financing activities of $60.6 million was funded by $60.0 million of long-term debt borrowings.
Cash used for financing activities for the year ended December 31, 2013 was $12.1 million, compared to $20.7 million for the year ended December 31, 2012. The $8.5 million decrease in cash used financing activities was comprised of a $36.2 million reduction in cash provided by indebtedness and $44.7 million reduction in cash used for the redemption of preferred and common stock and stockholder dividends.
Working Capital
Our working capital as of June 30, 2015 was $61.5 million compared to $45.5 million as of December 31, 2014. The $16.0 million increase in working capital during the six months ended June 30, 2015 was the result of recognizing a $10.5 million income tax benefit related to the write-off of tax deductible goodwill and intangible assets associated with our Nevada operation, which was recorded as a current tax receivable amount as of June 30, 2015. Additionally, the net of accounts receivable, inventories, accounts payable and accrued expenses increased $11.2 million during the six month period, reflecting an increase in the growth in the net sales of the Company. Offsetting these increases was a $5.8 million decrease in the current assets of discontinued operation, resulting from the sale of our Nevada operation during the period.
85
Our working capital as of December 31, 2014 was $45.5 million compared to $28.1 million as of December 31, 2013. The $17.4 million increase in working capital was driven by a $7.2 million increase in investment in working capital from operating activities, $7.6 million of working capital acquired in the EFT Source acquisition and a $2.9 million increase from the reclassification of fixed assets to current assets of a discontinued operation.
Bad Debt Expense
The allowance for bad debts and returns activity for the six months ended June 30, 2015 and the years ended December 31, 2014 and 2013 is summarized as follows:
Balance as of December 31, 2012 |
$ | 1,034 | ||
Bad debt expense |
650 | |||
Write-off of uncollectible accounts |
(320 | ) | ||
Currency translation adjustments |
1 | |||
| | | | | |
Balance as of December 31, 2013 |
1,365 | |||
Bad debt expense |
(100 | ) | ||
Write-off of uncollectible accounts |
(986 | ) | ||
Currency translation adjustments |
(7 | ) | ||
| | | | | |
Balance as of December 31, 2014 |
272 | |||
Bad debt expense |
407 | |||
Currency translation adjustments |
(5 | ) | ||
| | | | | |
Balance as of June 30, 2015 |
$ | 674 | ||
| | | | | |
| | | | | |
| | | | | |
The Company reserves for bad debts and customer credits on the specific identification method and assesses the amount of the required reserve for the period by an account-by-account analysis to determine which past due accounts may not be collected.
For the year ended December 31, 2013, the Company had reserved for several specific past due accounts attributable to its discontinued operations that were disputed by the customer. The disputed accounts were written off against the reserve during the year ended December 31, 2014. For the year ended December 31, 2014, the Company recognized $(0.1) million of bad debt expense as compared to $0.7 million of bad debt expense in the year ended December 31, 2013. The reduction in bad debt expense was the result of lower reserve requirements for the year ended December 31, 2014, as compared to the year ended December 31, 2013 as a result of an account-by-account analysis to determine which past due accounts may not be collected. For the six months ended June 30, 2015, the Company increased its reserve for bad debt to $0.7 million due to specific accounts of its discontinued operations that were retained in the sale of the discontinued operations on January 12, 2015. The Company determined that certain retained accounts may not be collected as a result of the sale.
Contractual Obligations
The following table summarizes our material contractual obligations as of December 31, 2014:
| |
Payments due by period—December 31, 2014 (in thousands) |
|||||||||||||||
|---|---|---|---|---|---|---|---|---|---|---|---|---|---|---|---|---|
| |
Total | Less than 1 year |
1 - 3 Years | 3 - 5 Years | More than 5 Years |
|||||||||||
Long-term debts |
$ | 179,866 | $ | 6,547 | $ | 173,319 | $ | — | $ | — | ||||||
Capital lease obligations |
133 | 82 | 51 | — | — | |||||||||||
Operating leases |
9,813 | 2,885 | 3,673 | 1,947 | 1,308 | |||||||||||
| | | | | | | | | | | | | | | | | |
Total contractual obligations |
$ | 189,812 | $ | 9,514 | $ | 177,043 | $ | 1,947 | $ | 1,308 | ||||||
| | | | | | | | | | | | | | | | | |
| | | | | | | | | | | | | | | | | |
| | | | | | | | | | | | | | | | | |
86
Additionally, as of June 30, 2015, 1,970 shares of our Preferred Stock are subject to a put, where the employees holding these preferred shares have the option upon leaving the Company to have the Company purchase the preferred shares at the then current liquidation preference. As of June 30, 2015, the aggregate liquidation preference of such shares was $8.4 million. See Note 11 (Series A Preferred Stock) to our unaudited condensed consolidated financial statements.
Cyclical and Seasonal Nature of Business
Financial Payment Cards and Private Label Credit Cards are generally influenced by broader cyclical changes in the economy, with economic downturns resulting in decreases in the demand for our products and services. In particular, prolonged economic downturns typically have resulted in significant reductions in the demand for general purpose credit cards due to tightening credit conditions. Additionally, we generate slightly higher net sales in the third and fourth quarters of the year, as our sales of Prepaid Debit Card solutions and retail gift cards are more heavily weighted toward the second half of the year when consumers tend to purchase more of these products and services in anticipation of the holiday season.
Taxation
We account for income taxes using an asset and liability approach to financial accounting and reporting for income taxes. Deferred income tax assets and liabilities are computed annually for differences between the financial statement and tax bases of assets and liabilities that will result in taxable or deductible amounts in the future based on enacted tax laws and rates applicable to the periods in which the differences are expected to affect taxable income.
We account for uncertain income tax positions in accordance with ASC 740, Income Taxes. ASC 740 prescribes a recognition threshold and measurement standard for the financial statement recognition and measurement of an income tax position taken or expected to be taken in a tax return. Only tax positions that meet the more-likely-than-not recognition threshold at the effective date may be recognized or continue to be recognized upon adoption. In addition, ASC 740 provides guidance on de-recognition, classification, interest and penalties, accounting in interim periods, disclosure, and transition.
We have analyzed our filing positions in all of the jurisdictions where we are required to file income tax returns, as well as all open tax years in these jurisdictions, and based upon our review, determined there are no unrecognized tax liabilities as of June 30, 2015.
Off-Balance Sheet Arrangements
We had no off-balance sheet arrangements at June 30, 2015 and December 31, 2014 and 2013.
Critical Accounting Policies and Estimates
Our management's discussion and analysis of financial condition and results of operations is based on our consolidated financial statements which have been prepared in accordance with accounting principles generally accepted in the United States of America. In preparing our financial statements, we make estimates, assumptions and judgments that can have a significant impact on our reported revenues, results of operations and net income, as well as on the value of certain assets and liabilities on our balance sheet during and as of the reporting periods. These estimates, assumptions and judgments are necessary because future events and their effects on our results and the value of our assets cannot be determined with certainty, and are made based on our historical experience and on other assumptions that we believe to be reasonable under the circumstances. These estimates may change as new events occur or additional information is obtained, and we may periodically be faced with uncertainties, the outcomes of which are not within our control and may not be known for a
87
prolonged period of time. Because the use of estimates is inherent in the financial reporting process, actual results could differ from those estimates.
Revenue Recognition
Generally, we recognize revenue related to sales of our products upon shipment, when persuasive evidence of an arrangement exists, delivery has occurred or services have been rendered, the fee is fixed or determinable, and collectability is reasonably assured. A provision for payment discounts, product return allowances and uncollectable accounts, which is estimated based upon our historical performance, management's experience and current economic trends, is recorded as a reduction of sales in the same period that the revenue is recognized.
In certain cases, at the customer's request, we enter into bill-and-hold transactions whereby title transfers to the customer, but the product does not ship until a specified later date. We recognize revenue associated with bill-and-hold arrangements when the product is complete and ready to ship, hold criteria have been met, the amount due from the customer is fixed, and collectability of the related receivable is reasonably assured. All of the foregoing requires us to apply our judgment. Bill-and-hold arrangements most often occur when customers request that we ship complete tamper-evident security packages containing a Prepaid Debit Card to our secure fulfillment center until they provide us further instructions at a later date to ship those packages to numerous individual retail locations or distribution centers.
Multiple-Element Arrangements
We enter into warehouse, fulfillment and distribution service agreements with several customers, where we are engaged to store and handle completed cards and tamper-evident security packages on their behalf. For the sales arrangements that contain multiple deliverables, the arrangement is split into separate units of accounting and individually delivered elements have value to the customer on a standalone basis. When separate units of accounting exist, revenue is allocated to each element based on our best estimate of competitive market prices. At the point in which completed cards and packages are shipped to our warehouse, the product is billed and the revenue is recognized in accordance with our revenue recognition policy. Warehousing services are recognized monthly based on volume and handling requirements; fulfillment services are recognized when the product is handled in the manner specified by the customer for a unit or handling fee. All of the foregoing requires us to apply our judgment. Multiple-element arrangements most often occur when customers request that we ship complete tamper-evident security packages containing a Prepaid Debit Card to our secure fulfillment center until they provide us further instructions at a later date to ship those packages to numerous individual retail locations or distribution centers.
Impairment Assessments of Goodwill and Long-Lived Assets
A component of our growth strategy has been to acquire and integrate businesses that complement our existing operations. We account for business combinations using the acquisition method and allocate the acquisition price of acquired companies to the tangible and intangible assets acquired and liabilities assumed based upon their estimated fair values at the acquisition date. The difference between the acquisition price and the fair value of the net assets acquired is recorded as goodwill.
In determining the fair value of assets acquired and liabilities assumed in business combinations and for determining fair values in impairment tests, we use one of the following recognized valuation methods: the income approach (including discounted cash flows), the market approach or the cost approach. Our significant estimates in those fair value measurements include identifying business factors such as size, growth, profitability, risk and return on investment and assessing comparable revenue and earnings multiples. Further, when measuring fair value based on discounted cash flows, we make assumptions about risk adjusted discount rates, future price levels, rates of increase in revenue,
88
cost of revenue and operating expenses, weighted average cost of capital, rates of long term growth and income tax rates. Valuations are performed by management or third party valuation specialists under management's supervision, where appropriate. We believe that the estimated fair values assigned to the assets acquired and liabilities assumed and for determining fair value in business combinations and impairment tests are based on reasonable assumptions that marketplace participants would use. However, such assumptions are inherently uncertain and actual results could differ from those estimates. Goodwill is allocated to our reporting units at the date the goodwill is initially recorded. Once goodwill has been allocated to the reporting units, it no longer retains its identification with a particular acquisition and becomes identified with the reporting unit in its entirety. Accordingly, the fair value of the reporting unit as a whole is available to support the recoverability of its goodwill.
We evaluate goodwill for impairment annually on October 1 or more frequently when an event occurs or circumstances change that indicates the carrying value may not be recoverable. We have the option to assess goodwill for impairment by first performing a qualitative assessment to determine whether it is more-likely-than-not that the fair value of a reporting unit is less than its carrying amount. If we determine that it is not more-likely-than-not that the fair value of a reporting unit is less than its carrying amount, then the two-step goodwill impairment test is not required to be performed. If we determine that it is more-likely-than-not that the fair value of a reporting unit is less than its carrying amount, or if we do not elect the option to perform an initial qualitative assessment, we perform the two-step goodwill impairment test. In the first step, the fair value of the reporting unit is compared to its book value including goodwill. If the fair value of the reporting unit is in excess of its book value, the related goodwill is not impaired and no further analysis is necessary. If the fair value of the reporting unit is less than its book value, there is an indication of potential impairment and a second step is performed. When required, the second step of testing involves calculating the implied fair value of goodwill for the reporting unit. The implied fair value of goodwill is determined in the same manner as goodwill recognized in a business combination, which is the excess of the fair value of the reporting unit determined in step one over the fair value of its net assets and identifiable intangible assets as if the reporting unit had been acquired. If the carrying value of the reporting unit's goodwill exceeds the implied fair value of that goodwill, an impairment loss is recognized in an amount equal to that excess. For reporting units with a negative book value (i.e., excess of liabilities over assets), we evaluate qualitative factors to determine whether it is necessary to perform the second step of the goodwill impairment test. As of June 30, 2015, the goodwill on our balance sheet was $73.8 million.
Long-lived assets, such as property, equipment and software, and intangible assets, are reviewed for impairment whenever events or changes in circumstances indicate that the carrying amount of an asset or asset group may not be recoverable. Plant, equipment, and leasehold improvements are recorded at cost. Accumulated depreciation is computed using the straight-line method over the lesser of the estimated useful life of the related assets (generally 3 to 10 years for equipment, furniture, and leasehold improvements) or, when applicable, the lease term. Maintenance and repairs that do not extend the useful life of the respective assets are charged to expense as incurred. If circumstances require that a long-lived asset or asset group be tested for possible impairment, we first compare the undiscounted cash flows expected to be generated by that long-lived asset or asset group to its carrying amount. If the carrying amount of the long-lived asset or asset group is not recoverable on an undiscounted cash flow basis, impairment is recognized to the extent that the carrying amount exceeds its fair value.
Future changes in our assumptions or the interrelationship of those assumptions may negatively impact future valuations. In future measurements of fair value, adverse changes in assumptions could result in an impairment of goodwill or long-lived assets that would require a non-cash charge to the consolidated statements of operations and may have a material effect on our financial condition and operating results.
89
Inventory Valuation
Raw materials, work-in-process and finished goods inventories are valued at the lower of cost or market, with cost determined using a weighted average method. Cost is calculated based upon the price paid for an item at the time it is received by us, and also includes the capitalization of labor, overhead and other expenses in the case of work-in-process and finished goods inventory. This net inventory cost is recognized through cost of sales when the inventory is sold. It is impractical for us to assign specific allocated overhead costs to individual units of inventory. As such, to match net inventory costs against the related revenues, we estimate the net inventory costs to be deferred and recognized each period as the inventory is sold. Also, we must exercise significant judgment in the case of work-in-process inventory to allocate the appropriate costs to this unfinished product.
Phantom Stock Plan
We maintain the CPI Acquisition, Inc. Phantom Stock Plan, a deferred compensation plan that provides incentive compensation to certain key employees based on the value of our preferred stock. Under the terms of the plan agreement, holders of an award are entitled to a cash payment upon redemption equal to the increase in value of phantom units in CPI Acquisition, Inc. above a certain base amount. All awards vest on the defined Redemption Date or earlier fixed date pursuant to each award agreement. The Redemption Date is defined as the earlier of a Change-in-Control or seven years from grant. Unvested awards expire upon the participant's termination of service. Total authorized units under the plan are 100,000. At June 30, 2015, there were 81,156 units issued and outstanding under the terms of the plan, of which 13,088 were fully vested. As these awards must be settled in cash, we account for them as liabilities. As a non-public company, we have elected to measure the liability at intrinsic value, with changes in the intrinsic value of the liability recognized as expense each year in the consolidated statements of operations and comprehensive income (loss). There was $1.5 million, $4.5 million and $0.6 million of compensation expense recognized for the six months ended June 30, 2015 and the years ended December 31, 2014 and December 31, 2013, respectively, related to this plan. Upon the filing of the registration statement, there will be a change in accounting policy in subsequent periods and vested units will be recorded at fair value, with the change in value recognized as expense in the consolidated statements of operations and comprehensive income (loss).
Because prior to this offering we have been privately held and there was no public market for our Preferred Stock, which is a key determinant of the value of the awards under the phantom stock plan, we were required to exercise significant judgment in valuing the awards under this plan. The fair value of our equity was historically estimated by our management and approved by our board. In estimating the fair value of our preferred stock, management and the board considered factors it believed were material to the valuation process including our actual and projected financial results, the principal amount of our indebtedness, net of cash, and the trading multiples of comparable companies. In connection with the offering, we intend to terminate this phantom stock plan and satisfy all liabilities due under the plan.
Stock Option Plan
We maintain the 2007 Stock Option Plan under which stock options have been granted to employees. We recognize compensation expense for option awards based on the fair value of the award on a straight-line basis over the vesting period of the award based on the estimated portion of the award that is expected to vest. The fair value of the award is based on the valuation of our common stock on the date of grant. We include the expense in selling, general and administrative expenses in our consolidated statement of operations and comprehensive income. Because prior to this offering, there was no public market for our common stock, we were required to exercise significant judgment in valuing the fair value of the awards under this plan. The fair value of our equity was historically estimated by our management and approved by our board. In estimating the fair value of our common
90
stock, management and the board considered factors it believed were material to the valuation process including the process, rights, preferences and privileges of our preferred stock relative to the common stock, our actual and projected financial results, current business conditions and projections, the principal amount of our indebtedness, net of cash and the trading multiples of comparable companies.
Income Taxes
We record income tax expense using the liability method for taxes and are subject to income tax in many jurisdictions, including the United States, various states and localities, the United Kingdom, and Canada. A current tax asset or liability is recognized for the estimated taxes refundable or payable on the tax returns for the current year and a deferred tax asset or liability is recognized for the estimated future tax effects attributable to temporary differences and carryforwards. Deferred tax assets and liabilities are measured using enacted income tax rates expected to apply to taxable income in the years in which those temporary differences are expected to be recovered or settled. The effect of a change in tax rates is recognized as income or expense in the period that includes the enactment date. A valuation allowance is recorded to reduce the carrying amounts of deferred tax assets unless it is more likely than not that such assets will be realized. In evaluating our ability to realize our deferred tax asset, we considered the following sources of future taxable income:
- •
- future reversals of existing taxable temporary differences;
- •
- future taxable income, exclusive of reversing temporary differences and carryforwards;
- •
- taxable income in prior carryback years; and
- •
- tax-planning strategies.
Our evaluation regarding whether a valuation allowance is required or should be adjusted also considers, among other things, the nature, frequency and severity of recent losses, forecasts of future profitability and the duration of statutory carryforward periods. Our forecast of future profitability represents our best estimate of these future events. After conducting this assessment, the valuation allowance recorded, net of federal benefit, against our deferred tax assets was $4.1 million, $4.1 million and $4.8 million as of June 30, 2015, December 31, 2014 and December 31, 2013, respectively. If actual results differ from estimated results, or if we adjust these assumptions in the future, we may need to adjust our deferred tax assets or liabilities, which could impact our effective tax rate.
The amount of income taxes we pay could be subject to possible audits in the taxing jurisdictions in which we operate. In the event of these possible audits, the taxing authorities might challenge items on our tax returns. Because the tax matters challenged by tax authorities are typically complex, the ultimate outcome of these challenges is uncertain. We recognize tax benefits for uncertain positions only to the extent that we believe it is more likely than not that the tax position will be sustained. Our future results may include favorable or unfavorable adjustments to our unrecognized tax benefits due to closure of income tax audits, new regulatory or judicial pronouncements, or other relevant events. As a result, our effective tax rate may fluctuate significantly on a quarterly and annual basis.
Internal Control Over Financial Reporting
Assessing our staffing and training procedures to improve our internal control over financial reporting is an ongoing process. We are not currently required to comply with Section 404 of the Sarbanes-Oxley Act, and are therefore not required to make a formal assessment of the effectiveness of our internal control over financial reporting. As a result, our management did not perform an evaluation of our internal control over financial reporting as of December 31, 2014. Further, our independent registered public accounting firm has not been engaged to express, nor have they expressed, an opinion on the effectiveness of our internal control over financial reporting. However, we recently identified a material weakness related to a lack of finance expertise that could result in a failure to properly account for non-routine and complex transactions. With the oversight of senior
91
management, we are taking steps to remediate the underlying causes of this material weakness, primarily through the hiring of additional finance personnel, as well as the development and implementation of formal policies and improved processes. Although we plan to address this material weakness as promptly as possible, we cannot estimate when the remediation process will be completed. See "Risk Factors—Risks Related to Our Business—We have identified a material weakness in our internal controls over financial reporting. If we are unable to implement and maintain effective internal controls over financial reporting in the future, investors may lose confidence in the accuracy and completeness of our financial reports and the market price of our common stock may be negatively affected."
For the year ending December 31, 2016, pursuant to Section 404 of the Sarbanes-Oxley Act, management will be required to deliver a report that assesses the effectiveness of our internal control over financial reporting. Under current SEC rules, our independent registered public accounting firm will eventually be required to deliver an attestation report on the effectiveness of our internal control over financial reporting when we no longer qualify as an emerging growth company. We may qualify as an emerging growth company for as long as five years, although we may lose that status under certain circumstances. See "Risk Factors—Risks Related to Our Business—We are an "emerging growth company" and we cannot be certain if the reduced disclosure and other requirements applicable to emerging growth companies will make our common stock less attractive to investors."
Quantitative and Qualitative Disclosures about Market Risk
Key Input Price Risks
Our profitability is dependent on, among other things, our ability to anticipate and react to changes in the costs of key operating resources, including EMV microchips, polyvinyl chloride ("PVC"), energy and other commodities. We have been able to offset cost increases, which have historically not been significant, by increasing our selling prices, as well as, making other operational adjustments that increase productivity. However, substantial increases in costs and expenses could impact our operating results to the extent that such increases cannot be offset by selling price increases.
Labor and Benefits Costs
We are exposed to inflation in wage and benefits costs which represented 31.6% of net sales for the year ended December 31, 2014. Due to the high-security nature of our business, the availability of potential applicants is limited by the security and other requirements of the Payment Card Brands and applicants are required to undergo a rigorous background screening process. Due to these factors, we have historically provided a starting wage that is above the minimum wage in place for the particular states or provinces in which we do business to attract qualified applicants. We further believe that this enables us to attract a higher caliber employee and this translates directly to higher quality and productivity. There can be no assurance that we will generate sales growth in an amount sufficient to offset increases in minimum wage or other inflationary pressures.
Interest Rate Risk
We are exposed to interest rate risk through fluctuations in interest rates on our Term Loan obligations. Our New Revolving Credit Facility and New Term Loan Facility carry interest at a floating rate. We seek to manage exposure to adverse interest rate changes through our normal operating and financing activities. As of August 17, 2015, we had $435.0 million in outstanding floating rate debt obligations under our New Term Loan Facility. Each quarter point increase or decrease in the interest rate on our New Term Loan Facility would change our annual interest expense by approximately $1.1 million. If our New Revolving Credit Facility was fully-drawn, each quarter point increase or decrease in the interest rate on our New Revolving Credit Facility would change our annual interest expense by approximately $0.1 million.
92
Foreign Currency Exchange Risk
We are not currently subject to significant foreign currency exchange risk. While we have foreign currency risks related to our revenue and operating expenses denominated in currencies other than the U.S. dollar, primarily the British Pound Sterling and the Canadian Dollar, historically we have not been impacted materially by the changes in exchange rates. We have experienced and will continue to experience fluctuations in our consolidated statement of operations as a result of transaction gains or losses related to revaluing certain current asset and current liability balances that are denominated in currencies other than the functional currency of the entities in which they are recorded. Risk can be estimated by measuring the impact of a near-term adverse movement of 10% in foreign currency rates against the U.S. Dollar. If foreign currency exchange rates were 10% higher or lower at December 31, 2014, there would not have been a material adverse impact on our net income from continuing operations or financial position.
Pricing Risk
While we have been able to partially offset historical pricing pressure and other changes in the price of our products and services by offering higher-value added products and services, cross-selling additional products and services, selectively implementing pricing increases, coupled with more efficient purchasing practices, productivity improvements and greater economies of scale, there can be no assurance that we will be able to continue to do so in the future. From time to time, competitive conditions could limit our pricing flexibility and macroeconomic conditions could increase pricing pressure. There can be no assurance that future pricing pressure can be offset by our ability to reduce our costs. In addition, there can be no assurance that we will generate sales growth in an amount sufficient to offset pricing pressures.
Recent Accounting Pronouncements
The FASB issued ASU 2014-09, Revenue from Contracts with Customers, in May 2014. ASU 2014-09 requires an entity to recognize revenue to depict the transfer of promised goods or services to customers in an amount that reflects the consideration to which the entity expects to be entitled in exchange for those goods or services. An entity should also disclose sufficient quantitative and qualitative information to enable users of financial statements to understand the nature, amount, timing and uncertainty of revenue and cash flows arising from contracts with customers. The new standard is effective for annual reporting periods beginning after December 15, 2017. We will implement the provisions of ASU 2014-09 as of January 1, 2018. We are in the process of determining the method of adoption and assessing the impact of ASU 2014-09 on our results of operations, financial position and consolidated financial statements.
The FASB issued ASU 2015-03, Interest—Imputation of Interest, in April 2015. ASU 2015-03 requires debt issuance costs related to a recognized debt liability to be presented on the balance sheet as a direct deduction from the debt liability, similar to the presentation of debt discounts. The new standard is effective for public entities annual reporting periods beginning after December 15, 2015. We will implement the provisions of ASU 2015-03 as of January 1, 2016. The adoption of ASU 2015-03 will require us to reclassify deferred loan costs as a direct deduction from the carrying amount of debt on our balance sheet. We do not expect any material impact to our balance sheet from this change.
The FASB issued ASU 2015-11, Inventory—Simplifying the Measurement of Inventory, in July 2015. ASU 2015-11 requires that inventory be at the lower of cost and net realizable value. Net realizable value is the estimated selling prices in the ordinary course of business, less reasonably predictable cost of completion, disposal, and transportation. The new standard is effective for public business entities for fiscal years beginning after December 15, 2016. We will implement the provisions of ASU 2015-11 as of January 1, 2017. We are in the process of assessing the impact of ASU 2015-11 on our results of operations, financial position and consolidated financial statements.
93
Overview
Consumer payments in the United States and globally have shifted over the last several decades from paper-based media such as cash and checks to card-based media such as credit, debit and Prepaid Debit Cards, and electronic methods such as pre-authorized payments through ACH. The Nilson Report estimates that card-based payments have increased from 38.3% of U.S. transactions in 2005 to 56.5% in 2013, and electronic payments have increased from 4.3% to 7.2% over the same period. By 2018, card-based payments are projected to comprise 69.2% of U.S. transactions, with cash and checks accounting for 21.4% and electronic payments representing the remaining 9.4%. We believe that this long-term trend of card-based and electronic payments replacing cash and checks will continue.
Financial Payment Card Production and Service
Our primary market is production of and services for Financial Payment Cards, which are cards issued on the networks of the Payment Card Brands (Visa, MasterCard, American Express and Discover) and Interac (in Canada), that require high levels of security throughout the card production and issuance process. According to First Annapolis, 976 million Financial Payment Cards were produced for the U.S. market in 2014 and this number is estimated to grow to 1.2 billion cards by 2019, representing a CAGR of 4.3%. The primary driver of growth is predicted to be an increasing adoption of Prepaid Debit Cards, along with anticipated steady growth in debit and credit cards. On a dollar basis, the U.S. Financial Payment Card market (excluding services) was $371 million in 2014 (up from $180 million in 2013), and is anticipated to grow to $1.2 billion by 2019, driven by the EMV conversion and unit volume growth.
| Annual U.S. Financial Payment Card Production | (number of cards in millions) |
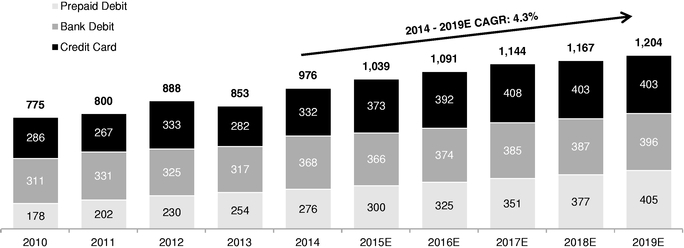
Source: First Annapolis
According to First Annapolis, the demand for bank debit and general purpose credit cards has been predictable and recurring in nature, with 88% of cards issued in the United States in 2014 directly replacing existing cards. This includes:
- •
- regular renewal of cards, which generally occurs every three to five years due to fixed expiration dates (53% of 2014 issuances);
- •
- cards lost, stolen or replaced due to fraudulent usage (19%); and
- •
- portfolio churn, which is when cardholders move from one card program to another (16%).
94
The remaining demand for general purpose credit and bank debit cards is the issuance of cards in conjunction with net new account growth (12%). The issuance of Prepaid Debit Cards has represented a similarly predictable and recurring source of demand, as a majority of Prepaid Debit Cards have an average estimated card life of less than twelve months.
We estimate that bank debit and general purpose credit cards historically have been replaced on average every three years. First Annapolis estimates that certain issuers of bank debit cards and general purpose credit cards may extend the expiration dates on their cards which may be due, in part, to the higher cost of EMV cards. This longer card expiration cycle would result in lower demand for bank debit cards and general purpose credit cards in the United States, and First Annapolis has taken this into consideration in estimating the growth rates of these markets.
Our market can be divided as follows: bank debit cards, general purpose credit cards and Prepaid Debit Cards.
Bank debit cards
Bank debit cards generally are issued by financial institutions to their customers as a convenient way to access funds under the custody of the issuer. Bank debit cards are issued on the networks of the Payment Card Brands and Interac (in Canada) or similar debit networks and are usable anywhere on the card network to withdraw cash from ATMs or pay merchants for goods and services. There are over 10,000 banks, credit unions and other organizations that issue such cards in the United States.
First Annapolis estimates that the market for bank debit card production for the U.S. will grow from 368 million cards in 2014 to 396 million cards by 2019, which represents a compounded annual growth rate of 1.5% over this period. First Annapolis believes the primary drivers of demand in this market over this period will be the automatic renewal of cards at expiration (59% of annual issuance), portfolio churn (21%), cards lost, stolen or replaced due to fraudulent usage (15%) and net new account growth (5%). Demand from portfolio churn is generated primarily from cardholders exchanging one card for another, which often occurs due to the competitive nature of the personal banking market, such as banks competing to offer the most attractive card benefits or promotions. Demand from the opening of net new accounts has historically been tied to population and Gross Domestic Product growth. The shift from magnetic stripe cards to EMV cards is expected to reduce card fraud, which currently affects nearly 1% of cards in an issuer's portfolio every month. By 2017 First Annapolis expects that nearly all new bank debit cards issued in the United States will be EMV-enabled, with larger issuers leading the conversion.
General purpose credit cards
General purpose credit cards are issued by financial institutions, as well as certain Payment Card Brands including American Express and Discover. All general purpose credit cards are issued on the networks of the Payment Card Brands and usable anywhere on the card network to pay merchants for goods and services or to withdraw cash from ATMs, as opposed to Private Label Credit Cards, which are not issued on the networks of the Payment Card Brands. There are over 4,800 banks, credit unions, card networks and other organizations that issue such cards in the United States.
First Annapolis estimates that the market for general purpose credit card production for the U.S. market will grow from 332 million cards in 2014 to 403 million cards by 2019, which represents a compounded annual growth rate of 4.0% over this period. The primary drivers of demand in this market over this period are expected to be the automatic renewal of cards at expiration (65% of annual issuance), portfolio churn (12%), cards lost, stolen or replaced due to fraudulent usage (15%) and net new account growth (9%). Demand from portfolio churn is generated primarily from cardholders exchanging one card for another, which often occurs due to the competitive nature of the market for personal credit cards, such as rewards cards that appeal to consumers with specific purchasing habits,
95
balance transfer offers to lower interest rates and changes in co-branded agreements between card networks and large merchants. The opening of net new accounts has historically been tied to population growth and the strength of the consumer credit markets. The shift from magnetic stripe cards to EMV cards is expected to reduce card fraud, which currently affects nearly 1% of cards in an issuers' portfolio every month. By 2017, we expect that nearly all new general purpose credit cards issued in the United States will be EMV-enabled, with larger issuers leading the conversion.
Prepaid debit cards
Prepaid debit cards share many of the functional features and conveniences of traditional bank debit cards; they are issued on the network of a Payment Card Brand and usable in the same manner as a bank debit card. However, these cards are not linked to a traditional bank account, are easier to acquire (they do not require a credit check) and require cardholders to load money onto the card in advance of any transaction. Prepaid Debit Cards are often issued for use as gift cards (in place of a cash or check gift), for payroll purposes (as an alternative to paper payroll checks), or by employers and government agencies for benefits or incentives. Additionally, GPR Cards, which are registered by the cardholder with the issuing bank or licensed money transmitter in order to reload the card's monetary value, have emerged as an important part of the Prepaid Debit Card market, particularly the unbanked and underbanked populations, as well as for low-income and younger consumers. The Federal Deposit Insurance Corporation ("FDIC") estimates that in 2013, 7.7% and 20.0% of U.S. households were classified as unbanked and underbanked, respectively.
As described in the table below, the prepaid debit market can be divided into six segments based on distribution channel, related characteristics and use:
Prepaid Category
|
Distribution Model | Key Distribution Channels | Funding | 2014 - 2019E CAGR |
||||||
|---|---|---|---|---|---|---|---|---|---|---|
General Purpose Reloadable |
Direct to Consumer | · Retail · Check cashing · Tax preparation · Bank branches · Internet |
Reloadable | 16 | % | |||||
Gift |
· Retail |
Single load |
5 |
% |
||||||
Payroll |
Enterprise (B2B) |
· Employers |
Reloadable |
11 |
% |
|||||
Government Disbursement |
· Government agencies |
Reloadable |
5 |
% |
||||||
Incentive |
· B2B |
Usually single load |
5 |
% |
||||||
Employee Benefits |
· Plan administrators |
Reloadable |
19 |
% |
||||||
96
| Annual U.S. Prepaid Debit Card Production | (number of cards in millions) |
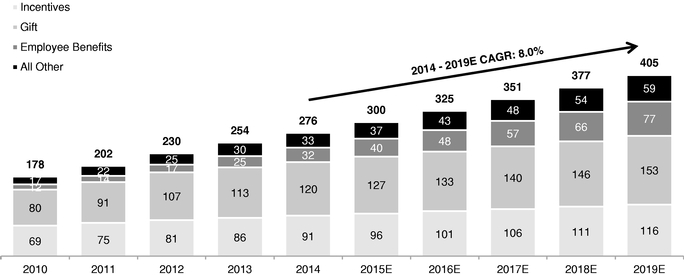
Source: First Annapolis
The Prepaid Debit Card market is expected to experience the highest annual growth rate from 2014-2019 as adoption across Prepaid Debit Card products increases. First Annapolis estimates that the U.S. market for Prepaid Debit Card manufacturing will grow from 276 million cards in 2014 to 405 million cards by 2019, which represents a CAGR of 8.0% over this period. Unlike other Financial Payment Card subsets where many cards are replaced at expiration (generally three to five year cycles), Prepaid Debit Cards generally have shorter use periods, with many cards discarded when the funds have been depleted, specifically single load cards, which composed approximately two thirds of the prepaid market in 2014. Growth in this subset is driven by new card issuance as consumers increase adoption and additional financial institutions introduce new products. Consumers increasingly have adopted Prepaid Debit Cards and, according to the Federal Reserve, spent approximately $100 billion on open-loop cards in 2012, up from $40 billion in 2009, which represents a 36% CAGR over the period. New entrants to the prepaid market, particularly large bank debit and credit card issuers such as JPMorgan Chase and American Express, have driven further adoption in GPR Cards, particularly by consumers that also use traditional bank services. We believe that certain subsets of Prepaid Debit Cards, particularly cards that are reloadable, including government disbursement, payroll, employee benefits, and many GPR cards, will be substantially converted to the EMV standard by 2017.
Private Label Credit Card Production
Private Label Credit Cards are credit cards that an individual merchant issues for exclusive use in its own stores. They are generally not issued on the network of a Payment Card Brand. While Private Label Credit Cards are not our primary market, we believe they represent another possible growth opportunity, as issuers of these cards are increasingly demanding the high levels of security and certification prevalent in the market for Financial Payment Cards, and certain merchants have already begun implementing EMV-enabled cards for their captive card programs following high profile data breaches.
First Annapolis estimates that the market for Private Label Credit Card production in the U.S. will grow from 174 million cards in 2014 to 220 million cards by 2019, which represents a compounded annual growth rate of 4.8% over this period. The following table sets forth the estimated number of
97
Private Label Credit Cards produced in the United States on a unit basis annually for the periods specified:
| |
2014 | 2015E | 2016E | 2017E | 2018E | 2019E | |||||||||||||
|---|---|---|---|---|---|---|---|---|---|---|---|---|---|---|---|---|---|---|---|
Private Label Credit Card Production (number of cards in millions) |
174 | 209 | 214 | 217 | 226 | 220 | |||||||||||||
Source: First Annapolis
The primary drivers of demand in this market over this period are expected to be automatic renewal of cards at expiration (68% of annual issuance), portfolio churn (21%), cards lost, stolen or replaced due to fraudulent usage (4%) and net new account growth (7%). We believe that growth in this market is sensitive to economic conditions, and account growth is primarily tied to the strength of the consumer credit markets. Private Label Credit Cards experience lower instances of fraud than bank debit and general purpose credit cards as they are less attractive targets for fraud given their limited acceptance. We believe that Private Label Credit Cards will convert to EMV cards at a slower rate than bank debit and general purpose credit cards, but will ultimately convert to avoid negative consumer perceptions and to fit into the issuing merchant's payment terminal strategy.
Card Data Personalization and Card Services
According to First Annapolis, outsourced card data personalization services for Financial Payment Cards represented a $417 million market in the United States in 2014 and is estimated to grow to $604 million by 2019, representing a 7.7% CAGR. The process of personalization involves assigning unique identification numbers and encrypting authentication data (such as a cardholder's account number, name and other data) onto cards, embossing and encoding personal information onto the cards and distributing PINs and fully packaged cards to individual cardholders. We believe the value of the market for personalization services will grow over the next several years due to the growth of overall cards in circulation and the U.S. EMV conversion, which is expected to increase revenues for service providers as personalizing EMV cards incorporates higher value added services than the process for non-EMV cards.
Instant Card Issuance Systems and Services
Instant card issuance refers to card issuing banks providing their customers with a new debit card, issued on the network of one of the Payment Card Brands, within the bank branch upon demand. When a debit card is "instantly issued", it is personalized within the bank branch and handed to the customer on the spot. This debit card can be issued in connection with the cardholder opening a new deposit account or to replace a card that has been lost or stolen. Instant card issuance has emerged primarily as a method for card issuing banks to provide an enhanced level of service to their cardholders. Additionally, instant card issuance allows card issuing banks to immediately begin capturing interchange revenue as the cardholder does not have to wait for the new card to be sent in the mail. Finally, instant issuance eliminates the problem of cardholders not activating their cards, a persistent challenge for card issuers, as the cards are automatically activated when they are delivered through the instant issuance model.
Instant issuance can be facilitated by either temporary cards, or systems and solutions that can be used to issue permanent cards. Temporary cards have a short expiration, are generally only intended for use until a permanent card is fulfilled through a central issuance process and are personalized only to the extent needed to link the physical card to the cardholder's account (i.e., are not embossed with a cardholder's name). Permanent instant issuance systems and solutions also enable the immediate use of cards, but offer a superior customer experience by providing a permanent, fully-personalized card that
98
is encoded and embossed on a desktop terminal in a bank branch. Permanent instant issued cards look similar to and carry the same length of expiration as a centrally issued card. This permanent card avoids the confusion of having to replace a temporary card at a later date and any related complications of using a temporary card (e.g., without a cardholder name POS security verification is not possible).
The Aite Group, an advisory firm to the financial services industry, estimates that in 2014, approximately 14,000 bank branches have deployed instant issuance systems, with this number expected to grow to over 37,000 by 2018, which represents a 27.7% CAGR. This growth is driven primarily by the growing number of financial institutions adopting this product offering and the ability to offer permanent Financial Payment Cards, including EMV cards, through instant issuance.
EMV Conversion in the United States
The EMV standard for Financial Payment Cards, which is named after Europay, MasterCard and Visa, is a technologically advanced high security protocol that features a Financial Payment Card with an embedded microprocessor, commonly known as a "chip card." Depending on the features desired by the issuer, EMV cards may sell for 5 to 10 times the average selling price of the magnetic stripe cards they are replacing. We estimate based on our experience that the industry-wide average selling prices per card, exclusive of services, are approximately as follows: magnetic stripe—$0.20 per card; Contact EMV—$1.00 per card; and Dual-Interface EMV—$2.00 per card. Actual per card pricing will vary significantly depending on issuer size, order size, card features, finishes, and EMV chip features selected by the issuer. According to First Annapolis, the conversion of U.S. Financial Payment Cards to the EMV standard is expected to increase the size (measured in dollars) of the Financial Payment Card market (excluding services) by more than three-fold to $1.2 billion by 2019 and $1.3 billion inclusive of Private Label Credit Cards.
| Annual U.S. Financial Payment Card & Private Label Credit Card Market Size | ($ in millions) |
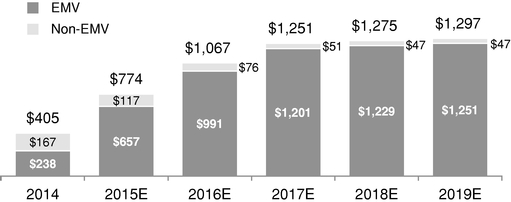
Source: First Annapolis
The conversion of U.S. Financial Payment Cards from magnetic stripe technology to the EMV standard began in earnest in the second half of 2014 and is expected to continue over the next several years, with full adoption in the credit and traditional debit card markets largely complete by 2017 and increasing levels of adoption of Prepaid Debit Cards and Private Label Credit Cards beyond 2017. EMVCo, an industry organization overseen by six financial institutions, estimates that at the end of 2014, only 7.3% of Financial Payment Cards in circulation in the United States were EMV-enabled. The following table sets forth the estimated mix of EMV and non-EMV Financial Payment Cards and
99
Private Label Credit Cards produced in the United States on a unit basis annually for the periods specified:
| |
2013 | 2014 | 2015E | 2016E | 2017E | 2018E | 2019E | |||||||||||||||
|---|---|---|---|---|---|---|---|---|---|---|---|---|---|---|---|---|---|---|---|---|---|---|
EMV Cards |
2 | % | 17 | % | 42 | % | 59 | % | 69 | % | 70 | % | 71 | % | ||||||||
Non-EMV Cards |
98 | % | 83 | % | 58 | % | 41 | % | 31 | % | 30 | % | 29 | % | ||||||||
Source: First Annapolis
A number of factors have precipitated the ongoing conversion of Financial Payment Cards in the United States to the EMV standard:
The Liability Shift
In August 2011, Visa announced a plan for the U.S. market to adopt the EMV standard for security on credit and debit cards. A key feature of Visa's announcement, which later became a coordinated effort among all of the Payment Card Brands, was a card fraud liability shift effective October 1, 2015. After the October 1, 2015 deadline, the party that caused a non-EMV transaction to occur (i.e., either the non-EMV card issuer or the merchant that does not have an EMV compatible POS system) will be the one held financially liable for any resulting counterfeit fraud losses.
Escalating U.S. Card Fraud
According to The Nilson Report, the United States represents about one half of global Financial Payment Card and Private Label Credit Card fraudulent transactions (more than $5.3 billion annually), despite accounting for only about one quarter of total card transactions. While a number of factors contribute to this imbalance, we believe counterfeit card fraud has migrated to countries that have lower EMV adoption rates such as the United States, which is the last of the G-20 nations to begin to transition Financial Payment Cards from magnetic stripe technology to the more secure EMV standard.
Enhanced Security
EMV cards feature an embedded microprocessor that, when paired with an EMV payment terminal, dynamically authenticates cardholder debit and credit card transactions using a cryptographic process that results in a significantly more secure payment transaction environment. Card fraud and, in particular, Card-Present Fraud, has declined significantly in nations that have adopted the EMV standard. For example, in the U.K., counterfeit card fraud has been reported to have dropped 75% from its peak in 2008 to 2013, according to Financial Fraud Action UK, with other countries experiencing similar levels of fraud reduction following EMV adoption.
High-Profile Data Breaches
In the last few years, a number of large U.S. merchants, such as Target and Home Depot, and banks have reported major customer or client data breaches and other fraudulent activities, which have heightened awareness of data security and increased demand for higher security solutions in payments systems, including accelerating the adoption of EMV. As a result, combating such data breaches and card fraud has become a board of director level issue among many of the nation's largest merchants, card issuers and Payment Card Brands and has garnered significant attention from the U.S. Government. For example, Congress held hearings regarding financial data privacy in response to the Target and similar breaches and in January 2014, U.S. Senator Al Franken (Chairman of the Senate Judiciary Subcommittee on Privacy, Technology and the Law) requested that major issuers of Financial Payment Cards (Bank of America, Capital One, Citigroup, JPMorgan Chase and Wells Fargo), as well as the Payment Card Brands submit in writing their EMV conversion plans and timing. President
100
Obama signed an executive order in October 2014 directing that all Financial Payment Cards issued by or on the behalf of the U.S. Government be EMV-enabled.
Desire for Global Interoperability of the Acceptance Network
EMV is increasingly becoming the global standard for Financial Payment Cards outside the United States. The coordinated efforts of the Payment Card Brands to implement the liability shift in the United States reflect, in part, their desire to standardize payment systems technology globally to ensure cardholders' cards will be accepted by merchants anywhere on their global network and to provide a predictable and consistent experience for the cardholder. EMVCo, an industry group overseen by the Payment Card Brands, estimates that in Europe Zone I (which represents the Single Euro Payments Area, or "SEPA") 96.6% of the card present transactions processed in the twelve months ended December 31, 2014 were completed on both EMV-enabled cards and terminals. Over the same period, EMVCo estimates that 85.4% of transactions processed in the Americas (excluding the United States) were EMV enabled and only 0.12% of U.S. transactions were EMV-enabled.
EMV cards issued in the United States to date primarily have been Contact EMV cards. Globally, Dual-Interface EMV cards, which also enable contactless payment, are gaining popularity among card issuers, primarily because of the speed and convenience they offer to cardholders. For example, in Canada, we believe that the majority of all credit cards currently being issued are Dual-Interface EMV cards. Dual-Interface EMV cards are more complex to produce than Contact EMV cards and typically sell at a significantly higher price point. We believe that as the U.S. market migrates to the EMV standard, Dual-Interface EMV cards issued in the United States will gain share relative to Contact EMV cards, further expanding the dollar value of our market opportunity.
Mobile Payments
A trend in the financial technology industry over the past decade has been the emergence of mobile payment solutions enabled on smart phones. While mobile payment products have been around for some time, they gained more visibility in recent years beginning with Starbucks' launch of its popular captive mobile payments application in 2011. In the same year Google introduced Google Wallet, usable on NFC-enabled terminals accepting MasterCard and Visa, and these mobile payment products gained further visibility in 2013 with the release of Softcard, developed as a joint venture between AT&T, T-Mobile and Verizon. Today, a broad array of organizations has developed varying and competing mobile payment technologies, leading to a fragmented landscape. Apple Pay, introduced by Apple into the United States in October of 2014, utilizes an iPhone's NFC technology to wirelessly transmit a user's secure transaction information to a POS terminal. Merchant Customer Exchange, a consortium of U.S. merchants such as CVS and Walmart, developed CurrentC, a mobile offering which utilizes a Quick Response code on the consumer's mobile phone that can be scanned by a merchant's bar code reader. LoopPay, which was acquired by Samsung in February of 2015 and subsequently rebranded as Samsung Pay, employs Magnetic Secure Transmission technology, which generates changing magnetic fields in a user's mobile phone that can be read by a magnetic stripe reader and, to date, is not EMV compliant.
History has shown that change in payment technology often takes decades to occur. The concept of a general purpose credit card was first introduced by Diner's Club in 1950. The adoption of these cards has occurred in a steady manner over time; according to the Federal Reserve, bank-issued general purpose credit cards increased from 16% adoption in 1970 to 68% in 1998. According to The Nilson Report, cards represented 38.3% of total transactions in 2005 and continued to rise to 56.5% of total transactions in 2013. Additionally, the adoption of technology within this card-based ecosystem has been slow. Magnetic stripe technology was first introduced in the 1970's, yet most cards in circulation today still have embossed numbering, for the occasional occurrences where a merchant still utilizes the original card acceptance method, taking a mechanical imprint of the card. Conversion to EMV remains
101
in its infancy in the United States, despite the fact that the technology has been available for over 20 years and is already broadly utilized in other developed regions across the world.
We believe that mobile payments will serve a complementary role in the payments ecosystem, coexisting with Financial Payment Cards. We believe mobile payments will be a particularly relevant payment option for making low-price, high-frequency transactions, such as at quick-service restaurants or vending machines. However, we believe card based payment will still be the primary form of payment utilized given its convenience, ubiquitous acceptance, reliability and security. In order for issuers to discontinue issuing cards, we believe they would need assurance that consumers could utilize mobile payment solutions in a ubiquitous fashion (i.e., able to make mobile payments at all merchants at all times) and consumers must be willing to shift exclusively to mobile payments. Given the absence of uniform technologies and standards as well as user concerns with respect to the ease, benefit, security and technology of exclusive mobile payments, we do not believe such ubiquity is obtainable in the foreseeable future. Even upon broader adoption, simple technical issues, such as a mobile phone's battery limitations, will require issuers to provide cards to consumers as another option, much like the embossed lettering on cards provided today.
102
Overview
We are a leading provider of comprehensive Financial Payment Card solutions in North America. We define Financial Payment Cards as credit, debit and Prepaid Debit Cards issued on the networks of the Payment Card Brands (Visa, MasterCard, American Express and Discover) and Interac (in Canada). In 2014, we produced over 360 million Financial Payment Cards, provided integrated card services to over 3,200 card-issuing banks and Prepaid Debit Card issuers and personalized more than 130 million Financial Payment Cards. We have established a leading position in the Financial Payment Card market through more than 20 years of experience and are focused primarily on this growing subsector of the financial technology market. Our customers are primarily leading national and regional banks, independent community banks, credit unions, managers of prepaid debit programs, Group Service Providers and card processors. We serve a diverse set of over 4,000 direct and indirect customers, including many of the largest North American issuers of debit and credit cards such as JPMorgan Chase, Bank of America, American Express and Wells Fargo, the largest global managers of Prepaid Debit Card programs, including InComm, Green Dot, Blackhawk Network and American Express, as well as thousands of independent community banks, credit unions, Group Service Providers and card processors.
We serve our customers through a network of nine production and card services facilities, including seven high-security facilities in North America that are each certified by one or more of the Payment Card Brands and Interac (in Canada) and, where required by our customers, the PCI Security Standards Council. We have the largest such network of high-security production facilities in North America, allowing us to optimize our solutions offerings to serve the needs of our diverse and long-term customer base.
We estimate that we produce approximately 35% of all Financial Payment Cards in the United States, which we believe gives us the #1 market position by unit volume. We believe we have:
- •
- the #1 position in the U.S. prepaid debit market (which represents the fastest growing subset of the Financial Payment Card market in
the United States), serving the top five U.S. Prepaid Debit Card program managers;
- •
- a leading position in the U.S. large issuer market, serving the majority of the top 20 U.S. debit and credit card issuers; and
- •
- the #1 position in the highly attractive U.S. small issuer market, which includes independent community banks and credit unions, driven by our strong relationships, capabilities and technologies.
We have grown our business significantly over the past decade, both organically and through acquisitions. Over that time period, we have completed six acquisitions, significantly increasing our geographic and market coverage, solutions offerings and capacity. On March 9, 2010, we purchased certain assets of Premier Card Solutions, a leading provider of Financial Payment Cards, data personalization services and tamper-evident security packaging for Prepaid Debit Cards that utilize the payment networks of the Payment Card Brands. The Premier Card Solutions transaction significantly enhanced our offering to Prepaid Debit Card customers. On September 2, 2014, we acquired EFT Source, a recognized leader in the financial technology industry that was named to American Banker and BAI's FinTech Forward 100 in both 2013 and 2014. The acquisition of EFT Source significantly enhanced our card services offering, added Card@Once® to our instant issuance card offering and expanded our end-to-end Financial Payment Card solutions.
103
In addition to our seven North American facilities, we have two facilities in the United Kingdom that produce retail cards, such as gift and loyalty cards that are not issued on the networks of the Payment Card Brands, and personalization services.
For the LTM Period, we generated net sales of $338.1 million, net income from continuing operations of $30.5 million and Adjusted EBITDA of $81.5 million, representing net income from continuing operations and Adjusted EBITDA margins of 9.0% and 24.1%, respectively. For the year ended December 31, 2014, we generated $261.0 million of net sales, which represented an increase of 32.9% as compared to the prior year, $16.0 million of net income from continuing operations, which represented an increase of 42.6% as compared to the prior year, and $54.2 million of Adjusted EBITDA, which represented an increase of 41.3% as compared to the prior year and net income from continuing operations and Adjusted EBITDA margins of 6.1% and 20.8%, respectively. Our 2014 and LTM results include four and ten months of results from EFT Source, respectively. Adjusted EBITDA and Adjusted EBITDA margin are financial measures not presented in accordance with generally accepted accounting principles ("GAAP"). For a definition of Adjusted EBITDA and a reconciliation of Adjusted EBITDA to net income from continuing operations, the most comparable GAAP measure, see "Summary Consolidated Historical Financial Data."
Our Competitive Strengths
- •
- Leading Market Position with Long-Term Customer Relationships. We estimate that we produce approximately 35% of all Financial Payment Cards in the United States, which we believe gives us the #1 market position by unit volume. We are a trusted partner across the markets we serve, and believe we have the #1 position in the U.S. Prepaid Debit Card market (which represents the fastest growing subset of the Financial Payment Card market in the United States), serving the top five U.S. Prepaid Debit Card program managers, a leading position in the U.S. large issuer market, serving the majority of the top 20 U.S. debit and credit card issuers, and the #1 position in the highly attractive U.S. small issuer market, which includes independent community banks and credit unions, driven by our strong relationships, capabilities and technologies. As a market leader, CPI has long-standing trust-based relationships with our key customers and often deep process and technology integration, particularly in the case of customers who utilize our card services and instant issuance systems and services. The solutions that we provide require strict data integrity, and generally card issuers are reluctant to switch away from trusted providers due to the requirements for high-security and access to highly-sensitive cardholder information. As a result, our customers are selective about the partners with which they work and typically seek out partners who have a well-established reputation for trust and quality and are able to meet their service requirements.
- •
- Well Positioned for EMV Conversion in the United States. As a leading provider of integrated credit, debit and Prepaid Debit Card solutions in North America, we are well-positioned to capitalize on the U.S. market conversion to EMV. We serve our customers through a network of nine production and card services facilities, including seven high-security facilities in North America that are each certified by one or more of the Payment Card Brands (Visa, MasterCard,
We serve a diverse set of over 4,000 direct and indirect customers, including many of the largest North American issuers of debit and credit cards such as JPMorgan Chase, Bank of America, American Express and Wells Fargo, as well as the largest global managers of Prepaid Debit Card programs, including InComm, Green Dot, Blackhawk Network and American Express. We have long-standing relationships with our customers, many of whom we have served for decades and provide a differentiated level of service, as evidenced by our strong net promoter score, a customer satisfaction metric developed through customer satisfaction surveys conducted by an independent market research firm. We also maintain important relationships with the Payment Card Brands to ensure our facilities and processes consistently meet their standards.
104
- •
- Comprehensive End-to-End Card Solutions Drive Deep Customer
Integration. The foundation of our strong market position is our comprehensive end-to-end Financial Payment Card solutions. Our
solutions provide a full suite of products and card services required to produce, personalize and fulfill Financial Payment Cards, while maintaining the most stringent security requirements of the
Payment Card Brands. We are integral to many of our customers' card programs, pairing card production with an end-to-end offering of card data personalization and card services that are deeply
integrated within our customers operations. We provide card data personalization services for more than 3,200 financial institutions and managers of Prepaid Debit Card programs that require extensive
technology integration, such as secure data links to transfer highly sensitive cardholder information. Similarly, our installed base of more than 3,400 instant issuance systems at bank and credit
union branches across the United States require comparable levels of customer integration, as our Card@Once® instant issuance system utilizes only our secure technology to instantly
personalize cards. Certain customers have also integrated our proprietary software into their customer-facing websites to offer card design and customization to their cardholders. We believe that our
comprehensive solution allows our customers to choose a single trusted partner to address their card program needs in a cost-effective manner instead of managing multiple suppliers across a complex
value chain. We believe our customers choose and retain us for these critical functions, which typically require integrations that are costly and difficult to unwind, due to our reputation as a
trusted partner, our high levels of service and proven execution.
- •
- Certified Network of North American High-Security
Facilities. Our seven high-security North American facilities are each certified by one or more of the Payment Card Brands and Interac
(in Canada), forming the largest certified production facility network in North America. The Payment Card Brand certifications allow us to produce cards bearing these brands and provide relevant card
services for our issuer customers. Additionally, many of our facilities are also certified by the PCI Security Standards Council and individually by customers. These certification processes are long,
complex and costly, and our facilities must comply with the strictest standards of security in order to obtain and retain this designation, which are regularly verified by both the Payment Card Brands
and our customers.
- •
- Industry Experience and Proprietary and Patented
Solutions. Over the course of our long operating history, we have developed extensive technological, engineering and operational
expertise that we believe has made us a leader in our industry for product and process know-how. We believe that our technological and operational know-how, combined with our specific focus on the
Financial Payment Card market, gives us a competitive advantage and fosters a culture of innovation. We have developed and acquired significant intellectual property over our operating history and
hold 18 U.S. patents, as well as 27 pending U.S. and foreign patent applications, on our Financial Payment Card solutions, including patents on our tamper-evident security packaging used by our
customers that have Prepaid Debit Card and instant issuance offerings. We also hold exclusive production rights to certain products the Company has developed as well as patented software solutions
such as our MYCA™ offering, which is integrated into the websites of over 300 card issuing banks and other customers.
- •
- Strong Management Team. We have built a strong management team led by Steven Montross, our CEO and President. Mr. Montross has led CPI for six years and under his leadership we
American Express and Discover), Interac (in Canada) and, where required by our customers, the PCI Security Standards Council. We have made significant investments in our physical infrastructure and equipment platform to prepare for the EMV conversion including opening a dedicated EMV technology center in Colorado for EMV production and personalization and significant information technology, human capital and equipment upgrades across our network of facilities.
105
have completed three strategic acquisitions and our EBITDA has grown more than three-fold. Our management team, which collectively has more than 140 years of experience in our industry, has established a track record of recognizing and capitalizing on growth opportunities across the markets we serve. Management identified and drove our expansion into Prepaid Debit Card services during the early market adoption period of this card product which has grown at an estimated 11.8% CAGR since 2009. Similarly, our management team devised and executed on a strategy to develop our card services offering, which was accelerated by our acquisition of EFT Source. Today, we have a card services customer base of more than 3,200 financial institutions and an installed base of more than 3,400 Card@Once® instant issuance systems in U.S. bank branches.
Our Growth Strategy
The key components of our strategy include:
- •
- Capitalize on U.S. EMV Conversion. The conversion to the
EMV standard in the United States is expected to increase the size (measured in dollars) of the Financial Payment Card market (excluding services) from $180 million in 2013 to
$1.2 billion by 2019, driven primarily by the increasing levels of card fraud in the United States, the Payment Card Brands' coordinated EMV conversion plan, including the liability shift
scheduled for October 1, 2015, and the need for a single global interoperable standard of card acceptance. The conversion of Financial Payment Cards in the United States from magnetic stripe
technology to the EMV standard began in earnest in the second half of 2014 and is expected to continue over the next several years, with full adoption in the credit and bank debit card markets
expected to be largely complete by 2017 and increasing levels of adoption of Prepaid Debit Cards and Private Label Credit Cards beyond 2017. We believe the conversion to EMV, and subsequently the
expected further adoption of the more complex and higher priced Dual-Interface EMV cards, will increase the size (measured in dollars) of our estimated addressable card market by four times over the
next decade. In anticipation of the EMV conversion, we invested significantly in our network of facilities (the most extensive in North America), technological infrastructure and human capital
resources. We believe our comprehensive solutions offering and proven track record ideally positions us to be our customers' partner of choice to successfully complete the EMV conversion.
- •
- Capitalize on Growth in Prepaid Debit Market. According
to First Annapolis, the Prepaid Debit Card market has grown at an 11.8% CAGR from 2009 to 2014 and is expected to continue to grow at an 8.0% CAGR from 2014 to 2019 as consumers increase adoption and
additional issuers introduce new products. We believe we are well positioned to capitalize on this continued growth due to our market leading position, supported by our industry expertise and patents
and comprehensive end-to-end card solutions. We have driven our leading market position through trust-based relationships with the largest global managers of Prepaid Debit Card programs, including
InComm, Green Dot, Blackhawk Network and American Express. Additionally, we have further developed proprietary production techniques which provide us a cost advantage and additional flexibility to
meet customer demands.
- •
- Capitalize on Growth in Instant Issuance Systems and Services Market. We acquired our instant card issuance system, Card@Once®, through the acquisition of EFT Source in 2014 and have continued to drive significant growth in sales of our instant issuance systems and related services revenue. We plan to continue to grow our installed base of instant issuance systems in bank branches across the U.S., which was more than 3,400 as of June 30, 2015, to increase our opportunity for continued recurring revenue streams from card personalization which is delivered through our software as a service offering. We believe the U.S. market is in the early
106
- •
- Cross-Sell Expanded Services Offering Across Customer
Base. We believe our leading market position in card production in North America, combined with recent enhancements to our card services
platform, including our acquisition of EFT Source, represents a significant opportunity to cross-sell services across our customer base by offering a comprehensive end-to-end card solution. According
to First Annapolis, the dollar value of the U.S. market for outsourced personalization services for Financial Payment Cards is expected to grow from $417 million in 2014 to $604 million
in 2019, representing a 7.7% CAGR, and we believe that focused selling efforts of our card services to our existing customers and as part of a complete end-to-end solution, and continued investment in
proprietary card services, represents a substantial revenue opportunity and means to further deepen our existing customer relationships. Through our strong track record in card services, including
providing card data personalization services for more than 3,200 financial institutions and managers of Prepaid Debit Card programs and personalizing more than 130 million Financial Payment
Cards in 2014, we believe we have established a reputation as a trusted partner and advisor to our customers with the ability to securely manage significant amounts of sensitive and confidential
customer data throughout our network. Due to the high costs of failure, such as a data breach, we expect that customers will continue to choose trusted vendors such as CPI that can provide high levels
of security, service and certainty to manage these critical functions.
- •
- Continued Execution on Strategic Acquisitions. We have a strong track record of acquiring and integrating complementary businesses, completing six acquisitions since 2008, all of which have enhanced our market share, capabilities and capacity. We expect to continue to opportunistically execute strategic acquisitions that give us access to new markets and capabilities while providing a reasonable value proposition to our stockholders.
stages of instant issuance adoption as, according to First Annapolis, only approximately 20% of U.S. bank branches are equipped with instant issuance solutions.
Our History of Acquisitions, Divestitures and Investments
Over the last decade, we have completed six acquisitions and heavily invested in our platform to drive organic growth. Our first major phase of growth occurred throughout 2008, during which time we made three acquisitions to enter new markets and gain access to new client bases. In January 2008, we made our first acquisition, purchasing Wm. A. Didier & Sons, Inc., a privately owned Financial Payment Card producer based in Fort Wayne, Indiana, which was a direct competitor within our market. In August 2008, we entered the Western European market with our acquisition of PCC, a card producer and card services provider primarily serving the European retail gift card market with two facilities located in the U.K. Finally in October 2008, we entered the Canadian market by purchasing Metaca, a Toronto-based provider of EMV and Prepaid Debit Cards and card services.
Our next phase of growth focused on expanding capabilities within these markets. In March 2010, we purchased certain assets of Premier Card Solutions, which strengthened our position in the prepaid debit market, added tamper-evident security packaging solutions to our portfolio of services and added capacity and capabilities in Financial Payment Card production and card services. In May 2012, we acquired certain assets of ID Data, Limited, an operator of a U.K.-based Financial Payment Card production and card services business, in order to bolster our capabilities in Europe. Finally, in September 2014 we expanded our card services offerings with the acquisition of EFT Source, a leading provider of card services for Financial Payment Cards. In addition to its strong card services platform, EFT's Card@Once® instant issuance offering earned it multiple leadership recognitions within the financial technology industry. In April 2015, we completed the consolidation of our Colorado Springs facility, obtained through the EFT Source acquisition, with our Midway facility in order to realize on planned synergies from this acquisition.
107
In addition to these acquisitions, we have made significant investments in our physical infrastructure and equipment platform over the past decade. To prepare for the EMV conversion, we opened a dedicated EMV technology center in Colorado for EMV production and personalization and also made significant information technology, human capital and equipment upgrades across our network of facilities. In Minnesota, we added significant capacity and also opened a secure fulfillment facility.
In January 2015, we divested our Nevada facility, a unit focused on the production of retail gift cards, to further align our strategy and focus on the Financial Payment Card market in North America.
Our Products and Services
Our leading market position is supported by our comprehensive end-to-end Financial Payment Card solutions offering which meets the stringent security requirements of the Payment Card Brands and our customers. This comprehensive offering of end-to-end solutions drives deep customer integration and long-term trusted relationships with our customers, many of which we have served for decades.
EMV Financial Payment Cards (Contact and Dual-Interface) (37% of LTM net sales)
We produce Contact EMV cards, which feature a microprocessor that interfaces with an EMV payment terminal over a contact plate on the surface of the card when inserted into an EMV-enabled payment terminal. We also produce Dual-Interface EMV cards, which feature both the contact EMV technology and a RFID antenna that utilizes near field communications ("NFC") technology to allow transactions to also be processed on a contactless basis when the card is brought within the requisite proximity to a NFC enabled payment terminal.
Non-EMV Financial Payment Cards and Retail Gift Cards (22% of LTM net sales)
We produce non-EMV cards that utilize magnetic stripes, contactless cards which utilize NFC technology and cards that include both magnetic stripes and NFC technology. In addition, we produce retail gift cards (which are not issued on the network of the Payment Card Brands) primarily in the U.K. and Canada.
Card Data Personalization (18% of LTM net sales)
We provide data preparation and card data personalization solutions for debit, credit and Prepaid Debit Cards in EMV and non-EMV card formats. Our personalization services are technology-driven and provide a wide range of card customization options, using advanced processes to personalize (encode, program and emboss with data such as cardholder name and account number) and fulfill cards to individual cardholders. In addition, we provide EMV data script development services for our customers and in certain cases generate PIN numbers and mailers on their behalf. We offer patented card design software, known as MYCA™, which provides our customers and their cardholders the ability to design cards on the internet and customize cards with individualized digital images. We also provide consultation and card design services to further assist customers in card customization. We also offer integrated business continuity services to card issuers that provide their own card issuance and personalization services, providing an alternate site to personalize and fulfill cards in the event of a business disruption at their captive sites. Finally, we have the capabilities to provide Trusted Service Manager services, leveraging our existing data connectivity with processors and other customers to offer a trusted, high-security solution for facilitating mobile payments.
108
Tamper-Evident Security Packaging Solutions (19% of LTM net sales)
We offer specialized and innovative tamper-evident security packaging products and services to customers with a Prepaid Debit Card offering that reduce fraud for Prepaid Debit Cards sold through the retail channel. The majority of the tamper-evident security packaging we produce is protected by our patents. In certain cases, we also manage the fulfillment of fully-completed Prepaid Debit Card packages to retail locations on behalf of our customers utilizing this solution.
Instant Card Issuance Systems and Services (4% of LTM net sales)
We offer Card@Once®, our proprietary and patented instant card issuance system and services, which provide our card issuing bank customers the ability to issue a completely personalized permanent debit card within the bank branch to individual cardholders upon demand. Our instant issuance system is enabled by cloud-based software that securely transfers data from our servers to the card branch to encode and print the card on a small specialized desktop printer in a process which is certified by MasterCard and Visa. Our instant issuance system generates both system sales and recurring revenue from software as a service, card personalization and sales of cards and consumables. As of June 30, 2015, we had over 3,400 instant issuance systems installed in bank and credit union branches across the United States. In addition, we provide instant issuance of debit cards to large financial institutions whereby we provide fully-personalized temporary debit cards which are issued to card holders upon opening a new account, and we manage the fulfillment and replenishment of these fully personalized cards directly to thousands of individual bank branches.
Our Value Proposition
We provide a strong value proposition to our customers through our comprehensive end-to-end Financial Payment Card solutions that we tailor to meet the specific requirements of each of our customers. The three key components of our value proposition are our:
- •
- large and integrated North American production network;
- •
- focus on providing a superior customer experience; and
- •
- proprietary products and suite of value-added services
The first element of our value proposition is that our card production and services facilities together serve as an integrated network, which is the largest in our industry in North America. All of our North American facilities are certified by one or more of the Payment Card Brands, Interac (in Canada) and, where required by our customers, the PCI Security Standards Council, utilizing integrated and standardized practices, processes and technologies. We believe our highly integrated network of seven facilities allows us to provide a differentiated value proposition to the North American Financial Payment Card market for several reasons. First, our network allows us to provide our customers with a complete solution across a wide variety of card products and services. This allows our customers to choose a single trusted partner to address their card program needs in a cost-effective manner instead of managing multiple suppliers across a complex value chain. Second, our large card production network provides economies of scale that allows us to provide all of our customers with a competitive price point. Third, our network provides us with significant flexibility to move card production and services orders between facilities to provide high levels of service and precise execution. This is valuable to our customers because it allows us to accelerate delivery times and provide a consistent supply. Our customers have told us, directly and through third-party market research that we conduct, that on-time delivery is very important to them and we use our network to maximize our performance in this regard.
The second element of our value proposition is the high-importance that we place on the customer experience. We are focused across our Company on providing our customers with the highest-level of service in the industry. We have long-standing relationships with our customers, many of whom we have
109
served for decades, and provide a differentiated level of service, as evidenced by our strong net promoter score of greater than 60, a customer satisfaction metric developed through customer satisfaction surveys conducted by an independent market research firm. We measure our net promoter score regularly to assess our customers' perception of our service levels and hold ourselves accountable by tying a portion of our incentive compensation to continuous improvement of our service levels.
The third element of our value proposition is our proprietary products and value-added services. We have developed several proprietary products and services that provide our customers with individually tailored solutions and have fostered a culture of innovation to continue to improve upon our existing, and develop new, solutions. We have developed a patented suite of tamper-evident security packaging options, which we believe leads the industry, and enables our prepaid debit customers to differentiate themselves with a high-level of security performance. The success of this product is evidenced by the fact that our tamper-evident security packaging is used by all of the top five Prepaid Debit Card program managers. Similarly, we have developed our patented instant card issuance platform, Card@Once®, which provides our customers an easy-to-use, software-as-a-service enabled instant issuance solution that allows them to provide their cardholders permanent debit cards without a significant investment of capital or internal resources. The success of this solution is evidenced by the more than 3,400 instant issuance systems installed in bank branches across the United States. Finally, our patented card-design software, MYCA™, is integrated with more than 300 of our customers and allows their cardholders to design customized cards over the internet, including the ability to select personal digital images, that enable our customers to differentiate themselves in their market and become "top of wallet" with their cardholders.
Suppliers
The most important component of our products is the EMV microchip, which represented approximately 23.4% of our total cost of goods sold for the year ended December 31, 2014, and which we expect to become even more significant as EMV cards comprise an increasing percentage of the cards we ship. While we have developed constructive relationships with our suppliers and, in general, receive a high level of cooperation and support from them, the objective of our procurement strategy is not to depend on any single supplier. We obtain our components from multiple suppliers located in South Korea, France, the United States and Singapore, primarily on a purchase order basis. Our main suppliers of EMV microchips are five leading semiconductor manufacturers: KONA I Co. Ltd, Smart Packaging Solutions, NXP Semiconductors USA, Inc., Inside Secure and Multos International. Approximately 96.1% of our total purchased EMV microchips for the year ended December 31, 2014 came from these five main suppliers. The other key components for our products are substrates (such as PVC), antennas and inlays, which we also source from multiple suppliers. We continuously monitor supply chain risks and evaluate alternative suppliers based on numerous attributes including quality, performance, service, scalability, features, innovation and price.
Customers
In the United States, we categorize our customers as follows: large issuers, prepaid debit issuers and program managers and small issuers. Our diverse customer base of over 4,000 direct and indirect customers includes many of the largest issuers of credit and debit cards in the United States and the five largest global managers of Prepaid Debit Card programs. Our top five customers represented approximately 33.9% of our pro forma net sales for the year ended December 31, 2014. Our top five customers in 2014, who we have been serving for an average of greater than 10 years, were First Data Corporation, InComm, Wells Fargo, American Express and Green Dot.
We typically enter into long-term master purchase or service agreements that govern the general terms and conditions of our commercial relationships. We then enter into short-term statements of work to define the prices and the quantities of products to be delivered and services rendered. Usually,
110
our contractual arrangements include neither exclusivity clauses nor commitments from our customers to order any given quantities of products on a medium or long-term basis.
Production and Services
Our production and services strategy has several key facets. We have a large network of integrated high-security facilities that we leverage to balance customer orders, expand the array of products and services available to our customers, provide consistent supply and execute short lead times. Our facilities and operating processes are designed to provide a differentiated level of service to each our key customer sets. For example, we have the processes and capabilities to:
- •
- execute high-volume, low-cost production runs that allow us to meet the competitive price points of large orders;
- •
- execute lower-volume, highly personalized customized runs that allow us to meet the high-service and quick-turn needs of smaller
orders; and
- •
- meet the specific needs of our Prepaid Debit Card customers.
We operate approximately 480,000 square feet of facilities in the United States, Canada and the United Kingdom, where we focus on Financial Payment Card production and personalization services. See "Facilities" for information on the operations of each facility.
We rely on secure ground freight to deliver products to our banking customers. Due to the high-security nature of the products we provide to our banking customers, product must be shipped to these customers via a secure method, such as armored vehicle. With respect to customers for whom we fulfill individual and personalized debit and credit cards, we utilize the U.S., Canadian and U.K. postal services to deliver these cards directly to individual cardholders. For other customers, we predominately deliver our products via regular ground and air freight.
Sales and Marketing
We market our products and services to national and regional banks, independent community banks, credit unions, managers of prepaid programs, Group Service Providers and card processors. We have approximately 30 field-based sales representatives that gives us a wide geographic reach across North America, Western Europe and Canada. Our sales representatives offer a complete end-to-end solution to our customers that incorporates the full spectrum of our products and services from concept to delivery. Our sales and marketing strategy focuses on strengthening our relationships with existing customers, providing a differentiated offer that includes cross-selling expanded services. We leverage the strength of our full-service offerings to attract new customers. Our marketing efforts focus on the needs of our specific types of customers. By tailoring our marketing strategy to different customer groups, we are able to provide relevant targeted solutions to meet their individual needs. We utilize an array of different marketing communications focused on thought leadership that include industry publications, editorial white papers, conferences and trade shows, print and digital advertisements and educational webinars designed to introduce our existing customers and new customers to innovations in the payments market. Through these efforts, we drive customer retention and satisfaction, and have been able to attract new customers.
Competition
The market for products and services in the payment card industry is highly competitive. Some of our competitors possess substantially greater financial, sales and marketing resources than we do and have substantial flexibility in competing with us, including through the use of integrated product offerings and competitive pricing. Competitive factors for our business include product quality, security,
111
service reliability, product line comprehensiveness and integration, timely introduction of new products and features and price. We believe that we compete favorably in each of these categories.
Our products and services compete with other card manufacturers and card solutions providers. We believe our primary competitors are Oberthur Technologies S.A., Giesecke & Devrient GmbH, Valid S.A. and Gemalto NV. Certain existing and potential financial institution customers also have the ability to personalize Financial Payment Cards in-house. In addition, we compete with customers that offer transaction processing products and services to financial institutions.
Intellectual Property
We own and control various intellectual property rights, such as patents, trade secrets, confidential information, trademarks, service marks, trade names, copyrights and applications. We are also party to certain patent cross-license arrangements with industry participants and may, from time to time, enter into similar commercial agreements should we consider it necessary or beneficial for our business.
We rely on a combination of statutory (copyright, trademark and trade secret) and contractual safeguards for intellectual property protection throughout the world. As of August 25, 2015, we had 22 registered U.S. and foreign trademarks, 18 existing U.S. patents, as well as 27 pending U.S. and foreign patent applications. Our patents have an average remaining maturity of 14.5 years, and our trademarks will be due for renewal for additional ten or fifteen-year periods on an ongoing basis over the next 11.5 years.
Environmental Protection
Our manufacturing operations are subject to environmental protection regulations, including those governing the emissions of pollutants into the air, wastewater discharges, the use and handling of hazardous substances, waste disposal, the investigation and remediation of soil and groundwater contamination. We are also required to obtain environmental permits from governmental authorities for certain of our operations. We believe that we are in material compliance with environmental requirements and that environmental matters will not have a material adverse effect on our business, although resolution of any item in any particular year or quarter could be material to the results of operations or liquidity for that period.
Regulation
Privacy and Data Security
In the course of our business, we receive personally identifiable information of cardholders from our customers, either from a financial institution or through a card processor on behalf of a financial institution. Such information includes names, addresses, card account numbers and expiration dates. In some cases, we receive a cardholder's social security number and/or PIN number. As a service provider to financial institutions in the United States, we comply with the privacy provisions of the GLBA and its implementing regulations and, as applicable, with various other federal, state and foreign privacy statutes and regulations, and the PCI Security Standards Council's Data Security Standards, each of which is subject to change at any time. We may only use and disclose the personal information we receive on behalf of our customers for the purposes for which it was provided to us and in a manner that is consistent with each financial institution's and processor's own data privacy and security obligations.
In order to comply with our obligations under the GLBA, applicable state laws and our contractual agreements with our customers, we are required to safeguard and protect the privacy of personally identifiable information we receive. As part of their compliance with these requirements, each of our U.S. customers is expected to have a program in place for responding to unauthorized access to, or use
112
of, consumer information that could result in substantial harm or inconvenience to consumers. A majority of U.S. states have enacted security breach legislation, requiring varying levels of consumer notification in the event of a security breach, which could result in significant costs to us and significant damage to our reputation.
The interpretation of pending and existing laws and regulations is evolving and, therefore, these laws and regulations may be applied inconsistently. It is possible that our current data protection policies and practices may be deemed inconsistent with new legal requirements or interpretations thereof, and breaches in the security of our systems and technology could result in a violation of these laws and regulations.
We are also subject to requirements from the Payment Card Brands, which require us to meet certain security standards in order to achieve certification that allows us to produce Financial Payment Cards issued on their networks. These standards include extensive checklists with respect to the physical characteristics of our facilities, as well as our electronic treatment and storage of cardholder data. We believe that we have developed significant expertise in acquiring and maintaining these certifications, and have invested significant capital to obtain and retain these designations, which are regularly verified by both the Payment Card Brands and our customers. We believe the long, complex and costly certification process serves as a significant barrier to new entrants to our market.
Financial Services
We are generally not directly subject to federal or state regulations specifically applicable to financial institutions such as banks, thrifts and credit unions. However, as a provider of products and services to these financial institutions, our operations may be examined by various state and federal regulatory authorities and representatives of the Federal Financial Institutions Examination Council, which is a formal inter-agency body empowered to prescribe uniform principles, standards and report forms for the federal examination of financial institutions and to make recommendations to promote uniformity in the supervision of financial institutions. Also, state and federal regulations require our financial institution clients to include certain provisions in their contracts with service providers like us and to conduct ongoing monitoring and risk management for third party relationships. In addition, independent auditors annually review many of our operations to provide internal control evaluations for our clients' auditors.
In conducting certain of our card services, we are directly subject to various federal and state laws and regulations including those relating to the movement of money. In order to comply with our obligations under applicable laws, we are required, among other things, to comply with licensing and reporting requirements, to implement operating policies and procedures to comply with anti-money laundering laws, to protect the privacy and security of our clients' information and to undergo periodic audits and examinations.
In 2010, the Dodd-Frank Act was enacted. The Dodd-Frank Act introduced substantial reforms to the supervision and operation of the financial services industry, including introducing changes that: affect the oversight and supervision of financial institutions; provide for a new resolution procedure for large financial companies; introduce more stringent regulatory capital requirements; implement changes to corporate governance and executive compensation practices; and require significant rule-making. The Dodd-Frank Act has generated numerous new regulations that have imposed compliance costs and, in some cases, limited revenue sources for us and our clients. The Dodd-Frank Act established the Consumer Financial Protection Bureau ("CFPB") which is empowered to conduct rule-making and supervision related to, and enforcement of, federal consumer financial protection laws. The CFPB has issued guidance that applies to "supervised service providers" which the CFPB has defined to include service providers, like us, to CFPB supervised banks and nonbanks. The CFPB has in the past and may in the future issue regulations that may require us to make compliance investments and/or limit our
113
fees or other revenue sources. We do not currently anticipate a materially adverse impact on our business, results of operations or financial condition due to these regulations, but it is difficult to predict with certainty the extent to which the Dodd-Frank Act, the CFPB or the resulting regulations will impact our business or the businesses of our current and potential clients over the long term.
Employees
As of June 30, 2015 we had approximately 1,255 employees, all of whom are full-time employees. We have never experienced any work stoppages or strikes as a result of labor disputes. We consider relations with our employees to be good.
Facilities
We maintain a network of nine facilities. Information regarding each of our facilities is set forth below.
Location(1)
|
Operations | Square Footage | Owned/Leased | ||||
|---|---|---|---|---|---|---|---|
Littleton, Colorado (Centennial) |
Financial Payment Card production and corporate headquarters | 65,000 | Leased | ||||
Littleton, Colorado (Midway) |
Financial Payment Card production and card personalization services |
50,000 |
Leased |
||||
Roseville, Minnesota (2 facilities) |
Financial Payment Card production, card personalization services and secure fulfillment center |
164,000 |
Leased |
||||
Fort Wayne, Indiana |
Financial Payment Card production |
50,000 |
Leased |
||||
Nashville, Tennessee |
Financial Payment Card personalization services and fulfillment |
49,000 |
Leased |
||||
Toronto, Ontario |
Financial Payment Card and retail gift card production and card personalization services and fulfillment |
67,000 |
Leased |
||||
Colchester, United Kingdom |
Retail gift card production |
37,000 |
Owned and Leased |
||||
Liverpool, United Kingdom |
Retail gift card personalization services |
30,000 |
Owned |
||||
- (1)
- We also lease a facility in Petersfield, United Kingdom. In August 2015, we completed the shutdown and closure of our operations at our Petersfield facility.
Legal Proceedings
We are subject to routine legal proceedings in the ordinary course of business. We believe that the ultimate resolution of these matters will not have a material adverse effect on our business, financial condition or results of operations.
114
Executive Officers and Directors
The following table provides information with respect to individuals who will serve as our directors and executive officers at the time of this offering.
| Name | Age | Position | Residence | ||||
|---|---|---|---|---|---|---|---|
Steven Montross |
62 | President, Chief Executive Officer and Director | Colorado, United States | ||||
David Brush |
50 | Chief Financial Officer | Colorado, United States | ||||
Lisa Jacoba |
48 | Chief Human Resources Officer | Colorado, United States | ||||
William Dinker |
60 | Executive Vice President | Tennessee, United States | ||||
Anna Rossetti |
55 | President—CPI Canada | Ontario, Canada | ||||
Jerry Dreiling |
53 | Vice President and Chief Accounting Officer | Colorado, United States | ||||
Nicholas Cahn |
51 | Managing Director—CPI Europe | Surrey, United Kingdom | ||||
Bradley Seaman |
55 | Chairman of the Board | Illinois, United States | ||||
Robert Pearce |
60 | Director | Ontario, Canada | ||||
Nicholas Peters |
42 | Director | Illinois, United States | ||||
David Rowntree |
59 | Director | British Columbia, Canada | ||||
Executive Officers
Steven Montross has served as our President and Chief Executive Officer since January 2009. Prior to joining CPI, Mr. Montross was a founding shareholder and Managing Director of FirstLight Financial Corporation, a business which invests senior debt capital in private-equity owned businesses, from 2007 to 2008. Prior to forming FirstLight, Montross had a 17 year career at General Electric Company where he held positions of increasing responsibility and leadership within GE's financial service businesses, including a business that financed private-equity owned enterprises. Mr. Montross holds a Bachelor of Business Administration degree from the University of Michigan and a Masters of Business Administration from the Kellogg School of Management at Northwestern University. Mr. Montross brings to the board extensive executive leadership experience, and, through his position as our Chief Executive Officer, he brings to the board management's perspective over a full range of issues affecting the Company.
David Brush has served as our Chief Financial Officer since 2015. From 2013 to 2015, Mr. Brush managed Idris Capital Partners, a financial and operational advisory firm. From 2012 to 2013, Mr. Brush served as Group Executive and President—Power Transmission of Rexnord Corporation, a global industrial business in process and motion control and water management. From 1994 to 2011, Mr. Brush served in various roles at Pactiv Corporation, a multi-national manufacturer of packaging and consumer products, including Vice President and General Manager, Specialty Packaging from 2005 to 2011, Vice President and Treasurer from 2000 to 2005, Vice President Finance, Protective & Flexible Packaging from 1997 to 1999 and multiple finance positions within Specialty Packaging from 1994 to 1996. Prior to joining Pactiv, Mr. Brush was Audit Manager at Price Waterhouse LLC from 1987 to 1994. Mr. Brush received his Bachelor Degree in Accounting from the University of Northern Iowa.
Lisa Jacoba has served as our Chief Human Resources Officer since 2015. From 2006 to 2014, Ms. Jacoba served as Senior Vice President at Western Union in the United States and United Kingdom where she held leadership positions in the human resources function. Prior to that, Ms. Jacoba held various human resources leadership positions at First Data Corporation from 1990 to 2006. Ms. Jacoba received her Bachelor of Science in Human Resources from Bellevue University.
William Dinker has served as our Executive Vice President since August 2015. Prior to that, Mr. Dinker served as the President, CPI EFT Source since the Company's acquisition of EFT in September 2014. Prior to our acquisition of EFT Source, Mr. Dinker served as the President and Chief
115
Executive Officer of EFT from 1999 to 2014 and as Vice President of Sales of EFT Source from 1989 to 1999. Prior to joining EFT Source, Mr. Dinker held various management positions at Anheuser-Busch working with its distributors. Mr. Dinker holds a Bachelor of Business Administration degree from Middle Tennessee State University and a Masters of Business Administration from Vanderbilt University.
Anna Rossetti has served as the President of CPI Card Group—Canada since 2008. From 1999 to 2008, Ms. Rossetti held several positions with Giesecke & Devrient (Canada), including President from 2004 to 2008 and Senior Vice President and General Manager from 1999 to 2004. Prior to that, Ms. Rossetti worked with Equifax Canada, Bank of Nova Scotia and Bank of Montreal. Ms. Rossetti received her Bachelor Degree in Economics with Honors from York University.
Jerry Dreiling has served as our Vice President and Chief Accounting Officer since August 2011 overseeing the Company's audit and budgeting function. From 2000 to 2011, Mr. Dreiling served as Chief Financial Officer of Picosecond Pulse Labs. From 1990 to 2000, he served in several senior financial roles, including Director of Strategic Financial Planning, and business unit Finance Director at Storage Tek. From 1984 to 1990, he served as an officer at United Bank of Denver. Mr. Dreiling received his Bachelor's in Business Administration with honors from the University of Northern Colorado and his Master of Business Administration with honors from Regis University.
Nicholas Cahn has served as Managing Director of CPI Europe since 2008. From 2000 to 2008, Mr. Cahn was Director of the Card Division for Oakhill plc and then Managing Director of PCC Services Ltd., prior to its acquisition in 2008 by CPI. Prior to this, Mr. Cahn spent 15 years with Group Bull of France, serving as Director of International Sales in their smartcard division in Paris, Smartcard Business Unit Director in London and Vice President of a joint venture with Dai Nippon Printing in Tokyo. Mr. Cahn holds a business studies degree from Thames Valley University and is an alumnus of Bull's Executive Advanced Management Course and the European Executive Training Program in Japan.
Directors
Bradley Seaman has served on our board of directors since 2007. Mr. Seaman has been employed, since August 1999, by Tricor Pacific Capital, Inc., a private equity firm that makes control investments in lower middle market companies in the United States and Canada. From 1999 through December 2011, Mr. Seaman was Tricor's Managing Director and leader of its U.S. operations, and, since January 2012, has served as its Managing Partner, responsible for leading overall firm operations, strategy, funding and investments. Prior to joining Tricor, and from 1990 through July 1999, Mr. Seaman was employed by GE Capital Corporation where he held a number of increasingly senior positions in GE's Transportation & Industrial Funding and Commercial Finance units, ultimately being promoted to head GE Capital's transactions origination teams in Ohio, Michigan and Missouri. In 1994, Mr. Seaman was selected to be part of a new group that was established to focus GE Capital's debt and equity products on the emerging private equity market, and, in that capacity, headed GE's offices in New York and Chicago. Mr. Seaman is also a member of the board of directors of Steel Dynamics, Inc. (NASDAQ: STLD). Mr. Seaman holds a Bachelor of Science degree in Business Administration from Bowling Green State University and an MBA from the University of Dallas. He brings to the board a comprehensive understanding and experience in the capital markets, management experience, and both operational and corporate governance experience drawn from his involvement in the management and oversight of Tricor's portfolio companies.
Robert Pearce has served on our board of directors since 2007. Mr. Pearce also serves on the board of directors of Canada Guaranty Mortgage Insurance Company and First American Payments Systems, and as an advisor to NorthCard Inc. Mr. Pearce spent 26 years with BMO Bank of Montreal, from 1980 to 2006, most recently holding the position of Chief Executive Officer and President, Personal and Commercial Client Group. He also served on the board of directors of MasterCard International from 1998 to 2006 and as Chairman of the Canadian Bankers' Association from 2004 to 2006. Mr. Pearce
116
holds a Bachelor of Arts from the University of Victoria and a Master of Business Administration from the University of British Columbia. Mr. Pearce brings to the board over 30 years of operational and leadership experience in the financial services industry, including extensive operating experience in credit card, debit card and prepaid cards in both card issuing and merchant acceptance in Canada and the United States.
Nicholas Peters has served on our board of directors since 2007. Mr. Peters is a Managing Director at Tricor, which he joined in 2002 and also began serving as Tricor's Chief Financial Officer in 2012. Prior to joining Tricor, Mr. Peters was a Senior Manager at Arthur Andersen LLP in Chicago. Mr. Peters is the Chairman of BFG Supply Company LLC and Certified Recycling and has served on the board of several other Tricor investment companies. Mr. Peters holds a Bachelor of Science degree in Business Administration from the University of Dayton in Ohio. He is a Certified Public Accountant and is affiliated with the American Institute of Certified Public Accountants and the Ohio Society of CPAs. Mr. Peters brings to the board strong finance and accounting skills, as well as valuable experience from his oversight of the management and operations of several of Tricor's portfolio companies.
David Rowntree has served on our board of directors since 2007. Mr. Rowntree is the President and Chair of Highland West Capital Ltd., a Vancouver-based merchant bank that he founded in July 2012. Mr. Rowntree is one of the founders of Tricor, where he served as a Managing Director from January 1996 to June 2013. Prior to co-founding Tricor, Mr. Rowntree was a practicing attorney in both public practice and as in-house counsel. Mr. Rowntree is the Chair of Ten Peaks Coffee Co Inc. (TSE:TPK). Mr. Rowntree holds a Bachelor of Arts from the University of British Columbia and a Bachelor of Law from the Osgoode Hall Law School in Toronto, Ontario. Mr. Rowntree brings to the board more than three decades of public and private investment expertise as well as experience in corporate governance, strategic planning and risk mitigation and assessment.
Share Ownership by Directors and Officers
As at the date of this prospectus, as a group, the Company's directors and executive officers beneficially owned, directly or indirectly, or exercised control over 3,119,886 shares of common stock and 73 shares of preferred stock, representing 7.52% and 2.83%, respectively, of the issued and outstanding shares of common stock and preferred stock of the Company, respectively. The foregoing does not include shares held by the Tricor Funds. Each of Messrs. Seaman, Peters and Rowntree is an officer or member of Tricor and has an indirect pecuniary interest in the shares held by the Tricor Funds through their respective interests in the Tricor Funds.
Corporate Cease Trade Orders, Bankruptcies, Penalties and Sanctions
No director or executive officer of the Company is, as at the date of this Prospectus, or was within 10 years before the date of this Prospectus, a director, chief executive officer or chief financial officer of any company (including the Company), that was subject to a cease trade order, an order similar to a cease trade order, or an order that denied the relevant company access to any exemption under securities legislation that was in effect for a period of more than 30 consecutive days:
- (a)
- that
was issued while the director or executive officer was acting in the capacity as director, chief executive officer or chief financial officer, or
- (b)
- that was issued after the director or executive officer ceased to be a director, chief executive officer or chief financial officer and which resulted from an event that occurred while that person was acting in the capacity as director, chief executive officer or chief financial officer.
No director or executive officer of the Company, or a stockholder holding a sufficient number of securities of the Company to affect materially the control of the Company:
- (a)
- is, as at the date of the Prospectus, or has been within the 10 years before the date of the Prospectus, a director or executive officer of any company (including the Company) that, while that person was acting in that capacity, or within a year of that person ceasing to act in that
117
- (b)
- has, within the 10 years before the date of the Prospectus, become bankrupt, made a proposal under any legislation relating to bankruptcy or insolvency, or become subject to or instituted any proceedings, arrangement or compromise with creditors, or had a receiver, receiver manager or trustee appointed to hold the assets of the director, executive officer or stockholder.
capacity, became bankrupt, made a proposal under any legislation relating to bankruptcy or insolvency or was subject to or instituted any proceedings, arrangement or compromise with creditors or had a receiver, receiver manager or trustee appointed to hold its assets; or
No director or executive officer of the Company, or a stockholder holding a sufficient number of securities of the Company to affect materially the control of the Company, has been subject to (a) any penalties or sanctions imposed by a court relating to securities legislation or by a securities regulatory authority or has entered into a settlement agreement with a securities regulatory authority; or (b) any other penalties or sanctions imposed by a court or regulatory body that would likely be considered important to a reasonable investor in making an investment decision.
Conflicts of Interest
Other than as disclosed herein, none of our directors, officers or principal stockholders and no associates or affiliates of any of them, have or have had any material interest in any transaction which materially affects us.
Board Composition and Structure; Director Independence
Our amended and restated certificate of incorporation, which will be in effect prior to the completion of this offering, will provide that, subject to any rights applicable to any then outstanding preferred stock, our board of directors shall consist of such number of directors as determined from time to time by resolution adopted by a majority of the total number of authorized directors, whether or not there exist any vacancies in previously authorized directorships. Initially, our board of directors will consist of five directors. We plan to appoint additional directors following the completion of this offering, and we are currently in the process of identifying such additional directors. Subject to any rights applicable to any then outstanding preferred stock, any additional directorships resulting from an increase in the number of directors may only be filled by the directors then in office unless otherwise required by law or by a resolution passed by our board of directors. The term of office for each director will be until his or her successor is elected at our annual meeting or his or her death, resignation or removal, whichever is earliest to occur.
In connection with this offering, we will enter into a Director Nomination Agreement with the Tricor Funds that provides the Tricor Funds the right to designate nominees for election to our board of directors for so long as the Tricor Funds collectively beneficially own 5% or more of the total number of shares of our common stock then outstanding. The number of nominees that the Tricor Funds are entitled to designate under the Director Nomination Agreement will bear the same proportion to the total number of members of our board of directors as the number of shares of common stock beneficially owned by the Tricor Funds bears to the total number of shares of common stock outstanding, rounded up to the nearest whole number. In addition, the Tricor Funds shall be entitled to designate the replacement for any of its board designees whose board service terminates prior to the end of such designee's term regardless of the Tricor Funds' beneficial ownership at such time. The Tricor Funds shall also have the right to have their designees participate on committees of our board of directors, subject to compliance with applicable law and stock exchange rules. The Director Nomination Agreement will terminate at such time as the Tricor Funds collectively own less than 5% of our outstanding common stock.
We will take steps to ensure that adequate structures and processes are in place to permit our board of directors to function independently of management. The directors will be able to request at any time a meeting restricted to independent directors for the purposes of discussing matters
118
independently of management and are encouraged to do so should they feel that such a meeting is required.
Our board of directors intends to encourage a culture of ethical business conduct. Our board of directors encourages each member to conduct a self-review to determine if he or she is providing effective service with respect to both the Company and the stockholders. Should it be determined that a member of our board of directors is unable to effectively act in the interests of the Company or its stockholders, such member would be encouraged to resign.
Because the Tricor Funds will beneficially own more than a majority of our outstanding voting power following the completion of this offering, we are eligible to be a "controlled company" under the corporate governance rules of the NASDAQ Global Select Market. A company that avails itself of the controlled company exemption is not required to, among other things, have a majority of its board of directors be independent, nor is it required to have independent director oversight of executive compensation and director nominations. We do not intend to avail ourselves of the controlled company exemption for the foreseeable future. The board has determined that each of Messrs. Seaman, Peters, Rowntree and Pearce satisfy the independence requirements of the NASDAQ Global Select Market (other than the additional requirements applicable to members of our audit committee).
Board Mandate
The mandate of our board of directors will be to oversee corporate performance and to provide quality, depth and continuity of management so that we can meet our strategic objectives. Following the completion of this offering, we will adopt a board mandate, which will, among other things, govern the roles, responsibilities and requirements for our board of directors.
Position Descriptions
Our board of directors expects to develop and implement a written position description for each of the chairman and the chief executive officer. Each committee of our board of directors will have a committee charter that will set out the mandate of such committee, including the responsibilities of the chair of such committee.
The chairman's key responsibilities will include facilitating communication between our board of directors and management, assessing management's performance, managing board members, acting as chair of board meetings and meetings of the Company's stockholders and managing relations with stockholders, other stakeholders and the public.
The chief executive officer's key responsibilities will include providing leadership and vision, developing, in concert with our board of directors, the Company's strategic direction, tactics and business plan necessary to realize organizational objectives and manage the overall business of the Company, ensuring strategic and business plans are effectively implemented.
Orientation and Continuing Education
Director orientation and continuing education will be conducted by the Nominating and Corporate Governance Committee. All newly elected directors will be provided with a comprehensive orientation on our business and operations. This will include familiarization with our reporting structure, strategic plans, significant financial, accounting and risk management issues, compliance programs, policies and management and the external auditor. We plan to periodically update existing directors in respect of these matters. The orientation program is designed to assist the directors in fully understanding the nature and operation of our business, the role of our board of directors and its committees, and the contributions that individual directors are expected to make.
Committees of our Board of Directors
We expect that, immediately following this offering, the standing committees of our board of directors will consist of an Audit Committee, a Compensation Committee and a Nominating and
119
Corporate Governance Committee. Each of the committees will report to our board of directors as they deem appropriate and as the board may request. The expected composition, duties and responsibilities of these committees are set forth below.
Audit Committee
The audit committee will be responsible for, among other matters: (1) appointing, retaining and evaluating our independent registered public accounting firm and approving all services to be performed by them; (2) overseeing our independent registered public accounting firm's qualifications, independence and performance; (3) overseeing the financial reporting process and discussing with management and our independent registered public accounting firm the interim and annual financial statements that we file with Canadian Securities Regulators and the SEC; (4) reviewing and monitoring our accounting principles, accounting policies, financial and accounting controls and compliance with legal and regulatory requirements; (5) establishing procedures for the confidential anonymous submission of concerns regarding questionable accounting, internal controls or auditing matters; and (6) reviewing and approving related person transactions.
Upon the completion of this offering, our audit committee will consist of Robert Pearce, Nicholas Peters and Bradley Seaman. We believe that Mr. Pearce meets the independence criteria for purposes of serving on an audit committee under the NASDAQ Global Select Market Rules and Rule 10A-3 under the Exchange Act. In addition, our board of directors has determined that Mr. Pearce qualifies as an "audit committee financial expert," as such term is defined in Item 407(d)(5) of Regulation S-K. The NASDAQ Global Select Market Rules and Rule 10A-3 under the Exchange Act provide for a phase-in of the independence requirements for audit committees, requiring one independent director on the date our registration statement becomes effective, a majority of independent directors within 90 days of such date and a fully independent committee within one year of such date. In accordance with this phase-in schedule, we expect to add additional independent directors to our audit committee in order to satisfy the applicable independence requirements under the rules of the NASDAQ Global Select Market and the SEC. Our board of directors will adopt a new written charter for our audit committee, which will be available on our corporate website at www.cpicardgroup.com upon the completion of this offering. The information on our website is not part of this prospectus.
Compensation Committee
The Compensation Committee will be responsible for, among other matters: (1) reviewing key employee compensation goals, policies, plans and programs; (2) reviewing and approving the compensation of our directors, chief executive officer and other executive officers; (3) reviewing and approving employment agreements and other similar arrangements between us and our executive officers; and (4) administering our stock plans and other incentive compensation plans.
Immediately following this offering, our Compensation Committee will consist of Robert Pearce, David Rowntree and Bradley Seaman, each of whom meets the definition of "independent director" under NASDAQ Global Select Market rules. Our board of directors will adopt a written charter for the Compensation Committee in connection with this offering, which will be available on our corporate website at www.cpicardgroup.com upon the completion of this offering. The information on our website is not part of this prospectus.
Nominating and Corporate Governance Committee
Our Nominating and Corporate Governance Committee will be responsible for, among other matters: (1) identifying individuals qualified to become members of our board of directors, consistent with criteria approved by our board of directors; (2) overseeing the organization of our board of directors to discharge the board's duties and responsibilities properly and efficiently; (3) identifying best practices and recommending corporate governance principles; and (4) developing and recommending to our board of directors a set of corporate governance guidelines and principles applicable to us.
120
Immediately following this offering, our Nominating and Corporate Governance Committee will consist of Robert Pearce, Nicholas Peters and David Rowntree, each of whom meets the definition of "independent director" under NASDAQ Global Select Market rules. Our board of directors will adopt a written charter for the Nominating and Corporate Governance Committee in connection with this offering, which will be available on our corporate website at www.cpicardgroup.com upon the completion of this offering. The information on our website is not part of this prospectus.
Compensation Committee Interlocks and Insider Participation
None of our executive officers has served as a member of the board of directors or compensation committee of another entity that had one or more of its executive officers serving as a member of our board of directors.
Other Committees
Our board of directors may establish other committees as it deems necessary or appropriate from time to time.
Majority Voting Policy
The Second Amended and Restated By-laws of the Company which will become effective upon completion of this offering will provide that a director nominee shall be elected to the board of directors by a majority of the votes cast in favour of such director nominee, provided that it is only applicable to uncontested elections, which satisfies the majority voting requirement under the TSX Company Manual.
Director Term Limits
Our board of directors will not adopt policies imposing an arbitrary term or retirement age limit in connection with individuals nominated for election as directors as it does not believe that such a limit is in the best interests of the Company. Our Nominating and Corporate Governance Committee will annually review the composition of the board of directors, including the age and tenure of individual directors. Our board of directors strives to achieve a balance between the desirability of its members having a depth of institutional experience, on the one hand, and the need for renewal and new perspectives, on the other hand.
Gender Diversity Policy
Our board of directors is committed to nominating the best individuals to fulfill director and executive roles. Our board has not adopted policies relating to the identification and nomination of women directors and executives and as it does not believe that it is necessary in the case of the Company to have such written policies at this time. Our board of directors believes that diversity is important to ensure that board members and senior management provide the necessary range of perspectives, experience and expertise required to achieve effective stewardship and management. We have not adopted a target regarding women on the Board or regarding women in executive officer positions as the Board believes that such arbitrary targets are not appropriate for the Company. Currently there are no women directors on the board and two women holding an executive position, representing 29% of our executive officers.
Risk Oversight
Our board of directors will oversee the risk management activities designed and implemented by our management. The board of directors will execute its oversight responsibility for risk management both directly and through its committees. The full board of directors will also consider specific risk topics, including risks associated with our strategic plan, business operations and capital structure. In addition, the board of directors will regularly receive detailed reports from members of our senior
121
management and other personnel that include assessments and potential mitigation of the risks and exposures involved with their respective areas of responsibility.
Our board of directors will delegate to the audit committee oversight of our risk management process. Our other board committees will also consider and address risk as they perform their respective committee responsibilities. All committees will report to the full board of directors as appropriate, including when a matter rises to the level of a material or enterprise level risk.
Assessments
Upon the completion of this offering, our board of directors, each of its committees and our individual directors will be assessed on an annual basis. Such assessment will be conducted with an emphasis on the overall effectiveness and contributions made by the board as a whole and each committee of the board. Evaluations will include the completion of written effectiveness surveys by directors and interviews with each director, as applicable.
Family Relationships
There are no family relationships among any of our executive officers or any of the persons to be nominated as our directors prior to the consummation of this offering.
Code of Ethics
In connection with this offering, we intend to adopt an amended and restated Code of Ethics that will apply to all of our employees, including our chief executive officer, chief financial officer and principal accounting officer. Our Code of Ethics will be available on our website at www.cpicardgroup.com by clicking on About CPI and then Code of Ethics. If we amend or grant a waiver of one or more of the provisions of our Code of Ethics, we intend to satisfy the requirements under Item 5.05 of Form 8-K regarding the disclosure of amendments to or waivers from provisions of our Code of Ethics that apply to our principal executive officer, financial and accounting officers by posting the required information on our website at the above address. The information on our website is not part of this prospectus.
Our board of directors, management and all employees of the Company will be committed to implementing the Code of Ethics. Therefore, it will be up to each individual to comply with the Code of Ethics and to be in compliance of the Code of Ethics. Where an individual is concerned that there has been a violation of the Code of Ethics, he or she will be able to report in good faith to his or her superior. While a record of such reports will kept confidential by the Company for the purposes of investigation, the report may be made anonymously and no individual making such a report will be subject to any form of retribution.
Director Compensation
See "Executive Compensation—Director Compensation."
Risk Management
The Company intends to implement effective risk management relating to its compensation policies. The Company anticipates that the board of directors or the compensation committee will review the overall executive compensation program on an annual basis and will consider the implications of the risks associated with the Company's executive compensation policies, philosophy and practices.
The Company does not anticipate permitting directors and officers to purchase financial instruments for the purposes of hedging or otherwise engaging in price protective transactions with respect to securities which are held, directly or indirectly, by a director or officer of the Company.
122
Summary Compensation Table
The following Summary Compensation Table discloses the compensation information for fiscal year 2014 for our principal executive officer ("PEO") and the two most highly compensated executive officers other than the PEO who were serving as executive officers at the end of the last completed fiscal year. Certain updated 2015 compensation and other information is provided in the narrative sections following the Summary Compensation Table.
Name and Principal Position |
Year | Salary | Bonus | Stock Awards |
Option Awards |
Non-Equity Incentive Plan Compensation |
Change in Pension Value and Nonqualified Deferred Compensation Earnings |
All Other Compensation(1) |
Total | |||||||||||||||||||
|---|---|---|---|---|---|---|---|---|---|---|---|---|---|---|---|---|---|---|---|---|---|---|---|---|---|---|---|---|
| Steven Montross | 2014 | $ | 415,700 | $ | 207,850 | (2) | — | — | $ | 207,850 | — | $ | 13,078 | $ | 844,478 | |||||||||||||
President and Chief Executive Officer |
||||||||||||||||||||||||||||
Marvin Press(3) |
2014 |
$ |
275,000 |
— |
— |
— |
$ |
100,000 |
— |
$ |
54,000 |
$ |
429,000 |
|||||||||||||||
Former Chief Financial Officer |
||||||||||||||||||||||||||||
Anna Rossetti |
2014 |
$ |
226,450 |
— |
— |
— |
$ |
107,564 |
— |
$ |
21,243 |
$ |
355,257 |
|||||||||||||||
President, CPI Card Group-Canada |
||||||||||||||||||||||||||||
- (1)
- Represents
a car allowance for Mr. Montross; a stipend for living expenses in Colorado and matching contributions under the Company's
401(k) plan for Mr. Press; and life insurance coverage, employer contributions under the Company's pension plan and a car allowance for Ms. Rossetti.
- (2)
- Mr. Montross
was awarded a special bonus of $207,850 in light of his exceptional performance in 2014. In determining this bonus, the
board of directors considered the increase in the Company's EBITDA for the year ended December 31, 2014 as compared to the prior year and the successful completion of the EFT Source
acquisition.
- (3)
- Mr. Press retired from the Company effective May 8, 2015. In connection with his retirement, Mr. Press did not receive any payments other than accrued salary and accrued benefits.
Base Salaries
Base salaries established for the Company's executive officers are intended to reflect each individual's responsibilities, experience, historical performance and other discretionary factors deemed relevant by the Company and have generally been set at levels deemed necessary to attract and retain individuals with superior talent. Base salaries are also designed to provide executive officers with steady cash flow during the course of the fiscal year that is not contingent on short-term variations in the Company's operating performance.
Our named executive officers were entitled to the following annual base salaries:
Named Executive Officer
|
2014 Base Salary (Effective January 1, 2014) |
2015 Base Salary (Effective January 1, 2015) |
|||||
|---|---|---|---|---|---|---|---|
Steven Montross |
$ | 415,700 | $ | 500,000 | |||
Marvin Press |
$ | 275,000 | $ | 275,000 | |||
Anna Rossetti |
$ | 226,450 | $ | 226,450 | |||
Annual Incentive Awards
The Company maintains an incentive compensation program ("IC Plan") to incentivize senior management and other key employees to achieve the short-term financial and non-financial objectives
123
of the company. The annual incentive awards are intended to reward both overall Company and individual performance during the year, and as such, are variable from year to year. The Company believes that establishing cash bonus opportunities is an important factor in both attracting and retaining the services of qualified and highly skilled executives and in motivating our senior management to achieve the Company's annual objectives. In 2014, the IC Plan provided for an aggregate target bonus pool of $2.5 million, and up to a maximum bonus pool of $3.1 million, based upon the company achieving certain levels Adjusted EBITDA. Payout of the aggregate target bonus to individual management team members is based upon a variety of factors including the performance of the individual management team members and the achievement of individual objectives. Generally, payouts to individual management team members are based 70% on the achievement of certain levels of Adjusted EBITDA and 30% on the achievement of personal objectives. In 2014, the IC Plan target bonus pool of $2.5 million was attained and aggregate payouts under the IC Plan to individual management team members were $2.18 million, with the named executive officers earning the following amounts: Mr. Montross—$207,850; Mr. Press—$100,000; and Ms. Rossetti—$107,564. For 2015, the IC plan provides for a bonus pool equal to $1.75 to $5.25 million for achieving certain levels of Adjusted EBITDA during the 2015 calendar year.
In addition, Mr. Montross was paid a special bonus, outside of the IC Plan, of $207,850 in 2015 for his exceptional performance in 2014, as described in the "Summary Compensation Table," above.
Employee Benefits
The Company maintains the CPI Holdings I, Inc. 401(k), which is a qualified defined-contribution plan under the provisions of the Internal Revenue Code Section 401(k), which covers substantially all employees who meet certain eligibility requirements. Under the plan, participants may defer their salary subject to statutory limitations and may direct the contributions among various investment accounts. The Company matches 100% of the participant's first 3% of deferrals and 50% of the next 2% deferral percentage. The Company's portion is 100% vested at the time of the match.
Mr. Montross' Employment Agreement
Effective April 22, 2009, Mr. Montross entered into an employment agreement with the Company to serve as President and Chief Executive Officer for a term of five years, plus automatic one-year renewals thereafter unless either party provides notice of intent not to renew the agreement. The agreement provided for an initial base salary of $390,000 per year. In addition, Mr. Montross is entitled to participate in the annual incentive compensation program with a target of 50% of his annual base salary. In 2009, Mr. Montross received grants of 1,145,078 restricted shares of common stock and 213 restricted shares of preferred stock and also purchased 199,320 shares of common stock and 425 shares of preferred stock. The Company loaned Mr. Montross $150,000 in the form of notes payable to fund a portion of his investment. The remaining balance of this loan was repaid in full by Mr. Montross in August 2015. The Company also agreed to provide a tax gross-up payment of $71,000 in connection with Mr. Montross' grants of restricted shares of common and preferred stock. Mr. Montross is also provided with a reasonable automobile allowance to be approved by the Chairman of the Board.
In the event Mr. Montross is terminated by the Company without "Cause," he resigns for "Good Reason" (each as defined in the agreement) or the Company fails to renew his agreement upon its expiration, Mr. Montross would be entitled to (i) continued payments of his base salary and 1/12th of his estimated annual bonus for a period of 12 months and (ii) a prorated portion of his annual bonus (excluding any portion related to individual objectives), based on the number of full months completed during the fiscal year in which such termination of employment occurs. If Mr. Montross dies or suffers a "Disability" (as defined in the agreement) during the term of the agreement, he or his estate would
124
be entitled to continued base salary and prorated bonus payments for a period of 6 months. Mr. Montross may resign upon giving no less than 90 days' notice.
Mr. Montross is subject to certain restrictive covenants, including non-competition and non-solicitation of Company employees and customers obligations, during the term and for a period of two years following any termination of his employment with the Company.
The estimated payment to Mr. Montross on termination, assuming termination as of December 31, 2014, would have been $623,550 for termination without "Cause" as defined in the agreement, "Good Reason" as defined in the agreement or failure to renew the agreement, and $311,775 for death or "Disability" as defined in the agreement.
Ms. Rossetti's Employment Agreement
Effective October 1, 2008, we entered into an employment agreement with Ms. Rossetti to serve as President of CPI Card Group-Canada for a term ending on October 1, 2011, plus automatic one-year renewals thereafter unless either party provides notice of intent not to renew the agreement. The agreement provided for an initial base salary of CDN $250,000 per year (amounts shown in the Summary Compensation Table above have been converted based on the Canadian Dollar to U.S. dollar exchange rate as of December 31, 2014). In addition, Ms. Rossetti is entitled to participate in the annual incentive compensation program with a target of up to 80% of her annual base salary.
In the event that we terminate Ms. Rossetti's employment without "cause" (as described in the agreement) or fail to renew her agreement upon its expiration, Ms. Rossetti would be entitled to receive a payment each month for the 12 months following such termination equal to the sum of (i) the monthly installment of her base salary, (ii) her monthly car allowance and (iii) 1/12th of her annual bonus, calculated as the average of the bonuses received by her in the prior three calendar years. If Ms. Rossetti's employment terminates due to Ms. Rossetti's death or "disability" (as described in the agreement) during the term of the agreement, she or her estate would be entitled to receive the monthly payments described in (i) and (iii) above for the 12 months following such termination. Ms. Rossetti may resign upon giving no less than 90 days' notice.
Ms. Rossetti is subject to certain restrictive covenants, including non-competition and non-solicitation (of our employees and customers) obligations, during the term and for a period of one year following any termination of her employment with us.
The estimated payment to Ms. Rossetti on termination, assuming termination as of December 31, 2014, would have been CDN $320,750 for termination without cause or failure to renew the agreement, and CDN $308,750 for termination due to death or disability.
Outstanding Equity Awards at 2014 Fiscal Year-End
| |
Stock Awards(1) | ||||||
|---|---|---|---|---|---|---|---|
Name
|
Number of Shares of Stock that Have Not Vested (#) |
Market Value of Shares of Stock that Have Not Vested ($) |
|||||
Steven Montross |
— | — | |||||
Marvin Press |
— | — | |||||
Anna Rossetti |
— | — | |||||
- (1)
- As of December 31, 2014, none of our named executive officers held any options or unvested equity awards.
125
Director Compensation
As described more fully below, the following table summarizes the annual compensation for our non-employee directors during 2014.
Name
|
Fees Earned or Paid in Cash ($) |
Total ($) |
|||||
|---|---|---|---|---|---|---|---|
Robert Pearce |
$ | 100,000 | $ | 100,000 | |||
Nicholas Peters |
— | — | |||||
Bradley Seaman |
— | — | |||||
James Galliher(1) |
$ | 100,000 | $ | 100,000 | |||
Robert Clarke(1) |
$ | 100,000 | $ | 100,000 | |||
Jonathan Dries(1) |
— | — | |||||
David Rowntree |
— | — | |||||
- (1)
- Messrs. Galliher, Clarke and Dries resigned from our board of directors in August 2015.
Narrative to Director's Compensation Table
Our non-employee directors who are not affiliated with the Tricor Funds receive an annual cash retainer of $100,000 per year.
No changes were made with respect to director compensation in 2015.
Incentive Plans and Awards
CPI Holdings I, Inc. Amended and Restated 2007 Stock Option Plan
Prior to this offering, 2,090,000 of our common shares were available to be issued to our employees, directors and consultants in the form of stock option awards under the Option Plan, which became effective October 26, 2007. As shown above in the "Outstanding Equity Awards at 2014 Fiscal Year-End" table, there are no stock option awards held by our named executive officers under the Option Plan. Upon and following the completion of this offering, outstanding awards under the Option Plan shall remain outstanding, but no additional options will be granted under the Option Plan.
As of June 30, 2015, 528,000 outstanding options to acquire shares of common stock are held by 13 employees of the Company. These 528,000 options have a weighted average exercise price of $0.0003 with a weighted average remaining term of 6.11 years. None of our executive officers hold any options under the Option Plan.
CPI Acquisition, Inc. Phantom Stock Plan
In connection with the consummation of this offering, the CPI Acquisition, Inc. Phantom Stock Plan will be terminated (except with respect to participants' continuing non-competition and non-solicitation obligations) and awards held by employees thereunder will be paid out. Participants in the phantom stock plan received phantom preferred units in CPI Acquisition, Inc. and upon redemption are entitled to a cash payment equal to the increase in value of those units above a certain base amount. Our named executive officers participating in the phantom stock plan and the approximate
126
amount they will receive in connection with the phantom stock plan's termination and the redemption of their awards is set forth below.
Name
|
Number of Units Vesting(#) |
Payout Amount ($) |
|||||
|---|---|---|---|---|---|---|---|
Steven Montross |
30,112 | 4,775,832 | |||||
Anna Rossetti |
1,571 | 244,584 | |||||
IPO Stock Option Grants
Upon the effective date of the registration statement of which this prospectus forms a part, we intend to grant awards of stock options for 770,450 shares of our common stock in the aggregate under the Omnibus Plan described below, at an exercise price equal to the initial public offering price. As part of these option awards, we intend to grant Mr. Montross an option to purchase 309,150 shares, Mr. Brush an option to purchase 95,000 shares, and Ms. Rossetti an option to purchase 14,000 shares. The options will generally vest 33.4% on the second anniversary of the date of grant and 33.3% on each of the third and fourth anniversaries of the date of grant, subject to other applicable terms and conditions consistent with the Omnibus Plan.
CPI Card Group Inc. Omnibus Incentive Plan
We intend to adopt the CPI Card Group Inc. Omnibus Incentive Plan (the "Omnibus Plan") pursuant to which cash and equity-based incentives (including through an annual incentive program) may be granted to participating employees, directors and consultants. We expect our board of directors to adopt, and our stockholders to approve, the Omnibus Plan before the consummation of this offering. The principal purposes of the Omnibus Plan are to encourage profitability and growth through short-term and long-term incentives that are consistent with our objectives; to give participants an incentive for excellence in individual performance; to promote teamwork among participants; and to give us a significant advantage in attracting and retaining key employees, directors, and consultants. Our Omnibus Plan provides for the grant of incentive stock options within the meaning of Section 422 of the Internal Revenue Code, nonqualified stock options, stock appreciation rights, restricted stock, restricted stock units, performance based awards (including performance shares, performance units and performance bonus awards), and other stock or cash-based awards. When considering new grants of share-based or option-based awards, the Company intends to take into account previous grants of such awards.
Administration. The Omnibus Plan will be administered by our board of directors or by a committee that the board designates for this purpose (referred to below as the plan administrator). The plan administrator will have the power to determine the terms of the awards granted under our Omnibus Plan, including the exercise price, the number of shares subject to each award, and the exercisability of the awards. The plan administrator also will have full power to determine the persons to whom and the time or times at which awards will be made and to make all other determinations and take all other actions advisable for the administration of the Omnibus Plan.
Grant of Awards; Shares Available for Awards. Certain employees, advisors, and directors will be eligible to be granted awards under the Omnibus Plan, other than incentive stock options, which may be granted only to employees. We will reserve 4,000,000 shares of our common stock for issuance under the Omnibus Plan, plus all shares that are or become available for issuance due to forfeitures under the Option Plan following the consummation of this offering. The number of shares issued or reserved pursuant to the Omnibus Plan will be adjusted by the plan administrator, as they deem appropriate and equitable, as a result of stock splits, stock dividends, and similar changes in our common stock. No more than 1,000,000 shares of our common stock will be granted, or $5,000,000 paid
127
in cash, pursuant to awards which are intended to be performance-based compensation (within the meaning of Section 162(m) of the Internal Revenue Code) to any one participant in a fiscal year. In addition, no non-employee director may receive in any fiscal year share-based awards with an aggregate fair market value greater than $500,000, provided that this limit will not apply to any awards that a non-employee director elects to receive at fair market value in lieu of all or a portion of such non-employee director's compensation.
The maximum number of shares issuable pursuant to awards under the Omnibus Plan and any other share compensation arrangement we maintain, including the Option Plan, within a one-year period to any one participant in the Omnibus Plan, will not exceed 5% of the total number of issued and outstanding shares of our common stock on the grant date of such awards, on a non-diluted basis. The maximum number of shares that may be issued to all insiders (as defined in the Toronto Stock Exchange Company Manual for the purpose of security-based compensation arrangements) within any one-year period, and issuable to insiders at any point in time under the Omnibus Plan and any other share compensation arrangement we maintain, including the Option Plan, will not exceed 10% of the total number of then-issued and outstanding shares of our common stock.
Stock Options. Under the Omnibus Plan, the plan administrator may grant participants incentive stock options, which qualify for special tax treatment in the United States, as well as non-qualified stock options. Stock options are a variable component of compensation designed to incentivize the participants to grow the Company and to increase the value of the Company's shares. The plan administrator will establish the duration of each option at the time it is granted, with a maximum duration of 10 years from the effective date of the Omnibus Plan, and may also establish vesting performance requirements that must be met prior to the exercise of options. Stock option grants must have an exercise price that is equal to or greater than the fair market value of our common stock on the date of grant. Stock option grants may include provisions that permit the option holder to exercise all or part of the holder's vested options, or to satisfy withholding tax liabilities, by tendering shares of our common stock already owned by the option holder for at least six months (or another period consistent with the applicable accounting rules) with a fair market value equal to the exercise price.
Stock Appreciation Rights. The plan administrator may also grant stock appreciation rights, which will be exercisable upon the occurrence of certain contingent events. Stock appreciation rights are a variable component of compensation designed to retain key employees. Stock appreciation rights entitle the holder upon exercise to receive an amount in any combination of cash and shares of our common stock (as determined by the plan administrator) equal in value to the excess of the fair market value of the shares covered by the stock appreciation rights over the exercise price of the right.
Restricted Stock. The plan administrator may also grant restricted stock, which are awards of our shares of common stock that vest in accordance with the terms and conditions established by the plan administrator. The plan administrator will determine in the award agreement whether the participant will be entitled to vote the shares of restricted stock and/or receive dividends on such shares. Restricted stock is a variable component of compensation also available to retain key employees when deemed appropriate.
Restricted Stock Units. Restricted stock units represent the right to receive shares of our common stock at a specified date in the future, subject to forfeiture of such right. If the restricted stock unit has not been forfeited, then on the date specified in the restricted stock unit grant, the Company must deliver to the holder of the restricted stock unit, unrestricted shares of our common stock, which will be freely transferable. Restricted stock units are a variable component of compensation also designed to retain key employees when deemed appropriate.
Performance-Based Awards. Performance-based awards are denominated in shares of our common stock, stock units, or cash, and are linked to the satisfaction of performance criteria established by the
128
plan administrator. Performance-based awards are a variable component of compensation designed to reward key management for achieving annual performance goals. If the plan administrator determines that the performance-based award to an employee is intended to meet the requirements of "qualified performance-based compensation" and therefore may be deductible under Section 162(m) of the Internal Revenue Code, then the performance-based criteria upon which the awards will be based shall be with reference to any one or more of the following: earnings before interest and taxes; earnings before interest, taxes, depreciation and amortization; net operating profit after tax; cash flow; revenue; net revenues; sales; days sales outstanding; scrap rates; income; net income; operating income; net operating income, operating margin; earnings; earnings per share; return on equity; return on investment; return on capital; return on assets; return on net assets; total stockholder return; economic profit; market share; appreciation in the fair market value, book value or other measure of value of the company's common stock; expense/cost control; working capital; volume/production; new products; customer satisfaction; brand development; employee retention or employee turnover; employee satisfaction or engagement; environmental, health, or other safety goals; individual performance; strategic objective milestones; days inventory outstanding; or any combination of, or a specified increase in, any of the foregoing.
Change in Control Provisions. In connection with the grant of an award, the plan administrator may provide for the treatment of such award in the event of a change in control of the Company, including that, in the event of an involuntary termination of an executive's employment by the company in connection with a change in control, any outstanding awards that are unexercisable or otherwise unvested will become fully vested and/or immediately exercisable.
Amendment and Termination. Our board of directors may alter, amend, modify, or terminate the Omnibus Plan at any time, provided that the approval of our stockholders will be obtained for any amendment to the Omnibus Plan that requires stockholder approval under the rules of the stock exchange(s) on which our common stock is then listed or in accordance with other applicable law, including, but not limited to, an increase in the number of shares of our common stock reserved for issuance, a reduction in the exercise price of options or other entitlements, an extension of the maximum term of any award, an increase to the maximum number of shares that may be issued to insiders (as defined in the Toronto Stock Exchange Company Manual for the purpose of security-based compensation arrangements) or an amendment that grants our board of directors additional powers to amend the Omnibus Plan. In addition, no modification of an award will, without the prior written consent of the participant, materially impair any rights or obligations under any award already granted under the Omnibus Plan unless the board expressly reserved the right to do so at the time of the award.
Compliance with Applicable Laws. We intend to to structure the Omnibus Plan so that we can grant stock options and other performance-based awards that may qualify for an exemption from the deduction limitation contained in Section 162(m) of the Internal Revenue Code, to the extent that Section 162(m) is applicable. Awards under our Omnibus Plan shall be designed, granted, and administered in such a manner that they are either exempt from the application of, or comply with, the requirements of Section 409A of the Internal Revenue Code.
Appointment of New CFO
We entered into an employment agreement with David Brush effective June 22, 2015 to serve as our Chief Financial Officer. The initial term of the employment agreement is five years, plus automatic one-year renewals thereafter unless either party provides notice of intent not to renew the agreement. The agreement provides for an initial base salary of $450,000 per year plus an annual target incentive award equal to 50% of his base salary, with a pro-rated incentive award for 2015. Mr. Brush also
129
received an award of 147,664 restricted shares of common stock that vests in three annual installments in June of 2016, 2017 and 2018 subject to his continued employment.
Mr. Brush would be entitled to severance benefits if his employment terminates under certain circumstances. In the event of a termination of employment by us without "Cause," Mr. Brush's resignation of employment for "Good Reason" (each as defined in the agreement), or our failure to renew the agreement upon its expiration, Mr. Brush would be entitled to continued monthly payments of his base salary and 1/12th of his estimated annual bonus for a period of 12 months, continued vesting of his restricted share award for 12 months and pro rata vesting of any other outstanding equity or long-term incentive awards. In the event that Mr. Brush's employment terminates due to his death or "Disability" (as defined in the agreement), he or his estate would be entitled to continued monthly payments of base salary and 1/12th of his estimated annual bonus, prorated for the portion of the calendar year during which Mr. Brush was employed by us, for a period of 12 months, continued vesting of his restricted share award for 12 months and pro rata vesting of any other outstanding equity or long-term incentive awards.
Mr. Brush is subject to certain restrictive covenants, including non-competition and non-solicitation of Company employees and customers obligations, during the term and for a period of one year following any termination of his employment with the Company.
Mr. Brush was hired in June 2015 and was not an executive officer in 2014; however, based on the terms of his employment agreement, the estimated payments to him for a termination by us without "Cause," a resignation by him for "Good Reason," our failure to renew the agreement or a termination due to his death or "Disability" would be approximately equal to 11/2 times his annual base salary rate of $450,000.
130
STRUCTURE AND FORMATION OF OUR COMPANY
CPI Card Group Inc. was formed as CPI Holdings I, Inc. under the laws of Delaware, United States on June 4, 2007 in connection with the initial investment in our business by the Tricor Funds. We changed our name to CPI Card Group Inc. in August 2015. Our registered office is located at 1209 Orange Street, Wilmington, Delaware 19801 and our head office is located at 10368 West Centennial Road Littleton, Colorado 80127. We are a holding company and through our subsidiaries, we operate the Financial Payment Card business described in this prospectus. Since incorporation, there have been a number of amendments to our certificate of incorporation and the bylaws. Prior to the closing of the offering, we anticipate further amending our certificate of incorporation and bylaws as described in "Description of Capital Stock". The following diagram illustrates our ownership structure following the completion of this offering. All subsidiaries are wholly-owned.
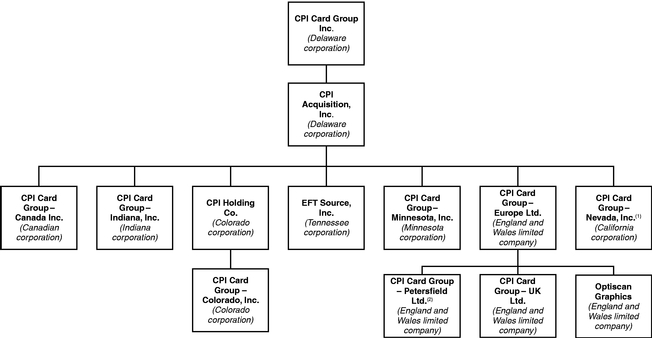
- (1)
- In
January 2015, we sold all of our business operations conducted at CPI Card Group-Nevada, Inc. See "Management's Discussion
and Analysis of Financial Condition and Results of Operations—Trends and Key Factors Affecting our Financial Performance—Discontinued Operation and Disposition."
- (2)
- As of July 2015, we ceased operations at our Petersfield facility. See "Management's Discussion and Analysis of Financial Condition and Results of Operations—Segment Overview."
131
CERTAIN RELATIONSHIPS AND RELATED PARTY TRANSACTIONS
The following is a description of transactions since January 1, 2012 to which we have been a party in which the amount involved exceeded or will exceed $120,000 within any fiscal year and in which any of our directors, executive officers, beneficial holders of more than 5% of our capital stock or entities affiliated with them had or will have a direct or indirect material interest.
Stockholders Agreement
The Company is party to a Stockholders Agreement with the Tricor Funds and the other holders of the Company's common and preferred stock. The Stockholders Agreement sets forth certain rights and obligations of the Company's stockholders with respect to the Company's board of directors, share transfer restrictions, sale transactions and stock issuances and repurchases. The Stockholders Agreement will be terminated in connection with this offering.
Sales of our Securities
We sold the following capital stock to our directors, officers and holders of 5% or more of our outstanding capital stock, and their respective affiliates, in private transactions on the dates set forth below.
Stockholder
|
Shares of Common Stock |
Shares of Preferred Stock |
Date of Purchase |
Total Purchase Price |
||||||||
|---|---|---|---|---|---|---|---|---|---|---|---|---|
Anna Rossetti |
66,000 | — | 1/6/2012 | $ | 30 | |||||||
William Dinker |
205,238 | 438 | 9/2/2014 | $ | 3,984,354 | |||||||
Nicholas Cahn |
270,116 | 107 | 1/4/2012 | $ | 181,114 | |||||||
132
Preferred Stock Redemptions
We redeemed shares of preferred stock held by our directors, executive officers and 5% stockholders on the dates set forth below.
Stockholder
|
Shares of Preferred Stock Redeemed |
Date of Redemption |
Aggregate Redemption Payment |
||||||
|---|---|---|---|---|---|---|---|---|---|
Tricor Pacific Capital Partners (Fund IV), Limited Partnership |
5,364 | 11/12/2012 | $ | 14,386,677 | |||||
|
4,207 | 12/26/2012 | $ | 11,514,727 | |||||
|
35,510 | 8/17/2015 | $ | 157,902,317 | |||||
Tricor Pacific Capital Partners (Fund IV) US, Limited Partnership |
3,167 |
11/12/2012 |
$ |
8,494,147 |
|||||
|
2,484 | 12/26/2012 | $ | 6,798,807 | |||||
|
20,961 | 8/17/2015 | $ | 93,207,279 | |||||
Steven Montross |
84 |
11/12/2012 |
$ |
225,295 |
|||||
|
66 | 12/26/2012 | $ | 180,645 | |||||
|
556 | 8/17/2015 | $ | 2,472,365 | |||||
Jerry Dreiling |
8 |
11/12/2012 |
$ |
21,457 |
|||||
|
7 | 12/26/2012 | $ | 19,159 | |||||
|
56 | 8/17/2015 | $ | 249,015 | |||||
William Dinker |
421 |
8/17/2015 |
$ |
1,872,061 |
|||||
Nicholas Cahn |
12 |
11/12/2012 |
$ |
32,185 |
|||||
|
10 | 12/26/2012 | $ | 27,370 | |||||
|
82 | 8/17/2015 | $ | 364,629 | |||||
Robert Pearce |
102 |
11/12/2012 |
$ |
273,572 |
|||||
|
80 | 12/26/2012 | $ | 218,963 | |||||
|
679 | 8/17/2015 | $ | 3,019,309 | |||||
Robert Clarke |
236 |
11/12/2012 |
$ |
632,971 |
|||||
|
185 | 12/26/2012 | $ | 506,352 | |||||
|
1,565 | 8/17/2015 | $ | 6,959,086 | |||||
James Galliher |
270 |
11/12/2012 |
$ |
724,162 |
|||||
|
212 | 12/26/2012 | $ | 580,252 | |||||
|
1,789 | 8/17/2015 | $ | 7,955,146 | |||||
Each of Messrs. Seaman, Peters and Rowntree, members of our Board of Directors, has an indirect pecuniary interest in the shares of common stock held by the Tricor Funds through their investments in the Tricor Funds.
133
Loans to Executive Officers
In connection with investments in shares of our common and preferred stock by certain of our executive officers, we have made loans to such officers to fund the purchase of shares. In connection with the redemption transactions described above, the executive officers have made partial repayments of these loans. Each of the loans to our executive officers was repaid in full in August 2015.
Executive Officer
|
Aggregate Principal Amount of Loan |
Principal Outstanding as of June 30, 2015 |
Interest Rate | |||||
|---|---|---|---|---|---|---|---|---|
Steven Montross |
$ | 225,574 | $ | 49,277 | 5% per annum | |||
Jerry Dreiling |
$ | 37,056 | $ | 19,333 | 5% per annum | |||
Acquisition of EFT Source, Inc.
On September 2, 2014, we acquired all of the outstanding capital stock of EFT Source. One of our executive officers, William Dinker, together with trusts for the benefit of certain of his family members, owned approximately 75% of EFT Source. Mr. Dinker did not have any relationship with the Company at the time of the acquisition. The purchase price for the acquisition of EFT Source was $68.9 million, consisting of $54.9 million in cash, a $9.0 million subordinated unsecured promissory note (the "Seller Note") and the issuance of $5.0 million of the Company's preferred and common stock. The Seller Note bears interest at a rate of 5% per annum and matures on the earlier of (i) September 2, 2016, (ii) twelve months following the consummation of an initial public offering or (iii) the occurrence of certain change of control events.
In connection with the EFT Source acquisition, we entered into an Employment and Non-Competition Agreement with Mr. Dinker. Pursuant to this agreement, if EFT Source achieves certain EBITDA targets prior to December 31, 2016, Mr. Dinker will be entitled to bonus payments in an amount up to $666,667.
Lease of Indiana Facility
We lease our Fort Wayne, Indiana facility from an entity owned by James Galliher, a stockholder and member of our board of directors who resigned from our board in August 2015. We paid $175,000 under the lease for each of the years ended December 31, 2012, 2013 and 2014.
Registration Rights Agreement
In connection with this offering, we intend to enter into a registration rights agreement with the Tricor Funds (the "Registration Rights Agreement"). Under the Registration Rights Agreement, the Tricor Funds will be entitled to request that we register shares of our common stock on a long-form or short-form registration statement on one or more occasions in the future, provided that we will not be obligated to register such shares within 90 days after the effective date of a registration statement previously filed pursuant to a request under the Registration Rights Agreement and otherwise for up to 60 days from the date of a request under the Registration Rights Agreement in certain circumstances. The Tricor Funds will also be entitled to participate in certain registered offerings that we may conduct in the future, subject to certain restrictions. However, subject to limited exceptions described in "Underwriting," the Tricor Funds may not sell shares of our common stock or otherwise exercise its demand rights under the Registration Rights Agreement for a period of 180 days after the date of the closing of this offering without the prior written consent of the Representatives (as defined below), on behalf of the underwriters. See "Underwriting." We will pay the Tricor Funds' expenses in connection with the exercise of these rights.
134
The registration rights described in this paragraph apply to (i) shares of our common stock held by the Tricor Funds as of the closing of this offering, (ii) any of our capital stock (or that of our subsidiaries) issued or issuable with respect to the common stock described in clause (i) with respect to any dividend, distribution, recapitalization, reorganization, or certain other corporate transactions, and (iii) any of our common stock owned or acquired following the closing of this offering by the Tricor Funds ("Registrable Securities"). These registration rights are also for the benefit of any subsequent holder of Registrable Securities; provided that any particular securities will cease to be Registrable Securities when they have been sold in a registered public offering, sold in compliance with Rule 144 under the Securities Act or repurchased by us or our subsidiaries. A copy of the Registration Rights Agreement is included as exhibit 10.11 to the registration statement of which this prospectus forms a part, and this description of the terms of the Registration Rights Agreement is qualified in its entirety by reference to the full text of such agreement.
Nomination of our Directors
In connection with this offering, we will enter into a Director Nomination Agreement with the Tricor Funds that provides the Tricor Funds the right to designate nominees for election to our board of directors for so long as the Tricor Funds collectively beneficially own 5% or more of the total number of shares of our common stock then outstanding. The number of nominees that the Tricor Funds are entitled to designate under the Director Nomination Agreement will bear the same proportion to the total number of members of our board of directors as the number of shares of common stock beneficially owned by the Tricor Funds bears to the total number of shares of common stock outstanding, rounded up to the nearest whole number. In addition, the Tricor Funds shall be entitled to designate the replacement for any of its board designees whose board service terminates prior to the end of such designee's term regardless of the Tricor Funds' beneficial ownership at such time. In addition, for so long as the Tricor Funds collectively beneficially own 10% or more of the total number of shares of our common stock then outstanding, the Tricor Funds shall also have the right to have their designees participate on committees of our board of directors, subject to compliance with applicable law and stock exchange rules. The Director Nomination Agreement will terminate at such time as the Tricor Funds collectively own less than 5% of our outstanding common stock.
A copy of the Director Nomination Agreement is included as exhibit 10.10 to the registration statement of which this prospectus forms a part, and this description of the terms of the Director Nomination Agreement is qualified in its entirety by reference to the full text of such agreement.
Policies and Procedures for Related Party Transactions
In connection with this offering, our board of directors will adopt a written related party transaction policy setting forth the policies and procedures for the review and approval of related party transactions. The policy will cover transactions involving us in which the aggregate amount involved exceeds or may be expected to exceed $120,000 and in which a related person has or will have a direct or indirect material interest. For purposes of this policy, a related person will be defined as a director, executive officer, nominee for director, or a greater than 5% beneficial owner of our common stock, in each case since the beginning of the most recently completed fiscal year, and any immediate family member of or person sharing a household with any of these individuals. All related party transactions must be presented to the Audit Committee for review, consideration and approval. In approving or rejecting any such proposed transaction, the Audit Committee will consider the material facts of the transaction, including whether the transaction is on terms no less favorable than terms generally available to an unaffiliated third party under the same or similar circumstances and the extent of the related party's interest in the transaction.
All related party transactions described in this section were not subject to the approval and review procedures set forth in such policy.
135
PRINCIPAL AND SELLING STOCKHOLDERS
The following table sets forth information regarding the beneficial ownership of our common stock as of October 5, 2015 and the anticipated beneficial ownership percentages immediately following this offering, by:
- •
- each person who is known by us to beneficially own more than 5% of our outstanding common stock,
- •
- each individual who will be a director or named executive officer at the time of this offering;
- •
- all directors and executive officers as a group; and
- •
- each selling stockholder.
Each stockholder's percentage ownership before the offering is based on 41,476,116 shares of our common stock outstanding as of October 5, 2015. Each stockholder's percentage ownership after the offering is based on 53,692,116 shares of our common stock outstanding immediately after the completion of this offering.
Beneficial ownership for the purposes of the following table is determined in accordance with the rules and regulations of the SEC. These rules generally provide that a person is the beneficial owner of securities if such person has or shares the power to vote or direct the voting thereof, or to dispose or direct the disposition thereof or has the right to acquire such powers within 60 days. Common stock subject to options that are currently exercisable or exercisable within 60 days of October 5, 2015 are deemed to be outstanding and beneficially owned by the person holding the options. These shares, however, are not deemed outstanding for the purposes of computing the percentage ownership of any other person. Percentage of beneficial ownership is based on 41,476,116 shares of common stock outstanding as of October 5, 2015 and 53,692,116 shares of common stock to be outstanding after the completion of this offering. Except as disclosed in the footnotes to this table and subject to applicable community property laws, we believe that each stockholder identified in the table possesses sole voting and investment power over all shares of common stock shown as beneficially owned by the stockholder.
136
Unless otherwise specified in the footnotes, the address of each beneficial owner listed in the table below is c/o CPI Card Group Inc., 10368 West Centennial Road, Littleton, Colorado 80127.
| |
|
|
|
Beneficially Owned Following the Offering |
||||||||||||||||||
|---|---|---|---|---|---|---|---|---|---|---|---|---|---|---|---|---|---|---|---|---|---|---|
| |
|
|
|
Assuming No Exercise of Underwriters' Option |
Assuming Full Exercise of Underwriters' Option |
|||||||||||||||||
| |
Beneficially Owned Before the Offering |
|
||||||||||||||||||||
| |
Shares of Common Stock Offered |
|||||||||||||||||||||
Name and Address of Beneficial Owners
|
Number of Shares |
Percent | Number of Shares |
Percent | Number of Shares |
Percent | ||||||||||||||||
5% Stockholders: |
||||||||||||||||||||||
Tricor Pacific Capital Partners (Fund IV), Limited Partnership(1) |
21,816,366 | 52.6 | % | 1,912,331 | 19,904,035 | 37.1 | % | 18,623,661 | 34.7 | % | ||||||||||||
Tricor Pacific Capital Partners (Fund IV) US, Limited Partnership(1) |
12,877,370 | 31.1 | % | 1,128,776 | 11,748,594 | 21.9 | % | 10,992,838 | 20.5 | % | ||||||||||||
Named Executive Officers and Directors: |
||||||||||||||||||||||
Steven Montross |
1,607,034 | 3.9 | % | 140,866 | 1,466,168 | 2.7 | % | 1,371,854 | 2.6 | % | ||||||||||||
Anna Rossetti |
66,000 | * | — | 66,000 | * | 66,000 | * | |||||||||||||||
Robert Pearce |
415,646 | 1.0 | % | 36,434 | 379,212 | * | 354,819 | * | ||||||||||||||
Nicholas Peters(1) |
— | — | — | — | — | — | — | |||||||||||||||
David Rowntree(1) |
— | — | — | — | — | — | — | |||||||||||||||
Bradley Seaman(1) |
— | — | — | — | — | — | — | |||||||||||||||
All Executive Officers and Directors as a Group (11 persons) |
3,119,886 |
7.5 |
% |
250,890 |
2,868,996 |
5.3 |
% |
2,701,016 |
5.0 |
% |
||||||||||||
Other Selling Stockholders: |
||||||||||||||||||||||
Robert Clarke |
1,181,246 | 2.9 | % | 103,543 | 1,077,703 | 2.0 | % | 1,008,377 | 1.9 | % | ||||||||||||
Hayley C. Clarke 2008 Imagine Trust(2) |
14,300 | * | 1,253 | 13,047 | * | 12,207 | * | |||||||||||||||
McKenzie A. Clarke 2008 Imagine Trust(2) |
14,300 | * | 1,253 | 13,047 | * | 12,207 | * | |||||||||||||||
Tyler L. Clarke 2008 Imagine Trust(2) |
14,300 | * | 1,253 | 13,047 | * | 12,207 | * | |||||||||||||||
James Galliher |
1,067,990 | 2.6 | % | 93,615 | 974,375 | 1.8 | % | 911,696 | 1.7 | % | ||||||||||||
Jerry Dreiling |
364,188 | * | 31,923 | 332,265 | * | 310,891 | * | |||||||||||||||
Nicholas Cahn |
270,116 | * | 23,677 | 246,439 | * | 230,586 | * | |||||||||||||||
Paul Boge |
230,296 | * | 20,187 | 210,109 | * | 196,593 | * | |||||||||||||||
Docia Myer |
210,650 | * | 18,465 | 192,185 | * | 179,823 | * | |||||||||||||||
William Dinker(3) |
205,238 | * | 17,990 | 187,248 | * | 175,203 | * | |||||||||||||||
Mary Martinez |
199,430 | * | 199,430 | — | — | — | — | |||||||||||||||
Andrew Sappenfield |
191,158 | * | 16,756 | 174,402 | * | 163,183 | * | |||||||||||||||
9074-1448 Quebec Inc.(4) |
125,532 | * | 11,004 | 114,528 | * | 107,161 | * | |||||||||||||||
Diane Jackson |
123,112 | * | 10,791 | 112,321 | * | 105,095 | * | |||||||||||||||
David Ogonowski |
56,430 | * | 4,946 | 51,484 | * | 48,172 | * | |||||||||||||||
Eric Savoy |
56,430 | * | 4,946 | 51,484 | * | 48,172 | * | |||||||||||||||
Katherine Nevill(3) |
35,618 | * | 3,122 | 32,496 | * | 30,406 | * | |||||||||||||||
Tom Hedrich(3) |
16,412 | * | 1,439 | 14,973 | * | 14,010 | * | |||||||||||||||
- *
- Less than 1.0%
137
- (1)
- Each
of the Tricor Funds is managed by Tricor Pacific Capital Partners (Fund IV), ULC, as the general partner. Mr. Seaman,
Mr. Rowntree, J. Trevor Johnstone and Roderick Senft are the sole members of an investment committee of the Tricor Funds that has the power to vote or dispose of the shares held by the
Tricor Funds. Each of Messrs. Seaman, Peters and Rowntree is an officer or member of Tricor and has an indirect pecuniary interest in the shares of common stock held by the Tricor Funds through
their respective interests in the Tricor Funds. Each of Messrs. Seaman, Peters and Rowntree expressly disclaims any beneficial ownership of any shares of common stock held by the Tricor Funds.
The address of the Tricor Funds is c/o Tricor Pacific Capital, One Westminster Place, Suite 100, Lake Forest, Illinois 60045.
- (2)
- Trusts
for the benefit of the children of Robert Clarke.
- (3)
- Each
of Mr. Dinker, Ms. Nevill and Mr. Hedrich acquired their shares of common stock in September 2014 in connection with
the Company's acquisiton of EFT Source.
- (4)
- This entity is owned by Benoit and Corinne Guez.
138
DESCRIPTION OF CERTAIN INDEBTEDNESS
On August 17, 2015, we, our subsidiary, CPI Acquisition, Inc., as borrower, and our principal domestic operating subsidiaries, CPI Card Group—Minnesota, Inc., CPI Holding Co., CPI Card Group—Colorado, Inc., CPI Card Group—Indiana, Inc., EFT Source, Inc., and CPI Card Group—Nevada, Inc., as guarantors, entered into the New Credit Agreement with a syndicate of lenders providing for the New Revolving Credit Facility and the New Term Loan Facility. As of August 17, 2015, the aggregate principal balance of the New Term Loan Facility totaled $435.0 million and the aggregate commitments under the New Revolving Credit Facility totaled $40.0 million. As of August 17, 2015, we did not have any outstanding revolving loans other than outstanding letters of credit of approximately $100,000, which reduced our borrowing capacity under our New Revolving Credit Facility by an equivalent amount.
The New Term Loan Facility and New Revolving Credit Facility mature on August 17, 2022 and August 17, 2020, respectively. The loans under our New Credit Facility are required to be prepaid in advance of the maturity date upon the occurrence of certain customary events. We are also required to prepay at least $75.0 million of the New Term Loan Facility upon the closing of this offering.
Our New Credit Facility is secured by a first-priority security interest in substantially all of our assets constituting equipment, inventory, receivables, cash and other personal property. Such security excludes certain specified assets, as more fully set forth in the collateral agreement under our New Credit Facility.
Interest rates under our New Credit Facility are based, at our election, on either a Eurodollar rate plus a margin of 4.50% or a base rate plus a margin of 3.50%. Letters of credit are subject to a 0.125% fronting fee payable to the issuing bank and a fee payable to the revolving lenders equal to the margin applicable to Eurodollar revolving loans. In addition, we are required to pay an unused commitment fee ranging from 0.50% per annum to 0.375% per annum of the average unused portion of the revolving commitments. The unused commitment fee is determined on the basis of a grid that results in a lower unused commitment fee as our total net leverage ratio declines.
Our New Credit Facility contains customary covenants, including among other things, restrictions on indebtedness, issuance of liens, investments, dividends, redemptions and other distributions to equityholders, asset sales, certain mergers or consolidations, sales, transfers, leases or dispositions of substantially all of our assets, and affiliate transactions. The restrictions on dividends, redemptions and other distributions to equityholders contained in our New Credit Facility are subject to certain exceptions.
Our New Credit Facility also contains a requirement that, as of the last day of any fiscal quarter, if the amount we have drawn under the New Revolving Credit Facility is greater than 50% of the aggregate principal amount of all commitments of the lenders thereunder, we maintain a first lien net leverage not in excess of 7.0x.
139
The following is a summary of our capital stock and provisions of our amended and restated certificate of incorporation and our amended and restated bylaws, as each will be in effect prior to the closing of this offering, and certain provisions of Delaware law. This summary does not purport to be complete and is qualified in its entirety by the provisions of our amended and restated certificate of incorporation (the "certificate of incorporation") and amended and restated bylaws (the "bylaws"), copies of which have been or will be filed with the SEC as exhibits to the registration statement of which this prospectus is a part. References in this section to the "Company," "we" "us" and "our" refer to CPI Card Group Inc. and not to any of its subsidiaries.
General
The total amount of our authorized capital stock will consist of 100,000,000 shares of common stock, $0.001 par value, of which 41,476,116 shares of common stock are outstanding as of the date of this prospectus, and 200,000 shares of preferred stock, $0.001 par value. As of September 21, 2015, we had 27 holders of record of our common stock. As of September 21, 2015, after giving effect to the issuance and sale of shares of common stock in this offering and the use of proceeds therefrom, we will have 53,692,116 shares of common stock outstanding and no shares of preferred stock outstanding.
Common Stock
Holders of common stock are entitled to one vote for each share held on all matters subject to a vote of stockholders, subject to the rights of holders of any outstanding preferred stock. Accordingly, holders of a majority of the shares of common stock entitled to vote in any election of directors may elect all of the directors standing for election, subject to the rights of holders of any outstanding preferred stock. Holders of common stock will be entitled to receive ratably any dividends that the board of directors may declare out of funds legally available therefor, subject to any preferential dividend rights of outstanding preferred stock. Upon our liquidation, dissolution or winding up, the holders of common stock will be entitled to receive ratably our net assets available after the payment of all debts and other liabilities and subject to the prior rights of holders of any outstanding preferred stock. Holders of common stock have no preemptive, subscription, redemption or conversion rights. There are no redemption or sinking fund provisions applicable to the common stock. All outstanding shares of our capital stock are fully paid and nonassessable, and the shares of common stock to be issued upon the closing of this offering will be fully paid and nonassessable.
Preferred Stock
The board of directors, without further approval of the stockholders, will be authorized to fix the number of shares constituting any series, as well as the dividend rights and terms, conversion rights and terms, voting rights and terms, redemption rights and terms, liquidation preferences and any other rights, preferences, privileges and restrictions applicable to each series of preferred stock. The issuance of preferred stock, while providing flexibility in connection with possible acquisitions and other corporate purposes, could also adversely affect the voting power and dividend and liquidation rights of the holders of common stock. The issuance of preferred stock could also, under certain circumstances, have the effect of making it more difficult for a third-party to acquire, or discouraging a third-party from acquiring, a majority of our outstanding voting stock or otherwise adversely affect the market price of our common stock. It is not possible to state the actual effect of the issuance of any shares of preferred stock on the rights of holders of common stock until the board of directors determines the specific rights of that series of preferred stock.
140
Elimination of Liability in Certain Circumstances
Our certificate of incorporation eliminates the liability of our directors to us or our stockholders for monetary damages resulting from breaches of their fiduciary duties as directors. Directors will remain liable for breaches of their duty of loyalty to us or our stockholders, as well as for acts or omissions not in good faith or that involve intentional misconduct or a knowing violation of law, and transactions from which a director derives improper personal benefit. Our certificate of incorporation will not absolve directors of liability for payment of dividends or stock purchases or redemptions by us in violation of Section 174 (or any successor provision of the Delaware General Corporation Law).
The effect of this provision is to eliminate the personal liability of directors for monetary damages for actions involving a breach of their fiduciary duty of care, including any such actions involving gross negligence. We do not believe that this provision eliminates the liability of our directors to us or our stockholders for monetary damages under the federal securities laws. The certificate of incorporation and by-laws provide indemnification for the benefit of our directors and officers to the fullest extent permitted by the Delaware General Corporation Law as it may be amended from time to time, including most circumstances under which indemnification otherwise would be discretionary.
Corporate Opportunity
Messrs. Seaman, Peters and Rowntree, who are officers or members of Tricor, serve on our board of directors. The Tricor Funds and entities controlled by them may hold equity interests in entities that directly or indirectly compete with us, and companies in which they currently invest may begin competing with us. As a result of these relationships, when conflicts between the interests of Tricor, on the one hand, and of other stockholders, on the other hand, arise, these directors may not be disinterested. Although our directors and officers have a duty of loyalty to us under Delaware law and our certificate of incorporation, transactions that we enter into in which a director or officer has a conflict of interest are generally permissible so long as (1) the material facts relating to the director's or officer's relationship or interest as to the transaction are disclosed to our board of directors and a majority of our disinterested directors approves the transaction, (2) the material facts relating to the director's or officer's relationship or interest as to the transaction are disclosed to our stockholders and a majority of our disinterested stockholders approve the transaction or (3) the transaction is otherwise fair to us. Our certificate of incorporation also provides that any principal, officer, member, manager and/or employee of the Tricor Funds or any entity that controls, is controlled by or under common control with, the Tricor Funds (other than the Company or any company that is controlled by the Company) or any investment funds managed by Tricor will not be required to offer any transaction opportunity of which they become aware to us and could take any such opportunity for themselves or offer it to other companies in which they have an investment.
Anti-Takeover Effects of Delaware Law and our Certificate of Incorporation and Bylaws
Our certificate of incorporation and bylaws also contain provisions that may delay, defer or discourage hostile takeovers, or changes in control or management of our company. These provisions, which are summarized below, are designed to encourage persons seeking to acquire control of us to first negotiate with our board of directors, which we believe may result in an improvement of the terms of any such acquisition in favor of our stockholders. However, they also give our board of directors the power to discourage acquisitions that some stockholders may favor.
Undesignated Preferred Stock
The ability to authorize undesignated preferred stock will make it possible for our board of directors to issue preferred stock with super voting, special approval, dividend or other rights or
141
preferences on a discriminatory basis that could impede the success of any attempt to acquire us. See "—Preferred Stock" above.
Removal of Directors
Under our certificate of incorporation, on and after the date that the Tricor Funds and their affiliates cease to beneficially own a majority of the voting power of our then outstanding capital stock entitled to vote generally in the election of directors (the "Trigger Date"), our directors may only be removed for cause and only upon the affirmative vote of 75% of our outstanding voting stock, at a meeting of our stockholders called for that purpose.
Special Meetings of Stockholders
Our certificate of incorporation provides that special meetings of our stockholders may be called only upon a resolution approved by a majority of the total number of directors that we would have if there were no vacancies on our board of directors or, prior to the Trigger Date, at the request of the holders of a majority of the voting power of our then outstanding shares of voting capital stock.
Requirements for Nominations and Proposals at Stockholder Meetings
Our bylaws prohibit the conduct of any business at a special meeting other than as specified in the notice for such meeting. Our bylaws also provide that nominations of persons for election to our board of directors may be made at annual and special meetings of stockholders at which directors are to be elected pursuant to the notice of meeting (1) by or at the direction of our board of directors or (2) provided that our board of directors has determined that directors shall be elected at such meeting, by any stockholder who (i) is a stockholder of record at the time the notice is delivered, on the record date for the determination of stockholders entitled to vote at the meeting and on the date of the meeting, (ii) is entitled to vote at the meeting and upon such election and (iii) complies with the notice procedures set forth in our bylaws. These provisions do not apply to nominations by the Tricor Funds pursuant to the Director Nomination Agreement.
Stockholder Action by Written Consent
Pursuant to Section 228 of the DGCL, any action required to be taken at any annual or special meeting of the stockholders may be taken without a meeting, without prior notice and without a vote if a consent or consents in writing, setting forth the action so taken, is signed by the holders of outstanding stock having not less than the minimum number of votes that would be necessary to authorize or take such action at a meeting at which all shares of our stock entitled to vote thereon were present and voted, unless a company's certificate of incorporation provides otherwise. Our certificate of incorporation provides that, prior to the Trigger Date, any action required or permitted to be taken by our stockholders may be effected by written consent. However, from and after the Trigger Date, any action required or permitted to be taken by the stockholders may be effected only at a duly called annual or special meeting.
Business Combinations with Interested Stockholders
We have elected in our certificate of incorporation not to be subject to Section 203 of the DGCL, an anti-takeover law. In general, Section 203 prohibits a publicly held Delaware corporation from engaging in a business combination, such as a merger, with a person or group owning 15% or more of the corporation's voting stock for a period of three years following the date the person became an interested stockholder, unless (with certain exceptions) the business combination or the transaction in which the person became an interested stockholder is approved in a prescribed manner. Accordingly, we are not subject to any anti-takeover effects of Section 203. However, our certificate of incorporation
142
contains provisions that have the same effect as Section 203, except that they provide that (i) Tricor and any of its affiliates or associates, including any investment funds managed by Tricor, (ii) any other person with whom any of the foregoing are acting as a group or in concert for the purpose of acquiring, holding, voting or disposing of shares of our stock and (iii) any person who would otherwise be an interested stockholder because of a transfer of 5% or more of our outstanding voting stock by any person described in clause (i) or (ii) to such person are excluded from the "interested stockholder" definition in our certificate of incorporation and are therefore not subject to the restrictions therein that have the same effect as Section 203.
Requirements for Amendments to our Bylaws and Certificate of Incorporation
Our certificate of incorporation provides that, prior to the Trigger Date, our bylaws may be adopted, amended, altered or repealed by the vote of a majority of the voting power of our then outstanding voting stock, voting together as a single class. After the Trigger Date, our bylaws may be adopted, amended, altered or repealed by either (i) a vote of a majority of the total number of directors that would be on our board of directors if there were no vacancies or (ii) in addition to any vote otherwise required by law, the affirmative vote of the holders of at least 662/3% of the voting power of our then outstanding capital stock entitled to vote generally in the election of directors, voting together as a single class.
Following the Trigger Date, the provisions of our certificate of incorporation relating to the size and composition of our board of directors, limitation on liabilities of directors, stockholder action by written consent, the ability of stockholders to call special meetings, business combinations with interested persons, amendment of our bylaws or certificate of incorporation and the Court of Chancery as the exclusive forum for certain disputes, may only be amended, altered, changed or repealed by the affirmative vote of the holders of at least 662/3% of the voting power of all of our outstanding shares of our capital stock entitled to vote generally in the election of directors, voting together as a single class. Our certificate of incorporation provides that, prior to the Trigger Date, such provisions may be amended, altered, changed or repealed by the affirmative vote of the holders of a majority of the voting power of our then outstanding capital stock entitled to vote generally in the election of directors, voting together as a single class. Our certificate of incorporation also provides that the provision relating to corporate opportunity may only be amended, altered or repealed by a vote of 80% of the voting power of our then outstanding capital stock entitled to vote generally in the election of directors, voting together as a single class.
Authorized but Unissued Shares
The authorized but unissued shares of common stock will be available for future issuance without stockholder approval. These additional shares may be utilized for a variety of corporate purposes, including future public offerings to raise additional capital, corporate acquisitions and employee benefit plans. The existence of authorized but unissued shares of common stock could render it more difficult or discourage an attempt to obtain control of us by means of a proxy contest, tender offer, merger or otherwise.
Advance Notice Requirements for Stockholder Proposals and Nomination of Directors
Our by-laws provide that stockholders seeking to bring business before an annual meeting of stockholders, or to nominate candidates for election as directors at an annual meeting of stockholders, must provide timely notice in writing. To be timely, a stockholder's notice must be delivered to or mailed and received at our principal executive offices not less than 60 days nor more than 90 days prior to the anniversary date of the immediately preceding annual meeting of stockholders. However, in the event that the annual meeting is called for a date that is not within 30 days before or after such anniversary date, such notice will be timely only if received not later than the close of business on the
143
tenth day following the date on which notice of the date of the annual meeting was mailed to stockholders or made public, whichever first occurs. Our by-laws also specify requirements as to the form and content of a stockholder's notice.
Exchange Listing
It is a condition to the completion of this offering that our common stock be listed on the NASDAQ Global Select Market and the Toronto Stock Exchange. We have applied to list our common stock on the NASDAQ Global Select Market under the symbol "PMTS." We have been conditionally approved to list our common stock on the TSX under the symbol "PNT." Listing on the TSX will be subject to our fulfilling all of the listing requirements of the TSX.
Transfer Agent and Registrar
The transfer agent and registrar for our common stock is Wells Fargo Bank, N.A. The transfer agent's address is 1110 Centre Pointe Curve, Suite 101, Mendota Heights, Minnesota 55120, and its telephone number is 800-468-9716. The Canadian transfer agent acting as co-agent for our common stock is TMX Equity Transfer Services at 650 West Georgia Street, Suite 2700, Vancouver, BC V6B4N9, Canada.
Auditor
The Company's auditor is KPMG LLP. The auditor's address is 1225 17th St #800, Denver, Colorado 80202.
144
SHARES ELIGIBLE FOR FUTURE SALE
Prior to this offering, there has been no public market for our common stock. Future sales of substantial amounts of our common stock in the public market, or the perception that such sales may occur, could adversely affect the prevailing market price of our common stock. No prediction can be made as to the effect, if any, future sales of shares, or the availability of shares for future sales, will have on the market price of our common stock prevailing from time to time.
Rule 144
In general, under Rule 144 under the Securities Act ("Rule 144") as currently in effect, once we have been subject to public company reporting requirements under the Exchange Act for at least 90 days, a person who is not deemed to have been one of our affiliates for purposes of the Securities Act at any time during 90 days preceding a sale and who has beneficially owned the shares proposed to be sold for at least six months, including the holding period of any prior owner other than our affiliates, is entitled to sell such shares without complying with the manner of sale, volume limitation or notice provisions of Rule 144, subject to compliance with the public information requirements of Rule 144. If such a person has beneficially owned the shares proposed to be sold for at least one year, including the holding period of any prior owner other than our affiliates, then such person is entitled to sell such shares without complying with any of the requirements of Rule 144.
In general, under Rule 144, as currently in effect, our affiliates or persons selling shares on behalf of our affiliates are entitled to sell within any three-month period beginning 90 days after the date of this prospectus, a number of shares that does not exceed the greater of:
- •
- 1% of the number of shares of common stock then outstanding; or
- •
- the average weekly trading volume of the common stock during the four calendar weeks preceding the filing of a notice on Form 144 with respect to such sale.
Such sales under Rule 144 are also subject to prescribed requirements relating to the manner of sale, notice and availability of current public information about us.
Rule 701
Rule 701 generally allows a stockholder who purchased shares of our common stock pursuant to a written compensatory plan or contract and who is not deemed to have been one of our affiliates during the immediately preceding 90 days to sell such shares in reliance upon Rule 144, but without being required to comply with the public information, holding period, volume limitation or notice provisions of Rule 144. Rule 701 also permits our affiliates to sell their Rule 701 shares under Rule 144 without complying with the holding period requirements of Rule 144.
Stock Plans
We intend to file a registration statement on Form S-8 under the Securities Act covering all of the shares of our common stock reserved for issuance under the Omnibus Plan, which we intend to adopt in connection with this offering. We expect to file this registration statement as soon as practicable after this offering and adoption of the Omnibus Plan. Accordingly, shares registered under the registration statement on Form S-8 will be available for sale in the open market following its effective date, subject to any applicable vesting provisions and the Rule 144 limitations applicable to affiliates.
Lock-Up Agreements
In connection with this offering, we and our stockholders, our executive officers and directors (whose common stock represents all of our pre-offering shares) have entered into 180-day lock-up
145
agreements (except for Mr. Montross, who has entered into a one-year lock-up agreement) with the underwriters of this offering under which neither we nor they may, with limited exceptions, for a period of 180 days or one year, as applicable, after the date of this prospectus, directly or indirectly sell, dispose of or hedge any shares of common stock or any securities convertible into or exchangeable or exercisable for shares of common stock without the prior written consent of the Representatives (as defined below), on behalf of the underwriters.
Registration Rights
Upon completion of this offering, the Tricor Funds will be entitled to various rights with respect to the registration of the sale of shares of our common stock under the Securities Act. See "Certain Relationships and Related Party Transactions—Registration Rights Agreement."
146
BMO Capital Markets Corp., Goldman, Sachs & Co., CIBC World Markets Inc., Robert W. Baird & Co. Incorporated, William Blair & Company, L.L.C., Raymond James & Associates, Inc., Scotia Capital (USA) Inc. and Griffiths McBurney Corp. are acting as the underwriters of this offering, and BMO Capital Markets Corp., Goldman, Sachs & Co. and CIBC World Markets Inc., are acting as the representatives of the several underwriters (the "Representatives"). Subject to the terms and conditions stated in the underwriting agreement dated the date of this prospectus among us, the selling stockholders and the Underwriters, or the "Underwriting Agreement," each underwriter named below has severally agreed to purchase from us and the selling stockholders, and we and the selling stockholders have agreed to sell to each such underwriter, the respective number of shares of common stock shown opposite its name below at a price of $ per share by October 13, 2015, payable in cash against delivery. We will not receive any proceeds from the sale of shares by the selling stockholders.
Underwriter
|
Number of Shares of Common Stock | |||
|---|---|---|---|---|
BMO Capital Markets Corp. |
||||
Goldman, Sachs & Co. |
||||
CIBC World Markets Inc. |
||||
Robert W. Baird & Co. Incorporated |
||||
William Blair & Company, L.L.C. |
||||
Raymond James & Associates, Inc. |
||||
Scotia Capital (USA) Inc. |
||||
Griffiths McBurney Corp. |
||||
| | | | | |
| | | | | |
| | | | | |
Total |
16,000,000 | |||
This offering is being made concurrently in the United States and in each of the provinces and territories of Canada. The shares of common stock will be offered in the United States through those underwriters or their U.S. affiliates who are registered to offer the shares of common stock for sale in the United States, and in Canada through those underwriters or their Canadian affiliates who are registered to offer the shares of common stock for sale in applicable Canadian provinces or territories, and such other registered dealers as may be designated by the underwriters. Subject to applicable law, the underwriters may offer the shares of common stock outside of the United States and Canada.
The obligations of the underwriters under the Underwriting Agreement may be terminated at their discretion based on their assessment of the state of the financial markets and may also be terminated upon the occurrence of certain stated events. The underwriters are, however, obligated to take up and pay for all of the offered shares of common stock if any of the shares of common stock are purchased under the Underwriting Agreement. The Underwriting Agreement also provides that if an underwriter defaults, the purchase commitments of non-defaulting underwriters may also be increased or the offering may be terminated.
The underwriters propose to offer the shares of common stock directly to the public at the initial public offering price set forth on the cover page of this prospectus and to certain dealers at that price less a concession not in excess of $ per share. After the initial public offering of the shares of common stock, the offering price and other selling terms may be changed by the underwriters. After the underwriters have made a reasonable effort to sell the offered shares of common stock at the price of offering, the offering price may be decreased and may be further changed from time to time to an amount not greater than the offering price, and the compensation realized by those underwriters who sell their proportionate share of the shares offered at a reduced price will be decreased by the amount that the aggregate price paid by the purchasers for such offered shares is less than the price paid by the applicable underwriters.
147
The underwriters have an option to buy up to 2,400,000 additional shares of common stock from the selling stockholders at a price of $ per share to cover sales of shares of common stock by the underwriters which exceed the number of shares of common stock specified in the table above. The underwriters have 30 days from the closing date of this offering to exercise this overallotment option, in whole or from time to time in part. If any shares of common stock are purchased with this overallotment option, the underwriters will purchase shares of common stock in approximately the same proportion as shown in the table above. If any additional shares of common stock are purchased, the underwriters will offer the additional shares on the same terms as those on which the shares of common stock are being offered. We will not receive any proceeds from the exercise of the underwriters' overallotment option.
A purchaser who acquires shares of common stock forming part of the underwriters' overallotment position acquires such shares under this prospectus, regardless of whether the overallotment position is ultimately filled through the sales of shares of common stock by the selling stockholders upon exercise of the overallotment option or secondary market purchases. Any naked short position shall form part of the underwriters' overallotment position.
The following table shows the per share and total underwriters' commission to be paid to the underwriters, assuming both no exercise and full exercise of the underwriters' option to purchase additional shares of common stock.
| |
Per Share | Total | |||||||||||
|---|---|---|---|---|---|---|---|---|---|---|---|---|---|
| |
Without Over- Allotment |
With Over- Allotment |
Without Over- Allotment |
With Over- Allotment |
|||||||||
Public offering price |
$ | $ | $ | $ | |||||||||
Underwriters' commissions paid by us |
$ | $ | $ | $ | |||||||||
Underwriters' commissions paid by the selling stockholders |
$ | $ | $ | $ | |||||||||
The public offering price for our shares of common stock, wherever offered, is payable in U.S. dollars, except as may otherwise be agreed by the underwriters.
In addition to the underwriters' commissions, we are responsible for reimbursing certain expenses of the underwriters incurred in relation to this offering, including legal expenses and expenses related to road show and marketing activities subject to certain limitations described in the Underwriting Agreement. The maximum amount of such reimbursable expenses will be $1.25 million.
We have also granted BMO Nesbitt Burns Inc. a right of first refusal until March 13, 2016, to act as lead left manager and joint bookrunner of any initial public offering or private placement of securities by us or our subsidiaries, subject to certain exceptions.
We estimate that the total expenses of this offering to us, including registration, filing and listing fees, printing fees, and legal and accounting expenses, but excluding the underwriters' commission, will be approximately $5.0 million.
We and our stockholders, our executive officers and directors (whose common stock represents all of our pre-offering shares) have entered into lock-up agreements with the underwriters pursuant to which each of these persons or entities, with limited exceptions, for a period of 180 days (or, in the case of Mr. Montross, one year) after the date of the closing of this offering, may not, without the prior written consent of the Representatives, on behalf of the underwriters, (1) offer, pledge, sell, contract to sell, sell any option or contract to purchase, purchase any option or contract to sell, grant any option, right, or warrant to purchase, or otherwise transfer or dispose of, directly or indirectly, any of our shares or any securities convertible into or exercisable or exchangeable for our shares (including, without limitation, our shares or such other securities which may be deemed to be beneficially owned by such persons in accordance with the rules and regulations of the SEC and securities which may be
148
issued upon exercise of a stock option or warrant), or publicly disclose the intention to do any of the foregoing, (2) enter into any swap or other agreement that transfers, in whole or in part, any of the economic consequences of ownership of our shares or such other securities, whether any such transaction described in clause (1) or (2) above is to be settled by delivery of our shares or such other securities, in cash, or otherwise, or (3) file, request or make any demand for or exercise any right with respect to the registration of any of our shares or any security convertible into or exercisable or exchangeable for our shares. In addition, the lock-up agreements do not restrict the transfer of shares of common stock (A) as bona fide gifts, (B) by will or the laws of intestacy, (C) to family members (including to vehicles of which they are beneficial owners), (D) pursuant to domestic relations or court orders, (E) following the 180 day lock-up period, pursuant to Rule 10b5-1 trading plans established during the 180 day lock-up period without any announcement or public disclosure being required during the 180 day lock-up period, (F) solely for the purpose of satisfying tax withholding amounts that become due in connection with the vesting of awards granted under an equity incentive plan of the Company, (G)(i) in the case of corporations or other entities, to affiliates that do not involve any disposition for value or (ii) as part of a disposition, transfer, distribution or liquidation without consideration to its equity holders, (H) by selling stockholders pursuant to the Underwriting Agreement, (I) acquired in open market transactions after the completion of this offering or (J) pursuant to a bona fide third party tender offer, merger, consolidation or other similar transaction made to all holders of the common stock involving a change of control of the Company (unless such tender offer, merger, consolidation or other similar transaction is not completed); provided, that in the case of clauses (A), (B), (C) and (G), each donee or transferee shall agree with the Representatives in writing to be bound by the lock-up restrictions for the duration that such restrictions remain in effect at the time of transfer; and provided, further, that, in the case of clauses (A), (B), (C) and (I), no filing by any donor or transferor under the Exchange Act or Canadian securities laws, or other public announcement by any donor or transferor shall be required or shall be made voluntarily in connection with such transfer or distribution (other than a filing on a Form 5 made prior to the expiration of the 180-day period referred to above); and provided, further, that, in the case of clauses (D), (F) and (G)(i), any public filing or public announcement under the Exchange Act or Canadian securities laws, reporting a reduction in beneficial ownership of shares of common stock, or otherwise required or voluntarily made shall clearly indicate in the footnotes or comments section of such filing that such transfer was made pursuant to the circumstances described in such clause.
We and the selling stockholders have agreed to indemnify the underwriters against certain liabilities, including liabilities under the U.S. Securities Act and applicable Canadian securities laws.
Pursuant to Canadian securities laws and the Universal Market Integrity Rules for Canadian Marketplaces, the underwriters may not, throughout the period of distribution, bid for, or purchase our shares, except in accordance with certain permitted transactions, including market stabilization and passive market making activities.
In connection with this offering, the underwriters may engage in stabilizing transactions, which involves making bids for, purchasing, and selling our shares of common stock in the open market for the purpose of preventing or retarding a decline in the market price of our shares of common stock while this offering is in progress. These stabilizing transactions may include making short sales of our shares of common stock, which involves the sale by the underwriters of a greater number of our shares of common stock than they are required to purchase in this offering, and purchasing our shares of common stock on the open market to cover positions created by short sales. Short sales may be "covered" shorts, which are short positions in an amount not greater than the underwriters' overallotment option referred to above, or may be "naked" shorts, which are short positions in excess of that amount. The underwriters may close out any covered short position either by exercising their overallotment option, in whole or in part, or by purchasing shares of common stock in the open market. In making this determination, the underwriters will consider, among other things, the price of
149
shares of common stock available for purchase in the open market compared to the price at which the underwriters may purchase shares of common stock through the overallotment option. A naked short position is more likely to be created if the underwriters are concerned that there may be downward pressure on the price of our shares of common stock in the open market that could adversely affect investors who purchase in this offering. To the extent that the underwriters create a naked short position, they will purchase shares of common stock in the open market to cover the position.
The underwriters have advised us that, pursuant to Regulation M of the U.S. Securities Act and applicable Canadian securities laws, they may also engage in other activities that stabilize, maintain, or otherwise affect the price of our shares, including the imposition of penalty bids. This means that if the underwriters purchase our shares of common stock in the open market in stabilizing transactions or to cover short sales, the joint book-running managers can require the underwriters that sold those shares of common stock as part of this offering to repay the underwriters' commission received by them.
These activities may have the effect of raising or maintaining the market price of our shares of common stock or preventing or retarding a decline in the market price of our shares of common stock, and, as a result, the price of our shares of common stock may be higher than the price that otherwise might exist in the open market. If the underwriters commence these activities, they may discontinue them at any time. The underwriters may carry out these transactions on applicable stock exchanges, in the over-the-counter market, or otherwise.
Prior to this offering, there has been no public market for our shares of common stock. The initial public offering price will be determined by negotiations between us and the underwriters. In determining the initial public offering price, we and the underwriters expect to consider a number of factors including:
- •
- the information set forth in this prospectus and otherwise available to us and the underwriters;
- •
- our prospects and the history and prospects for the industry in which we compete;
- •
- an assessment of our management;
- •
- our prospects for future earnings;
- •
- the general condition of the securities markets at the time of this offering;
- •
- the recent market prices of, and demand for, publicly traded common stock of generally comparable companies; and
- •
- other factors deemed relevant by the underwriters and us.
Neither we nor the underwriters can assure investors that an active trading market will develop for our shares of common stock, or that the shares of common stock will trade in the public market at or above the initial public offering price.
Other than in the United States and in each of the Canadian provinces and territories, no action has been taken by us or the underwriters that would permit a public offering of the securities offered by this prospectus in any jurisdiction where action for that purpose is required. The securities offered by this prospectus may not be offered or sold, directly or indirectly, nor may this prospectus or any other offering material or advertisements in connection with the offer and sale of any such securities be distributed or published in any jurisdiction, except under circumstances that will result in compliance with the applicable rules and regulations of that jurisdiction. Persons into whose possession this prospectus comes are advised to inform themselves about and to observe any restrictions relating to the offering and the distribution of this prospectus. This prospectus does not constitute an offer to sell or a solicitation of an offer to buy any securities offered by this prospectus in any jurisdiction in which such an offer or a solicitation is unlawful.
150
Conflicts of Interest
Certain of the underwriters and their affiliates have provided in the past to us and our affiliates and may provide from time to time in the future certain commercial banking, financial advisory, investment banking, and other services for us and such affiliates in the ordinary course of their business, for which they have received and may continue to receive customary fees and commissions. In addition, from time to time, certain of the underwriters and their affiliates may effect transactions for their own account or the account of customers, and hold, on behalf of themselves or their customers, long or short positions in our equity or debt securities or loans, and may do so in the future. In addition, affiliates of each of BMO Nesbitt Burns Inc., BMO Capital Markets Corp., Goldman Sachs Canada Inc., Goldman, Sachs & Co., CIBC World Markets Inc., CIBC World Markets Corp., Scotia Capital Inc. and Scotia Capital (USA) Inc. are lenders to the Company under the New Revolving Credit Facility. Accordingly, we may be considered a "connected issuer" (as defined in National Instrument 33-105—Underwriting Conflicts of the Canadian Securities Administrators) of each of BMO Nesbitt Burns Inc., BMO Capital Markets Corp., Goldman Sachs Canada Inc., Goldman, Sachs & Co., CIBC World Markets Inc., CIBC World Markets Corp., Scotia Capital Inc. and Scotia Capital (USA) Inc. for the purposes of applicable Canadian securities laws. Proceeds of this offering will not be applied for the benefit of such affiliates. In connection with the New Credit Agreement, the Company provided the lenders under the New Credit Agreement with a general security interest over the Company's assets. We and our subsidiaries that are party to the New Credit Agreement have been in compliance with the terms thereof at all times, and no breach thereof has been waived since the execution thereof. Other than as disclosed in this prospectus, our financial position has not changed since the execution of the New Credit Agreement. See "Management's Discussion and Analysis of Financial Condition and Results of Operations—Liquidity and Capital Resources."
Furthermore, an affiliate of CIBC World Markets Inc., CIBC World Markets Corp. (the "CIBC LP") and an affiliate of Scotia Capital Inc. and Scotia Capital (USA) Inc. (the "Scotia Capital LP") are limited partners in Tricor Pacific Capital Partners (Fund IV), Limited Partnership, one of the selling stockholders named in this Prospectus, and therefore, Tricor Pacific Capital Partners (Fund IV), Limited Partnership may also be considered a "connected issuer" of CIBC World Markets Inc., CIBC World Markets Corp., Scotia Capital Inc. and Scotia Capital (USA) Inc. (as defined in National Instrument 33-105—Underwriting Conflicts of the Canadian Securities Administrators). As a limited partner of Tricor Pacific Capital Partners (Fund IV), Limited Partnership, the CIBC LP and the Scotia Capital LP are each entitled to share in the returns generated by the fund in proportion to its limited partnership interest. None of CIBC World Markets Inc., CIBC World Markets Corp., the CIBC LP, Scotia Capital Inc., Scotia Capital (USA) Inc. and the Scotia Capital LP have any direct or indirect control over the management of the general partner of Tricor Pacific Capital Partners (Fund IV), Limited Partnership, and the CIBC LP and the Scotia Capital LP are entitled to less than 10% of the aggregate distributions made to limited partners of the fund. As a result of this offering, Tricor Pacific Capital Partners (Fund IV), Limited Partnership may indirectly apply some of the proceeds of this offering to make distributions to its limited partners, including the CIBC LP and the Scotia Capital LP.
The decision to offer our shares of common stock was made solely by us and the selling stockholders, and the terms upon which the shares of common stock are being offered were determined by negotiation between us, the selling stockholders and the underwriters. This offering was not required or suggested by, but was consented to by, each of BMO Nesbitt Burns Inc., BMO Capital Markets Corp., Goldman Sachs Canada Inc., Goldman, Sachs & Co., CIBC World Markets Inc., CIBC World Markets Corp., Robert W. Baird & Co. Incorporated, William Blair & Company, L.L.C., Raymond James Ltd., Raymond James & Associates, Inc., Scotia Capital Inc., Scotia Capital (USA) Inc., GMP Securities L.P. and Griffiths McBurney Corp. or any of their respective affiliates. As a result
151
of this offering, such underwriters will receive their share of the underwriting fee payable to the underwriters.
Our offered shares of common stock (other than any shares of common stock issuable or to be sold on exercise of the overallotment option) are to be taken up by the underwriters, if at all, on or before a date not later than 42 days after the date of the receipt for the final Canadian prospectus.
Selling Restrictions
Other than in the United States and each of the provinces and territories of Canada, no action has been taken by us that would permit a public offering of our shares of common stock offered by this prospectus in any jurisdiction where action for that purpose is required. Our shares of common stock offered by this prospectus may not be offered or sold, directly or indirectly, nor may this prospectus or any other offering material or advertisements in connection with the offer and sale of any such shares of common stock be distributed or published in any jurisdiction, except under circumstances that will result in compliance with the applicable rules and regulations of that jurisdiction. Persons into whose possession this prospectus comes are advised to inform themselves about and to observe any restrictions relating to the offering and the distribution of this prospectus. This prospectus does not constitute an offer to sell or a solicitation of an offer to buy any shares of common stock offered by this prospectus in any jurisdiction in which such an offer or a solicitation is unlawful.
Notice to Prospective Investors in the European Economic Area
This document has been prepared on the basis that all offers of our shares of common stock will be made pursuant to an exemption under Article 3 of the Prospectus Directive, as implemented in member states of the European Economic Area (the "EEA"), from the requirement to produce a prospectus for offers of our shares of common stock. Accordingly, any person making or intending to make any offer within the EEA of our shares of common stock should only do so in circumstances in which no obligation arises for us or any of the underwriters to produce a prospectus for such offer. Neither we nor the underwriters have authorized, nor do we or the underwriters authorize, the making of any offer of our shares of common stock through any financial intermediary, other than offers made by the underwriters, which constitute the final sale of the shares of common stock contemplated in this document.
In relation to each member state of the EEA that has implemented the Prospectus Directive (each, a "Relevant Member State"), with effect from and including the date on which the Prospectus Directive is implemented in that Relevant Member State, an offer to the public of our shares of common stock has not been made, and may not be made in that Relevant Member State, other than:
- a)
- to
any legal entity which is a qualified investor as defined in the Prospectus Directive;
- b)
- to
fewer than 150 natural or legal persons (other than qualified investors as defined in the Prospectus Directive), subject to obtaining the prior consent of
the relevant underwriter or underwriters nominated by us for any such offer; or
- c)
- in any other circumstances falling within Article 3(2) of the Prospectus Directive,
provided that no such offer of our shares of common stock shall require us or the underwriters to publish a prospectus pursuant to Article 3 of the Prospectus Directive.
For the purposes of the foregoing restrictions:
- •
- the expression an "offer of common stock to the public" in relation to our shares of common stock in any Relevant Member State means the communication in any form and by any means of sufficient information on the terms of the offer and our shares of common stock to be offered so as to enable an investor to decide to purchase or subscribe for our shares of common stock,
152
- •
- the expression "Prospectus Directive" means Directive 2003/71/EC (and amendments thereto, including the 2010 PD Amending
Directive), and includes any relevant implementing measure in the Relevant Member State; and
- •
- the expression "2010 PD Amending Directive" means Directive 2010/73/EU.
as the same may be varied in that Relevant Member State by any measure implementing the Prospectus Directive in that Relevant Member State;
Each subscriber for or purchaser of our shares of common stock in the offer located within a Relevant Member State will be deemed to have represented, acknowledged and agreed that it is a "qualified investor" within the meaning of Article 2(1)(e) of the Prospectus Directive. We, the underwriters and their respective affiliates, and others will rely upon the truth and accuracy of the foregoing representation, acknowledgement and agreement.
Notice to Prospective Investors in the United Kingdom
This document is for distribution only to, and is only directed at, persons who (i) have professional experience in matters relating to investments falling within Article 19(5) of the Financial Services and Markets Act 2000 (the "FSMA") (Financial Promotion) Order 2005, as amended (the "Financial Promotion Order"), (ii) are persons falling within Article 49(2)(a) to (d) (high net worth companies, unincorporated associations, etc.) of the Financial Promotion Order, or (iii) are persons to whom an invitation or inducement to engage in investment activity within the meaning of section 21 of the FSMA in connection with the issue or sale of any securities may otherwise lawfully be communicated or caused to be communicated (all such persons together being referred to as "relevant persons"). This document is directed only at relevant persons and must not be acted on or relied on by anyone who is not a relevant person. Any investment or investment activity to which this document relates is available only to relevant persons and will be engaged in only with relevant persons.
Notice to Prospective Investors in Hong Kong
Our shares of common stock may not be offered or sold in Hong Kong by means of any document other than (i) in circumstances which do not constitute an offer to the public within the meaning of the Companies Ordinance (Cap. 32, Laws of Hong Kong), or (ii) to "professional investors" within the meaning of the Securities and Futures Ordinance (Cap. 571, Laws of Hong Kong) and any rules made thereunder, or (iii) in other circumstances which do not result in this document being a "prospectus" within the meaning of the Companies Ordinance (Cap. 32, Laws of Hong Kong) and no advertisement, invitation or document relating to our shares of common stock may be issued or may be in the possession of any person for the purpose of issue (in each case whether in Hong Kong or elsewhere), which is directed at, or the contents of which are likely to be accessed or read by, the public in Hong Kong (except if permitted to do so under the laws of Hong Kong) other than with respect to our shares of common stock which are or are intended to be disposed of only to persons outside Hong Kong or only to "professional investors" within the meaning of the Securities and Futures Ordinance (Cap. 571, Laws of Hong Kong) and any rules made thereunder.
Notice to Prospective Investors in Japan
Our shares of common stock offered in this document have not been and will not be registered under the Financial Instruments and Exchange Law of Japan. The shares of common stock have not been offered or sold and will not be offered or sold, directly or indirectly, in Japan or to or for the account of any resident of Japan (including any corporation or other entity organized under the laws of Japan), except (i) pursuant to an exemption from the registration requirements of the Financial Instruments and Exchange Law and (ii) in compliance with any other applicable requirements of Japanese law.
153
Notice to Prospective Investors in Singapore
This document has not been registered as a prospectus with the Monetary Authority of Singapore. Accordingly, this document and any other document or material in connection with the offer or sale, or invitation for subscription or purchase, of our shares of common stock may not be circulated or distributed, nor may our shares of common stock be offered or sold, or be made the subject of an invitation for subscription or purchase, whether directly or indirectly, to persons in Singapore other than (i) to an institutional investor under Section 274 of the Securities and Futures Act, Chapter 289 of Singapore (the "SFA"), (ii) to a relevant person pursuant to Section 275(1), or any person pursuant to Section 275(1A), and in accordance with the conditions specified in Section 275 of the SFA or (iii) otherwise pursuant to, and in accordance with the conditions of, any other applicable provision of the SFA, in each case subject to compliance with conditions set forth in the SFA.
Where our shares of common stock are subscribed for or purchased under Section 275 of the SFA by a relevant person which is:
- •
- a corporation (which is not an accredited investor (as defined in Section 4A of the SFA)) the sole business of which is to hold
investments and the entire share capital of which is owned by one or more individuals, each of whom is an accredited investor; or
- •
- a trust (where the trustee is not an accredited investor) whose sole purpose is to hold investments and each beneficiary of the trust is an individual who is an accredited investor,
shares, debentures and units of shares and debentures of that corporation or the beneficiaries' rights and interest (howsoever described) in that trust shall not be transferred within six months after that corporation or that trust has acquired the shares pursuant to an offer made under Section 275 of the SFA except:
- •
- to an institutional investor (for corporations, under Section 274 of the SFA) or to a relevant person defined in
Section 275(2) of the SFA, or to any person pursuant to an offer that is made on terms that such shares, debentures and units of shares and debentures of that corporation or such rights and
interest in that trust are acquired at a consideration of not less than S$200,000 (or its equivalent in a foreign currency) for each transaction, whether such amount is to be paid for in cash or by
exchange of securities or other assets, and further for corporations, in accordance with the conditions specified in Section 275 of the SFA;
- •
- where no consideration is or will be given for the transfer; or
- •
- where the transfer is by operation of law.
154
MATERIAL U.S. FEDERAL INCOME TAX CONSIDERATIONS TO NON-U.S. HOLDERS
The following is a summary of the material U.S. federal income tax consequences of the ownership and disposition of our common stock to a non-U.S. holder that purchases shares of our common stock in this offering. This summary applies only to a non-U.S. holder that holds our common stock as a "capital asset," within the meaning of Section 1221 of the U.S. Internal Revenue Code of 1986, as amended (the "Code"). For purposes of this summary, a "non-U.S. holder" means any beneficial owner of our common stock that is, for U.S. federal income tax purposes, an individual, corporation, estate or trust other than:
- •
- an individual citizen or resident of the United States;
- •
- a corporation or other entity treated as a corporation for U.S. federal income tax purposes created or organized in the United States
or under the laws of the United States or any state thereof or the District of Columbia;
- •
- an estate the income of which is subject to U.S. federal income tax regardless of its source; or
- •
- a trust if it (1) is subject to the primary supervision of a court within the United States and one or more United States persons have the authority to control all substantial decisions of the trust or (2) has a valid election in place to be treated as a U.S. person for U.S. federal income tax purposes.
In the case of a holder that is classified as a partnership for U.S. federal income tax purposes, the tax treatment of a partner in such partnership generally will depend upon the status of the partner and the activities of the partner and the partnership. If you are a partnership or a partner in a partnership considering an investment in our common stock, you are urged to consult your tax advisor.
This summary is based upon the provisions of the Code, the U.S. Treasury regulations promulgated thereunder and administrative and judicial interpretations thereof, all as of the date hereof. Those authorities may be changed, perhaps retroactively, so as to result in U.S. federal income tax consequences different from those summarized below. We cannot assure you that a change in law, possibly with retroactive application, will not alter significantly the tax considerations that we describe in this summary. We have not sought and do not plan to seek any ruling from the U.S. Internal Revenue Service (the "IRS"), with respect to statements made and the conclusions reached in the following summary, and there can be no assurance that the IRS or a court will agree with our statements and conclusions.
This summary does not address all aspects of U.S. federal income taxes that may be relevant to non-U.S. holders in light of their personal circumstances, and does not deal with federal taxes other than the U.S. federal income tax (such as U.S. federal estate and gift tax laws) or with non-U.S., state or local tax or tax treaty considerations. The tax consequences for the shareholders, partners, or beneficiaries of a non-U.S. holder are not discussed. Special rules, not discussed here, may apply to certain non-U.S. holders, including:
- •
- former citizens or residents of the U.S. or part-year resident aliens;
- •
- brokers, dealers or traders in securities, commodities or currencies;
- •
- persons who hold our common stock as a position in a "straddle," "conversion transaction" or other risk reduction transaction;
- •
- controlled foreign corporations, passive foreign investment companies, or corporations that accumulate earnings to avoid U.S. federal
income tax;
- •
- tax-exempt organizations;
155
- •
- persons subject to the unearned income Medicare contribution tax on certain investment income;
- •
- non-U.S. holders subject to the alternative minimum tax;
- •
- governments, government instrumentalities or agencies;
- •
- persons who received shares through the exercise of incentive options or through the issuance of restricted stock under an equity
incentive plan or through a tax-qualified retirement plan;
- •
- entities disregarded as separate from their owner for U.S. federal income tax purposes;
- •
- "expatriated entities" subject to section 7874 of the Code;
- •
- hybrid or reverse hybrid entities;
- •
- banks, underwriters, insurance companies, or other financial institutions; and
- •
- pass-through entities (including entities that are treated as pass-through entities for U.S. federal income tax purposes) and the owners of such entities that are subject to special treatment under the Code.
If you are considering the purchase of our common stock, you are urged to consult your tax advisor to determine the U.S. federal, state, local and other tax and tax treaty consequences that may be relevant to you.
Dividends
A distribution of cash or property that we pay in respect of our common stock, will be treated as a dividend for U.S. federal income tax purposes to the extent paid from our current or accumulated earnings and profits (as determined under U.S. federal income tax principles). Dividends paid to you generally will be subject to withholding of U.S. federal income tax at a 30% rate or such lower rate as may be specified by an applicable income tax treaty, assuming certain requirements to obtain such reduced rate are met, as discussed below. However, dividends that are effectively connected with the conduct of a trade or business by you within the U.S. (and, if required by an applicable income tax treaty, are attributable to a permanent establishment or a fixed base maintained by the non-U.S. holder in the United States) are not subject to the withholding tax, but instead are subject to U.S. federal income tax on a net income basis at applicable graduated individual or corporate rates, unless an applicable income tax treaty provides otherwise. Certain certification and disclosure requirements, including delivery of a properly completed and executed IRS Form W-8ECI, must be satisfied for effectively connected income to be exempt from withholding. Any such effectively connected dividends received by a foreign corporation may be subject to an additional "branch profits tax" at a 30% rate or such lower rate as may be specified by an applicable income tax treaty. Any distributions of cash or property that we pay in respect of our common stock would also be subject to the discussions below under the sections titled "—Information Reporting and Backup Withholding" and "—FATCA."
If the amount of a distribution paid on our common stock exceeds our current and accumulated earnings and profits, such excess will be allocated ratably among each share of common stock with respect to which the distribution is paid and treated first as a tax-free return of capital to the extent of your adjusted tax basis in each such share, and thereafter as capital gain from a sale or other taxable disposition of such share of common stock that is taxed to you as described below under the heading "Gain on Disposition of Common Stock." Your adjusted tax basis in a share is generally the purchase price of such share, reduced by the amount of any such tax-free returns of capital.
If you wish to claim the benefit of an applicable treaty rate to avoid or reduce withholding of U.S. federal income tax for dividends, then you must (a) provide the withholding agent with a properly completed and executed IRS Form W-8BEN or W-8BEN-E (as applicable) and any applicable
156
attachments and certify under penalties of perjury that you are not a United States person and are eligible for treaty benefits, or (b) if our common stock is held through certain foreign intermediaries, satisfy the relevant certification requirements of applicable U.S. Treasury regulations. Special certification and other requirements apply to certain non-U.S. holders that act as intermediaries (including partnerships and other flow-through entities). These certifications must be provided to the applicable withholding agent prior to the payment of dividends and must be updated periodically. A claim for exemption or reduction in tax will not be valid if the person receiving the applicable form has actual knowledge or reason to know that the statements on the form are false.
If you are eligible for a reduced rate of U.S. federal income tax pursuant to an income tax treaty, then you may obtain a refund or credit of any excess amounts withheld by timely filing an appropriate claim with the IRS.
Gain on Disposition of Common Stock
Subject to the discussions below in "Information Reporting and Backup Withholding" and "FATCA," you generally will not be subject to U.S. federal income tax with respect to gain realized on the sale or other taxable disposition of our common stock, unless:
- •
- the gain is effectively connected with a trade or business you conduct in the United States, and, where a tax treaty applies, is
attributable to a permanent establishment or fixed base maintained by you in the United States;
- •
- if you are an individual, you are present in the United States for 183 days or more in the taxable year of the sale or other
taxable disposition and certain other conditions are met; or
- •
- we are or have been during a specified testing period a "United States real property holding corporation" as defined in the Code (a "USRPHC") for U.S. federal income tax purposes, and certain other conditions are met.
We believe that we are not, and we do not anticipate becoming, a USRPHC for U.S. federal income tax purposes. However, there can be no assurance that we will not become a USRPHC in the future. Even if we are or become a USRPHC, a non-U.S. holder generally will not be subject to U.S. federal income tax on any gain in respect of our common stock as long as our common stock is "regularly traded on an established securities market" and such non-U.S. holder owned (directly, indirectly or constructively) or is deemed to have owned no more than 5% of our common stock during the specified testing period. However, there can be no assurance that our common stock will be "regularly traded on an established securities market" for purposes of these rules. If we are or become a USRPHC and you owned (directly, indirectly or constructively) or are deemed to have owned more than 5% of our common stock at any time during the specified testing period or our common stock is not "regularly traded on an established securities market," you will be subject to tax on the net gain derived from the sale under regular graduated U.S. federal income tax rates.
If you are a person described in the first bullet point above, you will be subject to tax on the net gain derived from the sale under regular graduated U.S. federal income tax rates. In addition, a non-U.S. holder corporation may be subject to the branch profits tax equal to 30% of its effectively connected earnings and profits or at such lower rate as may be specified by an applicable income tax treaty.
If you are an individual described in the second bullet point above, you will be subject to a flat 30% tax on the gain derived from the sale, which may be offset by U.S. source capital losses, provided the non-U.S. holder timely files a U.S. federal income tax return with respect to such losses.
157
Information Reporting and Backup Withholding
Generally, we must report annually to the IRS and to you, certain information, including the non-U.S. holder's name, address and taxpayer identification number, the aggregate amount of dividends paid to you and the amount of tax, if any, withheld with respect to such dividends. The IRS may make this information available to the tax authorities in the country in which you are resident under the provisions of an applicable income tax treaty.
In addition, you may be subject to information reporting requirements and backup withholding (currently at a rate of 28%) with respect to dividends paid on, and the proceeds of disposition of, shares of our common stock, unless, generally, you certify under penalties of perjury (usually on IRS Form W-8BEN or W-8BEN-E) that you are not a United States person or you otherwise establish an exemption. Additional rules relating to information reporting requirements and backup withholding with respect to payments of the proceeds from the disposition of shares of our common stock include:
- •
- If the proceeds are paid to or through the U.S. office of a broker, the proceeds generally will be subject to backup withholding and
information reporting, unless you certify under penalties of perjury (usually on IRS Form W-8BEN or W-8BEN-E) that you are not a United States person or you otherwise establish an exemption.
- •
- If the proceeds are paid to or through a non-U.S. office of a broker that is not a United States person and is not a foreign person
with certain specified U.S. connections (a "U.S.-related person"), information reporting and backup withholding generally will not apply.
- •
- If the proceeds are paid to or through a non-U.S. office of a broker that is a United States person or a U.S.-related person, the proceeds generally will be subject to information reporting (but not to backup withholding), unless you certify under penalties of perjury (usually on IRS Form W-8BEN or W-8BEN-E) that you are not a United States person or you otherwise establish an exemption.
Any amounts withheld under the backup withholding rules may be allowed as a refund or a credit against your U.S. federal income tax liability, provided the required information is timely furnished by you to the IRS.
FATCA
Sections 1471-1474 of the Code, the U.S. Treasury regulations and official IRS guidance associated with such provisions (such provisions, regulations and guidance commonly known as "FATCA") generally impose a United States federal withholding tax of 30% on dividend income and the gross proceeds of a sale or other disposition of common stock paid to (1) a foreign financial institution ("FFI") (as the beneficial owner or as an intermediary for the beneficial owner), unless such institution (a) enters into, and is in compliance with, a withholding and information reporting agreement with the United States government to collect and provide to the United States tax authorities substantial information regarding United States account holders of such institution (which would include certain equity and debt holders of such institution, as well as certain account holders that are foreign entities with United States owners) (a "FATCA Agreement") or (b) is a resident in a country that has entered into an intergovernmental agreement with the United States in relation to such withholding and information reporting and the FFI complies with the related information reporting requirements of such country, (2) a foreign entity that is not a financial institution, unless such entity identifies the substantial United States owners of the entity, which generally includes any United States person who directly or indirectly owns more than 10% of the entity or certifies that it does not have any substantial United States owners. Certain exemptions may apply. A person that receives payments through one or more foreign financial institutions may receive reduced payments as a result of FATCA withholding taxes if (i) any such foreign financial institution does not enter into a FATCA Agreement and does not
158
otherwise establish an exemption, or (ii) such person is (a) a "recalcitrant account holder" (as defined in FATCA) or (b) a foreign financial institution that fails to enter into a FATCA Agreement or establish an exemption.
Withholding under FATCA may apply to dividend payments on our common stock regardless of when they are made. However, under the applicable U.S. Treasury regulations, withholding under FATCA generally will only apply to payments of gross proceeds from the sale or other disposition of our common stock on or after January 1, 2017. An intergovernmental agreement between the United States and the applicable non-U.S. country, or future U.S. Treasury regulations or other official IRS guidance, may modify these requirements. Under certain circumstances, a non-U.S. holder of our common stock may be eligible for refunds or credits of such taxes, but a non-U.S. holder would generally be required to file a U.S. federal income tax return (which may entail significant administrative burden) to claim such refunds or credits. Investors are urged to consult with their tax advisors regarding the implications of FATCA on their investment in our common stock.
THE SUMMARY OF CERTAIN U.S. FEDERAL INCOME TAX CONSEQUENCES ABOVE IS INCLUDED FOR GENERAL INFORMATION PURPOSES ONLY. POTENTIAL PURCHASERS OF OUR COMMON STOCK ARE URGED TO CONSULT THEIR TAX ADVISORS TO DETERMINE THE U.S. FEDERAL, STATE, LOCAL AND NON-U.S. TAX AND TAX TREATY CONSIDERATIONS OF OWNING AND DISPOSING OF OUR COMMON STOCK.
159
CERTAIN CANADIAN FEDERAL INCOME TAX CONSIDERATIONS FOR HOLDERS OF OUR
COMMON STOCK
The following is a summary of certain Canadian federal income tax considerations under the Income Tax Act (Canada), or the "Tax Act," generally applicable to a holder who acquires our common stock pursuant to this offering, and who, for the purposes of the Tax Act and at all relevant times, holds such common stock as capital property and deals at arm's length with, and is not affiliated with, us, which we refer to as a "Holder." Common stock will generally be considered to be capital property to a Holder unless the Holder holds such common stock in the course of carrying on a business of buying and selling securities or has acquired them in one or more transactions considered to be an adventure or concern in the nature of trade.
This summary is not applicable to a Holder: (i) with respect to whom our company is or will be a "foreign affiliate" within the meaning of the Tax Act, (ii) that is a "financial institution" for the purposes of the mark-to-market rules under the Tax Act, (iii) an interest in which is a "tax shelter" or a "tax shelter investment" as defined in the Tax Act, (iv) that is a "specified financial institution" as defined in the Tax Act, (v) who has made a "functional currency" reporting election under section 261 of the Tax Act to report the holder's "Canadian tax results" (as defined in the Tax Act) in a currency other than the Canadian currency or (vi) that has entered or will enter into a "derivative forward agreement" (as defined in the Tax Act) with respect to the common stock. Any such holder should consult its own tax advisor with respect to the income tax considerations applicable to it in respect of acquiring, holding and disposing of common stock.
This summary is based on the current provisions of the Tax Act and the regulations thereunder and an understanding of the current published administrative policies and assessing practices of the Canada Revenue Agency, or the "CRA," made public prior to the date hereof. This summary takes into account all proposed amendments to the Tax Act and the regulations that have been publicly announced by or on behalf of the Minister of Finance (Canada) prior to the date hereof, which we refer to as the "Proposed Amendments," and assumes that such Proposed Amendments will be enacted in the form proposed, although no assurance can be given that the Proposed Amendments will be enacted in their current form or at all. Except for the Proposed Amendments, this summary does not take into account or anticipate any other changes in law or any changes in the CRA's administrative policies and assessing practices, whether by judicial, governmental or legislative action or decision, nor does it take into account other federal or any provincial, territorial or foreign tax legislation or considerations, which may differ from the Canadian federal income tax considerations described herein. The provisions of provincial income tax legislation vary from province to province in Canada and in some cases differ from the Tax Act.
This summary is of a general nature only and is not intended to be, nor should it be construed to be, legal or tax advice to any particular Holder, and no representations with respect to the income tax considerations applicable to any particular Holder are made. This summary is not exhaustive of all Canadian federal income tax considerations. The relevant tax considerations applicable to the acquiring, holding and disposing of common stock may vary according to the status of the purchaser, the jurisdiction in which the purchaser resides or carries on business and the purchaser's own particular circumstances. Accordingly, prospective Holders are urged to consult their own tax advisors about the specific tax consequences to them of acquiring, holding and disposing of common stock.
Currency Conversion
For purposes of the Tax Act, all amounts relating to the acquisition, holding or disposition of securities (including dividends, adjusted cost base and proceeds of disposition) must generally be expressed in Canadian Dollars. Amounts denominated in any other currency must be converted into Canadian Dollars generally based on the exchange rate quoted by the Bank of Canada for noon on the
160
date such amounts arise or such other rate of exchange as is acceptable to the Minister of National Revenue (Canada).
Stockholders Resident in Canada
The following discussion applies to a Holder who, for the purposes of the Tax Act, and at all relevant times, is, or is deemed to be, resident in Canada, which we refer to as a "Resident Holder."
Dividends on Common Stock
A Resident Holder will be required to include in computing such Resident Holder's income for a taxation year the amount of any dividends including amounts deducted for U.S. withholding tax, if any, received on our common stock. Dividends received on our common stock by a Resident Holder who is an individual will not be subject to the gross-up and dividend tax credit rules in the Tax Act normally applicable to taxable dividends received from taxable Canadian corporations. A Resident Holder that is a corporation will be required to include dividends received on our common stock in computing its income and will not be entitled to deduct the amount of such dividends in computing its taxable income.
To the extent that U.S. withholding tax is payable by a Resident Holder in respect of any dividends received on our common stock, the Resident Holder may be eligible for a foreign tax credit or deduction under the Tax Act to the extent and under the circumstances described in the Tax Act. Resident Holders should consult their own tax advisors regarding the availability of a foreign tax credit or deduction in their particular circumstances.
Disposition of Common Stock
A disposition or deemed disposition of our common stock by a Resident Holder (including on a purchase of common stock for cancellation by the company) will generally result in a capital gain (or capital loss) to the extent that the proceeds of disposition, net of any reasonable costs of the disposition, exceed (or are less than) the adjusted cost base to the Resident Holder of our common stock immediately before the disposition. See "—Taxation of Capital Gains and Capital Losses."
Taxation of Capital Gains and Capital Losses
Generally, one-half of any capital gain, or a "taxable capital gain," realized by a Resident Holder will be included in the Resident Holder's income for the year of disposition. One-half of any capital loss, or an "allowable capital loss," realized by a Resident Holder in a taxation year generally must be deducted by the Resident Holder against taxable capital gains in that year (subject to, and in accordance with, the provisions of the Tax Act). Any excess of allowable capital losses over taxable capital gains of a Resident Holder realized in the year of disposition may be carried back up to three taxation years or forward indefinitely and deducted against net taxable capital gains realized in such years, to the extent and under the circumstances described in the Tax Act.
Capital gains realized by a Resident Holder that is an individual or trust, other than certain specified trusts, may give rise to a liability for minimum tax under the Tax Act.
U.S. tax, if any, levied on any gain realized on a disposition of our common stock may be eligible for a foreign tax credit under the Tax Act to the extent and under the circumstances described in the Tax Act. Resident Holders should consult their own tax advisors with respect to the availability of a foreign tax credit, having regard to their own particular circumstances.
161
Offshore Investment Fund Property Rules
The Tax Act contains provisions, or the "OIF Rules," which, in certain circumstances, may require a Resident Holder to include an amount in income in each taxation year in respect of the acquisition and holding of our common stock if (1) the value of such common stock may reasonably be considered to be derived, directly or indirectly, primarily from portfolio investments in: (i) shares of the capital stock of one or more corporations, (ii) indebtedness or annuities, (iii) interests in one or more corporations, trusts, partnerships, organizations, funds or entities, (iv) commodities, (v) real estate, (vi) Canadian or foreign resource properties, (vii) currency of a country other than Canada, (viii) rights or options to acquire or dispose of any of the foregoing or (ix) any combination of the foregoing, which we collectively refer to as "Investment Assets" and (2) it may reasonably be concluded that one of the main reasons for the Resident Holder acquiring, holding or having our common stock was to derive a benefit from portfolio investments in Investment Assets in such a manner that the taxes, if any, on the income, profits and gains from such Investment Assets for any particular year are significantly less than the tax that would have been applicable under Part I of the Tax Act if the income, profits and gains had been earned directly by the Resident Holder.
In making this determination, the OIF Rules provide that regard must be had to all of the circumstances, including (i) the nature, organization and operation of any non-resident entity, including our company, and the form of, and the terms and conditions governing, the Resident Holder's interest in, or connection with, any such non-resident entity, (ii) the extent to which any income, profit and gains that may reasonably be considered to be earned or accrued, whether directly or indirectly, for the benefit of any such non-resident entity, including our company, are subject to an income or profits tax that is significantly less than the income tax that would be applicable to such income, profits and gains if they were earned directly by the Resident Holder and (iii) the extent to which any income, profits and gains of any such non-resident entity, including our company, for any fiscal period are distributed in that or the immediately following fiscal period.
If applicable, the OIF Rules can result in a Resident Holder being required to include in its income for each taxation year in which such Resident Holder owns our common stock the amount, if any, by which (i) the total of all amounts each of which is the product obtained when the Resident Holder's "designated cost" (as defined in the Tax Act) of our common stock at the end of a month in the year is multiplied by 1/12 of the aggregate of the prescribed rate of interest for the period including that month plus two percentage points exceeds (ii) the Resident Holder's income for the year (other than a capital gain) in respect of our common stock determined without reference to the OIF Rules. Any amount required to be included in computing a Resident Holder's income under these provisions will be added to the adjusted cost base of our common stock to the Resident Holder.
The CRA has taken the position that the term "portfolio investment" should be given a broad interpretation. While the value of our common stock should not be regarded as being derived primarily from portfolio investments in Investment Assets, there is a possibility that the CRA may take a different view. However, as noted above, even if this is the case, the OIF Rules will apply only if it is reasonable to conclude that one of the main reasons for a Resident Holder acquiring, holding or having our common stock was to derive, either directly or indirectly, a benefit from Investment Assets in such a manner that the taxes, if any, on the income, profits and gains from such Investment Assets for any particular year are significantly less than the tax that would have been applicable under Part I of the Tax Act if the income, profits and gains had been earned directly by the Resident Holder.
The OIF Rules are complex and their application will potentially depend, in part, on the reasons for a Resident Holder acquiring, holding or having our common stock. Resident Holders are urged to consult their own tax advisors regarding the application and consequences of the OIF Rules in their own particular circumstances.
162
Additional Refundable Tax
A Resident Holder that is, throughout the relevant taxation year, a "Canadian-controlled private corporation" (as defined in the Tax Act) may be subject to pay a refundable tax on its "aggregate investment income" (as defined in the Tax Act), including taxable capital gains and certain dividends.
Foreign Property Information Reporting
In general, a Resident Holder that is a "specified Canadian entity" (as defined in the Tax Act) for a taxation year or a fiscal period and whose total cost amount of "specified foreign property" (as defined in the Tax Act), including our common stock, at any time in the year or fiscal period exceeds C$100,000 will be required to file an information return with the CRA for the taxation year or fiscal period disclosing certain prescribed information in respect of such property. Subject to certain exceptions, a taxpayer resident in Canada, other than a corporation or trust exempt from tax under Part I of the Tax Act, will be a "specified Canadian entity," as will certain partnerships. Our common stock will be "specified foreign property" to a Resident Holder. Penalties may apply where a Resident Holder fails to file the required information return in respect of such Resident Holder's "specified foreign property" (as defined in the Tax Act) on a timely basis in accordance with the Tax Act. The reporting requirements with respect to "specified foreign property" were expanded so that more detailed information is required to be provided to the CRA.
The reporting rules in the Tax Act are complex and this summary does not purport to address all circumstances in which reporting may be required by a Resident Holder. Resident Holders should consult their own tax advisors regarding the reporting rules contained in the Tax Act.
Eligibility for Investment
The common stock offered hereby will, on the date of this offering, provided that the common stock is on that date listed on a designated stock exchange, as defined in the Tax Act (which currently includes the Toronto Stock Exchange, or "TSX," and the NASDAQ Global Select Market or "NASDAQ"), be qualified investments under the Tax Act and the regulations thereunder for trusts governed by a registered retirements savings plan, or "RRSP," registered retirement income fund, or "RRIF," registered disability savings plan, deferred profit sharing plan, tax-free savings account, or "TFSA," or registered education savings plan, all within the meaning of the Tax Act.
Notwithstanding, that the common stock may be qualified investments for a trust governed by a TFSA, RRSP or RRIF, the holder of the TFSA or the annuitant under a RRSP or RRIF, as the case may be, will be subject to tax in respect of the common stock if such common stock is a "prohibited investment" for the TFSA, RRSP or RRIF, as the case may be. The common stock will generally not be a "prohibited investment" provided the holder of the TFSA or the annuitant under the RRSP or RRIF, as the case may be, deals at arm's length with our company for purposes of the Tax Act and does not have a "significant interest" in our company for purposes of the prohibited investment rules in the Tax Act. Holders of a TFSA and annuitants under a RRSP or RRIF should consult their own tax advisors as to whether the common stock will be a "prohibited investment" in their particular circumstances.
Shareholders Not Resident in Canada
The following portion of this summary is applicable to a Holder who: (i) has not been, is not, and will not be resident or deemed to be resident in Canada for purposes of the Tax Act ; and (ii) does not and will not use or hold, and is not and will not be deemed to use or hold, our common stock in connection with, or in the course of, carrying on a business in Canada, or a "Non-Resident Holder." Special rules, which are not discussed in this summary, may apply to a Non-Resident Holder that is an
163
insurer carrying on business in Canada and elsewhere. Such Non-Resident Holders should consult their own tax advisors.
Dividends on Common Stock
Dividends paid in respect of our common stock to a Non-Resident Holder will not be subject to Canadian withholding tax or other income tax under the Tax Act.
Disposition of Common Stock
A Non-Resident Holder who disposes or is deemed to dispose of our common stock that were acquired under the offering will not be subject to Canadian income tax in respect of any capital gain realized on the disposition unless such common stock constitute "taxable Canadian property" of the Non-Resident Holder for the purposes of the Tax Act and no exemption is available under an applicable income tax convention between Canada and the jurisdiction in which the Non-Resident Holder is resident.
Generally, our common stock will not be taxable Canadian property at a particular time of a Non-Resident Holder provided that our common stock are listed on a designated stock exchange (which currently includes the TSX and NASDAQ) that time, unless, at any time during the sixty-month period that ends at that time when (a)(i) the Non-Resident Holder; (ii) persons not dealing at arm's length with such Non-Resident Holder; (iii) partnerships in which the Non-Resident Holder or a person mentioned in (a)(ii) holds a membership interest directly or indirectly through one or more partnerships or (iv) any combination of (a)(i) to (iii), owned 25% or more of the issued shares of any class of the capital stock of our company and (b) at that time more than 50% of the value of such common stock was derived directly or indirectly from one or any combination of (i) real or immoveable property situated in Canada; (ii) "Canadian resource properties" as defined in the Tax Act; (iii) "timber resource properties" as defined in the Tax Act; and (iv) options in respect of, interests in or rights in any property listed in (i)-(iii) whether or not the property exists. Notwithstanding the foregoing, in certain circumstances set out in the Tax Act, our common stock may be deemed to be taxable Canadian property to a Non-Resident Holder. Non-Resident Holders whose common stock is taxable Canadian property should consult their own tax advisors for advice having regard to their particular circumstances.
164
NOTICE TO INVESTORS REGARDING U.S. GAAP
We prepare our financial information in accordance with U.S. GAAP, which differs in certain material respects from Canadian generally accepted accounting principles. We have historically provided financial information prepared in accordance with U.S. GAAP. As we will become an SEC issuer (as such term is defined in NI-52-107—Acceptable Accounting Principles and Auditing Standards of the Canadian Securities Administrators), we are not required to provide, and have not provided, a reconciliation of our financial statements to IFRS.
The validity of the common stock offered hereby will be passed upon for us by Winston & Strawn LLP, Chicago, Illinois. Certain Canadian legal matters relating to this offering are being passed upon for us by Blake, Cassels & Graydon LLP. Certain legal matters in connection with this offering will be passed upon for the underwriters by Paul, Weiss, Rifkind, Wharton & Garrison LLP, with respect to U.S. law, and Stikeman Elliott LLP, with respect to Canadian law. The partners and associates of Blake, Cassels & Graydon LLP, collectively, beneficially own, directly or indirectly, less than 1% of our shares. The partners and associates of Stikeman Elliott LLP, collectively, beneficially own, directly or indirectly, less than 1% of our shares.
The consolidated financial statements of CPI Card Group Inc. and its subsidiaries as of December 31, 2014 and 2013 and for each of the years in the three year period ended December 31, 2014, have been included herein in reliance upon the report of KPMG LLP, independent registered public accounting firm, appearing elsewhere herein, and upon the authority of said firm as experts in accounting and auditing.
The financial statements of EFT Source, Inc. as of September 2, 2014 and for the period from January 1, 2014 to September 2, 2014 have been included herein in reliance upon the report of KPMG LLP, independent auditors, appearing elsewhere herein, and upon the authority of said firm as experts in accounting and auditing.
The financial statements of EFT Source, Inc. as of December 31, 2013 and 2012 and for the years then ended have been included herein in reliance upon the report of Lattimore, Black, Morgan & Cain, P.C., independent auditors, appearing elsewhere herein, and upon the authority of said firm as experts in accounting and auditing.
Certain statistical data contained herein have been derived from, and included herein in reliance upon, the market research report prepared by First Annapolis Consulting, Inc., an independent consulting firm, commissioned by the Company and issued on May 13, 2015, and upon the authority of said firm as experts with respect to the matters covered by its report.
None of the experts named above own any registered or beneficial interest, direct or indirect, in any securities or other property of CPI or any of its associates or affiliates.
CHANGE IN INDEPENDENT ACCOUNTANT
Ernst & Young LLP previously served as our independent auditors since 2007. On November 12, 2014, after a customary review, our board of directors dismissed Ernst & Young LLP and retained KPMG LLP as our auditor.
The report of Ernst & Young LLP on our consolidated financial statements of CPI Holdings I, Inc. which comprise the consolidated balance sheet as of December 31, 2013, and the related consolidated statements of operations and comprehensive income (loss), cash flows and stockholders' equity for the
165
fiscal year ended December 31, 2013 contained no adverse opinion or disclaimer of opinion and was not qualified or modified as to uncertainty, audit scope or accounting principle. During the fiscal year ended December 31, 2013 and the subsequent interim period through November 12, 2014, there were no disagreements with Ernst & Young LLP on any matter of accounting principles or practices, financial statement disclosure, or auditing scope or procedures, which disagreement if not resolved to the satisfaction of Ernst & Young LLP would have caused them to make reference thereto in their report on the financial statements for such year. During the fiscal year ended December 31, 2013 and the subsequent interim period through November 12, 2014, there were no reportable events (as defined in Regulation S-K 304(a)(1)(v)).
We have provided Ernst & Young LLP with a copy of the foregoing disclosure and have requested that Ernst & Young LLP furnish us with a letter addressed to the SEC stating whether or not Ernst & Young LLP agrees with the above statements and, if not, stating the respects in which it does not agree.
WHERE YOU CAN FIND MORE INFORMATION
We have filed with the SEC a registration statement on Form S-1 under the Securities Act with respect to the shares of common stock offered hereby. This prospectus, which constitutes a part of the registration statement, does not contain all of the information set forth in the registration statement or the exhibits filed therewith. For further information about us and the common stock offered hereby, reference is made to the registration statement and the exhibits filed therewith. Statements contained in this prospectus regarding the contents of any contract or any other document that is filed as an exhibit to the registration statement are not necessarily complete, and in each instance we refer you to the copy of such contract or other document filed as an exhibit to the registration statement. We currently do not file periodic reports with the SEC. Upon closing of our initial public offering, we will be required to file periodic reports, proxy statements and other information with the SEC pursuant to the Exchange Act. A copy of the registration statement and the exhibits filed therewith may be inspected without charge at the public reference room maintained by the SEC, located at 100 F Street, NE, Washington, DC 20549, and copies of all or any part of the registration statement may be obtained from that office. Please call the SEC at 1-800-SEC-0330 for further information about the public reference room. The SEC also maintains a website that contains reports, proxy and information statements and other information regarding registrants that file electronically with the SEC. The address of the website is www.sec.gov.
166
[ADDITIONAL PAGE FOR CANADIAN PROSPECTUS]
This table sets out particulars of the Common Shares and Preferred Shares issued within the 12-month period prior to the date of this Prospectus. There were no securities exercisable for or exchangeable into Common Shares or Preferred Shares issued within the 12-month period prior to the date of this Prospectus.
Issuance of Common and Preferred Shares
Date of Issuance/Grant
|
Type of Security |
Number of Securities Issued |
Issue Price Per Share | ||||||
|---|---|---|---|---|---|---|---|---|---|
September 2, 2014 |
Common Shares(1) | 257,268 | $ | 11.47 | |||||
September 2, 2014 |
Preferred Shares(1) | 549 | $ | 3,733.88 | |||||
Notes:
- (1)
- Issued in connection with the acquisition of EFT Source, Inc. in September 2014.
Restricted Common Shares
As of the date of this prospectus, a total of 191,664 common shares that have restrictions on transferability ("restricted shares") have been granted by the Company to certain executive officers as an inducement to employment. On June 22, 2015, 147,664 restricted shares were granted to David Brush and 44,000 restricted shares were granted to Lisa Jacoba.
The grants of restricted shares did not involve any cash payments from the recipients, however, the weighted average fair value as at the date of grant is $9.48 per share.
167
[ADDITIONAL PAGE FOR CANADIAN PROSPECTUS]
Composition of the Audit Committee
The Company currently has an Audit Committee (the "Audit Committee") which, upon the Company becoming a reporting issuer in a jurisdiction in Canada, will be comprised of Robert Pearce, Nicholas Peters and Bradley Seaman, all of whom are financially literate. Mr. Pearce is considered independent for the purposes of serving on the audit committee. In accordance with the phase-in schedule under the NASDAQ Global Select Market Rules and Rule 10A-3 under the Exchange Act, the Company expects to add additional independent directors so that the audit committee will have a majority of independent directors within 90 days of the filing of the prospectus, and an entirely independent committee within one year of such date. A description of the education and experience of each Audit Committee member that is relevant to the performance of his responsibilities as an Audit Committee member may be found above under the heading "Management—Executive Officers and Directors."
The Audit Committee will be responsible for, among other matters: (i) appointing, retaining and evaluating our independent registered public accounting firm and approving all services to be performed by them; (ii) overseeing our independent registered public accounting firm's qualifications, independence and performance; (iii) overseeing the financial reporting process and discussing with management and our independent registered public accounting firm the interim and annual financial statements that we file with the SEC; (iv) reviewing and monitoring our accounting principles, accounting policies, financial and accounting controls and compliance with legal and regulatory requirements; (v) establishing procedures for the confidential anonymous submission of concerns regarding questionable accounting, internal controls or auditing matters; and (vi) reviewing and approving related person transactions. The Audit Committee will also review the annual audited financial statements and make recommendations to the Board. A copy of the Audit Committee's charter will be available on our corporate website at www.cpicardgroup.com upon the completion of this offering.
Audit Committee Oversight
Since the commencement of the Company's most recently completed financial year, there has not been a recommendation of the Audit Committee to nominate or compensate an external auditor which was not adopted by the Company's board.
Pre-Approval Policies and Procedures
The Audit Committee will have authority and responsibility for pre-approval of all non-audit services to be provided to the Company by the external auditor, unless such pre-approval is otherwise appropriately delegated or if appropriate specific policies and procedures for the engagement of non-audit services have been adopted by the Audit Committee.
External Auditor Service Fees by Category
In connection with the Company's last fiscal year end, the Company incurred audit fees as set out in the table below. In the table, "audit fees" are fees billed by the Company's external auditor for services provided in auditing the Company's annual financial statements. "Audit-related fees" are fees not included in audit fees that are billed by the auditor for assurance and related services that are reasonably related to the performance of the audit review of the Company's financial statements. "Tax fees" are fees billed by the auditor for professional services rendered for tax compliance, tax advice and tax planning. "All other fees" are fees billed by the auditor for products and services not included in the foregoing categories.
Financial Year Ending
|
Audit Fees | Audit Related Fees | Tax Fees | All Other Fees | |||||||||
|---|---|---|---|---|---|---|---|---|---|---|---|---|---|
December 31, 2014 |
$ | 421,805 | — | — | $ | 345,288 | |||||||
December 31, 2013 |
$ | 482,267 | — | — | $ | 115,523 | |||||||
168
[ADDITIONAL PAGE FOR CANADIAN PROSPECTUS]
The following are the only material contracts, other than those contracts entered into in the ordinary course of business, which we have entered into during the most recently completed financial year or before the most recently completed financial year that are still in effect or to which we are or will become a party on or prior to the closing date of this offering:
- 1.
- The
Underwriting Agreement between us, the selling stockholders and the underwriters, referred to under "Underwriting."
- 2.
- Purchase
and Sale Agreement, dated as of August 22, 2014, by and among William S. Dinker, Katherine S. Nevill, Bobby Smith and Tom
Hedrich, William S. Dinker 2012 Trust for Edward McCullough Dinker, William S. Dinker 2012 Trust for John Walsh Dinker and William S. Dinker 2012 Trust for William S.
Dinker III, EFT Source, Inc., CPI Acquisition, Inc. and William S. Dinker, as Sellers' Representative.
- 3.
- First Lien Credit Agreement, dated as of August 17, 2015, by and among CPI Card Group Inc., CPI Acquisition Inc., the lenders from time to time party thereto and the Bank of Nova Scotia, as Administrative Agent and Collateral Agent, referred to under "Description of Certain Indebtedness."
Copies of the foregoing contracts may be inspected at the Company's head office during ordinary business hours at any time during the period of distribution of the securities offered hereby or may be viewed at the SEC website or on the Company's profile on the SEDAR website maintained by the Canadian Securities Administrators at www.sedar.com.
PURCHASER'S STATUTORY RIGHTS OF RESCISSION
Securities legislation in certain of the provinces and territories of Canada provides purchasers with the right to withdraw from an agreement to purchase securities. This right may be exercised within two business days after receipt or deemed receipt of a prospectus and any amendment. In several of the provinces and territories of Canada, the securities legislation further provides a purchaser with remedies for rescission or, in some jurisdictions, revisions of the price or damages if the prospectus and any amendment contains a misrepresentation or is not delivered to the purchaser, provided that the remedies for rescission, revisions of the price or damages are exercised by the purchaser within the time limit prescribed by the securities legislation of the purchaser's province or territory. The purchaser should refer to any applicable provisions of the securities legislation of the purchaser's province or territory for the particulars of these rights or consult with a legal adviser.
Accounting Standards Relief
The Company has applied to the securities regulatory authority in British Columbia for relief from the requirement in sections 3.2 and 3.3 of NI 52-107—Acceptable Accounting Principles and Auditing Standards ("NI 52-107") that financial statements included in this prospectus be prepared in accordance with International Financial Reporting Standards and audited in accordance with Canadian generally accepted auditing standards (the "Accounting Standards Relief"), respectively. The Accounting Standards Relief will allow the Company to include in this prospectus financial statements prepared in accordance with U.S. generally accepted accounting principles ("U.S. GAAP") and audited in accordance with the standards of the Public Company Accounting Oversight Board (United States) ("U.S. GAAS").
169
[ADDITIONAL PAGE FOR CANADIAN PROSPECTUS]
In connection with the offering, the Company is filing the Registration Statement with the SEC. On the effective date of the Registration Statement, the Company will become an "SEC issuer" within the meaning of NI 52-107. As prescribed by U.S. federal securities laws, the financial statements included in the U.S. Prospectus included herein have been prepared in accordance U.S. GAAP and audited in accordance with U.S. GAAS. The Company's application for the Accounting Standards Relief is based on the fact that the use of U.S. GAAP and U.S. GAAS is permitted by NI 52-107 for reporting issuers that are SEC issuers. In accordance with National Policy 11-202—Process for Prospectus Reviews in Multiple Jurisdictions ("NP 11-202"), the issuance of a receipt by the securities regulatory authority in British Columbia for the final prospectus will constitute evidence that the Accounting Standards Relief has been granted.
170
INDEX TO CONSOLIDATED FINANCIAL STATEMENTS
F-1
Report of Independent Registered Public Accounting Firm
The
Board of Directors
CPI Card Group Inc.:
We have audited the accompanying consolidated balance sheets of CPI Card Group Inc. (the Company) and subsidiaries as of December 31, 2014 and 2013, and the related consolidated statements of operations and comprehensive income (loss), stockholders' deficit, and cash flows for each of the years in the three year period ended December 31, 2014. These consolidated financial statements are the responsibility of the Company's management. Our responsibility is to express an opinion on these consolidated financial statements based on our audits.
We conducted our audits in accordance with the standards of the Public Company Accounting Oversight Board (United States). Those standards require that we plan and perform the audit to obtain reasonable assurance about whether the financial statements are free of material misstatement. An audit includes examining, on a test basis, evidence supporting the amounts and disclosures in the financial statements. An audit also includes assessing the accounting principles used and significant estimates made by management, as well as evaluating the overall financial statement presentation. We believe that our audits provide a reasonable basis for our opinion.
In our opinion, the consolidated financial statements referred to above present fairly, in all material respects, the financial position of CPI Card Group Inc. and subsidiaries as of December 31, 2014 and 2013, and the results of their operations and their cash flows for each of the years in the three year period ended December 31, 2014, in conformity with U.S. generally accepted accounting principles.
/s/ KPMG LLP
Denver,
Colorado
July 7, 2015, except as to
Note 20, which is as of September 4, 2015
F-2
CPI Card Group Inc. and Subsidiaries
Consolidated Balance Sheets
(Dollars in Thousands, Except Shares and Per Share Amounts)
| |
December 31, | ||||||
|---|---|---|---|---|---|---|---|
| |
2014 | 2013 | |||||
Assets |
|||||||
Current assets: |
|||||||
Cash and cash equivalents |
$ | 12,941 | $ | 9,702 | |||
Accounts receivable, net of allowances of $272 and $1,365, respectively |
43,548 | 31,435 | |||||
Inventories |
21,605 | 17,551 | |||||
Prepaid expenses and other current assets |
4,129 | 1,612 | |||||
Income taxes refundable |
— | 3,061 | |||||
Deferred income taxes |
634 | 2,597 | |||||
Current assets of a discontinued operation |
5,862 | — | |||||
| | | | | | | | |
Total current assets |
88,719 | 65,958 | |||||
Plant, equipment and leasehold improvements, net |
44,772 |
36,650 |
|||||
Capitalized loan fees |
614 | 1,166 | |||||
Intangible assets, net |
58,703 | 26,266 | |||||
Goodwill |
73,801 | 40,818 | |||||
Deferred income taxes |
— | 1,009 | |||||
Other assets |
15 | — | |||||
| | | | | | | | |
Total assets |
$ | 266,624 | $ | 171,867 | |||
| | | | | | | | |
| | | | | | | | |
| | | | | | | | |
Liabilities and stockholders' deficit |
|||||||
Current liabilities: |
|||||||
Accounts payable |
$ | 16,276 | $ | 16,077 | |||
Accrued expenses |
10,591 | 7,613 | |||||
Deferred revenue and customer deposits |
3,382 | 4,431 | |||||
Current maturities of long-term debt |
6,326 | 6,841 | |||||
Income taxes payable |
13 | — | |||||
| | | | | | | | |
Total current liabilities |
36,588 | 34,962 | |||||
Long-term debt, net of current maturities |
164,098 |
115,465 |
|||||
Sellers Note |
9,000 | — | |||||
Deferred income taxes |
13,810 | — | |||||
Other long-term liabilities |
6,572 | 2,135 | |||||
| | | | | | | | |
Total liabilities |
230,068 | 152,562 | |||||
Commitments and contingencies |
|||||||
Series A Preferred Stock; $0.001 par value—100,000 shares authorized; 86,407 shares issued and 64,809 shares outstanding and 85,858 shares issued and 64,260 shares outstanding; liquidation preference of $256,017 and $211,540 at December 31, 2014 and 2013 respectively |
58,250 |
56,201 |
|||||
Stockholders' deficit: |
|||||||
Common Stock; $0.001 par value—75,000,000 shares authorized; 44,840,576 shares issued and 41,371,220 shares outstanding and 44,583,308 shares issued and 41,113,952 shares outstanding at December 31, 2014 and 2013, respectively |
2 | 2 | |||||
Additional paid-in capital |
(24,802 | ) | (27,747 | ) | |||
Accumulated earnings (deficit) |
5,798 | (7,504 | ) | ||||
Accumulated other comprehensive loss |
(2,584 | ) | (1,520 | ) | |||
Employee notes receivable |
(108 | ) | (127 | ) | |||
| | | | | | | | |
Total stockholders' deficit |
(21,694 | ) | (36,896 | ) | |||
| | | | | | | | |
Total liabilities and stockholders' deficit |
$ | 266,624 | $ | 171,867 | |||
| | | | | | | | |
| | | | | | | | |
| | | | | | | | |
See accompanying notes to consolidated financial statements
F-3
CPI Card Group Inc. and Subsidiaries
Consolidated Statements of Operations and Comprehensive Income (Loss)
(Dollars in Thousands,
Except Per Share Amounts)
| |
Year Ended December 31, | |||||||||
|---|---|---|---|---|---|---|---|---|---|---|
| |
2014 | 2013 | 2012 | |||||||
Net sales: |
||||||||||
Products |
$ | 159,220 | $ | 101,360 | $ | 98,969 | ||||
Services |
101,786 | 95,010 | 84,817 | |||||||
| | | | | | | | | | | |
Total net sales |
261,006 | 196,370 | 183,786 | |||||||
| | | | | | | | | | | |
Cost of sales: |
||||||||||
Products (exclusive of depreciation and amortization shown below) |
105,580 | 66,154 | 65,777 | |||||||
Services (exclusive of depreciation and amortization shown below) |
65,052 | 63,054 | 58,360 | |||||||
Depreciation and amortization |
8,647 | 7,666 | 6,760 | |||||||
| | | | | | | | | | | |
Total cost of sales |
179,279 | 136,874 | 130,897 | |||||||
| | | | | | | | | | | |
Gross profit |
81,727 | 59,496 | 52,889 | |||||||
Operating expenses: |
||||||||||
Selling, general and administrative (exclusive of depreciation and amortization shown below) |
42,650 | 29,418 | 29,231 | |||||||
Depreciation and amortization |
4,605 | 3,929 | 3,754 | |||||||
| | | | | | | | | | | |
Total operating expenses |
47,255 | 33,347 | 32,985 | |||||||
| | | | | | | | | | | |
Income from operations |
34,472 | 26,149 | 19,904 | |||||||
Other income (expense): |
||||||||||
Interest, net |
(7,508 | ) | (7,838 | ) | (5,765 | ) | ||||
Foreign currency loss |
(124 | ) | (142 | ) | (279 | ) | ||||
Loss on debt modification and early extinguishment |
(476 | ) | — | — | ||||||
Gain on purchase of ID Data |
— | — | 604 | |||||||
Other income (expense), net |
(101 | ) | 18 | 171 | ||||||
| | | | | | | | | | | |
Total other expense |
(8,209 | ) | (7,962 | ) | (5,269 | ) | ||||
| | | | | | | | | | | |
Income before income taxes |
26,263 | 18,187 | 14,635 | |||||||
Provision for income taxes |
(10,291 | ) | (6,988 | ) | (5,909 | ) | ||||
| | | | | | | | | | | |
Net income from continuing operations |
15,972 | 11,199 | 8,726 | |||||||
Loss from a discontinued operation, net of taxes (note 4) |
(2,670 | ) | (2,612 | ) | (3,796 | ) | ||||
| | | | | | | | | | | |
Net income |
$ | 13,302 | $ | 8,587 | $ | 4,930 | ||||
| | | | | | | | | | | |
| | | | | | | | | | | |
| | | | | | | | | | | |
Other Comprehensive Income |
||||||||||
Currency translation adjustment |
(1,064 | ) | (261 | ) | 604 | |||||
| | | | | | | | | | | |
Total comprehensive income |
$ | 12,238 | $ | 8,326 | $ | 5,534 | ||||
| | | | | | | | | | | |
| | | | | | | | | | | |
| | | | | | | | | | | |
Net income from continuing operations |
$ | 15,972 | $ | 11,199 | $ | 8,726 | ||||
Preferred stock dividends |
(44,477 | ) | (35,268 | ) | (36,363 | ) | ||||
| | | | | | | | | | | |
Loss from continuing operations attributable to common stockholders |
(28,505 | ) | (24,069 | ) | (27,637 | ) | ||||
Loss from a discontinued operation, net of taxes |
(2,670 | ) | (2,612 | ) | (3,796 | ) | ||||
| | | | | | | | | | | |
Net loss attributable to common stockholders |
$ | (31,175 | ) | $ | (26,681 | ) | $ | (31,433 | ) | |
| | | | | | | | | | | |
| | | | | | | | | | | |
| | | | | | | | | | | |
Basic and diluted loss per share: |
||||||||||
Continued operations |
$ | (0.69 | ) | $ | (0.59 | ) | $ | (0.67 | ) | |
Discontinued operation |
(0.07 | ) | (0.06 | ) | (0.09 | ) | ||||
| | | | | | | | | | | |
|
$ | (0.76 | ) | $ | (0.65 | ) | $ | (0.76 | ) | |
| | | | | | | | | | | |
| | | | | | | | | | | |
| | | | | | | | | | | |
See accompanying notes to consolidated financial statements
F-4
CPI Card Group Inc. and Subsidiaries
Consolidated Statement of Stockholders' Deficit
(Dollars in Thousands, Except Share Amounts)
| |
Common Shares | |
|
Accumulated other comprehensive loss |
|
|
||||||||||||||||
|---|---|---|---|---|---|---|---|---|---|---|---|---|---|---|---|---|---|---|---|---|---|---|
| |
Additional paid-in capital |
Accumulated earnings (deficit) |
Employee notes receivable |
|
||||||||||||||||||
| |
Shares | Amount | Total | |||||||||||||||||||
January 1, 2012 |
40,888,782 | $ | 2 | $ | 621 | $ | (21,021 | ) | $ | (1,863 | ) | $ | (463 | ) | $ | (22,724 | ) | |||||
Issuance of common stock, net of issuance costs |
380,116 | — | — | — | — | — | — | |||||||||||||||
Preferred stock dividend |
— | — | (28,368 | ) | — | — | — | (28,368 | ) | |||||||||||||
Repayment of employee note |
326 | 326 | ||||||||||||||||||||
Components of comprehensive income: |
||||||||||||||||||||||
Net income |
— | — | — | 4,930 | — | — | 4,930 | |||||||||||||||
Currency translation adjustment |
— | — | — | — | 604 | — | 604 | |||||||||||||||
| | | | | | | | | | | | | | | | | | | | | | | |
December 31, 2012 |
41,268,898 | $ | 2 | $ | (27,747 | ) | $ | (16,091 | ) | $ | (1,259 | ) | $ | (137 | ) | $ | (45,232 | ) | ||||
Issuance of common stock, net of issuance costs |
123,112 | — | — | — | — | — | — | |||||||||||||||
Redemption of common stock |
(278,058 | ) | — | — | — | — | — | — | ||||||||||||||
Repayment of employee note |
10 | 10 | ||||||||||||||||||||
Components of comprehensive income: |
||||||||||||||||||||||
Net income |
— | — | — | 8,587 | — | — | 8,587 | |||||||||||||||
Currency translation adjustment |
— | — | — | (261 | ) | — | (261 | ) | ||||||||||||||
| | | | | | | | | | | | | | | | | | | | | | | |
December 31, 2013 |
41,113,952 | $ | 2 | $ | (27,747 | ) | $ | (7,504 | ) | $ | (1,520 | ) | $ | (127 | ) | $ | (36,896 | ) | ||||
Issuance of common stock |
257,268 | — | 2,945 | — | — | — | 2,945 | |||||||||||||||
Repayment of employee note |
— | — | — | — | — | 19 | 19 | |||||||||||||||
Components of comprehensive income: |
||||||||||||||||||||||
Net income |
— | — | — | 13,302 | — | — | 13,302 | |||||||||||||||
Currency translation adjustment |
— | — | — | — | (1,064 | ) | — | (1,064 | ) | |||||||||||||
| | | | | | | | | | | | | | | | | | | | | | | |
December 31, 2014 |
41,371,220 | $ | 2 | $ | (24,802 | ) | $ | 5,798 | $ | (2,584 | ) | $ | (108 | ) | $ | (21,694 | ) | |||||
| | | | | | | | | | | | | | | | | | | | | | | |
| | | | | | | | | | | | | | | | | | | | | | | |
| | | | | | | | | | | | | | | | | | | | | | | |
See accompanying notes to consolidated financial statements
F-5
CPI Card Group Inc. and Subsidiaries
Consolidated Statements of Cash Flows
(Dollars in Thousands)
| |
Year Ended December 31, | |||||||||
|---|---|---|---|---|---|---|---|---|---|---|
| |
2014 | 2013 | 2012 | |||||||
Operating activities |
||||||||||
Net income |
$ | 13,302 | $ | 8,587 | $ | 4,930 | ||||
Adjustments to reconcile net income from continuing operations to net cash provided by operating activities, net of effects of acquisitions: |
||||||||||
Depreciation, amortization and accretion expense |
14,789 | 14,295 | 12,666 | |||||||
Non-cash accretion of defined stock compensation plan |
4,534 | 610 | — | |||||||
Loss on debt modification and extinguishment |
476 | — | — | |||||||
Deferred income tax |
(1,433 | ) | 1,960 | 1,001 | ||||||
Other |
80 | 27 | 456 | |||||||
Unrealized foreign currency exchange (gain) / loss |
(204 | ) | (94 | ) | 130 | |||||
Gain on purchase of ID Data |
— | — | (604 | ) | ||||||
Changes in operating assets and liabilities: |
||||||||||
Accounts receivable |
(7,003 | ) | 4,368 | (1,426 | ) | |||||
Inventories |
(5,763 | ) | 5,705 | (270 | ) | |||||
Prepaid expenses and other current assets |
(8,473 | ) | 572 | 759 | ||||||
Income taxes refundable |
3,061 | (1,013 | ) | (1,995 | ) | |||||
Accounts payable |
1,466 | (9,006 | ) | 8,559 | ||||||
Accrued expenses |
12,567 | (2,192 | ) | (1,793 | ) | |||||
Deferred revenue and customer deposits |
(772 | ) | (197 | ) | (1,088 | ) | ||||
| | | | | | | | | | | |
Cash provided by operating activities |
26,627 | 23,622 | 21,325 | |||||||
Investing activities |
||||||||||
Acquisition of EFT Source, Inc |
(54,859 | ) | — | — | ||||||
Acquisition of ID Data |
— | — | (1,156 | ) | ||||||
Acquisitions of plant, equipment and leasehold improvements |
(16,956 | ) | (9,240 | ) | (11,047 | ) | ||||
| | | | | | | | | | | |
Cash used in investing activities |
(71,815 | ) | (9,240 | ) | (12,203 | ) | ||||
Financing activities |
||||||||||
Payment on long-term debt |
(11,045 | ) | (7,122 | ) | (5,565 | ) | ||||
Proceeds from long-term debt |
60,000 | — | 24,505 | |||||||
Payment on line of credit |
(19,300 | ) | (14,750 | ) | — | |||||
Proceeds from line of credit |
19,300 | 9,750 | 5,000 | |||||||
Loan issuance costs |
(440 | ) | — | (192 | ) | |||||
Proceeds from employee note receivable |
19 | 10 | 326 | |||||||
Proceeds from sale of Company stock, net of issuance costs |
— | 50 | 181 | |||||||
Dividend distribution |
— | — | (28,367 | ) | ||||||
Redemption of preferred and common stock |
— | (48 | ) | (16,632 | ) | |||||
| | | | | | | | | | | |
Cash provided by (used in) financing activities |
48,534 | (12,110 | ) | (20,744 | ) | |||||
Effect of exchange rates on cash |
(107 |
) |
37 |
111 |
||||||
| | | | | | | | | | | |
Net increase (decrease) in cash and cash equivalents: |
3,239 | 2,309 | (11,511 | ) | ||||||
Cash and cash equivalents, beginning of period |
9,702 | 7,393 | 18,904 | |||||||
| | | | | | | | | | | |
Cash and cash equivalents, end of period |
$ | 12,941 | $ | 9,702 | $ | 7,393 | ||||
| | | | | | | | | | | |
| | | | | | | | | | | |
| | | | | | | | | | | |
Supplemental disclosures of cash flow information |
||||||||||
Cash paid during the period for: |
||||||||||
Interest |
$ | 6,793 | $ | 7,248 | $ | 5,323 | ||||
| | | | | | | | | | | |
| | | | | | | | | | | |
| | | | | | | | | | | |
Income taxes |
$ | 3,219 | $ | 4,680 | $ | 4,269 | ||||
| | | | | | | | | | | |
| | | | | | | | | | | |
| | | | | | | | | | | |
See accompanying notes to consolidated financial statements
F-6
CPI Card Group Inc. and Subsidiaries
Notes to Consolidated Financial Statements
(Dollars in Thousands, Except Share and Per Share Amounts or as Otherwise Indicated)
1. Business
CPI Card Group Inc., formerly known as CPI Holdings I, Inc. (which, together with its subsidiary companies, is referred to herein as "CPI" or the "Company") is engaged in the design, production, data personalization, packaging and fulfillment of Financial Payment Cards which the Company defines as credit cards, debit cards and prepaid debit cards issued on the networks of the Payment Card Brands (Visa, MasterCard, American Express, Discover and Interac (in Canada)) in the United States, Europe and Canada. The Company also is engaged in the design, production, data personalization, packaging and fulfillment of retail gift and loyalty cards (primarily in Europe and Canada).
The Company's business consists of three reportable segments: the U.S. Debit and Credit segment, the U.S. Prepaid Debit segment and the U.K. Limited segment.
- •
- U.S. Debit and Credit Segment. The U.S. Debit and Credit
segment primarily produces Financial Payment Cards and provides integrated card services to card-issuing banks in the United States. Products manufactured by this segment primarily include EMV and
non-EMV credit cards, debit cards and prepaid debit cards issued on the networks of the Payment Card Brands, private label credit cards that are not issued on the networks of the Payment Cards Brands
and instant issuance systems. This segment also provides a variety of integrated card services, including card personalization and fulfillment services and instant issuance services. The U.S. Debit
and Credit segment includes the Company's operations in Colorado, Indiana and Tennessee, which are each certified by multiple global Payment Card Brands, and where required by the Company's customers
and the PCI Security Standards Council.
- •
- U.S. Prepaid Debit Segment. The U.S. Prepaid Debit
segment primarily provides integrated card services to prepaid debit card issuers in the United States. Services provided include tamper-evident security packaging services and card personalization
and fulfillment services. This segment also produces Financial Payment Cards issued on the networks of the payment card brands that are included in the tamper-evident security packages mentioned
above. The U.S. Prepaid Debit segment includes the Company's operation in Minnesota which is certified by multiple global Payment Card Brands and the PCI Security Standards Council.
- •
- U.K. Limited Segment. The U.K. Limited segment primarily produces retail gift and loyalty cards for customers in the United Kingdom and continental Europe. This segment also provides card personalization and fulfillment services. The U.K. Limited segment includes the Company's operations in Colchester, United Kingdom and Liverpool, United Kingdom. Neither of the Company's operations in this segment is certified by any of the Payment Card Brands, nor are they PCI certified.
The Company applied acquisition accounting for the acquisition of both EFT Source, Inc. (the "EFT Acquisition") and ID Data, Limited ("ID Data" or the "ID Data acquisition") in accordance with Accounting Standards Codification (ASC) 805, Business Combinations. As such, the acquired assets and assumed liabilities were recorded at fair value as of the acquisition date. See Note 3 for more information related to the acquisitions.
The Company sold its non-secure operation located in Nevada on January 12, 2015 (the "Nevada Sale") under an asset purchase agreement for $5,000 in cash. Nevada primarily produced retail gift cards that are not issued on the networks of the Payment Card Brands. Accordingly, the Company's consolidated balance sheets and statements of operations and comprehensive income have been
F-7
CPI Card Group Inc. and Subsidiaries
Notes to Consolidated Financial Statements (Continued)
(Dollars in Thousands, Except Share and Per Share Amounts or as Otherwise Indicated)
1. Business (Continued)
reclassified to present Nevada as a discontinued operation for the years ended December 31, 2014, 2013 and 2012. See Note 4 for more information related to the discontinued operation and disposition.
As a producer and provider of services for Financial Payment Cards, each of the Company's secure facilities must be certified by one or more of the Payment Card Brands and are therefore subject to specific requirements and conditions. Noncompliance with these requirements would prohibit the individual facilities of the Company from producing Financial Payment Cards for these entities' payment card issuers.
2. Summary of Significant Accounting Policies
Basis of Presentation
The accompanying consolidated financial statements include the Company and its wholly-owned subsidiaries. All significant intercompany accounts and transactions have been eliminated in the consolidated financial statements.
Subsequent to the initial issuance of the Company's consolidated financial statements as of and for the years ended December 31, 2014 and December 31, 2013, the Company identified immaterial errors to those financial statements related to the customer relationship intangible asset of the CPI Nevada operating segment, and the related amortization of the intangible asset which should have been impaired prior to 2012. Those immaterial errors have been corrected in the accompanying consolidated financial statements.
As a result of the correction, there was a decrease for 2014 in intangible assets, net and deferred income taxes in the consolidated balance sheet of $16,449 and $5,928, respectively. In addition, in 2014, there was a decrease in depreciation and amortization expense associated with cost of sales and an increase in the provision for income taxes in the consolidated statement of operations and comprehensive income (loss) of $1,395 and $503, respectively.
For 2013, there was a decrease in intangible assets, net and deferred income taxes in the consolidated balance sheet of $17,884 and $6,471, respectively. In addition, in 2013, there was a decrease in depreciation and amortization expense associated with cost of sales and an increase in the provision for income taxes in the consolidated statement of operations and comprehensive income (loss) of $1,435 and $517, respectively.
Revenue Recognition
Generally, the Company recognizes revenue related to sales of its products upon shipment, when persuasive evidence of an arrangement exists, delivery has occurred or services have been rendered, the fee is fixed or determinable and collectability is reasonably assured.
In certain cases, at the customer's request, the Company enters into bill-and-hold transactions whereby title transfers to the customer, but the product does not ship until a specified later date. The Company recognizes revenue associated with bill-and-hold arrangements when the product is complete and ready to ship, hold criteria have been met, the amount due from the customer is fixed and collectability of the related receivable is reasonably assured.
F-8
CPI Card Group Inc. and Subsidiaries
Notes to Consolidated Financial Statements (Continued)
(Dollars in Thousands, Except Share and Per Share Amounts or as Otherwise Indicated)
2. Summary of Significant Accounting Policies (Continued)
Freight revenue totaling $4,249, $4,278 and $3,885 is included in net sales during the years ended December 31, 2014, 2013 and 2012, respectively. The related freight costs are included in cost of sales.
Multiple-Element Arrangements
The Company enters into warehouse, fulfillment and distribution service agreements with several customers, engaging the Company to store and handle completed cards and packages on their behalf. For the sales arrangements that contain multiple deliverables, the arrangement is split into separate units of accounting and individually delivered elements have value to the customer on a standalone basis. When separate units of accounting exist, revenue is allocated to each element based on the Company's best estimate of competitive market prices. At the point in which completed cards and packages are shipped to the Company's warehouse, the product is billed and the revenue is recognized in accordance with the Company's revenue recognition policy. Warehousing services revenue is recognized monthly based on volume and handling requirements; fulfillment services revenue is recognized when the product is handled in the manner specified by the customer for a unit or handling fee.
Cash and Cash Equivalents
The Company considers all highly liquid investments with original maturities of three months or less to be cash equivalents and they are stated at cost, which approximates fair value.
Trade Accounts Receivable and Concentration of Credit Risk
Accounts receivable are stated at the amount management expects to collect from outstanding balances. The Company performs ongoing credit evaluations of its customers and generally requires no collateral to secure accounts receivable. The Company maintains an allowance for potentially uncollectible accounts receivable based upon its assessment of the collectability of accounts receivable. Accounts are written off against the allowance when it becomes probable collection will not occur. The allowance for bad debt and credit activity for the years ended December 31, 2014 and 2013 is summarized as follows:
Balance as of December 31, 2012 |
$ | 1,034 | ||
Bad debt expense |
650 | |||
Write-off of uncollectible accounts |
(320 | ) | ||
Currency translation adjustments |
1 | |||
| | | | | |
Balance as of December 31, 2013 |
1,365 | |||
Bad debt expense |
(100 | ) | ||
Write-off of uncollectible accounts |
(986 | ) | ||
Currency translation adjustments |
(7 | ) | ||
| | | | | |
Balance as of December 31, 2014 |
$ | 272 | ||
| | | | | |
| | | | | |
| | | | | |
For the year ended December 31, 2014, the Company had sales to one customer of $29,523 (11.3% of consolidated net sales). For the years ended December 31, 2013 and 2012, the Company had sales to
F-9
CPI Card Group Inc. and Subsidiaries
Notes to Consolidated Financial Statements (Continued)
(Dollars in Thousands, Except Share and Per Share Amounts or as Otherwise Indicated)
2. Summary of Significant Accounting Policies (Continued)
a different customer of $31,924 (16.3% of consolidated net sales) and $27,510 (15.0% of consolidated net sales), respectively.
Inventories
Inventories consist of raw materials, work-in-process and finished goods and are valued at the lower-of-cost (determined on the first-in, first-out or specific identification basis) or market.
Plant, Equipment and Leasehold Improvements
Plant, equipment and leasehold improvements are recorded at cost. Accumulated depreciation is computed using the straight-line method over the lesser of the estimated useful life of the related assets (generally 3 to 10 years for equipment, furniture and leasehold improvements) or, when applicable, the lease term. Maintenance and repairs that do not extend the useful life of the respective assets are charged to expense as incurred. For the Company's continuing operations, amounts charged to expense for the depreciation of plant, equipment and leasehold improvements were $10,359, $9,560, and $8,438 for the years ended December 31, 2014, 2013 and 2012, respectively.
Long-lived assets with finite lives are reviewed for impairment whenever events indicate that the carrying amount of the asset or the carrying amounts of the asset group containing the asset may not be recoverable. In such reviews, estimated undiscounted future cash flows associated with these assets or asset groups are compared with their carrying value to determine if a write-down to fair value is required. Based upon the Company's analysis, it concluded that there was no impairment of its long-lived assets for the years ended December 31, 2014, 2013 and 2012, respectively.
Goodwill and Intangible Assets
Goodwill and other indefinite-lived intangible assets are not amortized, but instead are tested for impairment at least annually on October 1. Testing is done in accordance with ASC 350, Intangibles—Goodwill and Other and ASC 820, Fair Value Measurements and Disclosures. For impairment evaluations, the Company or third-party firm first makes a qualitative assessment with respect to both goodwill and other indefinite-lived intangibles. In the case of goodwill, if it is more likely than not that a reporting unit's fair value is less than its carrying value, the fair value of the reporting unit is compared to its respective carrying amount. If the carrying value of a reporting unit were to exceed its fair value, any excess of the carrying amount over the fair value would be charged to operations as an impairment loss. With respect to indefinite-lived intangible assets, if it is more-likely-than-not that the fair value of an indefinite-lived intangible asset is less than its carrying value, any excess of the carrying value over the fair value of the indefinite-lived intangible asset is also charged to operations as an impairment loss.
For the years ending December 31, 2014, 2013 and 2012 the Company determined goodwill and other indefinite-lived intangibles were not impaired. As of December 31, 2014, 2013 and 2012, $24,377, $27,562 and $30,747 of goodwill were tax-deductible, respectively.
Acquired finite-lived intangible assets are amortized on a straight-line basis over the estimated useful lives of the assets. The estimated remaining useful lives for intangible assets range 1 to
F-10
CPI Card Group Inc. and Subsidiaries
Notes to Consolidated Financial Statements (Continued)
(Dollars in Thousands, Except Share and Per Share Amounts or as Otherwise Indicated)
2. Summary of Significant Accounting Policies (Continued)
14.5 years. Acquired indefinite-lived intangible assets related to trademarks are capitalized and subject to impairment.
Capitalized Loan Fees
Certain costs incurred with borrowings or the establishment/modification of credit facilities are capitalized. These costs are amortized as an adjustment to interest expense over the life of the borrowing using the effective-interest rate method.
Income Taxes
The Company accounts for income taxes using an asset and liability approach to financial accounting and reporting for income taxes. Deferred income tax assets and liabilities are computed annually for differences between the financial statement and tax bases of assets and liabilities that will result in taxable or deductible amounts in the future based on enacted tax laws and rates applicable to the periods in which the differences are expected to affect taxable income.
The Company accounts for uncertain income tax positions in accordance with ASC 740, Income Taxes. ASC 740 prescribes a recognition threshold and measurement standard for the financial statement recognition and measurement of an income tax position taken or expected to be taken in a tax return. Only tax positions that meet the more-likely-than-not recognition threshold at the effective date may be recognized or continue to be recognized upon adoption. In addition, ASC 740 provides guidance on de-recognition, classification, interest and penalties, accounting in interim periods, disclosure, and transition.
The Company has analyzed its filing positions in all of the jurisdictions where it is required to file income tax returns, as well as all open tax years in these jurisdictions, and based upon its review, determined there are no unrecognized tax liabilities as of December 31, 2014 and 2013.
The Company is generally subject to potential federal and state examinations for the tax years after December 31, 2010 for federal purposes and December 31, 2009 for state purposes.
Stock-Based Compensation
The Company uses the fair value recognition provisions of ASC 718, Compensation—Stock Compensation. The Black-Scholes option pricing model is used to estimate stock option fair values. This option pricing model requires a number of assumptions, of which the most significant are estimated common stock fair value, expected stock price volatility, the expected forfeiture rate and the expected option term (the length of time from the grant date until the options are exercised or expire). Expected volatility was calculated based on an analysis of the volatility of stock prices for public companies in the Company's business segment. Forfeitures are assumed to be minimal, given that the Company has a limited history of forfeitures. The expected option life is estimated to be five years, based on the historical exercise patterns of option holders. See Notes 17 and 18 for additional information regarding stock-based compensation.
F-11
CPI Card Group Inc. and Subsidiaries
Notes to Consolidated Financial Statements (Continued)
(Dollars in Thousands, Except Share and Per Share Amounts or as Otherwise Indicated)
2. Summary of Significant Accounting Policies (Continued)
Advertising Costs
Advertising costs are expensed as incurred. Advertising costs during the years ended December 31, 2014, 2013 and 2012 were $392, $144 and $710, respectively.
Use of Estimates
Management uses estimates and assumptions relating to the reporting of assets and liabilities in its preparation of the consolidated financial statements. Significant items subject to such estimates and assumptions include the carrying amount of property and equipment, goodwill and intangible assets, valuation allowances for receivables, inventories, deferred tax assets and stock-based compensation expense. Actual results could differ from those estimates.
Foreign Currency Translation
Financial statements of foreign subsidiaries that use local currencies as their functional currency are translated into U.S. dollars using the exchange rate at each balance sheet date for assets and liabilities and the weighted-average exchange rate for each period for revenues, expenses, gains and losses. Translation adjustments are recorded as the only component of other comprehensive income in the accompanying financial statements. Foreign currency transaction gains and losses resulting from the process of re-measurement are recorded in other income (expense) in the accompanying consolidated statements of operations and comprehensive income. For the years ended December 31, 2014, 2013 and 2012 there were $124, $142 and $279 of such foreign currency losses, respectively.
Recently Issued Accounting Pronouncements
The Financial Accounting Standards Board (FASB) issued Accounting Standards Update (ASU) 2014-09, Revenue from Contracts with Customers, in May 2014. ASU 2014-09 requires an entity to recognize revenue to depict the transfer of promised goods or services to customers in an amount that reflects the consideration to which the entity expects to be entitled in exchange for those goods or services. An entity should also disclose sufficient quantitative and qualitative information to enable users of financial statements to understand the nature, amount, timing and uncertainty of revenue and cash flows arising from contracts with customers. The new standard is effective for annual reporting periods beginning after December 15, 2017. The Company will implement the provisions of ASU 2014-09 as of January 1, 2018. The Company is in the process of determining the method of adoption and assessing the impact of ASU 2014-09 on its results of operations, financial position and consolidated financial statements.
The FASB issued ASU 2015-03, Interest—Imputation of Interest, in April 2015. ASU 2015-03 requires debt issuance costs related to a recognized debt liability to be presented on the balance sheet as a direct deduction from the debt liability, similar to the presentation of debt discounts. The new standard is effective for public entities annual reporting periods beginning after December 15, 2015. We do not expect that this pronouncement will have a material impact on our consolidated financial statements.
F-12
CPI Card Group Inc. and Subsidiaries
Notes to Consolidated Financial Statements (Continued)
(Dollars in Thousands, Except Share and Per Share Amounts or as Otherwise Indicated)
3. Acquisitions
(a) EFT Source Acquisition
On September 2, 2014, CPI Card Group Inc., through its wholly-owned subsidiary, CPI Acquisition, Inc., purchased EFT Source, Inc. ("EFT Source") headquartered in Nashville, Tennessee. EFT Source is a provider of Financial Payment Card services such as data personalization and fulfillment in the U.S. market. The primary reasons for the acquisition were to extend the Company's existing product lines, expand its markets and increase revenue.
Purchase Price
Total consideration for the EFT Acquisition of $68,859 was paid in cash of $54,865 and non-cash considerations of the Sellers Note of $9,000 and issuance of $4,994 of CPI Card Group Inc. preferred and common stock.
Allocation of Purchase Price
The EFT Acquisition was accounted for in accordance with ASC 805, Business Combinations. As such, the acquired assets and assumed liabilities have been recorded at their estimated acquisition date fair values.
The allocation of purchase price to the assets acquired and liabilities assumed at the EFT Acquisition date is presented below:
Cash and cash equivalents |
$ | 381 | ||
Accounts receivable |
5,837 | |||
Inventory |
1,724 | |||
Prepaid expenses |
1,426 | |||
Other current assets |
645 | |||
Property, equipment and leasehold improvements, net |
6,460 | |||
Goodwill |
33,619 | |||
Intangible assets subject to amortization(a) |
31,100 | |||
Trademarks (indefinite-lived) |
4,400 | |||
Other assets |
13 | |||
Deferred tax liability |
(14,751 | ) | ||
Other current liabilities |
(1,995 | ) | ||
| | | | | |
Total purchase price |
$ | 68,859 | ||
| | | | | |
| | | | | |
| | | | | |
- (a)
- Amounts primarily include intangible assets related to customer relationships. At September 2, 2014, the weighted average useful life of EFT Source customer relationships was 15 years.
The fair value of the intangible assets acquired was primarily determined based upon the present value of expected future cash flows, utilizing a risk-adjusted discount rate. The customer relationships were valued based on a "multi-period excess earnings approach." The "multi-period excess earnings approach" measures an asset's value as the present value of cash flows generated by the asset adjusted
F-13
CPI Card Group Inc. and Subsidiaries
Notes to Consolidated Financial Statements (Continued)
(Dollars in Thousands, Except Share and Per Share Amounts or as Otherwise Indicated)
3. Acquisitions (Continued)
for contributory charges for other assets which contribute to the cash flows. The non-compete agreements were valued based on a "with and without" approach. The "with and without" method measures an asset value by estimating the difference in cash flows generated by the business with the asset in-use versus without the asset. The difference in cash flows is attributable to incremental earnings or cost savings associated with the asset. The trademark and trade names were valued based on a "relief from royalty" approach. The "relief from royalty" method is based on the premise that a third party would be willing to pay a royalty to use the trade name or trademark asset owned by the subject company. The projected royalties are converted into their present value equivalents through the application of a risk adjusted discount rate.
The Company recorded the excess of the aggregate purchase price over the estimated fair values of the identifiable assets acquired as goodwill, which is not deductible for tax purposes.
The assets and liabilities assumed in the acquisition and the results of EFT Source operations were included in the Company's consolidated financial statements as of September 2, 2014.
(b) ID Data, Limited Acquisition
On May 23, 2012, CPI Card Group Inc. through its wholly-owned indirect subsidiary, CPI Card Group—Petersfield, Inc., purchased certain assets of ID Data. ID Data is located in Petersfield, England, and serves both the secure financial card market and the retail, gift, loyalty, and government ID card markets. ID Data produces cards, including Financial Payment Cards (magnetic stripe and EMV) and provides card services (data personalization, card issuance and fulfillment) to customers throughout Europe.
Purchase Price
Consideration for the ID Data acquisition was cash of $1,156, which was funded by the Company with available cash.
Allocation of Purchase Price
The acquisition was accounted for as a business combination in accordance with ASC 805. As such, the acquired assets and assumed liabilities have been recorded at their estimated acquisition date fair values.
The Company has estimated that the fair value of the identifiable assets, net of the liabilities assumed, was $1,760, resulting in a gain on purchase of $604 for the year ended December 31, 2012.
F-14
CPI Card Group Inc. and Subsidiaries
Notes to Consolidated Financial Statements (Continued)
(Dollars in Thousands, Except Share and Per Share Amounts or as Otherwise Indicated)
3. Acquisitions (Continued)
The allocation of purchase price to the assets acquired and liabilities assumed at the acquisition date is presented below:
Current assets |
$ | 458 | ||
Property, equipment and leasehold improvements |
1,549 | |||
Intangible assets subject to amortization |
237 | |||
Deferred tax liability |
(268 | ) | ||
Other current liabilities |
(216 | ) | ||
Gain on acquisition |
(604 | ) | ||
| | | | | |
Total purchase price |
$ | 1,156 | ||
| | | | | |
| | | | | |
| | | | | |
Pro Forma Information
The following unaudited pro forma consolidated operating results give effect to the EFT Acquisition as if it had been completed on January 1, 2013. These pro forma amounts are not necessarily indicative of the operating results that would have occurred if these transactions had occurred on such date. The pro forma adjustments are based on certain assumptions that the Company considers to be reasonable.
| |
December 31, | ||||||
|---|---|---|---|---|---|---|---|
| |
2014 | 2013 | |||||
Revenue—Continuing Operations |
$ | 291,302 | $ | 233,360 | |||
Net Income—Continuing Operations |
16,916 | 10,186 | |||||
| | | | | | | | |
| | | | | | | | |
| | | | | | | | |
Basic and Diluted Loss Per Share from Continuing |
$ | (0.67 | ) | $ | (0.60 | ) | |
| | | | | | | | |
| | | | | | | | |
| | | | | | | | |
The Company's consolidated statement of operations for the year ended December 31, 2014 includes revenue and net income from operations of $21,999 and $4,446 respectively, attributable to EFT Source.
4. Discontinued Operation and Disposition
On January 12, 2015, the Company sold its Nevada non-secure operating segment under an asset purchase agreement for $5,000 in cash (the "Nevada Sale"). Nevada was primarily engaged in the design, production, data personalization, packaging and daily fulfillment of retail gift and loyalty cards for customers in the United States and was not certified by any of the Payment Card Brands. The net carrying values of the assets classified as a discontinued operation include inventory and plant, equipment and leasehold improvements of $3,100 and $2,900 respectively. Nevada recognized a loss of $2,670, $2,612 and $3,796 for the years ended December 31, 2014, 2013 and 2012, respectively, which is included in loss from a discontinued operation, net of an income tax benefit of $1,421, $1,398 and $2,182 in the Company's consolidated statement of operations. After the Nevada Sale, CPI retained no continuing involvement in the Nevada operations other than a 180 day transition of services agreement. The transition of services agreement requires the buyer to complete all work for purchase orders received by CPI prior to the Nevada Sale for any customers that could not be converted to a buyer's purchase order.
F-15
CPI Card Group Inc. and Subsidiaries
Notes to Consolidated Financial Statements (Continued)
(Dollars in Thousands, Except Share and Per Share Amounts or as Otherwise Indicated)
5. Inventories
Inventories are summarized below:
| |
December 31, | ||||||
|---|---|---|---|---|---|---|---|
| |
2014 | 2013 | |||||
Raw materials |
$ | 10,217 | $ | 8,605 | |||
Work-in-process |
8,222 | 7,261 | |||||
Finished goods |
3,166 | 1,685 | |||||
| | | | | | | | |
|
$ | 21,605 | $ | 17,551 | |||
| | | | | | | | |
| | | | | | | | |
| | | | | | | | |
6. Plant, Equipment and Leasehold Improvements
Plant, equipment and leasehold improvements consist of the following:
| |
December 31, | ||||||
|---|---|---|---|---|---|---|---|
| |
2014 | 2013 | |||||
Buildings |
$ | 2,486 | $ | 3,143 | |||
Machinery and equipment |
47,792 | 58,402 | |||||
Furniture and fixtures |
4,203 | 8,811 | |||||
Leasehold improvements |
12,593 | 11,784 | |||||
Construction in progress |
3,448 | 3,617 | |||||
| | | | | | | | |
|
70,522 | 85,757 | |||||
Less accumulated depreciation and amortization |
(25,750 | ) | (49,107 | ) | |||
| | | | | | | | |
|
$ | 44,772 | $ | 36,650 | |||
| | | | | | | | |
| | | | | | | | |
| | | | | | | | |
At December 31, 2013, the Company had $1,388 of accounts payable related to property, plant and equipment.
7. Goodwill and Other Intangible Assets
The Company's goodwill at December 31, 2014 and 2013 relates to the U.S. Debit and Credit reporting unit and the U.K. Limited reporting unit.
Goodwill activity is summarized as follows:
Balance as of January 1, 2013 |
$ | 41,132 | ||
Adjustments to 2007 goodwill related to tax deductions |
(314 | ) | ||
| | | | | |
Balance as of December 31, 2013 |
40,818 | |||
EFT Acquisition |
33,619 | |||
Currency translation |
(636 | ) | ||
| | | | | |
Balance as of December 31, 2014 |
$ | 73,801 | ||
| | | | | |
| | | | | |
| | | | | |
The Company completed its evaluation of the carrying value of goodwill as of October 1, 2014 and 2013 and determined there was no impairment to the recorded value of goodwill. In order to identify
F-16
CPI Card Group Inc. and Subsidiaries
Notes to Consolidated Financial Statements (Continued)
(Dollars in Thousands, Except Share and Per Share Amounts or as Otherwise Indicated)
7. Goodwill and Other Intangible Assets (Continued)
potential impairments, CPI compared the fair value of its reporting units with their carrying amounts, including goodwill. As the fair value of the reporting units exceeded their carrying amounts, the Company was not required to complete the second step of the process which would measure the amount of any impairment.
CPI's intangible assets consist of customer relationships, technology and software, noncompete agreements, favorable leases and trademarks. Total intangible assets are being amortized over a weighted-average useful life of 16 years. Intangible amortization expense totaled $2,893, $2,035 and $2,024, for the years ended December 31, 2014, 2013 and 2012, respectively.
Intangible assets consist of the following:
| |
|
December 31, 2014 | December 31, 2013 | ||||||||||||||||||
|---|---|---|---|---|---|---|---|---|---|---|---|---|---|---|---|---|---|---|---|---|---|
| |
Average Life (Years) |
Cost | Accumulated Amortization |
Net Book Value |
Cost | Accumulated Amortization |
Net Book Value |
||||||||||||||
Customer relationships |
12 to 20 | $ | 59,871 | $ | (14,304 | ) | $ | 45,567 | $ | 36,455 | $ | (11,886 | ) | $ | 24,569 | ||||||
Technology and software |
7 to 10 | 7,101 | (310 | ) | 6,791 | — | — | — | |||||||||||||
Noncompete agreements |
5 to 8 | 491 | (198 | ) | 293 | 191 | (159 | ) | 32 | ||||||||||||
Favorable leases |
9.5 | 111 | (88 | ) | 23 | 111 | (76 | ) | 35 | ||||||||||||
| | | | | | | | | | | | | | | | | | | | | | |
Intangible assets subject to amortization |
67,574 | (14,900 | ) | 52,674 | 36,757 | (12,121 | ) | 24,636 | |||||||||||||
Trademarks (indefinite-lived) |
6,029 | — | 6,029 | 1,630 | — | 1,630 | |||||||||||||||
| | | | | | | | | | | | | | | | | | | | | | |
|
$ | 73,603 | $ | (14,900 | ) | $ | 58,703 | $ | 38,387 | $ | (12,121 | ) | $ | 26,266 | |||||||
| | | | | | | | | | | | | | | | | | | | | | |
| | | | | | | | | | | | | | | | | | | | | | |
| | | | | | | | | | | | | | | | | | | | | | |
The estimated future aggregate amortization expense for the identified amortizable intangibles noted above as of December 31, 2014 is as follows:
2015 |
$ | 4,602 | ||
2016 |
4,588 | |||
2017 |
4,576 | |||
2018 |
4,576 | |||
2019 |
4,576 | |||
Thereafter |
29,756 | |||
| | | | | |
|
$ | 52,674 | ||
| | | | | |
| | | | | |
| | | | | |
8. Fair Value of Financial Instruments
Fair value is defined as the price that would be received to sell an asset or paid to transfer a liability in an orderly transaction between market participants at the measurement date (exit price). In determining fair value, the Company utilizes a fair value hierarchy that prioritizes the inputs to valuation techniques used to measure fair value into three broad levels. The following is a brief description of those three levels:
- •
- Level 1—Unadjusted quoted prices in active markets for identical assets or liabilities accessible to the reporting entity at the measurement date.
F-17
CPI Card Group Inc. and Subsidiaries
Notes to Consolidated Financial Statements (Continued)
(Dollars in Thousands, Except Share and Per Share Amounts or as Otherwise Indicated)
8. Fair Value of Financial Instruments (Continued)
- •
- Level 2—Inputs, other than quoted prices included in Level 1 inputs that are observable for the asset or
liability, either directly or indirectly, for substantially the full term of the asset or liability.
- •
- Level 3—Unobservable inputs for the asset or liability used to measure fair value to the extent that observable inputs are not available, thereby allowing for situations in which there is little, if any, market activity for the asset or liability at the measurement date.
The Company's financial assets and liabilities subject to fair value measurements and the necessary disclosures are as follows:
| |
|
Fair Value Measurement at December 31, 2014 (Using Fair Value Hierarchy) |
|||||||||||
|---|---|---|---|---|---|---|---|---|---|---|---|---|---|
| |
Fair Value as of December 31, 2014 |
||||||||||||
| |
Level 1 | Level 2 | Level 3 | ||||||||||
Assets: |
|||||||||||||
Cash and cash equivalents |
$ | 12,941 | $ | 12,941 | $ | — | $ | — | |||||
Liabilities: |
|||||||||||||
Term Loan |
$ | 170,866 | $ | — | $ | 170,866 | $ | — | |||||
Sellers Note |
$ | 9,000 | $ | — | $ | — | $ | 9,000 | |||||
| |
|
Fair Value Measurement at December 31, 2013 (Using Fair Value Hierarchy) |
|||||||||||
|---|---|---|---|---|---|---|---|---|---|---|---|---|---|
| |
Fair Value as of December 31, 2013 |
||||||||||||
| |
Level 1 | Level 2 | Level 3 | ||||||||||
Assets: |
|||||||||||||
Cash and cash equivalents |
$ | 9,702 | $ | 9,702 | $ | — | $ | — | |||||
Liabilities: |
|||||||||||||
Term Loan |
$ | 122,677 | $ | — | $ | 122,677 | $ | — | |||||
The Company has determined that the carrying value of the Term Loan approximates the fair value based on the Company's floating rate note which did not change significantly from the amended and restated Credit Agreement of September 2, 2014. The value of the Sellers Note approximates fair value based on the rate on the U.S. portion of the Term Loan at December 31, 2014.
The fair value measurements associated with the EFT Acquisition are based on significant unobservable inputs, which are classified as Level 3 (see Note 3 for additional information) based on the Company's estimates and assumptions. A discount rate of 11.9% was utilized in determining the fair value of acquired customer relationship intangible assets related to the EFT Acquisition.
9. Related-Party Transactions
The Company leases its operating facility in Indiana from an entity that is owned by a stockholder, who is also a member of the Company's Board of Directors. The lease expires in January 2018 and requires the Company to pay property taxes, insurance and normal maintenance costs. The Company paid rent of $175 for each of the three years ended December 31, 2014, 2013 and 2012.
F-18
CPI Card Group Inc. and Subsidiaries
Notes to Consolidated Financial Statements (Continued)
(Dollars in Thousands, Except Share and Per Share Amounts or as Otherwise Indicated)
9. Related-Party Transactions (Continued)
In conjunction with certain officer and non-officer Company employees acquiring Preferred and Common Stock during 2013 and 2012, the Company obtained notes receivable from the employees that have remaining balances outstanding of $108 and $127 at December 31, 2014 and 2013, respectively. See Note 13 for further discussion.
10. Long-Term Debt and Subordinated Credit Facility
Long-term debt consists of the following:
| |
December 31, 2014 | December 31, 2013 | |||||||||||||||||
|---|---|---|---|---|---|---|---|---|---|---|---|---|---|---|---|---|---|---|---|
| |
Principal | Unamortized Discount |
Total | Principal | Unamortized Discount |
Total | |||||||||||||
Term Loan facilities |
$ | 170,866 | $ | (442 | ) | $ | 170,424 | $ | 122,677 | $ | (371 | ) | $ | 122,306 | |||||
Less current maturities |
(6,547 | ) | 221 | (6,326 | ) | (6,841 | ) | — | (6,841 | ) | |||||||||
| | | | | | | | | | | | | | | | | | | | |
Long-term debt, net of current maturities |
164,319 | (221 | ) | 164,098 | 115,836 | (371 | ) | 115,465 | |||||||||||
Sellers Note |
9,000 | — | 9,000 | — | — | — | |||||||||||||
| | | | | | | | | | | | | | | | | | | | |
|
$ | 173,319 | $ | (221 | ) | $ | 173,098 | $ | 115,836 | $ | (371 | ) | $ | 115,465 | |||||
| | | | | | | | | | | | | | | | | | | | |
| | | | | | | | | | | | | | | | | | | | |
| | | | | | | | | | | | | | | | | | | | |
On September 2, 2014, the Company and its lenders amended and restated the Credit Agreement dated November 8, 2012. As a result, the existing senior term debt and related revolver were refinanced with new senior term debt of $175,343 (the "Term Loan") and a $25,000 unfunded revolver (the "Revolver") and the maturity was extended to September 30, 2016. The Term Loan included incremental gross proceeds of $60,000, and as of September 2, 2014, the Term Loan consisted of a U.S. Dollar term loan of $161,414 and a British Pound Sterling term loan of £8,194. The primary purpose of the additional debt was to finance the cash portion of the acquisition consideration of EFT Source. Principal and accrued interest payments on the Term Loan are due quarterly, with a final principal payment due on September 30, 2016. See Note 3 for further information.
The Company accounted for the debt refinancing in accordance with ASC 470-50-40-6, Modifications and Exchanges. The Company performed a present value of cash flows analysis of the new debt instrument as compared to the present value of the remaining cash flows under the terms of the original debt instrument on a creditor-by-creditor basis. This evaluation resulted in different methods of accounting for the modification depending on each creditor's participation in the senior term debt. As a result, the Company recognized a $476 loss on extinguishment. For the portion accounted for as a debt modification, any fees associated with the debt modification incurred between the Company and the creditors, along with any existing unamortized discount, will be amortized as an adjustment of interest expense over the remaining term of the modified debt. Any third party costs incurred as part of the debt modification have been deferred.
All fees associated with the debt extinguishment between the Company and the creditor, along with any existing unamortized discount, were recognized as a loss on extinguishment. Any third party costs incurred as part of the debt extinguishment have been expensed as incurred.
F-19
CPI Card Group Inc. and Subsidiaries
Notes to Consolidated Financial Statements (Continued)
(Dollars in Thousands, Except Share and Per Share Amounts or as Otherwise Indicated)
10. Long-Term Debt and Subordinated Credit Facility (Continued)
Term Loan
The Term Loan interest rate is calculated using either the London Interbank Offered Rate ("LIBOR") plus a margin on a sliding scale between 2.75% to 4.25% depending on the Company's leverage ratio as determined every fiscal quarter, or at a Base Rate plus a margin on a sliding scale between 1.75% to 3.25% depending on the Company's leverage ratio as determined every fiscal quarter. At December 31, 2014, the U.S. term loan was at a borrowing rate of 3.91% and the British Pound Sterling term loan was at a borrowing rate of 4.25%. Principal and accrued interest payments are due quarterly, with a maturity date of September 30, 2016.
The Credit Agreement is collateralized by the Company's equity interests in domestic subsidiaries and its unencumbered assets, which include accounts receivable, inventory, equipment, and intellectual property. The Credit Agreement is also collateralized by a partial pledge of the Company's equity interests in foreign subsidiaries, and no foreign assets are subject to a security interest.
The Credit Agreement contains restrictive covenants that, among other things, limit the incurrence of additional indebtedness, dividends, transactions with affiliates, disposition of assets, acquisitions, mergers and consolidations, liens and encumbrances, sale-leasebacks, changes in fiscal periods and restrictive payments. As of December 31, 2014 and 2013, the Company was in compliance with all covenants under the Credit Agreement, as amended. During the year ended December 31, 2014, the Company made total principal payments under the Term Loan of $11,045 including payments on the British Pound Sterling term loan of £475 ($777). During the year ended December 31, 2013, the Company made total principal payments under the Term Loan of $7,122 including payments on the British Pound Sterling term loan of £475 ($752).
Sellers Note
The Company entered into a subordinated, unsecured promissory note for $9,000 ("Sellers Note") with certain sellers of EFT Source as part of the EFT Acquisition. Interest on the Sellers Note accrues at 5.0% per annum, and is paid quarterly. The Sellers Note principal and unpaid interest is due to the Sellers at the sooner of September 2, 2016 or with the execution of certain specific events as outlined in the Sellers Note. The Company reports the Sellers Note separately as long-term subordinated debt on the consolidated balance sheet.
Maturities of long-term debt as of December 31, 2014 consist of the following:
Year ending December 31: |
||||
2015 |
$ | 6,547 | ||
2016 |
173,319 | |||
2017 |
— | |||
2018 |
— | |||
2019 |
— | |||
| | | | | |
|
$ | 179,866 | ||
| | | | | |
| | | | | |
| | | | | |
F-20
CPI Card Group Inc. and Subsidiaries
Notes to Consolidated Financial Statements (Continued)
(Dollars in Thousands, Except Share and Per Share Amounts or as Otherwise Indicated)
10. Long-Term Debt and Subordinated Credit Facility (Continued)
Revolving Loan Facility
At December 31, 2014 and 2013, the Company had no outstanding balances under the Revolver and had $24,900 available for borrowing (see Letters of Credit below). The Company pays a commitment fee equal to 0.50% per annum on the undrawn portion available under the Revolver. The Revolver matures on September 30, 2016 and any outstanding balances are due at that time.
The Revolver accrues interest at either LIBOR plus a margin on a sliding scale between 2.75% to 4.25%, depending on the Company's leverage ratio as determined every fiscal quarter, or at a Base Rate plus a margin on a sliding scale between 1.75% and 3.25%, depending on the Company's leverage ratio as determined every fiscal quarter. The Revolver is collateralized the same as the term loan and is subject to the same restrictive debt covenants.
Letters of Credit
The Company has two outstanding letters of credit for security deposits on two real property lease agreements. These letters of credit are for a total of $100, reducing the Revolver availability. The Company pays a fee on the outstanding letters of credit at the applicable margin, which was 3.75% as of December 31, 2014, in addition to a fronting fee of 0.25% per annum.
11. Income Taxes
Income tax expense and effective income tax rates consist of the following:
| |
December 31, | |||||||||
|---|---|---|---|---|---|---|---|---|---|---|
| |
2014 | 2013 | 2012 | |||||||
Current taxes: |
||||||||||
Domestic |
$ | 8,424 | $ | 4,982 | $ | 4,404 | ||||
Foreign |
— | 6 | 224 | |||||||
| | | | | | | | | | | |
|
8,424 | 4,988 | 4,628 | |||||||
| | | | | | | | | | | |
Deferred taxes: |
||||||||||
Domestic |
2,238 | 2,347 | 1,494 | |||||||
Foreign |
(371 | ) | (347 | ) | (213 | ) | ||||
| | | | | | | | | | | |
|
1,867 | 2,000 | 1,281 | |||||||
| | | | | | | | | | | |
Total tax expense |
$ | 10,291 | $ | 6,988 | $ | 5,909 | ||||
| | | | | | | | | | | |
| | | | | | | | | | | |
| | | | | | | | | | | |
Income before income taxes |
||||||||||
Domestic |
$ | 27,984 | $ | 19,954 | $ | 15,959 | ||||
Foreign |
(1,721 | ) | (1,767 | ) | (1,324 | ) | ||||
| | | | | | | | | | | |
Total |
$ | 26,263 | $ | 18,187 | $ | 14,635 | ||||
| | | | | | | | | | | |
| | | | | | | | | | | |
| | | | | | | | | | | |
Effective income tax rate |
39.1 | % | 38.4 | % | 40.4 | % | ||||
F-21
CPI Card Group Inc. and Subsidiaries
Notes to Consolidated Financial Statements (Continued)
(Dollars in Thousands, Except Share and Per Share Amounts or as Otherwise Indicated)
11. Income Taxes (Continued)
The effective income tax rate differs from the U.S. federal statutory income tax rate as follows:
| |
December 31, | |||||||||
|---|---|---|---|---|---|---|---|---|---|---|
| |
2014 | 2013 | 2012 | |||||||
Tax at federal statutory rate |
35.0 | % | 34.0 | % | 34.0 | % | ||||
Permanent differences |
(2.9 | ) | (1.7 | ) | (2.6 | ) | ||||
State income taxes |
3.1 | 4.8 | 4.7 | |||||||
Foreign taxes |
2.5 | (1.6 | ) | 0.7 | ||||||
Other |
1.4 | 2.9 | 3.6 | |||||||
| | | | | | | | | | | |
Effective income tax rate |
39.1 | % | 38.4 | % | 40.4 | % | ||||
| | | | | | | | | | | |
| | | | | | | | | | | |
| | | | | | | | | | | |
The components of the deferred tax assets and liabilities are as follows:
| |
December 31, | ||||||
|---|---|---|---|---|---|---|---|
| |
2014 | 2013 | |||||
Deferred tax assets: |
|||||||
Allowance for doubtful accounts |
$ | 65 | $ | 427 | |||
Inventory valuation |
607 | 757 | |||||
Deferred revenue |
— | 553 | |||||
Accrued expense |
372 | 657 | |||||
Unrealized foreign exchange loss |
634 | 688 | |||||
Capital loss carryforward |
480 | 521 | |||||
Net operating loss carryforward |
2,148 | 2,997 | |||||
Goodwill |
2,159 | 2,994 | |||||
Intangibles |
— | 622 | |||||
Asset retirement obligation |
292 | 270 | |||||
Stock compensation |
1,853 | 214 | |||||
| | | | | | | | |
Total gross deferred tax assets |
8,610 | 10,700 | |||||
Valuation allowance |
(4,120 | ) | (4,798 | ) | |||
| | | | | | | | |
Net deferred tax assets |
4,490 | 5,902 | |||||
| | | | | | | | |
Deferred tax liabilities: |
|||||||
Plant, property and leasehold improvements |
(4,238 | ) | (1,791 | ) | |||
Intangibles |
(12,383 | ) | — | ||||
Prepaid expense |
(1,045 | ) | (485 | ) | |||
Other |
— | (20 | ) | ||||
| | | | | | | | |
Total gross deferred tax liabilities |
(17,666 | ) | (2,296 | ) | |||
| | | | | | | | |
Net deferred tax liabilities |
$ | (13,176 | ) | $ | 3,606 | ||
| | | | | | | | |
| | | | | | | | |
| | | | | | | | |
F-22
CPI Card Group Inc. and Subsidiaries
Notes to Consolidated Financial Statements (Continued)
(Dollars in Thousands, Except Share and Per Share Amounts or as Otherwise Indicated)
11. Income Taxes (Continued)
The net deferred tax assets and liabilities are reflected in the consolidated balance sheets as follows:
| |
December 31, | ||||||
|---|---|---|---|---|---|---|---|
| |
2014 | 2013 | |||||
Current deferred tax assets |
$ | 634 | $ | 2,597 | |||
Long-term deferred tax assets |
— | 1,009 | |||||
Long-term deferred tax liabilities |
(13,810 | ) | — | ||||
| | | | | | | | |
Net deferred tax assets (liabilities) |
$ | (13,176 | ) | $ | 3,606 | ||
| | | | | | | | |
| | | | | | | | |
| | | | | | | | |
The net change in the valuation allowance was $678 and $399 for the years ended December 31, 2014 and 2013, respectively, related to change in net operating losses of a foreign location.
The Company has state operating loss carryforwards of $1,136 which expire at various dates from 2028 through 2033.
The Company has potential tax benefits associated with $798 of foreign operating loss carryforwards, which expire at various dates from 2024 through 2033. Due to the uncertainty of being able to recognize these loss carryforwards, the Company has provided a valuation allowance of 100% of the tax benefit.
At December 31, 2014, no provision has been made for U.S. federal and state taxes on cumulative foreign earnings from CPI Card Group—Europe Limited operations of approximately $1,161, which are expected to be indefinitely reinvested outside of the U.S.
12. Series A Preferred Stock
Series A Preferred Stock has a par value of $0.001 per share. The original Series A Preferred Stock has an initial liquidation preference equal to $1,000 per outstanding share. In addition, the Series A Preferred Stock liquidation preference earns a dividend of 20% per share per annum, payable when declared by the Board of Directors. Such dividends accrue on each share from the date of original issuance and accrue on a daily basis, whether or not declared. Such dividends are cumulative so that if such dividend in respect of any previous or current annual dividend period, at the annual 20% rate, has not been paid, the deficiency shall first be fully paid before any dividend or other distribution shall be paid or declared and set apart for the Common Stock. As of December 31, 2014, 1,970 shares of Series A Preferred Stock were subject to a put, where the employees holding these shares upon leaving the Company have the option to have the Company purchase the shares at the then current liquidation preference. As of December 31, 2014, the liquidation preference of Series A Preferred Stock had a value of approximately $3,950.33 per outstanding share for a total aggregate cumulative liquidation value of $256,017. As of December 31, 2013, the liquidation preference of
F-23
CPI Card Group Inc. and Subsidiaries
Notes to Consolidated Financial Statements (Continued)
(Dollars in Thousands, Except Share and Per Share Amounts or as Otherwise Indicated)
12. Series A Preferred Stock (Continued)
Series A Preferred Stock had a value of approximately $3,291.95 per outstanding share for a total aggregate cumulative liquidation value of $211,540.
| |
Series A Preferred Stock | ||||||
|---|---|---|---|---|---|---|---|
| |
Shares | Amount | |||||
Balance at January 1, 2012 |
80,777 | $ | 72,649 | ||||
Issuance of preferred |
107 | 182 | |||||
Less redemption of preferred |
(16,628 | ) | (16,632 | ) | |||
| | | | | | | | |
Balance at January 1, 2013 |
64,256 | 56,199 | |||||
Issuance of preferred |
28 | 50 | |||||
Less redemption of preferred |
(24 | ) | (48 | ) | |||
| | | | | | | | |
Balance at December 31, 2013 |
64,260 | 56,201 | |||||
Acquisition of EFT Source, Inc |
549 | 2,049 | |||||
| | | | | | | | |
Balance at December 31, 2014 |
64,809 | $ | 58,250 | ||||
| | | | | | | | |
| | | | | | | | |
| | | | | | | | |
During the year ended December 31, 2014, the Company issued 549 shares at an estimated value of $3,733.88 per share of Series A Preferred Stock as part of the payment consideration for the EFT Acquisition. The Company did not redeem any shares of Series A Preferred Stock during the year ended December 31, 2014. During the year ended December 31, 2013, the Company issued 28 shares of Series A Preferred Stock at $1,775.87 per share for total proceeds of $50. The Company redeemed 24 shares of Series A Preferred Stock at $1,992.89 per share for a total redemption value of $48 during the year ended December 31, 2013. During the year ended December 31, 2012, the Company issued 107 shares of Series A Preferred Stock at $1,691.72 per share for total proceeds of $181. The Company redeemed 9,321 and 7,307 shares of Series A Preferred Stock at $2,682.11 and $2,737.09, respectively, per share for a total redemption value of $45,000 during the year ended December 31, 2012.
In the event of any liquidation, dissolution, or winding up of the Company, the Series A Preferred Stock holders shall be entitled to receive, prior and in preference to any distributions of any of the Company's assets to the Common Stock holders, the value of the liquidation preference. If the distribution of such assets is insufficient to permit the payment to such holders, the distribution shall be distributed ratably among the holders of the Series A Preferred Stock in proportion to the amount of such stock owned by each holder. The Series A Preferred Stock has no voting rights.
13. Stockholders' Equity
Common Stock
Common Stock has a par value of $0.001 per share. Holders of Common Stock are entitled to receive dividends and distributions subject to the participation rights of holders of all classes of stock at the time outstanding, as such holders have prior rights as to dividends pursuant to the rights of any series of Preferred Stock. Upon any liquidation, dissolution, or winding up of the Company, after required payments are made to holders of any series of Preferred Stock, any remaining assets of the Company will be distributed ratably to the holders of Common Stock. Holders of Common Stock are entitled to one vote per share.
F-24
CPI Card Group Inc. and Subsidiaries
Notes to Consolidated Financial Statements (Continued)
(Dollars in Thousands, Except Share and Per Share Amounts or as Otherwise Indicated)
13. Stockholders' Equity (Continued)
During the year ended December 31, 2014, the Company issued 257,268 shares of Common Stock at an estimated value of $11.47 per share, as part of the payment consideration for the EFT Acquisition. The Company did not redeem any Common Stock during the year ended December 31, 2014.
During the year ended December 31, 2013, in connection with the preferred shares issued as discussed above pursuant to the Stockholder Agreement, the Company issued 123,112 shares of Common Stock, which had a de minimis fair value and issue price. The Company redeemed 278,058 shares of Common Stock for a de minimis amount.
Employee Notes Receivable
Included in contra stockholders' equity are promissory notes received in connection with equity issuances of Series A Preferred Stock and Common Stock to certain employees made during 2011 and earlier years. The notes receivable accrue interest at 5% per annum and are paid in bimonthly installments. The principal balances of the notes are due upon the employee's termination, the sale of the Company, upon any distributions, or at such time that the employee fails to own the underlying shares. The notes may be paid in whole or in part without any penalties at any time at the employee's option. During 2014 and 2013, the Company did not issue any new Employee notes.
For the year ended December 31, 2014 and 2013, $19 and $10, respectively, of employee notes were repaid. Employee notes receivable totaled $108 and $127 at December 31, 2014 and 2013, respectively.
14. Earnings per Share
Basic earnings or diluted loss per share is computed by dividing net earnings or loss by the weighted number of ordinary shares outstanding during the period. All potentially dilutive shares have been excluded from the weighted-average number of shares of common stock outstanding as their inclusion in the computation for would be antidilutive due to net losses from continuing operations attributable to common stockholders.
F-25
CPI Card Group Inc. and Subsidiaries
Notes to Consolidated Financial Statements (Continued)
(Dollars in Thousands, Except Share and Per Share Amounts or as Otherwise Indicated)
14. Earnings per Share (Continued)
The following table sets forth the computation of basic and diluted EPS attributable to continuing and discontinued operations:
| |
December 31, | |||||||||
|---|---|---|---|---|---|---|---|---|---|---|
| |
2014 | 2013 | 2012 | |||||||
Numerator: |
||||||||||
Net income from continuing operations |
$ | 15,972 | $ | 11,199 | $ | 8,726 | ||||
Preferred stock dividends |
(44,477 | ) | (35,268 | ) | (36,363 | ) | ||||
| | | | | | | | | | | |
Loss from continuing operations attributable to common stockholders |
(28,505 | ) | (24,069 | ) | (27,637 | ) | ||||
Loss from a discontinued operation, net of taxes |
(2,670 | ) | (2,612 | ) | (3,796 | ) | ||||
| | | | | | | | | | | |
Net loss attributable to common stockholders |
$ | (31,175 | ) | $ | (26,681 | ) | $ | (31,433 | ) | |
Denominator: |
||||||||||
Basic EPS—weighted average common shares outstanding |
41,199,246 | 41,072,350 | 41,264,828 | |||||||
Basic EPS: |
||||||||||
Loss from continuing operations |
$ | (0.69 | ) | $ | (0.59 | ) | $ | (0.67 | ) | |
Loss from a discontinued operation, net of taxes |
(0.07 | ) | (0.06 | ) | (0.09 | ) | ||||
| | | | | | | | | | | |
Net loss |
$ | (0.76 | ) | $ | (0.65 | ) | $ | (0.76 | ) | |
| | | | | | | | | | | |
| | | | | | | | | | | |
| | | | | | | | | | | |
The Company reported losses from continuing operations attributable to common stockholders for the years ended December 31, 2014, 2013 and 2012. Accordingly, the potentially dilutive effect of the outstanding stock options of 627,000, 649,000 and 528,000, respectively, has been excluded from the computation of diluted loss per share because their inclusion would have been anti-dilutive. As further described in Note 12, the cumulative dividends in arrears related to Series A Preferred Stock must be paid before any distribution can be paid to the Company's common shareholders. As of December 31, 2014, cumulative dividends in arrears related to the Series A Preferred Stock in aggregate was $191,208.
15. Commitments and Contingencies
The Company leases real property for its facilities under noncancelable operating lease agreements. Land and facility leases expire at various dates between 2015 and 2023 and contain various provisions for rental adjustments and renewals. All of these leases require the Company to pay property taxes, insurance and normal maintenance costs.
The Company also leases equipment for use in CPI's Petersfield operation production under capital leases. Amortization of capital leases is included in depreciation and amortization expense in the consolidated statements of operations and comprehensive income. Amortization expense for capital leases was $62, $62, and $39 for the years ended December 31, 2014, 2013 and 2012, respectively.
F-26
CPI Card Group Inc. and Subsidiaries
Notes to Consolidated Financial Statements (Continued)
(Dollars in Thousands, Except Share and Per Share Amounts or as Otherwise Indicated)
15. Commitments and Contingencies (Continued)
Equipment under capital leases included in plant, equipment and leasehold improvements are as follows:
| |
December 31, | ||||||
|---|---|---|---|---|---|---|---|
| |
2014 | 2013 | |||||
Equipment under capital leases |
$ | 264 | $ | 280 | |||
Less accumulated amortization |
(160 | ) | (105 | ) | |||
| | | | | | | | |
Total |
$ | 104 | $ | 175 | |||
| | | | | | | | |
| | | | | | | | |
| | | | | | | | |
During the normal course of business, the Company also enters into non-cancellable agreements to purchase goods and services, including production equipment and IT systems.
Future cash payments with respect to non-cancellable capital leases, operating leases and purchase obligations as of December 31, 2014 are as follows:
| |
Capital Leases |
Operating Leases |
Purchase Obligations |
|||||||
|---|---|---|---|---|---|---|---|---|---|---|
2015 |
$ | 82 | $ | 2,885 | $ | 7,864 | ||||
2016 |
51 | 2,445 | — | |||||||
2017 |
— | 1,228 | — | |||||||
2018 |
— | 1,105 | — | |||||||
2019 |
— | 842 | — | |||||||
Thereafter |
— | 1,308 | — | |||||||
| | | | | | | | | | | |
Total |
$ | 133 | $ | 9,813 | $ | 7,864 | ||||
| | | | | | | | | | | |
| | | | | | | | | | | |
| | | | | | | | | | | |
Less interest costs |
(14 | ) | ||||||||
| | | | | | | | | | | |
Present value of minimum lease payments |
$ | 119 | ||||||||
| | | | | | | | | | | |
| | | | | | | | | | | |
| | | | | | | | | | | |
The amount of the minimum lease payments under capital leases is included in other current and long-term liabilities in the consolidated balance sheet at December 31, 2014 and 2013.
The Company incurred rent expense under non-cancellable operating leases during the years ended December 31, 2014, 2013 and 2012, totaling $3,320, $3,096 and $2,432, respectively.
Asset retirement obligations relate to legal obligations associated with the removal of all leasehold improvements at the end of the lease term. The Company records all asset retirement obligations, which primarily relate to "make-good" clauses in operating leases, for its leased property containing leasehold improvements. The liability, reported within other long-term liabilities, is accreted through charges to operating expenses. If the asset retirement obligation is settled for an amount other than the carrying amount of the liability, the Company recognizes a gain or loss on settlement. The Company incurred accretion expense during the years ended December 31, 2014, 2013 and 2012 totaling $53, $55 and $54, respectively. As of December 31, 2014 and 2013, the Company's asset retirement obligations included in other long-term liabilities were $911 and $871, respectively.
F-27
CPI Card Group Inc. and Subsidiaries
Notes to Consolidated Financial Statements (Continued)
(Dollars in Thousands, Except Share and Per Share Amounts or as Otherwise Indicated)
16. Employee Benefit Plan
The Company maintains a qualified defined-contribution plan under the provisions of the Internal Revenue Code Section 401(k), which covers substantially all employees who meet certain eligibility requirements. Under the plan, participants may defer their salary subject to statutory limitations and may direct the contributions among various investment accounts. The Company matches 100% of the participant's first 3% of deferrals and 50% of the next 2% deferral percentage. The Company's portion is 100% vested at the time of the match.
The aggregate amounts charged to expense in connection with the plan were $824, $908 and $663, for the years ended December 31, 2014, 2013 and 2012, respectively.
17. Stock Option Plan
In 2007, the Company's Board of Directors adopted the 2007 Stock Option Plan (the "Plan"). Under the provisions of the Plan, stock options may be granted to employees, directors and consultants at an exercise price greater than or equal to (and not less than) the fair market value of a share on the date the option is granted. The number of common shares available is 2,090,000, of which 1,463,000 were available to be granted at December 31, 2014. The stock options have a 10-year life and vest as noted in each respective grant letter. All stock options are nonqualified.
Outstanding and exercisable stock options are as follows:
| |
Options | Weighted- Average Exercise Price |
Weighted- Average Remaining Contractual Term (in Years) |
|||||||
|---|---|---|---|---|---|---|---|---|---|---|
Outstanding as of January 1, 2012 |
451,000 | $ | 0.0003 | 8.63 | ||||||
Granted |
77,000 | 0.0005 | ||||||||
| | | | | | | | | | | |
Outstanding as of December 31, 2012 |
528,000 | $ | 0.0004 | 7.48 | ||||||
Granted |
165,000 | 0.0005 | ||||||||
Forfeited |
(44,000 | ) | 0.0005 | |||||||
| | | | | | | | | | | |
Outstanding as of December 31, 2013 |
649,000 | $ | 0.0004 | 7.35 | ||||||
Forfeited |
(22,000 | ) | 0.0001 | |||||||
| | | | | | | | | | | |
Outstanding as of December 31, 2014 |
627,000 | $ | 0.0004 | 6.44 | ||||||
| | | | | | | | | | | |
| | | | | | | | | | | |
| | | | | | | | | | | |
Exercisable as of December 31, 2014 |
535,326 | $ | 0.0004 | 7.55 | ||||||
F-28
CPI Card Group Inc. and Subsidiaries
Notes to Consolidated Financial Statements (Continued)
(Dollars in Thousands, Except Share and Per Share Amounts or as Otherwise Indicated)
17. Stock Option Plan (Continued)
Unvested options as of December 31, 2014, vest as follows:
December 31, 2015 |
51,326 | |||
December 31, 2016 |
40,348 | |||
| | | | | |
Total unvested options as of December 31, 2014 |
91,674 | |||
| | | | | |
| | | | | |
| | | | | |
Compensation expense and unrecorded compensation expense for the years ended December 31, 2014, 2013 and 2012 were de minimis.
18. Phantom Stock Plan
Effective January 1, 2012, the Company's Board of Directors adopted the CPI Acquisition, Inc. Phantom Stock Plan to provide incentive compensation to certain key employees. Under the terms of the agreement, holders of an award are entitled to a cash payment equal to the difference between the fair market value of the award, as defined in the agreement, at the time of exercise and the award's exercise price. Each award is issued for a specified number of units at an established base amount per unit of $2,000.
All awards vest on the defined Redemption Date or earlier fixed date pursuant to each award agreement. The Redemption Date is defined as the earlier of a Change-in-Control or seven years from grant. Unvested awards expire upon participant's termination of service.
Total authorized units under the plan are 100,000. At December 31, 2014, there were 84,297 units issued and outstanding under the terms of the plan, of which 13,088 were fully vested.
As these awards must be settled in cash, the Company accounts for them as liabilities. As a nonpublic company, the company has elected to measure the liability at intrinsic value, with changes in the intrinsic value of the liability recognized as expense each year in the consolidated statements of operations and comprehensive income. There was $4,534, $610 and $0 of compensation expense recognized for the years ended December 31, 2014, 2013 and 2012, respectively, related to this plan.
19. Segment Reporting
The Company has identified reportable segments as those consolidated subsidiaries that represent 10% or more of its revenue, EBITDA (as defined below), or total assets or subsidiaries which the Company believes information about the segment would be useful to the readers of the financial statements from a qualitative perspective. The Company's chief operating decision maker is its Chief Executive Officer who is charged with management of the Company and is responsible for the evaluation of operating performance and decision making about the allocation of resources to operating segments based on measures such as revenue and EBITDA.
EBITDA is the primary measure used by the Company's chief operating decision maker to evaluate segment operating performance. As the Company uses the term, EBITDA is defined as income from continuing operations before interest expense, income taxes, depreciation and amortization. The Company's chief operating decision maker believes EBITDA is a meaningful measure and is superior to available U.S. GAAP measures as it represents a transparent view of the
F-29
CPI Card Group Inc. and Subsidiaries
Notes to Consolidated Financial Statements (Continued)
(Dollars in Thousands, Except Share and Per Share Amounts or as Otherwise Indicated)
19. Segment Reporting (Continued)
Company's operating performance that is unaffected by fluctuations in property, equipment and leasehold improvement additions. The Company's chief operating decision maker uses EBITDA to perform periodic reviews and comparison of operating trends and identify strategies to improve the allocation of resources amongst segments.
As of December 31, 2014, the Company's reportable segments are as follows:
- •
- U.S. Debit and Credit
- •
- U.S. Prepaid Debit
- •
- U.K. Limited
The U.S. Debit and Credit segment primarily produces Financial Payment Cards and provides integrated card services to card-issuing banks in the United States. Products manufactured by this segment primarily include EMV and non-EMV credit cards, debit cards and prepaid debit cards issued on the networks of the Payment Card Brands, private label credit cards that are not issued on the networks of the Payment Cards Brands and instant issuance systems. This segment also provides a variety of integrated card services, including card personalization and fulfillment services and instant issuance services. The U.S. Debit and Credit segment includes the Company's operations in Colorado, Indiana and Tennessee, which are each certified by multiple global Payment Card Brands and, where required by the Company's customers and the PCI Security Standards Council. These operating segments have been aggregated into a single reportable segment due to similarities in the nature of the products and services sold by these subsidiaries, a common customer base, the substantial degree of integration and redundancy across the segments, and utilization of centrally shared sales, marketing, quality and planning departments. Separate information about these segments would not be useful to the readers of the financial statements.
The U.S. Prepaid Debit segment primarily provides integrated card services to prepaid debit card issuers in the United States. Services provided include tamper-evident security packaging services and card personalization and fulfillment services. This segment also produces financial payment cards issued on the networks of the Payment Card Brands that are included in the tamper-evident security packages mentioned above. The U.S. Prepaid Debit segment includes the Company's operation in Minnesota which is certified by multiple global Payment Card Brands and the PCI Security Standards Council.
The U.K. Limited segment primarily produces retail gift and loyalty cards for customers in the United Kingdom and continental Europe. This segment also provides card personalization and fulfillment services. The U.K. Limited segment includes the Company's operations in Colchester, United Kingdom and Liverpool, United Kingdom. Neither of the Company's operations in this segment is certified by any of the Payment Card Brands, nor are they PCI certified.
The "other" category includes the Company's corporate headquarters and less significant operating segments that derive their revenue from the production of Financial Payment Cards and retail gift cards in Canada (CPI—Canada) and the U.K. (CPI—Petersfield). For additional information regarding the Company's decision to shut down the CPI—Petersfield facility during the third quarter of 2015, see Note 20.
F-30
CPI Card Group Inc. and Subsidiaries
Notes to Consolidated Financial Statements (Continued)
(Dollars in Thousands, Except Share and Per Share Amounts or as Otherwise Indicated)
19. Segment Reporting (Continued)
Performance Measures of Reportable Segments
Revenue and EBITDA of the Company's reportable segments for the years ended December 31, 2014, 2013 and 2012 were as follows:
| |
Revenue | EBITDA | |||||||||||||||||
|---|---|---|---|---|---|---|---|---|---|---|---|---|---|---|---|---|---|---|---|
| |
December 31, | December 31, | |||||||||||||||||
| |
2014 | 2013 | 2012 | 2014 | 2013 | 2012 | |||||||||||||
U.S. Debit and Credit(a) |
$ | 153,015 | $ | 91,626 | $ | 81,602 | $ | 37,547 | $ | 18,871 | $ | 15,153 | |||||||
U.S. Prepaid Debit |
59,271 | 65,895 | 64,624 | 18,654 | 20,438 | 18,813 | |||||||||||||
U.K Limited |
35,163 | 33,242 | 34,135 | 2,943 | 2,801 | 3,261 | |||||||||||||
Other |
23,908 | 24,678 | 18,492 | (12,121 | ) | (4,491 | ) | (2,316 | ) | ||||||||||
Intersegment eliminations(b) |
(10,351 | ) | (19,071 | ) | (15,067 | ) | — | — | (3,997 | ) | |||||||||
| | | | | | | | | | | | | | | | | | | | |
Total: |
$ | 261,006 | $ | 196,370 | $ | 183,786 | $ | 47,023 | $ | 37,620 | $ | 30,914 | |||||||
| | | | | | | | | | | | | | | | | | | | |
| | | | | | | | | | | | | | | | | | | | |
| | | | | | | | | | | | | | | | | | | | |
- (a)
- Amounts
for 2014 include the post-acquisition revenue and EBITDA of EFT Source from September 2, 2014 through December 31, 2014.
- (b)
- Amounts include the revenue from sales between the U.S. Debit and Credit segment, U.K. Limited segment, and "other" category and are eliminated upon consolidation.
The following table provides a reconciliation of total segment EBITDA to income before taxes for the years ended December 31, 2014, 2013 and 2012:
| |
December 31, | |||||||||
|---|---|---|---|---|---|---|---|---|---|---|
| |
2014 | 2013 | 2012 | |||||||
Total segment EBITDA from continuing operations |
$ | 47,023 | $ | 37,620 | $ | 30,914 | ||||
Depreciation and amortization |
(13,252 | ) | (11,595 | ) | (10,514 | ) | ||||
Interest, net |
(7,508 | ) | (7,838 | ) | (5,765 | ) | ||||
| | | | | | | | | | | |
Income before income taxes |
$ | 26,263 | $ | 18,187 | $ | 14,635 | ||||
| | | | | | | | | | | |
| | | | | | | | | | | |
| | | | | | | | | | | |
F-31
CPI Card Group Inc. and Subsidiaries
Notes to Consolidated Financial Statements (Continued)
(Dollars in Thousands, Except Share and Per Share Amounts or as Otherwise Indicated)
19. Segment Reporting (Continued)
Balance Sheet Data of Reportable Segments
Total assets of the Company's reportable segments as of December 31, 2014 and 2013 were as follows:
| |
December 31, | ||||||
|---|---|---|---|---|---|---|---|
| |
2014 | 2013 | |||||
U.S. Debit and Credit |
$ | 200,572 | $ | 107,492 | |||
U.S. Prepaid Debit |
20,183 | 22,186 | |||||
U.K. Limited |
29,740 | 32,770 | |||||
Other |
10,267 | 9,419 | |||||
| | | | | | | | |
Total continuing operations: |
260,762 | 171,867 | |||||
Discontinued operation(a): |
5,862 | — | |||||
| | | | | | | | |
Total assets: |
$ | 266,624 | $ | 171,867 | |||
| | | | | | | | |
| | | | | | | | |
| | | | | | | | |
- (a)
- As of December 31, 2014, certain assets of the Nevada operation sold on January 12, 2015, see Note 4, are presented in assets of a discontinued operation in the Company's consolidated balance sheet.
Plant, Equipment and Leasehold Improvement Additions of Geographic Locations
Plant, equipment and leasehold improvement additions of the Company's geographical locations for the years ended December 31, 2014 and 2013 were as follows:
| |
December 31, | |||||||||
|---|---|---|---|---|---|---|---|---|---|---|
| |
2014 | 2013 | 2012 | |||||||
U.S. |
$ | 15,082 | $ | 9,679 | $ | 6,776 | ||||
Canada |
32 | 125 | 222 | |||||||
| | | | | | | | | | | |
Total North America |
15,114 | 9,804 | 6,998 | |||||||
U.K. |
454 | 824 | 2,115 | |||||||
| | | | | | | | | | | |
Total plant, equipment and leasehold improvement additions |
$ | 15,568 | $ | 10,628 | $ | 9,113 | ||||
| | | | | | | | | | | |
| | | | | | | | | | | |
| | | | | | | | | | | |
F-32
CPI Card Group Inc. and Subsidiaries
Notes to Consolidated Financial Statements (Continued)
(Dollars in Thousands, Except Share and Per Share Amounts or as Otherwise Indicated)
19. Segment Reporting (Continued)
Net Sales of Geographic Locations
Net sales of the Company's geographic locations for the years ended December 31, 2014, 2013 and 2012 were as follows:
| |
December 31, | |||||||||
|---|---|---|---|---|---|---|---|---|---|---|
| |
2014 | 2013 | 2012 | |||||||
U.S.(a) |
$ | 196,418 | $ | 135,525 | $ | 137,757 | ||||
Canada |
16,133 | 17,661 | 12,605 | |||||||
| | | | | | | | | | | |
Total North America |
212,551 | 153,186 | 150,362 | |||||||
U.K. |
36,682 | 32,448 | 27,356 | |||||||
Other(b) |
11,773 | 10,736 | 6,068 | |||||||
| | | | | | | | | | | |
Total revenue |
$ | 261,006 | $ | 196,370 | $ | 183,786 | ||||
| | | | | | | | | | | |
| | | | | | | | | | | |
| | | | | | | | | | | |
- (a)
- Amounts
for 2014 include the post-acquisition net sales of EFT Source from September 2, 2014 through December 31, 2014.
- (b)
- Amounts in other include sales to various countries that individually are not material.
Long-Lived Assets of Geographic Segments
Long-lived assets of the Company's geographic segments as of December 31, 2014 and 2013 were as follows:
| |
December 31, | ||||||
|---|---|---|---|---|---|---|---|
| |
2014 | 2013 | |||||
U.S. |
$ | 160,144 | $ | 82,793 | |||
Canada |
2,525 | 3,395 | |||||
| | | | | | | | |
Total North America: |
162,669 | 86,188 | |||||
U.K. |
14,607 | 17,546 | |||||
| | | | | | | | |
Total long-lived assets |
$ | 177,276 | $ | 103,734 | |||
| | | | | | | | |
| | | | | | | | |
| | | | | | | | |
F-33
CPI Card Group Inc. and Subsidiaries
Notes to Consolidated Financial Statements (Continued)
(Dollars in Thousands, Except Share and Per Share Amounts or as Otherwise Indicated)
19. Segment Reporting (Continued)
Net Sales by Product and Services
Net sales from products and services sold by the Company for the years ended December 31, 2014, 2013 and 2012 were as follows:
| |
December 31, | |||||||||
|---|---|---|---|---|---|---|---|---|---|---|
| |
2014 | 2013 | 2012 | |||||||
Product net sales(a) |
$ | 159,220 | $ | 101,360 | $ | 98,969 | ||||
Services net sales(b) |
101,786 | 95,010 | 84,817 | |||||||
| | | | | | | | | | | |
Total net sales: |
$ | 261,006 | $ | 196,370 | $ | 183,786 | ||||
| | | | | | | | | | | |
| | | | | | | | | | | |
| | | | | | | | | | | |
- (a)
- Product
net sales include the design and production of Financial Payment Cards, in Contact EMV, Dual-Interface EMV, contactless and magnetic
stripe formats. The Company also generates product revenue from the sale of Card@Once® instant issuance systems, private label credit cards, and retail gift cards.
- (b)
- Services net sales include revenue from the personalization and fulfillment of Financial Payment Cards, the provision of tamper-evident security packaging, providing fulfillment services to Prepaid Debit Card program managers and software as a service personalization of instant issuance debit cards. The Company also generates service revenue from personalizing retail gift cards (primarily in Canada and the United Kingdom) and from click-fees generated from the Company's patented card design software, known as MYCA, which provides customers and cardholders the ability to design cards on the internet and customize cards with individualized digital images.
20. Subsequent Event
Closure of Facility
On February 16, 2015, the CPI Board of Directors decided that its operation located in Petersfield, United Kingdom would be shut down. The shutdown and closure of this facility was completed in the third quarter of 2015.
New Credit Agreement and Series A Preferred Stock Redemption
On August 17, 2015, the Company entered into a new first lien credit facility. The aggregate principal balance of the term loan under the first lien credit facility totaled $435,000 and the aggregate revolving commitments under the first lien credit facility totaled $40,000. As of August 17, 2015, the Company did not have any outstanding revolving loans other than outstanding letters of credit of approximately $100, which reduced the borrowing capacity under the revolving credit facility by an equivalent amount.
The term loan and the revolving credit facility under the first lien credit facility have a maturity date of August 17, 2022 and August 17, 2020, respectively. The loans under the first lien credit facility are required to be prepaid in advance of the maturity date upon the occurrence of certain customary
F-34
CPI Card Group Inc. and Subsidiaries
Notes to Consolidated Financial Statements (Continued)
(Dollars in Thousands, Except Share and Per Share Amounts or as Otherwise Indicated)
20. Subsequent Event (Continued)
events. The Company is also required to prepay at least $75,000 of the term loans under the first lien credit facility upon the consummation of a qualified initial public offering.
On August 17, 2015, with the proceeds of the term loan under the first lien credit facility, the Company redeemed 62,140 shares of Series A Preferred Stock with an aggregate redemption value of $276,318, refinanced $142,042 of outstanding indebtedness under the existing term loan and financed the payment of related transaction fees and expenses of $17,646.
The new first lien credit facility is secured by a first-priority security interest in substantially all of the Company's assets constituting equipment, inventory, receivables, cash and other personal property. Such security excludes certain specified assets, as more fully set forth in the collateral agreement under the first lien credit facility.
Interest rates under the new first lien credit facility are based, at the Company's election, on a Eurodollar rate plus a margin of 4.50% or a base rate plus a margin of 3.50%. Letters of credit are subject to a 0.125% fronting fee payable to the issuing bank and a fee payable to the revolving lenders equal to the margin applicable to Eurodollar revolving loans. In addition, the Company is required to pay an unused commitment fee ranging from 0.375% per annum to 0.50% per annum of the average unused portion of the revolving commitments. The unused commitment fee is determined on the basis of a grid that results in a lower unused commitment fee as our total net leverage ratio declines.
The new first lien credit facility contains customary covenants, including among other things, restrictions on indebtedness, issuance of liens, investments, dividends, redemptions and other distributions to equity holders, asset sales, certain mergers or consolidations, sales, transfers, leases or dispositions of substantially all of our assets, and affiliate transactions. The restrictions on dividends, redemptions and other distributions to equity holders contained in the first lien credit facility are subject to certain exceptions.
The new first lien credit facility also contains a requirement that, as of the last day of any fiscal quarter, if the amount we have drawn under the first lien credit facility is greater than 50% of the aggregate principal amount of all commitments of the lenders thereunder, the Company maintain a first lien net leverage not in excess of 7.0x.
Stock Split and Increase in Authorized Shares
On September 3, 2015, our Board of Directors approved a 22-for-1 stock split of our common stock and an increase in the number of authorized shares of common stock to 75 million. The stock split and increase in authorized shares became effective upon filing of a certificate of amendment to our certificate of incorporation on September 3, 2015. Upon the effectiveness of the stock split, (i) every share of outstanding common stock was divided into 22 shares of common stock, (ii) the number of shares of common stock available under the 2007 Stock Option Plan, and the corresponding granted, outstanding and exercisable stock options, were increased on a 22-for-1 basis and the exercise price of the associated stock options was proportionately reduced on a 22-for-1 basis and (iii) the number of outstanding restricted shares of common stock was increased on a 22-for-1 basis. All of the share numbers, share prices and exercise prices have been retroactively adjusted to reflect the stock split in the accompanying consolidated financial statements.
F-35
CPI Card Group Inc. and Subsidiaries
Condensed Consolidated Balance Sheets
(Dollars in Thousands, Except Shares and Per Share Amounts)
(Unaudited)
| |
June 30, 2015 |
December 31, 2014 |
|||||
|---|---|---|---|---|---|---|---|
Assets |
|||||||
Current assets: |
|||||||
Cash and cash equivalents |
$ | 13,007 | $ | 12,941 | |||
Accounts receivable, net of allowances of $674 and $272, respectively |
51,385 | 43,548 | |||||
Inventories |
28,043 | 21,605 | |||||
Prepaid expenses and other current assets |
4,243 | 4,129 | |||||
Income taxes refundable |
10,494 | — | |||||
Deferred income taxes |
636 | 634 | |||||
Current assets of a discontinued operation |
— | 5,862 | |||||
| | | | | | | | |
Total current assets |
107,808 | 88,719 | |||||
Plant, equipment and leasehold improvements, net |
48,431 | 44,772 | |||||
Capitalized loan fees |
438 | 614 | |||||
Intangible assets, net |
56,425 | 58,703 | |||||
Goodwill |
73,770 | 73,801 | |||||
Other assets |
912 | 15 | |||||
| | | | | | | | |
Total assets |
$ | 287,784 | $ | 266,624 | |||
| | | | | | | | |
| | | | | | | | |
| | | | | | | | |
Liabilities and stockholders' deficit |
|||||||
Current liabilities: |
|||||||
Accounts payable |
$ | 21,495 | $ | 16,276 | |||
Accrued expenses |
8,473 | 10,591 | |||||
Deferred revenue and customer deposits |
3,373 | 3,382 | |||||
Current maturities of long-term debt |
6,556 | 6,326 | |||||
Income taxes payable |
— | 13 | |||||
| | | | | | | | |
Total current liabilities |
39,897 | 36,588 | |||||
Long-term debt, net of current maturities |
151,864 |
164,098 |
|||||
Sellers Note |
9,000 | 9,000 | |||||
Deferred income taxes |
24,969 | 13,810 | |||||
Other long-term liabilities |
7,864 | 6,572 | |||||
| | | | | | | | |
Total liabilities |
233,594 | 230,068 | |||||
Commitments and contingencies |
|||||||
Series A Preferred Stock; $0.001 par value—100,000 shares authorized; 86,407 shares issued and 64,716 shares outstanding and 86,407 shares issued and 64,809 shares outstanding; liquidation preference of $281,005 and $256,017 at June 30, 2015 and December 31, 2014, respectively |
57,880 |
58,250 |
|||||
Stockholders' deficit |
|||||||
Common Stock; $0.001 par value—75,000,000 shares authorized; 45,032,240 shares issued and 41,476,116 shares outstanding and 44,840,576 shares issued and 41,371,220 shares outstanding at June 30, 2015 and December 31, 2014, respectively |
2 | 2 | |||||
Additional paid-in capital |
(24,848 | ) | (24,802 | ) | |||
Accumulated earnings |
24,194 | 5,798 | |||||
Accumulated other comprehensive loss |
(2,930 | ) | (2,584 | ) | |||
Employee notes receivable |
(108 | ) | (108 | ) | |||
| | | | | | | | |
Total stockholders' deficit |
(3,690 | ) | (21,694 | ) | |||
| | | | | | | | |
Total liabilities and stockholders' deficit |
$ | 287,784 | $ | 266,624 | |||
| | | | | | | | |
| | | | | | | | |
| | | | | | | | |
See accompanying notes to condensed consolidated financial statements
F-36
CPI Card Group Inc. and Subsidiaries
Condensed Consolidated Statements of Operations and Comprehensive Income
(Dollars in Thousands)
(Unaudited)
| |
Three Months Ended June 30, |
Six Months Ended June 30, |
|||||||||||
|---|---|---|---|---|---|---|---|---|---|---|---|---|---|
| |
2015 | 2014 | 2015 | 2014 | |||||||||
Net sales: |
|||||||||||||
Products |
$ | 67,757 | $ | 33,574 | $ | 112,771 | $ | 58,905 | |||||
Services |
27,779 | 19,662 | 60,075 | 36,862 | |||||||||
| | | | | | | | | | | | | | |
Total net sales |
95,536 | 53,236 | 172,846 | 95,767 | |||||||||
| | | | | | | | | | | | | | |
Cost of sales: |
|||||||||||||
Products (exclusive of depreciation and amortization shown below) |
41,892 | 25,425 | 72,802 | 45,684 | |||||||||
Services (exclusive of depreciation and amortization shown below) |
15,464 | 10,349 | 33,929 | 20,435 | |||||||||
Depreciation and amortization |
2,345 | 1,908 | 4,772 | 3,850 | |||||||||
| | | | | | | | | | | | | | |
Total cost of sales |
59,701 | 37,682 | 111,503 | 69,969 | |||||||||
| | | | | | | | | | | | | | |
Gross profit |
35,835 | 15,554 | 61,343 | 25,798 | |||||||||
Operating expenses: |
|||||||||||||
Selling, general, and administrative (exclusive of depreciation and amortization shown below) |
14,514 | 7,805 | 26,691 | 14,498 | |||||||||
Depreciation and amortization |
1,634 | 880 | 3,268 | 1,764 | |||||||||
| | | | | | | | | | | | | | |
Total operating expenses |
16,148 | 8,685 | 29,959 | 16,262 | |||||||||
| | | | | | | | | | | | | | |
Income from operations |
19,687 | 6,869 | 31,384 | 9,536 | |||||||||
Other income (expense): |
|||||||||||||
Interest, net |
(1,616 | ) | (1,761 | ) | (3,505 | ) | (3,444 | ) | |||||
Foreign currency gain (loss) |
27 | (33 | ) | 149 | (211 | ) | |||||||
Other income, net |
73 | 23 | 61 | 19 | |||||||||
| | | | | | | | | | | | | | |
Total other expense, net |
(1,516 | ) | (1,771 | ) | (3,295 | ) | (3,636 | ) | |||||
| | | | | | | | | | | | | | |
Income before income taxes |
18,171 | 5,098 | 28,089 | 5,900 | |||||||||
Provision for income taxes |
(6,016 | ) | (2,028 | ) | (9,974 | ) | (2,334 | ) | |||||
| | | | | | | | | | | | | | |
Net income from continuing operations |
12,155 | 3,070 | 18,115 | 3,566 | |||||||||
Discontinued Operation (see note 3): |
|||||||||||||
Loss from a discontinued operation, net of taxes |
— | (1,167 | ) | (606 | ) | (2,763 | ) | ||||||
Gain on sale of discontinued operation, net of taxes |
— | — | 887 | — | |||||||||
| | | | | | | | | | | | | | |
Net income |
$ | 12,155 | $ | 1,903 | $ | 18,396 | $ | 803 | |||||
| | | | | | | | | | | | | | |
| | | | | | | | | | | | | | |
| | | | | | | | | | | | | | |
Other Comprehensive Income |
|||||||||||||
Currency translation adjustment |
434 | 395 | (346 | ) | 303 | ||||||||
| | | | | | | | | | | | | | |
Total comprehensive income |
$ | 12,589 | $ | 2,298 | $ | 18,050 | $ | 1,106 | |||||
| | | | | | | | | | | | | | |
| | | | | | | | | | | | | | |
| | | | | | | | | | | | | | |
Earnings Per Share |
|||||||||||||
Net income from continuing operations |
$ | 12,155 | $ | 3,070 | $ | 18,115 | $ | 3,566 | |||||
Preferred stock dividends |
(12,747 | ) | (10,548 | ) | (25,359 | ) | (20,980 | ) | |||||
| | | | | | | | | | | | | | |
Losses from continuing operations attributable to common stockholders |
(592 | ) | (7,478 | ) | (7,244 | ) | (17,414 | ) | |||||
(Loss) Income from a discontinued operation, net of taxes |
— | (1,167 | ) | 281 | (2,763 | ) | |||||||
| | | | | | | | | | | | | | |
Net loss available to common stockholders |
$ | (592 | ) | $ | (8,645 | ) | $ | (6,963 | ) | $ | (20,177 | ) | |
| | | | | | | | | | | | | | |
| | | | | | | | | | | | | | |
| | | | | | | | | | | | | | |
Basic and diluted (loss) income per share: |
|||||||||||||
Continued operations |
$ | (0.02 | ) | $ | (0.18 | ) | $ | (0.18 | ) | $ | (0.42 | ) | |
Discontinued operations |
— | (0.03 | ) | 0.01 | (0.07 | ) | |||||||
| | | | | | | | | | | | | | |
|
$ | (0.02 | ) | $ | (0.21 | ) | $ | (0.17 | ) | $ | (0.49 | ) | |
| | | | | | | | | | | | | | |
| | | | | | | | | | | | | | |
| | | | | | | | | | | | | | |
See accompanying notes to condensed consolidated financial statements
F-37
CPI Card Group Inc. and Subsidiaries
Condensed Consolidated Statements of Cash Flows
(Dollars in Thousands)
(Unaudited)
| |
Six Months Ended June 30, |
||||||
|---|---|---|---|---|---|---|---|
| |
2015 | 2014 | |||||
Operating activities |
|||||||
Net income |
$ | 18,396 | $ | 803 | |||
Adjustments to reconcile net income from continuing operations to net cash provided by operating activities, net of effects of acquisitions: |
|||||||
Depreciation, amortization and accretion expense |
8,364 | 7,574 | |||||
Non-cash accretion of defined stock compensation plan |
1,503 | (591 | ) | ||||
Loss on sale of a discontinued operation |
1,039 | — | |||||
Other |
396 | 68 | |||||
Unrealized foreign currency exchange gain |
85 | 22 | |||||
Deferred taxes |
11,151 | — | |||||
Changes in operating assets and liabilities: |
|||||||
Accounts receivable |
(7,680 | ) | (5,658 | ) | |||
Inventories |
(6,826 | ) | (8,729 | ) | |||
Prepaid expenses and other current assets |
593 | (2,304 | ) | ||||
Income taxes |
(10,494 | ) | (1,184 | ) | |||
Accounts payable |
4,659 | 7,504 | |||||
Accrued expenses |
(2,093 | ) | 800 | ||||
Deferred revenue and customer deposits |
(184 | ) | 2,671 | ||||
| | | | | | | | |
Cash provided by operating activities |
18,909 | 976 | |||||
Investing activities |
|||||||
Proceeds from sale of a discontinued operation |
5,000 | — | |||||
Acquisitions of plant, equipment and leasehold improvements |
(10,526 | ) | (8,161 | ) | |||
| | | | | | | | |
Cash used in investing activities |
(5,526 | ) | (8,161 | ) | |||
Financing activities |
|||||||
Payment of long-term debt |
(12,268 | ) | (7,763 | ) | |||
Proceeds from line of credit |
— | 10,800 | |||||
Payment of deferred stock issuance costs |
(589 | ) | |||||
Redemption of preferred and common stock |
(417 | ) | — | ||||
| | | | | | | | |
Cash (used in) provided by financing activities |
(13,274 | ) | 3,037 | ||||
Effect of exchange rates on cash |
(43 |
) |
120 |
||||
| | | | | | | | |
Net increase (decrease) in cash and cash equivalents: |
66 | (4,028 | ) | ||||
Cash and cash equivalents, beginning of period |
12,941 | 9,702 | |||||
| | | | | | | | |
Cash and cash equivalents, end of period |
$ | 13,007 | $ | 5,674 | |||
| | | | | | | | |
| | | | | | | | |
| | | | | | | | |
Supplemental disclosures of cash flow information |
|||||||
Cash paid during the period for: |
|||||||
Interest |
$ | 3,173 | $ | 3,173 | |||
| | | | | | | | |
| | | | | | | | |
| | | | | | | | |
Income taxes |
$ | 7,277 | $ | 274 | |||
| | | | | | | | |
| | | | | | | | |
| | | | | | | | |
See accompanying notes to condensed consolidated financial statements
F-38
CPI Card Group Inc. and Subsidiaries
Notes to Condensed Consolidated Financial Statements
(Dollars in Thousands, Except Share and Per Share Amounts or as Otherwise Indicated)
(Unaudited)
1. Summary of Significant Accounting Policies
Basis of Presentation
The accompanying unaudited condensed consolidated financial statements have been prepared in accordance with accounting principles generally accepted in the United States ("GAAP") for interim financial information and with the rules and regulations of the Securities and Exchange Commission ("SEC") for reporting on Form S-1, but does not include all the disclosures required by GAAP. The accompanying unaudited condensed consolidated financial statements and these notes thereto have been condensed or omitted pursuant to rules and regulations and should be read in conjunction with our 2014 consolidated financial statements and notes thereto included in this prospectus. In the opinion of management, these financial statements reflect all adjustments (consisting solely of normal recurring matters) considered necessary for a fair statement of the results for the interim periods presented. The results of operations for any interim period are not necessarily indicative of results for the full year.
The Company sold its non-secure operation located in Nevada on January 12, 2015 (the "Nevada Sale") under an asset purchase agreement for $5,000 in cash. Nevada primarily produced retail gift cards that are not issued on the networks of the Payment Card Brands. Accordingly, the Company's consolidated balance sheets for the year ended December 31, 2014 and the statements of operations and comprehensive income for the three and six months ended June 30, 2015 and 2014 have been reclassified to present Nevada as a discontinued operation. See Note 3 for more information related to the discontinued operation and disposition.
Revenue Recognition
Generally, the Company recognizes revenue related to sales of its products upon shipment, when persuasive evidence of an arrangement exists, delivery has occurred or services have been rendered, the fee is fixed or determinable and collectability is reasonably assured.
In certain cases, at the customer's request, the Company enters into bill-and-hold transactions whereby title transfers to the customer, but the product does not ship until a specified later date. The Company recognizes revenue associated with bill-and-hold arrangements when the product is complete and ready to ship, hold criteria have been met, the amount due from the customer is fixed and collectability of the related receivable is reasonably assured.
Freight revenue totaling $1,017 and $1,035 is included in net sales for the three months ended June 30, 2015 and 2014, respectively, and $1,978 and $2,101 for the six months ended June 30, 2015 and 2014, respectively. The related freight costs are included in cost of sales.
Multiple-Element Arrangements
The Company enters into warehouse, fulfillment and distribution service agreements with several customers, engaging the Company to store and handle completed cards and packages on their behalf. For the sales arrangements that contain multiple deliverables, the arrangement is split into separate units of accounting and individually delivered elements have value to the customer on a standalone basis. When separate units of accounting exist, revenue is allocated to each element based on the Company's best estimate of competitive market prices. At the point in which completed cards and
F-39
CPI Card Group Inc. and Subsidiaries
Notes to Condensed Consolidated Financial Statements (Continued)
(Dollars in Thousands, Except Share and Per Share Amounts or as Otherwise Indicated)
(Unaudited)
1. Summary of Significant Accounting Policies (Continued)
packages are shipped to the Company's warehouse, the product is billed and the revenue is recognized in accordance with the Company's revenue recognition policy. Warehousing service revenue is recognized monthly based on volume and handling requirements. Fulfillment service revenue is recognized when the product is handled in the manner specified by the customer for a unit or handling fee.
Trade Accounts Receivable and Concentration of Credit Risk
Accounts receivable are stated at the amount management expects to collect from outstanding balances. The Company performs ongoing credit evaluations of its customers and generally requires no collateral to secure accounts receivable. The Company maintains an allowance for potentially uncollectible accounts receivable based upon its assessment of the collectability of accounts receivable. Accounts are written off against the allowance when it becomes probable collection will not occur.
For the three and six months ended June 30, 2015, the Company did not have any sales to one customer over 10% of consolidated net sales. For the three months ended June 30, 2014 the Company had sales to two customers amounting to $6,113 (11.5% of consolidated net sales) and $5,835 (11.0% of consolidated net sales). For six months ended June 30, 2014, the Company did not have any sales to one customer over 10% of consolidated net sales.
Plant, Equipment and Leasehold Improvements
Plant, equipment and leasehold improvements are recorded at cost. Accumulated depreciation is computed using the straight-line method over the lesser of the estimated useful life of the related assets (generally 3 to 10 years for equipment, furniture and leasehold improvements) or, when applicable, the lease term. Maintenance and repairs that do not extend the useful life of the respective assets are charged to expense as incurred. For the Company's continuing operations, amounts charged to expense for the depreciation of plant, equipment and leasehold improvements was $2,834 and $2,278 for the three months ended June 30, 2015 and 2014, respectively, and $5,751 and $4,592 for the six months ended June 30, 2015 and 2014, respectively.
Long-lived assets with finite lives are reviewed for impairment whenever events indicate that the carrying amount of the asset or the carrying amounts of the asset group containing the asset may not be recoverable. In such reviews, estimated undiscounted future cash flows associated with these assets or asset groups are compared with their carrying value to determine if a write-down to fair value is required. To date in the periods presented, the Company has determined no impairment was required.
Goodwill and Intangible Assets
Goodwill and other indefinite-lived intangible assets are not amortized, but instead are tested for impairment at least annually on October 1. Testing is done in accordance with ASC 350, Intangibles—Goodwill and Other and ASC 820, Fair Value Measurements and Disclosures. For impairment evaluations, the Company or third-party firm first makes a qualitative assessment with respect to both goodwill and other indefinite-lived intangibles. In the case of goodwill, if it is more likely than not that a reporting unit's fair value is less than its carrying value, the fair value of the reporting unit is compared to its
F-40
CPI Card Group Inc. and Subsidiaries
Notes to Condensed Consolidated Financial Statements (Continued)
(Dollars in Thousands, Except Share and Per Share Amounts or as Otherwise Indicated)
(Unaudited)
1. Summary of Significant Accounting Policies (Continued)
respective carrying amount. If the carrying value of a reporting unit were to exceed its fair value, any excess of the carrying amount over the fair value would be charged to operations as an impairment loss. With respect to indefinite-lived intangible assets, if it is more-likely-than-not that the fair value of an indefinite-lived intangible asset is less than its carrying value, any excess of the carrying value over the fair value of the indefinite-lived intangible asset is also charged to operations as an impairment loss.
Acquired finite-lived intangible assets are amortized on a straight-line basis over the estimated useful lives of the assets. The estimated remaining useful lives for intangible assets range from 6 months to 14 years. Acquired indefinite-lived intangible assets related to trademarks are capitalized and subject to impairment.
Use of Estimates
Management uses estimates and assumptions relating to the reporting of assets and liabilities in its preparation of the condensed consolidated financial statements. Significant items subject to such estimates and assumptions include the carrying amount of property and equipment, goodwill and intangible assets; valuation allowances for receivables, inventories and deferred tax assets; and stock-based compensation expense. Actual results could differ from those estimates.
Foreign Currency Translation
Financial statements of international subsidiaries that use local currencies as their functional currency are translated into U.S. dollars using the exchange rate at each balance sheet date for assets and liabilities and the weighted-average exchange rate for each period for revenues, expenses, gains and losses. Translation adjustments are recorded as the only component of other comprehensive income in the accompanying financial statements. Foreign currency transaction gains and losses resulting from the process of re-measurement are recorded in other income (expense) in the accompanying consolidated statements of operations and comprehensive income. For the three months ended June 30, 2015 and 2014 there were $27 and ($33), respectively, and for the six months ended June 30, 2015 and 2014 there were $149 and $(211), respectively, of such foreign currency gains (losses).
Recently Issued Accounting Pronouncements
The Financial Accounting Standards Board (FASB) issued Accounting Standards Update (ASU) 2014-09, Revenue from Contracts with Customers, in May 2014. ASU 2014-09 requires an entity to recognize revenue to depict the transfer of promised goods or services to customers in an amount that reflects the consideration to which the entity expects to be entitled in exchange for those goods or services. An entity should also disclose sufficient quantitative and qualitative information to enable users of financial statements to understand the nature, amount, timing and uncertainty of revenue and cash flows arising from contracts with customers. In July 2015, the FASB deferred the effective date to annual reporting periods beginning after December 15, 2017, and interim reporting periods within those periods. The Company plans to implement the provisions of ASU 2014-09 as of January 1, 2018.
F-41
CPI Card Group Inc. and Subsidiaries
Notes to Condensed Consolidated Financial Statements (Continued)
(Dollars in Thousands, Except Share and Per Share Amounts or as Otherwise Indicated)
(Unaudited)
1. Summary of Significant Accounting Policies (Continued)
The Company is in the process of determining the method of adoption and assessing the impact of ASU 2014-09 on its results of operations, financial position and consolidated financial statements.
The FASB issued ASU 2015-03, Interest—Imputation of Interest, in April 2015. ASU 2015-03 requires debt issuance costs related to a recognized debt liability to be presented on the balance sheet as a direct deduction from the debt liability, similar to the presentation of debt discounts. The new standard is effective for public entities annual reporting periods beginning after December 15, 2015. We do not expect that this pronouncement will have a material impact on our consolidated financial statements.
The FASB issued ASU 2015-11, Inventory—Simplifying the Measurement of Inventory, in July 2015. ASU 2015-11 requires that inventory be measured at the lower of cost and net realizable value. Net realizable value is the estimated selling prices in the ordinary course of business, less reasonably predictable costs of completion, disposal, and transportation. The new standard is effective for public entities annual reporting periods beginning after December 15, 2016. We will implement the provisions of ASU 2015-11 as of January 1, 2017. We are in the process of assessing the impact of ASU 2015-11 on our results of operations, financial position and consolidated financial statements.
2. EFT Source Acquisition
On September 2, 2014, CPI Card Group Inc., through its wholly-owned subsidiary, CPI Acquisition, Inc., purchased EFT Source, Inc. ("EFT Source") headquartered in Nashville, Tennessee. EFT Source is a provider of Financial Payment Card services such as data personalization and fulfillment in the U.S. market. The primary reasons for the acquisition were to extend the Company's existing product lines, expand its markets, and increase revenue. Total consideration of $68,859 was paid in cash of $54,859 and non-cash considerations of $9,000 in Sellers Note and issuance of $5,000 of CPI Card Group Inc. preferred and common stock.
The assets and liabilities assumed in the acquisition were included in the condensed consolidated balance sheet as of June 30, 2015 and December 31, 2014. The results of the EFT Source operations were also included in the condensed consolidated statement of operations for the three and six month period ended June 30, 2015.
Pro Forma Information
The following unaudited pro forma consolidated operating results give effect to the EFT Source acquisition as if it had been completed on January 1, 2014. These pro forma amounts are not necessarily indicative of the operating results that would have occurred if these transactions had
F-42
CPI Card Group Inc. and Subsidiaries
Notes to Condensed Consolidated Financial Statements (Continued)
(Dollars in Thousands, Except Share and Per Share Amounts or as Otherwise Indicated)
(Unaudited)
2. EFT Source Acquisition (Continued)
occurred on such date. The pro forma adjustments are based on certain assumptions that the Company considers to be reasonable.
| |
Three Months Ended 30-Jun-14 |
Six Months Ended 30-Jun-14 |
|||||
|---|---|---|---|---|---|---|---|
Revenue—Continuing Operations |
$ | 64,086 | $ | 118,202 | |||
Net Income—Continuing Operations |
$ | 2,889 | $ | 3,192 | |||
| | | | | | | | |
| | | | | | | | |
| | | | | | | | |
Basic and diluted loss per share from Continuing Operations |
$ | (0.19) | (a) | $ | (0.43) | (a) | |
| | | | | | | | |
| | | | | | | | |
| | | | | | | | |
- (a)
- Loss per share from continuing operations attributable to common stockholders after giving effect to preferred stock dividends.
3. Discontinued Operation and Disposition
On January 12, 2015, the Company sold its Nevada non-secure operating segment under an asset purchase agreement for $5,000 in cash (the "Nevada Sale"). Nevada was primarily engaged in the design, production, data personalization, packaging and daily fulfillment of retail gift and loyalty cards for customers in the United States and was not certified by any of the Payment Card Brands. The net carrying values of the assets classified as a discontinued operation include inventory and plant, equipment and leasehold improvements of $3,128 and $2,910 respectively. During the six months ended June 30, 2015, the Company recognized a gain on the sale of discontinued operations of $887, which is included in the gain from a discontinued operation, net of an income tax benefit of $1,926 in the Company's consolidated statement of operations.
Nevada recognized a loss of $1,167 for the three months ended June 30, 2014, which is included in loss from a discontinued operation, net of an income tax benefit of $626 in the Company's consolidated statement of operations. Nevada recognized a loss of $606 for the six months ended June 30, 2015 and a loss of $2,763 for the six months ended June 30, 2014, which is included in loss from a discontinued operation, net of an income tax benefit of $404 and $1,482, respectively, in the Company's consolidated statement of operations.
After the Nevada Sale, CPI retained no significant continuing involvement in the Nevada operations other than a 180 day transition of services agreement. As a result of the Nevada Sale, the Company expects to be able to take a tax deduction of $32,128 related to the tax deductible goodwill and intangible assets of CPI Nevada of which $4,190 of the tax deductible goodwill resulted in the recognition of an income tax benefit of $1,510 during the six months ended June 30, 2015.
F-43
CPI Card Group Inc. and Subsidiaries
Notes to Condensed Consolidated Financial Statements (Continued)
(Dollars in Thousands, Except Share and Per Share Amounts or as Otherwise Indicated)
(Unaudited)
4. Inventories
Inventories are summarized below:
| |
June 30, 2015 |
December 31, 2014 |
|||||
|---|---|---|---|---|---|---|---|
Raw materials |
$ | 14,388 | $ | 10,217 | |||
Work-in-process |
11,539 | 8,222 | |||||
Finished goods |
2,116 | 3,166 | |||||
| | | | | | | | |
|
$ | 28,043 | $ | 21,605 | |||
| | | | | | | | |
| | | | | | | | |
| | | | | | | | |
5. Plant, Equipment and Leasehold Improvements
Plant, equipment and leasehold improvements consist of the following:
| |
June 30, 2015 |
December, 31 2014 |
|||||
|---|---|---|---|---|---|---|---|
Buildings |
$ | 2,509 | $ | 2,486 | |||
Machinery and equipment |
51,451 | 47,792 | |||||
Furniture and fixtures |
6,081 | 4,203 | |||||
Leasehold improvements |
13,634 | 12,593 | |||||
Construction in progress |
3,555 | 3,448 | |||||
| | | | | | | | |
|
77,230 | 70,522 | |||||
Less accumulated depreciation and amortization |
(28,799 | ) | (25,750 | ) | |||
| | | | | | | | |
|
$ | 48,431 | $ | 44,772 | |||
| | | | | | | | |
| | | | | | | | |
| | | | | | | | |
6. Goodwill and Other Intangible Assets
Goodwill relates to the Company's U.S. Debit and Credit, U.K. Limited, and Canada reporting units. The change in goodwill from December 31, 2014 to June 30, 2015 was a result of currency translation adjustments.
Intangible assets consist of customer relationships, technology and software, noncompete agreements, favorable leases and trademarks. Total intangible assets are being amortized over a weighted-average useful life of 16 years. The changes in the cost basis of the intangibles from December 31, 2014 to June, 2015 are related to foreign currency translations. Intangible amortization expense was $1,145 and $510 for the three months ended June 30, 2015 and 2014, respectively. Intangible amortization expense was $2,289 and $1,022 for the six months ended June 30, 2015 and 2014, respectively.
F-44
CPI Card Group Inc. and Subsidiaries
Notes to Condensed Consolidated Financial Statements (Continued)
(Dollars in Thousands, Except Share and Per Share Amounts or as Otherwise Indicated)
(Unaudited)
6. Goodwill and Other Intangible Assets (Continued)
As of June 30, 2015 and December 31, 2014, intangible assets, excluding goodwill, consist of the following:
| |
|
June 30, 2015 | December 31, 2014 | ||||||||||||||||||
|---|---|---|---|---|---|---|---|---|---|---|---|---|---|---|---|---|---|---|---|---|---|
| |
Average Life (Years) |
Cost | Accumulated Amortization |
Net Book Value |
Cost | Accumulated Amortization |
Net Book Value |
||||||||||||||
Customer relationships |
12 to 20 | $ | 59,892 | $ | (16,097 | ) | $ | 43,795 | $ | 59,871 | $ | (14,304 | ) | $ | 45,567 | ||||||
Technology and software |
7 to 10 | 7,101 | (774 | ) | 6,327 | 7,101 | (310 | ) | 6,791 | ||||||||||||
Noncompete agreements |
5 to 8 | 491 | (234 | ) | 257 | 491 | (198 | ) | 293 | ||||||||||||
Favorable leases |
9.5 | 111 | (94 | ) | 17 | 111 | (88 | ) | 23 | ||||||||||||
| | | | | | | | | | | | | | | | | | | | | | |
Intangible assets subject to amortization |
67,595 | (17,199 | ) | 50,396 | 67,574 | (14,900 | ) | 52,674 | |||||||||||||
Trademarks (indefinite-lived) |
6,029 | — | 6,029 | 6,029 | — | 6,029 | |||||||||||||||
| | | | | | | | | | | | | | | | | | | | | | |
|
$ | 73,624 | $ | (17,199 | ) | $ | 56,425 | $ | 73,603 | $ | (14,900 | ) | $ | 58,703 | |||||||
| | | | | | | | | | | | | | | | | | | | | | |
| | | | | | | | | | | | | | | | | | | | | | |
| | | | | | | | | | | | | | | | | | | | | | |
The estimated future aggregate amortization expense for the identified amortizable intangibles noted above as of June 30, 2015 is as follows:
2015 (remaining 6 months) |
$ | 2,296 | ||
2016 |
4,581 | |||
2017 |
4,554 | |||
2018 |
4,554 | |||
2019 |
4,534 | |||
Thereafter |
29,877 | |||
| | | | | |
|
$ | 50,396 | ||
| | | | | |
| | | | | |
| | | | | |
7. Fair Value of Financial Instruments
Fair value is defined as the price that would be received to sell an asset or paid to transfer a liability in an orderly transaction between market participants at the measurement date (exit price). In determining fair value, the Company utilizes a fair value hierarchy that prioritizes the inputs to valuation techniques used to measure fair value into three broad levels. The following is a brief description of those three levels:
- •
- Level 1—Unadjusted quoted prices in active markets for identical assets or liabilities accessible to the reporting
entity at the measurement date.
- •
- Level 2—Inputs, other than quoted prices included in Level 1 inputs that are observable for the asset or
liability, either directly or indirectly, for substantially the full term of the asset or liability.
- •
- Level 3—Unobservable inputs for the asset or liability used to measure fair value to the extent that observable inputs are not available, thereby allowing for situations in which there is little, if any, market activity for the asset or liability at measurement date.
F-45
CPI Card Group Inc. and Subsidiaries
Notes to Condensed Consolidated Financial Statements (Continued)
(Dollars in Thousands, Except Share and Per Share Amounts or as Otherwise Indicated)
(Unaudited)
7. Fair Value of Financial Instruments (Continued)
The Company's financial assets and liabilities subject to fair value measurements and the necessary disclosures are as follows:
| |
|
Fair Value Measurement at June 30, 2015 (Using Fair Value Hierarchy) |
|||||||||||
|---|---|---|---|---|---|---|---|---|---|---|---|---|---|
| |
Fair Value as of June 30, 2015 |
||||||||||||
| |
Level 1 | Level 2 | Level 3 | ||||||||||
Assets: |
|||||||||||||
Cash and cash equivalents |
$ | 13,007 | $ | 13,007 | $ | — | $ | — | |||||
Liabilities: |
|||||||||||||
Term Loan |
$ | 158,734 | $ | — | $ | 158,734 | $ | — | |||||
Sellers Note |
$ | 9,000 | $ | — | $ | — | $ | 9,000 | |||||
| |
|
Fair Value Measurement at December 31, 2014 (Using Fair Value Hierarchy) |
|||||||||||
|---|---|---|---|---|---|---|---|---|---|---|---|---|---|
| |
Fair Value as of December 31, 2014 |
||||||||||||
| |
Level 1 | Level 2 | Level 3 | ||||||||||
Assets: |
|||||||||||||
Cash and cash equivalents |
$ | 12,941 | $ | 12,941 | $ | — | $ | — | |||||
Liabilities: |
|||||||||||||
Term Loan |
$ | 170,866 | $ | — | $ | 170,866 | $ | — | |||||
Sellers Note |
$ | 9,000 | $ | — | $ | — | $ | 9,000 | |||||
The Company has determined that the carrying value of the Term Loan approximates the fair value based on the floating interest rate and minimal changes in credit spreads since the amended and restated Credit Agreement was entered into on September 2, 2014. The value of the Sellers Note approximates fair value based on the rate on the U.S. portion of the Term Loan at June 30, 2015.
8. Related-Party Transactions
The Company leases its operating facility in Indiana from a company that is owned by an individual who was a member of the Company's Board of Directors until August 7, 2015, and who is also a stockholder. The lease expires in January 2018 and requires the Company to pay property taxes, insurance and normal maintenance costs. The Company paid rent of $40 for each of the three month periods ended June 30, 2015 and 2014, and $81 for each of the six month periods ended June 30, 2015 and 2014.
In conjunction with certain officer and non-officer Company employees acquiring Preferred and Common Stock during 2013 and 2012, the Company obtained notes receivable from the employees that have remaining balances outstanding of $108 at both June 30, 2015 and December 31, 2014, respectively. These notes from employees were repaid in full as of August 17, 2015. See Note 12 for further discussion.
F-46
CPI Card Group Inc. and Subsidiaries
Notes to Condensed Consolidated Financial Statements (Continued)
(Dollars in Thousands, Except Share and Per Share Amounts or as Otherwise Indicated)
(Unaudited)
9. Long-Term Debt and Subordinated Credit Facility
Long-term debt consists of the following:
| |
June 30, 2015 | December 31, 2014 | |||||||||||||||||
|---|---|---|---|---|---|---|---|---|---|---|---|---|---|---|---|---|---|---|---|
| |
Principal | Unamortized Discount |
Total | Principal | Unamortized Discount |
Total | |||||||||||||
Term Loan facilities |
$ | 158,734 | $ | (314 | ) | $ | 158,420 | $ | 170,866 | $ | (442 | ) | $ | 170,424 | |||||
Less current maturities |
(6,808 | ) | 252 | (6,556 | ) | (6,547 | ) | 221 | (6,326 | ) | |||||||||
| | | | | | | | | | | | | | | | | | | | |
Long-term debt, net of current maturities |
151,926 | (62 | ) | 151,864 | 164,319 | (221 | ) | 164,098 | |||||||||||
Sellers Note |
9,000 | — | 9,000 | 9,000 | — | 9,000 | |||||||||||||
| | | | | | | | | | | | | | | | | | | | |
|
$ | 160,926 | $ | (62 | ) | $ | 160,864 | $ | 173,319 | $ | (221 | ) | $ | 173,098 | |||||
| | | | | | | | | | | | | | | | | | | | |
| | | | | | | | | | | | | | | | | | | | |
| | | | | | | | | | | | | | | | | | | | |
On September 2, 2014, the Company and its lenders amended and restated the Credit Agreement dated November 8, 2012. As a result, the existing senior term debt and related revolver were refinanced with new senior term debt of $175,343 (the "Term Loan") and a $25,000 unfunded revolver (the "Revolver") and the maturity was extended to September 30, 2016. The Term Loan included incremental gross proceeds of $60,000, and as of September 2, 2014, the Term Loan consisted of a U.S. Dollar term loan of $161,414 and a British Pound Sterling term loan of £8,194. The primary purpose of the additional debt was to finance the cash portion of the acquisition consideration of EFT Source. Principal and accrued interest payments on the Term Loan are due quarterly, with a final principal payment due on September 30, 2016. See Note 2 for further information.
The Company accounted for the debt refinancing in accordance with ASC 470-50-40-6, Modifications and Exchanges. The Company performed a present value of cash flows analysis of the new debt instrument as compared to the present value of the remaining cash flows under the terms of the original debt instrument on a creditor-by-creditor basis. This evaluation resulted in different methods of accounting for the modification depending on each creditor's participation in the senior term debt. As a result, on September 2, 2014 the Company recognized a $476 loss on extinguishment. For the portion accounted for as a debt modification, any fees associated with the debt modification incurred between the Company and the creditors, along with any existing unamortized discount, will be amortized as an adjustment of interest expense over the remaining term of the modified debt. Any third party costs incurred as part of the debt extinguishment have been expensed as incurred.
All fees associated with the debt extinguishment between the Company and the creditor, along with any existing unamortized discount, were recognized as a loss on extinguishment. Any third party costs incurred as part of the debt modification have been deferred.
Term Loan
The Term Loan interest rate is calculated using either the London Interbank Offered Rate ("LIBOR") plus a margin on a sliding scale between 2.75% to 4.25% depending on the Company's leverage ratio as determined every fiscal quarter, or at a Base Rate plus a margin on a sliding scale between 1.75% to 3.25% depending on the Company's leverage ratio as determined every fiscal quarter. At June 30, 2015, the U.S. term loan was at a borrowing rate of 3.02% and the British Pound
F-47
CPI Card Group Inc. and Subsidiaries
Notes to Condensed Consolidated Financial Statements (Continued)
(Dollars in Thousands, Except Share and Per Share Amounts or as Otherwise Indicated)
(Unaudited)
9. Long-Term Debt and Subordinated Credit Facility (Continued)
Sterling term loan was at a borrowing rate of 3.32%. Principal and accrued interest payments are due quarterly, with a maturity date of September 30, 2016.
The Credit Agreement is collateralized by the Company's equity interests in domestic subsidiaries and its unencumbered assets, which include accounts receivable, inventory, equipment, and intellectual property. The Credit Agreement is also collateralized by a partial pledge of the Company's equity interests in foreign subsidiaries, and no foreign assets are subject to a security interest.
The Credit Agreement contains restrictive covenants that, among other things, limit the incurrence of additional indebtedness, dividends, transactions with affiliates, disposition of assets, acquisitions, mergers and consolidations, liens and encumbrances, sale-leasebacks, changes in fiscal periods and restrictive payments. As of December 31, 2014 and June 30, 2015 the Company was in compliance with all covenants under the Credit Agreement, as amended. During the three months ended June 30, 2015 and 2014, the Company made total principal payments under the Term Loan of $5,639 and $9,551, respectively, including payments on the British Pound Sterling term loan of £119 ($187) and £119 ($202), respectively. During the six months ended June 30, 2015 and 2014, the Company made total principal payments under the Term Loan of $12,268 and $11,263, respectively, including payments on the British Pound Sterling term loan of £238 ($363) and £238 ($400), respectively.
The Credit Agreement was repaid in full and replaced with a new $435,000 term loan under the first lien credit facility entered into on August 17, 2015. See Note 18 for further information.
Sellers Note
The Company entered into a subordinated, unsecured promissory note for $9,000 with certain sellers of EFT Source as part of the EFT Acquisition. Interest on the Sellers Note accrues at 5.0% per annum and is paid quarterly. The Sellers Note principal and unpaid interest is due to the Sellers at the earlier of September 2, 2016 or with the execution of certain specific events as outlined in the Sellers Note. The Company reports the Sellers Note separately as long-term subordinated debt on the consolidated balance sheet.
Revolving Loan Facility
As of June 30, 2015, the Company has no outstanding balances under the Revolver and had $24,900 available for borrowing (see Letters of Credit below). The Company pays a commitment fee equal to 0.50% per annum on the undrawn portion available under the Revolver. The Revolver matures on September 30, 2016 and any outstanding balances are due at that time.
The Revolver accrues interest at either LIBOR plus a margin on a sliding scale between 2.75% to 4.25%, depending on the Company's leverage ratio as determined every fiscal quarter, or at a Base Rate plus a margin on a sliding scale between 1.75% and 3.25%, depending on the Company's leverage ratio as determined every fiscal quarter. The Revolver is collateralized the same as the term loan and is subject to the same restrictive debt covenants.
The Revolving Loan Facility was replaced with a new $40,000 revolving commitment under the new first lien credit facility on August 17, 2015. See Note 18 for further information.
F-48
CPI Card Group Inc. and Subsidiaries
Notes to Condensed Consolidated Financial Statements (Continued)
(Dollars in Thousands, Except Share and Per Share Amounts or as Otherwise Indicated)
(Unaudited)
9. Long-Term Debt and Subordinated Credit Facility (Continued)
Letters of Credit
The Company has two outstanding letters of credit for the security deposits on two real property lease agreements. These letters of credit are for a total of $100, reducing the Revolver availability. The Company pays a fee on the outstanding letters of credit at the applicable margin, which was 3.25% as of June 30, 2015, in addition to a fronting fee of 0.25% per annum.
10. Income Taxes
During the three months ended June 30, 2015, we recognized an income tax expense from continuing operations of $6,016 on pre-tax income of $18,171, representing an effective income tax rate of 33.1% compared to an income tax expense from continuing operations of $2,028 on pre-tax income of $5,098, representing an effective tax rate of 39.8% during the three months ended June 30, 2014.
During the six months ended June 30, 2015, we recognized an income tax expense of $9,974 on pre-tax income of $28,089, representing an effective income tax rate of 35.5% compared to an income tax expense of $2,334 on pre-tax income of $5,900, representing an effective tax rate of 39.6% during the six months ended June 30, 2014.
The effective tax rates for all periods presented differs from the federal U.S. statutory rates primarily due to a benefit from permanent deductions related to credits for domestic production activities partially offset by the impact of state income taxes.
11. Series A Preferred Stock
Series A Preferred Stock has a par value of $0.001 per share. The original Series A Preferred Stock has an initial liquidation preference equal to $1,000 per outstanding share. In addition, the Series A Preferred Stock liquidation preference earns a dividend of 20% per share per annum payable when declared by the Board of Directors. Such dividends accrue on each share from the date of original issuance and accrue on a daily basis, whether or not declared. Such dividends are cumulative so that if such dividend in respect of any previous or current annual dividend period, at the annual 20% rate, has not been paid, the deficiency shall first be fully paid before any dividend or other distribution shall be paid or declared and set apart for the Common Stock. As of June 30, 2015 the liquidation preference of Series A Preferred Stock had a redemption value of approximately $4,342.12 per outstanding share for a total aggregate cumulative liquidation value of $281,005.
| |
Series A Preferred Stock |
||||||
|---|---|---|---|---|---|---|---|
| |
Shares | Amount | |||||
Balance as of December 31, 2014 |
64,809 | $ | 58,250 | ||||
Less redemptions of preferred stock |
(93 | ) | (370 | ) | |||
| | | | | | | | |
Balance as of June 30, 2015 |
64,716 | $ | 57,880 | ||||
| | | | | | | | |
| | | | | | | | |
| | | | | | | | |
During the year ended December 31, 2014, the Company issued 549 shares of Series A Preferred Stock at an estimated value of $3,733.88 per share as part of the payment consideration for the EFT
F-49
CPI Card Group Inc. and Subsidiaries
Notes to Condensed Consolidated Financial Statements (Continued)
(Dollars in Thousands, Except Share and Per Share Amounts or as Otherwise Indicated)
(Unaudited)
11. Series A Preferred Stock (Continued)
Source Acquisition. The Company redeemed 40 and 53 shares of Series A Preferred Stock at $3,950.33 and $4,017.43 per share, respectively, during the six months ended June 30, 2015.
In the event of any liquidation, dissolution or winding up of the Company, the Series A Preferred Stock holders shall be entitled to receive, prior and in preference to any distributions of any of the Company's assets to the Common Stock holders, the value of the liquidation preference. If the distribution of such assets is insufficient to permit the payment to such holders, the distribution shall be distributed ratably among the holders of the Series A Preferred Stock in proportion to the amount of such stock owned by each holder. The Series A Preferred Stock has no voting rights.
On August 17, 2015, the Company redeemed 62,140 shares of the Series A Preferred Stock for $276,318, or $4,446.70 per share. See Note 18 for more information.
12. Stockholders' Equity
Common Stock
Common Stock has a par value of $0.001 per share. Holders of Common Stock are entitled to receive dividends and distributions subject to the participation rights of holders of all classes of stock at the time outstanding, as such holders have prior rights as to dividends pursuant to the rights of any series of Preferred Stock. Upon any liquidation, dissolution, or winding up of the Company, after required payments are made to holders of any series of Preferred Stock, any remaining assets of the Company will be distributed ratably to the holders of Common Stock. Holders of Common Stock are entitled to one vote per share.
During the six months ended June 30, 2015, the Company redeemed 86,768 shares of Common Stock at values ranging from $0.32 to $0.91 per share. During the three months ended June 30, 2015, there was no Common Stock issued or redeemed. The redeemed common stock share values were calculated based on the related stockholder agreements.
Employee Notes Receivable
Included in contra stockholders' equity are promissory notes received in connection with equity issuances of Series A Preferred Stock and Common Stock to certain employees made during 2011 and earlier years. The notes receivable accrue interest at 5% per annum and are paid in bimonthly installments. The principal balances of the notes are due upon the employee's termination, the sale of the Company, upon any distributions, or at such time that the employee fails to own the underlying shares. The notes may be paid in whole or in part without any penalties at any time at the employee's option. During the six months ended June 30, 2015, the Company did not issue any new employee notes.
Employee notes receivable totaled $108 at both June 30, 2015 and December 31, 2014, respectively. There were no payments paid on the employee notes receivable during the three and six months ended June 30, 2015 and 2014. As of August 17, 2015, the employee notes receivable were repaid in full to the Company.
F-50
CPI Card Group Inc. and Subsidiaries
Notes to Condensed Consolidated Financial Statements (Continued)
(Dollars in Thousands, Except Share and Per Share Amounts or as Otherwise Indicated)
(Unaudited)
13. Earnings per Share
Basic or diluted earnings (loss) per share is computed by dividing net earnings or loss by the weighted number of ordinary shares outstanding during the period. All potentially dilutive shares have been excluded from the weighted-average number of shares of common stock outstanding as their inclusion in the computation for all years would be antidilutive due to net losses.
The following table sets forth the computation of basic and diluted EPS attributable to continuing and discontinued operations:
| |
Three Months Ended June 30, | Six Months Ended June 30, | |||||||||||
|---|---|---|---|---|---|---|---|---|---|---|---|---|---|
| |
2015 | 2014 | 2015 | 2014 | |||||||||
Numerator: |
|||||||||||||
Net income from continuing operations |
$ | 12,155 | $ | 3,070 | $ | 18,115 | $ | 3,566 | |||||
Preferred stock dividends |
(12,747 | ) | (10,548 | ) | (25,359 | ) | (20,980 | ) | |||||
| | | | | | | | | | | | | | |
Loss from continuing operations attributable to common stockholders |
(592 | ) | (7,478 | ) | (7,244 | ) | (17,414 | ) | |||||
(Loss) income from a discontinued operation, net of taxes |
— | (1,167 | ) | 281 | (2,763 | ) | |||||||
| | | | | | | | | | | | | | |
Net loss available to common stockholders |
$ | (592 | ) | $ | (8,645 | ) | $ | (6,963 | ) | $ | (20,177 | ) | |
| | | | | | | | | | | | | | |
| | | | | | | | | | | | | | |
| | | | | | | | | | | | | | |
Denominator: |
|||||||||||||
Basic EPS—weighted average common shares outstanding |
41,284,452 | 41,113,952 | 41,312,854 | 41,113,952 | |||||||||
Basic EPS: |
|||||||||||||
Loss from continuing operations |
$ | (0.02 | ) | $ | (0.18 | ) | $ | (0.18 | ) | $ | (0.42 | ) | |
(Loss) income from a discontinued operation, net of taxes |
— | (0.03 | ) | (0.01 | ) | (0.07 | ) | ||||||
| | | | | | | | | | | | | | |
Net loss |
$ | (0.02 | ) | $ | (0.21 | ) | $ | (0.17 | ) | $ | (0.49 | ) | |
| | | | | | | | | | | | | | |
| | | | | | | | | | | | | | |
| | | | | | | | | | | | | | |
The Company reported losses from continuing operations available to common stockholders for three months ended June 30, 2015 and 2014 and the six months ended June 30, 2014 and 2014. Accordingly, the potentially dilutive effect of the outstanding stock options and non-vested restricted Common Stock of 719,664, and 627,000, respectively, has been excluded from the computation of diluted loss per share because their inclusion would have been anti-dilutive. As further described in Note 11, the cumulative dividends in arrears related to Series A Preferred Stock must be paid before any distribution can be paid to the Company's common shareholders. As of June 30, 2015, cumulative dividends in arrears related to Series A Preferred Stock in aggregate was $216,289.
F-51
CPI Card Group Inc. and Subsidiaries
Notes to Condensed Consolidated Financial Statements (Continued)
(Dollars in Thousands, Except Share and Per Share Amounts or as Otherwise Indicated)
(Unaudited)
14. Commitments and Contingencies
The Company leases real property for its facilities under noncancelable operating lease agreements. Land and facility leases expire at various dates between 2015 and 2023 and contain various provisions for rental adjustments and renewals. All of these leases require the Company to pay property taxes, insurance and normal maintenance costs.
During the normal course of business, the Company also enters into non-cancellable agreements to purchase goods and services, including production equipment and IT systems.
Future cash payments with respect to non-cancellable capital leases, operating leases and purchase obligations as of June 30, 2015 are as follows:
| |
Capital Leases |
Operating Leases |
Purchase Obligations |
|||||||
|---|---|---|---|---|---|---|---|---|---|---|
2015 (remaining 6 months) |
$ | 41 | $ | 2,279 | $ | 5,497 | ||||
2016 |
52 | 4,250 | — | |||||||
2017 |
— | 3,414 | — | |||||||
2018 |
— | 2,538 | — | |||||||
2019 |
— | 1,156 | — | |||||||
Thereafter |
— | 1,272 | — | |||||||
| | | | | | | | | | | |
Total |
93 | $ | 14,909 | $ | 5,497 | |||||
| | | | | | | | | | | |
| | | | | | | | | | | |
| | | | | | | | | | | |
Less interest costs |
(10 | ) | ||||||||
| | | | | | | | | | | |
Present value of minimum lease payment |
$ | 83 | ||||||||
| | | | | | | | | | | |
| | | | | | | | | | | |
| | | | | | | | | | | |
The amount of the minimum lease payments under capital leases is included in other long-term liabilities in the consolidated balance sheet at June 30, 2015 and December 31, 2014.
The Company incurred rent expense under non-cancellable operating leases of $886 and $799 for the three months ended June 30, 2015 and 2014, respectively and $1,819 and $1,568 for the six months ended June 30, 2015 and 2014, respectively.
Asset retirement obligations relate to legal obligations associated with the removal of all leasehold improvements at the end of the lease term. The Company records all asset retirement obligations, which primarily relate to "make-good" clauses in operating leases, for its leased property containing leasehold improvements. The liability, reported within other long-term liabilities, is accreted through charges to operating expenses. If the asset retirement obligation is settled for an amount other than the carrying amount of the liability, the Company recognizes a gain or loss on settlement. Accretion expense was $4 for both the six month periods ended June 30, 2015 and 2014. As of June 30, 2015 and December 31, 2014, the Company's asset retirement obligations included in other long-term liabilities were $918 and $911, respectively.
15. Stock-Based Compensation
The Company accounts for stock-based compensation pursuant to ASC 718, "Share-Based Payment," which requires measurement of compensation cost for all stock awards at fair value on the
F-52
CPI Card Group Inc. and Subsidiaries
Notes to Condensed Consolidated Financial Statements (Continued)
(Dollars in Thousands, Except Share and Per Share Amounts or as Otherwise Indicated)
(Unaudited)
15. Stock-Based Compensation (Continued)
date of grant and recognition of compensation, net of estimated forfeitures, over the requisite service period for awards expected to vest.
In 2007, the Company's Board of Directors adopted the 2007 Stock Option Plan (the "Plan"). Under the provisions of the Plan, stock options may be granted to employees, directors, and consultants at an exercise price greater than or equal to, (and not less than), the fair market value of a share on the date the option is granted. The number of common shares available is 2,090,000, of which 1,562,000 were available to be granted as of June 30, 2015. The stock options have a 10-year life and vest as noted in each respective grant letter. All stock options are nonqualified. No stock options were granted in 2015.
The following table summarizes the changes in the number of outstanding stock options for the six month period ended June 30, 2015:
| |
Options | Weighted-Average Exercise Price |
Weighted-Average Remaining Contractual Term (in Years) |
|||||||
|---|---|---|---|---|---|---|---|---|---|---|
Outstanding as of December 31, 2014 |
627,000 | $ | 0.0003 | 6.44 | ||||||
Granted |
— | — | — | |||||||
Forfeited |
(99,000 | ) | 0.0003 | — | ||||||
| | | | | | | | | | | |
Outstanding as of June 30, 2015 |
528,000 | $ | 0.0003 | 6.11 | ||||||
| | | | | | | | | | | |
| | | | | | | | | | | |
| | | | | | | | | | | |
Exercisable as of June 30, 2015 |
480,326 | 0.0004 | 5.93 | |||||||
Unvested options as of June 30, 2015, vest as follows:
2015 |
7,326 | |||
2016 |
40,348 | |||
| | | | | |
Total unvested options as of June 30, 2015 |
47,674 | |||
| | | | | |
| | | | | |
| | | | | |
Compensation expense and unrecorded compensation expense related to the stock options for the three and six month periods ended June 30, 2015 and 2014 were de minimis.
F-53
CPI Card Group Inc. and Subsidiaries
Notes to Condensed Consolidated Financial Statements (Continued)
(Dollars in Thousands, Except Share and Per Share Amounts or as Otherwise Indicated)
(Unaudited)
15. Stock-Based Compensation (Continued)
The following table summarizes the changes in the number of outstanding restricted shares of common stock for the six month period ended June 30, 2015:
| |
Shares | Weighted-Average Grant Date Fair Value |
|||||
|---|---|---|---|---|---|---|---|
Outstanding as of December 31, 2014 |
— | — | |||||
Granted |
191,664 | $ | 9.48 | ||||
Vested |
— | — | |||||
Forfeited |
— | — | |||||
| | | | | | | | |
Outstanding as of June 30, 2015 |
191,664 | $ | 9.48 | ||||
| | | | | | | | |
| | | | | | | | |
| | | | | | | | |
During the three and six months ended June 30, 2015 the Company issued 191,664 restricted shares of common stock to executives of the Company. The awards contain service conditions associated with continued employment or service. The terms of the non-vested restricted shares of common stock provide voting and regular dividend rights to the holders of the restricted shares of common stock. Upon vesting, the restrictions on the restricted shares of common stock lapse and the shares are considered issued and outstanding. The restricted shares vest over one- to three-year periods.
In measuring compensation expense associated with the grant of non-vested restricted shares of common stock, the Company estimated the fair value of the award on the grant date. Compensation expense is recorded monthly over the vesting periods of the awards. Total compensation expense related to the non-vested restricted shares of common stock awards was de minimis for the three and six month periods ended June 30, 2015. As of June 30, 2015, there was $1,817 of unrecognized compensation expense related to non-vested restricted shares of common stock that will be recognized over a weighted average period of 1.95 years.
16. Phantom Stock Plan
Effective January 1, 2012, the Company's Board of Directors adopted the CPI Acquisition, Inc. Phantom Stock Plan to provide incentive compensation to certain key employees. Under the terms of the agreement, holders of an award are entitled to a cash payment equal to the difference between the fair market value of the award, as defined in the agreement, at the time of exercise and the award's exercise price. Each award is issued for a specified number of units at an established base amount per unit of $2,000. In the event of any liquidation, dissolution, or winding up of the Company, the holders of the awards will receive the cash payment as defined above.
All awards vest on the defined Redemption Date or earlier fixed date pursuant to each award agreement. The Redemption Date is defined as the earlier of a Change-in-Control or seven years from grant. Unvested awards expire upon participant's termination of service.
Total authorized units under the plan are 100,000. At December 31, 2014, there were 84,297 units issued and outstanding under the terms of the plan, of which 13,088 were fully vested. At June 30,
F-54
CPI Card Group Inc. and Subsidiaries
Notes to Condensed Consolidated Financial Statements (Continued)
(Dollars in Thousands, Except Share and Per Share Amounts or as Otherwise Indicated)
(Unaudited)
16. Phantom Stock Plan (Continued)
2015, there were 81,156 units issued and outstanding under the terms of the plan, of which 13,088 were fully vested.
As these awards must be settled in cash, the Company accounts for them as liabilities. As a nonpublic company, the company had elected to measure the liability at intrinsic value; with changes in the intrinsic value of the liability recognized as expense each year in the consolidated statements of operations and comprehensive income. There was $897 and $(193) of compensation expense recognized for the three months ended June 30, 2015 and 2014, respectively, related to this plan. There was $1,503 and $(591) of compensation expense recognized for the six months ended June 30, 2015 and 2014, respectively, related to this plan.
17. Segment Reporting
The Company has identified reportable segments as those consolidated subsidiaries that represent 10% or more of its revenue, EBITDA (as defined below), or total assets or subsidiaries which the Company believes information about the segment would be useful to the readers of the financial statements from a qualitative perspective. The Company's chief operating decision maker is its Chief Executive Officer who is charged with management of Company and is responsible for the evaluation of operating performance and decision making about the allocation of resources to operating segments based on measures such as revenue and EBITDA.
EBITDA is the primary measure used by the Company's chief operating decision maker to evaluate segment operating performance. As the Company uses the term, EBITDA is defined as income from continuing operations before interest expense, income taxes, depreciation and amortization. The Company's chief operating decision maker believes EBITDA is a meaningful measure and is superior to available U.S. GAAP measures as it represents a transparent view of the Company's operating performance that is unaffected by fluctuations in property, equipment, and leasehold improvement additions. The Company's chief operating decision maker uses EBITDA to perform periodic reviews and comparison of operating trends and identify strategies to improve the allocation of resources amongst segments.
As of June 30, 2015, the Company's reportable segments are as follows:
- •
- U.S. Debit and Credit
- •
- U.S. Prepaid Debit
- •
- U.K. Limited
The U.S. Debit and Credit segment primarily produces Financial Payment Cards and provides integrated card services to card-issuing banks in the United States. Products manufactured by this segment primarily include EMV and non-EMV credit cards, debit cards and prepaid debit cards issued on the networks of the Payment Card Brands, private label credit cards that are not issued on the networks of the Payment Cards Brands and instant issuance systems. This segment also provides a variety of integrated card services, including card personalization and fulfillment services and instant issuance services. The U.S. Debit and Credit segment includes the Company's operations in Colorado,
F-55
CPI Card Group Inc. and Subsidiaries
Notes to Condensed Consolidated Financial Statements (Continued)
(Dollars in Thousands, Except Share and Per Share Amounts or as Otherwise Indicated)
(Unaudited)
17. Segment Reporting (Continued)
Indiana and Tennessee, which are each certified by multiple global Payment Card Brands and, where required by the Company's customers and the PCI Security Standards Council. These operating segments have been aggregated into a single reportable segment due to similarities in the nature of the products and services sold by these subsidiaries, a common customer base, the substantial degree of integration and redundancy across the segments, and utilization of centrally shared sales, marketing, quality and planning departments. Separate information about these segments would not be useful to the readers of the financial statements.
The U.S. Prepaid Debit segment primarily provides integrated card services to prepaid debit card issuers in the United States. Services provided include tamper-evident security packaging services and card personalization and fulfillment services. This segment also produces Financial Payment Cards issued on the networks of the Payment Card Brands that are included in the tamper-evident security packages mentioned above. The U.S. Prepaid Debit segment includes the Company's operation in Minnesota which is certified by multiple global Payment Card Brands and the PCI Security Standards Council.
The U.K. Limited segment primarily produces retail gift and loyalty cards for customers in the United Kingdom and continental Europe. This segment also provides card personalization and fulfillment services. The U.K. Limited segment includes the Company's operations in Colchester, United Kingdom and Liverpool, United Kingdom. Neither of the Company's operations in this segment is certified by any of the Payment Card Brands, nor are they PCI certified.
The "other" category includes the Company's corporate headquarters and less significant operating segments that derive their revenue from the production of Financial Payment Cards and retail gift cards in Canada (CPI—Canada) and the U.K. (CPI—Petersfield). On February 16, 2015, the Company determined that the Petersfield, United Kingdom operation would be shut down. The shut down and closure of the Petersfield facility was completed in August 2015.
Performance Measures of Reportable Segments
Revenue and EBITDA of the Company's reportable segments for the three and six months ended June 30, 2015 and 2014 were as follows:
| |
Revenue | ||||||||||||
|---|---|---|---|---|---|---|---|---|---|---|---|---|---|
| |
Three Months Ended June 30, |
Six Months Ended June 30, |
|||||||||||
| |
2015 | 2014 | 2015 | 2014 | |||||||||
U.S. Debit and Credit(a) |
$ | 73,354 | $ | 28,583 | $ | 123,405 | $ | 49,270 | |||||
U.S. Prepaid Debit |
12,392 | 13,015 | 29,823 | 23,298 | |||||||||
U.K. Limited |
7,679 | 9,216 | 13,918 | 16,330 | |||||||||
Other |
5,819 | 5,242 | 9,922 | 11,183 | |||||||||
Intersegment eliminations(b) |
(3,708 | ) | (2,820 | ) | (4,222 | ) | (4,314 | ) | |||||
| | | | | | | | | | | | | | |
Total: |
$ | 95,536 | $ | 53,236 | $ | 172,846 | $ | 95,767 | |||||
| | | | | | | | | | | | | | |
| | | | | | | | | | | | | | |
| | | | | | | | | | | | | | |
F-56
CPI Card Group Inc. and Subsidiaries
Notes to Condensed Consolidated Financial Statements (Continued)
(Dollars in Thousands, Except Share and Per Share Amounts or as Otherwise Indicated)
(Unaudited)
17. Segment Reporting (Continued)
| |
EBITDA | ||||||||||||
|---|---|---|---|---|---|---|---|---|---|---|---|---|---|
| |
Three Months Ended June 30, |
Six Months Ended June 30, |
|||||||||||
| |
2015 | 2014 | 2015 | 2014 | |||||||||
U.S. Debit and Credit(a) |
$ | 24,012 | $ | 6,508 | $ | 36,593 | $ | 10,990 | |||||
U.S. Prepaid Debit |
3,776 | 4,034 | 9,760 | 5,978 | |||||||||
U.K. Limited |
658 | 937 | 841 | 814 | |||||||||
Other |
(4,680 | ) | (1,832 | ) | (7,560 | ) | (2,824 | ) | |||||
| | | | | | | | | | | | | | |
Total: |
$ | 23,766 | $ | 9,647 | $ | 39,634 | $ | 14,958 | |||||
| | | | | | | | | | | | | | |
| | | | | | | | | | | | | | |
| | | | | | | | | | | | | | |
- (a)
- Amounts for the three and six months ended June 30, 2015 include the post-acquisition revenue and EBITDA of EFT Source.
The following table provides a reconciliation of total segment EBITDA to income before taxes for the three months ended June 30, 2015 and 2014 and the six months ended June 30, 2015 and 2014:
| |
Three Months Ended June 30, |
Six Months Ended June 30, |
|||||||||||
|---|---|---|---|---|---|---|---|---|---|---|---|---|---|
| |
2015 | 2014 | 2015 | 2014 | |||||||||
Total segment EBITDA from continuing operations |
$ | 23,766 | $ | 9,647 | $ | 39,634 | $ | 14,958 | |||||
Depreciation and amortization |
(3,979 | ) | (2,788 | ) | (8,040 | ) | (5,614 | ) | |||||
Interest, net |
(1,616 | ) | (1,761 | ) | (3,505 | ) | (3,444 | ) | |||||
| | | | | | | | | | | | | | |
Income before income taxes |
$ | 18,171 | $ | 5,098 | $ | 28,089 | $ | 5,900 | |||||
| | | | | | | | | | | | | | |
| | | | | | | | | | | | | | |
| | | | | | | | | | | | | | |
F-57
CPI Card Group Inc. and Subsidiaries
Notes to Condensed Consolidated Financial Statements (Continued)
(Dollars in Thousands, Except Share and Per Share Amounts or as Otherwise Indicated)
(Unaudited)
17. Segment Reporting (Continued)
Balance Sheet Data of Reportable Segments
Total assets of the Company's reportable segments as of June 30, 2015 and December 31, 2014 were as follows:
| |
June 30, 2015 |
December 31, 2014 |
|||||
|---|---|---|---|---|---|---|---|
U.S. Debit and Credit |
$ | 218,654 | $ | 200,572 | |||
U.S. Prepaid Debit |
23,888 | 20,183 | |||||
U.K. Limited |
26,418 | 29,740 | |||||
Other |
18,824 | 10,267 | |||||
| | | | | | | | |
Total continuing operations: |
287,784 | 260,762 | |||||
Discontinued operation(a): |
— | 5,862 | |||||
| | | | | | | | |
Total assets: |
$ | 287,784 | $ | 266,624 | |||
| | | | | | | | |
| | | | | | | | |
| | | | | | | | |
- (a)
- As of December 31, 2014, certain assets of the Nevada operation sold on January 12, 2015 (Note 3) are presented in assets of a discontinued operation in the Company's consolidated balance sheet.
Plant, Equipment and Leasehold Improvement Additions of Geographic Locations
Plant, equipment and leasehold improvement additions of the Company's geographical locations for the three months ended June 30, 2015 and 2014 and for the six months ended June 30, 2015 and 2014 were as follows:
| |
Three Months Ended June 30, |
Six Months Ended June 30, |
|||||||||||
|---|---|---|---|---|---|---|---|---|---|---|---|---|---|
| |
2015 | 2014 | 2015 | 2014 | |||||||||
U.S. |
$ | 5,799 | $ | 3,046 | $ | 9,973 | $ | 6,295 | |||||
Canada |
97 | 22 | 281 | 22 | |||||||||
| | | | | | | | | | | | | | |
Total North America |
5,896 | 3,068 | 10,254 | 6,317 | |||||||||
U.K. |
43 | 93 | 136 | 261 | |||||||||
| | | | | | | | | | | | | | |
Total plant, equipment and leasehold improvement additions |
$ | 5,939 | $ | 3,161 | $ | 10,390 | $ | 6,578 | |||||
| | | | | | | | | | | | | | |
| | | | | | | | | | | | | | |
| | | | | | | | | | | | | | |
F-58
CPI Card Group Inc. and Subsidiaries
Notes to Condensed Consolidated Financial Statements (Continued)
(Dollars in Thousands, Except Share and Per Share Amounts or as Otherwise Indicated)
(Unaudited)
17. Segment Reporting (Continued)
Net Sales of Geographic Locations
Net sales of the Company's geographic locations for the three months ended June 30, 2015 and 2014 and the six months ended June 30, 2015 and 2014 were as follows:
| |
Three Months Ended June 30, |
Six Months Ended June 30, |
|||||||||||
|---|---|---|---|---|---|---|---|---|---|---|---|---|---|
| |
2015 | 2014 | 2015 | 2014 | |||||||||
U.S.(a) |
$ | 82,676 | $ | 38,986 | $ | 150,511 | $ | 67,186 | |||||
Canada |
2,972 | 2,894 | 4,125 | 7,764 | |||||||||
| | | | | | | | | | | | | | |
Total North America |
85,648 | 41,880 | 154,636 | 74,950 | |||||||||
U.K. |
7,648 | 8,231 | 13,853 | 15,077 | |||||||||
Other(b) |
2,240 | 3,125 | 4,357 | 5,740 | |||||||||
| | | | | | | | | | | | | | |
Total revenue |
$ | 95,536 | $ | 53,236 | $ | 172,846 | $ | 95,767 | |||||
| | | | | | | | | | | | | | |
| | | | | | | | | | | | | | |
| | | | | | | | | | | | | | |
- (a)
- Amounts
for the three and six months ended June 30, 2015 include the post-acquisition revenue of EFT Source.
- (b)
- Amounts in other include sales to various countries that individually are not material.
Long-Lived Assets of Geographic Segments
Long-lived assets of the Company's geographic segments as of June 30, 2015 and December 31, 2014 were as follows:
| |
June 30, 2015 |
December 31, 2014 |
|||||
|---|---|---|---|---|---|---|---|
U.S. |
$ | 162,133 | $ | 160,144 | |||
Canada |
2,502 | 2,525 | |||||
| | | | | | | | |
Total North America: |
164,634 | 162,669 | |||||
U.K. |
13,991 | 14,607 | |||||
| | | | | | | | |
Total long-lived assets |
$ | 178,626 | $ | 177,276 | |||
| | | | | | | | |
| | | | | | | | |
| | | | | | | | |
F-59
CPI Card Group Inc. and Subsidiaries
Notes to Condensed Consolidated Financial Statements (Continued)
(Dollars in Thousands, Except Share and Per Share Amounts or as Otherwise Indicated)
(Unaudited)
17. Segment Reporting (Continued)
Net Sales by Product and Services
Net sales from products and services sold by the Company for the three months ended June 30, 2015 and 2014 and for the six months ended June 30, 2015 and 2014 were as follows:
| |
Three Months Ended June 30, |
Six Months Ended June 30, |
|||||||||||
|---|---|---|---|---|---|---|---|---|---|---|---|---|---|
| |
2015 | 2014 | 2015 | 2014 | |||||||||
Product net sales(a) |
$ | 67,757 | $ | 33,574 | $ | 112,771 | $ | 58,905 | |||||
Services net sales(b) |
27,779 | 19,662 | 60,075 | 36,862 | |||||||||
| | | | | | | | | | | | | | |
Total net sales: |
$ | 95,536 | $ | 53,236 | $ | 172,846 | $ | 95,767 | |||||
| | | | | | | | | | | | | | |
| | | | | | | | | | | | | | |
| | | | | | | | | | | | | | |
- (a)
- Product
net sales include the design and production of Financial Payment Cards, contact-EMV, Dual-Interface EMV, contactless and magnetic
stripe card formats. The Company also generates product revenue from the sale of Card@Once® instant issuance systems, private label credit cards and retail gift cards.
- (b)
- Services net sales include revenue from the personalization and fulfillment of Financial Payment Cards, the provision of tamper-evident security packaging, providing fulfillment services to Prepaid Debit Card program managers, and software as a service personalization of instant issuance debit cards. The Company also generates service revenue from personalizing retail gift cards (primarily in Canada and the United Kingdom) and from click-fees generated from the Company's patented card design software, known as MYCA, which provides customers and cardholders the ability to design cards on the internet and customize cards with individualized digital images.
18. Subsequent Event
New Credit Agreement and Series A Preferred Stock Redemption
On August 17, 2015, the Company entered into a new first lien credit facility. The aggregate principal balance of the term loan under the first lien credit facility totaled $435,000 and the aggregate revolving commitments under the first lien credit facility totaled $40,000. As of August 17, 2015, the Company did not have any outstanding revolving loans other than outstanding letters of credit of approximately $100, which reduced the borrowing capacity under the revolving credit facility by an equivalent amount.
The term loan and the revolving credit facility under the first lien credit facility have a maturity date of August 17, 2022 and August 17, 2020, respectively. The loans under the first lien credit facility are required to be prepaid in advance of the maturity date upon the occurrence of certain customary events. The Company is also required to prepay at least $75,000 of the term loans under the first lien credit facility upon the consummation of a qualified initial public offering.
F-60
CPI Card Group Inc. and Subsidiaries
Notes to Condensed Consolidated Financial Statements (Continued)
(Dollars in Thousands, Except Share and Per Share Amounts or as Otherwise Indicated)
(Unaudited)
18. Subsequent Event (Continued)
On August 17, 2015, with the proceeds of the term loan under the first lien credit facility, the Company redeemed 62,140 shares of Series A Preferred Stock with an aggregate redemption value of $276,318, refinanced $142,042 of outstanding indebtedness under the existing term loan and financed the payment of related transaction fees and expenses of $17,646.
The new first lien credit facility is secured by a first-priority security interest in substantially all of the Company's assets constituting equipment, inventory, receivables, cash and other personal property. Such security excludes certain specified assets, as more fully set forth in the collateral agreement under the first lien credit facility.
Interest rates under the new first lien credit facility are based, at the Company's election, on a Eurodollar rate plus a margin of 4.50% or a base rate plus a margin of 3.50%. Letters of credit are subject to a 0.125% fronting fee payable to the issuing bank and a fee payable to the revolving lenders equal to the margin applicable to Eurodollar revolving loans. In addition, the Company is required to pay an unused commitment fee ranging from 0.375% per annum to 0.50% per annum of the average unused portion of the revolving commitments. The unused commitment fee is determined on the basis of a grid that results in a lower unused commitment fee as our total net leverage ratio declines.
The new first lien credit facility contains customary covenants, including among other things, restrictions on indebtedness, issuance of liens, investments, dividends, redemptions and other distributions to equity holders, asset sales, certain mergers or consolidations, sales, transfers, leases or dispositions of substantially all of our assets, and affiliate transactions. The restrictions on dividends, redemptions and other distributions to equity holders contained in the first lien credit facility are subject to certain exceptions.
The new first lien credit facility also contains a requirement that, as of the last day of any fiscal quarter, if the amount we have drawn under the first lien credit facility is greater than 50% of the aggregate principal amount of all commitments of the lenders thereunder, the Company maintain a first lien net leverage not in excess of 7.0x.
Closure of Facility
In August 2015, the Company completed the shut down and closure of its operation in Petersfield, United Kingdom.
Stock Split and Increase in Authorized Shares
On September 3, 2015, our Board of Directors approved a 22-for-1 stock split of our common stock and an increase in the number of authorized shares of common stock to 75 million. The stock split and increase in authorized shares became effective upon filing of a certificate of amendment to our certificate of incorporation on September 3, 2015. Upon the effectiveness of the stock split, (i) every share of outstanding common stock was divided into 22 shares of common stock, (ii) the number of shares of common stock available under the 2007 Stock Option Plan, and the corresponding granted, outstanding and exercisable stock options, were increased on a 22-for-1 basis and the exercise price of the associated stock options was proportionately reduced on a 22-for-1 basis and (iii) the number of outstanding restricted shares of common stock was increased on a 22-for-1 basis. All of the share numbers, share prices and exercise prices have been retroactively adjusted to reflect the stock split in the accompanying consolidated financial statements.
F-61
The
Board of Directors
CPI Card Group Inc.:
Report on the Financial Statements
We have audited the accompanying financial statements of EFT Source, Inc., which comprise the balance sheet as of September 2, 2014, and the related statements of operations, changes in stockholders' equity, and cash flows for the period January 1, 2014 through September 2, 2014, and the related notes to the financial statements.
Management's Responsibility for the Financial Statements
Management is responsible for the preparation and fair presentation of these financial statements in accordance with U.S. generally accepted accounting principles; this includes the design, implementation, and maintenance of internal control relevant to the preparation and fair presentation of financial statements that are free from material misstatement, whether due to fraud or error.
Auditors' Responsibility
Our responsibility is to express an opinion on these financial statements based on our audit. We conducted our audit in accordance with auditing standards generally accepted in the United States of America. Those standards require that we plan and perform the audit to obtain reasonable assurance about whether the financial statements are free from material misstatement.
An audit involves performing procedures to obtain audit evidence about the amounts and disclosures in the financial statements. The procedures selected depend on the auditors' judgment, including the assessment of the risks of material misstatement of the financial statements, whether due to fraud or error. In making those risk assessments, the auditor considers internal control relevant to the entity's preparation and fair presentation of the financial statements in order to design audit procedures that are appropriate in the circumstances, but not for the purpose of expressing an opinion on the effectiveness of the entity's internal control. Accordingly, we express no such opinion. An audit also includes evaluating the appropriateness of accounting policies used and the reasonableness of significant accounting estimates made by management, as well as evaluating the overall presentation of the financial statements.
We believe that the audit evidence we have obtained is sufficient and appropriate to provide a basis for our audit opinion.
Opinion
In our opinion, the financial statements referred to above present fairly in all material respects, the financial position of EFT Source, Inc. as of September 2, 2014, and the results of its operations and its cash flows for the period January 1, 2014 through September 2, 2014 in accordance with U.S. generally accepted accounting principles.
| /s/ KPMG LLP |
Denver,
Colorado
May 14, 2015
F-62
EFT Source, Inc.
Balance Sheet
As of September 2, 2014
Assets |
||||
Current assets: |
||||
Cash and cash equivalents |
$ | 381,219 | ||
Accounts receivable |
5,814,977 | |||
Inventories |
1,430,074 | |||
Prepaid expenses and other current assets |
1,010,600 | |||
Income tax receivable (note 7) |
415,000 | |||
Deferred income taxes (note 7) |
9,098 | |||
| | | | | |
Total current assets |
9,060,968 | |||
Property and equipment, net (note 4) |
5,729,758 |
|||
Goodwill |
6,426,000 | |||
Related party mortgage receivables (note 8) |
1,288,667 | |||
| | | | | |
Total assets |
$ | 22,505,393 | ||
| | | | | |
| | | | | |
| | | | | |
Liabilities and stockholders' equity |
||||
Current liabilities: |
||||
Accounts payable |
$ | 575,891 | ||
Accrued expenses and other current liabilities |
1,169,248 | |||
Deferred income taxes (note 7) |
32,781 | |||
Income taxes payable (note 7) |
75,000 | |||
Current portion of capital lease obligations (note 9) |
165,685 | |||
Current portion of long-term debt (note 5) |
938,574 | |||
| | | | | |
Total current liabilities |
2,957,179 | |||
Long-term debt (note 5) |
4,434,857 |
|||
Capital lease obligations, excluding current portion (note 9) |
180,463 | |||
Deferred income taxes |
52,541 | |||
| | | | | |
Total liabilities |
7,625,040 | |||
Commitments and contingencies (note 9) |
||||
Stockholders' equity: |
||||
Common stock; no par value; 2,000 shares authorized; 899 shares issued and outstanding |
608,202 | |||
Retained earnings |
14,272,151 | |||
| | | | | |
Total stockholders' equity |
14,880,353 | |||
| | | | | |
Total liabilities and stockholders' equity |
$ | 22,505,393 | ||
| | | | | |
| | | | | |
| | | | | |
See accompanying notes to financial statements
F-63
EFT Source, Inc.
Statement of Operations
For the period January 1, 2014 through September 2, 2014
Net sales |
$ | 34,158,030 | ||
Cost of sales |
20,856,661 |
|||
Selling, general, and administrative |
9,540,654 | |||
Depreciation expense (note 4) |
738,788 | |||
| | | | | |
Income from operations |
3,021,927 |
|||
Other income (expense): |
||||
Interest expense |
(66,288 | ) | ||
Related party interest income (note 8) |
2,145 | |||
| | | | | |
Total other income (expense) |
(64,143 | ) | ||
| | | | | |
Income before income taxes |
2,957,784 |
|||
Income tax expense (benefit) (note 7) |
(726,476 | ) | ||
| | | | | |
Net income |
$ | 3,684,260 | ||
| | | | | |
| | | | | |
| | | | | |
See accompanying notes to financial statements
F-64
EFT Source, Inc.
Statement of Stockholders' Equity
For the period January 1, 2014 through September 2, 2014
| |
Common Shares | |
|
||||||||||
|---|---|---|---|---|---|---|---|---|---|---|---|---|---|
| |
Accumulated deficit |
|
|||||||||||
| |
Shares | Amount | Total | ||||||||||
December 31, 2013 |
899 | $ | 608,202 | $ | 10,587,891 | $ | 11,196,093 | ||||||
Net income |
— | — | 3,684,260 | 3,684,260 | |||||||||
| | | | | | | | | | | | | | |
September 2, 2014 |
899 | $ | 608,202 | $ | 14,272,151 | $ | 14,880,353 | ||||||
| | | | | | | | | | | | | | |
| | | | | | | | | | | | | | |
| | | | | | | | | | | | | | |
See accompanying notes to financial statements
F-65
EFT Source, Inc.
Statement of Cash Flows
For the period January 1, 2014 through September 2, 2014
Operating activities |
||||
Net income |
$ | 3,684,260 | ||
Adjustments to reconcile net income from continuing operations to net cash provided by operating activities: |
||||
Depreciation expense (note 4) |
738,788 | |||
Deferred income tax (note 7) |
(801,476 | ) | ||
Changes in operating assets and liabilities: |
||||
Accounts receivable |
(1,029,080 | ) | ||
Inventory |
(51,801 | ) | ||
Prepaid expenses and other current assets |
(59,109 | ) | ||
Income tax receivable |
(415,000 | ) | ||
Accounts payable |
45,274 | |||
Accrued expenses and other current liabilities |
(422,230 | ) | ||
Income taxes payable |
(178,147 | ) | ||
| | | | | |
Cash provided by operating activities |
1,511,479 | |||
Investing activities |
||||
Purchase of property and equipment (note 4) |
(1,468,589 | ) | ||
Loans to related parties (note 8) |
(1,288,667 | ) | ||
| | | | | |
Cash used in investing activities |
(2,757,256 | ) | ||
Financing activities |
||||
Borrowings of debt (note 5) |
14,677,477 | |||
Repayments of debt (note 5) |
(12,904,800 | ) | ||
Repayments of capital lease obligations (note 9) |
(145,685 | ) | ||
| | | | | |
Cash provided by financing activities |
1,626,992 | |||
Net increase in cash and cash equivalents |
381,215 |
|||
Cash and cash equivalents, beginning of period |
4 | |||
| | | | | |
Cash and cash equivalents, end of period |
$ | 381,219 | ||
| | | | | |
| | | | | |
| | | | | |
Supplementary information |
||||
Cash paid for interest |
$ | 66,288 | ||
Cash paid for income taxes |
415,000 |
See accompanying notes to financial statements
F-66
EFT Source, Inc.
Notes to Financial Statements
1. Business
EFT Source, Inc. ("EFT Source" or the "Company") personalizes and fulfills Financial Payment Cards for card issuing banks and other financial institutions located throughout the United States. We define Financial Payment Cards as credit, debit and Prepaid Debit Cards issued on the networks of the Payment Card Brands (Visa, MasterCard, American Express, and Discover). EFT Source's services include design, card and collateral procurement, encoding, embossing, chip programing, and data processing services related to Financial Payment Card management and issuance. EFT Source also sells its patented Card@Once® instant issuance system and provides ongoing card personalization services to users of this system.
EFT Source is authorized to personalize Visa and MasterCard products based upon card personalization agreements. The agreements require EFT Source to adhere to certain provisions as stated in the agreements.
2. Summary of Significant Accounting Policies
Basis of Presentation
The accompanying financial statements include the historical financial information of the stand-alone operations of EFT Source that are to be sold to CPI Acquisition, Inc. ("CPI"), a wholly owned subsidiary of CPI Card Group Inc., formerly known as CPI Holdings I, Inc., pursuant to a Purchase and Sale Agreement (the "EFT Sale Agreement") entered into on August 22, 2014 and closed on September 2, 2014.
Prior to September 2, 2014, EFT Source owned a 100% membership interest in Primadata, LLC ("Primadata"). Pursuant to the terms of the EFT Sale Agreement, EFT Source distributed all rights, title and interest in Primadata to the former owners of EFT Source. In connection with the distribution, EFT Source was released from all obligations with respect to the Primadata. Accordingly, the accompanying financial statements do not include the historical financial information of Primadata.
Revenue Recognition
Substantially all revenues of the Company are derived from card personalization, procurement, delivery services and sales of Card@Once® instant issuance systems. It is the Company's policy to recognize revenues as earned when the cards are mailed to the customer or end-user, when the instant issuance systems are shipped to the customer and as customers' instant issuance systems personalize cards within a bank branch. Certain service program revenue for instant issuance systems is recognized over the term of the program.
The Company has determined that the effects of deferred revenue for extended warranty agreements entered into with customers prior to January 1, 2014 was not material.
The Company accounts for all governmental taxes associated with revenue transactions on a net basis.
The Company includes shipping and handling fees billed to customers in service revenues. All shipping and handling costs are included in cost of services.
F-67
EFT Source, Inc.
Notes to Financial Statements (Continued)
2. Summary of Significant Accounting Policies (Continued)
Cash and Cash Equivalents
The Company considers all highly liquid investments with original maturities of three months or less to be cash equivalents and they are stated at cost, which approximates fair value.
The Company generally maintains cash on deposit at banks in excess of federally insured amounts. The Company has not experienced any losses in such accounts and management believes the Company is not exposed to any significant credit risk related to cash.
Trade Accounts Receivables and Concentration of Credit Risk
Accounts receivable are uncollateralized customer obligations due under normal trade terms requiring payment within 30 days from invoice date. Certain customers have been granted extended payment terms based on business volume or other considerations. Late or interest charges on delinquent accounts are not recorded until collected. The carrying amount of accounts receivable is reduced by a valuation allowance, if necessary, which reflects management's best estimate of the amounts that will not be collected. The allowance is estimated based on management's knowledge of its customers, historical loss experience and existing economic conditions. Delinquent receivables are written off based on individual credit evaluation and specific circumstances of the customer. In management's opinion, an allowance for doubtful accounts is not necessary as of September 2, 2014.
The majority of the Company's revenues and receivables are from sales to commercial financial service organizations located throughout the United States that distribute debit cards to customers and employees. The Company performs periodic credit evaluations of its customers' financial condition and generally does not require collateral.
Services provided to one customer for the period through September 2, 2014 amounted to approximately 9.9% of the Company's service revenues. Accounts receivable related to this customer was approximately $830,693 as of September 2, 2014.
Property and Equipment
Property and equipment are stated at cost. Depreciation and amortization are provided over the assets' estimated useful lives using primarily the straight-line method. Equipment and fixtures are depreciated over five to seven years and leasehold improvements are amortized over the shorter of their estimated lives or the respective lease term.
Expenditures for maintenance and repairs are expensed when incurred. Expenditures for renewals or betterments are capitalized. When property is retired or sold, the cost and the related accumulated depreciation and amortization are removed from the accounts, and the resulting gain or loss is included in operations.
Management evaluates the recoverability of the investment in long-lived assets on an ongoing basis and recognizes any impairment in the year of determination. It is reasonably possible that relevant conditions could change in the near term and necessitate a change in management's estimate of the recoverability of these assets.
F-68
EFT Source, Inc.
Notes to Financial Statements (Continued)
2. Summary of Significant Accounting Policies (Continued)
Goodwill and Intangible Assets
Goodwill represents the excess of the purchase price over the fair value of the net assets acquired in business combinations recorded as purchases.
Capitalized Loan Fees
Loan costs are amortized on a straight-line basis over the terms of the respective note agreements as the difference between interest expense recognized under the effective interest method and the straight-line amortization method is not considered to be material.
Inventory
Inventory consists primarily of non-personalized Financial Payment Cards and instant issuance systems held for sale and are stated at the lower of cost, determined on an average cost basis, or market (net realizable value).
The Company purchased 22% of its production materials and services from one supplier through September 2, 2014. Accounts payable related to this supplier was approximately $145,302 as of September 2, 2014.
Income Taxes
On March 14, 2014, the Company filed forms with the Internal Revenue Service to change its tax election from a standard "C" corporation to a Subchapter "S" corporation for federal income tax purposes, effective January 1, 2014. Prior to the Company's conversion to a Subchapter "S" corporation, EFT Source filed U.S. federal and state income tax returns for Tennessee, Colorado, and Wisconsin. Subsequent to the Company's conversion to a Subchapter "S" corporation, the Company will be treated as a pass through entity for federal and state income tax purposes in Colorado and Wisconsin. The Company will continue to file state income tax returns for Tennessee.
The amount provided for state income taxes is based upon the amounts of current and deferred taxes payable or refundable at the date of the financial statements as a result of all events recognized in the financial statements measured by the provisions of enacted tax laws.
Under generally accepted accounting principles, a tax position is recognized as a benefit only if it is "more likely than not" that the tax position would be sustained in a tax examination, with a tax examination being presumed to occur. The amount recognized is the largest amount of tax benefit that is greater than 50% likely of being realized on examination. For tax positions not meeting the "more likely than not" test, no tax benefit is recorded. The Company had no material uncertain tax positions that qualify for either recognition or disclosure in the financial statements.
Advertising Costs
Advertising costs are expensed as incurred and amounted to $209,857 for the period January 1, 2014 through September 2, 2014.
F-69
EFT Source, Inc.
Notes to Financial Statements (Continued)
2. Summary of Significant Accounting Policies (Continued)
Use of Estimates
The preparation of financial statements in conformity with generally accepted accounting principles requires management to make estimates and assumptions that affect the reported amounts of assets and liabilities, disclosure of contingent assets and liabilities at the date of the financial statements and the reported amounts of revenues and expenses during the reporting period. Actual results could differ from those estimates.
3. Fair Value Measurements
The Company reports assets and liabilities under the accounting standards for fair value, which define fair value, establish a framework for measuring fair value, and govern disclosures about fair value measurements for financial and non-financial assets and liabilities. Fair value is a market-based measurement, not an entity-specific measurement. Therefore, a fair value measurement should be determined based on the assumptions that market participants would use in pricing the asset or liability. As a basis for considering market participant assumptions in fair value measurements, fair value accounting standards establish a fair value hierarchy that distinguishes between market participant assumptions based on market data obtained from sources independent of the reporting entity including quoted market prices in active markets for identical assets (Level 1), or significant other observable inputs (Level 2) and the reporting entity's own assumptions about market participant assumptions (Level 3). There have been no changes in the methodology used as of September 2, 2014.
4. Property and Equipment
Property and equipment as of September 2, 2014 consists of the following:
Equipment and fixtures |
$ | 12,888,397 | ||
Leasehold improvements |
1,140,200 | |||
Construction in progress |
2,500,117 | |||
| | | | | |
|
16,528,714 | |||
Accumulated depreciation |
(10,798,956 | ) | ||
| | | | | |
|
$ | 5,729,758 | ||
| | | | | |
| | | | | |
| | | | | |
Depreciation expense for the period January 1, 2014 through September 2, 2014 was $738,788.
F-70
EFT Source, Inc.
Notes to Financial Statements (Continued)
5. Long-Term Debt
Debt as of September 2, 2014 consists of the following:
Term note to a financial institution due in monthly installments of $78,214, plus interest at variable rate of 30-day LIBOR plus 2.29% (2.445% as of September 2, 2014), through September 2, 2014; secured by all assets and stock of the Company; cross-collateralized with the revolving line of credit |
$ | 1,251,430 | ||
Equipment LOC payable to a financial institution interest only at a variable rate of 30-day LIBOR plus 2.29% (2.445% as of September 2, 2014), secured by specifically identified equipment in process to be termed once equipment installation is complete, projected June 2015 |
1,922,001 | |||
$2,800,000 revolving line of credit ("LOC") with a financial institution scheduled to mature on June 30, 2016 bearing interest at a variable rate of 30-day LIBOR plus 2.29% (2.445% at September 2, 2014); secured by all assets of the Company, and is cross-collateralized with the term note described above; the LOC has an outstanding balance of $2,200,000 as of September 2, 2014 |
2,200,000 | |||
| | | | | |
Total debt |
5,373,431 | |||
Less current portion of long-term debt |
(938,574 | ) | ||
| | | | | |
Long-term debt |
$ | 4,434,857 | ||
| | | | | |
| | | | | |
| | | | | |
The LOC agreement places certain restrictions upon the Company, including capital expenditures and additional borrowings, and requires a mandatory annual payment of 85% of excess cash flow, as defined in the agreement. The Company is also required to maintain a minimum cash flow to debt service ratio. Advances under the LOC are determined based on a defined borrowing base.
A summary of future maturities of debt as of September 2, 2014 is as follows:
2014 (through December 31, 2014) |
$ | 312,856 | ||
2015 |
2,860,575 | |||
2016 |
2,200,000 | |||
| | | | | |
|
$ | 5,373,431 | ||
| | | | | |
| | | | | |
| | | | | |
All of the Company's outstanding indebtedness was repaid on September 2, 2014 in connection with CPI's acquisition of EFT Source.
6. Profit-Sharing Plan
The Company sponsors certain defined contribution profit-sharing plans covering all employees over 21 years old with one year of service. Employees may defer up to 10% of their compensation, not to exceed the maximum amount allowable under income tax rules and regulations. Employee salary deferrals are matched 25% by the Company. The Company may also contribute an additional amount determined by its Board of Directors as allowed under the plan. The Company contributed $67,780 to the plan during the period January 1, 2014 through September 2, 2014.
F-71
EFT Source, Inc.
Notes to Financial Statements (Continued)
7. Income Taxes
On March 14, 2014, the Company filed forms with the Internal Revenue Service to change its tax election from a standard "C" corporation to a Subchapter "S" corporation for federal income tax purposes, effective January 1, 2014. In connection with the Company's conversion to a Subchapter "S" corporation, deferred taxes previously recorded by EFT Source for timing differences between financial statement and tax accounting for federal income taxes were reversed, resulting in an income tax benefit of $801,476. Subsequent to the Company's conversion to a Subchapter "S" corporation, the Company will be treated as a pass through entity for federal and state income tax purposes in Colorado and Wisconsin. The Company will continue to file state income tax returns in Tennessee.
For Tennessee state income taxes, deferred income taxes are provided for the temporary differences between the financial reporting basis and tax basis of the Company's assets and liabilities. The deferred income tax assets result primarily from the tax basis difference in accounting for non-compete agreements and certain accrued expenses which are not deductible for income tax purposes until paid. The deferred income tax liabilities result primarily from depreciation and amortization for financial reporting purposes being less than depreciation and amortization allowed for tax reporting purposes and certain timing differences related to prepaid expenses.
The Company's provision for income taxes for the period January 1, 2014 through September 2, 2014 is as follows:
Current tax expense (benefit): |
||||
Federal |
$ | — | ||
State |
75,000 | |||
| | | | | |
|
75,000 | |||
| | | | | |
Deferred tax expense (benefit): |
||||
Federal |
(801,476 | ) | ||
State |
— | |||
| | | | | |
|
(801,476 | ) | ||
| | | | | |
Total tax expense (benefit) |
$ | (726,476 | ) | |
| | | | | |
| | | | | |
| | | | | |
Income before income taxes |
$ | 2,957,784 | ||
Effective income tax rate |
(24.6 | )% |
The actual income tax expense each year differed from the expected income tax expense due to the Company's conversion to a Subchapter "S" corporation and certain expenses which have been recognized in the financial statements which are not deductible for Tennessee state income tax purposes.
As of September 2, 2014, the Company has accrued no interest and no penalties related to uncertain tax positions. It is the Company's policy to recognize interest and/or penalties related to income tax matters in income tax expense.
Prior to the Company's conversion to a Subchapter "S" corporation, EFT Source filed U.S. federal and state income tax returns for Tennessee, Colorado, and Wisconsin. EFT Source is currently open to audit under the statute of limitations by the Internal Revenue Service and the states of Tennessee, Colorado and Wisconsin for all years ended December 31, 2010 onward.
F-72
EFT Source, Inc.
Notes to Financial Statements (Continued)
7. Income Taxes (Continued)
Net deferred income taxes in the balance sheet as of September 2, 2014 include the following amounts of deferred income tax assets and liabilities:
Current deferred tax assets |
$ | 9,098 | ||
Current deferred tax liabilities |
(32,781 | ) | ||
| | | | | |
Net |
$ | (23,683 | ) | |
| | | | | |
| | | | | |
| | | | | |
Long-term deferred tax assets |
$ | — | ||
Long-term deferred tax liabilities |
(52,541 | ) | ||
| | | | | |
Net |
$ | (52,541 | ) | |
| | | | | |
| | | | | |
| | | | | |
Following CPI's acquisition of EFT Source, EFT Source will no longer be treated as a Subchapter "S" corporation and will be subject to U.S. federal and state income taxes in Tennessee, Colorado, and Wisconsin.
8. Related Party Transactions
Related Party Mortgage Receivables
On March 3, 2014 and May 20, 2014, EFT Source entered into two related party mortgage receivables with two executives. The outstanding principal balance owed by the executives to EFT Source as of September 2, 2014 is $628,268 and $650,000 and the entire principal balance is to be repaid on April 3, 2017 and June 20, 2017, respectively. The related party mortgage receivables are secured by the real estate purchased by the two executives. Interest on the outstanding principal balance is charged at a yearly rate of 0.33% and is payable on a monthly basis. Interest income recorded on the related party mortgage receivables during the period January 1, 2014 through September 2, 2014 was $2,145. All of the outstanding principal balance was repaid to EFT Source on September 2, 2014 utilizing the proceeds from the sale of EFT Source to CPI.
9. Commitments and Contingencies
Operating Leases
The Company utilizes office space and under non-cancellable operating leases. Rent expense under these leases amounted to $396,636 for the period January 1, 2014 through September 2, 2014. It is expected that in the normal course of business, leases that expire will be renewed or replaced by other leases; thus, it is anticipated that future lease payments will not be less than the expense for 2014.
Capital Leases
The Company also leases various equipment under capital leases.
F-73
EFT Source, Inc.
Notes to Financial Statements (Continued)
9. Commitments and Contingencies (Continued)
Property and equipment under capital leases included in property, equipment, and leasehold improvements, net as of September 2, 2014 is as follows:
Equipment and construction in progress under capital leases |
$ | 3,981,862 | ||
Less accumulated depreciation |
(3,576,979 | ) | ||
| | | | | |
Total |
$ | 404,882 | ||
| | | | | |
| | | | | |
| | | | | |
Depreciation expense related to property and equipment purchased under capital leases is included in depreciation expense in the statement of operations. Depreciation expense for property and equipment purchased under capital leases was $172,182 for the period January 1, 2014 through September 2, 2014.
Future cash payments with respect to non-cancellable capital leases and operating leases as of September 2, 2014 are as follows:
| |
Capital Leases |
Operating Leases |
|||||
|---|---|---|---|---|---|---|---|
2014 (through December 31, 2014) |
$ | 59,176 | $ | 198,168 | |||
2015 |
168,794 | 489,990 | |||||
2016 |
99,032 | 330,000 | |||||
2017 |
35,813 | — | |||||
| | | | | | | | |
Total |
$ | 362,815 | $ | 1,018,158 | |||
| | | | | | | | |
| | | | | | | | |
| | | | | | | | |
Less portion representing interest |
(16,667 | ) | |||||
| | | | | | | | |
Capital lease obligation |
$ | 346,148 | |||||
| | | | | | | | |
Less current portion of capital lease obligations |
(165,685 | ) | |||||
| | | | | | | | |
Capital lease obligations, excluding current portion |
$ | 180,463 | |||||
| | | | | | | | |
| | | | | | | | |
| | | | | | | | |
All of the Company's capital lease obligations were repaid on September 2, 2014 in connection with CPI's acquisition of EFT Source.
10. Employment Agreements
The Company has entered into employment agreements with certain executives of the Company. The agreements specify annual base salary, annual bonus based upon a specified formula as defined in the agreement and includes provisions for benefits. The agreements are effective through March 2015. Accrued expenses as of September 2, 2014 related to these agreements amounted to $271,853.
11. Subsequent Events
On August 22, 2014, EFT Source and its former owners entered into a Purchase and Sale Agreement with CPI pursuant to which CPI agreed to purchase all of the issued and outstanding shares of capital stock of EFT Source from its former owners in exchange for cash consideration of $54,000,000, a subordinated unsecured promissory note of $9,000,000, and $5,000,000 of CPI's preferred and common stock (the "EFT Sale"). The EFT Sale was completed on September 2, 2014.
F-74
INDEPENDENT ACCOUNTANTS' REVIEW REPORT
The
Board of Directors
CPI Holdings I, Inc.:
We have reviewed the accompanying balance sheet of EFT Source, Inc. as of September 2, 2013 and the related statements of operations, changes in stockholders' equity and cash flows for the period January 1, 2013 through September 2, 2013. A review includes primarily applying analytical procedures to management's financial data and making inquiries of Company management. A review is substantially less in scope than an audit, the objective of which is the expression of an opinion regarding the financial statements as a whole. Accordingly, we do not express such an opinion.
Management is responsible for the preparation and fair presentation of the financial statements in accordance with accounting principles generally accepted in the United States of America and for designing, implementing, and maintaining internal control relevant to the preparation and fair presentation of the financial statements.
Our responsibility is to conduct the review in accordance with Statements on Standards for Accounting and Review Services issued by the American Institute of Certified Public Accountants. Those standards require us to perform procedures to obtain limited assurance that there are no material modifications that should be made to the financial statements. We believe that the results of our procedures provide a reasonable basis for our report.
Based on our review, we are not aware of any material modifications that should be made to the accompanying financial statements in order for them to be in conformity with accounting principles generally accepted in the United States of America.
| /s/ Lattimore Black Morgan & Cain, PC |
Brentwood,
Tennessee
June 26, 2015
F-75
EFT SOURCE, INC.
Balance Sheet
As of September 2, 2013
Assets |
||||
Current assets: |
||||
Accounts receivable |
$ | 4,357,835 | ||
Inventory |
1,130,871 | |||
Income taxes receivable |
50,904 | |||
Prepaid expenses and other current assets |
687,910 | |||
| | | | | |
Total current assets |
6,227,520 | |||
Property and equipment, net |
2,900,046 |
|||
Goodwill |
6,426,000 | |||
Loan costs, net of accumulated amortization of $76,872 |
9,609 | |||
Deposits |
206,753 | |||
| | | | | |
|
$ | 15,769,928 | ||
| | | | | |
| | | | | |
| | | | | |
Liabilities and Stockholders' Equity |
||||
Current liabilities: |
||||
Checks written in excess of bank balance |
$ | 343,475 | ||
Accounts payable |
369,042 | |||
Accrued expenses and other current liabilities |
1,129,327 | |||
Deferred income taxes |
17,800 | |||
Income taxes payable |
146,302 | |||
Current portion of capital lease obligations |
160,384 | |||
Current portion of long-term debt |
1,029,384 | |||
| | | | | |
Total current liabilities |
3,195,714 | |||
Long-term debt |
1,251,429 |
|||
Capital lease obligations, excluding current portion |
350,242 | |||
Deferred income taxes |
653,500 | |||
| | | | | |
Total liabilities |
5,450,885 | |||
| | | | | |
Stockholders' equity: |
||||
Common stock, no par value; 2,000 shares authorized; 899 shares issued and outstanding |
608,202 | |||
Retained earnings |
9,710,841 | |||
| | | | | |
Total stockholders' equity |
10,319,043 | |||
| | | | | |
Total liabilities and stockholders' equity |
$ | 15,769,928 | ||
| | | | | |
| | | | | |
| | | | | |
See accompanying notes to the financial statements.
F-76
EFT SOURCE, INC.
Statement of Operations
For the period January 1, 2013 through September 2, 2013
Net sales |
$ | 27,673,034 | ||
Cost of sales |
17,070,381 | |||
Selling, general, and administrative expenses |
6,662,389 | |||
Depreciation expense |
655,196 | |||
| | | | | |
Income from operations |
3,285,068 | |||
Interest expense |
(95,781 | ) | ||
| | | | | |
Income before income taxes |
3,189,287 | |||
Income tax expense |
(1,128,264 | ) | ||
| | | | | |
Net income |
$ | 2,061,023 | ||
| | | | | |
| | | | | |
| | | | | |
See accompanying notes to the financial statements.
F-77
EFT SOURCE, INC.
Statement of Changes in Stockholders' Equity
For the period January 1, 2013 through September 2, 2013
| |
Common Shares |
Common Stock |
Retained Earnings |
Total Stockholders' Equity |
|||||||||
|---|---|---|---|---|---|---|---|---|---|---|---|---|---|
Balance at December 31, 2012 |
899 | $ | 608,202 | $ | 7,734,431 | $ | 8,342,633 | ||||||
Net contribution to related party |
— | — | (84,613 | ) | (84,613 | ) | |||||||
Net income |
— | — | 2,061,023 | 2,061,023 | |||||||||
| | | | | | | | | | | | | | |
Balance at December 31, 2013 |
899 | $ | 608,202 | $ | 9,710,841 | $ | 10,319,043 | ||||||
| | | | | | | | | | | | | | |
| | | | | | | | | | | | | | |
| | | | | | | | | | | | | | |
See accompanying notes to the financial statements.
F-78
EFT SOURCE, INC.
Statement of Cash Flows
For the period January 1, 2013 through September 2, 2013
| |
|
|||
|---|---|---|---|---|
Cash flows from operating activities: |
||||
Net income |
$ | 2,061,023 | ||
| | | | | |
Adjustments to reconcile net income to cash flows provided by operating activities: |
||||
Depreciation of property and equipment |
655,196 | |||
Amortization of loan costs |
19,218 | |||
Bad debt expense |
7,585 | |||
Deferred income tax benefit |
(66,900 | ) | ||
(Increase) decrease in operating assets: |
||||
Accounts receivable |
(1,040,740 | ) | ||
Inventory |
216,656 | |||
Income taxes receivable |
404,439 | |||
Prepaid expenses and other current assets |
(110,203 | ) | ||
Deposits |
(13,804 | ) | ||
Increase (decrease) in operating liabilities: |
||||
Accounts payable |
188,834 | |||
Accrued expenses and other current liabilities |
370,354 | |||
Income taxes payable |
146,302 | |||
| | | | | |
Total adjustments |
776,937 | |||
| | | | | |
Net cash provided by operating activities |
2,837,960 | |||
| | | | | |
Cash flows from investing activities: |
||||
Purchases of property and equipment |
(970,765 | ) | ||
| | | | | |
Net cash used by investing activities |
(970,765 | ) | ||
| | | | | |
Cash flows from financing activities: |
||||
Checks written in excess of bank balance |
(756,686 | ) | ||
Borrowings of debt |
17,097,318 | |||
Repayments of debt |
(17,967,734 | ) | ||
Repayments of capital lease obligations |
(155,480 | ) | ||
Net contribution to related party |
(84,613 | ) | ||
| | | | | |
Net cash used by financing activities |
(1,867,195 | ) | ||
| | | | | |
Net change in cash and cash equivalents |
— | |||
Cash and cash equivalents at beginning of period |
— | |||
| | | | | |
Cash and cash equivalents at end of period |
$ | — | ||
| | | | | |
| | | | | |
| | | | | |
Supplementary information: |
||||
Cash paid for interest |
$ | 96,689 | ||
Cash paid for income taxes, net |
644,423 | |||
See accompanying notes to the financial statements.
F-79
EFT SOURCE, INC.
Notes to the Financial Statements
September 2, 2013
(1) Organization and nature of operations
EFT Source, Inc. ("EFT Source" or the "Company") personalizes and fulfills Financial Payment Cards for card issuing banks and other financial institutions located throughout the United States. We define Financial Payment Cards as credit, debit and Prepaid Debit Cards issued on the networks of the Payment Card Brands (Visa, MasterCard, American Express, and Discover). EFT Source's services include design, card and collateral procurement, encoding, embossing, chip programming, and data processing services related to Financial Payment Card management and issuance. EFT Source also sells its patented Card@Once® instant issuance system and provides ongoing card personalization services to users of this system.
EFT Source is authorized to personalize Visa and MasterCard products based upon card personalization agreements. The agreements require EFT Source to adhere to certain provisions as stated in the agreements.
(2) Summary of significant accounting policies
(a) Basis of presentation
The accompanying financial statements include the historical financial information of the stand-alone operations of EFT Source that are to be sold to CPI Acquisition, Inc. ("CPI"), a wholly owned subsidiary of CPI Holdings I, Inc., pursuant to a Purchase and Sale Agreement (the "EFT Sale Agreement") entered into on August 22, 2014 and closed on September 2, 2014. The accompanying financial statements for the period January 1, 2013 through September 2, 2013 were prepared for the purpose of presenting a comparative period to the period separately presented in the year of sale.
Prior to September 2, 2014, EFT Source owned a 100% membership interest in Primadata, LLC ("Primadata"). Pursuant to the terms of the EFT Sale Agreement, EFT Source distributed all rights, title and interest in Primadata to the former owners of EFT Source. In connection with the distribution, EFT Source was released from all obligations with respect to the Primadata. Accordingly, the accompanying financial statements do not include the historical financial information of Primadata.
(b) Revenue recognition
Substantially all revenues of the Company are derived from card personalization, procurement, delivery services and sales of Card@Once® instant issuance systems. It is the Company's policy to recognize revenues as earned when the cards are mailed to the customer or end-user, when the instant issuance systems are shipped to the customer and as customers' instant issuance systems personalize cards within a bank branch. Certain service program revenue for instant issuance systems is recognized over the term of the program.
The Company has determined that the effects of deferred revenue for extended warranty agreements entered into with customers prior to September 3, 2013 were not material.
The Company accounts for all governmental taxes associated with revenue transactions on a net basis.
The Company includes shipping and handling fees billed to customers in net sales. All shipping and handling costs are included in cost of sales.
F-80
EFT SOURCE, INC.
Notes to the Financial Statements (Continued)
September 2, 2013
(2) Summary of significant accounting policies (Continued)
(c) Cash and cash equivalents
The Company considers all highly liquid investments with original maturities of three months or less to be cash equivalents and they are stated at cost, which approximates fair value.
The Company generally maintains cash on deposit at banks in excess of federally insured amounts. The Company has not experienced any losses in such accounts, and management believes the Company is not exposed to any significant credit risk related to cash.
(d) Trade accounts receivables and concentration of credit risk
Accounts receivable are uncollateralized customer obligations due under normal trade terms requiring payment within 30 days from invoice date. Certain customers have been granted extended payment terms based on business volume or other considerations. Late or interest charges on delinquent accounts are not recorded until collected. The carrying amount of accounts receivable is reduced by a valuation allowance, if necessary, which reflects management's best estimate of the amounts that will not be collected. The allowance is estimated based on management's knowledge of its customers, historical loss experience and existing economic conditions. Delinquent receivables are written off based on individual credit evaluation and specific circumstances of the customer. In management's opinion, an allowance for doubtful accounts is not necessary as of September 2, 2013.
The majority of the Company's revenues and receivables are from sales to commercial financial service organizations located throughout the United States that distribute debit cards to customers and employees. The Company performs periodic credit evaluations of its customers' financial condition and generally does not require collateral.
(e) Property and equipment
Property and equipment are stated at cost. Depreciation and amortization are provided over the assets' estimated useful lives using primarily the straight-line method. Equipment and fixtures are depreciated over five to seven years and leasehold improvements are amortized over the shorter of their estimated lives or the respective lease term.
Expenditures for maintenance and repairs are expensed when incurred. Expenditures for renewals or betterments are capitalized. When property is retired or sold, the cost and the related accumulated depreciation and amortization are removed from the accounts, and the resulting gain or loss is included in operations.
Management evaluates the recoverability of the investment in long-lived assets on an ongoing basis and recognizes any impairment in the year of determination. It is reasonably possible that relevant conditions could change in the near term and necessitate a change in management's estimate of the recoverability of these assets.
(f) Goodwill and intangible assets
Goodwill represents the excess of the purchase price over the fair value of the net assets acquired in business combinations recorded as purchases. Goodwill is not amortized, but instead is reviewed for impairment on an annual basis, or more frequently, as impairment indicators are identified.
F-81
EFT SOURCE, INC.
Notes to the Financial Statements (Continued)
September 2, 2013
(2) Summary of significant accounting policies (Continued)
(g) Capitalized loan fees
Loan costs are amortized on a straight-line basis over the terms of the respective note agreements as the difference between interest expense recognized under the effective interest method and the straight-line amortization method is not considered to be material.
(h) Inventory
Inventory consist primarily of non-personalized Financial Payment Cards and instant issuance systems held for sale and are stated at the lower of cost, determined on an average cost basis, or market (net realizable value).
The Company purchased 24% of its production materials and services from one supplier through September 2, 2013. Accounts payable related to this supplier was approximately $9,500 at September 2, 2013.
(i) Income taxes
The amount provided for income taxes is based upon the amounts of current and deferred taxes payable or refundable at the date of the financial statements as a result of all events recognized in the financial statements measured by the provisions of enacted tax laws.
Under generally accepted accounting principles, a tax position is recognized as a benefit only if it is "more likely than not" that the tax position would be sustained in a tax examination, with a tax examination being presumed to occur. The amount recognized is the largest amount of tax benefit that is greater than 50% likely of being realized on examination. For tax positions not meeting the "more likely than not" test, no tax benefit is recorded. The Company had no material uncertain tax positions that qualify for either recognition or disclosure in the consolidated financial statements.
(j) Advertising costs
Advertising costs are expensed as incurred and amounted to $226,038 for the period January 1, 2013 through September 2, 2013.
(k) Rebates
The Company offers certain sales incentives to its customers, in the form of rebates, whereby customers receive a periodic payment from the Company based on certain criteria. The amount of these rebates is estimated by management and recorded as a reduction of net sales on the accrual basis. Accordingly, net sales have been reduced for rebates in the amount of $272,625 for the period January 1, 2013 through September 2, 2013.
(l) Use of estimates
The preparation of financial statements in conformity with generally accepted accounting principles requires management to make estimates and assumptions that affect the reported amounts of assets and liabilities, disclosure of contingent assets and liabilities at the date of the financial statements and the reported amounts of revenues and expenses during the reporting period. Actual results could differ from those estimates.
F-82
EFT SOURCE, INC.
Notes to the Financial Statements (Continued)
September 2, 2013
(2) Summary of significant accounting policies (Continued)
(m) Events occurring after reporting date
The Company has evaluated events and transactions that occurred between September 2, 2013 and June 26, 2015, which is the date that the financial statements were available to be issued, for possible recognition or disclosure in the financial statements.
(3) Fair value measurements
The Company reports assets and liabilities under the accounting standards for fair value, which define fair value, establish a framework for measuring fair value, and govern disclosures about fair value measurements for financial and non-financial assets and liabilities. Fair value is a market-based measurement, not an entity-specific measurement. Therefore, a fair value measurement should be determined based on the assumptions that market participants would use in pricing the asset or liability. As a basis for considering market participant assumptions in fair value measurements, fair value accounting standards establish a fair value hierarchy that distinguishes between market participant assumptions based on market data obtained from sources independent of the reporting entity including quoted market prices in active markets for identical assets (Level 1), or significant other observable inputs (Level 2) and the reporting entity's own assumptions about market participant assumptions (Level 3). There have been no changes in the methodology used as of September 2, 2013.
(4) Property and equipment
A summary of property and equipment as of September 2, 2013 is as follows:
Equipment and fixtures |
$ | 9,276,182 | ||
Leasehold improvements |
782,539 | |||
| | | | | |
|
10,058,721 | |||
Accumulated depreciation |
(7,158,675 | ) | ||
| | | | | |
|
$ | 2,900,046 | ||
| | | | | |
| | | | | |
| | | | | |
Depreciation expense for the period January 1, 2013 through September 2, 2013 amounted to $655,196.
F-83
EFT SOURCE, INC.
Notes to the Financial Statements (Continued)
September 2, 2013
(5) Long-term debt
A summary of long-term debt as of September 2, 2013 is as follows:
Term note to a financial institution due in monthly installments of $78,214, plus interest at variable rate of 30-day LIBOR plus 2.29% (2.47% as of September 2, 2013), through December 2015; secured by all assets and stock of the Company; cross-collateralized with the revolving line of credit. |
$ | 2,189,997 | ||
Equipment note payable to a financial institution due in monthly installments of $13,239, including interest at the bank's rate (6.00% as of September 2, 2013), through March 2014; secured by specifically identified equipment and personal guarantee of majority stockholder. |
90,816 | |||
$2,800,000 revolving LOC with a financial institution scheduled to mature on June 30, 2016 bearing interest at a variable rate of 30-day LIBOR plus 2.29% (2.47% at September 2, 2013); secured by all assets of the Company, and is cross-collateralized with the term note described above. |
— | |||
| | | | | |
Total long-term debt |
2,280,813 | |||
Less current portion |
(1,029,384 | ) | ||
| | | | | |
Long-term debt |
$ | 1,251,429 | ||
| | | | | |
| | | | | |
| | | | | |
The LOC agreement placed certain restrictions upon the Company, including capital expenditures and additional borrowings, and required a mandatory annual payment of 85% of excess cash flow, as defined in the agreement. The excess cash flow payment requirement was waived by the financial institution for the year ended December 31, 2013. The Company was also required to maintain a minimum cash flow to debt service ratio. Advances under the LOC were determined based on a defined borrowing base.
A summary of future maturities of long-term debt as of September 2, 2013 is as follows:
Year
|
|
|||
|---|---|---|---|---|
2013 (through December 31, 2014) |
$ | 364,356 | ||
2014 |
977,884 | |||
2015 |
938,573 | |||
| | | | | |
|
$ | 2,280,813 | ||
| | | | | |
| | | | | |
| | | | | |
All of the Company's outstanding indebtedness was repaid on September 2, 2014 in connection with CPI's acquisition of EFT Source.
(6) Contribution to related party
During the period January 1, 2013 through September 2, 2013, EFT Source made cash contributions related to its investment in Primadata. The net $84,613 of contributions through September 2, 2013 consisted of various working capital advances to Primadata for its operations.
F-84
EFT SOURCE, INC.
Notes to the Financial Statements (Continued)
September 2, 2013
(7) Profit-sharing plan
The Company sponsors certain defined contribution profit-sharing plans covering all employees over 21 years old with one year of service. Employees may defer up to 10% of their compensation, not to exceed the maximum amount allowable under income tax rules and regulations. Employee salary deferrals are matched 25% by the Company. The Company may also contribute an additional amount determined by its Board of Directors as allowed under the plan. The Company contributed $58,080 to the plan during the period January 1, 2013 through September 2, 2013.
(8) Income taxes
The Company's provision for income taxes for the period January 1, 2013 through September 2, 2013 is as follows:
Current tax expense: |
||||
Federal |
$ | 1,089,664 | ||
State |
105,500 | |||
| | | | | |
Total current tax expense |
1,195,164 | |||
| | | | | |
Deferred tax expense: |
||||
Federal |
(60,000 | ) | ||
State |
(6,900 | ) | ||
| | | | | |
Total deferred tax expense |
(66,900 | ) | ||
| | | | | |
Total provision for income taxes |
$ | 1,128,264 | ||
| | | | | |
| | | | | |
| | | | | |
The actual income tax expense differed from the expected income tax expense due to certain expenses which have been recognized in the financial statements which are not deductible for federal and state income tax purposes. The Company also qualified for research and development federal tax credits, and certain other tax credits, which decreased the actual income tax expense for the period January 1, 2013 through September 2, 2013.
As of September 2, 2013, the Company has accrued no interest and no penalties related to uncertain tax positions. It is the Company's policy to recognize interest and/or penalties related to income tax matters in income tax expense.
EFT Source files U.S. Federal and states of Tennessee, Colorado and Wisconsin income tax returns. EFT Source is currently open to audit under the statute of limitations by the Internal Revenue Service and the states of Tennessee, Colorado and Wisconsin for the years ended December 31, 2012 through 2014.
Net deferred income taxes in the balance sheet as of September 2, 2013 include the following amounts of deferred income tax assets and liabilities:
| |
Current | Long-term | Total | |||||||
|---|---|---|---|---|---|---|---|---|---|---|
Deferred income tax assets |
$ | 245,600 | $ | — | $ | 245,600 | ||||
Deferred income tax liabilities |
(263,400 | ) | (653,500 | ) | (916,900 | ) | ||||
| | | | | | | | | | | |
Net |
$ | (17,800 | ) | $ | (653,500 | ) | $ | (671,300 | ) | |
| | | | | | | | | | | |
| | | | | | | | | | | |
| | | | | | | | | | | |
F-85
EFT SOURCE, INC.
Notes to the Financial Statements (Continued)
September 2, 2013
(8) Income taxes (Continued)
Deferred income taxes are provided for the temporary differences between the financial reporting basis and tax basis of the Company's assets and liabilities. The deferred income tax assets result primarily from the tax basis difference in accounting for non-compete agreements and certain accrued expenses which are not deductible for income tax purposes until paid. The deferred income tax liabilities result primarily from depreciation and amortization for financial reporting purposes being less than depreciation and amortization allowed for tax reporting purposes and certain timing differences related to prepaid expenses.
(9) Operating lease commitments
The Company utilizes office space and various equipment under non-cancelable operating leases. Rent expense under these leases amounted to $441,044 for the period January 1, 2013 through September 2, 2013. A summary of approximate future minimum payments under these leases as of September 2, 2013 is as follows:
Year
|
|
|||
|---|---|---|---|---|
2013 (through December 31, 2013) |
$ | 150,000 | ||
2014 |
463,000 | |||
2015 |
130,000 | |||
| | | | | |
|
$ | 743,000 | ||
| | | | | |
| | | | | |
| | | | | |
(10) Capital lease obligations
The Company has entered into capital lease agreements to finance the acquisition of certain equipment. Equipment utilized under capital lease obligations as of September 2, 2013 is as follows:
Equipment and construction in progress |
$ | 3,981,599 | ||
Accumulated depreciation |
(3,307,031 | ) | ||
| | | | | |
|
$ | 674,568 | ||
| | | | | |
| | | | | |
| | | | | |
Depreciation expense |
$ | 264,475 | ||
| | | | | |
| | | | | |
| | | | | |
F-86
EFT SOURCE, INC.
Notes to the Financial Statements (Continued)
September 2, 2013
(10) Capital lease obligations (Continued)
The Company's obligations under these non-cancelable capital leases as of September 2, 2013 are as follows:
Minimum lease payments payable: |
||||
2013 (through December 31, 2014) |
$ | 61,157 | ||
2014 |
177,529 | |||
2015 |
173,172 | |||
2016 |
99,045 | |||
2017 |
36,953 | |||
| | | | | |
Total minimum lease payments payable |
547,856 | |||
Less portion representing interest |
(37,230 | ) | ||
| | | | | |
Capital lease obligations |
510,626 | |||
Less current portion |
(160,384 | ) | ||
| | | | | |
Capital lease obligations, excluding current portion |
$ | 350,242 | ||
| | | | | |
| | | | | |
| | | | | |
All of the Company's capital lease obligations were repaid on September 2, 2014 in connection with CPI's acquisition of EFT Source.
(11) Employment agreements
The Company has entered into employment agreements with certain executives of the Company. The agreements specify annual base salary, annual bonus based upon a specified formula as defined in the agreement and includes provisions for benefits. The agreements are effective through March 2015. Accrued expenses as of September 2, 2013 related to these agreements amounted to $439,539.
(12) Subsequent events
On March 14, 2014, the Company filed forms with the Internal Revenue Service to change its tax election from a standard "C" corporation to a Subchapter "S" corporation for federal income tax purposes, effective January 1, 2014. In connection with the Company's conversion to a Subchapter "S" corporation, deferred taxes previously recorded by EFT Source for timing differences between financial statement and tax accounting for federal income taxes were reversed, resulting in an income tax benefit of approximately $877,700. Subsequent to the Company's conversion to a Subchapter "S" corporation, the Company will be treated as a pass through entity for federal and state income tax purposes in Colorado and Wisconsin. The Company will continue to file state income tax returns in Tennessee.
On August 22, 2014, EFT Source and its former owners entered into a Purchase and Sale Agreement with CPI pursuant to which CPI agreed to purchase all of the issued and outstanding shares of capital stock of EFT Source from its former owners in exchange for cash consideration of $54,000,000, a subordinated unsecured promissory note of $9,000,000, and $5,000,000 of CPI's preferred and common stock (the "EFT Sale"). The EFT Sale was completed on September 2, 2014.
F-87
The
Board of Directors
CPI Holdings I, Inc.:
We have audited the accompanying financial statements of EFT Source, Inc. (a Tennessee corporation), which comprise the balance sheets as of December 31, 2013 and 2012, and the related statements of operations, changes in stockholders' equity and cash flows for the years then ended, and the related notes to the financial statements.
Management's Responsibility for the Financial Statements
Management is responsible for the preparation and fair presentation of these financial statements in accordance with accounting principles generally accepted in the United States of America; this includes the design, implementation, and maintenance of internal control relevant to the preparation and fair presentation of financial statements that are free from material misstatement, whether due to fraud or error.
Auditors' Responsibility
Our responsibility is to express an opinion on these financial statements based on our audits. We conducted our audits in accordance with auditing standards generally accepted in the United States of America. Those standards require that we plan and perform the audits to obtain reasonable assurance about whether the financial statements are free of material misstatement.
An audit involves performing procedures to obtain audit evidence about the amounts and disclosures in the financial statements. The procedures selected depend on the auditors' judgment, including the assessment of the risks of material misstatement of the financial statements, whether due to fraud or error. In making those risk assessments, the auditor considers internal control relevant to the entity's preparation and fair presentation of the financial statements in order to design audit procedures that are appropriate in the circumstances, but not for the purpose of expressing an opinion on the effectiveness of the entity's internal control. Accordingly, we express no such opinion. An audit also includes evaluating the appropriateness of accounting polices used and the reasonableness of significant accounting estimates made by management, as well as evaluating the overall presentation of the financial statements.
We believe that the audit evidence we have obtained is sufficient and appropriate to provide a basis for our audit opinion.
Opinion
In our opinion, the financial statements referred to above present fairly, in all material respects, the financial position of EFT Source, Inc. as of December 31, 2013 and 2012, and the results of its operations and its cash flows for the years then ended in accordance with accounting principles generally accepted in the United States of America.
| /s/ Lattimore Black Morgan & Cain, PC |
Brentwood,
Tennessee
June 24, 2015
F-88
EFT SOURCE, INC.
Balance Sheets
As of December 31, 2013 and 2012
| |
2013 | 2012 | |||||
|---|---|---|---|---|---|---|---|
Assets |
|||||||
Current assets: |
|||||||
Cash and cash equivalents |
$ | 4 | $ | — | |||
Accounts receivable |
4,792,651 | 3,324,680 | |||||
Inventories |
1,378,274 | 1,347,527 | |||||
Prepaid expenses and other current assets |
754,173 | 577,707 | |||||
Income taxes receivable |
49,561 | 455,343 | |||||
| | | | | | | | |
Total current assets |
6,974,663 | 5,705,257 | |||||
Property and equipment, net |
4,948,011 |
2,584,477 |
|||||
Goodwill |
6,426,000 | 6,426,000 | |||||
Loan costs, net of accumulated amortization of $86,481 and $57,654 at December 31, 2013 and 2012, respectively |
— | 28,827 | |||||
Deposits |
192,949 | 192,949 | |||||
| | | | | | | | |
|
$ | 18,541,623 | $ | 14,937,510 | |||
| | | | | | | | |
| | | | | | | | |
| | | | | | | | |
Liabilities and Stockholders' Equity |
|||||||
Current liabilities: |
|||||||
Checks written in excess of bank balance |
$ | — | $ | 1,100,161 | |||
Accounts payable |
530,617 | 180,208 | |||||
Accrued expenses and other current liabilities |
1,506,821 | 758,973 | |||||
Deferred income taxes |
210,700 | 202,700 | |||||
Income taxes payable |
337,805 | — | |||||
Current portion of capital lease obligations |
160,813 | 215,170 | |||||
Current portion of long-term debt |
1,046,377 | 1,095,418 | |||||
| | | | | | | | |
Total current liabilities |
3,793,133 | 3,552,630 | |||||
Long-term debt |
2,593,693 |
2,055,811 |
|||||
Capital lease obligations, excluding current portion |
291,704 | 450,936 | |||||
Deferred income taxes |
667,000 | 535,500 | |||||
| | | | | | | | |
Total liabilities |
7,345,530 | 6,594,877 | |||||
| | | | | | | | |
Stockholders' equity: |
|||||||
Common stock, no par value; 2,000 shares authorized; 899 shares issued and outstanding at December 31, 2013 and 2012 |
608,202 | 608,202 | |||||
Retained earnings |
10,587,891 | 7,734,431 | |||||
| | | | | | | | |
Total stockholders' equity |
11,196,093 | 8,342,633 | |||||
| | | | | | | | |
Total liabilities and stockholders' equity |
$ | 18,541,623 | $ | 14,937,510 | |||
| | | | | | | | |
| | | | | | | | |
| | | | | | | | |
See accompanying notes to the financial statements.
F-89
EFT SOURCE, INC.
Statements of Operations
For the years ended December 31, 2013 and 2012
| |
2013 | 2012 | |||||
|---|---|---|---|---|---|---|---|
Net sales |
$ | 42,171,538 | $ | 37,128,700 | |||
Cost of sales |
25,961,650 |
23,818,218 |
|||||
Selling, general, and administrative expenses |
10,343,462 | 8,821,633 | |||||
Depreciation expense |
996,555 | 928,835 | |||||
| | | | | | | | |
Income from operations |
4,869,871 |
3,560,014 |
|||||
Interest expense |
(133,852 | ) | (213,402 | ) | |||
| | | | | | | | |
Income before income taxes |
4,736,019 |
3,346,612 |
|||||
Income tax expense |
(1,641,667 | ) | (1,102,889 | ) | |||
| | | | | | | | |
Net income |
$ | 3,094,352 | $ | 2,243,723 | |||
| | | | | | | | |
| | | | | | | | |
| | | | | | | | |
See accompanying notes to the financial statements.
F-90
EFT SOURCE, INC.
Statements of Changes in Stockholders' Equity
For the years ended December 31, 2013 and 2012
| |
Common Shares |
Common Stock |
Retained Earnings |
Total Stockholders' Equity |
|||||||||
|---|---|---|---|---|---|---|---|---|---|---|---|---|---|
Balance at December 31, 2011 |
899 | $ | 608,202 | $ | 6,066,384 | $ | 6,674,586 | ||||||
Net contribution to related party |
— | — | (575,676 | ) | (575,676 | ) | |||||||
Net income |
— | — | 2,243,723 | 2,243,723 | |||||||||
| | | | | | | | | | | | | | |
Balance at December 31, 2012 |
899 | 608,202 | 7,734,431 | 8,342,633 | |||||||||
Net contribution to related party |
— | — | (240,892 | ) | (240,892 | ) | |||||||
Net income |
— | — | 3,094,352 | 3,094,352 | |||||||||
| | | | | | | | | | | | | | |
Balance at December 31, 2013 |
899 | $ | 608,202 | $ | 10,587,891 | $ | 11,196,093 | ||||||
| | | | | | | | | | | | | | |
| | | | | | | | | | | | | | |
| | | | | | | | | | | | | | |
See accompanying notes to the financial statements.
F-91
EFT SOURCE, INC.
Statements of Cash Flows
For the years ended December 31, 2013 and 2012
| |
2013 | 2012 | |||||
|---|---|---|---|---|---|---|---|
Cash flows from operating activities: |
|||||||
Net income |
$ | 3,094,352 | $ | 2,243,723 | |||
| | | | | | | | |
Adjustments to reconcile net income to cash flows provided by operating activities: |
|||||||
Depreciation of property and equipment |
996,555 | 928,835 | |||||
Amortization of loan costs |
28,827 | 41,322 | |||||
Bad debt expense |
7,923 | 21,328 | |||||
Deferred income taxes |
139,500 | 235,100 | |||||
(Increase) decrease in operating assets: |
|||||||
Accounts receivable |
(1,475,894 | ) | (100,171 | ) | |||
Inventories |
(30,747 | ) | (684,521 | ) | |||
Income taxes receivable |
405,782 | 104,887 | |||||
Prepaid expenses and other current assets |
(176,466 | ) | (123,395 | ) | |||
Increase (decrease) in operating liabilities: |
|||||||
Accounts payable |
350,409 | (316,788 | ) | ||||
Accrued expenses and other current liabilities |
747,848 | 40,137 | |||||
Income taxes payable |
337,805 | — | |||||
| | | | | | | | |
Total adjustments |
1,331,542 | 146,734 | |||||
| | | | | | | | |
Net cash provided by operating activities |
4,425,894 | 2,390,457 | |||||
| | | | | | | | |
Cash flows from investing activities: |
|||||||
Purchases of property and equipment |
(2,375,167 | ) | (728,289 | ) | |||
| | | | | | | | |
Net cash used by investing activities |
(2,375,167 | ) | (728,289 | ) | |||
| | | | | | | | |
Cash flows from financing activities: |
|||||||
Checks written in excess of bank balance |
(1,100,161 | ) | 914,107 | ||||
Borrowings of debt |
17,836,009 | 16,880,699 | |||||
Repayments of debt |
(18,332,090 | ) | (18,593,492 | ) | |||
Repayments of capital lease obligations |
(213,589 | ) | (287,806 | ) | |||
Net contribution to related party |
(240,892 | ) | (575,676 | ) | |||
| | | | | | | | |
Net cash used by financing activities |
(2,050,723 | ) | (1,662,168 | ) | |||
| | | | | | | | |
Increase in cash and cash equivalents |
4 | — | |||||
Cash and cash equivalents at beginning of year |
— | — | |||||
| | | | | | | | |
Cash and cash equivalents at end of year |
$ | 4 | $ | — | |||
| | | | | | | | |
| | | | | | | | |
| | | | | | | | |
Supplementary information: |
|||||||
Cash paid for interest |
$ | 137,831 | $ | 216,264 | |||
Cash paid for income taxes, net |
758,580 | 762,902 | |||||
During 2013, the Company had $984,922 of non-cash borrowings under the equipment line of credit, whereby the lender remitted funds directly to the equipment supplier. During 2012, the Company incurred non-cash capital lease obligations of $388,541 for various acquisitions of equipment.
See accompanying notes to the financial statements.
F-92
EFT SOURCE, INC.
Notes to the Financial Statements
December 31, 2013 and 2012
(1) Organization and nature of operations
EFT Source, Inc. ("EFT Source" or the "Company") personalizes and fulfills Financial Payment Cards for card issuing banks and other financial institutions located throughout the United States. We define Financial Payment Cards as credit, debit and Prepaid Debit Cards issued on the networks of the Payment Card Brands (Visa, MasterCard, American Express, and Discover). EFT Source's services include design, card and collateral procurement, encoding, embossing, chip programming, and data processing services related to Financial Payment Card management and issuance. EFT Source also sells its patented Card@Once® instant issuance system and provides ongoing card personalization services to users of this system.
EFT Source is authorized to personalize Visa and MasterCard products based upon card personalization agreements. The agreements require EFT Source to adhere to certain provisions as stated in the agreements.
(2) Summary of significant accounting policies
(a) Basis of presentation
The accompanying financial statements include the historical financial information of the stand-alone operations of EFT Source that are to be sold to CPI Acquisition, Inc. ("CPI"), a wholly owned subsidiary of CPI Holdings I, Inc., pursuant to a Purchase and Sale Agreement (the "EFT Sale Agreement") entered into on August 22, 2014 and closed on September 2, 2014.
Prior to September 2, 2014, EFT Source owned a 100% membership interest in Primadata, LLC ("Primadata"). Pursuant to the terms of the EFT Sale Agreement, EFT Source distributed all rights, title and interest in Primadata to the former owners of EFT Source. In connection with the distribution, EFT Source was released from all obligations with respect to the Primadata. Accordingly, the accompanying financial statements do not include the historical financial information of Primadata.
(b) Revenue recognition
Substantially all revenues of the Company are derived from card personalization, procurement, delivery services and sales of Card@Once® instant issuance systems. It is the Company's policy to recognize revenues as earned when the cards are mailed to the customer or end-user, when the instant issuance systems are shipped to the customer and as customers' instant issuance systems personalize cards within a bank branch. Certain service program revenue for instant issuance systems is recognized over the term of the program.
The Company has determined that the effects of deferred revenue for extended warranty agreements entered into with customers for the years ended December 31, 2013 and 2012 were not material.
The Company accounts for all governmental taxes associated with revenue transactions on a net basis.
The Company includes shipping and handling fees billed to customers in net sales. All shipping and handling costs are included in cost of sales.
F-93
EFT SOURCE, INC.
Notes to the Financial Statements (Continued)
December 31, 2013 and 2012
(2) Summary of significant accounting policies (Continued)
(c) Cash and cash equivalents
The Company considers all highly liquid investments with original maturities of three months or less to be cash equivalents and they are stated at cost, which approximates fair value.
The Company generally maintains cash on deposit at banks in excess of federally insured amounts. The Company has not experienced any losses in such accounts, and management believes the Company is not exposed to any significant credit risk related to cash.
(d) Trade accounts receivables and concentration of credit risk
Accounts receivable are uncollateralized customer obligations due under normal trade terms requiring payment within 30 days from invoice date. Certain customers have been granted extended payment terms based on business volume or other considerations. Late or interest charges on delinquent accounts are not recorded until collected. The carrying amount of accounts receivable is reduced by a valuation allowance, if necessary, which reflects management's best estimate of the amounts that will not be collected. The allowance is estimated based on management's knowledge of its customers, historical loss experience and existing economic conditions. Delinquent receivables are written off based on individual credit evaluation and specific circumstances of the customer. In management's opinion, an allowance for doubtful accounts is not necessary as of December 31, 2013 or 2012.
The majority of the Company's revenues and receivables are from sales to commercial financial service organizations located throughout the United States that distribute debit cards to customers and employees. The Company performs periodic credit evaluations of its customers' financial condition and generally does not require collateral.
Services provided to one customer in 2012 amounted to approximately 12% of the Company's net sales. Accounts receivable related to this customer was approximately $395,000 at December 31, 2012.
(e) Property and equipment
Property and equipment are stated at cost. Depreciation and amortization are provided over the assets' estimated useful lives using primarily the straight-line method. Equipment and fixtures are depreciated over five to seven years and leasehold improvements are amortized over the shorter of their estimated lives or the respective lease term.
Expenditures for maintenance and repairs are expensed when incurred. Expenditures for renewals or betterments are capitalized. When property is retired or sold, the cost and the related accumulated depreciation and amortization are removed from the accounts, and the resulting gain or loss is included in operations.
Management evaluates the recoverability of the investment in long-lived assets on an ongoing basis and recognizes any impairment in the year of determination. It is reasonably possible that relevant conditions could change in the near term and necessitate a change in management's estimate of the recoverability of these assets.
F-94
EFT SOURCE, INC.
Notes to the Financial Statements (Continued)
December 31, 2013 and 2012
(2) Summary of significant accounting policies (Continued)
(f) Goodwill and intangible assets
Goodwill represents the excess of the purchase price over the fair value of the net assets acquired in business combinations recorded as purchases. Goodwill is not amortized, but instead is reviewed for impairment on an annual basis, or more frequently, as impairment indicators are identified.
(g) Capitalized loan fees
Loan costs are amortized on a straight-line basis over the terms of the respective note agreements as the difference between interest expense recognized under the effective interest method and the straight-line amortization method is not considered to be material.
(h) Inventories
Inventories consist primarily of non-personalized Financial Payment Cards and instant issuance systems held for sale and are stated at the lower of cost, determined on an average cost basis, or market (net realizable value).
The Company purchased 24% and 25% of its production materials and services from one supplier in 2013 and 2012, respectively. Accounts payable related to this supplier was approximately $102,000 and $4,000 at December 31, 2013 and 2012, respectively.
(i) Income taxes
The amount provided for income taxes is based upon the amounts of current and deferred taxes payable or refundable at the date of the financial statements as a result of all events recognized in the financial statements measured by the provisions of enacted tax laws.
Under generally accepted accounting principles, a tax position is recognized as a benefit only if it is "more likely than not" that the tax position would be sustained in a tax examination, with a tax examination being presumed to occur. The amount recognized is the largest amount of tax benefit that is greater than 50% likely of being realized on examination. For tax positions not meeting the "more likely than not" test, no tax benefit is recorded. The Company had no material uncertain tax positions that qualify for either recognition or disclosure in the consolidated financial statements.
(j) Advertising costs
Advertising costs are expensed as incurred and amounted to $399,483 and $320,614 for the years ended December 31, 2013 and 2012, respectively.
(k) Rebates
The Company offers certain sales incentives to its customers, in the form of rebates, whereby customers receive a periodic payment from the Company based on certain criteria. The amount of these rebates is estimated by management and recorded as a reduction of net sales on the accrual basis. Accordingly, net sales have been reduced for rebates in the amount of $412,675 and $288,143 in 2013 and 2012, respectively.
F-95
EFT SOURCE, INC.
Notes to the Financial Statements (Continued)
December 31, 2013 and 2012
(2) Summary of significant accounting policies (Continued)
(l) Use of estimates
The preparation of financial statements in conformity with generally accepted accounting principles requires management to make estimates and assumptions that affect the reported amounts of assets and liabilities, disclosure of contingent assets and liabilities at the date of the financial statements and the reported amounts of revenues and expenses during the reporting period. Actual results could differ from those estimates.
(m) Events occurring after reporting date
The Company has evaluated events and transactions that occurred between December 31, 2013 and June 24, 2015, which is the date that the financial statements were available to be issued, for possible recognition or disclosure in the financial statements.
(3) Fair value measurements
The Company reports assets and liabilities under the accounting standards for fair value, which define fair value, establish a framework for measuring fair value, and govern disclosures about fair value measurements for financial and non-financial assets and liabilities. Fair value is a market-based measurement, not an entity-specific measurement. Therefore, a fair value measurement should be determined based on the assumptions that market participants would use in pricing the asset or liability. As a basis for considering market participant assumptions in fair value measurements, fair value accounting standards establish a fair value hierarchy that distinguishes between market participant assumptions based on market data obtained from sources independent of the reporting entity including quoted market prices in active markets for identical assets (Level 1), or significant other observable inputs (Level 2) and the reporting entity's own assumptions about market participant assumptions (Level 3). There have been no changes in the methodology used as of December 31, 2013 and 2012.
(4) Property and equipment
A summary of property and equipment as of December 31, 2013 and 2012 is as follows:
| |
2013 | 2012 | |||||
|---|---|---|---|---|---|---|---|
Equipment and fixtures |
$ | 9,388,318 | $ | 8,320,756 | |||
Leasehold improvements |
1,027,103 | 767,200 | |||||
Construction in progress—equipment |
2,032,625 | — | |||||
| | | | | | | | |
|
12,448,046 | 9,087,956 | |||||
Accumulated depreciation |
(7,500,035 | ) | (6,503,479 | ) | |||
| | | | | | | | |
|
$ | 4,948,011 | $ | 2,584,477 | |||
| | | | | | | | |
| | | | | | | | |
| | | | | | | | |
Depreciation expense for the years ended December 31, 2013 and 2012 amounted to $996,555 and $928,835, respectively.
F-96
EFT SOURCE, INC.
Notes to the Financial Statements (Continued)
December 31, 2013 and 2012
(5) Long-term debt
A summary of long-term debt as of December 31, 2013 and 2012 is as follows:
| |
2013 | 2012 | |||||
|---|---|---|---|---|---|---|---|
Term note to a financial institution due in monthly installments of $78,214, plus interest at variable rate of 30-day LIBOR plus 2.29% (2.46% as of December 31, 2013), through December 2015; secured by all assets and stock of the Company; cross-collateralized with the revolving line of credit. |
$ | 1,877,141 | $ | 2,815,709 | |||
Equipment line of credit ("LOC") payable to a financial institution interest only at a variable rate of 30-day LIBOR plus 2.29% (2.46% as of December 31, 2013), secured by specifically identified equipment in process to be termed once equipment installation is complete, projected June 2015. |
1,723,613 | — | |||||
Equipment note payable to a financial institution due in monthly installments of $13,239, including interest at the bank's rate (6.00% as of December 31, 2013), through March 2014; secured by specifically identified equipment and personal guarantee of majority stockholder. |
39,316 | 190,739 | |||||
Vehicle note payable due in monthly installments of $1,809, including interest at 1.90% through April 2013; secured by the vehicle. |
— | 5,427 | |||||
$2,800,000 revolving LOC with a financial institution scheduled to mature on June 30, 2016 bearing interest at a variable rate of 30-day LIBOR plus 2.29% (2.46% at December 31, 2013); secured by all assets of the Company, and is cross-collateralized with the term note described above. |
— | 139,354 | |||||
| | | | | | | | |
Total long-term debt |
3,640,070 | 3,151,229 | |||||
Less current portion |
(1,046,377 | ) | (1,095,418 | ) | |||
| | | | | | | | |
Long-term debt |
$ | 2,593,693 | $ | 2,055,811 | |||
| | | | | | | | |
| | | | | | | | |
| | | | | | | | |
The LOC agreement placed certain restrictions upon the Company, including capital expenditures and additional borrowings, and required a mandatory annual payment of 85% of excess cash flow, as defined in the agreement. The excess cash flow payment requirement was waived by the financial institution for the years ended December 31, 2013 and 2012. The Company was also required to maintain a minimum cash flow to debt service ratio. Advances under the LOC were determined based on a defined borrowing base.
F-97
EFT SOURCE, INC.
Notes to the Financial Statements (Continued)
December 31, 2013 and 2012
(5) Long-term debt (Continued)
A summary of future maturities of long-term debt as of December 31, 2013 is as follows:
Year
|
|
|||
|---|---|---|---|---|
2014 |
$ | 1,046,377 | ||
2015 |
2,593,693 | |||
| | | | | |
|
$ | 3,640,070 | ||
| | | | | |
| | | | | |
| | | | | |
All of the Company's outstanding indebtedness was repaid on September 2, 2014 in connection with CPI's acquisition of EFT Source.
(6) Contributions to related party
During 2013 and 2012, EFT Source made cash contributions related to its investment in Primadata. The net $240,892 of contributions for 2013 consisted of various working capital advances to Primadata for its operations. The net $575,676 of contributions for 2012 consisted of $225,000 for the purchase of the non-controlling interest in Primadata and $350,676 of various working capital advances to Primadata for its operations.
(7) Profit-sharing plan
The Company sponsors certain defined contribution profit-sharing plans covering all employees over 21 years old with one year of service. Employees may defer up to 10% of their compensation, not to exceed the maximum amount allowable under income tax rules and regulations. Employee salary deferrals are matched 25% by the Company. The Company may also contribute an additional amount determined by its Board of Directors as allowed under the plan. The Company contributed $89,605 and $69,641 to the plan for December 31, 2013 and 2012, respectively.
(8) Income taxes
The Company's provision for income taxes for the years ended December 31, 2013 and 2012 are as follows:
| |
2013 | 2012 | |||||
|---|---|---|---|---|---|---|---|
Current tax expense: |
|||||||
Federal |
$ | 1,381,167 | $ | 778,994 | |||
State |
121,000 | 88,795 | |||||
| | | | | | | | |
Total current tax expense |
1,502,167 | 867,789 | |||||
| | | | | | | | |
Deferred tax expense: |
|||||||
Federal |
126,000 | 212,000 | |||||
State |
13,500 | 23,100 | |||||
| | | | | | | | |
Total deferred tax expense |
139,500 | 235,100 | |||||
| | | | | | | | |
Total provision for income taxes |
$ | 1,641,667 | $ | 1,102,889 | |||
| | | | | | | | |
| | | | | | | | |
| | | | | | | | |
F-98
EFT SOURCE, INC.
Notes to the Financial Statements (Continued)
December 31, 2013 and 2012
(8) Income taxes (Continued)
The actual income tax expense each year differed from the expected income tax expense due to certain expenses which have been recognized in the financial statements which are not deductible for federal and state income tax purposes. The Company also qualified for research and development federal tax credits, and certain other tax credits, which decreased the actual income tax expense in 2013 and 2012.
As of December 31, 2013 and 2012, the Company has accrued no interest and no penalties related to uncertain tax positions. It is the Company's policy to recognize interest and/or penalties related to income tax matters in income tax expense.
EFT Source files U.S. Federal and states of Tennessee, Colorado and Wisconsin income tax returns. EFT Source is currently open to audit under the statute of limitations by the Internal Revenue Service and the states of Tennessee, Colorado and Wisconsin for the years ended December 31, 2012 through 2014.
Net deferred income taxes in the balance sheet as of December 31, 2013 and 2012 include the following amounts of deferred income tax assets and liabilities:
| |
Current | Long-term | Total | |||||||
|---|---|---|---|---|---|---|---|---|---|---|
| |
2013 | |||||||||
Deferred income tax assets |
$ | 78,500 | $ | — | $ | 78,500 | ||||
Deferred income tax liabilities |
(289,200 | ) | (667,000 | ) | (956,200 | ) | ||||
| | | | | | | | | | | |
Net |
$ | (210,700 | ) | $ | (667,000 | ) | $ | (877,700 | ) | |
| | | | | | | | | | | |
| | | | | | | | | | | |
| | | | | | | | | | | |
| |
2012 | |||||||||
|---|---|---|---|---|---|---|---|---|---|---|
Deferred income tax assets |
$ | 18,500 | $ | — | $ | 18,500 | ||||
Deferred income tax liabilities |
(221,200 | ) | (535,500 | ) | (756,700 | ) | ||||
| | | | | | | | | | | |
Net |
$ | (202,700 | ) | $ | (535,500 | ) | $ | (738,200 | ) | |
| | | | | | | | | | | |
| | | | | | | | | | | |
| | | | | | | | | | | |
Deferred income taxes are provided for the temporary differences between the financial reporting basis and tax basis of the Company's assets and liabilities. The deferred income tax assets result primarily from the tax basis difference in accounting for non-compete agreements and certain accrued expenses which are not deductible for income tax purposes until paid. The deferred income tax liabilities result primarily from depreciation and amortization for financial reporting purposes being less than depreciation and amortization allowed for tax reporting purposes and certain timing differences related to prepaid expenses.
(9) Operating lease commitments
The Company utilizes office space and various equipment under non-cancelable operating leases. Rent expense under these leases amounted to $676,027 and $639,095 for 2013 and 2012, respectively. A
F-99
EFT SOURCE, INC.
Notes to the Financial Statements (Continued)
December 31, 2013 and 2012
(9) Operating lease commitments (Continued)
summary of approximate future minimum payments under these leases as of December 31, 2013 is as follows:
Year
|
|
|||
|---|---|---|---|---|
2014 |
$ | 463,000 | ||
2015 |
130,000 | |||
| | | | | |
|
$ | 593,000 | ||
| | | | | |
| | | | | |
| | | | | |
(10) Capital lease obligations
The Company has entered into capital lease agreements to finance the acquisition of certain equipment. Equipment utilized under capital lease obligations as of December 31, 2013 and 2012 is as follows:
| |
2013 | 2012 | |||||
|---|---|---|---|---|---|---|---|
Equipment and construction in progress |
$ | 3,981,599 | $ | 3,981,599 | |||
Accumulated depreciation |
(3,419,065 | ) | (3,042,556 | ) | |||
| | | | | | | | |
|
$ | 562,534 | $ | 939,043 | |||
| | | | | | | | |
| | | | | | | | |
| | | | | | | | |
Depreciation expense |
$ | 376,509 | $ | 421,273 | |||
| | | | | | | | |
| | | | | | | | |
| | | | | | | | |
The Company's obligations under these non-cancelable capital leases as of December 31, 2013 and 2012 are as follows:
| |
2013 | 2012 | |||||
|---|---|---|---|---|---|---|---|
Minimum lease payments payable: |
|||||||
2014 |
$ | 177,921 | |||||
2015 |
168,868 | ||||||
2016 |
98,866 | ||||||
2017 |
37,231 | ||||||
| | | | | | | | |
Total minimum lease payments payable |
482,886 | $ | 722,575 | ||||
Less portion representing interest |
(30,369 | ) | (56,469 | ) | |||
| | | | | | | | |
Capital lease obligations |
452,517 | 666,106 | |||||
Less current portion |
(160,813 | ) | (215,170 | ) | |||
| | | | | | | | |
Capital lease obligations, excluding current portion |
$ | 291,704 | $ | 450,936 | |||
| | | | | | | | |
| | | | | | | | |
| | | | | | | | |
All of the Company's capital lease obligations were repaid on September 2, 2014 in connection with CPI's acquisition of EFT Source.
(11) Employment agreements
The Company has entered into employment agreements with certain executives of the Company. The agreements specify annual base salary, annual bonus based upon a specified formula as defined in
F-100
EFT SOURCE, INC.
Notes to the Financial Statements (Continued)
December 31, 2013 and 2012
(11) Employment agreements (Continued)
the agreement and includes provisions for benefits. The agreements are effective through March 2015. Accrued expenses at December 31, 2013 and 2012 related to these agreements amounted to $679,369 and $184,503, respectively.
(12) Subsequent events
On March 14, 2014, the Company filed forms with the Internal Revenue Service to change its tax election from a standard "C" corporation to a Subchapter "S" corporation for federal income tax purposes, effective January 1, 2014. In connection with the Company's conversion to a Subchapter "S" corporation, deferred taxes previously recorded by EFT Source for timing differences between financial statement and tax accounting for federal income taxes were reversed, resulting in an income tax benefit of approximately $877,700. Subsequent to the Company's conversion to a Subchapter "S" corporation, the Company will be treated as a pass through entity for federal and state income tax purposes in Colorado and Wisconsin. The Company will continue to file state income tax returns in Tennessee.
On August 22, 2014, EFT Source and its former owners entered into a Purchase and Sale Agreement with CPI pursuant to which CPI agreed to purchase all of the issued and outstanding shares of capital stock of EFT Source from its former owners in exchange for cash consideration of $54,000,000, a subordinated unsecured promissory note of $9,000,000, and $5,000,000 of CPI's preferred and common stock (the "EFT Sale"). The EFT Sale was completed on September 2, 2014.
F-101
CPI CARD GROUP INC.
UNAUDITED PRO FORMA CONDENSED CONSOLIDATED STATEMENTS OF OPERATIONS FOR THE YEAR ENDED DECEMBER 31, 2014
(in thousands, except share and per share amounts)
CPI Card Group Inc. (the "Company") acquired 100% of the outstanding capital of EFT Source, Inc. ("EFT Source") on September 2, 2014. For purposes of the unaudited pro forma condensed consolidated statement of operations set forth below, the Company assumed that the acquisition of EFT Source occurred on January 1, 2014. As a result, the unaudited pro forma consolidated statement of operations data was derived from:
- •
- the audited historical consolidated statement of operations and comprehensive income for the Company for the year ended
December 31, 2014; and
- •
- the audited historical statement of operations data for EFT Source for the period from January 1, 2014 to September 2, 2014.
The unaudited pro forma condensed consolidated statement of operations data set forth below is presented for illustrative purposes only and does not necessarily indicate the operating results that would have been achieved if the acquisition of EFT Source had occurred at the beginning of the period presented, nor is it indicative of future operating results. The unaudited pro forma condensed consolidated statement of operations should be read in conjunction with the Company's and EFT Source's historical consolidated financial statements and accompanying notes included elsewhere in this prospectus.
P-1
CPI CARD GROUP INC.
UNAUDITED PRO FORMA CONDENSED CONSOLIDATED STATEMENT OF OPERATIONS
FOR THE YEAR ENDED DECEMBER 31, 2014
(in thousands except share and per share data)
| |
CPI Card Group Inc. and Subsidiaries Historical(AA) |
EFT Source, Inc. Historical(BB) |
Pro Forma Before Adjustments |
Pro Forma Adjustments |
CPI Card Group Inc. Pro Forma |
|||||||||||
|---|---|---|---|---|---|---|---|---|---|---|---|---|---|---|---|---|
Operating revenue: |
||||||||||||||||
Product revenue |
$ | 159,220 | $ | 12,124 | $ | 171,344 | $ | (3,862 | )(CC) | $ | 167,482 | |||||
Service revenue |
101,786 | 22,034 | 123,820 | — | 123,820 | |||||||||||
| | | | | | | | | | | | | | | | | |
Total operating revenue |
261,006 | 34,158 | 295,164 | (3,862 | )(CC) | 291,302 | ||||||||||
| | | | | | | | | | | | | | | | | |
Cost of sales |
179,279 | 20,857 | 200,136 | (3,862 | )(CC) | 196,274 | ||||||||||
| | | | | | | | | | | | | | | | | |
Gross profit |
81,727 | 13,301 | 95,028 | — | 95,028 | |||||||||||
Operating expenses |
47,255 | 10,280 | 57,535 | 233 | (DD, EE, FF, GG) | 57,768 | ||||||||||
| | | | | | | | | | | | | | | | | |
Income from operations |
34,472 | 3,021 | 37,493 | (233 | ) | 37,260 | ||||||||||
Other income (expenses): |
||||||||||||||||
Interest, net |
(7,508 | ) | (64 | ) | (7,572 | ) | (1,764 | )(HH) | (9,336 | ) | ||||||
Foreign currency loss |
(124 | ) | — | (124 | ) | — | (124 | ) | ||||||||
Loss on debt modification and early extinguishment |
(476 | ) | — | (476 | ) | 476(II) | — | |||||||||
Other income (expenses), net |
(101 | ) | — | (101 | ) | — | (101 | ) | ||||||||
| | | | | | | | | | | | | | | | | |
Total other expenses |
(8,209 | ) | (64 | ) | (8,273 | ) | (1,288 | ) | (9,561 | ) | ||||||
| | | | | | | | | | | | | | | | | |
Income before income taxes |
26,263 | 2,957 | 29,220 | (1,521 | ) | 27,699 | ||||||||||
Provision for income taxes |
(10,291 | ) | 727 | (9,564 | ) | (1,219 | )(JJ) | (10,783 | ) | |||||||
| | | | | | | | | | | | | | | | | |
Net income from continuing operations |
15,972 | 3,684 | 19,656 | (2,740 | ) | 16,916 | ||||||||||
Loss from a discontinued operation, net of taxes |
(2,670 | ) | — | (2,670 | ) | — | (2,670 | ) | ||||||||
| | | | | | | | | | | | | | | | | |
Net income (loss) |
$ | 13,302 | $ | 3,684 | $ | 16,986 | $ | (2,740 | ) | $ | 14,246 | |||||
| | | | | | | | | | | | | | | | | |
| | | | | | | | | | | | | | | | | |
| | | | | | | | | | | | | | | | | |
Net income (loss) per share: |
||||||||||||||||
Basic and Diluted—Continuing Operations |
$ | (0.69 | ) | $ | (0.67 | ) | ||||||||||
Basic and Diluted—Discontinued Operations |
(0.07 | ) | (0.07 | ) | ||||||||||||
| | | | | | | | | | | | | | | | | |
Total |
$ | (0.76 | ) | $ | (0.74 | ) | ||||||||||
| | | | | | | | | | | | | | | | | |
| | | | | | | | | | | | | | | | | |
| | | | | | | | | | | | | | | | | |
Weighted average shares outstanding |
||||||||||||||||
Basic and Diluted |
41,199,246 | 41,371,220 | ||||||||||||||
- (AA)
- Represents
CPI Card Group Inc.'s consolidated statement of operations for the year ended December 31, 2014, which includes the
operations of EFT Source, Inc. from September 2, 2014 through December 31, 2014.
- (BB)
- Represents
EFT Source, Inc.'s statement of operations for the period January 1, 2014 through September 2, 2014. Revenue
and cost of sales reported in the historical financial statements of EFT Source, Inc. have been reclassified to conform with the presentation used in the historical financial statements of
CPI Card Group Inc. Specifically, (i) revenue of $34,158 for the period January 1, 2014 through September 2, 2014 has been separated into product revenue of $12,124 and
service revenue of $22,034.
- (CC)
- Represents
the elimination of sales from CPI Card Group Inc. to EFT Source, Inc. during the period beginning January 1,
2014 and ended on September 2, 2014 of $3,862 which are included in the reported revenue of CPI Card Group Inc. and subsidiaries for the year ended December 31, 2014 and in the
reported cost of sales of EFT Source, Inc. for the period January 1, 2014 through September 2, 2014.
- (DD)
- Represents
the elimination of direct transactions costs of $537 and $24 which were included in the historical financial statements of
CPI Card Group Inc. and EFT Source, Inc., respectively.
- (EE)
- Represents
the elimination of non-recurring bonuses of $1,280 paid by EFT Source, Inc. to former executives and owners for personal
income taxes incurred in connection with the transaction.
- (FF)
- Represents adjustments to depreciation expense for the period January 1, 2014 through September 2, 2014 of $337 and attributable to increases in the estimated fair values of acquired tangible assets, which are depreciated over an estimated remaining useful life of 3 years.
P-2
- (GG)
- Represents
adjustments to amortization expense for the period January 1, 2014 through September 2, 2014 of $1,712 attributable
to the estimated fair value of acquired intangible assets, including customer relationships, proprietary software, technology and non-compete agreements, which are amortized over estimated useful
lives ranging from 5 to 15 years.
- (HH)
- Represents
adjustments to interest expense for the period January 1, 2014 through September 2, 2014 related to
(i) additional interest expense of $1,444 on the additional Senior Term Debt borrowed by CPI Card Group Inc. in connection with the EFT Acquisition, (ii) additional interest
expense of $300 on the Sellers Note issued to the former owners of EFT Source, Inc. in connection with the EFT Acquisition, (iii) additional interest expense of $84 related to deferred
financing costs and debt discounts recorded in connection with the issuance of the additional Senior Term Debt, offset by (iv) a reduction to interest expense of $64 related to the outstanding
indebtedness and capital lease obligations of EFT Source, Inc. repaid in connection with the EFT Acquisition.
- (II)
- Represents
the reversal of the loss on debt modification and early extinguishment of $476 related to the issuance of additional indebtedness
to existing Senior Term Debt creditors incurred in connection with the EFT Acquisition.
- (JJ)
- Represents adjustments to income tax expense to reflect (i) the reversal of the income tax benefit recorded by EFT Source, Inc. in connection with their conversion from a taxable "C" corporation to a non-taxable subchapter "S" corporation effective January 1, 2014 offset by (ii) additional income tax expense which would have been incurred by EFT Source, Inc. as a "C" corporation and (iii) the income tax impact of the pro forma adjustments further described above.
P-3
[ADDITIONAL PAGE FOR CANADIAN PROSPECTUS]
Dated: October 7, 2015
This prospectus, together with the documents and information incorporated by reference, will, as of the date of the supplemented prospectus providing the information permitted to be omitted from this prospectus, constitute full, true and plain disclosure of all material facts relating to the securities offered by this prospectus as required by the securities legislation of each of the provinces and territories of Canada.
| Steven Montross (signed) "Steven Montross" Chief Executive Officer |
David Brush (signed) "David Brush" Chief Financial Officer |
On behalf of the Board of Directors:
| Bradley Seaman (signed) "Bradley Seaman" Director |
Nicholas Peters (signed) "Nicholas Peters" Director |
C-1
[ADDITIONAL PAGE FOR CANADIAN PROSPECTUS]
CERTIFICATE OF THE CANADIAN UNDERWRITERS
Dated: October 7, 2015
To the best of our knowledge, information and belief, this prospectus, together with the documents and information incorporated by reference, will, as of the date of the supplemented prospectus providing the information permitted to be omitted from this prospectus, constitute full, true and plain disclosure of all material facts relating to the securities offered by this prospectus as required by the securities legislation of each of the provinces and territories of Canada.
| BMO Nesbitt Burns Inc. (signed) "Jamie Rogers" Managing Director |
Goldman Sachs Canada Inc. (signed) "Michelle Khalili" Managing Director |
CIBC World Markets Inc. (signed) "Kathy Butler" Managing Director |
||
Raymond James Ltd. (signed) "J. Graham Fell" Senior Managing Director |
Scotia Capital Inc. (signed) "Andrew McLenan" Managing Director |
GMP Securities L.P. (signed) "Kevin Sullivan" Deputy Chairman |
C-2

16,000,000 Shares
CPI Card Group Inc.
Common Stock
PRELIMINARY PROSPECTUS
BMO Capital Markets
Goldman, Sachs & Co.
CIBC
Baird
William Blair
Raymond James
Scotiabank
GMP Securities
, 2015
Until , 2015 (25 days after the date of this prospectus), all dealers that buy, sell or trade shares of our common stock, whether or not participating in this offering, may be required to deliver a prospectus. This is in addition to the dealers' obligation to deliver a prospectus when acting as underwriters and with respect to their unsold allotments or subscriptions.
PART II
INFORMATION NOT REQUIRED IN PROSPECTUS
Item 13. Other Expenses of Issuance and Distribution
The following table sets forth all expenses to be paid by the Registrant, other than estimated underwriting discounts and commissions, in connection with our initial public offering. All amounts shown are estimates except for the SEC registration fee and the FINRA filing fee:
SEC registration fee |
$ | 42,448 | ||
FINRA filing fee |
54,795 | |||
NASDAQ listing fee |
200,000 | |||
Printing and engraving |
300,000 | |||
Legal fees and expenses |
3,000,000 | |||
Accounting fees and expenses |
1,000,000 | |||
Transfer agent and registrar fees |
15,000 | |||
Miscellaneous |
387,757 | |||
| | | | | |
Total |
$ | 5,000,000 | ||
| | | | | |
| | | | | |
| | | | | |
Item 14. Indemnification of Directors and Officers
Section 145 of the Delaware General Corporation Law authorizes a corporation's board of directors to grant, and authorizes a court to award, indemnity to officers, directors and other corporate agents.
As permitted by Section 102(b)(7) of the Delaware General Corporation Law, or DGCL, the registrant's amended and restated certificate of incorporation to be in effect upon the closing of this offering includes provisions that eliminate the personal liability of its directors and officers for monetary damages for breach of their fiduciary duty as directors and officers, except for liability (i) for any breach of the director's duty of loyalty to the corporation or its stockholders, (ii) for acts or omissions not in good faith or which involve intentional misconduct or a knowing violation of law, (iii) for unlawful payments of dividends or unlawful stock repurchases, redemptions or other distributions or (iv) for any transaction from which the director derived an improper personal benefit. The registrant's amended and restated certificate of incorporation provides for such limitation of liability.
In addition, as permitted by Section 145 of the DGCL, the bylaws of the registrant to be effective upon completion of this offering provide that:
- •
- The registrant shall indemnify its directors and officers for serving the registrant in those capacities or for serving other business
enterprises at the registrant's request, to the fullest extent permitted by Delaware law. Delaware law provides that a corporation may indemnify such person if such person acted in good faith and in a
manner such person reasonably believed to be in or not opposed to the best interests of the registrant and, with respect to any criminal action or proceeding, had no reasonable cause to believe such
person's conduct was unlawful.
- •
- The registrant may, in its discretion, indemnify employees and agents in those circumstances where indemnification is permitted by
applicable law.
- •
- The registrant is required to advance expenses, as incurred, to its directors and officers in connection with defending a proceeding, except that such director or officer shall undertake to repay such advances if it is ultimately determined that such person is not entitled to indemnification.
II-1
- •
- The registrant will not be obligated pursuant to the bylaws to indemnify a person with respect to proceedings initiated by that
person, except with respect to proceedings authorized by the registrant's board of directors or brought to enforce a right to indemnification.
- •
- The rights conferred in the bylaws are not exclusive, and the registrant is authorized to enter into indemnification agreements with
its directors, officers, employees and agents and to obtain insurance to indemnify such persons.
- •
- The registrant may not retroactively amend the bylaw provisions to reduce its indemnification obligations to directors, officers, employees and agents.
Prior to the completion of this offering, we expect to enter into indemnification agreements with each of our directors and executive officers that may be broader than the specific indemnification provisions contained in the Delaware General Corporation Law. These indemnification agreements will require us, among other things, to indemnify our directors and executive officers against liabilities that may arise by reason of their status or service. These indemnification agreements will also require us to advance all expenses incurred by the directors and executive officers in investigating or defending any such action, suit, or proceeding. We believe that these agreements are necessary to attract and retain qualified individuals to serve as directors and executive officers. The registrant will also maintain directors and officers insurance to insure such persons against certain liabilities.
The underwriting agreement to be filed as Exhibit 1.1 to this registration statement provides for indemnification by the underwriters of the registrant and its officers and directors for certain liabilities arising under the Securities Act and otherwise.
Item 15. Recent Sales of Unregistered Securities
Since January 1, 2012, we have issued and sold the following securities:
- 1.
- In
January 2012, we issued 380,116 shares of common stock at an issue price of $0.0005 per share to certain of our employees.
- 2.
- In
January 2012, we issued options to purchase an aggregate of 77,000 shares of common stock to our employees at an exercise price of $0.0005 per
share.
- 3.
- In
January 2012, we issued 107 shares of preferred stock at an issue price of $1,691.72 to a certain employee.
- 4.
- In
September 2013, we issued 123,112 shares of common stock at $0.0005 per share and 28 shares of our preferred stock at $1,775.87 per share to
one of our employees.
- 5.
- In
May 2013 and September 2013, we issued options to purchase an aggregate of 99,000 and 22,000 shares of common stock, respectively, to our employees
at an exercise price of $0.0005 per share.
- 6.
- In
September 2014, we issued 257,268 shares of common stock valued at $11.47 per share and 549 shares of preferred stock valued at $3,733.88
per share to the former owners of EFT Source, Inc. as partial consideration for our acquisition of EFT Source, Inc.
- 7.
- In June 2015, we granted 191,664 shares of restricted common stock to certain newly-hired executive officers pursuant to employment agreements. These grants of restricted stock did not involve any cash payments from the recipients.
Other than the transactions listed immediately above, we have not issued and sold any unregistered securities in the three years preceding the filing of this registration statement. No underwriters were in involved in the foregoing issuances of securities.
II-2
Unless otherwise stated, the sales of the above securities were deemed to be exempt from registration under the Securities Act in reliance upon Section 4(a)(2) of the Securities Act (or Regulation D or Regulation S promulgated thereunder), or Rule 701 promulgated under Section 3(b) of the Securities Act as transactions by an issuer not involving any public offering or pursuant to benefit plans and contracts relating to compensation as provided under Rule 701. The recipients of the securities in each of these transactions represented their intentions to acquire the securities for investment only and not with a view to or for sale in connection with any distribution thereof, and appropriate legends were placed upon the stock certificates issued in these transactions.
Item 16. Exhibits and Financial Statement Schedules
(3) Exhibits. The following exhibits are included herein or incorporated herein by reference:
| |
Exhibit Number |
Description | |||
|---|---|---|---|---|---|
| 1.1† | Form of Underwriting Agreement | ||||
2.1† |
Purchase and Sale Agreement, dated as of August 22, 2014, by and among William S. Dinker, Katherine S. Nevill, Bobby Smith and Tom Hedrich, William S. Dinker 2012 Trust for Edward McCullough Dinker, William S. Dinker 2012 Trust for John Walsh Dinker and William S. Dinker 2012 Trust for William S. Dinker III, EFT Source, Inc., CPI Acquisition, Inc. and William S. Dinker, as Sellers' Representative |
||||
3.1† |
Form of Amended and Restated Certificate of Incorporation of CPI Card Group Inc. |
||||
3.2† |
Form of Amended and Restated Bylaws of CPI Card Group Inc. |
||||
4.1† |
Form of Stock Certificate |
||||
5.1 |
Opinion of Winston & Strawn LLP |
||||
10.1+† |
Employment and Non-Competition Agreement, dated April 22, 2009, between CPI Acquisition, Inc. and Steven Montross |
||||
10.2+† |
Employment and Non-Competition Agreement, dated October 1, 2008, between Metaca Corporation and Anna Rossetti |
||||
10.3+† |
Termination Letter, dated May 5, 2015 between CPI Acquisition, Inc. and Marvin Press |
||||
10.4+† |
CPI Card Group Inc. Omnibus Incentive Plan |
||||
10.5† |
Form of Stock Option Award Agreement under the CPI Card Group Inc. Omnibus Incentive Plan |
||||
10.6+† |
CPI Acquisition, Inc. Phantom Stock Plan |
||||
10.7+† |
CPI Holdings I, Inc. Amended and Restated 2007 Stock Option Plan |
||||
10.8+† |
Employment and Non-Competition Agreement, effective June 22, 2015, between CPI Acquisition, Inc. and David Brush |
||||
10.9†† |
Form of Indemnification Agreement |
||||
10.10† |
First Lien Credit Agreement, dated as of August 17, 2015, by and among CPI Card Group Inc., CPI Acquisition Inc., the lenders from time to time party thereto and the Bank of Nova Scotia, as Administrative Agent and Collateral Agent |
||||
10.11† |
Form of Director Nomination Agreement by and between CPI Card Group Inc. and the Tricor Funds |
||||
10.12† |
Form of Registration Rights Agreement by and betwen CPI Card Group Inc. and the Tricor Funds |
||||
II-3
| |
Exhibit Number |
Description | |||
|---|---|---|---|---|---|
| 15.1 | Lattimore, Black, Morgan & Cain, P.C. letter re unaudited interim financial information. | ||||
16.1† |
Letter to the Securities and Exchange Commission from Ernst & Young LLP, dated May 21, 2015 |
||||
21.1† |
List of subsidiaries of CPI Card Group Inc. |
||||
23.1 |
Consent of KPMG LLP |
||||
23.2 |
Consent of KPMG LLP |
||||
23.3 |
Consent of Lattimore, Black, Morgan & Cain, P.C. |
||||
23.4† |
Consent of First Annapolis Consulting, Inc. |
||||
23.5 |
Consent of Winston & Strawn LLP (included in Exhibit 5.1) |
||||
24.1† |
Powers of Attorney |
||||
- +
- Indicates
exhibits that constitute management contracts or compensatory plans or arrangements
- *
- Indicates
to be filed by amendment.
- †
- Previously filed.
(b) Financial Statement Schedules. All financial statement schedules are omitted because they are not applicable or the information is included in the Registrant's consolidated financial statements or related notes.
The undersigned registrant hereby undertakes to provide to the underwriters at the closing specified in the underwriting agreement, certificates in such denominations and registered in such names as required by the underwriters to permit prompt delivery to each purchaser.
Insofar as indemnification for liabilities arising under the Securities Act may be permitted to directors, officers and controlling persons of the registrant pursuant to the foregoing provisions, or otherwise, the registrant has been advised that in the opinion of the SEC such indemnification is against public policy as expressed in the Securities Act and is, therefore, unenforceable. In the event that a claim for indemnification against such liabilities (other than the payment by the registrant of expenses incurred or paid by a director, officer or controlling person of the registrant in the successful defense of any action, suit or proceeding) is asserted by such director, officer or controlling person in connection with the securities being registered, the registrant will, unless in the opinion of its counsel the matter has been settled by controlling precedent, submit to a court of appropriate jurisdiction the question whether such indemnification by it is against public policy as expressed in the Securities Act and will be governed by the final adjudication of such issue.
The undersigned registrant hereby undertakes that:
(1) for purposes of determining any liability under the Securities Act, the information omitted from the form of prospectus filed as part of this registration statement in reliance upon Rule 430A and contained in a form of prospectus filed by the registrant pursuant to Rule 424(b)(1) or (4) or 497(h) under the Securities Act shall be deemed to be part of this registration statement as of the time it was declared effective; and
(2) for the purpose of determining any liability under the Securities Act, each post-effective amendment that contains a form of prospectus shall be deemed to be a new registration statement relating to the securities offered therein, and the offering of such securities at that time shall be deemed to be the initial bona fide offering thereof.
II-4
Pursuant to the requirements of the Securities Act of 1933, the registrant has duly caused this amendment to be signed on its behalf by the undersigned, thereunto duly authorized, in Littleton, Colorado, on this 7th day of October, 2015.
| CPI CARD GROUP INC. | ||||||
By: |
/s/ STEVEN MONTROSS |
|||||
| Name: | Steven Montross | |||||
| Title: | Chief Executive Officer | |||||
Signature
|
Title
|
Date
|
||||
|---|---|---|---|---|---|---|
| /s/ STEVEN MONTROSS Steven Montross |
President, Chief Executive Officer and Director (Principal Executive Officer) | October 7, 2015 | ||||
/s/ DAVID BRUSH David Brush |
Chief Financial Officer (Principal Financial Officer) |
October 7, 2015 |
||||
/s/ JERRY DREILING Jerry Dreiling |
Vice President and Chief Accounting Officer (Principal Accounting Officer) |
October 7, 2015 |
||||
* Bradley Seaman |
Chairman of the Board |
October 7, 2015 |
||||
* Nicholas Peters |
Director |
October 7, 2015 |
||||
* Robert Pearce |
Director |
October 7, 2015 |
||||
* David Rowntree |
Director |
October 7, 2015 |
||||
*By: |
/s/ STEVEN MONTROSS Steven Montross, as attorney-in-fact |
|||||
II-5
| |
Exhibit Number | Description | |||
|---|---|---|---|---|---|
| 1.1† | Form of Underwriting Agreement | ||||
2.1† |
Purchase and Sale Agreement, dated as of August 22, 2014, by and among William S. Dinker, Katherine S. Nevill, Bobby Smith and Tom Hedrich, William S. Dinker 2012 Trust for Edward McCullough Dinker, William S. Dinker 2012 Trust for John Walsh Dinker and William S. Dinker 2012 Trust for William S. Dinker III, EFT Source, Inc., CPI Acquisition, Inc. and William S. Dinker, as Sellers' Representative |
||||
3.1† |
Form of Amended and Restated Certificate of Incorporation of CPI Card Group Inc. |
||||
3.2† |
Form of Amended and Restated Bylaws of CPI Card Group Inc. |
||||
4.1† |
Form of Stock Certificate |
||||
5.1 |
Opinion of Winston & Strawn LLP |
||||
10.1+† |
Employment and Non-Competition Agreement, dated April 22, 2009, between CPI Acquisition, Inc. and Steven Montross |
||||
10.2+† |
Employment and Non-Competition Agreement, dated October 1, 2008, between Metaca Corporation and Anna Rossetti |
||||
10.3+† |
Termination Letter, dated May 5, 2015 between CPI Acquisition, Inc. and Marvin Press |
||||
10.4+† |
CPI Card Group Inc. Omnibus Incentive Plan |
||||
10.5† |
Form of Stock Option Award Agreement under the CPI Card Group Inc. Omnibus Incentive Plan |
||||
10.6+† |
CPI Acquisition, Inc. Phantom Stock Plan |
||||
10.7+† |
CPI Holdings I, Inc. Amended and Restated 2007 Stock Option Plan |
||||
10.8+† |
Employment and Non-Competition Agreement, effective June 22, 2015, between CPI Acquisition, Inc. and David Brush |
||||
10.9†† |
Form of Indemnification Agreement |
||||
10.10† |
First Lien Credit Agreement, dated as of August 17, 2015, by and among CPI Card Group Inc., CPI Acquisition Inc., the lenders from time to time party thereto and the Bank of Nova Scotia, as Administrative Agent and Collateral Agent |
||||
10.11† |
Form of Director Nomination Agreement by and between CPI Card Group Inc. and the Tricor Funds |
||||
10.12† |
Form of Registration Rights Agreement by and betwen CPI Card Group Inc. and the Tricor Funds |
||||
15.1 |
Lattimore, Black, Morgan & Cain, P.C. letter re unaudited interim financial information. |
||||
16.1† |
Letter to the Securities and Exchange Commission from Ernst & Young LLP, dated May 21, 2015 |
||||
21.1† |
List of subsidiaries of CPI Card Group Inc. |
||||
23.1 |
Consent of KPMG LLP |
||||
23.2 |
Consent of KPMG LLP |
||||
23.3 |
Consent of Lattimore, Black, Morgan & Cain, P.C. |
||||
23.4† |
Consent of First Annapolis Consulting, Inc. |
||||
23.5 |
Consent of Winston & Strawn LLP (included in Exhibit 5.1) |
||||
24.1† |
Powers of Attorney |
||||
- +
- Indicates
exhibits that constitute management contracts or compensatory plans or arrangements
- *
- Indicates
to be filed by amendment.
- †
- Previously filed.