Attached files
| file | filename |
|---|---|
| EX-23.1 - EX-23.1 - At Home Group Inc. | a2226143zex-23_1.htm |
Use these links to rapidly review the document
TABLE OF CONTENTS
INDEX TO CONSOLIDATED FINANCIAL STATEMENTS
As filed with the Securities and Exchange Commission on October 6, 2015
Registration No. 333-206772
SECURITIES AND EXCHANGE COMMISSION
WASHINGTON, D.C. 20549
AMENDMENT NO. 2
TO
FORM S-1
REGISTRATION STATEMENT
UNDER
THE SECURITIES ACT OF 1933
AT HOME GROUP INC.
(Exact name of registrant as specified in its charter)
| Delaware (State or other jurisdiction of incorporation or organization) |
5719 (Primary Standard Industrial Classification Code Number) |
45-3229563 (I.R.S. Employer Identification No.) |
1600 East Plano Parkway
Plano, Texas 75074
(972) 265-6227
(Address, including zip code, and telephone number, including area code, of registrant's principal executive offices)
Judd T. Nystrom
Chief Financial Officer
At Home Group Inc.
1600 East Plano Parkway
Plano, Texas 75074
(972) 265-6227
(Name, address, including zip code, and telephone number including area code, of agent for service)
| Copies of all communications, including communications sent to agent for service, should be sent to: | ||||
Andrew B. Barkan, Esq. Fried, Frank, Harris, Shriver & Jacobson LLP One New York Plaza New York, New York 10004 (212) 859-8000 |
Mary Jane Broussard General Counsel At Home Group Inc. 1600 East Plano Parkway Plano, Texas 75074 (972) 265-6227 |
Marc D. Jaffe, Esq. Ian D. Schuman, Esq. Latham & Watkins LLP 885 Third Avenue New York, New York 10022 (212) 906-1200 |
||
Approximate date of commencement of proposed sale to the public: As soon as practicable after this Registration Statement becomes effective.
If any of the securities being registered on this Form are to be offered on a delayed or continuous basis pursuant to Rule 415 under the Securities Act of 1933, check the following box. o
If this Form is filed to register additional securities for an offering pursuant to Rule 462(b) under the Securities Act of 1933, please check the following box and list the Securities Act registration statement number of the earlier effective registration statement for the same offering. o
If this Form is a post-effective amendment filed pursuant to Rule 462(c) under the Securities Act, check the following box and list the Securities Act registration statement number of the earlier effective registration statement for the same offering. o
If this Form is a post-effective amendment filed pursuant to Rule 462(d) under the Securities Act, check the following box and list the Securities Act registration statement number of the earlier effective registration statement for the same offering. o
Indicate by check mark whether the registrant is a large accelerated filer, an accelerated filer, a non-accelerated filer, or a smaller reporting company. See the definitions of "large accelerated filer," "accelerated filer" and "smaller reporting company" in Rule 12b-2 of the Exchange Act. (Check One):
| Large accelerated filer o | Accelerated filer o | Non-accelerated filer ý | Smaller reporting company o |
CALCULATION OF REGISTRATION FEE
|
||||
| Title of Each Class of Securities to be Registered |
Proposed Maximum Aggregate Offering Price(1)(2) |
Amount of Registration Fee |
||
|---|---|---|---|---|
Common Stock, par value $0.01 per share |
$100,000,000 | $11,620(3) | ||
|
||||
- (1)
- Estimated
solely for the purpose of calculating the registration fee in accordance with Rule 457(o) under the Securities Act of 1933.
- (2)
- Includes
the offering price of common stock that may be purchased by the underwriters upon the exercise of their option to purchase additional shares.
- (3)
- Previously paid.
The Registrant hereby amends this Registration Statement on such date or dates as may be necessary to delay its effective date until the Registrant shall file a further amendment which specifically states that this Registration Statement shall thereafter become effective in accordance with Section 8(a) of the Securities Act of 1933 or until this Registration Statement shall become effective on such date as the Commission, acting pursuant to said Section 8(a), may determine.
The information in this prospectus is not complete and may be changed. We may not sell these securities until the registration statement filed with the Securities and Exchange Commission is effective. This prospectus is not an offer to sell these securities and it is not soliciting an offer to buy these securities in any jurisdiction where the offer or sale is not permitted.
SUBJECT TO COMPLETION. DATED OCTOBER 6, 2015.
Shares

At Home Group Inc.
Common Stock
This is an initial public offering of shares of common stock of At Home Group Inc. We are selling all of the shares to be sold in the offering.
Prior to this offering, there has been no public market for the common stock. The initial public offering price is expected to be between $ and $ per share. We have applied to list our common stock on the New York Stock Exchange under the symbol "HOME".
The underwriters have an option for a period of 30 days to purchase up to a maximum of additional shares of our common stock from us.
After the completion of this offering, we expect to be a "controlled company" within the meaning of the corporate governance standards of the New York Stock Exchange.
We are an "emerging growth company", as defined in Section 2(a) of the Securities Act of 1933, as amended, and will be subject to reduced reporting requirements. This prospectus complies with the requirements that apply to an issuer that is an emerging growth company.
Investing in our common stock involves risk. See "Risk Factors" beginning on page 20 to read about factors you should consider before buying shares of our common stock.
| |
Price to Public | Underwriting Discounts and Commissions(1) |
Proceeds to At Home Group Inc. |
|||
|---|---|---|---|---|---|---|
Per Share |
$ | $ | $ | |||
Total |
$ | $ | $ |
- (1)
- See "Underwriting" for additional information regarding underwriting compensation.
Delivery of the shares of common stock will be made on or about , 2015.
Neither the Securities and Exchange Commission ("SEC") nor any other regulatory body has approved or disapproved of these securities or determined if this prospectus is truthful or complete. Any representation to the contrary is a criminal offense.
| BofA Merrill Lynch | Goldman, Sachs & Co. | |
Jefferies |
Morgan Stanley |
| Evercore ISI | William Blair | Guggenheim Securities | Stifel |
The date of this prospectus is , 2015.


TABLE OF CONTENTS
You should rely only on the information contained in this prospectus and any free writing prospectus prepared by or on behalf of us that we have referred to you. Neither we nor the underwriters have authorized anyone to provide you with additional information or information different from that contained in this prospectus or in any free writing prospectus prepared by or on behalf of us that we have referred to you. If anyone provides you with additional, different or inconsistent information, you should not rely on it. Offers to sell, and solicitations of offers to buy, shares of our common stock are being made only in jurisdictions where offers and sales are permitted.
No action is being taken in any jurisdiction outside the United States to permit a public offering of common stock or possession or distribution of this prospectus in that jurisdiction. Persons who come into possession of this prospectus in jurisdictions outside the United States are required to
i
inform themselves about and to observe any restriction as to this offering and the distribution of this prospectus applicable to those jurisdictions.
This prospectus includes estimates regarding market and industry data that we prepared based on our management's knowledge and experience in the markets in which we operate, together with information obtained from various sources, including publicly available information, industry reports and publications, surveys, our customers, distributors, suppliers, trade and business organizations and other contacts in the markets in which we operate. In addition, certain market and industry data has been derived from market research prepared for us by (1) Buxton Company, a leading real estate analytics firm, which we refer to herein as "Buxton" and (2) Russell Research, Inc., a consumer research firm, which we refer to herein as "Russell Research".
In presenting this information, we have made certain assumptions that we believe to be reasonable based on such data and other similar sources and on our knowledge of, and our experience to date in, the markets for the products we distribute. Market share data is subject to change and may be limited by the availability of raw data, the voluntary nature of the data gathering process and other limitations inherent in any statistical survey of market shares. In addition, customer preferences are subject to change. Accordingly, you are cautioned not to place undue reliance on such market share data. References herein to the markets in which we conduct our business refer to the geographic metropolitan areas in which our stores are located.
We report on the basis of a 52- or 53-week fiscal year, which ends on the last Saturday in January. References to a fiscal year mean the year in which that fiscal year ends. References herein to "fiscal year 2013" or "FY2013" relate to the 52 weeks ended January 26, 2013, references herein to "fiscal year 2014" or "FY2014" relate to the 52 weeks ended January 25, 2014, references herein to "fiscal year 2015" or "FY2015" relate to the 53 weeks ended January 31, 2015 and references herein to "fiscal year 2016" relate to the 52 weeks ending January 30, 2016. References herein to "LTM" relate to the last twelve months ended August 1, 2015.
As used in this prospectus, unless the context otherwise requires, references to:
- •
- "the Company", "At Home", "we", "us" and "our" mean At Home Group Inc. and its consolidated subsidiaries;
- •
- "ABL Facility" means our $140 million senior secured asset based revolving credit facility;
- •
- "aided brand awareness" means the percentage of survey respondents who expressed knowledge of our brand when asked and "unaided brand
awareness" means the percentage of survey respondents who expressed knowledge of our brand without prompting when asked about awareness of home décor stores;
- •
- "big box", "large format" and "superstore" mean a store that is larger than 50,000 square feet in size;
- •
- "core customer" means, with respect to data discussed herein from Russell Research, a customer that spent more than $200 during the
last twelve months at our stores;
- •
- "efficiency" means our financial performance as measured by the Adjusted EBITDA profit margins that we generate in our business;
- •
- "First Lien Facility" means our $300 million senior secured first lien term loan facility;
ii
- •
- "good / better / best" means our three-tiered strategy that our buyers use to create our product assortment;
- •
- "June 2015 Refinancing" means our entry into the Term Loan Facilities and redemption in full of the Senior Secured Notes with the
proceeds of the Term Loan Facilities, which were consummated on June 5, 2015;
- •
- "net investment" means the sum of gross capital expenditure required for a new store, net working capital investment and pre-opening
expenses, less sale-leaseback proceeds, as applicable;
- •
- "net promoter score" means a management tool that is used to gauge the loyalty of customer relationships;
- •
- "new stores" means the number of stores opened during a particular period, including any relocations of existing stores during such
period;
- •
- "non-linear investment" means ongoing fixed costs in connection with our business that are not expected to grow with the size of our
business;
- •
- "pay back" and "payback period" mean, for a given store, the period of time it takes for the cumulative Store-level Adjusted EBITDA
for that store from its opening to equal our net investment in that store on a pre-tax basis;
- •
- "profitability" means our financial performance as measured by Adjusted EBITDA and Adjusted EBITDA margin;
- •
- "Second Lien Facility" means our $130 million senior secured second lien term loan facility;
- •
- "Senior Secured Notes" means our $360 million in aggregate principal amount of 10.75% senior secured notes due June 1,
2019, which were redeemed in full on June 5, 2015;
- •
- "SKU" means stock keeping unit;
- •
- "Sponsors" means investment funds affiliated with AEA Investors LP ("AEA") and Starr Investment Holdings, LLC ("Starr
Investments"), which together own a controlling interest in us; and
- •
- "Term Loan Facilities" means our First Lien Facility and our Second Lien Facility, together.
Certain financial measures presented in this prospectus, such as comparable store sales, Adjusted EBITDA and Store-level Adjusted EBITDA are not recognized under accounting principles generally accepted in the United States, which we refer to as "GAAP". We define these terms as follows:
- •
- "comparable store sales" means, for any reporting period, sales for the comparable store base, beginning with stores on the first day
of the sixteenth full fiscal month following the store's opening. When a store is being relocated, we exclude sales from that store in the calculation of comparable store sales until the first day of
the sixteenth full fiscal month after it reopens. For the fiscal years ended January 25, 2014 and January 31, 2015 and the twenty-six weeks ended July 26, 2014 and
August 1, 2015, there were 55, 60, 58 and 66 stores, respectively, in our comparable store base.
- •
- "Adjusted EBITDA" means net (loss) income before interest expense, net, loss from early extinguishment of debt, income tax (benefit) provision and depreciation and amortization, adjusted for the impact of certain other items permitted by our debt agreements, including legal
iii
- •
- "Adjusted EBITDA margin" means Adjusted EBITDA divided by net sales.
- •
- "Store-level Adjusted EBITDA" means Adjusted EBITDA, adjusted further to exclude the impact of certain corporate overhead expenses,
which we do not consider in our evaluation of the ongoing performance of our stores from period to period.
- •
- "Store-level Adjusted EBITDA margin" means Store-level Adjusted EBITDA divided by net sales.
settlements and consulting and other professional fees, costs associated with new store openings, relocation and employee recruiting incentives, management fees and expenses, stock-based compensation expense, impairment of our trade name and deferred rent.
We present Adjusted EBITDA, Adjusted EBITDA margin, Store-level Adjusted EBITDA and Store-level Adjusted EBITDA margin, which are not recognized financial measures under GAAP, because we believe they assist investors and analysts in comparing our operating performance across reporting periods on a consistent basis by excluding items that we do not believe are indicative of our core operating performance, such as interest, depreciation, amortization, loss on extinguishment of debt and taxes, as well as costs related to new store openings, which are incurred on a limited basis with respect to any particular store when opened and are not indicative of ongoing core operating performance. You are encouraged to evaluate these adjustments and the reasons we consider them appropriate for supplemental analysis. In evaluating Adjusted EBITDA and Store-level Adjusted EBITDA, you should be aware that in the future we may incur expenses that are the same as or similar to some of the adjustments in our presentation of Adjusted EBITDA and Store-level Adjusted EBITDA. Our presentation of Adjusted EBITDA and Store-level Adjusted EBITDA should not be construed as an inference that our future results will be unaffected by unusual or non-recurring items. In addition, Adjusted EBITDA, Adjusted EBITDA margin, Store-level Adjusted EBITDA and Store-level Adjusted EBITDA margin may not be comparable to similarly titled measures used by other companies in our industry or across different industries.
Management believes Adjusted EBITDA is helpful in highlighting trends in our core operating performance, while other measures can differ significantly depending on long-term strategic decisions regarding capital structure, the tax jurisdictions in which companies operate and capital investments. In addition, we utilize Adjusted EBITDA in certain calculations under our ABL Facility (defined therein as "Consolidated EBITDA") and our Term Loan Facilities (defined therein as "Consolidated Cash EBITDA"). Management believes Store-level Adjusted EBITDA is helpful in highlighting trends because it facilitates comparisons of store operating performance from period to period by excluding the impact of certain corporate overhead expenses, such as certain costs associated with management, finance, accounting, legal and other central corporate functions.
This prospectus includes trademarks and service marks owned by us, including "at home". This prospectus also contains trademarks, trade names and service marks of other companies, which are the property of their respective owners. Solely for convenience, trademarks, trade names and service marks referred to in this prospectus may appear without the ®, ™ or SM symbols, but such references are not intended to indicate, in any way, that we will not assert, to the fullest extent under applicable law, our rights or the right of the applicable licensor to these trademarks, trade names and service marks. We do not intend our use or display of other parties' trademarks, trade names or service marks to imply, and such use or display should not be construed to imply, a relationship with, or endorsement or sponsorship of us by, these other parties.
iv
This summary highlights selected information contained elsewhere in this prospectus. Because this is only a summary, it does not contain all the information that may be important to you. You should read the entire prospectus carefully, especially "Risk Factors" beginning on page 20 of this prospectus and our consolidated financial statements and related notes included elsewhere in this prospectus, before deciding to invest in our common stock.
Our Company
At Home is the leading home décor superstore based on the number of our locations and our large format stores that we believe dedicate more space per store to home décor than any other player in the industry. We are focused on providing the broadest assortment of products for every room, in every style at everyday low prices. We utilize our space advantage to out-assort our competition, offering over 50,000 SKUs throughout our stores. Our differentiated merchandising strategy allows us to identify on-trend products and then value engineer those products to provide desirable aesthetics at attractive price points for our customers. Over 70% of our products are unbranded, private label or specifically designed for us. We believe that our broad and comprehensive offering and compelling value proposition combine to create a leading destination for home décor with the opportunity to continue taking market share in a large, fragmented and growing market.
We have loyal, enthusiastic and diverse customers who are deeply passionate about, and love to decorate, their homes. According to a report prepared for us by Russell Research, a consumer research firm, our average customer typically visits an At Home store four times per year, while our core customer shops our stores more than seven times per year. Our stores are a regular destination where our core customer typically spends more than one hour per visit, providing a means to express her vision in her home often and affordably. To our customer, her home is a representation and an extension of who she is. Decorating her home is a continuous, ever evolving process that can be as simple as replacing patio cushions with a new seasonal pattern or as involved as updating the look of a whole room or the entire house. Making her feel at home while shopping At Home is our primary focus, and we strive to do so by creating an environment that is easy for her to shop, enjoy the experience and express herself through our merchandise.
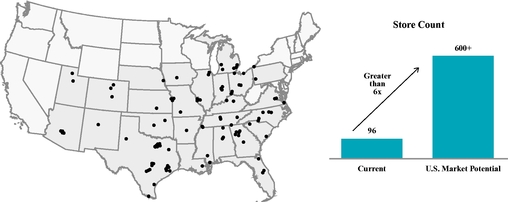
Our current store base is comprised of 96 stores across 26 states and 56 markets, averaging over 120,000 square feet per store. We utilize a flexible and disciplined real estate strategy that allows us to successfully open and operate stores from 80,000 to 200,000 square feet across a wide range of formats and markets. All of our stores that have been open since the beginning of the year are profitable, and stores that have been open for more than a year average over $6 million in net sales and realize average Store-level Adjusted EBITDA margins of 28%. Based on our internal analysis and research conducted for us by Buxton, a leading real estate analytics firm, we believe that we have the potential to expand to at least 600 stores in the United States over the long term, or over six times our current store base, although we do not currently have an anticipated timeframe to reach this potential. Due in part to our recent investments, our systems, processes and controls should be able to support up to 220 stores with limited additional investment.
1
We have developed a highly efficient operating model that seeks to drive growth and profitability while minimizing operating risk. Our merchandising, sourcing and pricing strategies generate strong and consistent performance across our product offering and throughout the entire year. Through specialized in-store merchandising and visual navigation elements, we enable a self-service model that minimizes in-store staffing needs and allows us to deliver exceptional value to our customers.
We believe that our differentiated home décor concept, flexible real estate strategy and highly efficient operating model create competitive advantages that have driven our financial success. In fiscal year 2015, we produced net sales of $498 million, Adjusted EBITDA of $97 million and a net loss of $0.4 million. For a reconciliation of Adjusted EBITDA to net (loss) income, please see "—Summary Consolidated Financial and Operating Data".
Recent financial highlights include:
- •
- Positive comparable stores sales in eight out of the last nine consecutive quarters, averaging 5.3% growth over the period;
- •
- Forty-five new stores opened in the last five fiscal years, including 16 in the last fiscal year ended January 31, 2015;
- •
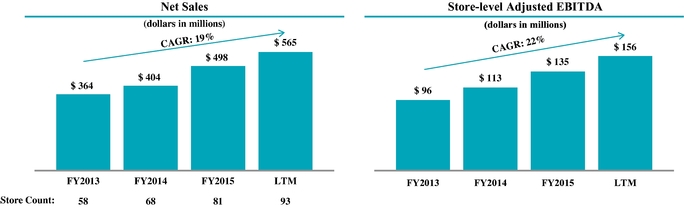
- Total net sales growth from $364 million in fiscal year 2013 to $565 million for the last twelve months ended
August 1, 2015, representing a compound annual growth rate, or CAGR, of 19%;
- •
- Store-level Adjusted EBITDA margins of 27.6% for the last twelve months ended August 1, 2015, and growth of Store-level
Adjusted EBITDA from $96 million in fiscal year 2013 to $156 million for the last twelve months ended August 1, 2015, representing a CAGR of 22%, in line with total net sales
growth; and
- •
- Adjusted EBITDA margins of 19.4% for the last twelve months ended August 1, 2015, and growth of Adjusted EBITDA from $82 million in fiscal year 2013 to $110 million for the last twelve months ended August 1, 2015, representing a CAGR of 13%, which includes significant non-linear investments in people, systems and processes to support our future growth.
Our History and Evolution
Our Company (formerly known as Garden Ridge) was founded in 1979 in Garden Ridge, Texas, a suburb of San Antonio. We quickly gained a loyal following in our Texas home market and expanded thereafter. Throughout our history, we have cultivated a passionate customer base that shops our stores for the unique, wide assortment of products offered at value price points. After our Company was acquired in 2011 by an investment group led by AEA, which included affiliates of Starr
2
Investments, we began a series of strategic investments in the business. We believe that the core strengths of our business combined with the significant investments made over the last four years position us to grow sales and expand our store base.
Key changes that have been implemented since 2011 include:
- •
- Hired seven out of the eight top executives at the Company including our current Chief Executive Officer and Chief Financial Officer,
while almost doubling our home office headcount from 110 to 195 across all functions;
- •
- Launched the At Home brand in 2014 and converted our entire store base while investing in advertising and marketing initiatives to
support the brand launch;
- •
- Expanded our assortment and broadened our appeal to include more on-trend merchandise and increased our mix of "better" and "best"
products;
- •
- Re-established a marketing function and reinstituted marketing spending to 2% of net sales in fiscal year 2015, up from nearly
zero;
- •
- Invested in our stores to create a better customer experience by refreshing all stores, improving our in-store signage and enhancing
our merchandising layout for easier navigation and improved shopability;
- •
- Invested in systems, processes and controls including new point-of-sale, or POS, and inventory allocation systems, and the automation
of our distribution center that should be able to support up to 220 potential stores with limited additional investment; and
- •
- Developed our real estate capabilities by implementing a proprietary site selection model and employing multiple financing approaches, enabling a near doubling of the store base over the last two fiscal years while increasing the first year net sales and Adjusted EBITDA performance of stores opened during fiscal year 2015 by 40% and 60%, respectively, as compared to stores opened during fiscal year 2014.
Our Competitive Strengths
Highly Differentiated Home Décor Concept
We believe our concept is highly differentiated from other home décor retailers given our broad product offering, warehouse format and customer friendly in-store experience. For most products, our superstores dedicate up to 15 times more square footage and SKUs than other home décor retailers. The size of our stores also provides us the ability to sell larger size products such as oversized area rugs, and fully-assembled products, such as decorative accent furniture and bar stools. Our stores are designed as shoppable warehouses that combine the scale of a big box format with shopper friendly features such as an interior racetrack, clear signage that enables easy navigation throughout the store and product vignettes that offer design inspiration and coordinated product ideas. We believe our customer values shopping At Home as an in-person experience through which she can see and feel the quality of our products and physically assemble her desired aesthetic. We believe we have no direct competitor, effectively competing with mass merchants and large format multi-chain retailers that dedicate only a small portion of their selling space to home décor and do not deliver a shopping experience specifically focused on the home décor customer. Additionally, we also compete with smaller format, independent or national specialty retailers that cannot match our total square footage, selection of products and diverse array of home décor styles. We believe our differentiated concept is positioning us as a leading destination for the home décor consumer and will allow us to continue taking share in a large, highly fragmented and growing market.
3
Compelling Customer Value Proposition
We believe we provide a compelling value proposition to our customers through our broad merchandise assortment, unique product offering and attractive value price points. By offering something for every room, in every style at everyday low prices, we appeal to a diverse customer base across a variety of markets.
- •
- Every Room. We offer over 50,000 SKUs across virtually all home
décor products enabling our customer to decorate any space inside or outside her home. From her bedroom to her living and dining rooms to her outside patio and garden areas, we carry
thousands of products that allow her to express her unique sense of style in any area of the home she desires. All of our products are in-stock and ready to take home, enabling a one-stop shopping
experience.
- •
- Every Style. We deliver a unique and innovative product offering that
spans all styles of home décor ranging from traditional to country and from vintage to modern. We introduce approximately 20,000 new SKUs per year, or an average of 400 new SKUs per
week, which keeps our offering fresh and exciting.
- •
- Everyday Low Prices. We value engineer products in collaboration with our suppliers to recreate the "look" that we believe our customer wants while eliminating the costly construction elements that she does not value. This design approach allows us to deliver an attractive value to our customers, as our products are typically less expensive than other branded products that have a similar look. We employ a simple everyday low pricing strategy that consistently delivers savings to our customers without the need for extensive promotions, as evidenced by 80% of our net sales occurring at full price.
Efficient Operating Model Driving Industry-Leading Profitability
We believe we have the most efficient operating model in the home décor industry, which drives our industry-leading profitability. We generate strong product margins through our extensive product offering with an everyday low pricing strategy. We have designed a store model that enables a largely self-service shopping experience and streamlines our store operations, thereby minimizing in-store staffing levels. Our disciplined yet flexible real estate strategy allows us to negotiate favorable lease terms, which average $5 per square foot in annual rental costs. Despite the significant investments we have made in our business, we continue to operate with a highly efficient home office team. All major decisions regarding merchandising, pricing, product assortment and allocation are standardized and made centrally, which supports a lean cost structure. As a result of these factors, we are able to deliver industry-leading profitability and succeed in locations where we believe other retailers cannot.
Flexible and Disciplined Real Estate Strategy Supporting Attractive Store Economics
We have developed a store model that has been successful across a number of geographic markets, population densities and real estate locations, including anchor, stand-alone or mall-enclosed locations that range between 80,000 and 200,000 square feet, averaging over 120,000 square feet per store. Our success operating stores across multiple market types and store formats allows us to be opportunistic and select locations with the most favorable investment characteristics. We are flexible in our approach and realize compelling store economics whether we lease a second generation property, purchase a second generation location or build a new store from the ground up. We believe we are one of the few growing retail concepts that actively targets larger box sizes, enabling us to obtain highly attractive real estate terms. We have also become a direct beneficiary of large, national big box retailers pruning their store portfolios and have become a preferred partner for a number of these retailers looking to quickly shed stores. All of our stores that have been open since the beginning of the year are profitable and those that have been open for more than a year average over $6 million in net sales and realize average Store-level Adjusted EBITDA margins of 28%. Over the past three fiscal years, we
4
have successfully opened 33 new stores in 27 markets, including 18 new markets. We expect our new stores to generate at least $1 million of Store-level Adjusted EBITDA in the first year of operations and pay back the net investment within two years. We believe our ability to achieve such attractive returns across a broad set of markets is a testament to the universal appeal of our concept and strongly positions us to continue to profitably open new stores.
Systematic Approach to Minimizing Operating Risk
We have designed and implemented a systematic approach to our business that is focused on driving growth and profitability while minimizing operating risk. Through this approach, we are able to deliver consistent sales and profitability growth and reduce the volatility that other big box retailers may face. Key areas of our business that are built on this approach include:
- •
- Merchandising: We have a broad assortment that delivers consistent
financial results across our product offering and reduces our reliance on any individual product, style or trend. Additionally, our store size allows merchandise to stay on the floor longer than a
typical retailer, thereby reducing the need for unplanned markdowns.
- •
- Inventory Management: We maintain strict inventory controls at the
overall company level as well as at individual stores in order to minimize markdowns. Additionally, we have a regular markdown cadence through which we clear slower moving inventory. Finally, we do
not carry over or store any of our seasonal products, ensuring that our inventory remains as relevant and fresh to our customers as possible.
- •
- Product Development and Sourcing: Our largely private label and unbranded
offering allows us to better control input costs and maintain a profitable product margin, even in the event of a markdown. We implement rigorous controls to maintain our product costs, often changing
materials and features based on fluctuations in input costs. We work with over 500 vendors and are not reliant on any single vendor, with our largest vendor representing less than 5% of our
purchases.
- •
- Store Operations: We optimize our staffing levels based on hourly sales
and traffic volumes and are able to utilize downtime to stock shelves and displays with new inventory. Additionally, we work with our vendors and internal operations teams to deploy customized
merchandising solutions such as specialized racks and displays to reduce labor needs, while creating a more pleasant shopping experience for our
customers.
- •
- Real Estate: We employ a highly analytical approach to real estate site selection with a stringent process to approve new stores and, as a result, have not closed a single store due to poor financial performance in the past decade. Our ability to negotiate favorable lease terms typically results in low square footage rents, unilateral two to three year "opt-out" clauses or short initial terms with multiple renewal options, and other features that provide us with optimal flexibility to manage our store portfolio.
Scalable Operations To Support Future Growth
We have made significant capital and non-linear operating expense investments in our business that we believe have laid the foundation for continued profitable growth. Over the past two fiscal years, we have invested $47.8 million in capital related to store maintenance, expanding our distribution center capacity and rebranding our Company. We have also invested $22.3 million in non-linear operating expenses, which include people, processes and systems, as well as $14.5 million in one-time expenses to build key capabilities to support our future growth. We believe that we are just beginning to see the benefits of these investments in our business. Our strengthened management team, new brand identity, upgraded and automated distribution center and enhanced information systems, including our inventory allocation, warehouse management and POS systems, should enable us to
5
profitably replicate our store format and differentiated shopping experience. We believe our standardized systems and processes, which rely on refined tools for store operations, inventory management, procurement, employee hiring, training and scheduling, are scalable to meet our expansion goals. We expect these infrastructure investments to support our successful operating model over a significantly expanded store base.
Exceptional Management Team and Strong Corporate Culture
We have assembled a highly experienced management team that has an average of 18 years of retail experience, has a demonstrated track record of delivering superior results and is well-positioned to scale our business. Since 2011, we have made meaningful investments in our team, hiring top executives with experience leading their respective functions at large industry-leading public retail companies including Nike, Gap, Best Buy, Advance Auto Parts, Nordstrom, TJX, Brinker International and Yum! Brands, among others. Additionally, we have built out and enhanced functional teams across finance, real estate, marketing, merchandising, information technology and store operations. We believe that our experienced management team has been able to institute rigorous, systematic processes across each of our functional areas that have resulted in strong financial performance while opening new stores. Under the leadership of our Chief Executive Officer, Lee Bird, we have developed a strong corporate culture that is focused on motivating and empowering our employees and creating a great place to work. Our entire organization is aligned with our mission to enable our customer to affordably make her house a home and realize our vision of becoming the leading home décor retailer.
Our Growth Strategies
We expect to continue our strong sales growth and leading profitability by pursuing the following strategies:
Expand Our Store Base
We believe there is a tremendous whitespace opportunity to expand in both existing and new markets in the United States and believe we have the whitespace to open at least 20 new stores per year for the foreseeable future. In fiscal year 2016, we plan to open 20 new stores, of which 16 are already open and the remaining are under construction. We plan to open at least 20 new stores in fiscal year 2017, for which we have signed letters of intent for 18 stores. Over the long term, we believe we have the potential to expand to at least 600 stores in the United States, or over six times our current footprint of 96 stores, based on our internal analysis and research conducted for us by Buxton. The rate of future growth in any particular period is inherently uncertain and is subject to numerous factors that are outside of our control. As a result, we do not currently have an anticipated timeframe to reach this potential. In addition, due in part to our recent investments, our systems, processes and controls should be able to support up to 220 stores with limited additional investment.
We have used our site selection model to score over 20,000 big box retail locations throughout the United States, which positions us to be able to act quickly as locations become available, and we have developed detailed market maps for each U.S. market that guide our deliberate expansion strategy. Over the last three years, we have opened stores in a mix of new and existing markets. New stores in existing markets have increased our total market share due to higher brand awareness. We believe there is still a considerable opportunity to continue adding locations in even our most established markets. In addition, we anticipate a limited number of relocations periodically as we evaluate our position in the market upon the impending expiration of lease terms. We have demonstrated our ability to open stores successfully in a diverse range of new markets across the country, having entered 30 new markets since 2011. Our portable concept has delivered consistent store economics across all markets, from smaller, less dense locations to larger, more heavily populated metropolitan areas.
6
Our new store model combines high average unit volumes and high Store-level Adjusted EBITDA margins with low net capital investment and occupancy costs, resulting in cash flow generation early in the life of a store. Our stores typically mature within six months of opening. We target first year annualized sales of $5 million, with Store-level Adjusted EBITDA margins of approximately 20%. Our new stores require on average $2 to $3 million of net investment, varying based on our lease, purchase or build decisions, but all with a target payback period of less than two years.
Drive Comparable Store Sales
We have achieved positive comparable store sales growth in eight out of the last nine consecutive fiscal quarters, averaging 5.3% growth over the period. We will seek to continue to drive demand and customer spend by providing a targeted, exciting product selection and a differentiated shopping experience, including the following specific strategic initiatives:
- •
- Continuously introduce new and on-trend products to appeal to a wide range of customers and improve the mix of our assortment ("good /
better / best" product offering);
- •
- Enhance inventory planning and allocation capabilities to get the right products in the right store at the right time;
- •
- Continue to strengthen our visual merchandising such as vignettes, end caps and feature tables to inspire our customers and generate
in-store demand; and
- •
- Grow the At Home brand through marketing and advertising as well as community engagements that target the home décor enthusiast to drive increased traffic to our stores.
Build the At Home Brand and Create Awareness
During fiscal year 2015, we launched the At Home brand, which we believe better communicates our positioning as the leading home décor superstore. Additionally, we re-established a marketing function and reinstated marketing spend to highlight our new brand, broad product offering and compelling value proposition. Given the newness and relatively limited awareness of the At Home brand, we believe there is a significant opportunity to grow our brand and build awareness for existing and new markets.
While we have a net promoter score that is among the highest of our home décor peers, according to Russell Research, At Home has an aided brand awareness in our existing and newly entered markets that is approximately half of many of our specialty and mass merchant competitors. Our low awareness level, coupled with the high loyalty and customer satisfaction we have among existing customers, underscores what we believe is a significant growth opportunity to convert potential new customers into loyal brand enthusiasts.
To address this opportunity, we intend to allocate our marketing spend across a range of strategic initiatives in order to highlight our differentiated value proposition. We will involve both traditional media platforms and unique, targeted strategies aimed at reaching the home décor enthusiast. Our marketing and brand building efforts will be enhanced by engaging in an ongoing dialogue with our customers through growing social and mobile channels. We believe we have an opportunity to leverage our growing social media and online presence to drive brand excitement and increase store visits within existing and new markets.
Through our extensive customer research, we have learned that many home décor enthusiasts browse online for ideas, inspiration and general product information before visiting specific stores. Over the next year, we intend to enable our customers to view our product assortment online with robust search functionality and a mobile-friendly website. This upcoming enhancement will focus on an inspirational shopping experience that showcases decorating ideas to drive traffic into our stores. In the
7
future, we may consider providing various levels of e-commerce capabilities but will focus on initiatives that maintain our industry-leading profitability.
We believe increased brand awareness will not only drive traffic to existing stores, but also strengthen our business as we expand into new markets.
Our Industry
We compete in the large, growing and highly fragmented home furnishings and décor market. The industry had total sales of approximately $180 billion in 2014 according to Home Furnishings News, and has enjoyed stable growth at an annual rate of approximately 3% per year over the last five years according to Euromonitor. We attribute this growth to the industry's broad consumer appeal, coupled with strong positive tailwinds from a growing housing market, rising property values and home sales and growing disposable incomes. This growth trend is expected to continue, with a forecasted growth rate of approximately 4% over the next five years according to Euromonitor.
Unlike other big box retail categories (e.g., office supplies, home improvement and electronics) where the top retailers hold a significant share of the overall market, the top three retailers in the home décor and furnishings category make up less than 25% of the market share. We believe we are uniquely positioned in the market, focused on providing the broadest assortment of home décor products at value price points. In addition, the size of our stores enables us to carry a broad offering of fully assembled, larger merchandise, unlike many of our competitors, who are space constrained from providing a similar offering. We believe our focus on a broad assortment at value price points also uniquely positions us for those times when the industry is growing below trend, as it allows us to gain share in a fragmented market while also supporting our customer's passion about, and love for, decorating her home.
The home furnishings and décor market includes a diverse set of categories and retail formats. However, we believe that we do not have a direct competitor, as no retailer matches our size, scale or scope of the product assortment that we offer at everyday low prices. While we have no direct competitor, certain products that we offer do compete with offerings by companies in the following segments:
- •
- Specialty Home Décor / Organization and Furniture retailers (e.g., Bed Bath & Beyond, The Container
Store, Home Goods, Pier 1 Imports, Havertys, Ethan Allen and Williams-Sonoma) have stores that are typically smaller (approximately 10,000 to 30,000 square feet) and we believe their home
décor product offering is much narrower than ours and often is priced at a substantial premium.
- •
- Mass / Club retailers (e.g., Wal-Mart Stores, Target Corporation and Costco) only dedicate a small portion of their selling
spaces to home décor products and focus on the most popular SKUs.
- •
- Arts / Craft / Hobby retailers (e.g., Michaels Stores, Jo-Ann Stores and Hobby Lobby) target customers who prefer to create the
product themselves, whereas our customer prefers finished products.
- •
- Discount retailers (e.g., Big Lots and Tuesday Morning) have a home décor product offering that is typically limited, offered at deep discounts and often dependent on their ability to purchase close-out or liquidated merchandise from manufacturers.
8
- •
- Home Improvement retailers (e.g., Home Depot and Lowe's) have a product offering that is primarily focused on home improvement
and repair items, although we do compete with them in seasonal and outdoor products.
- •
- Online home décor retailers (e.g., Wayfair) offer a broad selection of products in home furnishings and décor that is typically weighted toward more expensive items (typically $200 to $300 per transaction) that can justify the high shipping, returns and damage costs and overall economics of their model. Conversely, we focus primarily on the attractive decorative accents and accessories portion of the market, generating an average basket of approximately $60, where we can employ our efficient operating model to generate attractive economics. For similar products, we believe we are able to offer comparable breadth of assortment to online retailers. In addition, according to Russell Research, while consumers may browse options online, they strongly value the opportunity to experience the look-and-feel of products in stores before they purchase them.
Our Sponsors
We were acquired by our Sponsors in 2011 pursuant to a stock purchase agreement with our former equity holders. Upon completion of this offering, our Sponsors will collectively own approximately % of our shares of common stock. See "—Organizational Structure" and "Principal Stockholders".
AEA
AEA is one of the most experienced global private investment firms. Founded in 1968, AEA currently manages over $6 billion of capital for an investor group that includes former and current chief executive officers of major multinational corporations, family groups, and institutional investors from around the world. With a staff of approximately 70 investment professionals and offices in New York, Stamford, London, Munich and Shanghai, AEA focuses on investing in companies in the consumer products/retail, industrial products, specialty chemicals and related services sectors.
In addition to At Home, representative current and former consumer/retail portfolio companies include 24 Hour Fitness, Brand Networks, Shoes for Crews, Acosta Sales & Marketing, Burt's Bees, Tampico Beverages and Graco Children's Products.
Starr Investments
Starr Investment Holdings, LLC is an investment adviser with more than $5 billion of assets under management. Starr Investments manages capital on behalf of a wide range of institutions and family offices with a focus on long-term private investments. Starr Investments seeks to invest in businesses with high-performing and experienced management teams, high barriers to entry, differentiated service offerings, high margins and strong free cash flow profiles. Starr Investments principally focuses on four industry verticals: business services, financial services, healthcare services and consumer.
Summary Risk Factors
We are subject to a number of risks, including risks that may prevent us from achieving our business objectives or that may adversely affect our business, financial condition, results of operations, cash flows and prospects. You should carefully consider the risks discussed in the section entitled "Risk Factors", including the following risks, before investing in our common stock:
- •
- general economic factors may materially adversely affect our business, revenue and profitability;
- •
- consumer spending on home décor products could decrease or be displaced by spending on other activities as driven by a number of factors;
9
- •
- failure to successfully implement our growth strategy on a timely basis or at all, which could harm our growth and results of
operations;
- •
- failure to manage our inventory effectively and inability to satisfy changing consumer demands and preferences, which could materially
adversely impact our operations; and
- •
- the loss of, or disruption in, or our inability to efficiently operate our distribution network could have a materially adverse impact on our business.
Implications of Being an Emerging Growth Company
As a company with less than $1.0 billion in revenue during our last fiscal year, we qualify as an "emerging growth company" as defined in the Jumpstart Our Business Startups Act of 2012, or JOBS Act. An emerging growth company may take advantage of specified reduced reporting and other requirements that are otherwise applicable generally to public companies. These provisions include:
- •
- we are required to have only two years of audited financial statements and only two years of related Management's Discussion and
Analysis of Financial Condition and Results of Operations disclosure;
- •
- we are not required to engage an auditor to report on our internal controls over financial reporting pursuant to Section 404(b)
of the Sarbanes-Oxley Act of 2002 (the "Sarbanes-Oxley Act");
- •
- we are not required to comply with any requirement that may be adopted by the Public Company Accounting Oversight Board (the "PCAOB")
regarding mandatory audit firm rotation or a supplement to the auditor's report providing additional information about the audit and the financial statements (i.e., an auditor discussion and
analysis);
- •
- we are not required to submit certain executive compensation matters to stockholder advisory votes, such as "say-on-pay",
"say-on-frequency" and "say-on-golden parachutes"; and
- •
- we are not required to disclose certain executive compensation related items such as the correlation between executive compensation and performance and comparisons of the chief executive officer's compensation to median employee compensation.
We may take advantage of these provisions until the last day of our fiscal year following the fifth anniversary of the completion of this offering or such earlier time that we are no longer an emerging growth company. We would cease to be an emerging growth company if we have more than $1.0 billion in annual revenue, have more than $700 million in market value of our common stock held by non-affiliates or issue more than $1.0 billion of non-convertible debt over a three-year period. We may choose to take advantage of some but not all of these reduced burdens. We have elected to adopt the reduced disclosure with respect to financial statements and the related Management's Discussion and Analysis of Financial Condition and Results of Operations disclosure. As a result of this election, the information that we provide stockholders may be different than you might get from other public companies.
The JOBS Act permits an emerging growth company like us to take advantage of an extended transition period to comply with new or revised accounting standards applicable to public companies. We are choosing to irrevocably "opt out" of this provision and, as a result, we will comply with new or revised accounting standards as required when they are adopted.
Our Corporate Information
At Home Group Inc. was incorporated as a Delaware corporation on June 30, 2011 under the name GRD Holding I Corporation. Our principal executive office is located at 1600 East Plano Parkway, Plano, Texas 75074 and our telephone number at that address is (972) 265-6227. We maintain a website on the Internet at www.athome.com. The information contained on, or that can be accessed through, our website is not a part of, and should not be considered as being incorporated by reference into, this prospectus. For a chart illustrating our organizational structure, see "—Organizational Structure".
10
The chart below summarizes our ownership and corporate structure after giving effect to this offering, assuming no exercise of the underwriters' option to purchase additional shares.
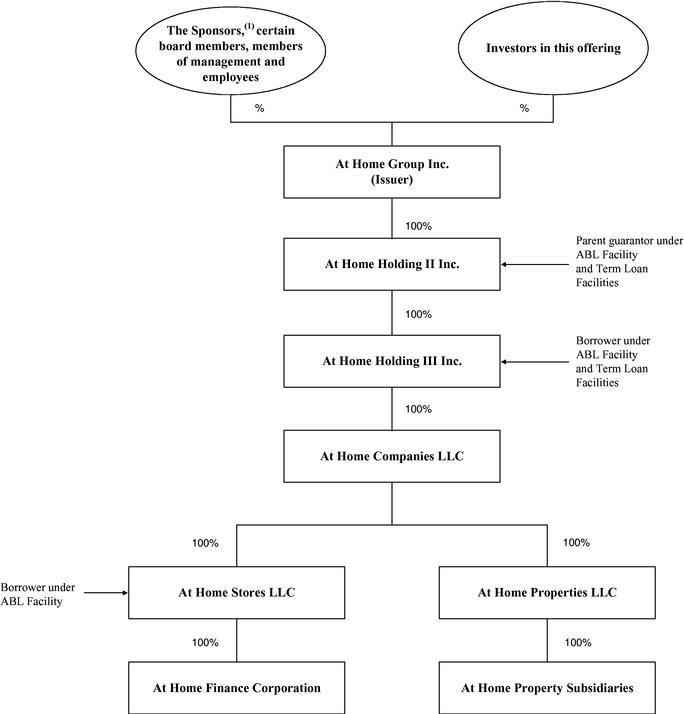
- (1)
- Upon the completion of this offering, the Sponsors will beneficially own approximately % of our outstanding common stock.
11
Common stock offered by us |
shares. | |
Common stock to be outstanding |
shares. | |
Option to purchase additional shares |
The underwriters have an option to purchase up to an aggregate of additional shares of common stock from us. The underwriters can exercise this option at any time within 30 days from the date of this prospectus. | |
Use of proceeds |
We estimate that the net proceeds to us from this offering, after deducting underwriting discounts and commissions and estimated offering expenses, will be approximately $ million, assuming the shares are offered at $ per share (the midpoint of the price range set forth on the cover page of this prospectus). We intend to use the net proceeds from this offering to repay approximately $ million of indebtedness under the Second Lien Facility. See "Use of Proceeds". | |
Dividend policy |
We do not expect to pay any dividends on our common stock for the foreseeable future. See "Dividend Policy". | |
New York Stock Exchange symbol |
"HOME". | |
LOYAL3 platform |
At our request, the underwriters have reserved for sale, at the initial public offering price, up to % of the shares of common stock offered hereby to our directors, officers, employees, customers, certain business and other associates of ours and individual investors through the LOYAL3 platform. See "Underwriting". | |
Controlled company |
Following this offering, we will be a "controlled company" within the meaning of the corporate governance rules of the New York Stock Exchange. | |
Risk factors |
Investing in our common stock involves a high degree of risk. See "Risk Factors" beginning on page 20 of this prospectus for a discussion of factors you should carefully consider before investing in our common stock. |
The number of shares of common stock to be outstanding after this offering excludes:
- •
- shares of common stock issuable upon the exercise of options outstanding under our stock option plan
as of
August 1, 2015 at a weighted average exercise price of $ per share; and
- •
- shares of common stock reserved for future issuance under our new omnibus incentive plan.
Unless otherwise indicated, all information contained in this prospectus:
- •
- assumes an initial public offering price of $ per share, which is the midpoint of the price range set
forth on the cover page of this prospectus;
- •
- assumes the underwriters' option to purchase additional shares will not be exercised;
- •
- gives effect to
a -for- stock split effected
on , 2015; and
- •
- gives effect to our amended and restated certificate of incorporation and our amended and restated bylaws, which will be in effect prior to the consummation of this offering.
12
Summary Consolidated Financial and Operating Data
Our summary consolidated statement of operations, cash flow and balance sheet data presented below as of and for the fiscal years ended January 25, 2014 and January 31, 2015 has been derived from our audited consolidated financial statements included elsewhere in this prospectus. Our summary consolidated statement of operations, cash flow and balance sheet data presented below as of and for the twenty-six weeks ended July 26, 2014 and August 1, 2015 has been derived from the unaudited consolidated financial statements included elsewhere in this prospectus. The unaudited consolidated financial statements were prepared on a basis consistent with that used in preparing our audited consolidated financial statements and include all adjustments, consisting of normal and recurring items, that we consider necessary for a fair presentation of our financial position and results of operations for the unaudited periods.
Our summary consolidated financial information presented below for the twelve months ended August 1, 2015 has been derived by adding our financial information for the fiscal year ended January 31, 2015 to the financial information for the twenty-six weeks ended August 1, 2015, and then subtracting the financial information for the twenty-six weeks ended July 26, 2014. We believe that the presentation of financial information for the twelve months ended August 1, 2015 is useful to investors because it presents information about how our business has performed in the twelve month period immediately preceding the date of our most recent interim financial statements, which allows investors to review our performance trends over a period consisting of our four most recent consecutive fiscal quarters, reflecting, to the extent possible, the impact of our recent expansion and our rebranding initiative completed during the first nine months of fiscal year 2015, while compensating for any seasonal factors that might impact results in any particular quarter.
The historical results presented below are not necessarily indicative of the results to be expected for any future period. The summary consolidated financial and operating data presented below should be read in conjunction with "Management's Discussion and Analysis of Financial Condition and Results of Operations" and our consolidated financial statements and related notes included elsewhere in this prospectus.
| |
Fiscal Year Ended | Twenty-six Weeks Ended | Twelve Months Ended |
|||||||||||||
|---|---|---|---|---|---|---|---|---|---|---|---|---|---|---|---|---|
| |
January 25, 2014 |
January 31, 2015 |
July 26, 2014 |
August 1, 2015 |
August 1, 2015 |
|||||||||||
| |
(dollars in thousands) |
|||||||||||||||
Statement of Operations Data: |
||||||||||||||||
Net sales |
$ | 403,966 | $ | 497,733 | $ | 229,915 | $ | 297,224 | $ | 565,042 | ||||||
Cost of sales |
272,021 | 335,617 | 150,617 | 197,147 | 382,147 | |||||||||||
| | | | | | | | | | | | | | | | | |
Gross profit |
131,945 | 162,116 | 79,298 | 100,077 | 182,895 | |||||||||||
Operating Expenses |
||||||||||||||||
Selling, general and administrative expenses |
74,255 | 110,503 | 44,246 | 61,295 | 127,552 | |||||||||||
Impairment of trade name |
37,500 | — | — | — | — | |||||||||||
Depreciation and amortization |
1,262 | 5,310 | 3,788 | 933 | 2,455 | |||||||||||
| | | | | | | | | | | | | | | | | |
Total operating expenses |
113,017 | 115,813 | 48,034 | 62,228 | 130,007 | |||||||||||
Operating income |
18,928 | 46,303 | 31,264 | 37,849 | 52,888 | |||||||||||
Interest expense, net |
41,152 | 42,382 | 20,553 | 19,768 | 41,597 | |||||||||||
Loss on extinguishment of debt |
— | — | — | 36,046 | 36,046 | |||||||||||
| | | | | | | | | | | | | | | | | |
(Loss) income before income taxes |
(22,224 | ) | 3,921 | 10,711 | (17,965 | ) | (24,755 | ) | ||||||||
Income tax provision |
59 | 4,357 | 14,782 | 26,377 | 15,952 | |||||||||||
| | | | | | | | | | | | | | | | | |
Net loss |
$ | (22,283 | ) | $ | (436 | ) | $ | (4,071 | ) | $ | (44,342 | ) | $ | (40,707 | ) | |
| | | | | | | | | | | | | | | | | |
| | | | | | | | | | | | | | | | | |
| | | | | | | | | | | | | | | | | |
13
| |
Fiscal Year Ended | Twenty-six Weeks Ended | Twelve Months Ended |
|||||||||||||
|---|---|---|---|---|---|---|---|---|---|---|---|---|---|---|---|---|
| |
January 25, 2014 |
January 31, 2015 |
July 26, 2014 |
August 1, 2015 |
August 1, 2015 |
|||||||||||
| |
(dollars in thousands except per share amounts) |
|||||||||||||||
Per Share Data: |
||||||||||||||||
Net loss per common share: |
||||||||||||||||
Basic |
$ | (56.17 | ) | $ | (1.10 | ) | $ | (10.26 | ) | $ | (111.78 | ) | $ | (102.62 | ) | |
Diluted |
$ | (56.17 | ) | $ | (1.10 | ) | $ | (10.26 | ) | $ | (111.78 | ) | $ | (102.62 | ) | |
Weighted average shares outstanding: |
||||||||||||||||
Basic |
396,674 | 396,674 | 396,674 | 396,674 | 396,674 | |||||||||||
Diluted |
396,674 | 396,674 | 396,674 | 396,674 | 396,674 | |||||||||||
Cash Flow Data: |
||||||||||||||||
Net cash provided by (used in) operating activities |
$ | 35,695 | $ | 15,321 | $ | (7,701 | ) | $ | (1,935 | ) | $ | 21,087 | ||||
Net cash used in investing activities |
(30,310 | ) | (100,098 | ) | (59,719 | ) | (23,271 | ) | (63,650 | ) | ||||||
Net cash (used in) provided by financing activities |
(4,032 | ) | 84,512 | 67,460 | 26,651 | 43,703 | ||||||||||
Net increase (decrease) in cash and cash equivalents |
1,353 | (265 | ) | 40 | 1,445 | 1,140 | ||||||||||
Balance Sheet Data (as of end of period): |
||||||||||||||||
Cash and cash equivalents |
$ | 4,971 | $ | 4,706 | $ | 5,011 | $ | 6,151 | $ | 6,151 | ||||||
Inventories, net |
109,125 | 142,256 | 130,524 | 167,550 | 167,550 | |||||||||||
Property and equipment, net |
111,786 | 220,084 | 182,058 | 249,398 | 249,398 | |||||||||||
Net working capital(1) |
46,006 | 66,155 | 63,017 | 74,650 | 74,650 | |||||||||||
Total assets |
834,921 | 980,347 | 907,422 | 1,026,067 | 1,026,067 | |||||||||||
Long-term debt(2) |
372,351 | 378,261 | 372,073 | 444,856 | 444,856 | |||||||||||
Total shareholders' equity |
357,101 | 360,916 | 355,138 | 318,867 | 318,867 | |||||||||||
Other Financial and Operating Data: |
||||||||||||||||
Total stores at end of period |
68 | 81 | 72 | 93 | 93 | |||||||||||
New stores opened(3) |
10 | 16 | 6 | 12 | 22 | |||||||||||
Comparable store sales |
(0.4 | )% | 8.3 | % | 8.1 | % | 3.7 | % | 5.9 | % | ||||||
Store-level Adjusted EBITDA(4) |
$ | 113,273 | $ | 134,881 | $ | 66,922 | $ | 88,111 | $ | 156,070 | ||||||
Store-level Adjusted EBITDA margin(4) |
28.0 | % | 27.1 | % | 29.1 | % | 29.6 | % | 27.6 | % | ||||||
Adjusted EBITDA(4) |
$ | 87,296 | $ | 97,311 | $ | 51,538 | $ | 64,027 | $ | 109,800 | ||||||
Adjusted EBITDA margin(4) |
21.6 | % | 19.6 | % | 22.4 | % | 21.5 | % | 19.4 | % | ||||||
| |
Fiscal Year Ended January 31, 2015 |
Twenty-six Weeks Ended August 1, 2015 |
|||||
|---|---|---|---|---|---|---|---|
| |
(dollars in thousands, except share and per share data) |
||||||
Pro Forma Statement of Operations Data: |
|||||||
Pro forma net income(5) |
$ | $ | |||||
Pro forma weighted average shares outstanding(6) |
|||||||
Basic |
|||||||
Diluted |
|||||||
Pro forma net income per share(5)(6) |
|||||||
Basic |
|||||||
Diluted |
|||||||
14
- (1)
- Net
working capital is defined as current assets (excluding cash and cash equivalents) less current liabilities (excluding the current portion of long-term
debt and revolving line of credit).
- (2)
- Long-term
debt consists of the current and long-term portions of the Senior Secured Notes, First Lien Facility and mortgage loans. The current portion of
long-term debt, per the accompanying unaudited condensed consolidated balance sheet as of August 1, 2015 included elsewhere in this prospectus, includes $0.3 million for the current
portion of financing obligations that has been excluded from this presentation of long-term debt.
- (3)
- Represents
new stores opened during each period presented, including relocations of existing stores as follows: zero during the fiscal year ended
January 25, 2014; two during the fiscal year ended January 31, 2015; one during the twenty-six weeks ended July 26, 2014; zero during the twenty-six weeks ended August 1,
2015; and one for the twelve months ended August 1, 2015.
- (4)
- We
present Adjusted EBITDA, Adjusted EBITDA margin, Store-level Adjusted EBITDA and Store-level Adjusted EBITDA margin, which are not recognized financial
measures under GAAP, because we believe they assist investors and analysts in comparing our operating performance across reporting periods on a consistent basis by excluding items that we do not
believe are indicative of our core operating performance, such as interest, depreciation, amortization, loss on extinguishment of debt and taxes, as well as costs related to new store openings, which
are incurred on a limited basis with respect to any particular store when opened and are not indicative of ongoing core operating performance. You are encouraged to evaluate these adjustments and the
reasons we consider them appropriate for supplemental analysis. In evaluating Adjusted EBITDA and Store-level Adjusted EBITDA, you should be aware that in the future we may incur expenses that are the
same as or similar to some of the adjustments in our presentation of Adjusted EBITDA and Store-level Adjusted EBITDA. Our presentation of Adjusted EBITDA and Store-level Adjusted EBITDA should not be
construed as an inference that our future results will be unaffected by unusual or non-recurring items. In addition, Adjusted EBITDA, Adjusted EBITDA margin, Store-level Adjusted EBITDA and
Store-level Adjusted EBITDA margin may not be comparable to similarly titled measures used by other companies in our industry or across different industries.
- Management
believes Adjusted EBITDA is helpful in highlighting trends in our core operating performance, while other measures can differ
significantly depending on long-term strategic decisions regarding capital structure, the tax jurisdictions in which companies operate and capital investments. In addition, we utilize Adjusted EBITDA
in certain calculations under our ABL Facility (defined therein as "Consolidated EBITDA") and our Term Loan Facilities (defined herein as "Consolidated Cash EBITDA"). Management believes Store-level
Adjusted EBITDA is helpful in highlighting trends because it facilitates comparisons of store operating performance from period to period by excluding the impact of certain corporate overhead
expenses, such as certain costs associated with management, finance, accounting, legal and other central corporate functions.
- We also include information concerning Adjusted EBITDA margin, which is calculated as Adjusted EBITDA divided by net sales. We present Adjusted EBITDA margin because it is used by management as a performance measure to judge the level of Adjusted EBITDA that is generated from net sales. In addition, we include information concerning Store-level Adjusted EBITDA margin, which is calculated as Store-level Adjusted EBITDA divided by net sales. We present Store-level Adjusted EBITDA margin because it is used by management as a performance measure to judge the level of Store-level Adjusted EBITDA that is generated from net sales.
15
- Adjusted
EBITDA, Adjusted EBITDA margin, Store-level Adjusted EBITDA and Store-level Adjusted EBITDA margin have their limitations as analytical
tools and you should not consider them in isolation, or as a substitute for analysis of our results as reported under GAAP. Some of these limitations include:
- •
- Adjusted EBITDA, Adjusted EBITDA margin, Store-level Adjusted EBITDA and Store-level Adjusted EBITDA margin do not
reflect every expenditure, future requirements for capital expenditures or contractual commitments;
- •
- Adjusted EBITDA and Store-level Adjusted EBITDA do not reflect changes in our working capital needs;
- •
- Adjusted EBITDA and Store-level Adjusted EBITDA do not reflect the significant interest expense, or the amounts necessary
to service interest or principal payments, on our outstanding debt;
- •
- Adjusted EBITDA and Store-level Adjusted EBITDA do not reflect income tax expense, and because the payment of taxes is
part of our operations, tax expense is a necessary element of our costs and ability to operate;
- •
- Adjusted EBITDA and Store-level Adjusted EBITDA do not reflect expenditures associated with new store openings;
- •
- although depreciation and amortization are eliminated in the calculation of Adjusted EBITDA and Store-level Adjusted
EBITDA, the assets being depreciated and amortized will often have to be replaced in the future, and Adjusted EBITDA and Store-level Adjusted EBITDA do not reflect any costs of such replacements;
- •
- non-cash compensation is and will remain a key element of our overall long-term incentive compensation package, although
we exclude it as an expense when evaluating our ongoing operating performance for a particular period; and
- •
- Adjusted EBITDA and Store-level Adjusted EBITDA do not reflect the impact of earnings or charges resulting from matters
we consider not to be indicative of our ongoing operations.
- We compensate for these limitations by relying primarily on our GAAP results and using Adjusted EBITDA, Adjusted EBITDA margin, Store-level Adjusted EBITDA and Store-level Adjusted EBITDA margin only as supplemental information.
16
- The following is a reconciliation of our net (loss) income to EBITDA (excluding loss on extinguishment of debt), Adjusted EBITDA and Store-level Adjusted EBITDA:
| |
Fiscal Year Ended | Twenty-six Weeks Ended | Twelve Months Ended |
||||||||||||||||
|---|---|---|---|---|---|---|---|---|---|---|---|---|---|---|---|---|---|---|---|
| |
January 26, 2013 |
January 25, 2014 |
January 31, 2015 |
July 26, 2014 |
August 1, 2015 |
August 1, 2015 |
|||||||||||||
| |
(in thousands) |
||||||||||||||||||
Net loss |
$ | (9,749 | ) | $ | (22,283 | ) | $ | (436 | ) | $ | (4,071 | ) | $ | (44,342 | ) | $ | (40,707 | ) | |
Interest expense, net |
39,837 | 41,152 | 42,382 | 20,553 | 19,768 | 41,597 | |||||||||||||
Loss on extinguishment of debt |
20,744 | — | — | — | 36,046 | 36,046 | |||||||||||||
Income tax (benefit) provision |
(1,558 | ) | 59 | 4,357 | 14,782 | 26,377 | 15,952 | ||||||||||||
Depreciation and amortization(a) |
12,912 | 13,132 | 23,317 | 10,418 | 13,194 | 26,093 | |||||||||||||
| | | | | | | | | | | | | | | | | | | | |
EBITDA |
$ | 62,186 | $ | 32,060 | $ | 69,620 | $ | 41,682 | $ | 51,043 | $ | 78,981 | |||||||
Legal settlements and consulting and other professional services(b) |
3,609 | 2,874 | 4,633 | 931 | 1,947 | 5,649 | |||||||||||||
Costs associated with new store openings(c) |
1,070 | 2,023 | 6,848 | 1,749 | 4,332 | 9,431 | |||||||||||||
Relocation and employee recruiting costs(d) |
321 | 4,442 | 2,928 | 912 | 237 | 2,253 | |||||||||||||
Management fees and expenses(e) |
3,805 | 3,690 | 3,596 | 1,775 | 1,835 | 3,656 | |||||||||||||
Stock-based compensation expense(f) |
292 | 4,373 | 4,251 | 2,108 | 2,292 | 4,435 | |||||||||||||
Impairment of trade name(g) |
— | 37,500 | — | — | — | — | |||||||||||||
Deferred rent(h) |
1,730 | 1,695 | 3,554 | 1,737 | 2,420 | 4,237 | |||||||||||||
Other(i) |
8,567 | (1,361 | ) | 1,881 | 644 | (79 | ) | 1,158 | |||||||||||
| | | | | | | | | | | | | | | | | | | | |
Adjusted EBITDA |
$ | 81,580 | $ | 87,296 | $ | 97,311 | $ | 51,538 | $ | 64,027 | $ | 109,800 | |||||||
| | | | | | | | | | | | | | | | | | | | |
Corporate overhead expenses(j) |
14,146 | 25,977 | 37,570 | 15,384 | 24,084 | 46,270 | |||||||||||||
| | | | | | | | | | | | | | | | | | | | |
Store-level Adjusted EBITDA |
$ | 95,726 | $ | 113,273 | $ | 134,881 | $ | 66,922 | $ | 88,111 | $ | 156,070 | |||||||
| | | | | | | | | | | | | | | | | | | | |
| | | | | | | | | | | | | | | | | | | | |
| | | | | | | | | | | | | | | | | | | | |
- (a)
- Includes
the portion of depreciation and amortization expenses that are classified as cost of sales in the statements of operations included elsewhere in
this prospectus.
- (b)
- Primarily
consists of (i) litigation settlement charges and related legal fees for prior claims that have concluded and (ii) consulting and
other professional fees with respect to completed projects to enhance our accounting and finance capabilities.
- (c)
- Non-capital
expenditures associated with opening new stores. We anticipate that we will continue to incur cash costs as we open new stores in the future.
- (d)
- Primarily
reflects (i) relocation expenses associated with moving our corporate headquarters from Houston to Plano and related relocation bonuses and (ii)
employee recruiting costs incurred in connection with the build-out of our management team.
- (e)
- Reflects
management fees paid to our Sponsors. After this offering, our Sponsors will no longer receive management fees from us.
- (f)
- Consists of non-cash stock-based compensation expense related to stock option awards.
17
- (g)
- Reflects
the impairment of the Garden Ridge trade name as a result of our rebranding initiative.
- (h)
- Consists
of non-cash deferred rent, which better reflects the current rent obligations of the business.
- (i)
- Other
adjustments include amounts our management believes are not representative of our ongoing operations,
including:
- •
- for fiscal year 2013, a $5.6 million exit payment to former management;
- •
- for fiscal year 2014, an insurance reimbursement of $1.6 million; and
- •
- for fiscal year 2015, asset retirements related to our rebranding of $0.6 million and $0.4 million for a store
relocation.
- (j)
- Reflects corporate overhead expenses, which are not directly related to the profitability of our stores, to facilitate comparisons of store operating performance from period to period. Corporate overhead expenses, which are a component of selling, general and administrative expenses, are comprised of various home office general and administrative expenses such as payroll expenses, occupancy costs, marketing and advertising, and consulting and professional fees.
- (5)
- Pro
forma to give effect to the following transactions as if they had occurred as of the beginning of the periods presented: (i) the June 2015
Refinancing, (ii) this offering, (iii) the repayment of $ million of indebtedness from the proceeds of this offering as described in "Use of Proceeds" and
(iv) each of the related adjustments mentioned below.
- Adjustments to net income for the fiscal year ended January 31, 2015 and the twenty-six weeks ended August 1, 2015 reflect (i) a $ and $ decrease in interest expense, respectively (see the reconciliation of historical interest expense to pro forma interest expense below), (ii) a $ and $ increase in income tax expense, respectively, due to higher income before taxes relating to our pro forma net income and (iii) the removal of $ and $ of the Sponsors' management fees, respectively.
The following is a reconciliation of historical net (loss) income to pro forma net income for the fiscal year ended January 31, 2015 and the twenty-six weeks ended August 1, 2015:
| |
Fiscal Year Ended January 31, 2015 |
Twenty-six Weeks Ended August 1, 2015 |
|||||
|---|---|---|---|---|---|---|---|
| |
(in thousands) |
||||||
Net (loss) income |
$ | $ | |||||
Decrease in interest expense, net(a) |
|||||||
Increase in income tax expense(b) |
|||||||
Removal of management fee(c) |
|||||||
| | | | | | | | |
Pro forma net income |
$ | $ | |||||
| | | | | | | | |
| | | | | | | | |
| | | | | | | | |
- (a)
- See
the reconciliation of historical interest expense to pro forma interest expense below.
- (b)
- Reflects an increase of $ and $ , respectively, in income tax expense for the fiscal year ended January 31, 2015 and the twenty-six weeks ended August 1, 2015 for the related tax effects of the pro forma adjustments. The tax impact is based upon an increase of pro forma income before taxes of $ and $ , respectively, and a statutory tax rate of % and %, respectively.
18
- (c)
- Reflects the removal of $ and $ , respectively, of management fees for the fiscal year ended January 31, 2015 and the twenty-six weeks ended August 1, 2015. In connection with this offering, the management agreement will be terminated, see "Certain Relationships and Related Party Transactions".
The following is a reconciliation of historical interest expense to pro forma interest expense for the fiscal year ended January 31, 2015 and the twenty-six weeks ended August 1, 2015.
| |
Fiscal Year Ended January 31, 2015 |
Twenty-six Weeks Ended August 1, 2015 |
|||||
|---|---|---|---|---|---|---|---|
| |
(in thousands) |
||||||
Interest expense, net |
$ | $ | |||||
Decrease resulting from the June 2015 Refinancing(a) |
|||||||
Decrease resulting from use of proceeds of this offering(b) |
|||||||
| | | | | | | | |
Pro forma interest expense, net |
$ | $ | |||||
| | | | | | | | |
| | | | | | | | |
| | | | | | | | |
- (a)
- Reflects
redemption in full of the Senior Secured Notes with the proceeds of the Term Loan Facilities.
- (b)
- Assumes repayment of $ million of indebtedness under the Second Lien Facility, which bears interest at a rate of % per annum, from the proceeds of this offering, as if it had occurred as of the beginning of the periods presented.
- (6)
- Gives effect to (i) the -for- stock split effected on , 2015 and (ii) the shares of our common stock to be issued by us in this offering. Pro forma basic net income per share consists of pro forma net income divided by the pro forma basic weighted average common shares outstanding. Pro forma diluted net income per share consists of pro forma net income divided by the pro forma diluted weighted average common shares outstanding.
19
You should carefully consider the risks described below, together with all of the other information included in this prospectus, before making an investment decision. Our business, financial condition and results of operations could be materially and adversely affected by any of these risks or uncertainties. In that case, the trading price of our common stock could decline, and you may lose all or part of your investment.
Risks Relating to Our Business
General economic factors may materially adversely affect our business, revenue and profitability.
General conditions in the United States and global economy that are beyond our control may materially adversely affect our business and financial performance. As a retailer that is dependent upon consumer discretionary spending for home décor products, our customers may allocate less money for discretionary purchases as a result of increased levels of unemployment, reduced consumer disposable income, higher interest rates, higher fuel and other energy costs, higher tax rates and other changes in tax laws, foreclosures, bankruptcies, falling home prices, reduced availability of consumer credit, higher consumer debt levels, a decline in consumer confidence, inflation, deflation, recession, an overall economic slowdown and other factors that influence consumer spending. Any reduced demand for the merchandise that we sell could result in a significant decline in customer traffic and sales and decreased inventory turnover. Therefore, if economic conditions worsen, there may be a material adverse impact on our business, revenue and profitability.
In addition, our costs and expenses could be materially adversely impacted by general economic factors such as higher interest rates, higher fuel and other energy costs, higher transportation costs, higher commodity costs, higher costs of labor, insurance and healthcare, increased rental expense, inflation in other costs, higher tax rates and other changes in the tax law and changes in other laws and regulations. The economic factors that affect our operations also affect the operations and economic viability of our suppliers from whom we purchase goods, a factor that can result in an increase in the cost to us of merchandise we sell to our customers.
Volatility or disruption in the financial markets could materially adversely affect our business and the trading price of our common stock.
We rely on stable and efficient financial markets. Any disruption in the credit and capital markets could adversely impact our ability to obtain financing on acceptable terms. Volatility in the financial markets could also result in difficulties for financial institutions and other parties that we do business with, which could potentially affect our ability to access financing under our existing arrangements. Although we generally generate funds from our operations and our existing credit facilities to pay our operating expenses and fund our capital expenditures, our ability to continue to meet these cash requirements over the long term may require access to additional sources of funds, including equity and debt capital markets, and market volatility and general economic conditions may adversely affect our ability to access capital markets. In addition, the inability of our vendors to access capital and liquidity with which to maintain their inventory, production levels and product quality and to operate their businesses, or the insolvency of our vendors, could lead to their failure to deliver merchandise. If we are unable to purchase products when needed, our sales could be materially adversely impacted. Accordingly, volatility or disruption in the financial markets could impair our ability to execute our growth strategy and could have a material adverse effect on the trading price of our common stock.
Consumer spending on home décor products could decrease or be displaced by spending on other activities as driven by a number of factors.
Consumer spending on home décor products could decrease or be displaced by spending on other activities as driven by a number of factors including:
- •
- shifts in behavior away from home decorating in favor of other products or activities, such as fashion, media or electronics;
20
- •
- general economic conditions and other factors that affect consumer discretionary spending;
- •
- natural disasters, including hurricanes, tornadoes, floods, droughts, heavy snow, ice or rain storms, which disrupt the
ability of consumers to continue spending on home décor products;
- •
- man-made disasters, such as terrorism or war, as well as other national and international security concerns;
and
- •
- other matters that influence consumer confidence and spending.
Total consumer spending may not continue to increase at historical rates due to slowed population growth and shifts in population demographics, and it may not increase in certain product markets given changes in consumer interests. Further, as we expand into new markets, we may not accurately predict consumer preferences in that market, which could result in lower than expected sales. If consumer spending on home décor products decline, our results of operations could be materially adversely affected.
We may not be able to successfully implement our growth strategy on a timely basis or at all, which could harm our growth and results of operations.
Our growth is dependent on our ability to open profitable new stores. Our ability to increase the number of our stores will depend in part on the availability of existing big box retail stores or store sites that meet our specifications. We may face competition from other retailers for suitable locations and we may also face difficulties in negotiating leases on acceptable terms. In addition, a lack of available financing on terms acceptable to real estate developers or a tightening credit market may adversely affect the retail sites available to us. Rising real estate costs and acquisition, construction and development costs and available lease financing could also inhibit our ability to open or acquire new stores.
Opening or acquiring stores involves certain risks, including constructing, furnishing, supplying and staffing a store in a timely and cost-effective manner and accurately assessing the demographic or retail environment for a particular location, as well as addressing any environmental issues related to such locations. We cannot predict whether new stores will be successful. Our future sales at new stores may not meet our expectations, which could adversely impact our return on investment. For example, the costs of opening and operating new stores may offset the increased sales generated by the additional stores. Therefore, there can be no assurance that our new stores will generate sales levels necessary to achieve store-level profitability or profitability comparable to that of existing stores. New stores also may face greater competition and have lower anticipated sales volumes relative to previously opened stores during their comparable years of operation. In addition, a significant portion of our management's time and energy may be consumed with issues related to store expansion and we may be unable to hire a sufficient number of qualified store personnel or successfully integrate the new stores into our business. Furthermore, our vendors may be unable to meet the increased demand of additional stores in a timely manner. We cannot guarantee that we will be able to obtain and distribute adequate merchandise to new stores or maintain adequate warehousing and distribution capability at acceptable costs.
In addition, our expansion in new and existing markets may present competitive, distribution, merchandising and regulatory challenges that differ from our current challenges, including competition among our stores, diminished novelty of our store design and concept, added strain on our distribution center, additional information to be processed by our information technology systems and diversion of management attention from operations. New stores in new markets, where we are less familiar with the population and are less well-known, may face different or additional risks and increased costs compared to stores operating in existing markets or new stores in existing markets. For example, we may need to increase marketing and advertising expenditures in new or smaller markets in which we have less store density. Additionally, we may not accurately predict consumer preferences in new markets, which could result in lower than expected sales. Expansion into new markets could also bring us into direct
21
competition with retailers with whom we have no past experience as direct competitors. To the extent that we are not able to meet these new challenges, our sales could decrease and our operating costs could increase. Furthermore, our margins may be impacted in periods in which incremental expenses are incurred as a result of new store openings. Additionally, although our systems, processes and controls currently should be able to support a store base of up to 220 potential stores with limited additional investment, which is over two times our current store base, any unanticipated failure of or inability to support our growing store base could have a material adverse effect on our business. Therefore, there can be no assurance that we will be successful in opening, acquiring or operating any new stores on a profitable basis.
Accordingly, we cannot assure you that we will achieve our planned growth or, even if we are able to grow our store base as planned, that any new stores will perform as planned. If we fail to successfully implement our growth strategy, we will not be able to sustain the growth in sales and profits that we expect, which would likely have an adverse impact on the price of our common stock.
Failure to manage our inventory effectively and inability to satisfy changing consumer demands and preferences could materially adversely impact our operations.
Due to the nature of our business, we make decisions regarding merchandise several months in advance of each of the seasons in which such merchandise will be sold, particularly with respect to our merchandise that is manufactured, purchased and imported from countries around the world. We must maintain sufficient inventory levels to operate our business successfully. However, if we misjudge consumer preferences or demands, we could have excess inventory that may need to be held for a long period of time, written down or discarded in order to clear excess inventory, especially seasonal and holiday merchandise. Conversely, if we underestimate consumer demand, we may not be able to provide certain products in a timely manner to our customers in order to meet their demand, which can result in lost sales. Either event could have a material adverse impact on our business, financial condition and results of operations. In addition, we are currently in the process of upgrading to a new inventory planning and allocation system. If the new inventory planning and allocation system is unsuccessful, our ability to properly allocate inventory to stores could be adversely affected.
There can be no assurance that we will be able to continue to offer assortments of products that appeal to our customers or that we will satisfy changing consumer demands and preferences in the future. Accordingly, our business, financial condition and results of operations could be materially adversely affected if:
- •
- we miscalculate either the market for the merchandise in our stores or our customers' purchasing habits;
- •
- consumer demand unexpectedly shifts away from the merchandise we offer or if there are unanticipated shifts in consumer
preferences in some seasons; or
- •
- we are unable to anticipate, identify and respond to changing consumer demands or emerging trends, including shifts in the popularity of certain products or increased consumer demand for more enhanced customer service and assistance, home delivery or online sales and services.
In addition, inventory shrinkage (inventory theft, loss or damage) rates could negatively impact our financial results. Furthermore, failure to control merchandise returns could also adversely affect our business. We have established a provision for estimated merchandise returns based upon historical experience and other known factors. However, if actual returns are greater than those projected by management, additional reductions of revenue could be recorded in the future. In addition, to the extent that returned merchandise is damaged or otherwise not appealing to our customers, we may not receive full retail value from the resale or liquidation of the returned merchandise.
Our business model currently relies on purchasing all inventory centrally through our home office in Plano, Texas. At this office, all product samples are developed and/or received and reviewed; in addition, all purchase orders are placed, fulfilled and allocated from the same location. Major
22
catastrophic events such as natural disasters, localized labor issues or wages increases, fire or flooding, malfunction or disruption of the information systems, a disruption in communication services, power outages or shipping interruptions could delay or otherwise adversely affect inventory purchasing or allocation, as well as the ultimate distribution of inventory to our stores and customers. Such disruptions could have a negative impact on our sales and results of operations. Our business model of central purchasing could also fail to account for differences in consumer preferences by market. In such cases, and where our focus of providing the broadest assortment of products for every room similarly did not account for differences in consumer preferences by market, our sales and results of operations could be adversely affected.
The loss of, or disruption in, or our inability to efficiently operate our distribution network could have a materially adverse impact on our business.
We operate a single cross-dock distribution center in Plano, Texas, which services all of our stores, as well as a single warehouse in Garland, Texas. The majority of our inventory is shipped directly from suppliers to our distribution center where the inventory is processed and then shipped to our stores. Only mattresses and some food items are shipped directly to stores. We rely in large part on the orderly operation of this receiving and distribution process, which depends on our automated distribution system, adherence to shipping schedules and effective management of our distribution network. If complications arise with our distribution facility or if the facility or the warehouse (or a significant portion of inventory located there) is severely damaged or destroyed, our ability to receive and deliver inventory on a timely basis will be significantly impaired. There can be no assurance that disruptions in operations due to natural or man-made disasters, fire, flooding, terrorism or other catastrophic events, system failure, labor disagreements or shipping problems will not result in delays in the delivery of merchandise to our stores. Such delays could materially adversely impact our business. In addition, we could incur significantly higher costs and longer lead times associated with distributing merchandise to our stores during the time it takes for us to reopen or replace our distribution center. Moreover, our business interruption insurance may not be adequate to cover or compensate us for any losses that may occur. In addition, our distribution center will, with limited additional investment, have the capacity to support up to 220 potential stores. To the extent that we grow to larger than 220 stores, we will need to expand our current distribution center and/or add new distribution capabilities.
We rely upon various means of transportation primarily through third parties, including shipments by air, sea, rail and truck, to deliver products to our distribution center from vendors and from our distribution center to our stores, as well as for direct shipments from vendors to stores. Labor shortages or capacity constraints in the transportation industry, disruptions to the national and international transportation infrastructure, fuel shortages or transportation cost increases (such as increases in fuel costs or port fees) could materially adversely affect our business and operating results, particularly as we receive and deliver our seasonal and holiday merchandise.
Adverse events could have a greater impact on us than if our operations were in more dispersed geographical regions.
We currently operate 96 stores in 26 states, primarily in the South Central, Southeastern and Midwestern regions of the United States, including 22 stores in Texas. In addition, we operate a single distribution center and a single warehouse in Texas, which services all of our stores. Accordingly, the effect on us of adverse events in these regions, especially in Texas, such as weather (including hurricanes, tornadoes, floods, droughts, heavy snow, ice or rain storms), natural or man-made disasters, catastrophic events, terrorism, blackouts, widespread illness or unfavorable regional economic conditions, may be greater than if our operations or inventory were more geographically dispersed throughout the country or abroad. Such events could result in physical damage to or destruction or disruption of one or more of our properties, physical damage to or destruction of our inventory, the closure of one or more stores, the lack of an adequate workforce in parts or all of our operations, supply chain disruptions, data and communications disruptions and the inability of our customers to shop in our stores.
23
In addition, increases in our selling, general and administrative expenses due to overhead costs could affect our profitability more negatively than if we had a larger store base. One or more unsuccessful new stores, or a decline in sales or profitability at an existing store, will have a more significant effect on our results of operations than if we had a larger store base.
We are subject to a number of risks because we import a significant portion of our merchandise.
Approximately 55% of our merchandise was directly imported from foreign countries such as China, Hong Kong, Belgium and Taiwan during fiscal year 2015. In addition, many of our domestic vendors purchase a portion of their products from foreign sources. For example, we purchase merchandise from domestic vendors that is imported from China or that is manufactured in China and assembled in the United States. Currently, we do not employ any resources on the ground in Asia to manage our procurement process and various vendor relationships. Instead, we often rely on trading companies to handle sourcing and logistics with Asian factories.
Foreign sourcing subjects us to a number of risks generally associated with doing business abroad such as the following:
- •
- long lead times;
- •
- work stoppages and strikes;
- •
- delays in shipment, shipping port and ocean carrier constraints;
- •
- freight cost increases;
- •
- product quality issues;
- •
- raw material shortages and factory consolidations;
- •
- employee rights issues and other social concerns;
- •
- epidemics and natural disasters;
- •
- political instability, international conflicts, war, threats of war, terrorist acts or threats, especially threats to
foreign and U.S. ports and piracy;
- •
- economic conditions, including inflation;
- •
- the imposition of tariffs, duties, quotas, taxes, import and export controls and other trade restrictions;
- •
- governmental policies and regulations; and
- •
- the status of trade relations with foreign countries, including the loss of "most favored nation" status with the United States for a particular foreign country.
If any of these or other factors were to cause disruptions or delays in supply from the countries in which our vendors or the suppliers of our vendors are located, our inventory levels may be reduced or the cost of our products may increase unless and until alternative supply arrangements could be made. Merchandise purchased from alternative sources may be of lesser quality or more expensive than the merchandise we currently purchase abroad. Any shortages of merchandise (especially seasonal and holiday merchandise), even if temporary, could result in missed opportunities, reducing our sales and profitability.
In addition, reductions in the value of the U.S. dollar or fluctuations in the value of foreign currencies could ultimately increase the prices that we pay for our products. We have not hedged our currency risk in the past and do not currently anticipate doing so in the future. All of our products manufactured overseas and imported into the United States are subject to duties collected by the U.S. Customs Service. We may be subjected to additional tariffs, duties, quotas, taxes, significant monetary penalties and other trade sanctions, the seizure and forfeiture of the products we are attempting to import or the loss of import privileges, if we or our suppliers are found to be in violation of U.S. laws and regulations applicable to the importation of our products. To the extent that any foreign manufacturers from whom we purchase products directly or indirectly employ labor, environmental or other business practices that vary from those commonly accepted in the United States, we could be hurt by any resulting negative publicity or, in some cases, potential claims of liability.
24
Additionally, the cost of labor and wage taxes have increased in China, which means we are at risk of higher costs associated with goods manufactured in China. Significant increases in these and other costs may increase the cost of goods manufactured in China, which could have a material adverse effect on our margins and profitability.
Because of our international operations, we could be adversely affected by violations of the U.S. Foreign Corrupt Practices Act and similar worldwide anti-bribery and anti-kickback laws.
We source a majority of our products abroad. The U.S. Foreign Corrupt Practices Act and other similar laws and regulations generally prohibit companies and their intermediaries from making improper payments to non-U.S. officials for the purpose of obtaining or retaining business. While our policies mandate compliance with these anti-bribery laws, we cannot assure you that we will be successful in preventing our employees or other agents from taking actions in violation of these laws or regulations. Such violations, or allegations of such violations, could disrupt our business and result in a material adverse effect on our financial condition, results of operations and cash flows.
Our recent rebranding may not be successful.
During fiscal year 2015, we launched a significant rebranding initiative through which we spent over $20 million in capital and expenses to change our brand and corporate name and convert and refresh all of our stores. There is no assurance that our rebranding initiative will be successful or result in a positive return on investment. In addition, we have a limited operating history under the At Home brand.
We believe that maintaining and enhancing our brand is integral to our business and to the implementation of our strategies for expanding our business. According to Russell Research, At Home has 21% unaided brand awareness in existing markets, 15% unaided brand awareness in newly entered markets and less than 0.5% unaided brand awareness in potential new markets. Therefore, we could be required to devote significant additional resources to advertising and marketing, which could have an adverse impact on our operations.
We are subject to risks associated with leasing substantial amounts of space.
We lease certain of our retail properties, our distribution center and our corporate office. The profitability of our business is dependent on operating our current store base with favorable margins, opening and operating new stores at a reasonable profit, renewing leases for stores in desirable locations and, if necessary, identifying and closing underperforming stores. We lease a significant number of our store locations, ranging from short-term to long-term leases. Typically, a large portion of a store's operating expense is the cost associated with leasing the location.
The operating leases for our retail properties, distribution center and corporate office expire at various dates through 2035. A number of the leases have renewal options for various periods of time at our discretion. We are typically responsible for taxes, utilities, insurance, repairs and maintenance for these retail properties. Rent expense for the fiscal years ended January 25, 2014 and January 31, 2015 totaled approximately $37.9 million and $42.9 million, respectively. Our future minimum rental commitments for all operating leases in existence as of January 31, 2015 for fiscal year 2016 is approximately $44.8 million and total approximately $377.3 million for fiscal years 2017 through 2035. We expect that many of the new stores we open will also be leased to us under operating leases, which will further increase our operating lease expenditures and require significant capital expenditures. We depend on cash flows from operations to pay our lease expenses and to fulfill our other cash needs. If our business does not generate sufficient cash flow from operating activities, and sufficient funds are not otherwise available to us from borrowings under our ABL Facility or other sources, we may not be able to service our lease expenses or fund our other liquidity and capital needs, which would materially affect our business.
25
Over time current store locations may not continue to be desirable because of changes in demographics within the surrounding area or a decline in shopping traffic, including traffic generated by other nearby stores. Although we have the right to terminate some of our leases under specified conditions by making certain payments (typically within two to three years after opening a store), we may not be able to terminate a particular lease if or when we would like to do so. If we decide to close stores, we are generally required to either continue to pay rent and operating expenses for the balance of the lease term or, for certain locations, pay exercise rights to terminate, which in either case could be expensive. Even if we are able to assign or sublease vacated locations where our lease cannot be terminated, we may remain liable on the lease obligations if the assignee or sublessee does not perform.
In addition, when leases for the stores in our ongoing operations expire, we may be unable to negotiate renewals, either on commercially acceptable terms, or at all, which could cause us to close stores in locations that may be desirable. We may be unable to relocate these stores cost-effectively or at all and there can be no assurance that any relocated stores will be successful.
We are subject to risks associated with our sale-leaseback strategy.
From time to time, we engage in sale-leaseback transactions. The net proceeds from such transactions have been used to reduce outstanding debt and fund future capital expenditures for new store development. However, the sale-leaseback market may cease to be a reliable source of additional cash flows for us in the future if capitalization rates become less attractive, other unfavorable market conditions develop or the perceived value of our owned property declines. For example, should the sale-leaseback market require significantly higher yields (which may occur as interest rates rise), we may not enter into sale-leaseback transactions, which could adversely affect our ability to reduce outstanding debt and fund capital expenditures for future store development.
We operate in a highly competitive retail environment.
The retail business is highly competitive. The marketplace for home décor products is highly fragmented as many different retailers compete for market share by using a variety of store formats and merchandising strategies, dedicating a portion of their selling space to a limited selection of home décor, seasonal and holiday merchandise. Although we are the only big box concept solely dedicated to the home décor space, for all of our major products we compete with a diverse group of retailers, including mass merchants (such as Target and Wal-Mart), home improvement stores (such as Home Depot and Lowe's), craft retailers (such as Hobby Lobby, Jo-Ann Stores and Michaels Stores), home specialty/décor retailers (such as Bed Bath & Beyond, The Container Store, Home Goods and Pier 1 Imports), as well as various other small, independent retailers. In addition, to a lesser extent, we compete with Internet-based retailers, which competition could intensify in the future.
We compete with these and other retailers for customers, retail locations, management and other personnel. Some of our competitors are larger and have greater resources, more customers and greater store brand recognition. They may secure better terms from vendors, adopt more aggressive pricing and devote more resources to technology, distribution and marketing. Competitive pressures or other factors could cause us to lose customers, sales and market share, which may require us to lower prices, increase marketing and advertising expenditures or increase the use of discounting or promotional campaigns, each of which could materially adversely affect our margins and could result in a decrease in our operating results and profitability. We cannot guarantee that we will continue to be able to compete successfully against existing or future competitors. Further, although we do not currently engage in e-commerce, there is no assurance that we will not in the future, and the use of e-commerce by our competitors could have a material adverse effect on our business. Expansion into markets served by our competitors, entry of new competitors, expansion of existing competitors into our markets or the adoption by competitors of innovative store formats and retail sale methods,
26
including e-commerce, could cause us to lose market share and could be detrimental to our business, financial condition and results of operations.
We face risks related to our substantial indebtedness.
As of , 2015, after giving effect to the application of proceeds from this offering as set forth under "Use of Proceeds", including repayment of indebtedness under of the Second Lien Facility, we would have had total outstanding debt of $ million. Our substantial leverage could adversely affect our ability to raise additional capital to fund our operations, limit our ability to react to changes in the economy or our industry, expose us to interest rate risk associated with our variable rate debt and prevent us from meeting our obligations under our ABL Facility and Term Loan Facilities. Our substantial indebtedness could have important consequences to us, including:
- •
- making it more difficult for us to satisfy our obligations with respect to our debt, and any failure to comply with the
obligations under our debt instruments, including restrictive covenants, could result in an event of default under the agreements governing our indebtedness increasing our vulnerability to general
economic and industry conditions;
- •
- requiring a substantial portion of our cash flow from operations to be dedicated to the payment of principal and interest
on our debt, thereby reducing our ability to use our cash flow to fund our operations, capital expenditures, selling and marketing efforts, product development, future business opportunities and other
purposes;
- •
- exposing us to the risk of increased interest rates as substantially all of our borrowings are at variable rates;
- •
- restricting us from making strategic acquisitions;
- •
- limiting our ability to obtain additional financing for working capital, capital expenditures, product development, debt
service requirements, acquisitions, and general corporate or other purposes; and
- •
- limiting our ability to plan for, or adjust to, changing market conditions and placing us at a competitive disadvantage compared to our competitors who may be less highly leveraged.
The occurrence of any one of these events could have an adverse effect on our business, financial condition, results of operations, and ability to satisfy our obligations under our indebtedness.
We and our subsidiaries may be able to incur substantial additional indebtedness in the future, subject to the restrictions contained in the credit agreements governing our ABL Facility and Term Loan Facilities.
The ABL Facility and Term Loan Facilities impose significant operating and financial restrictions on us and our subsidiaries that may prevent us from pursuing certain business opportunities and restrict our ability to operate our business.
The credit agreements governing our ABL Facility and Term Loan Facilities contain covenants that restrict our and our subsidiaries' ability to take various actions, such as:
- •
- incur or guarantee additional indebtedness or issue certain disqualified or preferred stock;
- •
- pay dividends or make other distributions on, or redeem or purchase, any equity interests or make other restricted
payments;
- •
- make certain acquisitions or investments;
- •
- create or incur liens;
- •
- transfer or sell assets;
27
- •
- incur restrictions on the payments of dividends or other distributions from our restricted subsidiaries;
- •
- alter the business that we conduct;
- •
- enter into transactions with affiliates; and
- •
- consummate a merger or consolidation or sell, assign, transfer, lease or otherwise dispose of all or substantially all of our assets.
The restrictions in the credit agreements governing our ABL Facility and Term Loan Facilities also limit our ability to plan for or react to market conditions, meet capital needs or otherwise restrict our activities or business plans and adversely affect our ability to finance our operations, enter into acquisitions or to engage in other business activities that could be in our interest.
In addition, our ability to borrow under the ABL Facility is limited by the amount of our borrowing base. Any negative impact on the elements of our borrowing base, such as accounts receivable and inventory could reduce our borrowing capacity under the ABL Facility.
We are dependent upon the services of our senior management and our buyers.
We are dependent on the services, abilities and experiences of our senior management team. Any loss or interruption of the services of our senior management, or any general instability in the composition of our senior management team, could significantly reduce our ability to effectively manage our operations. Lee Bird, our Chief Executive Officer, joined us in December 2012 and, together with our senior management team, has played an instrumental role in developing and executing our business and operating strategies, which we believe are critical to our ability to maintain strong margins. Therefore, the loss of Mr. Bird's services, or any members of our senior management, could have a material adverse impact on our business, operating results and profitability and there can be no assurance that we will be able to find appropriate replacements for our senior management as needed. In addition, we have recently hired certain members of our management team who are relatively new to our business and have not worked as a team with other members of management for a significant period of time. Therefore, there can be no assurance that any new members of our management team will be able to successfully execute our business and operating strategies or continue to follow the same strategies.
In addition, a number of our buyers have been with us for many years and have developed a deep understanding of our business and our customers. The market for buyers is highly competitive and it may be difficult to find suitable replacements if we lose any of our buyers. If we are unable to find suitable replacements, we may experience difficulties in selecting and sourcing merchandise, which could materially adversely impact our business, revenue and profitability.
Failure to attract and retain quality employees could materially adversely affect our performance.
Our performance depends on attracting and retaining quality people at all levels, including corporate, stores, the distribution center and other areas. Many of our store employees are in entry level or part-time positions with historically high rates of turnover. Our ability to meet our labor needs while controlling labor costs is subject to external factors such as unemployment levels, prevailing wage rates, minimum wage legislation, changing demographics, health and other insurance costs and governmental labor and employment requirements. In the event of changes in the federal or state minimum wage, living wage requirements or changes in other wage or workplace regulations, including, for example, health care or employee leave regulations, if our overall compensation and benefits fail to remain competitive, then the quality of our workforce could decline, while increasing our costs could impair our profitability. If we do not continue to attract and retain quality employees, our performance could be materially adversely affected.
28
Although none of our employees are currently covered under collective bargaining agreements, there can be no assurance that our employees will not elect to be represented by labor unions in the future. If some or all of our workforce were to become unionized and collective bargaining agreement terms were significantly different from our current compensation arrangements or work practices, it could have a material adverse effect on our business, financial condition and results of operations.
Difficulties with our vendors may adversely impact our business.
Our performance depends on our ability to purchase merchandise at sufficient levels and at competitive prices from vendors who can deliver products in a timely and efficient manner and in compliance with our vendor standards and all applicable laws and regulations. We currently have over 500 vendor relationships. Generally, we do not have any long-term purchase agreements or other contractual assurances of continued supply, pricing or access to new products, and any vendor could discontinue selling to us at any time. Historically, we have not relied on any single vendor for our products and have not had difficulties replacing vendors for various products we sell. However, in the future there is no assurance that we will continue to be able to acquire desired merchandise in sufficient quantities or on terms acceptable to us, or be able to develop relationships with new vendors to replace any discontinued vendors. Our inability to acquire suitable merchandise in the future or our failure to replace any one or more vendors may have a material adverse effect on our business, results of operations and financial condition. In addition, any significant change in the payment terms that we have with our suppliers could adversely affect our liquidity.
Many of our suppliers are small firms that produce a limited number of items. These smaller vendors generally have limited resources, production capacities and operating histories, and some of our vendors have limited the distribution of their merchandise in the past. Accordingly, these vendors may be susceptible to cash flow issues, downturns in economic conditions, production difficulties, quality control issues and difficulty delivering agreed-upon quantities on schedule and in compliance with regulatory requirements. If a vendor fails to deliver on its commitments, whether due to financial difficulties or other reasons, we could experience merchandise out-of-stocks that could lead to lost sales, especially with respect to seasonal and holiday merchandise. In addition, there is no assurance that we would be able, if necessary, to return product to these vendors, obtain refunds of our purchase price or obtain reimbursement or indemnification from any of our vendors should we so desire, and from time to time, we may be in litigation with one or more vendors. Many of these suppliers require extensive advance notice of our requirements in order to supply products in the quantities we need. This long lead time requires us to place orders far in advance of the time when certain products will be offered for sale, exposing us to shifts in consumer demand and discretionary spending.
Our business is moderately seasonal and a weak fourth fiscal quarter could have a material adverse effect on our operating results for the entire fiscal year.
Our business is moderately seasonal, with a meaningful portion of our sales dedicated to seasonal and holiday merchandise. Due to the importance of our peak sales periods, which include the fall and winter holiday seasons, the fourth fiscal quarter has historically contributed, and is expected to continue to contribute, significantly to our operating results for the entire fiscal year. In anticipation of increased sales activity in the fourth fiscal quarter, we incur significant additional expense prior to and during this period, which we may finance with additional short-term borrowings. These expenses may include the acquisition of additional inventory, seasonal staffing needs and other similar items. As a result, any factors negatively affecting us during the fourth fiscal quarter, including adverse weather and unfavorable economic conditions, could have a material adverse effect on our results of operations for the entire fiscal year.
29
Our quarterly operating results may fluctuate substantially and historical quarterly operating results may not be a meaningful indicator of future performance.
Our quarterly results of operations have fluctuated in the past and may fluctuate significantly in the future as a result of a variety of factors, many outside of our control, including:
- •
- general economic and political conditions;
- •
- the mix of merchandise sold;
- •
- shifts in consumer tastes and changes in demand for the products that we offer in our stores;
- •
- calendar shifts of holiday or seasonal periods;
- •
- the timing of new store openings and the level of pre-opening expenses associated with new stores;
- •
- the amount and timing of sales contributed by new stores;
- •
- store closings or relocations and costs related thereto;
- •
- expansion of existing or entry of new competitors into our markets;
- •
- pricing and other actions taken by our competitors;
- •
- changes in promotions, advertising or other actions taken by us or our existing or possible new competitors;
- •
- the timing and level of markdowns;
- •
- delays in the flow of merchandise to our stores;
- •
- changes in our operating expenses;
- •
- changes in commodity prices and the cost of fuel;
- •
- foreign exchange rates;
- •
- litigation;
- •
- adverse weather conditions in our markets, particularly on weekends;
- •
- natural or man-made disasters;
- •
- the timing of income tax refunds to our customers;
- •
- the timing or elimination of certain state and local tax holidays; and
- •
- changes in other tenants or landlords or surrounding geographic circumstances in the areas in which we are located.
Any of these events could have a material adverse effect on our business, financial condition and operating results for the fiscal quarter in which such event occurs as well as for the entire fiscal year. Therefore, period-to-period comparisons of historical quarterly operating results may not be a meaningful indicator of future performance.
We may not be able to protect our important intellectual property and we could incur substantial costs if we are subject to claims that our operations infringe on the proprietary rights of others.
We rely on our proprietary intellectual property, including trademarks, to market, promote and sell our products in our stores, particularly our At Home private label products. We monitor and
30
protect against activities that might infringe, dilute or otherwise violate our trademarks and other intellectual property and rely on the trademark and other laws of the United States. However, we may be unable to prevent third parties from using our intellectual property without our authorization. To the extent we cannot protect our intellectual property, unauthorized use and misuse of our intellectual property could harm our competitive position and have a material adverse effect on our financial condition, cash flows or results of operations.
Additionally, we cannot be certain that we do not or will not in the future infringe on the intellectual property rights of third parties. From time to time, we have been subject to claims from third parties that we have infringed upon their intellectual property rights and we face the risk of such claims in the future. Any intellectual property infringement claims against us could be costly, time-consuming, harmful to our reputation or result in injunctive or other equitable relief that may require us to make changes to our business, any of which could have a material adverse effect on our financial condition, cash flows or results of operations.
Increases in commodity prices and supply chain costs could materially adversely affect our results of operations.
Various commodities are used in our merchandise, such as petroleum, resin, copper, steel, cotton and lumber. These commodities are subject to inflation, price fluctuations and other market disturbances, including supply shortages. Increases in commodity prices or the costs related to our supply chain and distribution network, including currency exchange rates, tariffs, labor, fuel and other transportation costs, could have a material adverse effect on our gross margin, expenses and results of operations. Due to the uncertainty of these price fluctuations and our strategy to maintain everyday low prices, we may not be able to pass some or all of these increased costs on to our customers. Even if we are able to pass these increased costs on to our customers, we may not be able to do so on a timely basis, our gross margins could decline and we may not be able to implement other price increases for our merchandise.
If we are required to make significant investments in advertising, marketing or promotions, our margins and profitability could materially decline.
In general, we employ an everyday low pricing strategy that avoids high-low pricing and promotions and allows us to minimize advertising and marketing expenses incurred by other retailers. However, there is no assurance that we can continue to be successful without significant advertising, marketing and promotions, particularly as we open stores in new markets. We spent over $20 million in capital and expenses in connection with our rebranding initiative during fiscal year 2015 and may need to incur additional expenses to promote our new brand. In addition, if we choose to invest in advertising, marketing and promotions in the future, there is no assurance that such efforts will be successful or result in a positive return on investment. Therefore, if we are required to make significant investments in advertising, marketing or promotions and related expenditures, our margins and profitability could materially decline even if sales increase.
Any online services or e-commerce activities that we may launch in the future may require substantial investment and may not be successful.
We do not currently engage in e-commerce and have a limited online presence through our website and other forms of social media. However, as part of our growth strategy, we may expand our online services and could engage in e-commerce activities in the future, which may require substantial investment. The success of any online services or e-commerce business would depend, in part, on factors over which we may not control. We would need to successfully respond to changing consumer preferences and buying trends relating to online or e-commerce usage. We would also be vulnerable to increased risks and uncertainties including: changes in required technology interfaces; website downtime and other technical failures; costs and technical issues related to upgrading website software; computer
31
viruses; changes in applicable federal and state regulations; security breaches; consumer privacy concerns; and keeping up to date with competitive technology trends, including the use of new or improved technology, creative user interfaces and other online or e-commerce marketing tools. In addition, any e-commerce platform may be unprofitable, cannibalize sales from our existing stores or not be able to compete successfully against other Internet-based retailers who sell similar merchandise. Our failure to successfully respond to these risks and uncertainties might adversely affect sales in any e-commerce business that we establish in the future and could damage our reputation and brand. Further, in the event that we engage in e-commerce in the future, we will need to establish a shipping and delivery system for items purchased online, for which we do not currently have adequate capability. Our business could be adversely affected if we are not able to successfully develop and integrate such a shipping and delivery system in connection with any e-commerce business in which we may engage in the future.
Disruptions to our information systems, or our failure to adequately support, maintain and upgrade these systems, could negatively impact our operations and financial results.
We depend on our information technology systems for many aspects of our business. We have made significant investments in information technology, including investments in systems and applications for finance and accounting functions, supply chain management software for retail operations and data warehouse management systems and an automated distribution system for our distribution center operations. We purchase our inventory through a centralized inventory management system that operates for the entire chain. Merchandise is bar-coded, enabling management to control inventory and pricing by SKU. Sales are updated daily in the merchandise reporting systems by polling all sales information from each store's point-of sale terminals. Stores are then staffed based on a statistically developed labor model which incorporates the daily and hourly store sales volume. We attempt to mitigate the risk of possible business interruptions caused by disruptions to our information systems by maintaining a disaster recovery plan, which includes maintaining backup systems off-site. However, despite safeguards and careful contingency planning, our systems are still subject to power outages, computer viruses, computer and telecommunication failures, employee usage errors, security breaches, terrorism, natural or man-made disasters and other catastrophic events. A major disruption of our information systems and backup mechanisms may cause us to incur significant costs to repair our systems and experience a critical loss of data. System failures could also disrupt our ability to track, record and analyze sales and inventory and could cause disruptions of our operations, including, among other things, our ability to process and ship inventory, process financial information including credit card transactions, process payrolls or vendor payments or engage in other similar normal business activities.
In addition, we may be unable to improve, upgrade, integrate or expand upon our existing systems and any costs and potential problems and interruptions associated with the implementation of new or upgraded systems and technology could also disrupt or reduce the efficiency of our operations.
Unauthorized disclosure of sensitive or confidential customer information could harm our business and standing with our customers.
The protection of our customer, employee and other company data is critical to us. We rely on commercially available systems, software, tools and monitoring to provide security for processing, transmission and storage of confidential customer information, such as payment card and personal information. Despite the security measures we have in place, our facilities and systems, and those of our third-party service providers, may be vulnerable to security breaches, acts of vandalism, payment card terminal tampering, computer viruses, misplaced, lost or stolen data, programming or human errors or other similar events. Any security breach involving the misappropriation, loss or other unauthorized disclosure of confidential information, whether by us or our third-party service providers, could damage our reputation, expose us to risk of litigation and liability, disrupt our operations and
32
harm our business. In addition, as a result of recent security breaches at a number of prominent retailers, the media and public scrutiny of information security and privacy has become more intense. As a result, we may incur significant costs to change our business practices or modify our service offerings in connection with the protection of personally identifiable information.
Regulatory or litigation developments could materially adversely affect our business operations and financial performance.
We are subject to numerous statutory, regulatory and legal requirements at a local, state, national and international level because of our business operations, store locations, workforce, sales to consumers and importation of merchandise. Laws and regulations affecting our business may change, sometimes frequently and significantly, as a result of political, economic, social or other events. Changes in the regulatory environment in the areas of product safety, environmental protection, privacy and information security, health care, labor and employment, U.S. customs, advertising and taxes, among others, could potentially impact our operations and financial results. For example, more stringent and varied requirements of local and state governmental bodies with respect to zoning, land use and environmental factors could delay or prevent development of new stores in particular locations. Environmental laws and regulations also govern, among other things, discharges of pollutants into the air and water as well as the presence, handling, release and disposal of and exposure to hazardous substances. These laws provide for significant fines and penalties for noncompliance. Third parties may also make personal injury, property damage or other claims against us associated with actual or alleged release of, or exposure to, hazardous substances at our properties. We could also be strictly liable, without regard to fault, for certain environmental conditions at properties we formerly owned or operated as well as at our current properties. We could be negatively impacted by developments in these areas due to the costs of compliance, and if we fail to comply with a law or regulation, we may be subject to claims, lawsuits, fines, penalties, loss of a license or permit and adverse publicity or other consequences that could have a material adverse effect on our business and results of operations.
Product recalls and/or product liability, as well as changes in product safety and other consumer protection laws, may adversely impact our operations, merchandise offerings, reputation, results of operations, cash flow and financial condition.
We are subject to regulations by a variety of federal, state and international regulatory authorities, including The Consumer Product Safety Commission. A large portion of our merchandise is manufactured in foreign countries. As such, one or more of our vendors might not adhere to product safety requirements or our quality control standards, and we might not identify the deficiency before merchandise ships to our stores. If our merchandise offerings do not meet applicable safety standards or our customers' expectations regarding safety, we could experience lost sales and increased costs and be exposed to legal and reputational risk. We could be required to recall some of those products or could expose ourselves to government enforcement action or private litigation, such as product liability claims, which could result in significant fines, penalties, monetary damages and other remedies as well as harm to our reputation. We could also be subject to litigation related to injuries or other accidents at our stores or distribution center.
Moreover, changes in product safety or other consumer protection laws could lead to increased costs to us for certain merchandise, or additional labor costs associated with readying merchandise for sale. Long lead times on merchandise ordering cycles increase the difficulty for us to plan and prepare for potential changes to applicable laws. In particular, The Consumer Product Safety Improvement Act of 2008 imposes significant requirements on manufacturing, importing, testing and labeling requirements for some of our products. In the event that we are unable to timely comply with regulatory changes, significant fines or penalties could result, and could adversely affect our reputation, results of operations, cash flow and financial condition.
33
Inadequacy of our insurance coverage could have a material adverse effect on our business.
We maintain third party insurance coverage against various liability risks and risks of property loss and business interruption, as well directors and officers liability insurance coverage. While we believe these arrangements are an effective way to insure against liability and property damage risks, the potential liabilities associated with those risks or other events could exceed the coverage provided by such arrangements. Significant uninsured liabilities could have a material adverse effect on our company.
Our continued success is substantially dependent on positive perceptions of At Home.
We are highly dependent on our reputation amongst home décor enthusiasts. To remain successful in the future, we must continue to preserve, grow and utilize the value of our reputation as the destination retailer for our customers' home décor needs. Reputational value is based in large part on perceptions of subjective qualities, and even isolated incidents may erode trust and confidence. Events that can damage our reputation include, but are not limited to, legal violations, litigation, actual or perceived ethical problems, product safety issues, actual or perceived poor employee relations, actual or perceived poor customer service, store appearance or operational issues, unauthorized use or other misappropriation of our trade name, data security or events outside of our control that could generate negative publicity with respect to At Home, whether in traditional media or social media outlets. Any event that has the potential to negatively impact our trade name or our reputation with customers, employees, suppliers, communities, governmental officials and others could have a material adverse effect on our business and results of operations.
Our operating results and financial position could be negatively impacted by accounting policies, rules and regulations.
Our operating results and financial position could be negatively impacted by implementation of our various accounting policies as well as changes to accounting rules and regulations or new interpretations of existing accounting standards. These changes may include, without limitation, changes to lease accounting standards. In addition, from time to time we could incur impairment charges that adversely affect our operating results. For example, changes in economic or operating conditions impacting our estimates and assumptions could result in the impairment of intangible assets (such as our goodwill or trade name) or long-lived assets in accordance with applicable accounting guidance. In the event that we determine our intangible or long-lived assets are impaired, we may be required to record a significant charge to earnings in our financial statements that could have a material adverse effect on our results of operations.
We incurred net losses in fiscal years 2014 and 2015 and we may experience net losses in the future.
We experienced net losses of $22.3 million and $0.4 million, respectively, for the fiscal years ended January 25, 2014 and January 31, 2015. There is no guarantee that we will be successful in realizing net income or otherwise achieving profitability or sustaining positive cash flow in future periods. Any failure to achieve net income could, among other things, impair our ability to complete future financings or the cost of obtaining financing or force us to seek additional capital through sales of our equity securities, which could dilute the value of any shares of common stock you purchase in this offering. In addition, a lack of profitability could adversely affect the price of our common stock.
Changes in our effective income tax rate could affect our results of operations.
Our effective income tax rate is influenced by a number of factors. Changes in the tax laws, the interpretation of existing laws or our failure to sustain our reporting positions on examination could adversely affect our effective tax rate. Further, our effective tax rate in a given financial statement
34
period may be materially impacted by changes in the mix and level of earnings or by changes to existing accounting rules or regulations.
We are a holding company with no operations of our own, and we depend on our subsidiaries for cash.
We are a holding company and do not have any material assets or operations other than ownership of equity interests of our subsidiaries. Our operations are conducted almost entirely through our subsidiaries, and our ability to generate cash to meet our obligations or to pay dividends, if any, is highly dependent on the earnings of, and receipt of funds from, our subsidiaries through dividends or intercompany loans. The ability of our subsidiaries to generate sufficient cash flow from operations to allow us and them to make scheduled payments on our debt obligations will depend on their future financial performance, which will be affected by a range of economic, competitive and business factors, many of which are outside of our control. We cannot assure you that the cash flow and earnings of our operating subsidiaries will be adequate for our subsidiaries to service their debt obligations. If our subsidiaries do not generate sufficient cash flow from operations to satisfy corporate obligations, we may have to undertake alternative financing plans (such as refinancing), restructure debt, sell assets, reduce or delay capital investments, or seek to raise additional capital. We cannot assure you that any such alternative refinancing would be possible, that any assets could be sold, or, if sold, of the timing of the sales and the amount of proceeds realized from those sales, that additional financing could be obtained on acceptable terms, if at all, or that additional financing would be permitted under the terms of our various debt instruments then in effect. Our inability to generate sufficient cash flow to satisfy our obligations, or to refinance our obligations on commercially reasonable terms, could have a material adverse effect on our business, financial condition and results of operations.
Furthermore, we and our subsidiaries may incur substantial additional indebtedness in the future that may severely restrict or prohibit our subsidiaries from making distributions, paying dividends, if any, or making loans to us.
Risks Related to our Common Stock and this Offering
There is no existing market for our common stock and we do not know if one will develop to provide you with adequate liquidity. If our stock price fluctuates after this offering, you could lose a significant part of your investment.
Prior to this offering, there has not been a public market for our common stock. We cannot predict the extent to which investor interest in us will lead to the development of a trading market on the New York Stock Exchange, or NYSE, or otherwise or how active and liquid that market may come to be. If an active trading market does not develop, you may have difficulty selling any of the common stock that you buy. Negotiations between us and the underwriters will determine the initial public offering price for our common stock, which may not be indicative of prices that will prevail in the open market following this offering. Consequently, you may not be able to sell our common stock at prices equal to or greater than the price you paid in this offering. The market price of our common stock may be influenced by many factors including:
- •
- quarterly variations in our operating results compared to market expectations;
- •
- changes in the preferences of our customers;
- •
- low comparable store sales growth compared to market expectations;
- •
- delays in the planned openings of new stores;
- •
- the failure of securities analysts to cover the Company after this offering or changes in analysts' financial estimates;
- •
- economic, legal and regulatory factors unrelated to our performance;
35
- •
- changes in consumer spending or the housing market;
- •
- increased competition or stock price performance of our competitors;
- •
- future sales of our common stock or the perception that such sales may occur;
- •
- changes in senior management or key personnel;
- •
- investor perceptions of us and the retail industry;
- •
- events beyond our control, such as war, terrorist attacks, transportation and fuel prices, natural disasters, severe
weather and widespread illness; and
- •
- the other factors listed in this "Risk Factors" section.
As a result of these factors, investors in our common stock may not be able to resell their shares at or above the initial offering price. In addition, our stock price may be volatile. The stock market in general has experienced extreme price and volume fluctuations that have often been unrelated or disproportionate to the operating performance of companies like us. Accordingly, these broad market and industry factors may significantly reduce the market price of the our common stock, regardless of our operating performance.
Because the Sponsors control a significant percentage of our common stock, they may control all major corporate decisions and their interests may conflict with your interests as an owner of our common stock and those of the Company.
We are controlled by the Sponsors, which currently indirectly own % of our common stock and will own approximately % after the completion of this offering. Accordingly, the Sponsors currently control the election of the majority of our directors and could exercise a controlling interest over our business, affairs and policies, including the appointment of our management and the entering into of business combinations or dispositions and other corporate transactions. The directors so elected have the authority to incur additional debt, issue or repurchase stock, declare dividends and make other decisions that could be detrimental to stockholders. In addition, pursuant to the stockholders' agreement, for a period of two years following this offering, Starr Investments will agree to vote 75,000 of their shares of our common stock on all matters presented to the stockholders in the same manner that AEA votes on such matters. In addition, following the consummation of this offering, and for so long as certain affiliates of AEA and Starr Investments hold an aggregate of at least 10% of our outstanding common stock, such Sponsors shall be entitled to nominate at least one individual for election to our board, and our board and nominating committee thereof shall nominate and recommend to our stockholders that such individual be elected to our board, and each party to the stockholders' agreement agrees to vote all of their shares to elect such individual to our board.
The Sponsors may have interests that are different from yours and may vote in a way with which you disagree and which may be adverse to your interests. Further, AEA and Starr Investments may have differing views from each other, neither of which may align with your interests. In addition, the Sponsors' concentration of ownership could have the effect of delaying or preventing a change in control or otherwise discouraging a potential acquirer from attempting to obtain control of us, which could cause the market price of our common stock to decline or prevent our stockholders from realizing a premium over the market price for their common stock.
Additionally, the Sponsors are in the business of making investments in companies and may from time to time acquire and hold interests in businesses that compete directly or indirectly with us or supply us with goods and services. The Sponsors may also pursue acquisition opportunities that may be complementary to our business and, as a result, those acquisition opportunities may not be available to us. Stockholders should consider that the interests of the Sponsors may differ from their interests in material respects.
36
You will incur immediate and substantial dilution in the net tangible book value of the common stock you purchase in this offering.
Prior investors have paid substantially less per share for our common stock than the price in this offering. The initial public offering price of our common stock is substantially higher than the net tangible book value per share of our outstanding common stock prior to completion of the offering. Accordingly, based on an initial public offering price of $ per share (the midpoint of the price range set forth on the cover page of this prospectus), if you purchase our common stock in this offering, you will pay more for your shares than the amounts paid by our existing stockholders for their shares and you will suffer immediate dilution of approximately $ per share in net tangible book value of our common stock. See "Dilution."
Sales of a substantial number of shares of our common stock in the public market by our existing stockholders could cause our stock price to fall.
Sales of a substantial number of shares of our common stock in the public market or the perception that these sales might occur, could depress the market price of our common stock and could impair our ability to raise capital through the sale of additional equity securities. Substantially all of our existing stockholders are subject to lock-up agreements with the underwriters of this offering that restrict the stockholders' ability to transfer shares of our common stock for at least 180 days from the date of this prospectus, subject to certain exceptions. The lock-up agreements limit the number of shares of common stock that may be sold immediately following the public offering. After this offering, we will have outstanding shares of common stock based on the number of shares outstanding as of August 1, 2015. Subject to limitations, approximately shares will become eligible for sale upon expiration of the lock-up period, as calculated and described in more detail in the section entitled "Shares Eligible for Future Sale." In addition, shares issued or issuable upon exercise of options and warrants vested as of the expiration of the lock-up period will be eligible for sale at that time. Sales of stock by these stockholders could have a material adverse effect on the trading price of our common stock.
Moreover, after this offering, holders of an aggregate of shares of our common stock will have rights, subject to certain conditions, to require us to file registration statements covering their shares or to include their shares in registration statements that we may file for ourselves or other stockholders. Registration of these shares under the Securities Act of 1933, as amended, or the Securities Act, would result in the shares becoming freely tradable without restriction under the Securities Act, except for shares held by our affiliates as defined in Rule 144 under the Securities Act. Any sales of securities by these stockholders could have a material adverse effect on the trading price of our common stock.
If securities analysts do not publish research or reports about At Home, or if they issue unfavorable commentary about us or our industry or downgrade our common stock, the price of our common stock could decline.
The trading market for our common stock will depend in part on the research and reports that third-party securities analysts publish about At Home and the retail industry. One or more analysts could downgrade our common stock or issue other negative commentary about At Home or our industry. In addition, we may be unable or slow to attract research coverage. Alternatively, if one or more of these analysts cease coverage of At Home, we could lose visibility in the market. As a result of one or more of these factors, the trading price of our common stock could decline.
37
Some provisions of our charter documents and Delaware law may have anti-takeover effects that could discourage an acquisition of us by others, even if an acquisition would be beneficial to our stockholders, and may prevent attempts by our stockholders to replace or remove our current management.
Provisions in our amended and restated certificate of incorporation and our amended and restated bylaws that will become effective following the closing of this offering, as well as provisions of the Delaware General Corporation Law, or DGCL, could make it more difficult for a third party to acquire us or increase the cost of acquiring us, even if doing so would benefit our stockholders, including transactions in which stockholders might otherwise receive a premium for their shares. These provisions include:
- •
- establishing a classified board of directors such that not all members of the board are elected at one time;
- •
- allowing the total number of directors to be determined exclusively (subject to the rights of holders of any series of
preferred stock to elect additional directors) by resolution of our board of directors and granting to our board the sole power (subject to the rights of holders of any series of preferred stock or
rights granted pursuant to the stockholders' agreement) to fill any vacancy on the board;
- •
- limiting the ability of stockholders to remove directors without cause if AEA ceases to own, or have the right to direct
the vote of, 50% or more of the voting power of our common stock;
- •
- authorizing the issuance of "blank check" preferred stock by our board of directors, without further stockholder
approval, to thwart a takeover attempt;
- •
- prohibiting stockholder action by written consent (and, thus, requiring that all stockholder actions be taken at a
meeting of our stockholders), if AEA ceases to own, or have the right to direct the vote of, 50% or more of the voting power of our common stock;
- •
- eliminating the ability of stockholders to call a special meeting of stockholders, except for AEA, so long as AEA owns,
or has the right to direct the vote of, 50% or more of the voting power of our common stock;
- •
- establishing advance notice requirements for nominations for election to the board of directors or for proposing matters
that can be acted upon at annual stockholder meetings; and
- •
- requiring the approval of the holders of at least two-thirds of the voting power of all outstanding stock entitled to vote thereon, voting together as a single class, to amend or repeal our certificate of incorporation or bylaws if AEA ceases to own, or have the right to direct the vote of, 50% or more of the voting power of our common stock.
In addition, while we will have opted out of Section 203 of the DGCL, our amended and restated certificate of incorporation will contain similar provisions providing that we may not engage in certain "business combinations" with any "interested stockholder" for a three-year period following the time that the stockholder became an interested stockholder, unless:
- •
- prior to such time, our board of directors approved either the business combination or the transaction that resulted in the
stockholder becoming an interested stockholder;
- •
- upon consummation of the transaction that resulted in the stockholder becoming an interested stockholder, the interested stockholder owned at least 85% of our voting stock outstanding at the time the transaction commenced, excluding certain shares; or
38
- •
- at or subsequent to that time, the business combination is approved by our board of directors and by the affirmative vote of holders of at least two-thirds of our outstanding voting stock that is not owned by the interested stockholder.
Generally, a "business combination" includes a merger, asset or stock sale or other transaction provided for or through our Company resulting in a financial benefit to the interested stockholder. Subject to certain exceptions, an "interested stockholder" is a person who owns 15% or more of our outstanding voting stock and the affiliates and associates of such person. For purposes of this provision, "voting stock" means any class or series of stock entitled to vote generally in the election of directors. Our amended and restated certificate of incorporation will provide that AEA, Starr Investments, their respective affiliates and any of their respective direct or indirect designated transferees (other than in certain market transfers and gifts) and any group of which such persons are a party do not constitute "interested stockholders" for purposes of this provision.
Under certain circumstances, this provision will make it more difficult for a person who qualifies as an "interested stockholder" to effect certain business combinations with our Company for a three-year period. This provision may encourage companies interested in acquiring us to negotiate in advance with our board of directors in order to avoid the stockholder approval requirement if our board of directors approves either the business combination or the transaction that results in the stockholder becoming an interested stockholder. These provisions also may have the effect of preventing changes in our board of directors and may make it more difficult to accomplish transactions that our stockholders may otherwise deem to be in their best interests. See "Description of Capital Stock".
These anti-takeover defenses could discourage, delay or prevent a transaction involving a change in control of our Company. These provisions could also discourage proxy contests and make it more difficult for you and other stockholders to elect directors of your choosing and cause us to take corporate actions other than those you desire.
We will be exposed to risks relating to evaluations of controls required by Section 404 of the Sarbanes-Oxley Act.
We are in the process of evaluating our internal controls systems to allow management to report on, and our independent auditors to audit, our internal controls over financial reporting. We will be performing the system and process evaluation and testing (and any necessary remediation) required to comply with the management certification and, if required, the auditor attestation requirements of Section 404 of the Sarbanes-Oxley Act. We will be required to comply with the management certification requirements of Section 404 in our annual report on Form 10-K for the year following our first annual report that is filed with the SEC (subject to any change in applicable SEC rules).We will be required to comply with Section 404 in full (including an auditor attestation on management's internal controls report) in our annual report on Form 10-K at the later of the year following our first annual report required to be filed with the SEC or the date on which we are no longer an emerging growth company (subject to any change in applicable SEC rules). Furthermore, upon completion of this process, we may identify control deficiencies of varying degrees of severity under applicable SEC and PCAOB rules and regulations that remain unremediated. As a public company, we will be required to report, among other things, control deficiencies that constitute a "material weakness" or changes in internal controls that, or that are reasonably likely to, materially affect internal controls over financial reporting. A "material weakness" is a deficiency, or a combination of deficiencies, in internal control over financial reporting, such that there is a reasonable possibility that a material misstatement of our annual or interim financial statements will not be prevented or detected on a timely basis. A "significant deficiency" is a deficiency, or a combination of deficiencies, in internal control over financial reporting that is less severe than a material weakness, yet important enough to merit attention by those responsible for oversight of our financial reporting.
39
To comply with the requirements of being a public company, we have undertaken various actions, and may need to take additional actions, such as implementing and enhancing our internal controls and procedures, including in connection with income tax accounting and our valuation allowance, and hiring additional accounting or internal audit staff. Testing and maintaining internal control can divert our management's attention from other matters that are important to the operation of our business. Additionally, when evaluating our internal control over financial reporting, we may identify material weaknesses that we may not be able to remediate in time to meet the applicable deadline imposed upon us for compliance with the requirements of Section 404. For example, in the past, certain matters involving our internal controls over financial reporting that constituted "material weaknesses" were identified and have since been remediated, which related to our limited accounting personnel and other resources at the time, as well as our adoption of public company standards. If we identify any additional material weaknesses in our internal control over financial reporting or are unable to comply with the requirements of Section 404 in a timely manner or assert that our internal control over financial reporting is effective, or if our independent registered public accounting firm is unable to express an opinion as to the effectiveness of our internal control over financial reporting once we are no longer an emerging growth company, investors may lose confidence in the accuracy, completeness or reliability of our financial reports and the trading price of our common stock may be adversely affected, and we could become subject to sanctions or investigations by the NYSE, the SEC or other regulatory authorities, which could require additional financial and management resources. In addition, if we fail to remedy any material weakness, our financial statements could be inaccurate and we could face restricted access to the capital markets.
We do not currently expect to pay any cash dividends.
The continued operation and expansion of our business will require substantial funding. Accordingly, we do not currently expect to pay any cash dividends on shares of our common stock. Any determination to pay dividends in the future will be at the discretion of our board of directors and will depend upon results of operations, financial condition, contractual restrictions, restrictions imposed by applicable law and other factors that our board of directors deems relevant. We are a holding company, and substantially all of our operations are carried out by our operating subsidiaries. Under our ABL Facility and Term Loan Facilities, our operating subsidiaries are currently limited in their ability to pay cash dividends, and we expect these limitations to continue in the future. Our ability to pay dividends may also be limited by the terms of any future credit agreement or any future debt or preferred equity securities of ours or of our subsidiaries. Accordingly, if you purchase shares in this offering, realization of a gain on your investment will depend on the appreciation of the price of our common stock, which may never occur. Investors seeking cash dividends in the foreseeable future should not purchase our common stock.
The requirements of being a public company, including compliance with the reporting requirements of the Exchange Act and the requirements of the Sarbanes-Oxley Act and the NYSE, may strain our resources, increase our costs and divert management's attention, and we may be unable to comply with these requirements in a timely or cost-effective manner.
As a public company, we will be subject to the reporting requirements of the Securities Exchange Act of 1934, as amended (the "Exchange Act"), and the corporate governance standards of the Sarbanes-Oxley Act and the NYSE. These requirements will place a strain on our management, systems and resources and we will incur significant legal, accounting, insurance and other expenses that we have not incurred as a private company. The Exchange Act will require us to file annual, quarterly and current reports with respect to our business and financial condition within specified time periods and to prepare a proxy statement with respect to our annual meeting of stockholders. The Sarbanes-Oxley Act will require that we maintain effective disclosure controls and procedures and internal controls over financial reporting. The NYSE will require that we comply with various corporate governance requirements. To maintain and improve the effectiveness of our disclosure controls and
40
procedures and internal controls over financial reporting and comply with the Exchange Act and the NYSE's requirements, significant resources and management oversight will be required. This may divert management's attention from other business concerns and lead to significant costs associated with compliance, which could have a material adverse effect on us and the price of our common stock.
The expenses incurred by public companies generally for reporting and corporate governance purposes have been increasing. We expect these rules and regulations to increase our legal and financial compliance costs and to make some activities more time-consuming and costly, although we are currently unable to estimate these costs with any degree of certainty. These laws and regulations could also make it more difficult or costly for us to obtain certain types of insurance, including director and officer liability insurance, and we may be forced to accept reduced policy limits and coverage or incur substantially higher costs to obtain the same or similar coverage. These laws and regulations could also make it more difficult for us to attract and retain qualified persons to serve on our board of directors, our board committees or as our executive officers. Advocacy efforts by stockholders and third parties may also prompt even more changes in governance and reporting requirements. We cannot predict or estimate the amount of additional costs we may incur or the timing of these costs. Furthermore, if we are unable to satisfy our obligations as a public company, we could be subject to delisting of our common stock, fines, sanctions and other regulatory action and potentially civil litigation.
We are a "controlled company" within the meaning of the NYSE rules and, as a result, will qualify for, and may rely on, exemptions from certain corporate governance requirements.
Following the consummation of this offering, we expect that a control group, consisting of the Sponsors and certain of our other stockholders, will continue to control a majority of the voting power of our outstanding common stock. As a result, we expect to be a "controlled company" within the meaning of the NYSE corporate governance standards. A company of which more than 50% of the voting power is held by an individual, a group or another company is a "controlled company" within the meaning of the NYSE rules and may elect not to comply with certain corporate governance requirements of the NYSE, including:
- •
- the requirement that a majority of our board of directors consist of independent directors;
- •
- the requirement that we have a nominating/corporate governance committee that is composed entirely of independent directors with a
written charter addressing the committee's purpose and responsibilities; and
- •
- the requirement that we have a compensation committee that is composed entirely of independent directors with a written charter addressing the committee's purpose and responsibilities.
Following this offering, we intend to rely on all of the exemptions listed above. If we do utilize the exemptions, we will not have a majority of independent directors and our nominating and corporate governance and compensation committees will not consist entirely of independent directors. As a result, our board of directors and those committees may have more directors who do not meet the NYSE's independence standards than they would if those standards were to apply. The independence standards are intended to ensure that directors who meet those standards are free of any conflicting interest that could influence their actions as directors. Accordingly, you will not have the same protections afforded to stockholders of companies that are subject to all of the corporate governance requirements of the NYSE.
41
Taking advantage of the reduced disclosure requirements applicable to "emerging growth companies" may make our common stock less attractive to investors.
As a company with less than $1.0 billion in revenue during our last fiscal year, we qualify as an "emerging growth company" as defined in the JOBS Act. An emerging growth company may take advantage of specified reduced reporting and other requirements that are otherwise applicable generally to public companies. These provisions include:
- •
- we are required to have only two years of audited financial statements and only two years of related Management's Discussion and
Analysis of Financial Condition and Results of Operations disclosure;
- •
- we are not required to engage an auditor to report on our internal controls over financial reporting pursuant to Section 404(b)
of the Sarbanes-Oxley Act;
- •
- we are not required to comply with any requirement that may be adopted by the PCAOB regarding mandatory audit firm rotation or a
supplement to the auditor's report providing additional information about the audit and the financial statements (i.e., an auditor discussion and analysis);
- •
- we are not required to submit certain executive compensation matters to stockholder advisory votes, such as "say-on-pay",
"say-on-frequency" and "say-on-golden parachutes"; and
- •
- we are not required to disclose certain executive compensation related items such as the correlation between executive compensation and performance and comparisons of the chief executive officer's compensation to median employee compensation.
We may take advantage of these provisions until the last day of our fiscal year following the fifth anniversary of the completion of this offering or such earlier time that we are no longer an emerging growth company. We would cease to be an emerging growth company if we have more than $1.0 billion in annual revenue, have more than $700 million in market value of our common stock held by non-affiliates, or issue more than $1.0 billion of non-convertible debt over a three-year period. We may choose to take advantage of some but not all of these reduced burdens. We have elected to adopt the reduced disclosure in this prospectus.
The JOBS Act permits an emerging growth company like us to take advantage of an extended transition period to comply with new or revised accounting standards applicable to public companies. We are choosing to irrevocably "opt out" of this provision and, as a result, we will comply with new or revised accounting standards as required when they are adopted.
We cannot predict if investors will find our common stock less attractive if we elect to rely on these exemptions, or if taking advantage of these exemptions would result in less active trading or more volatility in the price of our common stock.
Our amended and restated certificate of incorporation will designate the Court of Chancery of the State of Delaware as the exclusive forum for certain litigation that may be initiated by our stockholders, which could limit our stockholders' ability to obtain a favorable judicial forum for disputes with us.
Our amended and restated certificate of incorporation will provide that the Court of Chancery of the State of Delaware will be the sole and exclusive forum for (i) any derivative action or proceeding brought on our behalf, (ii) any action asserting a claim of breach of a fiduciary duty owed to us or our stockholders by any of our directors, officers, employees or agents, (iii) any action asserting a claim against us arising under the DGCL or (iv) any action asserting a claim against us that is governed by the internal affairs doctrine. By becoming a stockholder in our company, you will be deemed to have notice of and have consented to the provisions of our amended and restated certificate of incorporation related to choice of forum. The choice of forum provision in our amended and restated certificate of incorporation may limit our stockholders' ability to obtain a favorable judicial forum for disputes with us.
42
CAUTIONARY NOTE REGARDING FORWARD-LOOKING STATEMENTS
This prospectus contains forward-looking statements. You can generally identify forward-looking statements by our use of forward-looking terminology such as "anticipate," "believe," "continue," "could," "estimate," "expect," "intend," "may," "might," "plan," "potential," "predict," "seek," "vision" or "should," or the negative thereof or other variations thereon or comparable terminology. In particular, statements about the markets in which we operate, expected new store openings, potential growth opportunities and future capital expenditures and our expectations, beliefs, plans, strategies, objectives, prospects, assumptions or future events or performance contained in this prospectus under the headings "Prospectus Summary," "Risk Factors," "Management's Discussion and Analysis of Financial Condition and Results of Operations" and "Business" are forward-looking statements.
We have based these forward-looking statements on our current expectations, assumptions, estimates and projections. While we believe these expectations, assumptions, estimates and projections are reasonable, such forward-looking statements are only predictions and involve known and unknown risks and uncertainties, many of which are beyond our control. These and other important factors, including those discussed in this prospectus under the headings "Prospectus Summary," "Risk Factors," "Management's Discussion and Analysis of Financial Condition and Results of Operations" and "Business," may cause our actual results, performance or achievements to differ materially from any future results, performance or achievements expressed or implied by these forward-looking statements. Some of the factors that could cause actual results to differ materially from those expressed or implied by the forward-looking statements include:
- •
- general economic factors that may materially adversely affect our business, revenue and profitability;
- •
- volatility or disruption in the financial markets;
- •
- consumer spending on home décor products which could decrease or be displaced by spending on other activities;
- •
- our ability to successfully implement our growth strategy on a timely basis or at all;
- •
- our failure to manage inventory effectively and our inability to satisfy changing consumer demands and preferences;
- •
- losses of, or disruptions in, or our inability to efficiently operate our distribution network;
- •
- adverse events in the geographical regions in which we operate;
- •
- risks related to our imported merchandise;
- •
- the success of our recent rebranding;
- •
- risks associated with leasing substantial amounts of space;
- •
- risks associated with our sale-leaseback strategy;
- •
- the highly competitive retail environment in which we operate;
- •
- risks related to our substantial indebtedness and the significant operating and financial restrictions imposed on us and our
subsidiaries by the ABL Facility and Term Loan Facilities;
- •
- our dependence upon the services of our management team and our buyers;
- •
- the failure to attract and retain quality employees;
- •
- difficulties with our vendors;
43
- •
- the seasonality of our business;
- •
- fluctuations in our quarterly operating results;
- •
- the failure or inability to protect our intellectual property rights;
- •
- risks associated with third party claims that we infringe upon their intellectual property rights;
- •
- increases in commodity prices and supply chain costs;
- •
- the need to make significant investments in advertising, marketing or promotions;
- •
- the success of any online services or e-commerce activities that we may launch in the future and the substantial investment related
thereto;
- •
- disruptions to our information systems or our failure to adequately support, maintain and upgrade those systems;
- •
- unauthorized disclosure of sensitive or confidential customer information;
- •
- regulatory or litigation developments;
- •
- risks associated with product recalls and/or product liability, as well as changes in product safety and other consumer protection
laws;
- •
- inadequacy of our insurance coverage;
- •
- our substantial dependence upon our reputation and positive perceptions of At Home;
- •
- the potential negative impact of changes to our accounting policies, rules and regulations;
- •
- changes in our effective income tax rate;
- •
- net losses incurred in fiscal years 2014 and 2015 and the potential to experience net losses in the future;
- •
- the Sponsors' control of us; and
- •
- other risks and uncertainties, including those listed under "Risk Factors."
Given these risks and uncertainties, you are cautioned not to place undue reliance on such forward-looking statements. The forward-looking statements contained in this prospectus are not guarantees of future performance and our actual results of operations, financial condition and liquidity, and the development of the industry in which we operate, may differ materially from the forward-looking statements contained in this prospectus. In addition, even if our results of operations, financial condition and liquidity, and events in the industry in which we operate, are consistent with the forward-looking statements contained in this prospectus, they may not be predictive of results or developments in future periods.
Any forward-looking statement that we make in this prospectus speaks only as of the date of such statement. Except as required by law, we do not undertake any obligation to update or revise, or to publicly announce any update or revision to, any of the forward-looking statements, whether as a result of new information, future events or otherwise, after the date of this prospectus.
44
We estimate that the net proceeds to us from our sale of shares in this offering will be approximately $ million (or $ million if the underwriters' option to purchase additional shares is exercised in full), based on the assumed initial public offering price of $ per share, which is the midpoint of the price range set forth on the cover page of this prospectus, and after deducting underwriting discounts and commissions and estimated offering expenses payable by us. We intend to use the net proceeds from this offering to repay approximately $ million of indebtedness plus accrued and unpaid interest and premium under the Second Lien Facility.
The interest rate on borrowings under the Second Lien Facility as of , 2015 was % and the maturity date is June 5, 2023. The borrowings under the Second Lien Facility were incurred on June 5, 2015, together with borrowings under the First Lien Facility, to finance the redemption in full of our 10.75% Senior Secured Notes due June 1, 2019, including accrued and unpaid interest and premium thereon and fees and expenses in connection therewith, to repay amounts outstanding under the ABL Facility and for general corporate purposes.
Each $1.00 increase (decrease) in the assumed initial public offering price of $ per share, the midpoint of the price range set forth on the cover page of this prospectus, would increase (decrease) the net proceeds to us from this offering by approximately $ million, assuming the number of shares offered by us, as set forth on the cover page of this prospectus, remains the same, and after deducting underwriting discounts and commissions and estimated offering expenses payable by us. Each increase (decrease) of 1.0 million shares in the number of shares sold in this offering, as set forth on the cover page of this prospectus, would increase (decrease) the net proceeds to us from this offering by approximately $ million, assuming the assumed initial public offering price of $ per share, the midpoint of the price range set forth on the cover page of this prospectus, remains the same, and after deducting underwriting discounts and commissions and estimated offering expenses payable by us. The information discussed above is illustrative only and will adjust based on the actual initial public offering price and other terms of this offering determined at pricing.
45
We do not currently expect to pay any cash dividends on our common stock for the foreseeable future. Instead, we intend to retain future earnings, if any, for the future operation and expansion of our business and the repayment of debt. Any determination to pay dividends in the future will be at the discretion of our board of directors and will depend upon our results of operations, cash requirements, financial condition, contractual restrictions, restrictions imposed by applicable laws and other factors that our board of directors may deem relevant. Our business is conducted through our subsidiaries. Dividends, distributions and other payments from, and cash generated by, our subsidiaries will be our principal sources of cash to repay indebtedness, fund operations and pay dividends. Accordingly, our ability to pay dividends to our stockholders is dependent on the earnings and distributions of funds from our subsidiaries. In addition, the covenants in the agreements governing our existing indebtedness, including the ABL Facility and the Term Loan Facilities, significantly restrict the ability of our subsidiaries to pay dividends or otherwise transfer assets to us. See "Description of Certain Indebtedness", "Risk Factors—Risks Relating to our Business—We are a holding company with no operations of our own, and we depend on our subsidiaries for cash" and "Risk Factors—Risks Related to our Common Stock and this Offering—We do not currently expect to pay any cash dividends."
46
The following table sets forth our cash and our consolidated capitalization as of August 1, 2015:
- •
- on an actual basis; and
- •
- on an as adjusted basis to give effect to our issuance and sale of shares of our common stock in this offering at an assumed initial public offering price of $ per share, the midpoint of the price range set forth on the cover page of this prospectus, after deducting estimated underwriting discounts and commissions and estimated offering expenses payable by us, and the application of the net proceeds from this offering as described in "Use of Proceeds".
You should read the data set forth below in conjunction with "Management's Discussion and Analysis of Financial Condition and Results of Operations" and the consolidated financial statements and accompanying notes included elsewhere in this prospectus.
| |
As of August 1, 2015 | ||||||
|---|---|---|---|---|---|---|---|
| |
Actual | As Adjusted(2) | |||||
| |
(in thousands, except share and per share data) |
||||||
Cash and cash equivalents |
$ | 6,151 | $ | ||||
| | | | | | | | |
| | | | | | | | |
| | | | | | | | |
Debt: |
|||||||
ABL Facility |
$ | 70,300 | $ | ||||
Notes Payable |
15,606 | ||||||
First Lien Facility |
299,250 | (1) | |||||
Second Lien Facility |
130,000 | (1) | |||||
| | | | | | | | |
Total debt |
515,156 | ||||||
Stockholders' equity: |
|||||||
Common stock, Class A; $0.01 par value; 1,000,000 shares authorized; 253,871 shares issued and outstanding actual(3) |
3 | — | |||||
Common stock, Class B; $0.01 par value; 1,000,000 shares authorized; 142,803 shares issued and outstanding actual(3) |
1 | — | |||||
Common stock; $0.01 par value; shares authorized; no shares issued and outstanding actual and as adjusted, shares issued and outstanding as further adjusted(3) |
— | ||||||
Additional paid-in capital |
407,880 | ||||||
Accumulated deficit |
(89,017 | ) | |||||
| | | | | | | | |
Total equity |
318,867 | ||||||
| | | | | | | | |
Total capitalization |
$ | 834,023 | $ | ||||
| | | | | | | | |
| | | | | | | | |
| | | | | | | | |
- (1)
- On
June 5, 2015, we utilized a portion of the proceeds from our Term Loan Facilities to complete the redemption of the Senior Secured Notes at a
price equal to 108.063% for total cash consideration of $389.4 million, which includes a $29.0 million early redemption premium and $0.4 million of accrued interest. The remainder
of the proceeds from our Term Loan Facilities were used (i) to pay fees and expenses in connection with Term Loan Facilities of approximately $13.6 million, (ii) to repay
$29.2 million in amounts outstanding under the ABL Facility and (iii) for general corporate purposes.
- (2)
- Each $1.00 increase (decrease) in the assumed initial public offering price of $ per share, the midpoint of the price range set forth on the cover page of this prospectus, would increase
47
(decrease) each of cash and cash equivalents, additional paid-in-capital, total stockholders' equity and total capitalization by approximately $ million, assuming the number of shares offered by us, as set forth on the cover page of this prospectus, remains the same, and after deducting underwriting discounts and commissions and estimated offering expenses payable by us. Each increase (decrease) of 1.0 million shares in the number of shares sold in this offering, as set forth on the cover page of this prospectus, would increase (decrease) each of cash and cash equivalents, additional paid-in-capital, total stockholders' equity and total capitalization by approximately $ million, assuming the assumed initial public offering price of $ per share, the midpoint of the price range set forth on the cover page of this prospectus, remains the same, and after deducting underwriting discounts and commissions and estimated offering expenses payable by us.
- (3)
- Upon consummation of this offering, the Class A common stock and Class B common stock will convert on a one-to-one basis into Class C common stock, which will then be designated as common stock.
48
If you purchase any of the shares offered by this prospectus, you will experience dilution to the extent of the difference between the offering price per share that you pay in this offering and the net tangible book value per share of our common stock immediately after this offering.
Our net tangible book value (deficit) as of August 1, 2015 was $(251.7) million, or $ per share of common stock. Net tangible book value (deficit) per share is determined by dividing our net tangible book value (deficit), which is total tangible assets less total liabilities, by the aggregate number of shares of common stock outstanding. Tangible assets represent total assets excluding goodwill and other intangible assets. Dilution in net tangible book value (deficit) per share represents the difference between the amount per share paid by purchasers of shares of our common stock in this offering and the pro forma as adjusted net tangible book value per share of our common stock immediately afterwards.
After giving effect to (i) our -for- stock split and (ii) our sale of shares of common stock in this offering at an assumed initial public offering price of $ per share, the midpoint of the price range set forth on the cover page of this prospectus, our pro forma as adjusted net tangible book value as of , 2015 would have been approximately $ , or $ per share. This represents an immediate increase in net tangible book value (deficit) of $ per share to our existing stockholders and an immediate dilution of $ per share to new investors purchasing shares of common stock in this offering. The following table illustrates this dilution on a per share basis:
The following table illustrates this dilution on a per share basis:
Assumed initial public offering price per share |
$ | ||||||
Historical net tangible book value per share |
$ | ||||||
Increase per share attributable to this offering |
|||||||
| | | | | | | | |
Pro forma net tangible book value per share after this offering |
$ | ||||||
| | | | | | | | |
Dilution per share to new investors |
$ | ||||||
| | | | | | | | |
| | | | | | | | |
| | | | | | | | |
Each $1.00 increase (decrease) in the assumed initial offering price of $ per share, the midpoint of the price range set forth on the cover page of this prospectus, would affect our net tangible book value after this offering by approximately $ , the net tangible book value per share after this offering by $ per share, and the dilution per common share to new investors by $ per share, assuming the number of shares offered by us, as set forth on the cover page of this prospectus, remains the same, and after deducting underwriting commissions and discounts and estimated offering expenses payable by us. Each increase (decrease) of 1.0 million shares in the number of shares sold in this offering, as set forth on the cover page of this prospectus, would affect our net tangible book value after this offering by approximately $ , the net tangible book value per share after this offering by $ per share, and the dilution per common share to new investors by $ per share, assuming the assumed initial public offering price of $ per share, the midpoint of the price range set forth on the cover page of this prospectus, remains the same, and after deducting underwriting commissions and discounts and estimated offering expenses payable by us.
The following table summarizes, as of August 1, 2015, on an as adjusted basis, the number of shares of common stock purchased or to be purchased from us, the total consideration paid or to be paid to us and the average price per share paid or to be paid by existing stockholders and by new
49
investors purchasing shares of common stock in this offering, before deducting the underwriting commissions and discounts and estimated offering expenses payable by us.
| |
Shares Purchased | Total Consideration |
Average Price Per Share |
|||||||||||||
|---|---|---|---|---|---|---|---|---|---|---|---|---|---|---|---|---|
| |
(in thousands, except share and per share data) |
|||||||||||||||
| |
Number | Percent | Amount | Percent | |
|||||||||||
Existing stockholders |
% | $ | % | $ | ||||||||||||
New investors |
% | $ | % | $ | ||||||||||||
| | | | | | | | | | | | | | | | | |
Total |
100 | % | $ | 100 | % | $ | ||||||||||
| | | | | | | | | | | | | | | | | |
| | | | | | | | | | | | | | | | | |
| | | | | | | | | | | | | | | | | |
Each $1.00 increase (decrease) in the assumed initial offering price of $ per share, the midpoint of the price range set forth on the cover page of this prospectus, would increase (decrease) total consideration paid by new investors, total consideration paid by all stockholders and average price per share paid by all stockholders by $ , $ and $ per share, respectively, assuming the number of shares offered by us, as set forth on the cover page of this prospectus, remains the same, and after deducting underwriting discounts and commissions and estimated offering expenses payable by us. Each increase (decrease) of 1.0 million shares in the number of shares sold in this offering, as set forth on the cover page of this prospectus, would increase (decrease) total consideration paid by new investors, total consideration paid by all stockholders and average price per share paid by all stockholders by $ , $ and $ per share, respectively, assuming the assumed initial public offering price of $ per share, the midpoint of the price range set forth on the cover page of this prospectus, remains the same, and after deducting underwriting discounts and commissions and estimated offering expenses payable by us.
If the underwriters exercise in full their option to purchase additional shares of our common stock in this offering, the as adjusted net tangible book value per share would be $ per share and the dilution to new investors in this offering would be $ per share. If the underwriters exercise such option in full, the number of shares held by new investors will increase to approximately shares of our common stock, or approximately % of the total number of shares of our common stock outstanding after this offering. The number of shares of our common stock to be outstanding immediately following this offering set forth above excludes:
- •
- shares of common stock issuable upon the exercise of options outstanding under our stock option plan
as of
August 1, 2015 at a weighted average exercise price of $ per share; and
- •
- shares of common stock reserved for future issuance under our new omnibus incentive plan.
To the extent any options are granted and exercised in the future, there may be additional economic dilution to new investors.
In addition, we may choose to raise additional capital due to market conditions or strategic considerations, even if we believe we have sufficient funds for our current or future operating plans. To the extent that we raise additional capital through the sale of equity or convertible debt securities, the issuance of these securities could result in further dilution to our stockholders.
50
SELECTED CONSOLIDATED FINANCIAL DATA
Our selected consolidated statement of operations, cash flow and balance sheet data presented below as of and for the fiscal years ended January 25, 2014 and January 31, 2015 has been derived from our audited consolidated financial statements included elsewhere in this prospectus. Our selected consolidated statement of operations, cash flow and balance sheet data presented below as of and for the twenty-six weeks ended July 26, 2014 and August 1, 2015 has been derived from our unaudited consolidated financial statements included elsewhere in this prospectus. The unaudited consolidated financial statements were prepared on a basis consistent with that used in preparing our audited consolidated financial statements and include all adjustments, consisting of normal and recurring items, that we consider necessary for a fair presentation of our financial position and results of operations for the unaudited periods.
The historical results presented below are not necessarily indicative of the results to be expected for any future period. The selected consolidated financial data presented below should be read in conjunction with "Management's Discussion and Analysis of Financial Condition and Results of Operations" and our consolidated financial statements and related notes included elsewhere in this prospectus.
| |
Fiscal Year Ended | Twenty-six Weeks Ended | |||||||||||
|---|---|---|---|---|---|---|---|---|---|---|---|---|---|
| |
January 25, 2014 |
January 31, 2015 |
July 26, 2014 |
August 1, 2015 |
|||||||||
| |
(in thousands, except share and per share data) |
||||||||||||
Statement of Operations Data: |
|||||||||||||
Net sales |
$ | 403,966 | $ | 497,733 | $ | 229,915 | $ | 297,224 | |||||
Cost of sales |
272,021 | 335,617 | 150,617 | 197,147 | |||||||||
| | | | | | | | | | | | | | |
Gross profit |
131,945 | 162,116 | 79,298 | 100,077 | |||||||||
Operating Expenses |
|||||||||||||
Selling, general and administrative expenses |
74,255 | 110,503 | 44,246 | 61,295 | |||||||||
Impairment of trade name |
37,500 | — | — | — | |||||||||
Depreciation and amortization |
1,262 | 5,310 | 3,788 | 933 | |||||||||
| | | | | | | | | | | | | | |
Total operating expenses |
113,017 | 115,813 | 48,034 | 62,228 | |||||||||
Operating income |
18,928 | 46,303 | 31,264 | 37,849 | |||||||||
Interest expense, net |
41,152 | 42,382 | 20,553 | 19,768 | |||||||||
Loss on extinguishment of debt |
— | — | — | 36,046 | |||||||||
| | | | | | | | | | | | | | |
(Loss) income before income taxes |
(22,224 | ) | 3,921 | 10,711 | (17,965 | ) | |||||||
Income tax provision |
59 | 4,357 | 14,782 | 26,377 | |||||||||
| | | | | | | | | | | | | | |
Net loss |
$ | (22,283 | ) | $ | (436 | ) | $ | (4,071 | ) | $ | (44,342 | ) | |
| | | | | | | | | | | | | | |
| | | | | | | | | | | | | | |
| | | | | | | | | | | | | | |
Per Share Data: |
|||||||||||||
Net loss per common share: |
|||||||||||||
Basic |
$ | (56.17 | ) | $ | (1.10 | ) | $ | (10.26 | ) | $ | (111.78 | ) | |
Diluted |
$ | (56.17 | ) | $ | (1.10 | ) | $ | (10.26 | ) | $ | (111.78 | ) | |
Weighted average shares outstanding: |
|||||||||||||
Basic |
396,674 | 396,674 | 396,674 | 396,674 | |||||||||
Diluted |
396,674 | 396,674 | 396,674 | 396,674 | |||||||||
Cash Flow Data: |
|||||||||||||
Net cash provided by (used in) operating activities |
$ | 35,695 | $ | 15,321 | $ | (7,701 | ) | $ | (1,935 | ) | |||
Net cash used in investing activities |
(30,310 | ) | (100,098 | ) | (59,719 | ) | (23,271 | ) | |||||
Net cash (used in) provided by financing activities |
(4,032 | ) | 84,512 | 67,460 | 26,651 | ||||||||
Net increase (decrease) in cash and cash equivalents |
1,353 | (265 | ) | 40 | 1,445 | ||||||||
51
| |
January 25, 2014 |
January 31, 2015 |
July 26, 2014 |
August 1, 2015 |
|||||||||
|---|---|---|---|---|---|---|---|---|---|---|---|---|---|
| |
(in thousands) |
||||||||||||
Balance Sheet Data: |
|||||||||||||
Cash and cash equivalents |
$ | 4,971 | $ | 4,706 | $ | 5,011 | $ | 6,151 | |||||
Inventories, net |
109,125 | 142,256 | 130,524 | 167,550 | |||||||||
Property and equipment, net |
111,786 | 220,084 | 182,058 | 249,398 | |||||||||
Net working capital(1) |
46,006 | 66,155 | 63,017 | 74,650 | |||||||||
Total assets |
834,921 | 980,347 | 907,422 | 1,026,067 | |||||||||
Long-term debt(2) |
372,351 | 378,261 | 372,073 | 444,856 | |||||||||
Total shareholders' equity |
357,101 | 360,916 | 355,138 | 318,867 | |||||||||
| |
Fiscal Year Ended January 31, 2015 |
Twenty-six Weeks Ended August 1, 2015 |
|||||
|---|---|---|---|---|---|---|---|
| |
(dollars in thousands, except share and per share data) |
||||||
Pro Forma Statement of Operations Data: |
|||||||
Pro forma net income(3) |
|||||||
Pro forma weighted average shares outstanding(4) |
|||||||
Basic |
|||||||
Diluted |
|||||||
Pro forma net income per share(3)(4) |
|||||||
Basic |
|||||||
Diluted |
|||||||
- (1)
- Net
working capital is defined as current assets (excluding cash and cash equivalents) less current liabilities (excluding the current portion of long-term
debt and revolving line of credit).
- (2)
- Long-term
debt consists of the current and long-term portions of the Senior Secured Notes and mortgage loans. The current portion of long-term debt, per the
accompanying unaudited condensed consolidated balance sheet as of August 1, 2015 included elsewhere in this prospectus, includes $0.3 million for the current portion of financing
obligations that has been excluded from this presentation of long-term debt.
- (3)
- Pro
forma to give effect to the following transactions as if they had occurred as of the beginning of the periods presented: (i) the June 2015
Refinancing, (ii) this offering, (iii) the repayment of $ million of indebtedness from the proceeds of this offering as described in "Use of Proceeds" and
(iv) each of the related adjustments mentioned below.
Adjustments to net income for the fiscal year ended January 31, 2015 and the twenty-six weeks ended August 1, 2015 reflect (i) a $ and $ decrease in interest expense, respectively (see the reconciliation of historical interest expense to pro forma interest expense below), (ii) a $ and $ increase in income tax expense, respectively, due to higher income before taxes relating to our pro forma net income and (iii) the removal of $ and $ of the Sponsors' management fees, respectively.
52
The following is a reconciliation of historical net (loss) income to pro forma net income for the fiscal year ended January 31, 2015 and the twenty-six weeks ended August 1, 2015:
| |
Fiscal Year Ended January 31, 2015 |
Twenty-six Weeks Ended August 1, 2015 |
|||||
|---|---|---|---|---|---|---|---|
| |
(in thousands) |
||||||
Net (loss) income |
$ | $ | |||||
Decrease in interest expense, net(a) |
|||||||
Increase in income tax expense(b) |
|||||||
Removal of management fee(c) |
|||||||
Pro forma net income |
$ | $ | |||||
- (a)
- See
the reconciliation of historical interest expense to pro forma interest expense below.
- (b)
- Reflects
an increase of $ and $ , respectively, in income tax expense for the fiscal year ended January 31, 2015
and the
twenty-six weeks ended August 1, 2015 for the related tax effects of the pro forma adjustments. The tax impact is based upon an increase of pro forma income before taxes of
$ and
$ , respectively, and a statutory tax rate of % and %, respectively.
- (c)
- Reflects the removal of $ and $ , respectively, of management fees for the fiscal year ended January 31, 2015 and the twenty-six weeks ended August 1, 2015. In connection with this offering, the management agreement will be terminated, see "Certain Relationships and Related Party Transactions".
The following is a reconciliation of historical interest expense to pro forma interest expense for the fiscal year ended January 31, 2015 and the twenty-six weeks ended August 1, 2015.
| |
Fiscal Year Ended January 31, 2015 |
Twenty-six Weeks Ended August 1, 2015 |
|||||
|---|---|---|---|---|---|---|---|
| |
(in thousands) |
||||||
Interest expense, net |
$ | $ | |||||
Decrease resulting from the June 2015 Refinancing(a) |
|||||||
Decrease resulting from use of proceeds of this offering(b) |
|||||||
| | | | | | | | |
Pro forma interest expense, net |
$ | $ | |||||
| | | | | | | | |
| | | | | | | | |
| | | | | | | | |
- (a)
- Reflects
redemption in full of the Senior Secured Notes with the proceeds of the Term Loan Facilities.
- (b)
- Assumes repayment of $ million of indebtedness under the Second Lien Facility, which bears interest at a rate of % per annum, from the proceeds of this offering, as if it had occurred as of the beginning of the periods presented.
- (4)
- Gives effect to (i) the -for- stock split effected on , 2015 and (ii) the shares of our common stock to be issued by us in this offering. Pro forma basic net income per share consists of pro forma net income divided by the pro forma basic weighted average common shares outstanding. Pro forma diluted net income per share consists of pro forma net income divided by the pro forma diluted weighted average common shares outstanding.
53
MANAGEMENT'S DISCUSSION AND ANALYSIS OF
FINANCIAL CONDITION AND RESULTS OF OPERATIONS
You should read the following discussion and analysis of our financial condition and results of operations together with the "Selected Consolidated Financial Data" and our consolidated financial statements and the related notes and other financial information included elsewhere in this prospectus. Some of the information contained in this discussion and analysis or set forth elsewhere in this prospectus, including information with respect to our plans and strategy for our business, includes forward-looking statements that involve risks and uncertainties. You should review the "Cautionary Note Regarding Forward-Looking Statements" and "Risk Factors" sections of this prospectus for a discussion of important factors that could cause actual results to differ materially from the results described in or implied by the forward-looking statements contained in the following discussion and analysis.
We operate on a fiscal calendar widely used by the retail industry that results in a given fiscal year consisting of a 52- or 53-week period ending on the last Saturday in January. In a 52-week fiscal year, each quarter contains 13 weeks of operations; in a 53-week fiscal year, each of the first, second and third quarters includes 13 weeks of operations and the fourth quarter includes 14 weeks of operations. References to a fiscal year mean the year in which that fiscal year ends. References herein to "fiscal year 2013" relate to the 52 weeks ended January 26, 2013, references herein to "fiscal year 2014" relate to the 52 weeks ended January 25, 2014, references herein to "fiscal year 2015" relate to the 53 weeks ended January 31, 2015 and references herein to "fiscal year 2016" relate to the 52 weeks ending January 30, 2016.
Overview
At Home is the leading home décor superstore based on the number of our locations and our large format stores that we believe dedicate more space per store to home décor than any other player in the industry. We are focused on providing the broadest assortment of products for every room, in every style at everyday low prices. We utilize our space advantage to out-assort our competition, offering over 50,000 SKUs throughout our stores. Our differentiated merchandising strategy allows us to identify on-trend products and then value engineer those products to provide desirable aesthetics at attractive price points for our customers. Over 70% of our products are unbranded, private label or specifically designed for us. We believe that our broad and comprehensive offering and compelling value proposition combine to create a leading destination for home décor with the opportunity to continue taking market share in a large, fragmented and growing market.
We were founded in 1979 in Garden Ridge, Texas, a suburb of San Antonio. After we were acquired in 2011 by a group of investors led by AEA, including affiliates of Starr Investments, we began a series of strategic investments in our business that we believe have laid the foundation for continued profitable growth. Since the beginning of fiscal year 2014, we have invested approximately $85 million in capital in connection with the following strategic initiatives:
- •
- To take advantage of the concentration of retail talent in the Dallas / Fort Worth area, we moved our Company headquarters from
Houston to Plano.
- •
- In addition to building out our executive team, we significantly increased the number of people within all functional areas, resulting
in a well-rounded team with a deep bench of experience.
- •
- We have implemented rigorous, systematic processes which have allowed us to accelerate new store openings while delivering strong
financial results.
- •
- We upgraded and automated our distribution center and expanded its capacity to service our growing store
base.
- •
- In fiscal year 2015, we completed the rebranding of our Company from Garden Ridge to At Home, an important milestone which has strengthened our brand message and better communicates our position as the leading home décor superstore.
54
Our strengthened management team, new brand identity, improved real estate capabilities, upgraded and automated distribution center and enhanced information systems should enable us to expand our store base while maintaining our industry-leading profitability.
Our current store base is comprised of 96 large format stores across 26 states and 56 markets, averaging over 120,000 square feet per store. Over the past five fiscal years we have opened 45 new stores and we believe there is significant whitespace opportunity to increase our store count in both existing and new adjacent markets.
Trends and Other Factors Affecting Our Business
Various trends and other factors affect or have affected our operating results, including:
Overall economic trends. The overall economic environment and related changes in consumer behavior have a significant impact on our business. In general, positive conditions in the broader economy promote customer spending in our stores, while economic weakness results in a reduction of customer spending. Macroeconomic factors that can affect customer spending patterns, and thereby our results of operations, include employment rates, business conditions, changes in the housing market, the availability of credit, interest rates, tax rates and fuel and energy costs.
Consumer preferences and demand. Our ability to maintain our appeal to existing customers and attract new customers depends on our ability to originate, develop and offer a compelling product assortment responsive to customer preferences and design trends. If we misjudge the market for our products, we may be faced with excess inventories for some products and may be required to become more promotional in our selling activities, which would impact our net sales and gross profit.
New store openings. We expect new stores will be the key driver of the growth in our sales and operating profit in the future. Our results of operations have been and will continue to be materially affected by the timing and number of new store openings. The performance of new stores may vary depending on various factors such as the store opening date, the time of year of a particular opening, the amount of store opening costs, the amount of store occupancy costs and the location of the new store, including whether it is located in a new or existing market. For example, we typically incur higher than normal employee costs at the time of a new store opening associated with set-up and other opening costs. In addition, in response to the interest and excitement generated when we open a new store, the new stores generally experience higher net sales during the initial period of one to three months after which the new store's net sales will begin to normalize as it reaches maturity within six months of opening, as further discussed below.
Our planned store expansion will place increased demands on our operational, managerial, administrative and other resources. Managing our growth effectively will require us to continue to enhance our store management systems, financial and management controls and information systems. We will also be required to hire, train and retain store management and store personnel, which together with increased marketing costs, affects our operating margins.
A new store typically reaches maturity, meaning the store's annualized targeted sales volume has been reached, within six months of opening. New stores are included in the comparable store base during the sixteenth full fiscal month following the store's opening, which we believe represents the most appropriate comparison. We also periodically explore opportunities to relocate a limited number of existing stores to improve location, lease terms, store layout or customer experience. Relocated stores typically achieve a level of operating profitability comparable to our company-wide average for existing stores more quickly than new stores.
Rebranding initiative. During the fiscal year ended January 31, 2015, we launched a significant rebranding initiative through which we spent over $20 million in capital and expenses to change our brand and corporate name and convert and refresh all of our stores. We changed our name from "Garden Ridge" to "At Home", a name that we believe better communicates our positioning as the leading home décor superstore. We completed the rebranding initiative during the first nine months of fiscal year 2015 and now all of our stores operate under the At Home brand.
55
Infrastructure investment. Our historical operating results reflect the impact of our ongoing investments to support our growth. We have made significant investments in our business that we believe have laid the foundation for continued profitable growth. We believe that our strengthened management team, new brand identity, upgraded and automated distribution center and enhanced information systems, including our warehouse management and POS systems, enable us to replicate our profitable store format and differentiated shopping experience. We are also currently in the process of upgrading our inventory allocation system to better manage inventory for each store and corresponding customer base. We expect these infrastructure investments to support our successful operating model over a significantly expanded store base.
Pricing strategy. We are committed to providing our products at everyday low prices. We value engineer products in collaboration with our suppliers to recreate the "look" that we believe our customer wants while eliminating the costly construction elements that she does not value. We believe our customer views shopping At Home as an in-person experience through which she can see and feel the quality of our products and physically assemble her desired aesthetic. This design approach allows us to deliver an attractive value to our customers, as our products are typically less expensive than other branded products with a similar look. We employ a simple everyday low pricing strategy that consistently delivers savings to our customers without the need for extensive promotions, as evidenced by 80% of our net sales occurring at full price.
Our ability to source and distribute products effectively. Our net sales and gross profit are affected by our ability to purchase our products in sufficient quantities at competitive prices. While we believe our vendors have adequate capacity to meet our current and anticipated demand, our level of net sales could be adversely affected in the event of constraints in our supply chain, including the inability of our vendors to produce sufficient quantities of some merchandise in a manner that is able to match market demand from our customers, leading to lost sales.
Fluctuation in quarterly results. Our quarterly results have historically varied depending upon a variety of factors, including our product offerings, promotional events, store openings and shifts in the timing of holidays, among other things. As a result of these factors, our working capital requirements and demands on our product distribution and delivery network may fluctuate during the year.
Adverse weather conditions in fourth quarter of fiscal year 2014. During the fourth quarter of fiscal year 2014, we experienced negative comparable stores sales due to significant weather events that affected Texas and a number of the markets in which we do business. Two ice storms hit the region during December 2013, resulting in lower than expected sales and requiring us to take early markdowns on some of our merchandise during an important compressed holiday shopping period.
Inflation and deflation trends. Our financial results can be expected to be directly impacted by substantial increases in product costs due to commodity cost increases or general inflation which could lead to a reduction in our sales as well as greater margin pressure as costs may not be able to be passed on to consumers. To date, changes in commodity prices and general inflation have not materially impacted our business. In response to increasing commodity prices or general inflation, we seek to minimize the impact of such events by sourcing our merchandise from different vendors, changing our product mix or increasing our pricing when necessary.
Refinancings. In June 2015, we entered into a $300 million senior secured first lien term loan facility and a $130 million senior secured second lien term loan facility. The proceeds of these term loans were used to refinance and redeem in full our 10.75% senior secured notes due 2019, which reduced our overall cost of capital. In addition, we expect to use the proceeds of this offering to repay the senior secured second lien term loan facility, which will further reduce our cost of capital and debt service obligations. For more information, please see "—Liquidity and Capital Resources".
56
53rd week. Our fiscal year 2015 consisted of 53 weeks. Fiscal year 2014 consisted of 52 weeks. The 53rd week of fiscal year 2015 contributed $7.8 million to net sales. Please see "—Results of Operations" below for further discussion of the impact of the 53rd week on net sales.
How We Assess the Performance of Our Business
In assessing our performance, we consider a variety of performance and financial measures. The key measures include net sales, gross profit and gross margin, and selling, general and administrative expenses. In addition, we also review other important metrics such as Adjusted EBITDA and Store-level Adjusted EBITDA.
Net Sales
Net sales are derived from direct retail sales to customers in our stores, net of merchandise returns and discounts. Growth in net sales is impacted by opening new stores and increases in comparable store sales.
New store openings
The number of new store openings reflects the new stores opened during a particular reporting period, including any relocations of existing stores during such period. Before we open new stores, we incur pre-opening costs, as described below. The total number of new stores per year and the timing of store openings has, and will continue to have, an impact on our results as described above in "—Trends and Other Factors Affecting Our Business".
Comparable store sales
A store is included in the comparable store sales calculation on the first day of the sixteenth full fiscal month following the store's opening, which is when we believe comparability is achieved. When a store is being relocated or remodeled, we exclude sales from that store in the calculation of comparable store sales until the first day of the sixteenth full fiscal month after it reopens. In addition, when applicable, we adjust for the effect of the 53rd week. There may be variations in the way in which some of our competitors and other retailers calculate comparable or "same store" sales. As a result, data in this prospectus regarding our comparable store sales may not be comparable to similar data made available by other retailers.
Comparable store sales allow us to evaluate how our store base is performing by measuring the change in period-over-period net sales in stores that have been open for the applicable period. Various factors affect comparable store sales, including:
- •
- consumer preferences, buying trends and overall economic trends;
- •
- our ability to identify and respond effectively to customer preferences and trends;
- •
- our ability to provide an assortment of high quality and trend-right product offerings that generate new and repeat visits to our stores;
- •
- the customer experience we provide in our stores;
- •
- our ability to source and receive products accurately and timely;
- •
- changes in product pricing, including promotional activities;
- •
- the number of items purchased per store visit;
- •
- weather; and
- •
- timing and length of holiday shopping periods.
Opening new stores is an important part of our growth strategy. As we continue to pursue our growth strategy, we anticipate that an increasing percentage of our net sales will come from stores not included in our comparable store sales calculation. Accordingly, comparable store sales are only one measure we use to assess the success of our growth strategy.
Gross Profit and Gross Margin
Gross profit is determined by subtracting cost of sales from our net sales. Gross margin measures gross profit as a percentage of net sales.
57
Cost of sales consists of various expenses related to the cost of selling our merchandise. Cost of sales consists of the following: (1) cost of merchandise, net of inventory shrinkage, damages and vendor allowances; (2) inbound freight and internal transportation costs such as distribution center-to-store freight costs; (3) costs of operating our distribution center, including labor, occupancy costs, supplies, and depreciation and (4) store occupancy costs including rent, insurance, taxes, common area maintenance, utilities, repairs and maintenance and depreciation. The components of our cost of sales expenses may not be comparable to other retailers.
Selling, General and Administrative Expenses
Selling, general and administrative expenses ("SG&A") consist of various expenses related to supporting and facilitating the sale of merchandise in our stores. These costs include payroll, benefits and other personnel expenses for corporate and store employees, including stock-based compensation expense, consulting, legal and other professional services expenses, marketing and advertising expenses, occupancy costs for our corporate headquarters and various other expenses.
SG&A includes both fixed and variable components and, therefore, is not directly correlated with net sales. In addition, the components of our SG&A expenses may not be comparable to those of other retailers. We expect that our SG&A expenses will increase in future periods due to our continuing store growth and in part due to additional legal, accounting, insurance and other expenses that we expect to incur as a result of being a public company, including compliance with the Sarbanes-Oxley Act. In addition, any increase in future stock option or other stock-based grants or modifications will increase our stock-based compensation expense included in SG&A.
Adjusted EBITDA
Adjusted EBITDA is a key metric used by management and our board of directors to assess our financial performance. Adjusted EBITDA is also the basis for performance evaluation under our current executive compensation programs. In addition, Adjusted EBITDA is frequently used by analysts, investors and other interested parties to evaluate companies in our industry. In addition to covenant compliance and executive performance evaluations, we use Adjusted EBITDA to supplement GAAP measures of performance to evaluate the effectiveness of our business strategies, to make budgeting decisions and to compare our performance against that of other peer companies using similar measures.
Adjusted EBITDA is defined as net (loss) income before interest expense, net, loss from early extinguishment of debt, income tax (benefit) provision and depreciation and amortization, adjusted for the impact of certain other items as defined in our debt agreements, including legal settlements and consulting and other professional fees, costs associated with new store openings, relocation and employee recruiting incentives, management fees and expenses, stock-based compensation expense, impairment of our trade name and deferred rent. For a reconciliation of Adjusted EBITDA to net (loss) income, the most directly comparable GAAP measure, see "—Non-GAAP Financial Measures".
Store-level Adjusted EBITDA
We use Store-level Adjusted EBITDA as a supplemental measure of our performance, which represents our Adjusted EBITDA excluding the impact of certain corporate overhead expenses that we do not consider in our evaluation of the ongoing operating performance of our stores from period to period. Store-level Adjusted EBITDA is a supplemental measure of operating performance of our stores and our calculations thereof may not be comparable to similar measures reported by other companies. We believe that Store-level Adjusted EBITDA is an important measure to evaluate the performance and profitability of each of our stores, individually and in the aggregate, especially given the level of investments we have made in our home office and infrastructure over the past three years to support future growth. We also believe that Store-level Adjusted EBITDA is a useful measure in evaluating our operating performance because it removes the impact of general and administrative expenses, which are not incurred at the store level, and the costs of opening new stores, which are non-recurring at the store-level, and thereby enables the comparability of the operating performance of
58
our stores during the period. We use Store-level Adjusted EBITDA information to benchmark our performance versus competitors.
For a reconciliation of Store-level Adjusted EBITDA to net (loss) income, the most directly comparable GAAP measure, see "—Non-GAAP Financial Measures".
Results of Operations
The following tables summarize key components of our results of operations for the periods indicated, both in dollars and as a percentage of our net sales:
| |
Fiscal Year Ended | Twenty-six Weeks Ended | |||||||||||
|---|---|---|---|---|---|---|---|---|---|---|---|---|---|
| |
January 25, 2014 |
January 31, 2015 |
July 26, 2014 |
August 1, 2015 |
|||||||||
| |
(in thousands, except percentages and operational data) |
||||||||||||
Statement of Operations Data: |
|||||||||||||
Net sales |
$ | 403,966 | $ | 497,733 | $ | 229,915 | $ | 297,224 | |||||
Cost of sales |
272,021 | 335,617 | 150,617 | 197,147 | |||||||||
| | | | | | | | | | | | | | |
Gross profit |
131,945 | 162,116 | 79,298 | 100,077 | |||||||||
Operating Expenses |
|||||||||||||
Selling, general and administrative expenses |
74,255 | 110,503 | 44,246 | 61,295 | |||||||||
Impairment of trade name |
37,500 | — | — | — | |||||||||
Depreciation and amortization |
1,262 | 5,310 | 3,788 | 933 | |||||||||
| | | | | | | | | | | | | | |
Total operating expenses |
113,017 | 115,813 | 48,034 | 62,228 | |||||||||
Operating income |
18,928 | 46,303 | 31,264 | 37,849 | |||||||||
Interest expense, net |
41,152 | 42,382 | 20,553 | 19,768 | |||||||||
Loss on extinguishment of debt |
— | — | — | 36,046 | |||||||||
| | | | | | | | | | | | | | |
(Loss) income before income taxes |
(22,224 | ) | 3,921 | 10,711 | (17,965 | ) | |||||||
Income tax provision |
59 | 4,357 | 14,782 | 26,377 | |||||||||
| | | | | | | | | | | | | | |
Net loss |
$ | (22,283 | ) | $ | (436 | ) | $ | (4,071 | ) | $ | (44,342 | ) | |
| | | | | | | | | | | | | | |
| | | | | | | | | | | | | | |
| | | | | | | | | | | | | | |
Percentage of Net Sales: |
|||||||||||||
Net sales |
100.0 | % | 100.0 | % | 100.0 | % | 100.0 | % | |||||
Cost of sales |
67.3 | % | 67.4 | % | 65.5 | % | 66.3 | % | |||||
| | | | | | | | | | | | | | |
Gross profit |
32.7 | % | 32.6 | % | 34.5 | % | 33.7 | % | |||||
Operating Expenses |
|||||||||||||
Selling, general and administrative expenses |
18.4 | % | 22.2 | % | 19.2 | % | 20.6 | % | |||||
Impairment of trade name |
9.3 | % | — | — | — | ||||||||
Depreciation and amortization |
0.3 | % | 1.1 | % | 1.6 | % | 0.3 | % | |||||
| | | | | | | | | | | | | | |
Total operating expenses |
28.0 | % | 23.3 | % | 20.9 | % | 20.9 | % | |||||
Operating income |
4.7 | % | 9.3 | % | 13.6 | % | 12.7 | % | |||||
Interest expense, net |
10.2 | % | 8.5 | % | 8.9 | % | 6.7 | % | |||||
Loss on extinguishment of debt |
— | % | — | % | — | % | 12.1 | % | |||||
| | | | | | | | | | | | | | |
(Loss) income before income taxes |
(5.5 | )% | 0.8 | % | 4.7 | % | (6.0 | )% | |||||
Income tax provision |
0.0 | % | 0.9 | % | 6.4 | % | 8.9 | % | |||||
| | | | | | | | | | | | | | |
Net loss |
(5.5 | )% | (0.1 | )% | (1.8 | )% | (14.9 | )% | |||||
| | | | | | | | | | | | | | |
| | | | | | | | | | | | | | |
| | | | | | | | | | | | | | |
Operational Data: |
|||||||||||||
Total stores at end of period |
68 | 81 | 72 | 93 | |||||||||
New stores opened |
10 | 16 | 6 | 12 | |||||||||
Comparable store sales |
(0.4 | )% | 8.3 | % | 8.1 | % | 3.7 | % | |||||
Store-level Adjusted EBITDA |
$ | 113,273 | $ | 134,881 | $ | 66,922 | $ | 88,111 | |||||
Store-level Adjusted EBITDA margin |
28.0 | % | 27.1 | % | 29.1 | % | 29.6 | % | |||||
Adjusted EBITDA |
$ | 87,296 | $ | 97,311 | $ | 51,538 | $ | 64,027 | |||||
Adjusted EBITDA margin |
21.6 | % | 19.6 | % | 22.4 | % | 21.5 | % | |||||
59
Twenty-six Weeks Ended August 1, 2015 Compared to Twenty-six Weeks Ended July 26, 2014
Net Sales
Net sales increased $67.3 million, or 29.3%, to $297.2 million for the twenty-six weeks ended August 1, 2015 from $229.9 million for the twenty-six weeks ended July 26, 2014. This increase was primarily driven by approximately $56.7 million of incremental revenue from the net addition of 21 new stores since July 26, 2014 as well as an approximately $10.6 million increase from comparable store sales which increased 3.7% during the twenty-six weeks ended August 1, 2015 driven primarily by our rebranding initiatives.
Cost of Sales
Cost of sales increased $46.5 million, or 30.9%, to $197.1 million for the twenty-six weeks ended August 1, 2015 from $150.6 million for the twenty-six weeks ended July 26, 2014. This increase was primary driven by the 29.3% increase in net sales for the twenty-six weeks ended August 1, 2015 compared to the twenty-six weeks ended July 26, 2014, which resulted in a $27.3 million increase in merchandise costs, as well as a $5.6 million increase in depreciation and amortization and a $6.2 million increase in store occupancy costs as a result of new store openings since July 26, 2014.
Gross Profit and Gross Margin
Gross profit was $100.1 million, or 33.7% of net sales, for the twenty-six weeks ended August 1, 2015, an increase from $79.3 million, or 34.5% of net sales, for the twenty-six weeks ended July 26, 2014. The increase in gross profit was primarily driven by increased sales volume from the net addition of 21 new stores opened since July 26, 2014 as well as comparable stores sales growth. Gross margin declined 80 basis points during the twenty-six weeks ended August 1, 2015 primarily due to increased depreciation expense during the twenty-six weeks ended August 1, 2015 as a result of purchased stores and ground up builds that were opened throughout fiscal year 2015. Gross margins for new stores did not materially differ from those of comparable stores during the twenty-six weeks ended August 1, 2015 or the twenty-six weeks ended July 26, 2014, primarily as a result of the short six month period to maturity of new stores, as discussed under "—Trends and Other Factors Affecting Our Business—New store openings", following which the performance of new stores was consistent with comparable stores in each such period.
Selling, General and Administrative Expenses
Selling, general and administrative expenses were $61.3 million for the twenty-six weeks ended August 1, 2015 compared to $44.2 million for the twenty-six weeks ended July 26, 2014. As a percentage of sales, SG&A for the twenty-six weeks ended August 1, 2015 was 20.6% compared to 19.2% for the twenty-six weeks ended July 26, 2014. SG&A increased $17.1 million, or 38.5%, during the twenty-six weeks ended August 1, 2015 compared to the twenty-six weeks ended July 26, 2014. Selling, general and administrative expenses include corporate overhead expenses which represented $8.7 million of the increase resulting from additional home office support capabilities as well as increased marketing and advertising expenses and consulting and professional fees incurred to support our growth strategies. In addition, corporate overhead expenses for the twenty-six weeks ended July 26, 2014 includes a $2.1 million reduction due to proceeds received on an insurance matter. The remaining $8.4 million in increased selling, general and administrative expenses that was contributed by store operations was due primarily to a $3.9 million increase in payroll expenses resulting from new store headcount and a $2.7 million increase in store pre-opening costs as well as increases in various other administrative costs to support the continued growth in our store base.
Interest Expense, Net
Interest expense, net decreased to $19.8 million in the twenty-six weeks ended August 1, 2015 from $20.6 million in the twenty-six weeks ended July 26, 2014, a decrease of $0.8 million. The
60
decrease in interest expense resulted from the June 2015 Refinancing. See "—Liquidity and Capital Resources".
Loss on Extinguishment of Debt
During the twenty-six weeks ended August 1, 2015, we recognized a loss on extinguishment of debt of approximately $36.0 million resulting from the June 2015 Refinancing. The loss on extinguishment of debt also includes the write-off of $7.0 million of unamortized deferred debt issuance costs.
Income Tax Provision
Income tax expense was $26.4 million for the twenty-six weeks ended August 1, 2015 compared to $14.8 million for the twenty-six weeks ended July 26, 2014. The effective tax rate for the twenty-six weeks ended August 1, 2015 was (146.8)% compared to 138.0% for the twenty-six weeks ended July 26, 2014. The effective tax rate for the twenty-six weeks ended August 1, 2015 differs significantly from the federal statutory rate primarily due to the impact of changes in the valuation allowance on our deferred tax assets. In connection with the calculation of the estimated annual effective tax rate for the fiscal year ended January 31, 2015 and the fiscal year ending January 30, 2016 in accordance with ASC 740-270-25-2, we assess the expected change in our valuation allowance based on our forecasted year-end deductible and taxable cumulative temporary differences. Based on our forecast, our net deferred tax asset is expected to increase primarily as a result of additional accruals, deferred rent from our store growth and deferred compensation from the recognition of stock-based compensation expense. However, because the amount of reversing taxable temporary differences and the amount of losses available for carryback has remained relatively stable from January 31, 2015, the valuation allowance is expected to increase.
The effective tax rate calculated without the impact of the change in valuation allowance is 38.3%. The effective tax rate for the twenty-six weeks ended July 26, 2014 differs significantly from the federal statutory rate primarily due to the impact of state income taxes as well as the impact of changes in reserves for uncertain tax positions and changes in the valuation allowance on our deferred tax assets. State taxes for the twenty-six weeks ended July 26, 2014 were significant when compared to consolidated pre-tax earnings because certain expenses were not deductible in certain states for purposes of calculating state income taxes payable. We changed our legal structure in September 2014 and, as a result, have been able to increase deductions related to certain expenses for state income tax purposes.
We are required to assess the available positive and negative evidence to estimate if sufficient future income will be generated to utilize deferred tax assets. In making our assessment we determined that two sources of future income were available: (1) reversing taxable temporary differences and (2) the carryback of losses resulting from the reversals of deductible temporary differences in excess of reversing taxable temporary differences. We did not, however, identify any tax planning strategies which would serve as a source of future income. In addition, we do not believe that forecasted future taxable income exclusive of reversing temporary differences (i.e., pre-tax income plus permanent differences) is currently a reliable source of future income because of our cumulative loss position (generally defined as losses before income taxes incurred over the most recent three-year period) as of January 31, 2015 and the forecasted cumulative loss position we are expecting as of January 30, 2016. We believe the cumulative losses are a significant piece of negative evidence that limits our ability to consider other subjective evidence such as forecasted pre-tax income. We established a valuation allowance against our deferred tax assets as of January 25, 2014 since we were in a three year cumulative loss. As a result, we concluded that, because it was more likely than not that certain net deferred tax assets would not be realized, a valuation allowance was required to the extent these assets would not be realized through the future reversals of existing taxable temporary differences and the carry back of the resultant loss from the excess of reversing deferred tax assets over reversing deferred liabilities.
61
Fiscal Year Ended January 31, 2015 Compared to Fiscal Year Ended January 25, 2014
Net Sales
Net sales increased $93.7 million, or 23.2%, to $497.7 million for the fiscal year ended January 31, 2015 from $404.0 million for the fiscal year ended January 25, 2014. This increase was primarily driven by $54.5 million of incremental revenue primarily from the net addition of 13 new stores opened during fiscal year 2015 as well as growth from stores opened during fiscal year 2014, a $31.4 million increase in comparable store sales, as well as $7.8 million in net sales earned during the 53rd week of fiscal year 2015. Comparable store sales increased 8.3% during fiscal year 2015 driven primarily by our rebranding initiatives. In addition, during the fourth quarter of fiscal year 2014, we experienced negative comparable stores sales due to significant weather events that affected Texas and a number of the markets in which we do business. Two ice storms hit the region during December 2013, resulting in lower than expected sales and requiring us to take early markdowns on some of our merchandise.
Cost of Sales
Cost of sales increased $63.6 million, or 23.4%, to $335.6 million for the fiscal year ended January 31, 2015 from $272.0 million for the fiscal year ended January 25, 2014. The primary driver of the year over year increase was the 23% increase in net sales which resulted in a $41.3 million increase in merchandise costs, as well as a $6.1 million increase in depreciation and amortization and a $7.8 million increase in store occupancy costs as a result of new store openings over the last twelve months.
Gross Profit and Gross Margin
Gross profit was $162.1 million, or 32.6% of net sales, for the fiscal year ended January 31, 2015, an increase from $131.9 million, or 32.7% of net sales, for the fiscal year ended January 25, 2014. The growth in gross profit was primarily driven by increased sales volume from the net addition of 13 new stores opened during fiscal year 2015 as well as growth from stores opened during fiscal year 2014, growth in comparable store sales, and an additional $7.8 million in net sales earned during the 53rd week of fiscal year 2015. Gross margins for new stores did not materially differ from those of comparable stores during the fiscal year ended January 31, 2015 or the fiscal year ended January 25, 2014, primarily as a result of the short six month period to maturity of new stores, as discussed under "—Trends and Other Factors Affecting Our Business—New store openings", following which the performance of new stores was consistent with comparable stores in each such period.
Selling, General and Administrative Expenses
Selling, general and administrative expenses were $110.5 million for the fiscal year ended January 31, 2015 compared to $74.3 million for the fiscal year ended January 25, 2014. As a percentage of sales, SG&A for fiscal year 2015 was 22.2% compared to 18.4% for fiscal year 2014. SG&A increased $36.2 million, or 48.8%, during the fiscal year 2015 compared to fiscal year 2014. Selling, general and administrative expenses include corporate overhead expenses which represented $11.6 million of the increase resulting from additional home office support capabilities as well as increased occupancy expenses, marketing and advertising expenses and consulting and professional fees incurred to support our growth. The remaining $24.6 million increase in selling, general and administrative expenses that was contributed by store operations was due primarily to a $7.2 million increase in payroll expenses resulting from new store headcount, a $5.8 million increase in store pre-opening costs as well as increases in marketing and advertising and various other administrative costs to support the continued growth in our store base.
Impairment of Trade Name
During the fiscal year ended January 25, 2014, we recognized a $37.5 million impairment charge related to our former Garden Ridge trade name intangible asset as a result of our rebranding
62
initiative. The remaining value of the Garden Ridge trade name of $4.0 million was reclassified as a definite-lived intangible asset and amortized over the first nine months of fiscal year 2015 during which we completed our rebranding initiative. As of January 31, 2015, the Garden Ridge trade name definite-lived intangible asset was fully amortized and the carrying value of the At Home trade name was approximately $0.9 million. No impairment charges were recognized during the fiscal year ended January 31, 2015.
Interest Expense, Net
Interest expense, net increased to $42.4 million for the fiscal year ended January 31, 2015 from $41.2 million for the fiscal year ended January 25, 2014, an increase of $1.2 million, or 3.0%. The increase in interest expense resulted from interest expense incurred from the use of the ABL Facility as well as the financing obligations that were recorded for various leases during fiscal year 2015.
Income Tax Provision
Income tax expense was $4.4 million for the fiscal year ended January 31, 2015 compared to $0.1 million for the fiscal year ended January 25, 2014. The effective tax rate for fiscal year 2015 differs from the federal statutory rate because of the impact of state income taxes of $1.3 million as well as changes in reserves for uncertain tax positions of $0.7 million and changes in our federal valuation allowance on deferred tax assets of $1.0 million on pre-tax earnings of $3.9 million. The effective tax rate for fiscal year 2014 differs from the federal statutory rate because of the impact of state income taxes of $2.5 million as well as the impact of changes in reserves for uncertain tax positions of $0.7 million and changes in our federal valuation allowance on deferred tax assets of $4.7 million on a pre-tax loss of $22.2 million. State taxes in fiscal 2015 and 2014 were significant when compared to consolidated pre-tax earnings (loss) because state tax deductions were not available for certain corporate expenses for purposes of calculating state income taxes owed by the Company. A valuation allowance has been recorded in fiscal year 2014 and fiscal year 2015 because we concluded that it is more likely than not that certain net deferred tax assets will not be realized.
Non-GAAP Financial Measures
We present Adjusted EBITDA, Adjusted EBITDA margin, Store-level Adjusted EBITDA and Store-level Adjusted EBITDA margin, which are not recognized financial measures under GAAP, because we believe they assist investors and analysts in comparing our operating performance across reporting periods on a consistent basis by excluding items that we do not believe are indicative of our core operating performance, such as interest, depreciation, amortization, loss on extinguishment of debt and taxes, as well as costs related to new store openings, which are incurred on a limited basis with respect to any particular store when opened and are not indicative of ongoing core operating performance. You are encouraged to evaluate these adjustments and the reasons we consider them appropriate for supplemental analysis. In evaluating Adjusted EBITDA and Store-level Adjusted EBITDA, you should be aware that in the future we may incur expenses that are the same as or similar to some of the adjustments in our presentation of Adjusted EBITDA and Store-level Adjusted EBITDA. Our presentation of Adjusted EBITDA and Store-level Adjusted EBITDA should not be construed as an inference that our future results will be unaffected by unusual or non-recurring items. In addition, Adjusted EBITDA, Adjusted EBITDA margin, Store-level Adjusted EBITDA and Store-level Adjusted EBITDA margin may not be comparable to similarly titled measures used by other companies in our industry or across different industries.
Management believes Adjusted EBITDA is helpful in highlighting trends in our core operating performance, while other measures can differ significantly depending on long-term strategic decisions regarding capital structure, the tax jurisdictions in which companies operate and capital investments. In addition, we utilize Adjusted EBITDA in certain calculations under our ABL Facility (defined therein as "Consolidated EBITDA") and our Term Loan Facilities (defined therein as "Consolidated Cash EBITDA"). Management believes Store-level Adjusted EBITDA is helpful in highlighting trends because it facilitates comparisons of store operating performance from period to period by excluding the impact of certain corporate overhead expenses, such as certain costs associated with management, finance, accounting, legal and other central corporate functions.
63
The following table reconciles our net (loss) income to EBITDA (excluding loss on extinguishment of debt), Adjusted EBITDA and Store-level Adjusted EBITDA for the periods presented (in thousands):
| |
Fiscal Year Ended | Twenty-six Weeks Ended | |||||||||||
|---|---|---|---|---|---|---|---|---|---|---|---|---|---|
| |
January 25, 2014 |
January 31, 2015 |
July 26, 2014 |
August 1, 2015 |
|||||||||
Net loss |
$ | (22,283 | ) | $ | (436 | ) | $ | (4,071 | ) | $ | (44,342 | ) | |
Interest expense, net |
41,152 | 42,382 | 20,553 | 19,768 | |||||||||
Loss on extinguishment of debt |
— | — | — | 36,046 | |||||||||
Income tax provision |
59 | 4,357 | 14,782 | 26,377 | |||||||||
Depreciation and amortization(a) |
13,132 | 23,317 | 10,418 | 13,194 | |||||||||
| | | | | | | | | | | | | | |
EBITDA |
$ | 32,060 | $ | 69,620 | $ | 41,682 | $ | 51,043 | |||||
Legal settlements and consulting and other professional services(b) |
2,874 | 4,633 | 931 | 1,947 | |||||||||
Costs associated with new store openings(c) |
2,023 | 6,848 | 1,749 | 4,332 | |||||||||
Relocation and employee recruiting costs(d) |
4,442 | 2,928 | 912 | 237 | |||||||||
Management fees and expenses(e) |
3,690 | 3,596 | 1,775 | 1,835 | |||||||||
Stock-based compensation expense(f) |
4,373 | 4,251 | 2,108 | 2,292 | |||||||||
Impairment of trade name(g) |
37,500 | — | — | — | |||||||||
Deferred rent(h) |
1,695 | 3,554 | 1,737 | 2,420 | |||||||||
Other(i) |
(1,361 | ) | 1,881 | 644 | (79 | ) | |||||||
| | | | | | | | | | | | | | |
Adjusted EBITDA |
$ | 87,296 | $ | 97,311 | $ | 51,538 | $ | 64,027 | |||||
| | | | | | | | | | | | | | |
Corporate overhead expenses(j) |
25,977 | 37,570 | 15,384 | 24,084 | |||||||||
| | | | | | | | | | | | | | |
Store-level Adjusted EBITDA |
$ | 113,273 | $ | 134,881 | $ | 66,922 | $ | 88,111 | |||||
| | | | | | | | | | | | | | |
| | | | | | | | | | | | | | |
| | | | | | | | | | | | | | |
- (a)
- Includes the portion of depreciation and amortization expenses that are classified as cost of sales in the statements of operations included elsewhere in this prospectus.
- (b)
- Primarily consists of (i) litigation settlement charges and related legal fees for prior claims that have concluded and (ii) consulting and other professional fees with respect to projects to enhance our accounting and finance capabilities.
- (c)
- Non-capital expenditures associated with opening new stores. We anticipate that we will continue to incur cash costs as we open new stores in the future.
- (d)
- Primarily reflects (i) relocation expenses associated with moving our corporate headquarters from Houston to Plano and related relocation bonuses and (ii) employee recruiting costs in connection with the build-out of our management team.
- (e)
- Reflects management fees paid to our Sponsors. After this offering, our Sponsors will no longer receive management fees from us.
- (f)
- Consists of non-cash stock-based compensation expense related to stock option awards.
- (g)
- Reflects the impairment of the Garden Ridge trade name as a result of our rebranding initiative.
- (h)
- Consists of non-cash deferred rent, which better reflects the current rent obligations of the business.
64
- (i)
- Other
adjustments include amounts our management believes are not representative of our ongoing operations,
including:
- •
- for fiscal year 2014, an insurance reimbursement of $1.6 million; and
- •
- for fiscal year 2015, asset retirements related to our rebranding of $0.6 million and $0.4 million for a store relocation.
- (j)
- Reflects corporate overhead expenses, which are not directly related to the profitability of our stores, to facilitate comparisons of store operating performance from period to period. Corporate overhead expenses, which are a component of selling, general and administrative expenses, are comprised of various home office general and administrative expenses such as payroll expenses, occupancy costs, marketing and advertising, and consulting and professional fees. See our discussion of the changes in selling, general and administrative expenses presented in "—Results of Operations".
Quarterly Results of Operations and Seasonality
Our business is moderately seasonal in nature. Historically, our business has realized a slightly higher portion of net sales and operating income in the second and fourth fiscal quarters, attributable primarily to the impact of the summer and year-end holiday decorating season, respectively. However, our broad and comprehensive product offering makes us less susceptible to holiday shopping seasonal patterns than many other retailers. In addition, our marketing plan is designed to minimize volatility and seasonal fluctuations of sales across periods. Our quarterly results have been and will continue to be affected by the timing of new store openings and their associated pre-opening costs. As a result of these factors, our financial results for any single quarter or for periods of less than a year are not necessarily indicative of the results that may be achieved for a full fiscal year.
The following table sets forth certain unaudited financial and operating information for each fiscal quarter during fiscal year 2014, fiscal year 2015 and the first and second fiscal quarters of fiscal year 2016. The quarterly information includes all adjustments (consisting of normal recurring adjustments) that, in the opinion of management, are necessary for a fair presentation of the information presented. This information should be read in conjunction with the consolidated financial statements and related notes thereto included elsewhere in this prospectus. Operating results for interim periods are not necessarily indicative of the results that may be expected for a full fiscal year.
| |
Fiscal Year 2014 | Fiscal Year 2015 | Fiscal Year 2016 | ||||||||||||||||||||||||||||
|---|---|---|---|---|---|---|---|---|---|---|---|---|---|---|---|---|---|---|---|---|---|---|---|---|---|---|---|---|---|---|---|
| |
First Quarter |
Second Quarter |
Third Quarter |
Fourth Quarter(1) |
First Quarter |
Second Quarter |
Third Quarter |
Fourth Quarter(2) |
First Quarter |
Second Quarter(3) |
|||||||||||||||||||||
| |
(in thousands, except percentages and other operating data) |
||||||||||||||||||||||||||||||
Net sales |
$ | 93,100 | $ | 101,814 | $ | 87,768 | $ | 121,284 | $ | 107,471 | $ | 122,443 | $ | 112,884 | $ | 154,935 | $ | 141,217 | $ | 156,007 | |||||||||||
Gross profit |
31,454 | 33,951 | 23,961 | 42,579 | 36,152 | 43,146 | 33,379 | 49,439 | 47,305 | 52,772 | |||||||||||||||||||||
Income (loss) from operations |
15,061 | 17,034 | 5,295 | (18,462 | ) | 13,903 | 17,361 | (169 | ) | 15,208 | 16,898 | 20,951 | |||||||||||||||||||
Net income (loss) |
3,469 | 4,691 | (3,773 | ) | (26,670 | ) | (1,357 | ) | (2,715 | ) | 4,906 | (1,270 | ) | 1,768 | (46,110 | ) | |||||||||||||||
Percentage of Net Sales: |
|||||||||||||||||||||||||||||||
Net sales |
100.0 | % | 100.0 | % | 100.0 | % | 100.0 | % | 100.0 | % | 100.0 | % | 100.0 | % | 100.0 | % | 100.0 | % | 100.0 | % | |||||||||||
Gross profit |
33.8 | % | 33.3 | % | 27.3 | % | 35.1 | % | 33.6 | % | 35.2 | % | 29.6 | % | 31.9 | % | 33.5 | % | 33.8 | % | |||||||||||
Income (loss) from operations |
16.2 | % | 16.7 | % | 6.0 | % | (15.2 | )% | 12.9 | % | 14.2 | % | (0.1 | )% | 9.8 | % | 12.0 | % | 13.4 | % | |||||||||||
Net income (loss) |
3.7 | % | 4.6 | % | (4.3 | )% | (22.0 | )% | (1.3 | )% | (2.2 | )% | 4.3 | % | (0.8 | )% | 1.2 | % | (29.7 | )% | |||||||||||
65
| |
Fiscal Year 2014 | Fiscal Year 2015 | Fiscal Year 2016 | ||||||||||||||||||||||||||||
|---|---|---|---|---|---|---|---|---|---|---|---|---|---|---|---|---|---|---|---|---|---|---|---|---|---|---|---|---|---|---|---|
| |
First Quarter |
Second Quarter |
Third Quarter |
Fourth Quarter(1) |
First Quarter |
Second Quarter |
Third Quarter |
Fourth Quarter(2) |
First Quarter |
Second Quarter(3) |
|||||||||||||||||||||
| |
(in thousands, except percentages and other operating data) |
||||||||||||||||||||||||||||||
Other operating data: |
|||||||||||||||||||||||||||||||
Total stores at end of period |
60 | 62 | 65 | 68 | 68 | 72 | 81 | 81 | 86 | 93 | |||||||||||||||||||||
Comparable store sales |
(7.1 | )% | 2.9 | % | 4.9 | % | (1.2 | )% | 6.6 | % | 9.8 | % | 11.6 | % | 6.1 | % | 3.8 | % | 3.5 | % | |||||||||||
Store-level Adjusted EBITDA(4) |
$ | 27,605 | $ | 28,922 | $ | 20,197 | $ | 36,549 | $ | 30,596 | $ | 36,325 | $ | 25,174 | $ | 42,786 | $ | 42,141 | $ | 45,969 | |||||||||||
Store-level Adjusted EBITDA margin |
29.7 | % | 28.4 | % | 23.0 | % | 30.1 | % | 28.5 | % | 29.7 | % | 22.3 | % | 27.6 | % | 29.8 | % | 29.5 | % | |||||||||||
Adjusted EBITDA(4) |
$ | 21,649 | $ | 21,996 | $ | 14,342 | $ | 29,308 | $ | 23,935 | $ | 27,602 | $ | 14,380 | $ | 31,393 | $ | 30,074 | $ | 33,952 | |||||||||||
Adjusted EBITDA margin |
23.3 | % | 21.6 | % | 16.3 | % | 24.2 | % | 22.3 | % | 22.5 | % | 12.7 | % | 20.3 | % | 21.3 | % | 21.8 | % | |||||||||||
- (1)
- The fourth quarter of fiscal year 2014 includes a $37.5 million impairment charge that was recognized on our former Garden Ridge trade name intangible asset as a result of our rebranding initiative. The fourth quarter of fiscal year 2014 also includes a $6 million charge to establish a valuation allowance on our net deferred tax asset.
- (2)
- The fourth quarter of fiscal year 2015 contained 14 weeks, as compared to the fourth quarter of fiscal year 2014, which contained 13 weeks.
- (3)
- The second quarter of fiscal year 2016 includes a $36.0 million loss on extinguishment of debt that was recognized as a result of the redemption of the Senior Secured Notes.
- (4)
- A reconciliation of net income (loss) to EBITDA (excluding loss on extinguishment of debt), Adjusted EBITDA and Store-level Adjusted EBITDA is set forth below:
| |
Fiscal Year 2014 | Fiscal Year 2015 | Fiscal Year 2016 | ||||||||||||||||||||||||||||
|---|---|---|---|---|---|---|---|---|---|---|---|---|---|---|---|---|---|---|---|---|---|---|---|---|---|---|---|---|---|---|---|
| |
First Quarter |
Second Quarter |
Third Quarter |
Fourth Quarter |
First Quarter |
Second Quarter |
Third Quarter |
Fourth Quarter |
First Quarter |
Second Quarter |
|||||||||||||||||||||
| |
(in thousands) |
||||||||||||||||||||||||||||||
Net income (loss) |
$ | 3,469 | $ | 4,691 | $ | (3,773 | ) | $ | (26,670 | ) | $ | (1,357 | ) | $ | (2,715 | ) | $ | 4,906 | $ | (1,270 | ) | $ | 1,768 | $ | (46,110 | ) | |||||
Interest expense, net |
10,278 | 10,300 | 10,428 | 10,146 | 10,360 | 10,193 | 10,830 | 10,999 | 10,806 | 8,961 | |||||||||||||||||||||
Loss on extinguishment of debt |
— | — | — | — | — | — | — | — | — | 36,046 | |||||||||||||||||||||
Income tax provision (benefit) |
1,314 | 2,042 | (1,359 | ) | (1,938 | ) | 4,900 | 9,882 | (15,904 | ) | 5,479 | 4,324 | 22,054 | ||||||||||||||||||
Depreciation and amortization(a) |
3,266 | 3,257 | 4,371 | 2,238 | 5,386 | 5,032 | 6,218 | 6,681 | 6,175 | 7,019 | |||||||||||||||||||||
| | | | | | | | | | | | | | | | | | | | | | | | | | | | | | | | |
EBITDA |
18,327 | 20,290 | 9,667 | (16,224 | ) | 19,289 | 22,392 | 6,050 | 21,889 | 23,073 | 27,970 | ||||||||||||||||||||
Legal settlements and consulting and other professional services(b) |
247 | 228 | 505 | 1,895 | 487 | 444 | 1,589 | 2,113 | 978 | 970 | |||||||||||||||||||||
Costs associated with new store openings(c) |
444 | 364 | 414 | 800 | 807 | 941 | 2,215 | 2,884 | 2,028 | 2,304 | |||||||||||||||||||||
Relocation and employee recruiting costs(d) |
423 | 395 | 1,393 | 2,231 | 564 | 348 | 1,475 | 541 | 167 | 69 | |||||||||||||||||||||
Management fees and expenses(e) |
945 | 936 | 956 | 853 | 875 | 900 | 875 | 946 | 887 | 948 | |||||||||||||||||||||
Stock-based compensation expense(f) |
1,356 | 916 | 1,083 | 1,018 | 1,047 | 1,061 | 1,065 | 1,078 | 1,109 | 1,183 | |||||||||||||||||||||
Impairment of trade name(g) |
— | — | — | 37,500 | — | — | — | — | — | — | |||||||||||||||||||||
Deferred rent(h) |
357 | 360 | 282 | 696 | 601 | 1,136 | 863 | 953 | 889 | 1,499 | |||||||||||||||||||||
Other(i) |
(450 | ) | (1,493 | ) | 42 | 539 | 265 | 380 | 248 | 989 | 943 | (991 | ) | ||||||||||||||||||
| | | | | | | | | | | | | | | | | | | | | | | | | | | | | | | | |
Adjusted EBITDA |
$ | 21,649 | $ | 21,996 | $ | 14,342 | $ | 29,308 | $ | 23,935 | $ | 27,602 | $ | 14,380 | $ | 31,393 | $ | 30,074 | $ | 33,952 | |||||||||||
| | | | | | | | | | | | | | | | | | | | | | | | | | | | | | | | |
Corporate overhead expenses(j) |
5,956 | 6,926 | 5,855 | 7,241 | 6,661 | 8,723 | 10,794 | 11,393 | 12,067 | 12,017 | |||||||||||||||||||||
| | | | | | | | | | | | | | | | | | | | | | | | | | | | | | | | |
Store-level Adjusted EBITDA |
$ | 27,605 | $ | 28,922 | $ | 20,197 | $ | 36,549 | $ | 30,596 | $ | 36,325 | $ | 25,174 | $ | 42,786 | $ | 42,141 | $ | 45,969 | |||||||||||
| | | | | | | | | | | | | | | | | | | | | | | | | | | | | | | | |
| | | | | | | | | | | | | | | | | | | | | | | | | | | | | | | | |
| | | | | | | | | | | | | | | | | | | | | | | | | | | | | | | | |
- (a)
- Includes the portion of depreciation and amortization expenses that are classified as cost of sales in the statements of operations included elsewhere in this prospectus.
- (b)
- Primarily consists of (i) litigation settlement charges and related legal fees for prior claims that have concluded and (ii) consulting and other professional fees with respect to projects to enhance our accounting and finance capabilities.
- (c)
- Non-capital expenditures associated with opening new stores. We anticipate that we will continue to incur cash costs as we open new stores in the future.
- (d)
- Primarily reflects (i) relocation expenses associated with moving our corporate headquarters from Houston to Plano and related relocation bonuses and (ii) employee recruiting costs in connection with the build-out of our management team.
- (e)
- Reflects management fees paid to our Sponsors. After this offering, our Sponsors will no longer receive management fees from us.
- (f)
- Consists of non-cash stock-based compensation expense related to stock option awards.
- (g)
- Reflects the impairment of the Garden Ridge trade name as a result of our rebranding initiative.
- (h)
- Consists of non-cash deferred rent, which better reflects the current rent obligations of the business.
- (i)
- Other
adjustments include amounts our management believes are not representative of our ongoing operations,
including:
- •
- for the second quarter of fiscal year 2014, an insurance reimbursement of $1.6 million;
- •
- for the fourth quarter of fiscal year 2015, asset retirements related to our rebranding of $0.6 million and $0.4 million for a store relocation; and
- •
- for the second quarter of fiscal year 2016, gain of $1.8 million recognized on the sale of our property in Houston, Texas.
- (j)
- Reflects corporate overhead expenses, which are not directly related to the profitability of our stores, to facilitate comparisons of store operating performance from period to period. Corporate overhead expenses, which are a component of selling, general and administrative expenses, are comprised of various home office general and administrative expenses such as payroll expenses, occupancy costs, marketing and advertising, and consulting and professional fees. See our discussion of the changes in selling, general and administrative expenses presented in "—Results of Operations".
66
Liquidity and Capital Resources
Our principal sources of liquidity are our cash generated by operating activities, proceeds from sale-leaseback transactions and borrowings under our ABL Facility. Historically, we have financed our operations primarily from cash generated from operations and periodic borrowings under our ABL Facility. Our primary cash needs are for day-to-day operations, to provide for infrastructure investments in our stores, to finance new store openings, to pay interest and principal on our indebtedness and to fund working capital requirements for seasonal inventory builds and new store inventory purchases.
As of August 1, 2015, we had $6.2 million of cash and cash equivalents and $69.0 million in borrowing availability under our ABL Facility. There were $0.7 million in letters of credit outstanding under the ABL Facility at that date. The availability under our ABL Facility is determined in accordance with a borrowing base which can decline due to various factors. Therefore, amounts under our ABL Facility may not be available when we need them.
In June 2015, we entered into a $300.0 million senior secured first lien term loan facility and $130.0 million senior secured second lien term loan facility. A portion of the proceeds from these term loans was used to refinance and redeem our Senior Secured Notes, which will reduce our interest expense in the future. The interest rates on the term loans are variable; based on LIBOR rates in effect at June 5, 2015, we would be subject to interest payments on the term loans at a blended effective rate of 6.21%. For additional details on such debt agreements entered into in June 2015, see "—Term Loan Facilities." In addition, we expect to use proceeds from this offering to repay the second lien term loan facility, which will further reduce our interest expense in the future. Historically, we were not subject to principal amortization payments under the Indenture governing the Senior Secured Notes. The first lien term loan is repayable in equal quarterly installments of $0.75 million and the second lien term loan does not require periodic principal payments. For additional information on principal and interest obligations in connection with such debt agreements, see "—Contractual Obligations".
Our capital expenditures can vary depending on the timing of new store openings and infrastructure-related investments. We currently estimate that our capital expenditures, net of proceeds from sale-leaseback transactions of approximately $56 million, will be in the range of $45 million to $55 million for the fiscal year ending January 30, 2016. We estimate that our capital expenditures for the fiscal year ending January 28, 2017 will be in the range of $50 million to $60 million, net of proceeds from anticipated sale-leaseback transactions of $80 million to $90 million. We plan to invest in the infrastructure necessary to support the further development of our business and continued growth. In fiscal year 2016, we plan to open 20 new stores and we expect our net capital expenditures will be substantially financed with cash from operating activities, proceeds from our ABL Facility and sale-leaseback transactions.
Based on our growth plans, we believe that our cash position, net cash provided by operating activities and availability under our ABL Facility will be adequate to finance our planned capital expenditures, working capital requirements and debt service obligations over the next twelve months and the foreseeable future thereafter. If cash flows from operations and borrowings under our ABL Facility are not sufficient or available to meet our capital requirements, then we will be required to obtain additional equity or debt financing in the future. There can be no assurance that equity or debt financing will be available to us when we need it or, if available, that the terms will be satisfactory to us and not dilutive to our then-current shareholders.
Our indebtedness could adversely affect our ability to raise additional capital, limit our ability to react to changes in the economy or our industry, expose us to interest rate risk and prevent us from meeting our obligations. Management reacts strategically to changes in economic conditions and monitors compliance with debt covenants to seek to mitigate any potential material impacts to our financial condition and flexibility.
67
Sale-Leaseback Transactions
As part of our flexible real estate strategy, we utilize sale-leaseback transactions to finance investments previously made for the purchase of second generation properties and the recent construction of new store locations. This enhances our ability to access a range of locations and facilities efficiently. We factor sale-leaseback transactions into our capital allocation decisions. In order to support the execution of sale-leaseback transactions, we have relationships with a number of major publicly traded REITs, who have demonstrated a strong demand for our portfolio of assets.
In certain cases, the sale is treated as a like-kind exchange transaction for U.S. federal income tax purposes in accordance with Section 1031 of the Internal Revenue Code (the "Code"). Section 1031 of the Code allows companies to defer the taxable gain realized from the sale of certain "relinquished" real property if the proceeds are reinvested, in a timely manner, in qualifying like kind "replacement" property. In addition, Section 1031 of the Code requires the sale proceeds of the relinquished property to be held in a restricted cash account by a third-party qualified intermediary, pending utilization thereof for the acquisition of a qualifying replacement property.
In October 2013, we sold our distribution center and corporate headquarters property located at 1600 East Plano Parkway, Plano, Texas, 75074 for $35.8 million. The property continues to serve as our distribution center and corporate headquarters through the leaseback of the property entered into contemporaneously with the closing of the sale. Cumulative annual rent under the lease is $2.5 million, subject to annual escalations. The sale of this property is being treated as a like-kind exchange for U.S. federal income tax purposes in accordance with Section 1031 of the Code.
In September 2014, we sold four of our properties in Raleigh, North Carolina, Mesa, Arizona, Lubbock, Texas and Louisville, Kentucky for a total of $40.9 million. Contemporaneously with the closing of the sale, certain of our indirect wholly-owned subsidiaries entered into four leases, pursuant to which they leased back the properties for cumulative annual rent of $2.8 million, subject to annual escalations. The sale of the properties located in Lubbock, Texas and Louisville, Kentucky are being treated as like-kind exchanges for U.S. federal income tax purposes in accordance with Section 1031 of the Code.
In January 2015, we sold our property located in Omaha, Nebraska for approximately $8.0 million. Contemporaneously with the closing of the sale, an indirect wholly-owned subsidiary of ours entered into a lease, pursuant to which we leased back the property for cumulative annual rent of $0.5 million, subject to annual escalations.
In September 2015, we sold five of our properties in Grand Prairie, Texas, Toledo, Ohio, Pharr, Texas, New Braunfels, Texas, and Gulfport, Mississippi for a total of $40.2 million. Contemporaneously with the closing of the sale, we entered into a lease pursuant to which we leased back the properties for cumulative annual rent of $2.7 million, subject to annual escalations. Approximately $5.5 million of the proceeds from the sale were used to pay off notes payable related the Grand Prairie and New Braunfels properties.
See "Risk Factors—Risks Relating to Our Business—We are subject to risks associated with our sale-leaseback strategy."
Summary of Cash Flows
A summary of our cash flows from operating, investing and financing activities is presented in the following table (in thousands):
| |
Fiscal Year Ended | Twenty-six Weeks Ended | |||||||||||
|---|---|---|---|---|---|---|---|---|---|---|---|---|---|
| |
January 25, 2014 |
January 31, 2015 |
July 26, 2014 |
August 1, 2015 |
|||||||||
Net Cash Provided by (Used in) Operating Activities |
$ | 35,695 | $ | 15,321 | $ | (7,701 | ) | $ | (1,935 | ) | |||
Net Cash Used in Investing Activities |
(30,310 | ) | (100,098 | ) | (59,719 | ) | (23,271 | ) | |||||
Net Cash (Used in) Provided by Financing Activities |
(4,032 | ) | 84,512 | 67,460 | 26,651 | ||||||||
Net Increase (Decrease) in Cash and Cash Equivalents |
1,353 | (265 | ) | 40 | 1,445 | ||||||||
68
Net Cash Provided by (Used in) Operating Activities
Net cash used in operating activities was $1.9 million for the twenty-six weeks ended August 1, 2015 compared to $7.7 million during the twenty-six weeks ended July 26, 2014. The $5.8 million decrease in cash used in operating activities was primarily due to a $6.6 million increase in operating income as well as an $11.5 million decrease in cash paid for income taxes partially offset by a $3.9 million increase in purchases of merchandise inventories and a $4.3 million increase in accounts payable, primarily due to the timing of rent payments, during the twenty-six weeks ended August 1, 2015 compared to the twenty-six weeks ended July 26, 2014. Inventory levels at the end of the second quarter of fiscal 2016 were $167.6 million, an increase of $25.3 million, or 17.8%, from the end of fiscal 2015. The increase in inventories was primarily due to new store growth during fiscal 2015 and the first six months of fiscal 2016 as well as the seasonal build of holiday assortments.
Net cash provided by operating activities was $15.3 million for the fiscal year ended January 31, 2015 and compared to $35.7 million for the fiscal year ended January 25, 2014. The $20.4 million decrease was primarily due to a $19.4 million increase in purchases of merchandise inventories, an $11.1 million increase in cash paid for income taxes and a $6.0 million increase in accrued liabilities. These changes were partially offset by a $2.8 million increase in operating income, as well as a $17.3 million decrease in accounts payable due to the timing of vendor payments. Inventory levels at the end of fiscal 2015 were $142.3 million, an increase of $31.3 million, or 30.4%, from the end of fiscal 2014. The increase in inventories was due to new store growth during fiscal 2015, the build of inventory in preparation for new store openings in fiscal year 2016 as well as the acceleration of purchases due to the shift in the timing of the Chinese New Year.
Net Cash Used in Investing Activities
Net cash used in investing activities was $23.3 million for the twenty-six weeks ended August 1, 2015 compared to $59.7 million for the twenty-six weeks ended July 26, 2014. The $36.4 million decrease was primarily driven by an additional $12.9 million in capital expenditures during the twenty-six weeks ended July 26, 2014 as a result of more purchased stores and ground up builds during that period as compared to more leased stores during the twenty-six weeks ended August 1, 2015. Capital expenditures of $45.3 million for the twenty-six weeks ended August 1, 2015 consisted of $39.0 million invested in new store growth with the remaining $6.3 million related to maintenance expenditures and investments in information technology. Capital expenditures during the twenty-six weeks ended August 1, 2015 were offset by $15.7 million in net restricted cash proceeds related to sale-leaseback transactions that were consummated during the period where the sale was treated as a like-kind exchange transaction in accordance with Section 1031 of the Code, as well as $6.3 million in proceeds from the sale of a property in Houston, Texas. Capital expenditures during the twenty-six weeks ended July 26, 2014 were offset by $17.7 million in net restricted cash proceeds related to sale-leaseback transactions that were consummated during the period where the sale was treated as a like-kind exchange transaction in accordance with Section 1031 of the Code.
Net cash used in investing activities was $100.1 million for the fiscal year ended January 31, 2015 compared to $30.3 million for the fiscal year ended January 24, 2015. The $69.8 million increase was primarily driven by an $89.8 million increase in capital expenditures. The capital expenditures of $137.0 million during fiscal year 2015 consisted of $104.1 million invested in new store growth, $17.1 million related to our rebranding initiative and $9.5 million for automation within our distribution center with the remaining expenditures being related to maintenance expenditures for investments in information technology, our home office and store maintenance. In addition, change in restricted cash decreased $18.5 million as compared to fiscal year 2014.
69
Net Cash (Used in) Provided by Financing Activities
Net cash provided by financing activities was $26.7 million for the twenty-six weeks ended August 1, 2015 compared to $67.5 million for the twenty-six weeks ended July 26, 2014, a decrease of $40.8 million primarily due to a $64.8 million decrease in net proceeds from borrowings under our ABL Facility. This decrease was partially offset by $27.3 million in net proceeds from borrowings under the Term Loan Facilities after payment of related debt issuances costs and the redemption of the Senior Secured Notes.
Net cash provided by financing activities was $84.5 million for the fiscal year ended January 31, 2015 compared to $4.0 million in cash used for financing activities for the fiscal year ended January 25, 2014. The $88.5 million increase is due to a $70.3 million increase in net proceeds from borrowings under our ABL Facility, $12.2 million in proceeds from financing obligations and $6.5 million in proceeds from the issuance of notes payable related to the purchase of property.
Financing Obligations
In some cases, the asset we will lease requires construction in order to ready the space for its intended use and, in certain cases, we are involved in the construction of leased assets. The construction period typically begins when we execute our lease agreement with the landlord and continues until the space is substantially complete and ready for its intended use. In accordance with Accounting Standards Codification ("ASC") 840-40-55 (Topic 840, "Leases"), we must consider the nature and extent of our involvement during the construction period and, in some cases, our involvement results in our being considered the accounting owner of the construction project. By completing the construction of key structural components of a leased building, we are deemed to have participated in the construction of the landlord's asset. In such cases, we capitalize the landlord's construction costs, including the value of costs incurred up to the date we execute our lease and costs incurred during the remainder of construction period, as such costs are incurred. Additionally, ASC 840-40-55 requires us to recognize a financing obligation for construction costs incurred by the landlord. Once construction is complete, we are required to perform a sale-leaseback analysis pursuant to ASC 840-40 to determine if we can remove the landlord's assets and associated financing obligations from our consolidated balance sheet. In certain leases, we maintain various forms of "prohibited continuing involvement" in the property, thereby precluding us from derecognizing the asset and associated financing obligations following the construction completion. In those cases, we will continue to account for the landlord's asset as if we are the legal owner, and the financing obligation, similar to other debt, until the lease expires or is modified to remove the continuing involvement that prohibits derecognition. Once derecognition is permitted, we would be required to account for the lease as either operating or capital in accordance with ASC 840. As of January 31, 2015, we have not derecognized any landlord assets or associated financing obligations.
In September 2014, we sold our property in Mesa, Arizona and contemporaneously with the closing of the sale, we entered into a lease pursuant to which we leased back the property. At the time of the sale-leaseback transaction, a prohibited form of continuing involvement existed due to an existing sublease with an occupant of a portion of the property. In accordance with ASC 840, the lease was accounted for as a financing transaction with the property remaining on our books at its then current carrying amount of $4.2 million, the proceeds received for the sale of the property were reflected as a financing obligation of $12.2 million, and future rental payments to the landlord will be treated as debt service and applied to interest and principal.
Term Loan Facilities
On June 5, 2015, our indirect wholly owned subsidiary, At Home Holding III Inc. ("At Home III") entered into a first lien credit agreement (the "First Lien Agreement"), by and among the At Home III, guaranteed by At Home Holding II Inc., a direct wholly owned subsidiary of ours ("At
70
Home II"), various lenders and Bank of America, N.A., as administrative agent and collateral agent. The First Lien Agreement provides for a $300.0 million term loan ("First Lien Facility"), which amount was borrowed on June 5, 2015. The First Lien Facility will mature on June 3, 2022, and is repayable in equal quarterly installments of $0.75 million for an annual aggregate amount equal to 1% of the original principal amount of $300.0 million. At Home III has the option of paying interest on a 1-month, 2-month or quarterly basis on the First Lien Facility at an annual rate of LIBOR (subject to a 1% floor) plus 4.00%, subject to, after a qualifying IPO, a 0.50% reduction if a certain secured net leverage ratio level is met.
On June 5, 2015, At Home III entered into a second lien credit agreement (the "Second Lien Agreement"), by and among At Home III, At Home II and Dynasty Financial II, LLC, as administrative agent, collateral agent and lender. The Second Lien Agreement provides for a $130.0 million term loan (the "Second Lien Facility" and, together with the First Lien Facility, the "Term Loan Facilities"), which amount was borrowed on June 5, 2015. The Second Lien Facility will mature on June 5, 2023 and does not require periodic principal payments, with the total amount outstanding, plus accrued interest, due at maturity. At Home III has the option of paying interest on a 1-month, 2-month or quarterly basis on the Second Lien Facility at an annual rate of LIBOR (subject to a 1% floor) plus 8.00%.
The Term Loan Facilities permit us to add one or more incremental term loans up to $50.0 million (shared between the First Lien Facility and the Second Lien Facility) plus additional amounts subject to our compliance with, with respect to the First Lien Facility, a first lien net leverage ratio test, and, with respect to the Second Lien Facility, a secured net leverage ratio test. The first lien net leverage ratio test and the secured net leverage ratio test are calculated using Adjusted EBITDA, which is defined as "Consolidated EBITDA" under our credit agreements.
The Term Loan Facilities have various non-financial covenants, customary representations and warranties, events of defaults and remedies, substantially similar to those described in respect of the ABL Facility below. There are no financial maintenance covenants in the Term Loan Facilities. As of August 1, 2015, we were in compliance with all covenants prescribed under the Term Loan Facilities.
At our option, the First Lien Facility may be prepaid on or prior to June 5, 2016 subject to, in the case of a repricing transaction, a prepayment premium equal to the principal amount of First Lien Facility subject to such prepayment multiplied by 1%. Any prepayment of all or any portion of the outstanding First Lien on or after June 5, 2016 is not subject to a premium. At our option, the Second Lien Facility may also be prepaid (but subject to the restrictions contained in the First Lien Facility/Second Lien Intercreditor Agreement) on or prior to June 5, 2017 subject to a prepayment premium equal to the principal amount of Second Lien Facility subject to such prepayment multiplied by 1%. In addition, on and after June 5, 2017, any prepayment or repayment of the Second Lien Facility for whatever reason (whether optional, mandatory, at maturity or otherwise) is subject to the payment of an exit fee which increases over time from an amount equal to 4.50% of the amount of the Second Lien Loan being so prepaid or repaid in the case of any prepayment or repayment occurring on or after June 5, 2017 but prior to June 5, 2018 to an amount equal to 12.00% of the amount of the Second Lien Loan being so prepaid or repaid in the case of any prepayment or repayment occurring on or after June 5, 2022, as described further in "Description of Certain Indebtedness".
At Home III used the net proceeds from the Term Loan Facilities (i) to effect the refinancing of all outstanding indebtedness under the Senior Secured Notes, (ii) to pay fees and expenses in connection with the Term Loan Facilities of approximately $13.6 million, (iii) to repay $29.2 million in amounts outstanding under the ABL Facility, and (iv) for general corporate purposes.
We intend to use the proceeds from this offering to repay indebtedness under the Second Lien Facility.
71
10.75% Senior Secured Notes Due 2019
In May 2012, At Home III issued $360.0 million aggregate principal amount of 10.75% senior secured notes that mature on June 1, 2019 (the "Senior Secured Notes"). The terms of the Senior Secured Notes were governed by the Indenture (the "Indenture"), dated May 16, 2012, among At Home III, the guarantors party thereto and Wells Fargo, National Association (the "Trustee"). Interest was payable semi-annually in arrears on each June 1st and December 1st, commencing on December 1, 2012.
The Senior Secured Notes were fully and unconditionally guaranteed, jointly and severally, on a senior secured basis by our domestic restricted subsidiaries. The Senior Secured Notes and the related guarantees were secured, subject to certain exceptions, by (i) a first priority lien on substantially all of our and the guarantors' assets (other than inventory and accounts receivable and related assets, which assets secure our ABL Facility on a first priority basis (the "ABL Priority Collateral")), including first priority liens on any capital stock held by us or a guarantor, and (ii) a second priority lien on the ABL Priority Collateral.
The Indenture contained customary covenants limiting At Home III's and its restricted subsidiaries' operations. It also provided for events of default that, in certain circumstances, permitted acceleration of the payment of principal, premium, if any, and interest on the then outstanding Senior Secured Notes.
On June 5, 2015, At Home III completed the redemption of the Senior Secured Notes at a price equal to 108.063% for total cash consideration of $389.4 million, which includes a $29.0 million early redemption premium and $0.4 million of accrued interest. The redemption resulted in a loss on extinguishment of debt in the amount of approximately $36.0 million.
Asset-Based Lending Credit Facility
In October 2011, we entered into the ABL Facility which provided for cash borrowings or issuances of letters of credit based on defined percentages of eligible inventory and credit card receivable balances up to a maximum facility limit of $80.0 million. In May 2012, we entered into the First Amendment to the Credit Agreement, which amended the ABL Credit Agreement to, among other things, permit the Senior Secured Notes. In May 2013, we entered into the Second Amendment to the Credit Agreement, which amended the ABL Credit Agreement to increase the facility limit to $90.0 million, extend the maturity from October 2016 to May 2018, reduce the interest rate and fees and amended various other covenants and related definitions. In July 2014, we entered into the Third Amendment to the Credit Agreement which further amended ABL Credit Agreement to modify certain financial terms and other covenants. Such modifications included increasing the facility from $90.0 million to $140.0 million; extending the scheduled maturity date from May 2018 to July 2019; reducing the margin on borrowings by 0.25%; providing for the release of certain real property collateral in specified circumstances; adding Wells Fargo Bank, National Association as a new lender under the facility and amending various other covenants, terms and related definitions to provide additional flexibility with the facility. In September 2014, we entered into the Assumption and Ratification Agreement, which updated the names of the loan parties to reflect our corporate restructuring and rebranding. The ABL Facility is secured by substantially all of our assets with a first lien on ABL Priority Collateral and a second lien on all non-ABL Priority Collateral.
Interest on borrowings under the ABL Facility is computed based on our average daily availability at our option: (x) the higher of (i) the Federal Funds Rate plus 1/2 of 1.00%, (ii) the bank's prime rate, and (iii) LIBOR plus 1.00%, plus in each case, an applicable margin of 0.25% to 0.75% or (y) the bank's LIBOR rate plus an applicable margin of 1.25% to 1.75%. The interest rate was 4.0%, 3.75% and 4.0% at January 25, 2014, January 31, 2015 and August 1, 2015, respectively.
72
As of August 1, 2015, approximately $70.3 million was outstanding under the ABL Facility, approximately $0.7 million was outstanding under letters of credit and we had availability of approximately $69.0 million.
The ABL Facility contains a number of covenants that, among other things, restrict our ability to, subject to specified exceptions, incur additional debt; incur additional liens and contingent liabilities; sell or dispose of assets; merge with or acquire other companies; liquidate or dissolve ourselves; engage in businesses that are not in a related line of business; make loans, advances or guarantees; pay dividends; engage in transactions with affiliates; and make investments. In addition, the ABL Facility contains certain cross-default provisions. There are no financial maintenance covenants in the ABL Facility. However, during the existence of an event of default or when we fail to maintain excess availability of at least the greater of $10.0 million or 10% of the line cap, the consolidated fixed charge coverage ratio of the most recently completed period of four consecutive quarters must be 1.00 to 1.00 or higher. As of January 31, 2015 and August 1, 2015, we were in compliance with all covenants.
On June 5, 2015, At Home III also entered into the Fourth Amendment to the Credit Agreement which further amended ABL Credit Agreement to modify certain provisions of the agreement to, among other things, permit the Term Loan Facilities to be issued and amend certain terms in the ABL Credit Agreement to be consistent with the terms set forth in the Term Loan Facilities.
Contractual Obligations
We enter into long-term obligations and commitments in the normal course of business, primarily debt obligations and non-cancelable operating leases. As of January 31, 2015, without giving effect to this offering or the refinancing transaction that occurred on June 5, 2015, our contractual cash obligations over the next several periods were as follows (in thousands):
| |
Total | Less than 1 year |
1 to 3 years |
3 to 5 years |
More than 5 years |
|||||||||||
|---|---|---|---|---|---|---|---|---|---|---|---|---|---|---|---|---|
Operating lease commitments(1) |
$ | 422,070 | $ | 44,764 | $ | 85,624 | $ | 78,876 | $ | 212,806 | ||||||
Long-term debt obligations(2) |
378,261 | 758 | 1,621 | 361,776 | 14,106 | |||||||||||
Interest payments on long-term debt obligations(3) |
183,915 | 39,536 | 78,968 | 59,463 | 5,948 | |||||||||||
Financing obligations(4) |
22,308 | 1,482 | 3,817 | 3,877 | 13,132 | |||||||||||
| | | | | | | | | | | | | | | | | |
Total |
$ | 1,006,554 | $ | 86,540 | $ | 170,030 | $ | 503,992 | $ | 245,992 | ||||||
| | | | | | | | | | | | | | | | | |
| | | | | | | | | | | | | | | | | |
| | | | | | | | | | | | | | | | | |
- (1)
- Our
operating lease commitments include leases for property used in our operations.
- (2)
- Long-term
debt obligations include principal payments due under our Senior Secured Notes and notes payable.
- On June 5, 2015, we entered into a $300 million First Lien Facility and a $130 million Second Lien Facility. The proceeds from the Term Loan Facilities were used to refinance and redeem our Senior Secured Notes. Our cash contractual obligations related to the Term Loan Facilities are as follows (in thousands):
| |
Total | Less than 1 year |
1 to 3 years |
3 to 5 years |
More than 5 years |
|||||||||||
|---|---|---|---|---|---|---|---|---|---|---|---|---|---|---|---|---|
Long-term debt obligations |
$ | 430,000 | $ | 2,250 | $ | 6,000 | $ | 6,000 | $ | 415,750 | ||||||
Interest payments on long-term debt obligations |
$ | 193,807 | $ | 17,772 | $ | 52,913 | $ | 52,313 | $ | 70,809 | ||||||
73
- (3)
- Interest
expense on long-term debt includes future interest payments on outstanding obligations under our Senior Secured Notes and notes payable. Certain
notes payable bear interest at variable rates and this table is based on rates in effect as of January 31, 2015.
- (4)
- Includes base lease terms for properties where we have been deemed to be the accounting owner of the landlord's property in accordance with accounting guidance related to leases.
Off-Balance Sheet Arrangements
We have not entered into off-balance sheet arrangements. We do enter into operating lease commitments, letters of credit and purchase obligations in the normal course of our operations.
Critical Accounting Policies and Use of Estimates
The preparation of financial statements in accordance with accounting principles generally accepted in the United States requires management to make estimates and assumptions about future events that affect amounts reported in our consolidated financial statements and related notes, as well as the related disclosure of contingent assets and liabilities at the date of the financial statements. Management evaluates its accounting policies, estimates, and judgments on an on-going basis. Management bases its estimates and judgments on historical experience and various other factors that are believed to be reasonable under the circumstances. Actual results may differ from these estimates under different assumptions and conditions.
Management evaluated the development and selection of its critical accounting policies and estimates and believes that the following involve a higher degree of judgment or complexity and are most significant to reporting our results of operations and financial position, and are therefore discussed as critical. The following critical accounting policies reflect the significant estimates and judgments used in the preparation of our consolidated financial statements. With respect to critical accounting policies, even a relatively minor variance between actual and expected experience can potentially have a materially favorable or unfavorable impact on subsequent results of operations. More information on all of our significant accounting policies can be found in Note 1—Nature of Operations and Summary of Significant Accounting Policies to our audited consolidated financial statements included elsewhere in this prospectus.
Inventories
Inventories are comprised of finished merchandise and are stated at the lower of cost or market with cost determined using the weighted-average method. The cost of inventories include the actual landed cost of an item at the time it is received in our distribution center, or at the point of shipment for certain international shipments, as well as transportation costs to our distribution center and to our retail stores, if applicable. Net inventory cost is recognized through cost of sales when the inventory is sold.
Vendor allowances, which primarily represent volume rebates and cooperative advertising funds, are recorded as a reduction of the cost of the merchandise inventories and a subsequent reduction in cost of sales when the inventory is sold. We generally earn vendor allowances as a percentage of certain merchandise purchases with no minimum purchase requirements. Typically, our vendor allowance programs extend for a period of twelve months.
Physical inventory counts are performed for our stores at least once per year by a third-party inventory counting service for stores that have been in operation for at least one year. Inventory records are adjusted to reflect actual inventory counts and any resulting shortage ("shrinkage") is recognized. Reserves for shrinkage are estimated and recorded throughout the period as a percentage of net sales based on the most recent physical inventory, in combination with current events and historical experience. We have loss prevention programs and policies in place intended to mitigate shrinkage. A 10% increase in our estimated shrinkage reserve rate would have affected net income by
74
approximately $0.5 million for fiscal year 2015. We also evaluate our merchandise to ensure that the expected net realizable value of the merchandise held at the end of a fiscal period exceeds cost. In the event that the expected net realizable value is less than cost, we reduce the value of that inventory accordingly.
Goodwill
Goodwill is tested for impairment at least annually at the operating segment level; we have only one operating segment and we do not have a reporting unit that exists below our operating segment. If the implied fair value of goodwill is lower than its carrying amount, goodwill impairment is indicated and goodwill is written down to its implied fair value. We assess the business enterprise value using a combination of the income approach and market approach to determine the fair value of the Company to be compared against the carrying value of net assets. The income approach, using the discounted cash flow method, includes key factors used in the valuation of the Company (a Level 3 valuation) which include, but are not limited to, management's plans for future operations, recent operating results, income tax rates, and discounted projected future cash flows. Material assumptions used in our impairment analysis include: (1) cash flow projections for ten years assuming positive sales growth in the high teens (15%+) for the next 1 to 5 years with years 6 through 10 linearly trended to a normalized annual level of 3%; (2) terminal year sales growth rates of 3%; and (3) discount rates of 13.5% based on our weighted average cost of capital adjusted for risks associated with operations. The projected high sales growth is based on our plans to open 20 new stores in fiscal year 2016 and at least 20 new stores in fiscal year 2017 along with similar new store growth trends expected for the foreseeable future. Sales growth from comparable stores was assumed to be in the low single digits.
As of January 31, 2015, the fair value of our operating segment would have to decline by more than 5% to be considered for potential impairment. No impairment of goodwill was recognized during the fiscal years ended January 31, 2015 or January 25, 2014. However, the use of different assumptions, estimates or judgments with respect to the estimation of the projected future cash flows and the determination of the discount rate and sales growth rate used to calculate the net present value of projected future cash flows could materially increase or decrease our estimates of fair value. We believe our estimates are appropriate based upon current market conditions and the best information available at the assessment date. However, future impairment charges could be required if we do not achieve our current net sales, which would occur if we are not able to meet our new store growth targets, and profitability projections or the weighted average cost of capital increases.
Impairment of Long-Lived and Indefinite-Lived Assets
We evaluate the recoverability of the carrying value of long-lived assets whenever events or circumstances indicate the carrying amount may not be recoverable. Additionally, for store assets, we evaluate the performance of individual stores for indicators of impairment, and underperforming stores are selected for further evaluation of the recoverability of the carrying amounts. The evaluation of long-lived assets is performed at the lowest level of identifiable cash flows, which is at the individual store level.
Our initial indicator that store assets may be impaired is that the estimated undiscounted future cash flows expected to result from the use and eventual disposition of the assets over the remaining useful life do not exceed the carrying value of the assets. This evaluation is performed on stores open longer than six months. To estimate store-specific future cash flows, management must make assumptions about key store variables, including sales, growth rate, gross margin, payroll and other controllable expenses. Further, management considers other factors when evaluating stores for impairment, including the individual store's execution of its operating plan and other local market conditions.
75
An impairment is recognized once all the factors noted above are taken into consideration and it is determined the carrying amount of the store's assets are not recoverable. The impairment loss would be recognized in the amount by which the carrying amount of a long-lived asset exceeds its fair value, excluding assets that can be redeployed. No impairment of long-term assets was recognized during the fiscal years ended January 25, 2014 or January 31, 2015.
We test indefinite-lived trade name intangible assets annually for impairment or more frequently if impairment indicators arise. If the fair value of the indefinite-lived intangible asset is lower than its carrying amount, the asset is written down to its fair value. During fiscal year 2014, we committed to a rebranding initiative that resulted in the conversion of the then existing "Garden Ridge" trade name to the new trade name "At Home". We performed an impairment analysis of the indefinite-lived trade name immediately before the conversion and, as a result, recognized a $37.5 million trade name impairment during the fiscal year ended January 25, 2014. The fair value of our former trade name (a Level 3 valuation) was calculated using a relief-from-royalty approach, which assumes the value of the trade name is the discounted cash flows of the amount that would be paid by a hypothetical market participant had they not owned the trade name and instead licensed the trade name from another company. The remaining value of the Garden Ridge trade name of $4.0 million was reclassified as a definite-lived intangible asset and amortized over the period of the conversion to "At Home", which we estimated to be nine months. As of January 31, 2015, the Garden Ridge trade name definite-lived intangible asset is fully amortized and the carrying value of the At Home trade name was approximately $0.9 million.
Revenue Recognition
Revenue from sales of our merchandise is recognized when the customer takes possession of the merchandise. Revenue is presented net of sales taxes collected. We allow for merchandise to be returned within 60 days of purchase date and provide a reserve for estimated returns. We use historical customer return behavior to estimate our reserve requirements, which are accounted for as a reduction in revenue; we also reduce cost of sales to reflect our estimates of the inventory cost of products that will be returned. As of January 31, 2015 and January 25, 2014, our sales returns reserve was approximately $0.7 million and $0.3 million, respectively.
We record a gift card liability on the date we issue the gift card to the customer. We record revenue and reduce the gift card liability as the customer redeems the gift card. As of January 25, 2014 and January 31, 2015, our gift card liability was approximately $0.7 million and $1.2 million, respectively. In addition, we recognize gift card breakage as revenue after 60 months of non-use. We recognized revenue of approximately $0.1 million for each of the fiscal years ended January 25, 2014 and January 31, 2015, respectively, related to such gift card balances.
Stock-Based Compensation
We account for stock-based compensation in accordance with ASC 718 (Topic 718, "Compensation—Stock Compensation"), which requires all stock-based payments to employees, including grants of employee stock options, to be recognized in the consolidated financial statements over the requisite service period. Compensation expense based upon the fair value of awards is recognized on a straight line basis, over the requisite service period for awards that actually vest. Stock-based compensation expense is recorded in selling, general and administrative expenses in the consolidated statements of operations.
We estimate fair value of each stock option grant on the date of grant based upon the Black-Scholes option pricing model. This model requires various significant judgmental assumptions in order to derive a final fair value determination for each type of award including the following:
- •
- Expected term—The expected term of the options represents the period of time between the grant date of the options and the date the options are either exercised or canceled.
76
- •
- Expected volatility—The expected volatility is calculated based on the
historical volatility of the common stock for comparable companies.
- •
- Expected dividend yield—The expected dividend yield is based on our
expectation of not paying dividends on its common stock for the foreseeable future.
- •
- Risk-free interest rate—The risk-free interest rate is the average of the 3-year and 5-year U.S. Treasury rate in effect at the time of grant and with a maturity that approximates the expected term.
All grants of our stock options have an exercise price equal to or greater than the estimated fair market value of our common stock on the date of grant. Because we are privately held and there is no public market for our common stock, the fair value of our equity is approved by our board of directors at the time option grants are awarded. In estimating the fair value of our common stock, we consider factors we believe are material to the valuation process including, but not limited to, our actual and projected financial results, performance of our peer group, risks and prospects and economic and market conditions. In fiscal year 2014 and fiscal year 2015, our valuations utilized projections of our future performance, estimates of our weighted average cost of capital and metrics based on the performance of a peer group of similar companies, including valuation multiples and stock price volatility.
We believe the combination of these methods provides an appropriate estimate of our expected fair value ranges. We have considered the valuation analyses to determine the best estimate of the fair value of our common stock at each stock option grant date.
The estimates used in determining the fair value of our common stock were highly complex and subject to significant judgment. Those assumptions are similar to those we make with respect to goodwill as described above and include the selection of revenue growth rates, discount rates and comparable public companies used in the guideline public company analysis, and the non-marketability discount used. There was also inherent uncertainty in our forecasts and projections. If we had made different assumptions and estimates than those described previously, the amount of our stock-based compensation expense, net income (loss) and net income (loss) per share amounts could have been materially different. Following this offering, such estimates will no longer be needed to determine fair value for new awards due to a publicly-available trading price for our common stock.
Income Taxes
We account for the provision for income taxes under the asset and liability method prescribed by ASC 740 (Topic 740, "Income Taxes"). Deferred tax assets and liabilities are recognized for the future tax consequences attributable to differences between the financial statement carrying amounts of existing assets and liabilities and their respective tax bases, operating losses and tax credit carryforwards. Deferred tax assets and liabilities are measured using the enacted tax rates expected to apply to taxable income in the years in which those temporary differences are expected to be recovered or settled. The effect on deferred tax assets and liabilities of a change in tax rates is recognized in income in the period the tax rate changes are enacted. We record a valuation allowance to reduce the carrying amounts to the amount that is believed more likely than not to be realized.
We are required to assess the available positive and negative evidence to estimate if sufficient future income will be generated to utilize deferred tax assets. A significant piece of negative evidence that we consider is cumulative losses (generally defined as losses before income taxes) incurred over the most recent three-year period. Such evidence limits our ability to consider other subjective evidence. Because we were in a three year cumulative loss as of January 25, 2014 and January 31, 2015, we established a valuation allowance against our deferred tax assets to the extent these assets would not be realized through the future reversals of existing taxable temporary differences and the carry back of the resultant loss from the excess of reversing deferred tax assets over reversing deferred liabilities.
77
Our valuation allowances totaled $6.0 million and $6.6 million, as of January 25, 2014 and January 31, 2015, respectively. Because our deferred tax assets solely relate to temporary differences, periodic changes in the amount of net deferred tax assets directly impact our income tax provision and make our effective tax rate difficult to predict. For example, the change in the required federal valuation allowance for fiscal year 2014 and fiscal year 2015 impacted our tax provision by $4.7 million and $1.0 million, respectively. The amount of the deferred tax asset considered realizable could be adjusted if negative evidence, such as three-year cumulative losses, no longer exists and additional consideration is given to other subjective evidence.
Recent Accounting Pronouncements
In May 2014, the Financial Accounting Standards Board ("FASB") issued Accounting Standards Update No. 2014-09, "Revenue from Contracts with Customers" ("ASU 2014-09"). ASU 2014-09 supersedes the revenue recognition requirements in "Topic 605, Revenue Recognition," and requires entities to recognize revenue in a way that depicts the transfer of promised goods or services to customers in an amount that reflects the consideration to which the entity expects to be entitled to in exchange for those goods or services. ASU 2014-09 is effective for annual reporting periods beginning after December 15, 2016, including interim periods within that reporting period and is to be applied retrospectively, with early application not permitted. However, on April 1, 2015, the FASB proposed a deferral of the effective date of the standard by one year, but the proposal would also permit entities to adopt ASU 2014-09 as of the current effective date. We are currently evaluating the impact of ASU 2014-09.
In April 2015, the FASB issued ASU 2015-03, "Interest—Imputation of Interest (Subtopic 835-30): Simplifying the Presentation of Debt Issuance Costs", in order to simplify the presentation of debt issuance costs ("ASU 2015-03"). ASU 2015-03 requires debt issuance costs to be presented on the balance sheet as a direct deduction from the related debt liability rather than an asset. ASU 2015-03 is effective for public companies for annual periods beginning after December 15, 2015, and interim periods thereafter, with early adoption permitted. The guidance also requires retrospective application to all prior periods presented. As of August 1, 2015, we had $15.1 million of net deferred debt issuance costs related to our Term Loan Facilities, ABL Facility and certain other long-term debt.
Quantitative and Qualitative Disclosures about Market Risks
Interest Rate Risk
We have market risk exposure arising from changes in interest rates on our ABL Facility and Term Loan Facilities, which bear interest at rates that are benchmarked against London Interbank Offered Rates ("LIBOR"). The interest rate on our Senior Secured Notes was fixed. In addition, certain of our notes payable related to mortgage loans secured by properties used in the operation of our business bear interest at variable rates. Based on our overall interest rate exposure to variable rate debt outstanding as of August 1, 2015, a 1% increase or decrease in interest rates would increase or decrease income before income taxes by approximately $4.4 million. A 1% increase or decrease in interest rates would impact the fair value of our long-term fixed rate debt by an immaterial amount. A change in interest rates would not materially affect the fair value of our variable rate debt as the debt reprices periodically. In addition, we expect to use proceeds from this offering to repay the Second Lien Facility, which would further reduce our interest expense in the future.
Impact of Inflation
Our results of operations and financial condition are presented based on historical cost. While it is difficult to accurately measure the impact of inflation due to the imprecise nature of the estimates required, we believe the effects of inflation, if any, on our results of operations and financial condition have been immaterial. We cannot assure you, however, that our results of operations and financial condition will not be materially impacted by inflation in the future.
78
Foreign Currency Risk
We purchase approximately 55% of our merchandise from foreign countries, however, those purchases are made exclusively in U.S. dollars. Therefore, we do not believe that foreign currency fluctuation has had a material impact on our financial performance for fiscal year 2014, fiscal year 2015, the second quarter of fiscal year 2015 or the second quarter of fiscal year 2016.
Jumpstart Our Business Startups Act of 2012
The JOBS Act permits us, as an "emerging growth company," to take advantage of an extended transition period to comply with new or revised accounting standards applicable to public companies. We are choosing to irrevocably "opt out" of this provision and, as a result, we will comply with new or revised accounting standards as required when they are adopted.
Internal Control over Financial Reporting
The process of improving our internal controls has required and will continue to require us to expend significant resources to design, implement and maintain a system of internal controls that is adequate to satisfy our reporting obligations as a public company. There can be no assurance that any actions we take will be completely successful. We will continue to evaluate the effectiveness of our disclosure controls and procedures and internal control over financial reporting on an on-going basis. As part of this process, we may identify specific internal controls as being deficient.
In fiscal year 2015, we began evaluating and implementing our internal control procedures in order to comply with the requirements of Section 404 of the Sarbanes-Oxley Act. Section 404 requires annual management assessments of the effectiveness of our internal control over financial reporting and a report by our independent auditors addressing these assessments; however, for so long as we qualify as an emerging growth company, we will not be required to engage an auditor to report on our internal controls over financial reporting. We will be required to comply with the management certification requirements of Section 404 in our annual report on Form 10-K for the year following our first annual report that is filed with the SEC (subject to any change in applicable SEC rules). We will be required to comply with Section 404 in full (including an auditor attestation on management's internal controls report) in our annual report on Form 10-K at the later of the year following our first annual report required to be filed with the SEC or the date on which we are no longer an emerging growth company (subject to any change in applicable SEC rules).
79
Our Company
At Home is the leading home décor superstore based on the number of our locations and large format stores that we believe dedicate more space per store to home décor than any other player in the industry. We are focused on providing the broadest assortment of products for every room, in every style at everyday low prices. We utilize our space advantage to out-assort our competition, offering over 50,000 SKUs throughout our stores. Our differentiated merchandising strategy allows us to identify on-trend products and then value engineer those products to provide desirable aesthetics at attractive price points for our customers. Over 70% of our products are unbranded, private label or specifically designed for us. We believe that our broad and comprehensive offering and compelling value proposition combine to create a leading destination for home décor with the opportunity to continue taking market share in a large, fragmented and growing market.
We have loyal, enthusiastic and diverse customers who are deeply passionate about, and love to decorate, their homes. According to a report prepared for us by Russell Research, a consumer research firm, our average customer typically visits an At Home store four times per year, while our core customer shops our stores more than seven times per year. Our stores are a regular destination where our core customer typically spends more than one hour per visit, providing a means to express her vision in her home often and affordably. To our customer, her home is a representation and an extension of who she is. Decorating her home is a continuous, ever evolving process that can be as simple as replacing patio cushions with a new seasonal pattern or as involved as updating the look of a whole room or the entire house. Making her feel at home while shopping At Home is our primary focus, and we strive to do so by creating an environment that is easy for her to shop, enjoy the experience and express herself through our merchandise.
Our current store base is comprised of 96 stores across 26 states, and 56 markets, averaging over 120,000 square feet per store. We utilize a flexible and disciplined real estate strategy that allows us to successfully open and operate stores from 80,000 to 200,000 square feet across a wide range of formats and markets. All of our stores that have been open since the beginning of the year are profitable, and stores that have been open for more than a year average over $6 million in net sales and realize average Store-level Adjusted EBITDA margins of 28%. Based on our internal analysis and research conducted for us by Buxton, a leading real estate analytics firm, we believe that we have the potential to expand to at least 600 stores in the United States over the long term, or over six times our current store base, although we do not currently have an anticipated timeframe to reach this potential. Due in part to our recent investments, our systems, processes and controls should be able to support up to 220 stores with limited additional investment.
We have developed a highly efficient operating model that seeks to drive growth and profitability while minimizing operating risk. Our merchandising, sourcing and pricing strategies generate strong and consistent performance across our product offering and throughout the entire year.
80
Through specialized in-store merchandising and visual navigation elements, we enable a self-service model that minimizes in-store staffing needs and allows us to deliver exceptional value to our customers.
We believe that our differentiated home décor concept, flexible real estate strategy and highly efficient operating model create competitive advantages that have driven our financial success. In fiscal year 2015, we produced net sales of $498 million, Adjusted EBITDA of $97 million and a net loss of $0.4 million. For a reconciliation of Adjusted EBITDA to net (loss) income, please see "—Summary Consolidated Financial and Operating Data".
Recent financial highlights include:
- •
- Positive comparable stores sales in eight out of the last nine consecutive quarters, ranging from (1.2)% to 11.6%, and averaging 5.3%
growth over the period. Comparable store sales can be impacted by various factors from period to period, including our rebranding initiatives, as discussed in "Management's Discussion and Analysis of
Financial Condition and Results of Operations—How We Assess the Performance of Our Business";
- •
- Forty-five new stores opened in the last five fiscal years, including 16 in the last fiscal year ended January 31, 2015;
- •
- Total net sales growth from $364 million in fiscal year 2013 to $565 million for the last twelve months ended
August 1, 2015, representing a CAGR of 19%;
- •
- Store-level Adjusted EBITDA margins of 27.6% for the last twelve months ended August 1, 2015, and growth of Store-level
Adjusted EBITDA from $96 million in fiscal year 2013 to $156 million for the last twelve months ended August 1, 2015, representing a CAGR of 22%, in line with total net sales
growth; and
- •
- Adjusted EBITDA margins of 19.4% for the last twelve months ended August 1, 2015, and growth of Adjusted EBITDA from $82 million in fiscal year 2013 to $110 million for the last twelve months ended August 1, 2015, representing a CAGR of 11%, which includes significant non-linear investments in people, systems and processes to support our future growth.
Our History and Evolution
Our Company (formerly known as Garden Ridge) was founded in 1979 in Garden Ridge, Texas, a suburb of San Antonio. We quickly gained a loyal following in our Texas home market and expanded thereafter. Throughout our history, we have cultivated a passionate customer base that shops our stores for the unique, wide assortment of products offered at value price points. After our Company was acquired in 2011 by an investment group led by AEA, which included affiliates of Starr Investments, we began a series of strategic investments in the business. We believe that the core
81
strengths of our business combined with the significant investments made over the last four years position us to grow sales and expand our store base.
Key changes that have been implemented since 2011 include:
- •
- Hired seven out of the eight top executives at the Company including our current Chief Executive Officer and Chief Financial Officer,
while almost doubling our home office headcount from 110 to 195 across all functions;
- •
- Launched the At Home brand in 2014 and converted our entire store base while investing in advertising and marketing initiatives to
support the brand launch;
- •
- Expanded our assortment and broadened our appeal to include more on-trend merchandise and increased our mix of "better" and "best"
products;
- •
- Re-established a marketing function and reinstituted marketing spending to 2% of net sales in fiscal year 2015, up from nearly zero;
- •
- Invested in our stores to create a better customer experience by refreshing all stores, improving our in-store signage and enhancing
our merchandising layout for easier navigation and improved shopability;
- •
- Invested in systems, processes and controls including new point-of-sale, or POS, and inventory allocation systems, and the automation
of our distribution center that should be able to support up to 220 potential stores with limited additional investment; and
- •
- Developed our real estate capabilities by implementing a proprietary site selection model and employing multiple financing approaches, enabling a near doubling of the store base over the last two fiscal years, while increasing the first year net sales and Adjusted EBITDA performance of stores opened during fiscal year 2015 by 40% and 60%, respectively, as compared to stores opened during fiscal year 2014.
Our Competitive Strengths
Highly Differentiated Home Décor Concept
We believe our concept is highly differentiated from other home décor retailers given our broad product offering, warehouse format and customer-friendly in-store experience. For most products, our superstores dedicate up to 15 times more square footage and SKUs than other home décor retailers. The size of our stores also provides us the ability to sell larger size products such as oversized area rugs, and fully-assembled products, such as decorative accent furniture and bar stools. Our stores are designed as shoppable warehouses that combine the scale of a big box format with shopper friendly features such as an interior racetrack, clear signage that enables easy navigation throughout the store and product vignettes that offer design inspiration and coordinated product ideas. We believe our customer values shopping At Home as an in-person experience through which she can see and feel the quality of our products and physically assemble her desired aesthetic. We believe we have no direct competitor, effectively competing with mass merchants and large format multi-chain retailers that dedicate only a small portion of their selling space to home décor and do not deliver a shopping experience specifically focused on the home décor customer. Additionally, we also compete with smaller format, independent or national specialty retailers that cannot match our total square footage, selection of products and diverse array of home décor styles. We believe our differentiated concept is positioning us as a leading destination for the home décor consumer and will allow us to continue taking share in a large, highly fragmented and growing market.
Compelling Customer Value Proposition
We believe we provide a compelling value proposition to our customers through our broad merchandise assortment, unique product offering and attractive value price points. By offering
82
something for every room, in every style at everyday low prices, we appeal to a diverse customer base across a variety of markets.
- •
- Every Room. We offer over 50,000 SKUs across virtually all home
décor products enabling our customer to decorate any space inside or outside her home. From her bedroom to her living and dining rooms to her outside patio and garden areas, we carry
thousands of products that allow her to express her unique sense of style in any area of the home she desires. All of our products are in-stock and ready to take home, enabling a one-stop shopping
experience.
- •
- Every Style. We deliver a unique and innovative product offering that
spans all styles of home décor ranging from traditional to country and from vintage to modern. We introduce approximately 20,000 new SKUs per year, or an average of 400 new SKUs per
week, which keeps our offering fresh and exciting.
- •
- Everyday Low Prices. We value engineer products in collaboration with our suppliers to recreate the "look" that we believe our customer wants while eliminating the costly construction elements that she does not value. This design approach allows us to deliver an attractive value to our customers, as our products are typically less expensive than other branded products that have a similar look. We employ a simple everyday low pricing strategy that consistently delivers savings to our customers without the need for extensive promotions, as evidenced by 80% of our net sales occurring at full price.
Efficient Operating Model Driving Industry-Leading Profitability
We believe we have the most efficient operating model in the home décor industry, which drives our industry-leading profitability. We generate strong product margins through our extensive product offering with an everyday low pricing strategy. We have designed a store model that enables a largely self-service shopping experience and streamlines our store operations, thereby minimizing in-store staffing levels. Our disciplined yet flexible real estate strategy allows us to negotiate favorable lease terms, which average $5 per square foot in annual rental costs. Despite the significant investments we have made in our business, we continue to operate with a highly efficient home office team. All major decisions regarding merchandising, pricing, product assortment and allocation are standardized and made centrally, which supports a lean cost structure. As a result of these factors, we are able to deliver industry-leading profitability and succeed in locations where we believe other retailers cannot.
Flexible and Disciplined Real Estate Strategy Supporting Attractive Store Economics
We have developed a store model that has been successful across a number of geographic markets, population densities and real estate locations, including anchor, stand-alone or mall-enclosed locations that range between 80,000 and 200,000 square feet, averaging over 120,000 square feet per store. Our success operating stores across multiple market types and store formats allows us to be opportunistic and select locations with the most favorable investment characteristics. We are flexible in our approach and realize compelling store economics whether we lease a second generation property, purchase a second generation location or build a new store from the ground up. We believe we are one of the few growing retail concepts that actively targets larger box sizes, enabling us to obtain highly attractive real estate terms. We have also become a direct beneficiary of large, national big box retailers pruning their store portfolios and have become a preferred partner for a number of these retailers looking to quickly shed stores. All of our stores that have been open since the beginning of the year are profitable and those that have been open for more than a year average over $6 million in net sales and realize average Store-level Adjusted EBITDA margins of 28%. Over the past three fiscal years, we have successfully opened 33 new stores in 27 markets, including 18 new markets. We expect our new stores to generate at least $1 million of Store-level Adjusted EBITDA in the first year of operations and pay back the net investment within two years. We believe our ability to achieve such attractive
83
returns across a broad set of markets is a testament to the universal appeal of our concept and strongly positions us to continue to profitably open new stores.
Systematic Approach to Minimizing Operating Risk
We have designed and implemented a systematic approach to our business that is focused on driving growth and profitability while minimizing operating risk. Through this approach, we are able to deliver consistent sales and profitability growth and reduce the volatility that other big box retailers may face. Key areas of our business that are built on this approach include:
- •
- Merchandising: We have a broad assortment that delivers consistent
financial results across our product offering and reduces our reliance on any individual product, style or trend. Additionally, our store size allows merchandise to stay on the floor longer than a
typical retailer, thereby reducing the need for unplanned markdowns.
- •
- Inventory Management: We maintain strict inventory controls at the
overall company level as well as at individual stores in order to minimize markdowns. Additionally, we have a regular markdown cadence through which we clear slower moving inventory. Finally, we do
not carry over or store any of our seasonal products, ensuring that our inventory remains as relevant and fresh to our customers as possible.
- •
- Product Development and Sourcing: Our largely private label and unbranded
offering allows us to better control input costs and maintain a profitable product margin, even in the event of a markdown. We implement rigorous controls to maintain our product costs, often changing
materials and features based on fluctuations in input costs. We work with over 500 vendors and are not reliant on any single vendor, with our largest vendor representing less than 5% of our
purchases.
- •
- Store Operations: We optimize our staffing levels based on hourly sales
and traffic volumes and are able to utilize downtime to stock shelves and displays with new inventory. Additionally, we work with our vendors and internal operations teams to deploy customized
merchandising solutions such as specialized racks and displays to reduce labor needs, while creating a more pleasant shopping experience for our
customers.
- •
- Real Estate: We employ a highly analytical approach to real estate site selection with a stringent process to approve new stores and, as a result, have not closed a single store due to poor financial performance in the past decade. Our ability to negotiate favorable lease terms typically results in low square footage rents, unilateral two to three year "opt-out" clauses or short initial terms with multiple renewal options, and other features that provide us with optimal flexibility to manage our store portfolio.
Scalable Operations To Support Future Growth
We have made significant capital and non-linear operating expense investments in our business that we believe have laid the foundation for continued profitable growth. Over the past two fiscal years, we have invested $47.8 million in capital related to store maintenance, expanding our distribution center capacity and rebranding our Company. We have also invested $22.3 million in non-linear operating expenses, which include people, processes and systems, as well as $14.5 million in one-time expenses to build key capabilities to support our future growth. We believe that we are just beginning to see the benefits of these investments in our business. Our strengthened management team, new brand identity, upgraded and automated distribution center and enhanced information systems, including our inventory allocation, warehouse management and POS systems, should enable us to profitably replicate our store format and differentiated shopping experience. We believe our standardized systems and processes, which rely on refined tools for store operations, inventory management, procurement, employee hiring, training and scheduling, are scalable to meet our
84
expansion goals. We expect these infrastructure investments to support our successful operating model over a significantly expanded store base.
Exceptional Management Team and Strong Corporate Culture
We have assembled a highly experienced management team that has an average of 18 years of retail experience, has a demonstrated track record of delivering superior results and is well-positioned to scale our business. Since 2011, we have made meaningful investments in our team, hiring top executives with experience leading their respective functions at large industry-leading public retail companies including Nike, Gap, Best Buy, Advance Auto Parts, FedEx Corporation, Brinker International and Yum! Brands, among others. Additionally, we have built out and enhanced functional teams across finance, real estate, marketing, merchandising, information technology and store operations. We believe that our experienced management team has been able to institute rigorous, systematic processes across each of our functional areas that have resulted in strong financial performance while opening new stores.
Under the leadership of our Chief Executive Officer, Lee Bird, we have developed a strong corporate culture that is focused on motivating and empowering our employees. Our entire organization is aligned with our mission to enable our customer to affordably make her house a home and realize our vision of becoming the leading home décor retailer. We are focused on making At Home a great place to work and over the past few years, we have established a number of practices to empower and incentivize our employees, including an uncapped bonus program for store directors, comprehensive health benefits, a generous 401(k) matching program with immediate vesting, fitness center access and fitness and wellness classes, sabbatical leaves, paid time off, volunteer time pay and what we believe is above industry average compensation for both our full and part-time employees. In addition, we offer a Company performance bonus program for all home office team members. We also invest in the continual development of our employees and have adopted a training program for our store employees. Our goal is to be a great place to work. We have already seen tremendous progress as evidenced by more than 50% reduction in employee turnover over the past two years.
Our Growth Strategies
We expect to continue our strong sales growth and leading profitability by pursuing the following strategies:
Expand Our Store Base
We believe there is a tremendous whitespace opportunity to expand in both existing and new markets in the United States and believe we have the whitespace to open at least 20 new stores per year for the foreseeable future. In fiscal year 2016, we plan to open 20 new stores, of which 16 are already open and the remaining are under construction. We plan to open at least 20 new stores in fiscal year 2017, for which we have signed letters of intent for 18 stores. Over the long term, we believe we have the potential to expand to at least 600 stores in the United States, or over six times our current footprint of 96 stores, based on our internal analysis and research conducted by Buxton. The rate of future growth in any particular period is inherently uncertain and is subject to numerous factors that are outside of our control. As a result, we do not currently have an anticipated timeframe to reach this potential. In addition, due in part to our recent investments, our systems, processes and controls should be able to support up to 220 stores with limited additional investment.
We have used our site selection model to score over 20,000 big box retail locations throughout the United States, which positions us to be able to act quickly as locations become available, and we have developed detailed market maps for each U.S. market that guide our deliberate expansion strategy. Over the last three years, we have opened stores in a mix of new and existing markets. New stores in existing markets have increased our total market share due to higher brand awareness. We believe there is still a considerable opportunity to continue adding locations in even our most established markets. In addition, we anticipate a limited number of relocations periodically as we
85
evaluate our position in the market upon the impending expiration of lease terms. We have demonstrated our ability to open stores successfully in a diverse range of new markets across the country, having entered 30 new markets since 2011. Our portable concept has delivered consistent store economics across all markets, from smaller, less dense locations to larger, more heavily populated metropolitan areas.
Our new store model combines high average unit volumes and high Store-level Adjusted EBITDA margins with low net capital investment and occupancy costs, resulting in cash flow generation early in the life of a store. Our stores typically mature within six months of opening. We target first year annualized sales of $5 million, with Store-level Adjusted EBITDA margins of approximately 20%. Our new stores require on average $2 to $3 million of net investment, varying based on our lease, purchase or build decisions, but all with a target payback period of less than two years. Approximately 30 stores have been opened since 2011 that have been operating for more than a year. The average first year sales for these stores was approximately $5.1 million and the average first year Store-level Adjusted EBITDA was approximately $1.4 million. Approximately 50% of these stores exceeded our sales target and approximately 68% exceeded our targeted Store-level Adjusted EBITDA and payback period of less than two years.
Drive Comparable Store Sales
We have achieved positive comparable store sales growth in eight out of the last nine consecutive fiscal quarters, ranging from (1.2)% to 11.6%, and averaging 5.3% growth over the period. Comparable store sales can be impacted by various factors from period to period, including our recent rebranding, as discussed in "Management's Discussion and Analysis of Financial Condition and Results of Operations—How We Assess the Performance of Our Business". We will seek to continue to drive demand and customer spend by providing a targeted, exciting product selection and a differentiated shopping experience, including the following specific strategic initiatives:
- •
- Continuously introduce new and on-trend products to appeal to a wide range of customers and improve the mix of our assortment ("good /
better / best" product offering);
- •
- Enhance inventory planning and allocation capabilities to get the right products in the right store at the right time;
- •
- Continue to strengthen our visual merchandising such as vignettes, end caps and feature tables to inspire our customers and generate
in-store demand; and
- •
- Grow the At Home brand through marketing and advertising as well as community engagements that target the home décor enthusiast to drive increased traffic to our stores.
Build the At Home Brand and Create Awareness
During fiscal year 2015, we launched the At Home brand, which we believe better communicates our positioning as the leading home décor superstore. Additionally, we re-established a marketing function and reinstated marketing spend to highlight our new brand, broad product offering and compelling value proposition. Given the newness and relatively limited awareness of the At Home brand, we believe there is a significant opportunity to grow our brand and build awareness for existing and new markets.
While we have a net promoter score that is among the highest of our home décor peers, according to Russell Research, At Home has an aided brand awareness in our existing and newly entered markets that is approximately half of many of our specialty and mass merchant competitors. Our low awareness level, coupled with the high loyalty and customer satisfaction we have among existing customers, underscores what we believe is a significant growth opportunity to convert potential new customers into loyal brand enthusiasts.
86
To address this opportunity, we intend to allocate our marketing spend across a range of strategic initiatives in order to highlight our differentiated value proposition. We will involve both traditional media platforms and unique, targeted strategies aimed at reaching the home décor enthusiast. Our marketing and brand building efforts will be enhanced by engaging in an ongoing dialogue with our customers through growing social and mobile channels. We believe we have an opportunity to leverage our growing social media and online presence to drive brand excitement and increase store visits within existing and new markets.
Through our extensive customer research, we have learned that many home décor enthusiasts browse online for ideas, inspiration and general product information before visiting specific stores. Over the next year, we intend to enable our customers to view our product assortment online with robust search functionality and a mobile-friendly website. This upcoming enhancement will focus on an inspirational shopping experience that showcases decorating ideas to drive traffic into our stores. In the future, we may consider providing various levels of e-commerce capabilities but will focus on initiatives that maintain our industry-leading profitability.
We believe increased brand awareness will not only drive traffic to existing stores, but also strengthen our business as we expand into new markets.
Our Industry
We compete in the large, growing and highly fragmented home furnishings and décor market. The industry had total sales of approximately $180 billion in 2014 according to Home Furnishings News, and has enjoyed stable growth at an annual rate of approximately 3% per year over the last five years according to Euromonitor. We attribute this growth to the industry's broad consumer appeal, coupled with strong positive tailwinds from a growing housing market, rising property values and home sales and growing disposable incomes. This growth trend is expected to continue, with a forecasted growth rate of approximately 4% over the next five years according to Euromonitor.
Unlike other big box retail categories (e.g., office supplies, home improvement and electronics) where the top retailers hold a significant share of the overall market, the top three retailers in the home décor and furnishings category make up less than 25% of the market share. We believe we are uniquely positioned in the market, focused on providing the broadest assortment of home décor products at value price points. In addition, the size of our stores enables us to carry a broad offering of fully assembled, larger merchandise, unlike many of our competitors, who are space constrained from providing a similar offering. We believe our focus on a broad assortment at value price points also uniquely positions us for those times when the industry is growing below trend, as it allows us to gain share in a fragmented market while also supporting our customer's passion about, and love for, decorating her home.
The home furnishings and décor market includes a diverse set of categories and retail formats. However, we believe that we do not have a direct competitor, as no retailer matches our size, scale or scope of the product assortment that we offer at everyday low prices. While we have no direct competitor, certain products that we offer do compete with offerings by companies in the following segments:
- •
- Specialty Home Décor / Organization and Furniture retailers (e.g., Bed Bath & Beyond, The Container
Store, Home Goods, Pier 1 Imports, Havertys, Ethan Allen and Williams-Sonoma) have stores that are typically smaller (approximately 10,000 to 30,000 square feet) and we believe their home
décor product offering is much narrower than ours and often is priced at a substantial premium.
- •
- Mass / Club retailers (e.g., Wal-Mart Stores, Target Corporation and Costco) only dedicate a small portion of their selling spaces to home décor products and focus on the most popular SKUs.
87
- •
- Arts / Craft / Hobby retailers (e.g., Michaels Stores, Jo-Ann Stores and Hobby Lobby) target customers who prefer to create the
product themselves, whereas our customer prefers finished products.
- •
- Discount retailers (e.g., Big Lots and Tuesday Morning) have a home décor product offering that is typically
limited, offered at deep discounts and often dependent on their ability to purchase close-out or liquidated merchandise from manufacturers.
- •
- Home Improvement retailers (e.g., Home Depot and Lowe's) have a product offering that is primarily focused on home improvement
and repair items, although we do compete with them in seasonal and outdoor products.
- •
- Online home décor retailers (e.g., Wayfair) offer a broad selection of products in home furnishings and décor that is typically weighted toward more expensive items (typically $200 to $300 per transaction) that can justify the high shipping, returns and damage costs and overall economics of their model. Conversely, we focus primarily on the attractive decorative accents and accessories portion of the market, generating an average basket of approximately $60, where we can employ our efficient operating model to generate attractive economics. For similar products, we believe we are able to offer comparable breadth of assortment to online retailers. In addition, according to Russell Research, while consumers may browse options online, they strongly value the opportunity to experience the look-and-feel of products in stores before they purchase them.
Our Customer
We have loyal, enthusiastic and diverse customers who are deeply passionate about, and love to decorate, their homes. In April 2015, we commissioned a third party study from Russell Research to gain additional information about our customers, the results of which are reflected in the below data. Our target demographic consists mostly of women over 45 years of age (mean age of our customers) who are married with children (approximately 50% of our customers). Approximately 30% of our customers are under the age of 34, up from 2% historically, indicating the cross generational appeal of our concept. Additionally, we appeal to a broad income demographic with approximately 15% of our core customers earning an average annual household income below $50,000, 21% earning $50,000 to $75,000 and 59% earning above $75,000 (with 5% not responding). Regardless of age or income, we focus on customers who are highly engaged in, and spend substantial time and money on, home décor.
To our customer, her home is a representation of who she is. She has an emotional connection to her home, and decorating is a continuous, ever-evolving process that can be as simple as replacing patio cushions with a new seasonal pattern or as involved as updating the look of a whole room or the entire house. She makes small modifications, such as changing throw pillows or wall decorations, on average six times a year, while our core customer does so on average nine times a year. She views updating her home as a hobby, and we give her the means to do so often and affordably. We are advantageously situated as a value player in the home décor market, with an average price point of less than $15 and where customers typically spend approximately $60 per visit. At these attractive price points, our customer does not feel guilty about frequently buying and replacing home décor items. Additionally, she can update the look of a room or home with just a few items and does not need a new home to justify her purchases.
Our customer values shopping in an At Home store as an experience through which she can see and feel the quality of the products and physically assemble her desired aesthetic. Approximately 80% of survey respondents had a strong preference for shopping in-store or indicated that they preferred to purchase in-store after browsing online. Our core customer spends an average of more than one hour per visit, often with a friend or family member, and visits an average of seven times per year to check on our continuously updated merchandise. In general, she spends five times more than
88
the average person on home décor and has a highly favorable opinion of At Home due to its broad product offering at value price points.
We have an extremely loyal following from our core customers, with two-thirds stating that they had increased their spending in the previous year and 85% indicating that they would be extremely or very likely to shop at our stores again. For shoppers aware of our stores, we received the highest "intent to shop" score among 20 other home décor retailers, driven in large part, by our compelling value proposition. We also have a net promoter score that is among the highest of our home décor peers, further demonstrating our customer loyalty.
Our Merchandise
We have the largest assortment of home décor products among all big box retailers. With eight main design archetypes, from traditional to country and from vintage to modern, we cover the full spectrum of home décor styles and we believe we have something for everyone. Over the past two years, we have evolved our merchandising strategy to increase our product offering of "better" and "best" level products, resulting in an increase in average basket size.
Our merchant organization is focused on finding or creating products that meet our customers' aesthetic requirements at attractive price points. A core goal of our buyers is to ensure we deliver our targeted selling margins across our entire product portfolio and, as a result, we enjoy strong gross margins that are consistent across our product offering.
Our product design process begins with inspiration. We seek to capitalize on existing trends and home décor fashions across various price points and make them accessible rather than drive new trends. We monitor emerging trends through a wide range of home décor industry sources including competitors, media sources, vendors, trade shows, various online outlets and user generated content (e.g., Pinterest and Houzz) to stay current with consumer preferences. We then identify new product opportunities or any gaps in our offering and work closely with our vendors to design products to meet her needs at accessible price points. Our merchandising team also closely monitors our sales trends and new product launches to ensure our store offering remains fresh and relevant.
We employ an everyday low pricing strategy that offers our customers the best possible pricing without the need for periodic discounts or promotions. When a customer views our prices, she can be confident in the value she receives and does not need to wait for sales or coupons to make purchasing decisions. We believe this results in consistent traffic to our stores. Over 80% of our net sales occur at full price, with the balance attributable to selective markdowns used to clear slow moving inventory or post-dated seasonal product. For the limited set of products that are directly comparable to products offered by other retailers, we seek to offer prices significantly below our specialty competitors and at or below our mass retail competitors. We allow for merchandise to be returned within 60 days from the purchase date.
Our merchant team consists of approximately 50 people and includes a Chief Merchandising Officer, divisional merchandising managers, buyers, assistant buyers and an inventory planning and allocation team. Our inventory planners work with our buyers to ensure that the appropriate level of inventory for each product is stocked across our store base. We purchase our inventory through a central system that buys for the entire chain versus individual stores. We believe this strategy allows us to take advantage of volume discounts and improves controls over inventory and product mix to ensure that we are disciplined about the level of inventory we carry.
89
Product Mix
Our broad and deep offering includes the following products:
• Accent furniture |
• Frames |
• Pottery |
|||
• Bar stools |
• Garden decor |
• Rugs and mats |
|||
• Bedding & bath products |
• Halloween decorations |
• Sculptures |
|||
• Beds and mattresses |
• Harvest decorations |
• Silk flowers |
|||
• Candles |
• Home organization |
• Sofas |
|||
• Chairs |
• Kitchenware |
• Stands |
|||
• Christmas decorations |
• Lamps |
• Storage |
|||
• Consumables |
• Mirrors |
• Tables |
|||
• Easter decorations |
• Patio |
• Vases |
|||
• Floor plants and trees |
• Pet items |
• Wall art |
|||
• Food preparation items |
• Pillows and cushions |
• Window treatments |
Home furnishings, which generally consists of accent furniture, furniture, mirrors, patio cushions, rugs and wall art, comprised approximately 41%, 44% and 47% of total net sales for fiscal years 2013, 2014 and 2015, respectively. In addition, accent décor, which generally consists of artificial flowers and trees, bedding, candles, garden and outdoor décor, holiday accessories, home organization, pillows, pottery, vases and window treatments, comprised approximately 50%, 49% and 49% of total net sales for fiscal years 2013, 2014 and 2015, respectively. Our superstore format and unique approach to merchandising result in our ability to offer multiple styles, colors and design elements most other retailers are unable to carry. As an example, in patio cushions, we offer 17 different shapes, in over 60 distinct patterns and maintain a stock of approximately 20 units per SKU, so our customer can benefit from the widest selection and complete her shopping at a single store. According to Russell Research, we out-assort our competitors for most products by up to 15 times, and in certain cases up to 30 times. For example, we carry more SKUs relative to our competition by 4 to 16 times across patio cushions, rugs, pillows, mirrors and bar stools, on average. Further, the size of our stores allow us to dedicate more space than our next largest competitor studied by approximately 27 times in patio cushions, 8 times in rugs, 4 times in pillows and 2 times in bar stools. In addition to offering the widest assortment of products, we offer everyday low pricing that can be up to 60% lower for similar products.
Sourcing
We believe our sourcing model provides us with significant flexibility to control our product costs. We work very closely with over 500 vendors to value engineer products at price points that deliver excellent value to our customers. In fiscal year 2015, approximately 45% of our merchandise was purchased from domestic vendors and 55% was imported from foreign countries such as China, Hong Kong, Belgium and Taiwan. Lead times vary depending on the product, ranging from one week to nine months. We plan to establish an overseas sourcing office in the future. However, to date we have not yet taken any significant steps in connection with such plan. An overseas office would allow us to continue to increase our direct purchases from overseas factories in Asia, rather than purchasing through domestic agents or trading companies. We believe this represents an opportunity to increase our access to unique and quality products.
We seek to build long-term relationships with our vendor partners, who can provide support for our various marketing and in-store merchandising initiatives. However, we believe we are not dependent on any one vendor and have no long-term purchase commitments or arrangements. For many of our vendors, we are their fastest growing and, sometimes, largest account, which promotes collaboration between our companies. In fiscal year 2015, our top ten vendors accounted for approximately 25% of total purchases, with our largest vendor representing less than 5%. We believe our vendor partner relationships will continue to support our business growth.
90
Our Stores
We currently operate 96 stores across the United States, of which 82 are leased and 14 are owned locations. Our stores are generally anchor, stand-alone or mall-enclosed locations. A summary of our store locations by market is below:
Market
|
Store Count | Market
|
Store Count | ||||||
|---|---|---|---|---|---|---|---|---|---|
Houston, TX |
6 | Denver, CO |
1 | ||||||
Dallas/Fort Worth, TX |
6 | Des Moines, IA |
1 | ||||||
Atlanta, GA |
5 | Erie, PA |
1 | ||||||
Phoenix, AZ |
4 | Grand Rapids, MI |
1 | ||||||
Austin, TX |
3 | Greeley, CO |
1 | ||||||
Detroit, MI |
3 | Greensboro, NC |
1 | ||||||
Indianapolis, IN |
3 | Greenville/Spartanburg, SC |
1 | ||||||
San Antonio, TX |
3 | Hattiesburg, MS |
1 | ||||||
St. Louis, MO |
3 | Huntsville, AL |
1 | ||||||
Kansas City, KS/Kansas City, MO |
3 | Jacksonville, FL |
1 | ||||||
Birmingham, AL |
2 | Kalamazoo, MI |
1 | ||||||
Charlotte, NC |
2 | Kenner, LA |
1 | ||||||
Chicago, IL |
2 | Knoxville, TN |
1 | ||||||
Cincinnati, OH |
2 | Lexington-Fayette, KY |
1 | ||||||
Columbus, OH |
2 | Little Rock, AR |
1 | ||||||
Memphis, TN |
2 | Louisville, KY |
1 | ||||||
Nashville, TN |
2 | Lubbock, TX |
1 | ||||||
Orlando, FL |
2 | Macon, GA |
1 | ||||||
Raleigh/Durham, NC |
2 | McAllen, TX |
1 | ||||||
Richmond, VA |
2 | Norfolk, VA |
1 | ||||||
Salt Lake City, UT |
2 | Oklahoma City, OK |
1 | ||||||
Albuquerque, NM |
1 | Omaha, NE |
1 | ||||||
Biloxi-Gulfport, MS |
1 | Pittsburgh, PA |
1 | ||||||
Charleston, SC |
1 | Springfield, MO |
1 | ||||||
Chattanooga, TN |
1 | Toledo, OH |
1 | ||||||
Cleveland, OH |
1 | Tulsa, OK |
1 | ||||||
Colorado Springs, CO |
1 | Tyler, TX |
1 | ||||||
Corpus Christi, TX |
1 | Witchita, KS |
1 | ||||||
|
Total |
96 | |||||||
Store Layout
Our stores vary in size between 80,000 and 200,000 square feet with an average of over 120,000 square feet. Our locations have a similar store layout that is specifically designed to engage our customers. We design our stores as shoppable warehouses with wide aisles, an interior race track and clear signage that enable customers to easily navigate the store. We also have store maps available at the entrances for our customer to use while she shops. Throughout our stores, we merchandise products logically by color, design and size in order to appeal to our core shopper's buying preferences and use feature tables and end caps to create continuous visual interest and to highlight value. Additionally, we utilize product vignettes that offer design inspiration and coordinated product ideas to our customers. Our large store format allows us to maintain high in-stock positions and sell larger-sized and fully assembled products. To make her shopping experience easier and support our efficient operating model, we install fixture shelves lower to the ground so that products are easily reachable and require minimal staff assistance. We also utilize special fixtures for our products such as wall art, mirrors and rugs to allow easy viewing, improved shopability and minimized product damage. We have
91
a centralized checkout lane with multiple registers that makes the checkout process simple and efficient.
To enhance our customer's self-help shopping experience in connection with our larger-sized products, we offer her the opportunity to engage Select Express, a third party delivery service, to provide home delivery. Through this service, she is able to interface directly with the provider to schedule a convenient delivery time. Deliveries typically occur within 48 hours, but next-day service is also available. Select Express has experience nationwide with many major retailers. Nonetheless, deliveries from our store follow completion of the sales transaction with our customer, thus minimizing any exposure we might have in connection with the delivery.
Store Operations
We centralize major decisions relating to merchandising, inventory and pricing in order to allow our in-store team to focus on creating a clean and organized shopping environment. Our stores are typically led by a store director, two assistant managers and have a general staff averaging 25 employees. Store employees are broadly split into two functional groups, customer service and operations, thereby allowing us to maximize efficiencies while aligning employees to the function that best suits their skills. Our proprietary labor model optimizes staffing levels based on hourly sales and traffic volumes. Additionally, employees utilize downtime to stock shelves and displays with new inventory. This model provides us with the flexibility to meet various seasonal demands while enabling consistent labor margins throughout the year. Overall store supervision is managed by our Director of Store Operations and ten district managers.
Our employees are a critical component of our success and we are focused on attracting, retaining and promoting the best talent in our stores. We recognize and reward team members who meet our high performance standards. Store directors are able to participate in an unlimited bonus incentive program based primarily on exceeding store level sales targets. We also recognize individual performance through internal promotions and provide opportunities for advancement throughout our organization. We provide training for all new hires and ongoing training for existing employees.
Our stores are typically open seven days a week across the chain with regular hours of 9 a.m. to 10 p.m. Monday through Saturday and 9 a.m. to 9 p.m. on Sunday.
Real Estate Strategy
Expansion Opportunities
Our retail concept has been successful across a number of geographic markets spanning populations of 150,000 to over five million people. Our stores that have been open for more than twelve months as of August 1, 2015 perform consistently across small, mid-level and large markets and generated average annual Store-level Adjusted EBITDA of approximately $1.8 million to $2.0 million and average net sales of approximately $6.1 million to $7.2 million across these markets. Over the past three fiscal years, we have successfully opened 33 new stores in 27 markets, including 18 new markets. Our recent store growth is summarized in the following table:
| |
Fiscal Year Ended | Twenty-six Weeks Ended |
|||||||||||
|---|---|---|---|---|---|---|---|---|---|---|---|---|---|
| |
January 26, 2013 | January 25, 2014 | January 31, 2015 | August 1, 2015 | |||||||||
Beginning of period |
51 | 58 | 68 | 81 | |||||||||
Openings |
7 | 10 | 16 | 12 | |||||||||
Relocations |
— | — | (2 | ) | — | ||||||||
Closures |
— | — | (1 | ) | — | ||||||||
| | | | | | | | | | | | | | |
Total stores at end of period |
58 | 68 | 81 | 93 | |||||||||
| | | | | | | | | | | | | | |
| | | | | | | | | | | | | | |
| | | | | | | | | | | | | | |
92
We believe we have the whitespace to open at least 20 new stores per year for the foreseeable future. In fiscal year 2016, we plan to open 20 new stores, of which 16 are already open and the remaining are under construction. We plan to open at least 20 new stores in fiscal year 2017, for which we have signed letters of intent for 18 stores. Based on our internal analysis and research conducted for us by Buxton, we believe that we have the potential to expand to at least 600 stores in the United States over the long term, or over six times our current footprint of 96 stores. The rate of future growth in any particular period is inherently uncertain and is subject to numerous factors that are outside of our control. As a result, we do not currently have an anticipated timeframe to reach this potential. In addition, due in part to our recent investments, our systems, processes and controls should be able to support up to 220 stores with limited additional investment. We expect to continue to be disciplined in our approach to opening new stores, focusing primarily on expanding our presence in existing markets while selectively entering adjacent geographies. We also plan to act on compelling opportunities we identify in new markets.
Our store growth is supported by new store economics that we believe are compelling. Our new stores generate an average of $5 million of net sales and over $1 million of Store-level Adjusted EBITDA within the first full year of operations and reach maturity within the first six months. The average investment varies by the type of site and whether the store is leased, purchased or built from the ground up. Each store requires net investment on average of $2 to $3 million. Based on our model and historical results, we expect our new stores to pay back the initial investment within two years.
Site Selection and Availability
We have developed a highly analytical approach to real estate site selection with a stringent new store approval process. Our dedicated real estate team spends considerable time evaluating prospective sites before submitting a comprehensive approval package to our real estate committee, comprised of our Chief Executive Officer, Chief Financial Officer and Chief Development Officer. We target markets that meet our specific demographic and site evaluation criteria and complete substantial research before opening a new site. We use a proprietary model which takes into account several demand factors including population density of our target customer, median household income, home ownership rates, retail adjacencies, competitor presence and local economic growth metrics. Primary site evaluation criteria include availability of attractive lease terms, sufficient box size, co-tenancy, convenient parking, traffic patterns, visibility and access from major roadways. We typically favor locations near other big box retailers that drive strong customer traffic to the area.
We believe there will continue to be an ample supply of large format real estate in the United States that is attractive to us, driven by multi-chain, national retailers relocating or closing stores, a number of retailers shifting to smaller locations and the relative lack of new retail concepts using larger store formats. We believe we are one of the only growing, large format retailers in the country. As a result, we have become a direct beneficiary of this available real estate and of various retailers looking to quickly shed stores. We typically offer a convenient solution to any selling or leasing party as we are able to take a wide variety of boxes, move quickly and require little investment in time, resources or capital on their part. We take a disciplined approach to how we enter and build out our presence in markets and seek to optimize sales in a deliberate, carefully planned manner. In order to act quickly on new opportunities, we have scored over 20,000 big box retail locations in the United States with a proprietary site selection model. As a result of our proven track record, we have developed strong relationships with brokers, landlords and big box retailers and are often the first to receive a call when locations become available.
Site Development and Financing
We have a flexible and balanced approach to site development that allows us to optimize the investment characteristics of each new store and maintain our robust new store pipeline. We can lease
93
a second generation property, purchase a second generation building or build a new location from the ground up.
| | | | | | | |
| 2nd Generation Lease | 2nd Generation Purchase | New Development Build | ||||
| | | | | | | |
| Description: | Lease with a third party landlord | Purchase of property (including building) from a big box retailer or a landlord | Purchase or ground lease of land and a ground up build |
|||
| | | | | | | |
| Total new stores opened (FY14, FY15 and year-to-date): |
23 | 14 | 5 | |||
| | | | | | | |
| Estimated gross capital expenditure required: | • $1 - $3 million |
• $4 - $6 million
• Sale-leaseback transactions used to recoup real property investment |
• $9 - $11 million
• Sale-leaseback transactions used to recoup real property investment |
|||
| | | | | | | |
| Timing: | 5 - 9 months | 5 - 9 months | 10 - 18 months | |||
| | | | | | | |
| Benefit to At Home: | Lowest upfront costs | Provides better access to real estate and ability to offer complete solution to retailer | Best used in markets where At Home is well known, or for relocations | |||
|
|
Provides optimal store location and layout |
||||
| | | | | | | |
For purchased or new development builds, we can extract capital using sale-leasebacks through a proven and disciplined approach. We have relationships with a number of the major publicly traded REITs many of which have demonstrated a strong demand for our portfolio of assets which has resulted in increasingly more attractive capitalization rates. We have completed approximately $125 million in sale-leaseback transactions in the past two years at a capitalization rate between 6.46% and 6.99%.
We have developed an efficient process from site selection through new store opening. Second generation locations can be identified in less than 14 days, can close on the property within 30 days and open the store within five months. Our three pronged approach to site development allows us to negotiate very favorable real estate terms that typically include low occupancy costs, the ability to unilaterally "opt out" of leased locations, and other features that provide us with flexibility to manage our store portfolio.
Marketing
Our marketing and advertising strategies seek to effectively and efficiently communicate our compelling value proposition to an increasing base of home décor enthusiasts. Our goal is to develop a continuous dialogue with our core customers, while attracting new customers by building a distinctive connection to the At Home brand. We reinvigorated our marketing efforts, increasing spend from nearly zero in fiscal year 2013 to 2.0% of net sales in fiscal year 2015. We also hired a new Chief Marketing Officer in January 2015 to establish and implement our marketing strategy.
The home décor enthusiast views her home as a place that is constantly evolving with each season as well as everyday events in her life. We connect with her on an ongoing basis by inspiring her with all of the ways she can refresh her home with our wide range of décor styles for every room, in every style at everyday low prices. We engage with her across various marketing channels before, during and after her store visit. We have increased our focus in social media building relationships with home décor influencers as well as facilitating the sharing of home décor ideas through user generated content strategies leveraging Pinterest, Facebook, Instagram, Twitter and various blogs. We use weekly email
94
marketing to inspire her with seasonally relevant décor, and will be growing the reach of these efforts as we focus on significantly building our customer database (currently over 450,000 households) by rolling out in-store email capture.
We also use traditional media platforms (outdoor, radio and online advertising) to build broader brand awareness in markets where we can achieve the highest impact. To launch our brand during new store openings, we have evolved our strategy through tactical testing to get to an effective and cost efficient mix of radio, outdoor, social, digital, public relations and events. Additionally, we leverage this same media mix in select markets to drive traffic during the key summer season with our outdoor product offering and during the important holiday season with our broad holiday décor assortments.
Through our customer research, we have learned that many home décor enthusiasts browse online for ideas, inspiration and general product information before visiting specific stores. Over the next year, we intend to enable our customers to view our product assortment online with a robust search functionality and mobile friendly website focused on an inspirational shopping experience that showcases decorating ideas with our broad product assortment to drive traffic into our stores. In the future, we may consider providing various levels of e-commerce capabilities but will focus on strategies that maintain our industry-leading profitability.
We believe that effective marketing will continue to grow our awareness which will drive brand excitement, increase our customer engagement leading to increased store visits and sales.
Distribution
We operate a 541,000 square foot distribution center in Plano, Texas, which also serves as our corporate headquarters. We also have an additional 147,000 square foot warehouse in Garland, Texas, for initial inventory build-up for new store openings. We upgraded the distribution center over the past two years and it should be able to support up to 220 potential stores with limited additional investment. We have also invested over $9 million in automating our facility, implementing warehouse management software and robotics to efficiently handle daily product deliveries. This automation will continue to support our needs as we expand our store base.
The majority of our products are shipped directly to our distribution center, which serves as a cross-dock facility, storing very limited inventory on site. In order to streamline store operations and reduce labor requirements, all of the merchandise in our distribution center is prepared for the sales floor prior to transport. Vendors pre-ticket items with the appropriate price tags. Products are sorted onto pallets by zone such that they can be easily loaded onto trucks and then unloaded and placed directly in the sales zone with minimal back room storage. Our automated systems arrange shipments in trucks in the most logical manner to expedite unloading and delivery. This approach to distribution supports our efficient store operating model.
Real-time product replenishment in stores ensures that our customers have the broadest selection available and that we do not carry extra inventory. We generally ship merchandise to our stores between one and five times a week, depending on the season and the volume of a specific store, utilizing contract carriers for all shipments.
Information Systems
We believe that our management information systems will support our growth and enhance our competitive position. Our efficient operating model is supported by using industry standard applications in the areas of merchandising, store systems, replenishment, distribution and financial systems. We use a combination of these industry standard systems along with automated and easy to use proprietary systems to support all areas of our business. Over the past two years, we have invested more than $6 million in IT systems and infrastructure, including investments in merchandising (JDA),
95
POS systems (IBM/Toshiba), distribution center (PKMS) and finance and accounting (SAP) to ensure our systems are robust and scalable. Additionally, over the past two years we have tripled the number of IT team members to provide appropriate support and project delivery capabilities needed for the growth of the company.
Employees
As of August 1, 2015, we employed approximately 2,682 employees, including 2,461 store employees and 221 other employees across the corporate and distribution center functions. Of the 2,461 store employees, 282 were full-time salaried level staff and the remaining employees consisted of a mix of full-time and part-time hourly workers. All of our full-time employees earn a minimum wage of $10.00 per hour and all of our part-time employees earn a minimum wage of $9.00 per hour. Based on the level of transactions experienced at different times of the day, week and year, store labor is planned to serve customers effectively during peak periods while minimizing overall labor costs. None of our employees are currently covered under any collective bargaining agreements.
Intellectual Property
We own a U.S. trademark registration for the trademark "at home" and design, which was registered by the United States Patent & Trademark Office on July 7, 2015 for a ten-year term and is renewable every ten years thereafter. We also own the domain name athome.com and a number of other registered trademarks, pending trademark applications and domain names that we use in our business. Collectively, we consider our trademarks and domain names to be important assets of our operations and seek to actively monitor and protect our interest in this property.
Government Regulation
We are subject to labor and employment laws, laws governing truth-in-advertising, privacy laws, environmental laws, safety regulations and other laws, including consumer protection regulations that regulate retailers and govern the promotion and sale of merchandise and the operation of stores and warehouse facilities. We monitor changes in these laws and believe that we are in material compliance with applicable laws.
Legal Proceedings
We are subject to various litigations, claims and other proceedings that arise from time to time in the ordinary course of business. We believe these actions are routine and incidental to the business. While the outcome of these actions cannot be predicted with certainty, we do not believe that any will have a material adverse impact on our business.
96
Executive Officers and Directors
The following table sets forth information about our executive officers and directors, including their ages as of August 1, 2015. With respect to our directors, each biography contains information regarding the person's service as a director, business experience, director positions held currently or at any time during the past five years, information regarding involvement in certain legal or administrative proceedings, and the experience, qualifications, attributes or skills that caused our board of directors to determine that the person should serve as a director of our company.
Name
|
Age | Position | ||
|---|---|---|---|---|
Executive Officers |
||||
Lewis L. Bird III |
51 | Chief Executive Officer, President and Director | ||
Judd T. Nystrom |
42 | Chief Financial Officer | ||
Alissa M. Ahlman |
44 | Chief Merchandising Officer | ||
Mary Jane Broussard |
55 | Vice President, General Counsel | ||
Peter S.G. Corsa |
46 | Chief Stores Officer | ||
Valerie L. Davisson |
53 | Chief People Officer | ||
Norman E. McLeod |
52 | Chief Development Officer | ||
Jennifer S. Warren |
41 | Chief Marketing Officer | ||
Non-Employee Directors |
||||
Martin C. Eltrich, III |
43 | Chairman of the Board | ||
Brian R. Hoesterey |
47 | Director | ||
Geoffrey G. Clark |
42 | Director | ||
Allen I. Questrom |
75 | Director | ||
Wendy A. Beck |
50 | Director | ||
Larry D. Stone |
64 | Director | ||
Philip L. Francis |
68 | Director |
Lewis L. Bird III has served as our Chief Executive Officer since December 2012 and as President since September 2015. Before joining the company, Mr. Bird held a variety of leadership positions, most recently serving as Managing Director of The Gores Group from March 2011 to November 2012, a global private equity firm that specializes in acquiring and partnering with mature and growing businesses. Prior to this, Mr. Bird served as President of Nike Affiliates for Nike Inc. from 2006 to 2009, Chief Operating Officer of Gap from 2003 to 2006, Chief Financial Officer of Old Navy from 2001 to 2003. In addition, he was Vice President of Finance & Operations for Gateway, Inc. from 1999 to 2001; Senior Director of Corporate Finance for AlliedSignal, Inc. from 1998 to 1999, and Director of Finance & Business Management at AlliedSignal Engines from 1996 to 1998. He has also held various senior financial and strategic positions for Ford Motor Company, and served as Assistant Vice President & Commercial Loan Officer for BayBanks, Inc. Mr. Bird received his Master of Business Administration from Olin Graduate School of Business at Babson College and his bachelor's degree from Ithaca College. Mr. Bird was selected to our board of directors because of the perspective, experience and operational expertise in our business that he has developed as our Chief Executive Officer.
Judd T. Nystrom has served as our Chief Financial Officer since February 2013. Prior to joining us, he held several leadership roles in finance from February 2008 to February 2013, most recently as Senior Vice President, Finance for Advance Auto Parts, where he was responsible for planning and performance management, identifying opportunities to grow the business and improve profitability, corporate procurement and investor relations. Prior to Advance Auto Parts, Mr. Nystrom was with Best Buy from July 2002 to February 2008, where he served in escalating responsibilities, most recently as the Senior Director, Finance for U.S. Retail Channels and Retail Support, which included Best Buy
97
stores, BestBuy.com, Operations and Real Estate. Mr. Nystrom also held various financial positions at Carlson Companies from December 1995 to June 2002, most recently serving as Director of Accounting & Reporting. Mr. Nystrom received his bachelor's degree in Accounting from the University of Minnesota Carlson School of Management, has attended Executive Leadership Programs at the Carlson School of Management and University of Chicago, and is a Certified Public Accountant (inactive), Certified Management Accountant, and Certified in Financial Management.
Alissa M. Ahlman has served as our Chief Merchandising Officer since April 2015. Ms. Ahlman joined the company in March 2008 as Director of Merchandise Planning; she was promoted to Divisional Merchandising Manager in April 2009; then to Vice President and Divisional Merchandising Manager in April 2010; and then to Vice President and Co-General Merchandising Manager in June 2013 before assuming her current role. Before joining us, Ms. Ahlman was with 99¢ Only Stores from January 2005 to March 2008, most recently serving as Vice President of Planning & Allocation, but held the positions of Divisional Merchandise Manager, Director of Re-orderables, Consumer Insights & Category Management, as well as Director of Financial Planning & Analysis. Prior to this, Ms. Ahlman served as Director of Financial Planning & Analysis for Factory 2-U Stores from June 2000 to December 2004. Ms. Ahlman attended San Diego State University, majoring in Finance.
Mary Jane Broussard has served as our General Counsel since March 2014. Prior to that role, she served as our Vice President, Legal Counsel since June 2013. Prior to joining us, Ms. Broussard was a partner with Brown McCarroll, L.L.P. from 1993 to 2013, a regional law firm based in Dallas. Prior to her legal career, Ms. Broussard was a Certified Public Accountant with a national accounting firm from 1982 to 1984. Ms. Broussard received both her Juris Doctorate and Bachelor of Business Administration from the University of Texas at Austin.
Peter S. G. Corsa has served as our Chief Stores Officer since March 2013. Prior to joining us, Mr. Corsa served as Vice President of KSL Resorts from January 2011 to April 2013, which operates luxury resorts throughout the United States. Before this, he served as Executive Vice President of Retail for Stuart Weitzman from January 2006 to February 2011. In addition, he served as Senior Director of Store Operations for Gap from 2004 to 2006, Senior Director of Loss Prevention for Old Navy from 2002 to 2003, and Director of Store Operations for Old Navy from 1999 to 2002. Mr. Corsa received his Master of Business Administration from St. Mary's College of California and his Bachelor's degree in Political Science from the University of California, Santa Barbara.
Valerie L. Davisson has served as our Chief People Officer since April 2013. Prior to joining the Company, Ms. Davisson served as Executive Vice President of Brinker International from June 2005, adding the title of Chief PeopleWorks Officer in June 2007 and serving in that role until January 2013, where she led human resources and IT for more than 800 company owned restaurants. Prior positions with Brinker included Senior Vice President. Prior to joining Brinker in June 2004, Ms. Davisson held various positions from December 1998 to June 2004 with Yum! Brands, Inc., including Vice President of Human Resources, Vice President of Field Operations for Kentucky Fried Chicken, Senior Director of Global Staffing for Yum! Brands, Inc. and Director of Field Human Resources for Pizza Hut. She received her Bachelor's degree in Government from Southern Illinois University and earned a Master in Human Resource Management from Washington University in St. Louis.
Norman E. McLeod has served as our Chief Development Officer since October 2013. Prior to joining us, Mr. McLeod most recently served as Vice President of Development and Real Estate for FedEx Office, a subsidiary of FedEx Corporation, from March 2004 to October 2013. In this role he was responsible for 1,900 U.S. and international stores, including lease administration, renewals, remodels, relocations and repair/maintenance. Prior to this, Mr. McLeod was with YUM! Brands, Inc. from May 1992 to March 2004, most recently serving as Director of Development. In addition to this
98
role, he also served as National Director of Construction, Franchise Development Director, Market Planning, Director of Special Projects and Equipment, and Development Manager. Prior to these roles, Mr. McLeod served as Director of Construction for Turnkey Construction Company from May 1991 to May 1992, and as a Staff Engineer and Project Manager for Mobil Oil Corporation from August 1986 to May 1991. Mr. McLeod received his Bachelor's degree in Civil Engineering from Texas Tech University.
Jennifer S. Warren has served as our Chief Marketing Officer since January 2015. Prior to joining us, Ms. Warren served as the Senior Vice President and Chief Marketing Officer at Radio Shack from May 2013 to January 2015. Prior to RadioShack, Jennifer held roles building Fortune 500 brands at Razorfish from March 2012 to April 2013 and GSD&M from January 2000 to March 2012. Ms. Warren has a Bachelor's degree in marketing from Lamar University.
Martin C. Eltrich, III has served as Chairman of our board of directors since October 2011. Mr. Eltrich is a Partner with AEA, which he joined in June 2001, and leads the consumer/retail investment practice. He currently serves on the board of directors of 24 Hour Fitness, Shoes for Crews, LLC and Brand Networks LLC. Prior to AEA's exit from the investment, Mr. Eltrich also sat on the boards of Acosta, Inc., Burt's Bees, Inc., Cogent HMG, Henry Company, Intermedia Advertising Group and Tampico Beverages. Before joining AEA, Mr. Eltrich was an investment banker covering the consumer products industry at Greenhill & Co. in New York, joining that firm at its inception in 1996. Prior to Greenhill & Co., Mr. Eltrich was an investment banker in the Consumer Group at Morgan Stanley. Mr. Eltrich received his Bachelor of Science in Economics from the University of Pennsylvania. Mr. Eltrich was selected to our board of directors because he possesses particular knowledge and experience in corporate finance, strategic planning and investments.
Brian R. Hoesterey has served as a member of our board of directors since October 2011. Mr. Hoesterey is a Partner with AEA, which he joined in 1999, where he focuses on investments in the specialty chemicals and value-added industrial products sectors. Prior to joining AEA, Mr. Hoesterey was with BT Capital Partners, the private equity investment vehicle of Bankers Trust. Mr. Hoesterey has also previously worked for McKinsey & Co. and the investment banking division of Morgan Stanley. Mr. Hoesterey is currently a director of GMS, Evoqua and Swanson Industries. Mr. Hoesterey was previously on the board of CPG International, Houghton, SRS, Henry Company, Unifrax, Pregis and Noveon. Mr. Hoesterey currently serves on the Oversight Committee for Patagonia Sur, a for-profit venture that invests in, protects and enhances scenically remarkable and ecologically valuable properties in Chilean Patagonia. Mr. Hoesterey received a Bachelor of Business Administration in accounting, summa cum laude, from Texas Christian University and received a Master of Business Administration with honors from the Harvard Business School. Mr. Hoesterey was selected to our board of directors because he possesses particular knowledge and experience in corporate finance, strategic planning and investments.
Geoffrey G. Clark has served as a member of our board of directors since 2012. Mr. Clark is Senior Managing Director of Starr Investment Holdings and a Director of C.V. Starr & Co., which he joined in 2007. Prior to joining Starr, Mr. Clark was a Partner and Managing Director of Goldman, Sachs & Co. where he joined in 1994, and served as the co-head of the Private Equity Group. Mr. Clark graduated as a Leslie Wong Fellow with a Bachelor of Commerce in Finance from the University of British Columbia, and is a Chartered Financial Analyst. Mr. Clark was selected to our board of directors because he possesses particular knowledge and experience in corporate finance, strategic planning and investments.
Allen I. Questrom has served as a member of our board of directors since March 2012. Mr. Questrom was Chairman and Chief Executive Officer of Neiman Marcus, Inc. from 1988 to 1990. He was Chairman and CEO of Federated Department Stores, Inc. (now Macy's) from February 1990 to May 1997. He served on the board of Barneys New York, Inc. beginning in January 1999 and as
99
President and Chief Executive Officer from May 1999 until September 2000 and as Chairman of the Board from May 1999 until January 2001. From 2000 through December 2004, he was the Chairman and Chief Executive Officer of J.C. Penney Company, Inc. Mr. Questrom is a Trustee of Boston University. He has been a Senior Advisor for Lee Equity Partners since 2006 and is currently a member of the Board of Directors of Glazer's Family of Companies, The Men's Wearhouse, Inc., InterlLuxe and on the Board of Advisors of the Robin Report, providing insight into consumer product industries. Until June 2014, Mr. Questrom was a member of the board of directors of Sotheby's; until 2013, a member of the board of directors of Foot Locker, Inc.; and until 2010, a member of the board of directors of Walmart Stores, Inc. and was non-executive chairman of Deb Shops, Inc. Mr. Questrom graduated from Boston University with a Bachelor of Science degree in Finance and Marketing. Mr. Questrom was selected to our board of directors because he brings particular knowledge and experience in operating and leading retail companies.
Wendy A. Beck has served as a member of our board of directors since September 2014. She currently serves as Executive Vice President and Chief Financial Officer for Norwegian Cruise Line Holdings, Inc. Prior to this role, Ms. Beck served as Executive Vice President and Chief Financial Officer of Domino's Pizza, Inc. from May 2008 to September 2010. Prior to that, she served as Senior Vice President, Chief Financial Officer and Treasurer of Whataburger Restaurants, LP from May 2004 through April 2008 and served as their Vice President and Chief Accounting Officer from August 2001 through April 2004. Ms. Beck was also employed at Checkers Drive-In Restaurants, Inc. from 1993 through July 2001, serving as Vice President, Chief Financial Officer and Treasurer from 2000 through July 2001. Ms. Beck previously sat on the board of directors and audit committee for Spartan Stores, Inc. She holds a Bachelor of Science degree in Accounting from the University of South Florida and is a Florida Certified Public Accountant. Ms. Beck was selected to our board of directors because she possesses particular knowledge and experience in accounting, finance, strategic planning and leadership of other major corporations.
Larry D. Stone has served as a member of our board of directors since December 2014. Mr. Stone served as President and Chief Operating Officer of Lowe's Companies Inc. from December 2006 until his retirement in June 2011, and before that as Senior Executive Vice President, Merchandising/Marketing of Lowe's Companies, Inc. since 2005. Mr. Stone served as Senior Executive Vice President, Store Operations for Lowe's Companies from 2003 to 2005, and as Executive Vice President, Store Operations from 2001 to 2003. Mr. Stone has served on the Board for Novant Health System, Inc., a not-for-profit integrated system of healthcare, since 2011 and currently serves as Vice Chairman of the Board. Mr. Stone has also served on the Board of Directors for Dick's Sporting Goods, Inc. since 2007 and he is the Chairman of the Compensation Committee. Mr. Stone is a graduate of the Harvard Business School's Program for Management Development. Mr. Stone was selected to our board of directors because he possesses particular knowledge and experience in strategic planning and leadership of other major corporations.
Philip L. Francis has served as a member of our board of directors since May 2015. He most recently served as Chairman of PetSmart, Inc. from 2009 to 2012 and Chairman and Chief Executive Officer from 2001 to 2009. Mr. Francis currently serves on the boards of Supervalu, Inc. and Pharmaca Integrative Pharmacy. He also served on the boards of PetSmart, Inc. from 1989 to 2013, Cardinal Health, Inc. from 2006 to 2009 and CareFusion Inc. from 2009 to March 2015. Mr. Francis received his Master of Business Administration from Indiana University in Marketing and Management and his Bachelor of Science in Agricultural Science from University of Illinois at Urbana-Champaign. Mr. Francis was selected to our board of directors because he possesses particular knowledge and experience in strategic planning and leadership of other major corporations.
100
Board Composition
Our board of directors currently consists of eight directors. Currently, each director is elected for a one-year term and serves until a successor is duly elected and qualified or until his or her death, resignation or removal. There are no family relationships between any of our directors or executive officers. Our executive officers are elected by and serve at the discretion of the board of directors.
Our amended and restated certificate of incorporation and amended and restated bylaws that will become effective upon the closing of this offering provide that the authorized number of directors may be changed only by resolution of the board of directors. Our amended and restated certificate of incorporation and amended and restated bylaws that will become effective upon the closing of this offering also provide that our directors may be removed only for cause, and that any vacancy on our board of directors, including a vacancy resulting from an enlargement of our board of directors, may be filled only by vote of a majority of our directors then in office.
In accordance with the terms of our amended and restated certificate of incorporation and amended and restated bylaws that will become effective upon the closing of this offering, our board of directors will be divided into three classes, class I, class II and class III, with members of each class serving staggered three-year terms. Upon the closing of this offering, the members of the classes will be divided as follows:
- •
- the Class I directors will be Mr. Bird and Mr. Questrom, and their terms will expire at the annual
meeting of stockholders to be held in 2016;
- •
- the Class II directors will be Ms. Beck, Mr. Francis and Mr. Stone, and their terms will
expire at the annual meeting of stockholders to be held in 2017; and
- •
- the Class III directors will be Mr. Clark, Mr. Eltrich and Mr. Hoesterey, and their terms will expire at the annual meeting of stockholders to be held in 2018.
The classification of the board of directors may have the effect of delaying or preventing changes in control of our company. We expect that additional directorships resulting from an increase in the number of directors, if any, will be distributed among the three classes so that, as nearly as possible, each class will consist of one-third of the directors.
Leadership Structure of the Board of Directors
Our board of directors currently separates the roles of Chief Executive Officer and Chairman of the Board. These positions are currently held by Lewis L. Bird III, as our Chief Executive Officer, and Martin C. Eltrich, III, as the Chairman. We believe this leadership structure is appropriate for our company due to the differences between the two roles. The Chief Executive Officer is responsible for setting our strategic direction, providing day-to-day leadership and managing our business, while the Chairman of the Board provides guidance to the Chief Executive Officer, chairs board meetings, sets the agendas for meetings of our board of directors as well as provides information to the members of our board of directors in advance of such meetings. In addition, separating the roles of Chief Executive Officer and Chairman of the Board allows the Chairman to provide oversight of our management.
Director Independence and Controlled Company Exception
Our board of directors has affirmatively determined that Messrs. Questrom, Stone and Francis and Ms. Beck are independent directors under the rules of the NYSE and independent directors as such term is defined in Rule 10A-3(b)(1) under the Exchange Act. Mr. Bird, our Chief Executive Officer, is not independent because of his position as an executive officer. Our remaining directors are not independent because of their affiliations with the Sponsors which, together with its affiliates, indirectly hold more than 50% of our common stock: Messrs. Eltrich (compensation committee) and
101
Hoesterey (compensation committee) are representatives of AEA and Mr. Clark (compensation committee) is a representative of Starr Investments.
After completion of this offering, we expect that the Sponsors will continue to control a majority of the voting power of our outstanding common stock. As a result, we expect to be a "controlled company" within the meaning of the NYSE corporate governance standards. Under these rules, a "controlled company" may elect not to comply with certain corporate governance standards, including:
- •
- the requirement that a majority of our board of directors consist of independent directors;
- •
- the requirement that we have a nominating and corporate governance committee that is composed entirely of independent
directors with a written charter addressing the committee's purpose and responsibilities;
- •
- the requirement that we have a compensation committee that is composed entirely of independent directors with a written
charter addressing the committee's purpose and responsibilities; and
- •
- the requirement for an annual performance evaluation of the nominating and corporate governance committee and compensation committee.
Following this offering, we intend to utilize certain of these exemptions. As a result, we will not have a majority of independent directors, our nominating and corporate governance committee and compensation committee will not consist entirely of independent directors and such committees will not be subject to annual performance evaluations. Accordingly, you will not have the same protections afforded to stockholders of companies that are subject to all of the corporate governance requirements. See "Risk Factors—Risks Related to Our Common Stock and this Offering—We are a "controlled company" within the meaning of the rules of the NYSE and, as a result, will qualify for, and may rely on, exemptions from certain corporate governance requirements."
Committees of the Board of Directors
Upon the consummation of this offering, our board of directors will have three committees: the audit committee, the compensation committee and the nominating and corporate governance committee. From time to time, our board of directors may contemplate establishing other committees.
Audit Committee. The members of the audit committee are Ms. Beck, as Chair, and Messrs. Francis and Stone. Rule 10A-3 of the Exchange Act requires us to have one independent audit committee member upon the listing of our common stock, a majority of independent directors on our audit committee within 90 days of the date of this prospectus and an audit committee composed entirely of independent directors within one year of the date of this prospectus. Ms. Beck qualifies as our "audit committee financial expert" within the meaning of regulations adopted by the SEC. The audit committee recommends the annual appointment and reviews independence of auditors and reviews the scope of audit and non-audit assignments and related fees, the results of the annual audit, accounting principles used in financial reporting, internal auditing procedures, the adequacy of our internal control procedures, related party transactions, and investigations into matters related to audit functions. The audit committee is also responsible for overseeing risk management on behalf of our board of directors. See "—Risk Oversight."
Compensation Committee. The members of the compensation committee are Mr. Eltrich, as Chairman, and Messrs. Clark, Hoesterey and Stone. The principal responsibilities of the compensation committee are to review and approve matters involving executive and director compensation, recommend changes in employee benefit programs, authorize equity and other incentive arrangements, and authorize our company to enter into employment and other employee related agreements.
102
Nominating and Corporate Governance Committee. Upon the consummation of this offering, the members of the nominating and corporate governance committee will be , as Chairman, and . The nominating and corporate governance committee assists our board of directors in identifying individuals qualified to become board members, makes recommendations for nominees for committees and develops, recommends to the board of directors and reviews our corporate governance principles.
Risk Oversight
Our board of directors administers its risk oversight function primarily through the audit committee. To that end, our audit committee meets at least quarterly with our Chief Financial Officer and our independent auditors where it receives regular updates regarding our management's assessment of risk exposures including liquidity, credit and operational risks and the process in place to monitor such risks and review results of operations, financial reporting and assessments of internal controls over financial reporting. Our board of directors believes that its administration of risk management has not affected the board's leadership structure, as described above.
Code of Ethics
We have adopted a code of ethics applicable to all of our directors, officers (including our principal executive officer, principal financial officer and principal accounting officer) and employees, known as the Code of Business Conduct & Ethics. The Code of Business Conduct & Ethics will be available on our website at www.athome.com under Investor Relations. In the event that we amend or waive certain provisions of the Code of Business Conduct & Ethics applicable to our principal executive officer, principal financial officer or principal accounting officer that requires disclosure under applicable SEC rules, we intend to disclose the same on our website.
Compensation Committee Interlocks and Insider Participation
None of our executive officers serves, or in the past year has served, as a member of the board of directors or compensation committee (or other committee performing equivalent functions) of any entity that has one or more executive officers serving on our board of directors or compensation committee. No interlocking relationship exists between any member of our compensation committee (or other committee performing equivalent functions) and any executive, member of the board of directors or member of the compensation committee (or other committee performing equivalent functions) and of any other company.
103
The following table sets forth the portion of compensation paid to the named executive officers that is attributable to services performed during the fiscal year ended January 31, 2015, with a focus on our executive compensation program relating to the following individuals: Lewis L. Bird III, Peter S.G. Corsa, and Judd T. Nystrom (our "named executive officers")
Summary Compensation Table
Name and Principal Position |
Year | Salary ($)(1) |
Bonus ($)(2) |
Option Awards ($)(3) |
Non-Equity Incentive Plan Compensation ($)(4) |
All Other Compensation ($) |
Total ($) | |||||||||||||||
|---|---|---|---|---|---|---|---|---|---|---|---|---|---|---|---|---|---|---|---|---|---|---|
Lewis L. Bird III |
2015 | 560,577 | — | — | 778,700 | 1,196,409 | 2,535,686 | |||||||||||||||
Chief Executive Officer |
||||||||||||||||||||||
Peter S.G. Corsa |
2015 |
331,250 |
100,000 |
266,048 |
233,610 |
5,190 |
936,098 |
|||||||||||||||
Chief Stores Officer |
||||||||||||||||||||||
Judd T. Nystrom |
2015 |
331,250 |
— |
266,048 |
233,610 |
60,544 |
891,452 |
|||||||||||||||
Chief Financial Officer |
||||||||||||||||||||||
- (1)
- The
amounts included in the "Salary" column are based on a 53 week fiscal year.
- (2)
- The
amount included in the "Bonus" column consists of a bonus of $100,000 paid to Mr. Corsa pursuant to the CSO Agreement (described below in
"Narrative Disclosure to Summary Compensation Table—Chief Stores Officer (P. Corsa)") on February 1, 2014 for his continued employment through such date.
- (3)
- The
amounts included in the "Option Awards" column represent the aggregate grant date fair value computed in accordance with FASB ASC Topic 718. The
valuation assumptions used in determining such amounts are described in Note 11—Stock-Based Compensation of our financial statements included elsewhere in this prospectus.
- (4)
- The amounts included in the "Non-Equity Incentive Compensation Plan" column reflect the named executive officers' annual performance bonuses earned in respect of fiscal year 2015, which were based on performance targets for fiscal year 2015 as described below in "Performance Based Annual Cash Incentives" and were paid following the end of fiscal year 2015 on April 17, 2015.
Narrative Disclosure to Summary Compensation Table
Elements of Compensation
In fiscal year 2015 we compensated our named executive officers through a combination of base salary, annual cash incentives, long-term equity incentives in the form of stock options and other benefits as described below.
Base Salary
The salaries for fiscal year 2015 for our named executive officers were determined pursuant to the terms of each officer's employment agreement, which are described below, and remained the same as the initial base salaries set forth in such employment agreements.
Performance Based Annual Cash Incentives
In fiscal year 2015 all of our named executive officers, with the exception of our Chief Executive Officer, Lewis L. Bird III, were eligible to receive annual cash bonuses with the target of 60% of base salary under our Management Bonus Plan. Mr. Bird was eligible for a cash bonus based on a dollar target of $650,000 pursuant to the terms of his employment agreement. The Management Bonus Plan consists of two measures of Company performance which determine the Company's achievement multiple for the target bonus through the use of an achievement table: (i) adjusted EBITDA versus the financial plan for the year, which comprises 75% of the achievement calculation,
104
and (ii) comparable store sales growth, which comprises 25% of the achievement calculation. Achievement of less than the Company's prior year adjusted EBITDA target results in a 0% achievement multiple and the maximum Company achievement multiple is 170%. Finally, the Compensation Committee of the Board of Directors has final discretion with regard to senior executive bonuses based upon the delivery of key strategic initiatives. The adjusted EBITDA target was $93.5 million and comparable store sales growth target was 2.5%. The Company's adjusted EBITDA was $97.2 million and comparable store sales growth was 8.3% resulting in a blended Company achievement multiple of 119.8% based upon the achievement table. The Board of Directors approved the bonus payment with no adjustments.
Fiscal Year 2015 Option Awards
On June 3, 2014, Messrs. Corsa and Nystrom were each granted a nonqualified stock option to purchase 661 shares of Class C common stock of the Company pursuant to the Company's 2012 Option Plan (defined below under "2012 Option Plan"), the terms and conditions of which are described below under "2012 Option Plan" and "Option Awards."
All Other Benefits
In fiscal year 2015, the Company reimbursed Messrs. Bird and Nystrom, on an after-tax basis, for certain expenses incurred in connection with their relocations to Texas (which, for Mr. Bird, included an "Equity Loss Payment" described below under "Employment Agreements—Chief Executive Officer (L. Bird)"). In fiscal year 2015, the Company also reimbursed Mr. Bird for certain annual financial planning costs he incurred.
The Company maintains, and the named executive officers participate in, a 401(k) retirement savings plan. Each participant may contribute to the plan through payroll deductions, up to 100% of his salary and bonus limited to the maximum allowed by the Internal Revenue Service regulations. The plan provides for "safe harbor" employer matching contributions as described below under "Retirement Benefits." All amounts contributed by the employee and the Company as well as earnings on these contributions are fully vested and are not taxable to participants until withdrawn.
Our compensation program does not include any other material benefits or perquisites for our named executive officers. Our named executive officers have the opportunity to participate in the same programs as our other employees.
Employment Agreements
We have entered into employment agreements with each of Messrs. Bird, Corsa, and Nystrom (the "Employment Agreements"). The following summary details the material terms of the Employment Agreements.
Chief Executive Officer (L. Bird)
On November 15, 2012 the Company entered into an employment agreement with Mr. Bird to serve as Chief Executive Officer of the Company (the "CEO Agreement"), pursuant to which his employment term commenced on December 3, 2012 and will continue for an indefinite term, subject to termination (other than for cause, as defined in the CEO Agreement) upon at least 30 days prior written notice by either party. The CEO Agreement provides that Mr. Bird was to receive an initial annual base salary of $550,000, subject to increase (but not decrease) at the discretion of the Board (or committee thereof), which amount was increased to $700,000 by the Compensation Committee on September 11, 2015. He is also eligible to receive an annual bonus of up to $1,105,000, with a target annual bonus equal to $700,000, subject to satisfaction of performance goals based on attainment of an EBITDA target for the applicable fiscal year. The CEO Agreement also provides that Mr. Bird is eligible to participate in all benefit programs for which other senior executives of the Company are generally eligible and is entitled to reimbursement of up to $15,000 per year for financial planning expenses. The CEO Agreement provided that in the event Mr. Bird sold his home in Oregon at a price
105
of less than $2.4 million, he would be entitled to a make-whole payment, grossed up for taxes, to a cover a portion of such shortfall (the "Equity Loss Payment"), which Equity Loss Payment was made on November 28, 2014. The CEO Agreement also provides for severance upon certain terminations of employment, as described below under "Payments upon Certain Events of Termination or Change in Control."
The CEO Agreement includes restrictive covenants providing for non-competition, non-solicitation of employees, and non-interference with business relationships, in each case during employment and for one year thereafter, mutual non-disparagement during employment and for five years thereafter, and perpetual nondisclosure of confidential information.
If any payments or benefits to which Mr. Bird would be entitled to receive pursuant to the terms of the CEO Agreement or otherwise in connection with a change in the ownership or effective control of the Company would result in all or a portion of such payments or benefits being deemed "parachute payments" under Section 280G of the Internal Revenue Code of 1986, as amended (the "Code") and the excise tax imposed by Section 4999 of the Code, such payments and benefits will be reduced to the minimum extent necessary so that they would not result in the imposition of an excise tax under Section 4999 of the Code, provided that no reduction will be made if Mr. Bird would receive a greater net after-tax amount absent such reduction.
Chief Financial Officer (J. Nystrom)
On January 25, 2013 the Company entered into an employment agreement with Mr. Nystrom to serve as Chief Financial Officer of the Company (the "CFO Agreement"), pursuant to which his employment term commenced on February 18, 2013 and will continue for an indefinite term, subject to termination (other than for cause, as defined in the CFO Agreement) upon at least 30 days prior written notice by either party. The CFO Agreement provides that Mr. Nystrom was to receive an initial annual base salary of $325,000, subject to increase (but not decrease) at the discretion of the Board (or committee thereof) and shall be eligible to receive an annual bonus of up to 100% of his annual base salary, which amount was increased to $400,000 by the Compensation Committee on September 11, 2015. He is also eligible to receive a target annual bonus equal to 60% of his annual base salary, subject to satisfaction of performance goals to be set by the Board. The CFO Agreement provides that Mr. Nystrom is eligible to participate in all benefit programs for which other senior executives of the Company are generally eligible. The CFO Agreement also provides for severance upon certain terminations of employment, as described below under "Payments upon Certain Events of Termination or Change in Control."
The CFO Agreement includes restrictive covenants providing for non-competition, non-solicitation of employees, and non-interference with business relationships, in each case, during employment and for one year thereafter, as well as perpetual nondisclosure of confidential information and nondisparagement of the Company.
Chief Stores Officer (P. Corsa)
On February 2, 2013 the Company entered into an employment agreement with Mr. Corsa to serve as Chief Stores Officer of the Company (the "CSO Agreement"), pursuant to which his employment term was to have commenced no later than March 25, 2013 and continue for an indefinite term, subject to termination (other than for cause, as defined in the CSO Agreement) upon at least 30 days prior written notice by either party. The CSO Agreement provides that Mr. Corsa was to receive an initial annual base salary of $325,000, subject to increase (but not decrease) at the discretion of the Board (or committee thereof), which amount was increased to $350,000 by the Compensation Committee on September 11, 2015. He is also eligible to receive an annual bonus of up to 100% of his annual base salary, with a target annual bonus equal to 60% of his annual base salary, subject to satisfaction of performance goals to be set by the Board. Under the CSO Agreement, Mr. Corsa was also entitled to a bonus of $100,000 that was paid on February 21, 2014. The CSO Agreement provides
106
that Mr. Corsa is eligible to participate in all benefit programs for which other senior executives of the Company are generally eligible. The CSO Agreement also provides for severance upon certain terminations of employment, as described below under "Payments upon Certain Events of Termination or Change in Control."
The CSO Agreement includes restrictive covenants providing for non-competition, non-solicitation of employees, and non-interference with business relationships, in each case, during employment and for one year thereafter, as well as perpetual nondisclosure of confidential information and nondisparagement of the Company.
Outstanding Equity Awards at Fiscal Year End
The following table summarizes the number of securities underlying the equity awards held by each of the named executive officers as of the fiscal year ended January 31, 2015.
| |
Option Awards(1) | |||||||||||||||
|---|---|---|---|---|---|---|---|---|---|---|---|---|---|---|---|---|
Name
|
Grant Date | Number of securities underlying unexercised options exercisable (#) |
Number of securities underlying unexercised options unexercisable (#) |
Equity incentive plan awards: Number of securities underlying unexercised unearned options (#) |
Option exercise price ($) |
Option expiration date |
||||||||||
Lewis L. Bird III |
11/26/2012 | 8,815 | 8,815 | — | 1,250 | 11/26/2022 | ||||||||||
Peter S.G. Corsa |
1/10/2013 |
1,102 |
3,306 |
— |
1,250 |
1/10/2023 |
||||||||||
|
6/3/2014 | — | 661 | — | 1,250 | 6/3/2024 | ||||||||||
Judd T. Nystrom |
1/31/2013 |
1,102 |
3,306 |
— |
1,250 |
1/31/2023 |
||||||||||
|
6/3/2014 | — | 661 | — | 1,250 | 6/3/2024 | ||||||||||
- (1)
- Each option award was originally scheduled to vest in equal annual installments on each of the first four anniversaries of the applicable grant date. Mr. Bird's option award, as well as Mr. Corsa's January 10, 2013 option award and Mr. Nystrom's January 31, 2013 option award, were amended as of December 4, 2012, March 25, 2013, and February 18, 2013, respectively, and now vest in equal annual installments on each of the first four anniversaries of the applicable option award amendment date.
Additional Narrative Disclosure
Retirement Benefits
We maintain a tax-qualified Section 401(k) retirement savings plan that provides for employee contributions and employer "safe harbor" matching contributions equal to 100% of salary deferrals up to 3% of a participant's compensation and 50% of salary deferrals thereafter up to 5% of a participant's compensation. Our named executive officers are eligible to participate in our tax qualified Section 401(k) retirement savings plan on the same basis as other employees who satisfy the plan's eligibility requirements, including requirements relating to age and length of service. Under this plan, participants may elect to make pre-tax contributions not to exceed the applicable statutory income tax limitation, which, subject to certain exceptions, was $17,500 for calendar year 2014 and $18,000 for calendar year 2015. Participants are always fully vested in their entire plan account (including with respect to employer contributions).
Payments upon Certain Events of Termination or Change in Control
Pursuant to the terms of the Employment Agreements, our named executive officers are entitled to receive certain payments in connection with certain termination events.
107
In the event of a termination of employment for any reason, each of our named executive officers is entitled to payment of any earned but unpaid base salary, vested benefits in accordance with the applicable employee benefit plan, unreimbursed business expenses, and, other than upon a termination for cause, any earned but unpaid annual bonus for fiscal years completed prior to the termination date. In addition, upon any termination of Mr. Bird's employment (other than for cause or due to resignation without good reason (as defined in the CEO Agreement)) that occurs after the 90th day of a fiscal year, Mr. Bird is entitled to a pro rata bonus for the year of termination based on performance through the end of the month preceding termination and an adjusted performance target, prorated based on the number of days worked in the fiscal year of termination. Upon a termination of employment of any named executive officer other than for cause, death, or disability, or upon a termination for good reason (as defined in the applicable Employment Agreement), then our named executive officers are each entitled to severance payments (in addition to the pro rata bonus described in the preceding sentence in the case of Mr. Bird), payable over the twelve month period following termination of employment, in amounts equal to annual base salary (for Mr. Corsa) and the sum of annual base salary plus target bonus opportunity (for Messrs. Bird and Nystrom), and Mr. Corsa is also entitled to payment of the full annual bonus to which he would have been entitled for the year of termination had he remained employed, based on actual performance and paid at the same time as annual bonuses are ordinarily paid. In addition, Mr. Bird is entitled to an additional lump sum payment if he is terminated without cause or resigns for good reason within six months before a "change of control" (as defined in the CEO Agreement) at the request of the buyer or within one year following a change of control, in an amount equal to the sum of his annual base salary plus target bonus opportunity, payable on the later of the date of the change of control or the date the initial payment of his standard severance payments is made.
Each of our named executive officers has been granted nonqualified stock option awards (described below under "Option Awards") under the Company's 2012 Option Plan (defined below under "2012 Option Plan"). Each of the option awards granted to our named executive officers fully vests and becomes exercisable upon a "change in control" (as defined in the 2012 Option Plan). In addition, pursuant to Mr. Bird's option award, if his employment is terminated without "cause" or he resigns for "good reason" (each as defined in the CEO Agreement) then his entire option shall remain outstanding for six months and become exercisable upon a change in control that occurs within such six-month period if the per share price received by the holders of the Company's common stock in such change in control equals or exceeds $2,500 (subject to equitable adjustments from time to time to account for any "Change in Capitalization" as defined in the 2012 Option Plan).
Mr. Bird is also party to a letter agreement dated November 26, 2012, pursuant to which he is entitled, upon a "change of control" that occurs before the "Mandatory Conversion Date" (as each such term is defined in the Company's amended and restated certificate of incorporation), to payment of an amount equal to the difference between the proceeds he would have received upon such change of control had the shares covered by the vested portion of his option award been Class A Common Stock of the Company instead of Class C common Stock of the Company. Because the date of the initial public offering of the Company's common stock is a Mandatory Conversion Date, this letter agreement will no longer be applicable on and after an initial public offering.
Director Compensation
We historically have not had a formal compensation package for non-employee members of our Board for their service as directors. However, we may decide to grant equity awards in connection with the appointment of, or continued service by, a director to our Board, from time to time. In fiscal year 2015, we granted nonqualified stock option awards to each of Ms. Beck and Mr. Stone.
Other than these nonqualified stock options, our non-employee directors currently do not receive any compensation specifically for their services as a director; however, the Company does reimburse these directors for any travel or other business expenses related to their service as a director.
108
The following table summarizes the compensation of the non-employee directors of the Company for the fiscal year ended January 31, 2015:
Name
|
Option Awards ($)(1)(2) |
Total ($) |
|||||
|---|---|---|---|---|---|---|---|
Wendy A. Beck |
212,295 | 212,295 | |||||
Geoffrey G. Clark |
— | — | |||||
Martin C. Eltrich, III |
— | — | |||||
Brian R. Hoesterey |
— | — | |||||
Allen I. Questrom(3) |
— | — | |||||
Larry D. Stone |
210,583 | 210,583 | |||||
- (1)
- The
amounts shown in the "Option Awards" column reflects the aggregate grant date fair value of the option award calculated in accordance with FASB ASC
Topic 718.
- (2)
- As
of January 31, 2015, Ms. Beck and Mr. Stone each held outstanding options to purchase 441 shares.
- (3)
- As of January 31, 2015, Mr. Questrom held outstanding options to purchase 441 shares, which were granted prior to the fiscal year ended January 31, 2015.
Annual Bonus Plan
Prior to the consummation of this offering, the Company intends to adopt the At Home Group Inc. Annual Bonus Plan (the "Bonus Plan") providing for the grant of annual bonus awards to our executive officers and other key employees.
The Bonus Plan will be administered by the Compensation Committee. Subject to the limitations set forth in the Bonus Plan, the Compensation Committee shall have the authority to determine, for each plan year, the time or times at which awards may be granted, the recipients of awards, the performance criteria, the performance goals and all other terms of an award, interpret the Bonus Plan, make all determinations under the Bonus Plan and necessary or advisable for the administration of the Bonus Plan, prescribe, amend and rescind rules and regulations relating to the Bonus Plan. The Compensation Committee shall be able to delegate responsibility for performing certain ministerial functions under the Bonus Plan to any officer or employee of the Company.
The performance criteria for us or any identified subsidiary or business unit, as selected by the Compensation Committee at the time of the award will be one or any combination of the following: (i) net earnings; (ii) earnings per share; (iii) net debt; (iv) revenue or sales growth; (v) net or operating income; (vi) net operating profit; (vii) return measures (including, but not limited to, return on assets, capital, equity or sales); (viii) cash flow (including, but not limited to, operating cash flow, distributable cash flow and free cash flow); (ix) earnings before or after taxes, interest, depreciation, amortization and/or rent; (x) share price (including, but not limited to growth measures and total stockholder return); (xi) expense control or loss management; (xii) customer satisfaction; (xiii) market share; (xiv) economic value added; (xv) working capital; (xvi) the formation of joint ventures or the completion of other corporate transactions; (xvii) gross or net profit margins; (xviii) revenue mix; (xix) operating efficiency; (xx) product diversification; (xxi) market penetration; (xxii) measurable achievement in quality, operation or compliance initiatives; (xxiii) quarterly dividends or distributions; (xxiv) employee retention or turnover; and (xxv) any combination of or a specified increase in any of the foregoing, or such other performance criteria determined to be appropriate by the Compensation Committee in its sole discretion.
The performance goals shall be the levels of achievement relating to the performance criteria as selected by the Compensation Committee for an award. The Compensation Committee shall be able to establish such performance goals relative to the applicable performance criteria in its sole discretion
109
at the time of an award. The performance goals may be applied on an absolute basis or relative to an identified index or peer group, as specified by the Compensation Committee. The performance goals may be applied by the Compensation Committee after excluding charges for restructurings, discontinued operations, extraordinary items and other unusual or nonrecurring items and the cumulative effects of accounting changes, and without regard to realized capital gains.
Because it is intended that the Bonus Plan be adopted prior to us becoming a publicly held company, it is intended that the Bonus Plan satisfy the requirements for transition relief under Section 162(m) of the Code (described below under "IRS Code Section 162(m)"), such that the $1 million annual deduction limit under Section 162(m) of the Code does not apply to any remuneration paid pursuant to this Bonus Plan until the first meeting of our shareholders at which our directors are to be elected that occurs after the close of the third calendar year following the calendar year in which the initial public offering of our securities occurs.
2012 Option Plan
On November 12, 2012, the board of directors of the Company adopted the GRD Holding I Corporation Stock Option Plan, as may be amended from time to time (the "2012 Option Plan"), under which 44,074.9103 shares of Class C common stock of the Company ("Shares") were reserved for the issuance of options to purchase Shares ("Options") as of January 31, 2015. Any Shares related to an Option that expires, is cancelled, or otherwise terminates without issuance of the Shares shall again be available for issuance. The 2012 Option Plan was established to attract, retain, incentivize and motivate officers and employees of, consultants to, and non-employee directors providing services to the Company and its subsidiaries and affiliates and to promote the success of the Company by providing such participating individuals with a proprietary interest in the performance of the Company.
Administration. The 2012 Option Plan is administered by the Compensation Committee, which has all of the powers necessary to enable it to carry out its duties under the 2012 Option Plan properly, including the power and duty to construe and interpret the 2012 Option Plan and to determine all questions arising under it. The Compensation Committee may correct any defect, supply any omission, or reconcile any inconsistency in the 2012 Option Plan or in any Option in the manner and to the extent it deems necessary to carry out the intent of the 2012 Option Plan. The Compensation Committee's interpretations and determinations shall be final, binding and conclusive upon all persons.
Plan Term. The 2012 Option Plan became effective on November 12, 2012 and will terminate on the tenth (10th) anniversary thereof, unless earlier terminated by the Board.
Eligibility. Under the 2012 Option Plan, the "Eligible Individuals" includes officers, employees, consultants, advisors and non-employee directors providing services to the Company and its subsidiaries and affiliates. The Compensation Committee will determine which Eligible Individuals will receive grants of options.
Option Price. The manner in which the exercise price is to be determined for Shares under each Option shall be determined by the Compensation Committee and set forth in the option agreement; provided, that the exercise price per Share under each Option shall not be less than the greater of (i) the par value of a Share and (ii) 100% of the fair market value of a Share on the date the Option is granted.
Maximum Duration. Options granted under the 2012 Option Plan shall be for such term as the Compensation Committee shall determine; provided that an Option shall not be exercisable after the expiration of 10 years from the date it is granted; provided, further, that unless the Compensation Committee provides otherwise, an Option may, upon the death of the participant prior to the expiration of the Option, be exercised for up to one year following the date of the participant's death, even if such period extends beyond 10 years from the date the Option is granted. The Compensation
110
Committee may, subsequent to the granting of any Option, extend the period within which the Option may be exercised (including following a participant's termination), but in no event shall the period be extended to a date that is later than the earlier of the latest date on which the Option could have been exercised and the 10th anniversary of the date of grant of the Option.
Vesting. The Compensation Committee shall determine and set forth in the applicable option agreement the time or times at which an Option shall become vested and exercisable. To the extent not exercised, vested installments shall accumulate and be exercisable, in whole or in part, at any time after becoming exercisable, but not later than the date the Option expires. Options granted under the 2012 Option Plan typically provide for vesting in equal annual installments over the first four anniversaries of the date of grant. The Compensation Committee may accelerate the exercisability of any Option or portion thereof at any time.
Method of Exercise. The exercise of an Option shall be made only by giving notice in the form and to the person designated by the Company, specifying the number of Shares to be exercised and, to the extent applicable, accompanied by payment therefor and otherwise in accordance with the option agreement pursuant to which the Option was granted. The Option Price shall be paid in any or any combination of the following forms: (a) cash or its equivalent or (b) in the form of other property as determined by the Compensation Committee. Any Shares transferred to or withheld by the Company as payment of the exercise price under an Option (to the extent permitted by the Compensation Committee) shall be valued at their fair market value on the last business day preceding the date of exercise of such Option.
Adjustments. In the event of a Change in Capitalization (as defined in the 2012 Option Plan), the Compensation Committee shall conclusively determine the appropriate adjustments, if any, to (a) the maximum number and class of Shares with respect to which Options may be granted under the 2012 Option Plan, and (b) the number and class of Shares or other stock or securities (of the Company or any other corporation or entity), cash or other property which are subject to outstanding Options granted under the Plan and the exercise price therefor, if applicable. If, by reason of a Change in Capitalization, pursuant to an Option Agreement, a participant shall be entitled to, or shall be entitled to exercise an Option with respect to new, additional or different shares of stock or securities of the Company or any other entity, such new, additional or different shares shall thereupon be subject to all of the conditions and restrictions which were applicable to the Shares subject to the Option prior to such Change in Capitalization.
Effect of Change in Control or Certain Other Transactions. Unless otherwise provided in an award agreement, in connection with a merger, consolidation, reorganization, recapitalization or other similar change in the capital stock of the Company, or a liquidation or dissolution of the Company or a Change in Control (as defined the 2012 Option Plan) (each a "Corporate Transaction"), all outstanding Options shall terminate upon the consummation of the Corporate Transaction, unless provision is made in connection with such transaction, in the sole discretion of the Compensation Committee or the parties to the Corporate Transaction, for the assumption or continuation of such Options by, or the substitution for such Options with new awards of stock options, stock appreciation rights or other equity based compensation, of the surviving, or successor or resulting entity, or a parent or subsidiary thereof, with such adjustments as to the number and kind of shares or other securities or property subject to such new awards, option and stock appreciation right exercise or base prices, and other terms of such new awards as the Compensation Committee or the parties to the Corporate Transaction shall agree. In the event that provision is made in writing as aforesaid in connection with a Corporate Transaction, the 2012 Option Plan and the unexercised Options theretofore granted or the new awards substituted therefor shall continue in the manner and under the terms provided in such writing. Notwithstanding the foregoing, vested Options (including those Options that would become vested upon the consummation of the Corporate Transaction) shall not be terminated upon the consummation of the Corporate Transaction unless holders of affected Options are provided either (i) a period of at
111
least fifteen (15) calendar days prior to the date of the consummation of the Corporate Transaction to exercise the Options, or (ii) payment in respect of each Share covered by the Option being cancelled in an amount equal to the excess, if any, of the per Share price to be paid or distributed to stockholders in the Corporate Transaction over the option price of the Option.
Without limiting the generality of the foregoing or being construed as requiring any such action, in connection with any such Corporate Transaction the Compensation Committee may, in its sole and absolute discretion, without the consent of any participant, cause any of the following actions to be taken effective upon or at any time prior to any Corporate Transaction: (a) cause any or all unvested Options to become fully vested and immediately exercisable (as applicable) and/or provide the holders of such Options a reasonable period of time prior to the date of the consummation of the Corporate Transaction to exercise the Options; or (b) with respect to unvested Options that are terminated in connection with the Corporation Transaction, provide the holders thereof a payment in respect of each Share covered by the Option being terminated in an amount equal to all or a portion of the excess, if any, of the per Share price to be paid or distributed to stockholders in the Corporate Transaction.
Transferability. Notwithstanding anything contained in the 2012 Option Plan or any option agreement to the contrary, in the event that the disposition of Shares acquired pursuant to the 2012 Option Plan is not covered by a then current registration statement under the Securities Act and is not otherwise exempt from such registration, such Shares shall be restricted against transfer to the extent required by the Securities Act and Rule 144 or other regulations promulgated thereunder. The Compensation Committee may require any individual receiving Shares pursuant to an Option granted under the 2012 Option Plan, as a condition precedent to receipt of such Shares, to represent and warrant to the Company in writing that the Shares acquired by such individual are acquired without a view to any distribution thereof and will not be sold or transferred other than pursuant to an effective registration thereof under the Securities Act or pursuant to an exemption applicable under the Securities Act or the rules and regulations promulgated thereunder.
Amendment or Termination of the 2012 Option Plan. The Board may earlier terminate the 2012 Option Plan and the Board may at any time and from time to time amend, modify or suspend the Option Plan; provided, however, that, (a) no such amendment, modification, suspension or termination shall impair or adversely alter any Options theretofore granted under the 2012 Option Plan, except with the consent of the participant, nor shall any amendment, modification, suspension or termination deprive any participant of any Shares which he may have acquired through or as a result of the 2012 Option Plan; and (b) to the extent necessary under any applicable law, regulation or exchange requirement, no other amendment shall be effective unless approved by the shareholders of the Company in accordance with applicable law, regulation or exchange requirement.
Option Awards
Each of our named executive officers has been granted nonqualified stock options to purchase shares of Class C common stock of the Company pursuant to the Company's 2012 Option Plan. Mr. Bird was granted a nonqualified stock option to purchase 17,630 shares on November 26, 2012. Messrs. Corsa and Nystrom were granted nonqualified stock options to purchase 4,408 shares on January 10 and January 31, 2013, respectively, as well as nonqualified stock options to purchase 661 shares on June 3, 2014. Each of the nonqualified stock options awards granted to our named executive officers was granted with an exercise price of $1,250 per share.
The option awards vest and become exercisable in equal annual installments on each of the first four anniversaries of the applicable award's grant date for the June 3, 2014 grants to Messrs. Corsa and Nystrom, and, for each other aforementioned award, the applicable award's "vesting commencement date" (December 4, 2012 for Mr. Bird, March 25, 2013 for Mr. Corsa, and February 18, 2013 for Mr. Nystrom). All of the options awarded to our named executive officers provide for accelerated vesting upon the occurrence of certain events, as described above in "Additional Narrative Disclosure—Payments upon Certain Events of Termination or Change in Control".
112
IRS Code Section 162(m)
Section 162(m) of the Code generally disallows publicly held companies a tax deduction for compensation in excess of $1,000,000 paid to their chief executive officer and the three other most highly compensated executive officers (other than the chief financial officer) unless such compensation qualifies for an exemption for certain compensation that is based on performance. Section 162(m) of the Code provides transition relief for privately held companies that become publicly held, pursuant to which the foregoing deduction limit does not apply to any remuneration paid pursuant to compensation plans or agreements in existence during the period in which the corporation was not publicly held if, in connection with an initial public offering, the prospectus accompanying the initial public offering discloses information concerning those plans or agreements that satisfies all applicable securities laws then in effect. If the transition requirements are met in connection with an initial public offering, the transition relief continues until the earliest of (i) the expiration of the plan or agreement, (ii) the material modification of the plan or agreement, (iii) the issuance of all employer stock and other compensation that has been allocated under the plan, or (iv) the first meeting of the stockholders at which directors are to be elected that occurs after the close of the third calendar year following the calendar year in which the initial public offering occurs. Our intent generally is to design and administer executive compensation programs in a manner that will preserve the deductibility of compensation paid to our executive officers, and we believe that a substantial portion of our current executive compensation program will satisfy the requirements for exemption from the $1,000,000 deduction limitation, to the extent applicable. However, we reserve the right to design programs that recognize a full range of performance criteria important to our success, even where the compensation paid under such programs may not be deductible. The Compensation Committee will monitor the tax and other consequences of our executive compensation program as part of its primary objective of ensuring that compensation paid to our executive officers is reasonable, performance based and consistent with our goals and the goals of our stockholders.
2015 Equity Incentive Plan
Prior to the consummation of this offering, the Company intends to adopt the At Home Group Inc. Equity Incentive Plan (the "2015 Equity Plan") under which equity awards may be made in respect of shares of common stock of the Company ("Shares"), consisting of an IPO Bonus Pool (as defined below) of shares (or 3.6% of issued and outstanding Shares on a fully diluted basis after this offering) and a Post-IPO Share Pool (as defined below) of shares (or 5.4% of issued and outstanding Shares on a fully diluted basis after this offering), as described further below in the section titled "—Shares Available." Under the 2015 Equity Plan, awards may be granted in the form of options, restricted stock, restricted stock units, stock appreciation rights, dividend equivalent rights and performance-based awards (including performance units, performance share units and performance-based restricted stock).
Administration. The 2015 Equity Plan will be administered by a committee appointed by the board of directors (the "Committee"). The Committee shall consist of at least two directors of the board of directors and may consist of the entire board of directors. The Committee will generally consist of at least two directors considered to be non-employee directors for purposes of Section 16 of the Exchange Act, and to the extent that an award is intended to qualify as "performance based compensation" within the meaning of Section 162(m) of the Code, the Committee will consist of at least two directors of the board, each of whom shall be an "outside director" as defined within the meaning of Section 162(m) of the Code.
Plan Term. The 2015 Equity Plan will become effective as of the date it is approved by the board of directors, subject to its having been approved by the existing stockholders, and will terminate on the tenth (10th) anniversary thereof, unless earlier terminated by the board of directors.
113
Eligibility. Under the 2015 Equity Plan, "Eligible Individuals" include officers, employees, consultants and non-employee directors providing services to the Company and its subsidiaries and affiliates. The Committee will determine which Eligible Individuals will receive grants of awards.
Incentives Available. Under the 2015 Equity Plan, the Committee may grant any of the following types of awards to an Eligible Individual: incentive stock options ("ISOs") and nonqualified stock options ("Nonqualified Stock Options" and, together with ISOs, "Options"); stock appreciation rights ("SARs"); restricted stock grants ("Restricted Stock Grants"); restricted stock units ("RSUs"); Performance Awards; Dividend Equivalent Rights; and Share Awards, each as defined below (each type of grant is considered an "Award").
Shares Available. Subject to any adjustment as provided in the 2015 Equity Plan, (i) up to Shares (the "IPO Bonus Pool") may be issued pursuant to Awards granted under the 2015 Equity Plan to senior executives of the Company in connection with the consummation of this offering, as described further below in the section titled "—2015 Equity Plan Awards—Special IPO Bonus Grants" and (ii) up to Shares may be issued pursuant to Awards granted under the 2015 Equity Plan (other than the IPO Bonus Pool) (the "Post-IPO Share Pool"), all of which may be granted pursuant to ISOs. With respect to Awards granted following the last day of the Transition Period (as defined in the 2015 Equity Plan) (or, if later, the date the 2015 Equity Plan is approved by the Company's stockholders for purposes of Section 162(m) of the Code), (a) the aggregate number of Shares that may be the subject of Option or SARs granted in any calendar year (or in respect of the calendar year during which the Transition Period expires, the remainder of such calendar year) may not exceed Shares in the case of an Eligible Individual who is not a director, or Shares in the case of a director, (b) the aggregate number of Shares that may be the subject of Performance-Based Restricted Stock and Performance Share Units granted in any calendar year (or in respect of the calendar year during which the Transition Period expires, the remainder of such calendar year) may not exceed Shares in the case of an Eligible Individual who is not a director, or Shares in the case of a director, and (c) the maximum dollar amount of cash or the fair market value of Shares that any Eligible Individual may receive in any calendar year (or in respect of the calendar year during which the Transition Period expires, the remainder of such calendar year) in respect of Performance Units may not exceed $6,000,000.
If an Award or any portion thereof that is issued from the Post-IPO Share Pool (i) expires or otherwise terminates without all of the Shares covered by such Award having been issued or (ii) is settled in cash (i.e., the Participant receives cash rather than Shares), such expiration, termination or settlement will not reduce (or otherwise offset) the number of Shares that may be available for issuance under the 2015 Equity Plan. Any Shares issued pursuant to an Award that are forfeited and returned back to or reacquired by the Company will again become available for issuance under the 2015 Equity Plan. Any Shares tendered or withheld to pay the exercise price of an Option or the base price of an SAR, or to satisfy tax withholding obligations associated with any Award, shall not become available again for issuance under the 2015 Equity Plan. Under no circumstances will Shares underlying any Awards issued under the IPO Bonus Pool, once issued, again become available for issuance under the 2015 Equity Plan.
Stock Options. The Committee may grant Options (which may be ISOs or Nonqualified Stock Options) to Eligible Individuals. An ISO is an Option intended to qualify for tax treatment applicable to ISOs under Section 422 of the Code. An ISO may be granted only to Eligible Individuals that are employees of the Company or any of its subsidiaries. A Nonqualified Stock Option is an Option that is not subject to statutory requirements and limitations required for certain tax advantages allowed under Section 422 of the Code.
Vesting and Exercise Periods. Each Option granted under the 2015 Equity Plan may be subject to certain vesting requirements and will become exercisable in accordance with the specific terms and conditions of the Option, as determined by the Committee at the time of grant and set forth
114
in an Award agreement. The term of an Option generally may not exceed ten years from the date it is granted (five years in the case of an ISO granted to a ten-percent stockholder). Each Option, to the extent it becomes exercisable, may be exercised at any time in whole or in part until its expiration or termination, unless otherwise provided in applicable Award agreement.
Exercise Price. The purchase price per Share with respect to any Option granted under the 2015 Equity Plan may be not less than 100% of the fair market value of a share of Common Stock on the date the Option is granted (110% in the case of an ISO granted to a ten-percent stockholder).
Limits on Incentive Stock Options. In order to comply with the requirements for ISOs in the Code, no person may receive a grant of an ISO for stock that would have an aggregate fair market value in excess of $100,000, determined when the ISO is granted, that would be exercisable for the first time during any calendar year. If any grant of an ISO is made in excess of such limit, the portion that is over the $100,000 limit would be a Nonqualified Stock Option.
Stock Appreciation Rights. The Committee may grant SARs to Eligible Individuals on terms and conditions determined by the Committee at the time of grant and set forth in an Award agreement. An SAR may be granted (a) at any time if unrelated to an Option or (b) if related to an Option, either at the time of grant or at any time thereafter during the term of the Option.
Amount Payable. An SAR is a right granted to a participant to receive an amount equal to the excess of the fair market value of a Share on the last business day preceding the date of exercise of such SAR over the fair market value of a Share on the date the SAR was granted. An SAR may be settled or paid in cash, Shares or a combination of each, in accordance with its terms.
Duration. Each SAR will be exercisable or be forfeited or expire on such terms as the Committee determines. Except in limited circumstances, an SAR shall have a term of no greater than ten years.
Prohibition on Repricings. The Committee will have no authority to make any adjustment or amendment (other than in connection with certain changes in capitalization or certain corporate transactions in accordance with the terms of the 2015 Equity Plan, as generally described below) that reduces, or would have the effect of reducing, the exercise price of an Option or SAR previously granted under the 2015 Equity Plan, unless the Company's stockholders approve such adjustment or amendment.
Dividend Equivalent Rights. The Committee may grant dividend equivalent rights ("Dividend Equivalent Rights"), either in tandem with an Award or as a separate Award, to Eligible Individuals on terms and conditions determined by the Committee at the time of grant and set forth in an Award agreement. A Dividend Equivalent Right is a right to receive cash or Shares based on the value of dividends that are paid with respect to the Shares. Amounts payable in respect of Dividend Equivalent Rights may be payable currently or, if applicable, deferred until the lapsing of restrictions on such dividend equivalent rights or until the vesting, exercise, payment, settlement or other lapse of restrictions on the Award to which the Dividend Equivalent Rights relate, subject to compliance with Section 409A of the Code. Dividend Equivalent Rights may be settled in cash or shares of Common Stock or a combination thereof, in a single installment or multiple installments, as determined by the Committee.
Restricted Stock; Restricted Stock Units. The Committee may grant either Shares (Restricted Stock) or phantom Shares (RSUs), in each case subject to certain vesting requirements, on terms and conditions determined by the Committee at the time of grant and set forth in an Award agreement.
Restricted Stock. Unless the Committee determines otherwise, upon the issuance of shares of Restricted Stock, the participant shall have all of the rights of a shareholder with respect to such Shares, including the right to vote the Shares and to receive all dividends or other distributions made with respect to the Shares. The Committee may determine that the payment to the participant of dividends, or a specified portion thereof, declared or paid on such Shares shall be deferred until the
115
lapsing of the restrictions imposed upon such Shares and held by the Company for the account of the participant until such time. Payment of deferred dividends in respect of shares of Restricted Stock shall be made upon the lapsing of restrictions imposed on the shares of Restricted Stock in respect of which the deferred dividends were paid, and any dividends deferred in respect of any shares of Restricted Stock shall be forfeited upon the forfeiture of such shares of Restricted Stock.
Restricted Stock Units. Each RSU shall represent the right of the participant to receive a payment upon vesting of the RSU, or on any later date specified by the Committee, of an amount equal to the fair market value of a Share as of the date the RSU becomes vested, or such later date as determined by the Committee at the time the RSU is granted (and which will be set forth in the applicable grant agreement). An RSU may be settled or paid in cash, Shares or a combination of each, as determined by the Committee.
Performance Awards. Performance awards ("Performance Awards") (including performance units ("Performance Units"), performance share units ("Performance Share Units") and performance-based restricted stock ("Performance-Based Restricted Stock")) may be granted to Eligible Individuals on terms and conditions determined by the Committee and set forth in an Award agreement.
Performance Units and Performance Share Units. Performance Units shall be denominated in a specified dollar amount and, contingent upon the attainment of specified performance objectives within a performance cycle and such other vesting conditions as may be determined by the Committee (including without limitation, a continued employment requirement following the end of the applicable performance period), and represent the right to receive payment of the specified dollar amount or a percentage of the specified dollar amount depending on the level of performance objective attained; provided, however, that the Committee may at the time a Performance Unit is granted specify a maximum amount payable in respect of a vested Performance Unit. Performance Share Units shall be denominated in Shares and, contingent upon the attainment of specified performance objectives within a performance cycle and such other vesting conditions as may be determined by the Committee (including without limitation, a continued employment requirement following the end of the applicable performance period), represent the right to receive payment of the fair market value of a Share on the date the Performance Share Unit was granted, the date the Performance Share Unit became vested or any other date specified by the Committee or a percentage of such amount depending on the level of performance objective attained; provided, however, that the Committee may at the time a Performance Share Unit is granted specify a maximum amount payable in respect of a vested Performance Share Unit. The Award agreement for each Performance Unit and Performance Share Unit shall specify the number of Performance Units or Performance Share Units to which it relates, the performance objectives and other conditions which must be satisfied in order for the Performance Unit or Performance Share Unit to vest and the performance cycle within which such performance objectives must be satisfied and the circumstances under which the Award will be forfeited.
Performance-Based Restricted Stock. Performance-Based Restricted Stock shall consist of an Award of shares of Restricted Stock, issued in the participant's name and subject to appropriate restrictions and transfer limitations. Unless the Committee determines otherwise and as set forth in the applicable Award agreement, upon issuance of Shares of Performance-Based Restricted Stock, the participant shall have all of the rights of a shareholder with respect to such Shares, including the right to vote the Shares and to receive all dividends or other distributions paid or made with respect to Shares. The Award agreement for each Award of Performance-Based Restricted Stock will specify the number of shares of Performance-Based Restricted Stock to which it relates, the performance objectives and other conditions that must be satisfied in order for the Performance-Based Restricted Stock to vest, the performance cycle within which the performance objectives must be satisfied (which will not be less than one (1) year) and the circumstances under which the Award will be forfeited. At the time the Award of Performance-Based Restricted Stock is granted, the Committee may determine that the payment to the participant of dividends, or a specified portion thereof, declared or paid on Shares represented by such Award which have been issued by the Company to the participant shall be
116
deferred until the lapsing of the restrictions imposed upon such Performance-Based Restricted Stock and held by the Company for the account of the participant until such time. Payment of deferred dividends in respect of Shares of Performance-Based Restricted Stock shall be made upon the lapsing of restrictions imposed on the Performance-Based Restricted Stock in respect of which the deferred dividends were paid, and any dividends deferred in respect of any Performance-Based Restricted Stock shall be forfeited upon the forfeiture of such Performance-Based Restricted Stock.
Performance Objectives. With respect to any Performance Awards intended to constitute "performance-based compensation" under Section 162(m) of the Code, performance objectives ("Performance Objectives") may be expressed in terms of (i) earnings per share; (ii) operating income; (iii) return on equity or assets; (iv) cash flow; (v) net cash flow; (vi) cash flow from operations; (vii) EBITDA and/or adjusted EBITDA; (viii) revenue growth, product revenue and/or comparable sales growth; (ix) revenue ratios; (x) cost reductions; (xi) cost ratios or margins; (xii) overall revenue or sales growth; (xiii) expense reduction or management; (xiv) market position or market share; (xv) total shareholder return; (xvi) return on investment; (xvii) earnings before interest and taxes (EBIT); (xviii) net income (before or after taxes); (xix) return on assets or net assets; (xx) economic value added; (xxi) shareholder value added; (xxii) cash flow return on investment; (xxiii) net operating profit; (xxiv) net operating profit after tax; (xxv) return on capital; (xxvi) return on invested capital; (xxvii) customer growth; (xxviii) supply chain achievements, (xxix) financial ratios, including those measuring liquidity, activity, profitability or leverage; (xxx) financing and other capital raising transactions; (xxxi) strategic partnerships or transactions; or (xxxii) any combination of the foregoing. Performance Objectives may be in respect of the performance of the Company, any of its Subsidiaries or Divisions (as defined in the 2015 Equity Plan) or any combination thereof. Performance Objectives may be absolute or relative (to prior performance of the Company or to the performance of one or more other entities or external indices) and may be expressed in terms of a progression within a specified range.
The Committee may, at the time the Performance Objectives in respect of a Performance Award are established, provide for the manner in which performance will be measured against the Performance Objectives to reflect the impact of specified events, including any one or more of the following with respect to the applicable performance period (i) the gain, loss, income or expense resulting from changes in accounting principles or tax laws that become effective during the performance period; (ii) the gain, loss, income or expense reported publicly by the Company with respect to the performance period that are extraordinary or unusual in nature or infrequent in occurrence; (iii) the gains or losses resulting from, and the direct expenses incurred in connection with, the disposition of a business or the sale of investments or non-core assets; (iv) the gain or loss from all or certain claims and/or litigation and all or certain insurance recoveries relating to claims or litigation; or (v) the impact of investments or acquisitions made during the year or, to the extent provided by the Committee, any prior year. The events may relate to the Company as a whole or to any part of the Company's business or operations, as determined by the Committee at the time the Performance Objectives are established. Any adjustments based on the effect of certain events are to be determined in accordance with generally accepted accounting principles and standards, unless another objective method of measurement is designated by the Committee.
Prior to the vesting, payment, settlement or lapsing of any restrictions with respect to any Performance Award intended to qualify as "performance-based compensation" under Section 162(m) of the Code, the Committee shall certify in writing that the applicable Performance Objectives have been satisfied. In respect of a Performance Award, the Committee may, in its sole discretion, (i) reduce the amount of cash paid or number of Shares to be issued or that have been issued and that become vested or on which restrictions lapse, and/or (ii) establish rules and procedures that have the effect of limiting the amount payable to any Participant to an amount that is less than the amount that otherwise would be payable under such Award. The Committee may exercise such discretion in a non-uniform manner among Participants.
117
Share Awards. The Committee may grant an Award of Shares ("Share Awards") to an Eligible Individual on such terms and conditions as the Committee may determine at the time of grant. A Share Award may be made as additional compensation for services rendered by the Eligible Individual or may be in lieu of cash or other compensation to which the Eligible Individual is entitled from the Company.
Adjustments upon Changes in Capitalization. In the event that the outstanding Shares are changed into or exchanged for a different number or kind of Shares or other stock or securities or other equity interests of the Company or another corporation or entity, whether through merger, consolidation, reorganizations, recapitalization, reclassification, stock dividend, stock split, reverse stock split, substitution or other similar corporate event or transaction, or an extraordinary dividend or distribution by the Company in respect of its Shares or other capital stock or securities convertible into capital stock in cash, securities or other property, the Committee shall determine the appropriate adjustments, if any, to (a) the maximum number and kind of shares of stock or other securities or other equity interests as to which Awards may be granted under the 2015 Equity Plan, (b) the maximum number and class of Shares or other stock or securities that may be issued upon exercise of ISOs, (c) the number and kind of Shares or other securities covered by any or all outstanding Awards that have been granted under the 2015 Equity Plan, (d) the option price of outstanding Options and the base price of outstanding SARs, and (e) the Performance Objectives applicable to outstanding Performance Awards.
Effect of Change in Control or Certain Other Transactions. Generally, the Award agreement evidencing each Award will provide any specific terms applicable to that Award in the event of a Change in Control of the Company (as defined below). Unless otherwise provided in an Award agreement, in connection with a merger, consolidation, reorganization, recapitalization or other similar change in the capital stock of the Company, or a liquidation or dissolution of the Company or a Change in Control (each a "Corporate Transaction"), Awards shall either: (a) continue following such Corporate Transaction, which may include, in the discretion of the Committee or the parties to the Corporate Transaction, the assumption, continuation or substitution of the Awards, in each case with appropriate adjustments to the number, kind of shares, and exercise prices of the Awards; or (b) terminate.
For purposes of the 2015 Equity Plan, "Change in Control" generally means the occurrence of any of the following events with respect to the Company: (a) any person (other than directly from the Company) first acquires securities of the Company representing fifty percent or more of the combined voting power of the Company's then outstanding voting securities, other than an acquisition by certain employee benefit plans, the Company or a related entity, or any person in connection with a non-control transaction; (b) a majority of the members of the board of directors is replaced by directors whose appointment or election is not endorsed by a majority of the members of the board of directors serving immediately prior to such appointment or election; (c) any merger, consolidation or reorganization, other than in a non-control transaction; (d) a complete liquidation or dissolution or (e) sale or disposition of all or substantially all of the assets. A "non-control transaction" generally includes any transaction in which (i) stockholders immediately before such transaction continue to own at least a majority of the combined voting power of such resulting entity following the transaction; (ii) a majority of the members of the board of directors immediately before such transaction continue to constitute at least a majority of the board of the surviving entity following such transaction or (iii) with certain exceptions, no person other than any person who had beneficial ownership of more than fifty percent of the combined voting power of the Company's then outstanding voting securities immediately prior to such transaction has beneficial ownership of more than fifty percent of the combined voting power of the surviving entity's outstanding voting securities immediately after such transaction.
Options and SARs. If Options or SARs are to terminate in the event of a corporate transaction, the holders of vested Options or SARs must be provided either (a) fifteen days to exercise their Options or SARs or (b) payment (in cash or other consideration) in respect of each Share
118
covered by the Option of SAR being cancelled in an amount equal to the excess, if any, of the per Share price to be paid to stockholders in the Corporate Transaction over the price of the Option or the SAR. If the per Share price to be paid to stockholders in the Corporate Transaction is less than the exercise price of the Option or SAR, the Option or SAR may be terminated without payment of any kind. The holders of unvested Options or SARs may also receive payment, at the discretion of the Committee, in the same manner as described above for vested Options and SARs. The Committee may also accelerate the vesting on any unvested Option or SAR and provide holders of such Options or SARS a reasonable opportunity to exercise the Award.
Other Awards. If Awards other than Options and SARs are to terminate in connection with a corporate transaction, the holders of vested Awards will be provided, and holders of unvested Awards may be provided, at the discretion of the Committee, payment (in cash or other consideration upon or immediately following the Corporate Transaction, or, to the extent permitted by Section 409A of the Code, on a deferred basis) in respect of each Share covered by the Award being cancelled in an amount equal to the per Share price to be paid to stockholders in the Corporate Transaction, where the value of any non-cash consideration will be determined by the Committee in good faith.
The Committee may, in its sole discretion, provide for different treatment for different Awards or Awards held by different parties, and where alternative treatment is available for a participant's Awards, may allow the participant to choose which treatment will apply to his or her Awards.
Transferability. The 2015 Equity Plan generally restricts the transfer of any Awards, except (a) transfers by will or the laws of descent and distribution or (b) to a beneficiary designated by the participant, to whom any benefit under the 2015 Equity Plan is to be paid or who may exercise any rights of the participant in the event of the participant's death before he or she receives any or all of such benefit or exercises an Award.
Amendment or Termination of the 2015 Equity Plan. The 2015 Equity Plan may be amended or terminated by the board of directors without shareholder approval unless shareholder approval of the amendment or termination is required under applicable law, regulation or NYSE requirement. No amendment may materially and adversely alter or impair any Awards that had been granted under the 2015 Equity Plan prior to the amendment without the impacted participant's consent. The 2015 Equity Plan will terminate on the tenth anniversary of its effective date; however, when the 2015 Equity Plan terminates, any applicable terms will remain in effect for administration of any Awards outstanding at the time of the 2015 Equity Plan's termination.
Forfeiture Events; Clawback. The Committee may specify in an Award agreement that the participant's rights, payments and benefits with respect to an Award shall be subject to reduction, cancellation, forfeiture, clawback or recoupment upon the occurrence of certain specified events or as required by law, in addition to any otherwise applicable forfeiture provisions that apply to the Award.
If a participant receives compensation pursuant to an Award under the 2015 Equity Plan based on financial statements that are subsequently required to be restated in a way that would decrease the value of such compensation, the participant will, to the extent not otherwise prohibited by law, upon the written request of the Company, forfeit and repay to the Company the difference between what the participant received and what the participant should have received based on the accounting restatement, in accordance with (i) the Company's compensation recovery, "clawback" or similar policy, as may be in effect from time to time and (ii) any compensation recovery, "clawback" or similar policy made applicable by law including the provisions of Section 945 of the Dodd-Frank Wall Street Reform and Consumer Protection Act and the rules, regulations and requirements adopted thereunder by the SEC, the NYSE and/or any other national securities exchange on which the Company's equity securities may be listed.
119
2015 Equity Plan Awards—Special IPO Transaction Bonus Grant
In connection with the consummation of this offering, the Company intends to make a special one-time bonus grant of up to Options under the IPO Bonus Pool of the 2015 Equity Plan to certain members of its senior management team (including the named executive officers) in order to reward them for historical performance through the consummation of this offering and allow them to further benefit from successful outcomes for the Sponsors (the "IPO Bonus Options"). This grant is expected to be in addition to the ongoing equity incentive program that the Company plans to employ to incentivize and retain its senior management team and additional executives. Each of Messrs. Bird, Corsa and Nystrom will be granted IPO Bonus Options to purchase , and Shares, respectively. The IPO Bonus Options shall be granted with a 7 year term and an exercise price equal to the initial offering price per Share in this offering and shall be issued from the IPO Bonus Pool. Each of the IPO Bonus awards shall be subject to achievement of a market-based vesting condition based on the achievement of specified closing Share price targets for a period of at least 20 consecutive trading days, disregarding the six-month period immediately following the date of grant, subject to the executive's continued employment with the Company through the applicable vesting date (except as noted below in the case of Mr. Bird) (the "Market-Based Condition"). The IPO Bonus Options shall be (i) 25% vested upon attainment of a 20 consecutive trading day closing share price of at least $ per Share, (ii) 50% vested upon attainment of a 20 consecutive trading day closing share price of at least $ per Share, (iii) 75% vested upon attainment of a 20 consecutive trading day closing share price of at least $ per Share, and (iv) 100% vested upon attainment of a 20 consecutive trading day closing share price of at least $ per Share. Mr. Bird's IPO Bonus Option also provides that if he experiences a termination without "cause" or he resigns for "good reason" (as such terms are defined in the CEO Agreement) (a "Severance Event"), then his unvested IPO Bonus Options shall remain outstanding and eligible to vest based upon attainment of the Market-Based Condition for a period of six months following his termination of service.
If either of Messrs. Corsa or Nystrom experiences a termination of service without "cause" (as defined in the IPO Bonus Options) other than due to death or disability, the vested portion of such executive's IPO Bonus Options shall expire 90 days following such termination or, if earlier, the seventh anniversary of the date of grant. If either of Messrs. Corsa or Nystrom experiences a termination of service due to death or disability, the vested portion of such executive's IPO Bonus Options shall expire on the first day that is one year after the date of such executive's termination of service, or, if earlier, the seventh anniversary of the date of grant. If Mr. Bird experiences a termination of service due to death, disability, or a Severance Event, the vested portion of his IPO Bonus Options shall expire on the seventh anniversary of the date of grant. If any of Messrs. Bird, Corsa, or Nystrom experiences a termination for cause, then such executive's IPO Bonus Options shall be forfeited immediately upon the effective date of such termination for cause.
We expect the non-cash stock-based compensation expense associated with the one-time grant of the IPO Bonus Options under the IPO Bonus Pool to senior executives (including the named executive officers) in connection with the consummation of this offering to be between approximately $14 million and $18 million, which will be incremental to our ongoing stock-based compensation expense. This stock-based compensation expense will be finalized upon the pricing of this offering and is expected to be expensed over the first eight fiscal quarters following the closing of this offering or a shorter period based on realized stock prices during potential follow-on offerings, which could accelerate the expense recognition.
120
The following table sets forth information regarding the beneficial ownership of our common stock as of , 2015, and as adjusted to reflect the sale of the shares of common stock offered in this offering for:
- •
- each person or entity who is known by us to beneficially own more than 5% of our common stock;
- •
- each of our directors and named executive officers; and
- •
- all of our directors and executive officers as a group.
Information with respect to beneficial ownership has been furnished to us by each director, executive officer or stockholder listed in the table below, as the case may be. The amounts and percentages of our common stock beneficially owned are reported on the basis of rules of the SEC governing the determination of beneficial ownership of securities. Under these rules, a person is deemed to be a "beneficial owner" of a security if that person has or shares "voting power," which includes the power to vote or direct the voting of such security, or "investment power," which includes the power to dispose of or to direct the disposition of such security. A person is also deemed to be a beneficial owner of any securities of which that person has a right to acquire beneficial ownership within 60 days after , 2015, including any shares of our common stock subject to an option that is exercisable within 60 days after , 2015. More than one person may be deemed to be a beneficial owner of the same securities.
Percentage of beneficial ownership prior to this offering is based on shares of common stock outstanding as of , 2015. Percentage of beneficial ownership after this offering is based on shares of common stock outstanding (assuming no exercise of the underwriters' option to purchase additional shares), or shares of common stock outstanding (assuming full exercise of the underwriters' option to purchase additional shares), in each case, after giving effect to the sale by us of the shares of common stock offered hereby. For a discussion of our stock split, see "Prospectus Summary—The Offering" and "Description of Capital Stock."
Unless otherwise indicated below, to our knowledge, all persons listed below have sole voting and investment power with respect to their shares of common stock, except to the extent authority is shared by spouses under applicable law. Unless otherwise indicated below, the address for each person or entity listed below is c/o At Home Group Inc., 1600 East Plano Parkway, Plano, Texas 75074.
Name of Beneficial Owner
|
Number of Shares Beneficially Owned |
Percentage of Shares Beneficially Owned Before this Offering |
Percentage of Shares Beneficially Owned After this Offering |
Percentage of Shares Beneficially Owned After this Offering Assuming Full Exercise of Underwriters' Option to Purchase Additional Shares |
|||||||||
|---|---|---|---|---|---|---|---|---|---|---|---|---|---|
5% Stockholders |
|||||||||||||
AEA(1)(2) |
% | % | % | ||||||||||
Starr Investments(1)(3) |
|||||||||||||
Directors and Named Executive Officers |
|||||||||||||
Lewis L. Bird III |
|||||||||||||
Judd T. Nystrom |
|||||||||||||
Peter S.G. Corsa |
|||||||||||||
Martin C. Eltrich, III(4) |
|||||||||||||
Brian R. Hoesterey(5) |
|||||||||||||
121
Name of Beneficial Owner
|
Number of Shares Beneficially Owned |
Percentage of Shares Beneficially Owned Before this Offering |
Percentage of Shares Beneficially Owned After this Offering |
Percentage of Shares Beneficially Owned After this Offering Assuming Full Exercise of Underwriters' Option to Purchase Additional Shares |
|||||||||
|---|---|---|---|---|---|---|---|---|---|---|---|---|---|
Geoffrey G. Clark(6) |
|||||||||||||
Allen I. Questrom |
|||||||||||||
Wendy A. Beck |
|||||||||||||
Larry D. Stone |
|||||||||||||
Philip L. Francis |
|||||||||||||
All executive officers and directors as a group (15 persons) |
|||||||||||||
- *
- Represents
beneficial ownership of less than 1% of our outstanding common stock.
- (1)
- Excludes
shares of common stock owned by other parties to the Stockholders Agreement by which they may be deemed to share beneficial ownership.
- (2)
- Represents investment vehicles managed by AEA Investors LP or AEA Management (Cayman) Ltd. John L. Garcia, the Chairman and Chief Executive Officer of AEA, may be deemed to have voting power and dispositive power with respect to shares of our common stock that are beneficially owned by AEA, but Mr. Garcia disclaims beneficial ownership of such shares.
The address for AEA Investors LP is 666 Fifth Avenue, 36 Floor, New York, NY 10103. The address for AEA Management (Cayman) Ltd. is P.O. Box 309, Ugland House, Grand Cayman KY1-1104, Cayman Islands.
- (3)
- Represents
investment vehicles managed by Starr Investments. The address for Starr Investments is 399 Park Ave, 17th Floor, New York, NY 10022.
Geoffrey Clark, the Senior Managing Director of Starr Investments, may be deemed to have voting power and dispositive power with respect to shares of our common stock that are beneficially owned by
Starr Investments, but Mr. Clark disclaims beneficial ownership of such shares.
- (4)
- Mr. Eltrich
serves on our board of directors as a representative of AEA. Mr. Eltrich is a Partner of AEA. Mr. Eltrich disclaims
beneficial ownership of the shares of common stock owned by investment vehicles managed by AEA Investors LP and AEA Management (Cayman) Ltd., except to the extent of his pecuniary
interests therein.
- (5)
- Mr. Hoesterey
serves on our board of directors as a representative of AEA. Mr. Hoesterey is a Partner of AEA. Mr. Hoesterey disclaims
beneficial ownership of the shares of common stock owned by investment vehicles managed by AEA Investors LP and AEA Management (Cayman) Ltd., except to the extent of his pecuniary
interests therein.
- (6)
- Mr. Clark serves on our board of directors as a representative of Starr Investments. Mr. Clark is Senior Managing Director of Starr Investment Holdings and a Director of C.V. Starr & Co. Mr. Clark disclaims beneficial ownership of the shares of common stock owned by investment vehicles managed by Starr Investments, except to the extent of his pecuniary interests therein.
122
CERTAIN RELATIONSHIPS AND RELATED PARTY TRANSACTIONS
The following is a description of transactions since January 29, 2012 to which we were a party in which the amount involved exceeded or will exceed $120,000, and in which any of our executive officers, directors or holders of more than 5% of any class of our voting securities, or an affiliate or immediate family member thereof, had or will have a direct or indirect material interest. We believe the terms obtained or consideration that we paid or received, as applicable, in connection with the transactions described below were comparable to terms available or amounts that would be paid or received, as applicable, in arms'-length transactions with parties unrelated to us.
Sponsors
We have entered into a management agreement with AEA and Starr Investments relating to the provision of their advisory and consulting services. The agreement requires us to pay the service providers an annual management fee of approximately $3.5 million per year. The annual management fee is payable in quarterly installments of approximately $875,000, in advance, on the first day of each calendar quarter. The management agreement also requires us to reimburse the service providers for their reasonable out-of-pocket costs and expenses incurred in connection with their provision of ongoing advisory and consulting services, monitoring their investment in us and developing, negotiating, performing or enforcing any agreements or documents relating to their investment in us. The cost reimbursement is typically billed in arrears during the month following the end of each quarter. For the fiscal year ended January 31, 2015, approximately $100,000 in cost reimbursement fees have been billed to us. We recognized approximately $3.6 million and $3.7 million of expenses related to annual management fees and reimbursed expenses during the fiscal years ended January 31, 2015 and January 25, 2014, respectively. We believe that the management agreement and the services mentioned above are or were on terms at least as favorable to us as we would expect to negotiate with unrelated third parties. Immediately following this offering, the service providers management agreement will be terminated.
Pursuant to the management agreement, we agreed to indemnify the service providers against any claims or liabilities relating to or arising out of actions taken by the service providers under the terms of the management agreement or the operation of our business, except for claims or liabilities that are shown to have resulted from actions taken by the service providers in bad faith, or due to the service providers gross negligence or willful misconduct. This indemnification provision will survive termination of the management agreement.
Affiliates of AEA own a significant equity position in Dematic Corporation, an external vendor that designs, develops and delivers solutions that optimize a company's supply chain, improve performance and increase productivity through intelligent warehouse logistics and materials handling solutions. In February 2014, we executed an agreement with Dematic Corporation for the installation of a system to assist in the automation of our distribution center. During the fiscal year ended January 31, 2015, we paid Dematic Corporation approximately $7.2 million under the agreement which is primarily recorded in property and equipment, net in the accompanying consolidated balance sheet as of January 31, 2015.
Starr Indemnity & Liability Company, a related party to Starr Investments, was an underwriter for our general liability and workers' compensation insurance policies that were effective December 1, 2013. The total cost of the policies was approximately $2.3 million, of which approximately $1.9 million and $0.4 million was paid during the fiscal years ended January 31, 2015 and January 25, 2014, respectively. These policies expired on December 1, 2014 and were replaced with policies underwritten by an unrelated party.
123
Management Equity Participation
Following the completion of this offering, members of our current management team will hold approximately % of our common stock (or % if the underwriters exercise their option to purchase additional shares in full). See "Principal Stockholders."
Board of Directors
Our board of directors consists of eight members, which includes two members (Messrs. Eltrich and Hoesterey), who are representatives of AEA and one member (Mr. Clark), who is a representative of Starr Investments.
Stockholders' Agreement
In connection with this offering, we and certain funds affiliated with the Sponsors will enter into a stockholders' agreement. The stockholders' agreement will contain, among other things, certain restrictions on the ability of such Sponsors to freely transfer shares of our stock. In addition, following the consummation of this offering, and for so long as certain affiliates of AEA and Starr Investments hold an aggregate of at least 10% of our outstanding common stock, such Sponsor shall be entitled to nominate at least one individual for election to our board, and our board and nominating committee thereof shall nominate and recommend to our stockholders that such individual be elected to our board, and each party to the stockholders' agreement agrees to vote all of their shares to elect such individual to our board. The stockholders agreement also provides that, for a period of two years following this offering, Starr Investments will agree to vote 75,000 of their shares of our common stock on all matters presented to the stockholders in the same manner that AEA votes on such matters.
Registration Rights Agreement
The parties to the stockholders' agreement described above will also enter into a registration rights agreement prior to the completion of this offering. Pursuant to the registration rights agreement, upon the closing of this offering and subject to the terms of the lock-up agreement they have entered into with the representatives of the underwriters, holders of a total of shares of our common stock as of August 1, 2015, will have the right to require us to register these shares under the Securities Act under specified circumstances and will have incidental registration rights as described below. After registration pursuant to these rights, these shares will become freely tradable without restriction under the Securities Act.
Demand Registration Rights
Subject to certain restrictions, at any time after 180 days following the effective date of the registration statement of which this prospectus forms a part, or 120 days following the effective date of any subsequent registration statement that we file (other than registration statements on Forms S-4 or S-8), the Sponsors may request that we register all or a portion of their common stock for sale under the Securities Act. We will effect the registration as requested in writing by the Sponsors, unless in the good faith judgment of our board of directors, such registration would materially and adversely interfere with certain transactions involving the company and should be delayed. We are not obligated to file a registration statement pursuant to these demand provisions on more than ten occasions on Form S-1; however, the Sponsors are entitled to make an unlimited number of demands for registration on Form S-3 if and when we become eligible to use such form.
Piggyback Registration Rights
In addition, if at any time we register any shares of our common stock (other than pursuant to registrations on Form S-4 or Form S-8), the holders of all shares having registration rights are entitled to prior notice of the registration and to include all or a portion of their common stock in the registration.
124
In the event that any registration in which the holders of registrable shares participate pursuant to the registration rights agreement is an underwritten public offering, the number of registrable shares to be included may, in specified circumstances, be limited.
Other Provisions
We will pay all registration and offering expenses, and the reasonable fees and expenses of a single special counsel for each of the parties making a demand and a single special counsel for all other selling stockholders, related to any demand or piggyback registration. The registration rights agreement contains customary cross-indemnification provisions, pursuant to which we are obligated to indemnify any selling stockholders in the event of material misstatements or omissions in the registration statement attributable to us, and they are obligated to indemnify us for material misstatements or omissions in the registration statement attributable to them. A particular stockholder's shares shall no longer be considered registrable shares, to which demand and piggyback registration rights apply, when such shares have been disposed of under an effective registration statement or sold under Rule 144 of the Securities Act.
Other Relationships and Transactions
Merry Mabbett Inc. ("MMI") is owned by Merry Mabbett Dean, who is the mother of Lewis L. Bird III, our Chief Executive Officer. During fiscal year 2014 and fiscal year 2015, Ms. Dean, through MMI, provided certain design services to us, including design for our home office, as well as design in stores. In addition, through MMI, we purchased certain fixtures, furniture and equipment that are now owned and used by us in our home office, new store offices or in the product vignettes in the stores.
We spent approximately $419,000 in fiscal year 2015 with MMI, of which $3,400 or 0.81% was for services provided by Ms. Dean, and approximately $696,000 in fiscal year 2014, of which $1,900 or 0.27% was for services provided by Ms. Dean.
Policies and Procedures for Related Person Transactions
Prior to the completion of this offering, we expect that our board of directors will adopt a policy providing that the audit committee will review and approve or ratify transactions in excess of $120,000 of value in which we participate and in which a director, executive officer or beneficial holder of more than 5% of any class of our voting securities has or will have a direct or indirect material interest. Under this policy, the board of directors is to obtain all information it believes to be relevant to a review and approval or ratification of these transactions. After consideration of the relevant information, the audit committee is to approve only those related party transactions that the audit committee believes are on their terms, taken as a whole, no less favorable to us than could be obtained in an arms'-length transaction with an unrelated third party and that the audit committee determines are not inconsistent with the best interests of the Company. In particular, our policy with respect to related person transactions will require our audit committee to consider the benefits to the company, the impact on a director's independence in the event the related person is a director, an immediate family member of a director or an entity in which a director has a position or relationship, the availability of other sources for comparable products or services, the terms of the transaction and the terms available to unrelated third parties or to employees generally. A "related person" is any person who is or was one of our executive officers, directors or director nominees or is a holder of more than 5% of our common stock, or their immediate family members or any entity owned or controlled by any of the foregoing persons. All of the transactions described above were entered into prior to the adoption of this policy.
125
General
Upon the completion of this offering, our authorized capital stock will consist of shares of common stock, par value $0.01 per share, and shares of preferred stock, par value $ per share. Upon the completion of this offering, there will be outstanding shares of common stock (excluding shares of our common stock issuable upon exercise of outstanding stock options) and no outstanding shares of preferred stock. As of , 2015, we had stockholders of record.
In connection with this offering, we will amend and restate our certificate of incorporation and bylaws. The following descriptions of our capital stock, amended and restated certificate of incorporation and amended and restated bylaws are intended as summaries only and are qualified in their entirety by reference to our amended and restated certificate of incorporation and amended and restated bylaws, which will become effective upon the completion of this offering and which are filed as exhibits to the registration statement, of which this prospectus forms a part, and to the applicable provisions of the DGCL.
Common Stock
The holders of our common stock are entitled to the following rights, preferences and privileges:
- •
- Voting Rights. Each share of common stock entitles the holder to one vote with respect to each matter presented to our stockholders on which the holders of common stock are entitled to vote. Subject to any rights that may be applicable to any then outstanding preferred stock, our common stock votes as a single class on all matters relating to the election and removal of directors on our board of directors and as provided by law, except as provided in the stockholders' agreement. Holders of our common stock will not have cumulative voting rights. Except in respect of matters relating to the election of directors on our board of directors and as otherwise provided in our certificate of incorporation, stockholders' agreement or required by law, all matters to be voted on by our stockholders must be approved by a majority of the shares present in person or by proxy at the meeting and entitled to vote on the subject matter. In the case of election of directors, any election must be approved by a plurality of the votes cast by the stockholders present in person or represented by proxy at the meeting and entitled to vote on the election.
- •
- Dividend Rights. Subject to preferences that may be applicable to any then-outstanding shares of our preferred stock (if any), the holders of our outstanding shares of common stock are entitled to receive dividends to be paid ratably, if any, as may be declared from time to time by our board of directors (in its sole discretion) out of legally available funds. It is our present intention not to pay cash dividends on our common stock for the foreseeable future. We are a holding company and substantially all of our operations are carried out by our operating subsidiaries. Our operating subsidiaries' ability to pay dividends to us is limited by the terms of the ABL
Pursuant to the stockholders' agreement, for a period of two years following this offering, Starr Investments will agree to vote 75,000 of their shares of our common stock on all matters presented to the stockholders in the same manner that AEA votes on such matters. In particular, following the consummation of this offering, and for so long as certain affiliates of AEA and Starr Investments hold an aggregate of at least 10% of our outstanding common stock, such Sponsors shall be entitled to nominate at least one individual for election to our board, and our board and nominating committee thereof shall nominate and recommend to our stockholders that such individual be elected to our board, and each party to the stockholders' agreement agrees to vote all of their shares to elect such individual to our board.
126
- •
- Liquidation Rights. In the event of any voluntary or
involuntary liquidation, dissolution or winding up of our affairs, holders of our common stock would be entitled to receive ratably, in proportion to the number of shares held by them, in our assets
that are legally available for distribution to our common stockholders after payment of our debts and other liabilities. If we have any preferred stock outstanding at such time, holders of the
preferred stock may be entitled to distribution or liquidation preferences. In either such case, we must pay the applicable distribution to the holders of our preferred stock before we may pay
distributions to the holders of our common stock.
- •
- Other Rights. Other than as provided in the stockholders' agreement and registration rights agreement, our stockholders have no preemptive or other rights to subscribe for additional shares. The shares of our outstanding common stock are not subject to further calls or assessments by us. There are no conversion or redemption rights or sinking fund provisions applicable to the shares of our common stock. The rights, preferences and privileges of the holders of our common stock are subject to, and may be adversely affected by, the rights of the holders of shares of any series of our preferred stock that we may designate and issue in the future.
Facility and Term Loan Facilities, which in turn may limit our ability to pay dividends on our common stock. See "Dividend Policy."
Following the consummation of this offering, we expect that the Sponsors will continue to control a majority of the voting power of our outstanding common stock.
Preferred Stock
Our preferred stock, if issued, may have priority over our common stock with respect to dividends and other distributions, including the distribution of our assets upon liquidation. To the extent permitted by law, our board of directors will have the authority, without further stockholder authorization, to issue from time to time shares of authorized preferred stock in one or more series and to fix the terms, powers (including voting powers), rights and preferences, variations and the restrictions and limitations thereof of each series. Although we have no present plans to issue any shares of preferred stock, the issuance of shares of preferred stock, or the issuance of rights to purchase such shares, could adversely affect the rights and powers, including voting rights, of the common stock, and could have the effect of delaying, deterring or preventing a change in control of us or an unsolicited acquisition proposal.
Limitations on Directors' Liability
Our amended and restated certificate of incorporation and amended and restated bylaws will contain provisions indemnifying our directors and officers to the fullest extent permitted by law. Prior to the completion of this offering, we intend to enter into indemnification agreements with each of our directors which may, in certain cases, be broader than the specific indemnification provisions provided for under Delaware law.
In addition, to the fullest extent permitted by Delaware law, our amended and restated certificate of incorporation will provide that no director will be personally liable to us or our stockholders for monetary damages for breach of fiduciary duty as a director. The effect of this provision is to restrict our rights and the rights of our stockholders in derivative suits to recover monetary damages from a director for breach of fiduciary duty as a director, except that a director will be personally liable for:
- •
- any breach of his or her duty of loyalty to us or our stockholders;
- •
- acts or omissions not in good faith which involve intentional misconduct or a knowing violation of law;
127
- •
- the payment of dividends or the redemption or purchase of stock in violation of the DGCL; or
- •
- any transaction from which the director derived an improper personal benefit.
This provision does not affect a director's liability under the federal securities laws.
To the extent that our directors, officers and controlling persons are indemnified under the provisions of our amended and restated certificate of incorporation, the DGCL or contractual arrangements against liabilities arising under the Securities Act, we have been advised that in the opinion of the SEC, such indemnification is against public policy as expressed in the Securities Act and is therefore unenforceable.
Provisions of Our Amended and Restated Certificate of Incorporation, Amended and Restated Bylaws and Delaware Law that May Have an Anti-Takeover Effect
The DGCL contains, and upon the completion of this offering our amended and restated certificate of incorporation and our amended and restated bylaws will contain, provisions that could have the effect of delaying, deferring or discouraging another party from acquiring control of us. These provisions, which are summarized below, are expected to discourage coercive takeover practices and inadequate takeover bids. These provisions are also designed to encourage persons seeking to acquire control of us to first negotiate with our board of directors.
Staggered Board; Removal of Directors
Our amended and restated certificate of incorporation and our amended and restated bylaws will divide our board of directors into three classes with staggered three-year terms. In addition, a director will be subject to removal by our stockholders only for cause if AEA ceases to own, or have the right to direct the vote of, 50% or more of the voting power of our common stock. Any vacancy on our board of directors, including a vacancy resulting from an increase in the number of directors, may only be filled by vote of a majority of our directors then in office (subject to the rights of holders of any series of preferred stock or rights granted pursuant to the stockholders' agreement). Furthermore, our amended and restated certificate of incorporation will provide that the total number of directors may be changed only by the resolution of our board of directors (subject to the rights of holders of any series of preferred stock to elect additional directors). The classification of our board of directors and the limitations on the removal of directors, changes to the total numbers of directors and filling of vacancies could make it more difficult for a third party to acquire, or discourage a third party from seeking to acquire, control of our Company.
Stockholder Action by Written Consent; Special Meetings
Our amended and restated certificate of incorporation will provide that any action required or permitted to be taken by our stockholders must be effected at a duly called annual or special meeting of the stockholders and may not be effected by written consent if AEA ceases to own, or have the right to direct the vote of, 50% or more of the voting power of our common stock. Our amended and restated certificate of incorporation and our amended and restated bylaws will also provide that, except as otherwise required by law, special meetings of our stockholders can be called only by our chairman of the board or our board of directors if AEA, ceases to own, or have the right to direct the vote of, 50% or more of the voting power of our common stock.
Advance Notice Requirements for Stockholder Proposals
Our amended and restated bylaws will establish an advance notice procedure for stockholder proposals to be brought before an annual meeting of stockholders, including proposed nominations of persons for election to our board of directors. Stockholders at an annual meeting may only consider proposals or nominations specified in the notice of meeting or brought before the meeting by or at the
128
direction of our board of directors or by a stockholder of record who is entitled to vote at the meeting and who has delivered timely written notice in proper form to our secretary of the stockholder's intention to bring such business before the meeting. These provisions could have the effect of delaying stockholder actions that are favored by the holders of a majority of our outstanding voting securities until the next stockholder meeting.
Section 203 of the Delaware General Corporation Law
In our amended and restated certificate of incorporation, we will have opted out of Section 203 of the DGCL, as permitted under and pursuant to subsection (b)(3) of Section 203; however, our amended and restated certificate of incorporation will contain similar provisions providing that we may not engage in certain "business combinations" with any "interested stockholder" for a three-year period following the time that the stockholder became an interested stockholder, unless:
- •
- prior to such time, our board of directors approved either the business combination or the transaction that resulted in
the stockholder becoming an interested stockholder;
- •
- upon consummation of the transaction that resulted in the stockholder becoming an interested stockholder, the interested
stockholder owned at least 85% of our voting stock outstanding at the time the transaction commenced, excluding certain shares; or
- •
- at or subsequent to that time, the business combination is approved by our board of directors and by the affirmative vote of holders of at least two-thirds of our outstanding voting stock that is not owned by the interested stockholder.
Generally, a "business combination" includes a merger, asset or stock sale or other transaction provided for or through our Company resulting in a financial benefit to the interested stockholder. Subject to certain exceptions, an "interested stockholder" is a person who owns 15% or more of our outstanding voting stock and the affiliates and associates of such person. For purposes of this provision, "voting stock" means any class or series of stock entitled to vote generally in the election of directors.
Under certain circumstances, this provision will make it more difficult for a person who qualifies as an "interested stockholder" to effect certain business combinations with our Company for a three-year period. This provision may encourage companies interested in acquiring us to negotiate in advance with our board of directors in order to avoid the stockholder approval requirement if our board of directors approves either the business combination or the transaction that results in the stockholder becoming an interested stockholder. These provisions also may have the effect of preventing changes in our board of directors and may make it more difficult to accomplish transactions that our stockholders may otherwise deem to be in their best interests.
Our amended and restated certificate of incorporation will provide that certain affiliates of AEA and Starr Investments, and their respective affiliates, and any of their respective direct or indirect designated transferees (other than in certain market transfers and gifts) and any group of which such persons are a party do not constitute "interested stockholders" for purposes of this provision.
Amendments to Our Bylaws
The DGCL provides generally that the affirmative vote of a majority of the shares presents at any meeting and entitled to vote on a matter is required to amend a corporation's bylaws, unless a corporation's bylaws requires a greater percentage. Effective upon the completion of this offering, our amended and restated bylaws may be amended or repealed by the affirmative vote of the holders of at least two-thirds of the voting power of all outstanding stock entitled to vote thereon, voting together as a single class, if AEA ceases to own, or have the right to direct the vote of, 50% or more of the voting power of our common stock.
129
Exclusive Jurisdiction for Certain Actions
Our amended and restated certificate of incorporation will require, to the fullest extent permitted by law, that derivative actions brought in the name of the Company, actions against directors, officers or employees for breach of a fiduciary duty and other similar actions, may be brought only in specified courts in the State of Delaware. Although we believe this provision will benefit us by providing increased consistency in the application of Delaware law in the types of claims to which it applies, the provision may have the effect of discouraging lawsuits against our directors and officers. See "Risk Factors—Risks Related to our Common Stock and this Offering—Our amended and restated certificate of incorporation will designate the Court of Chancery of the State of Delaware as the exclusive forum for certain litigation that may be initiated by our stockholders, which could limit our stockholders' ability to obtain a favorable judicial forum for disputes with us."
Stock Exchange Listing
We have applied to list our common stock on the NYSE under the symbol "HOME".
Transfer Agent and Registrar
The transfer agent and registrar for our common stock is American Stock Transfer & Trust Company, LLC.
130
DESCRIPTION OF CERTAIN INDEBTEDNESS
On October 5, 2011, we entered into a senior secured asset based revolving credit facility (the "ABL Facility"). On June 5, 2015, we entered into a senior secured first lien term loan facility (the "First Lien Facility"), and a senior secured second lien term loan facility (the "Second Lien Facility" and, together with the First Lien Facility, the "Term Loan Facilities"). The proceeds of the Term Loan Facilities were used to finance the redemption in full of our 10.75% Senior Secured Notes due June 1, 2019, including accrued and unpaid interest and premium thereon and fees and expenses in connection therewith and for general corporate purposes. Borrowings under the ABL Facility are used to finance or refinance our working capital and capital expenditures and for general corporate purposes.
We intend to use the proceeds of this offering to repay approximately $ million of indebtedness under the Second Lien Facility. See "Use of Proceeds."
ABL Facility
General
At Home Holding III Inc. (formerly known as GRD Holding III Corporation) ("At Home III") and At Home Stores LLC (as successor in interest to Garden Ridge, L.P.), an indirect wholly-owned subsidiary of At Home III ("At Home LLC", together with At Home III, collectively, the "ABL Borrowers") are party to the ABL Facility as co-borrowers, pursuant to a Credit Agreement (as amended by the First Amendment to Credit Agreement dated as of May 9, 2012, as further amended by the Second Amendment to Credit Agreement dated as of May 23, 2013, as further amended by the Third Amendment to Credit Agreement dated as of July 28, 2014 (the "Third Amendment"), as further amended by the Assumption and Ratification Agreement dated as of September 29, 2014, and as further amended by the Fourth Amendment to Credit Agreement dated as of June 5, 2015 (the "Fourth Amendment"), the "ABL Credit Agreement"), with At Home Holding II Inc. (formerly known as GRD Holding II Corporation) ("At Home II") as parent guarantor, certain of At Home II's indirect wholly-owned domestic subsidiaries as subsidiary guarantors, the lenders party thereto and Bank of America, N.A., as administrative agent and collateral agent (in such capacities, the "ABL Agent"). The ABL Facility is scheduled to mature on July 28, 2019. There is no scheduled amortization under the ABL Facility.
The ABL Facility provides for revolving borrowings of up to $140.0 million subject to borrowing base availability. The borrowing base is equal to the sum (subject to certain reserves and adjustments) of (i) 90% of eligible credit card receivables, (ii) 90% (increased to 92.5% during the period beginning August 15 and ending on November 30 of each year) of the appraised orderly liquidation value of eligible inventory, and (iii) at any time other than during cash dominion, the lesser of (x) 100% of the aggregate amount of borrowing base eligible cash and (y) $20.0 million. Subject to the borrowing base availability, the ABL Facility also includes a letter of credit facility of up to $10.0 million and a swing line facility for same-day borrowings of up to $10.0 million. Borrowings under the ABL Facility are subject to the satisfaction of customary conditions, including absence of default and accuracy of representations and warranties. We may increase the ABL Facility by up to $75.0 million, with notice to the administrative agent, subject to customary conditions.
As of August 1, 2015, we had $70.3 million in borrowings outstanding under the ABL Credit Agreement.
Interest
Borrowings under the ABL Facility bear interest at a rate per annum equal to, at our option, either (a) adjusted LIBOR plus the applicable rate or (b) base rate (determined by reference to the greatest of the prime rate published by Bank of America, N.A., the federal funds effective rate plus 0.5% and one-month LIBOR plus 1%) plus the applicable rate. The applicable rates under the ABL
131
Facility are subject to step-ups and step-downs based on the ABL Borrowers' average daily availability as a percentage of the line cap (i.e., aggregate commitments under the ABL Facility) for the immediately preceding fiscal quarter in accordance with the following schedule:
Pricing Level |
Average Daily Availability | Eurodollar Rate and Letters of Credit |
Base Rate | ||||||
|---|---|---|---|---|---|---|---|---|---|
I |
Less than or equal to $35.0 million | 1.75 | % | 0.75 | % | ||||
II |
Greater than $35.0 million but less than or equal to $80.0 million | 1.50 | % | 0.50 | % | ||||
III |
Greater than $80.0 million | 1.25 | % | 0.25 | % | ||||
Optional and Mandatory Prepayments; Cash Dominion
At our option, the ABL Facility may be prepaid at any time without a premium or penalty with notice to the administrative agent. We may also terminate and/or permanently reduce the unused commitments under the ABL Facility, with notice to the administrative agent. Such termination or reduction must be in a minimum aggregate amount of $2.0 million or in whole multiples of $1.0 million in excess thereof. In addition, we are not permitted to terminate or reduce the commitments if such termination or reduction (and any concurrent prepayments) would cause the total outstanding amount to exceed the amount of the ABL Facility. To the extent the borrowings under the ABL Facility at any time exceed the borrowing base at such time, we are required to prepay the borrowings under the ABL Facility in the amount of such excess.
We will be required to sweep substantially all cash receipts from the sale of inventory, collection of receivables and dispositions of the ABL Priority Collateral (defined below) into certain concentration accounts under the dominion and control of the administrative agent under the ABL Facility and all such cash will be used to repay outstanding borrowings under the ABL Facility (i) during the existence of an event of default, (ii) when we fail to maintain excess availability of at least the greater of $10.0 million and 12.5% of the line cap for five consecutive days, or (iii) when we fail to maintain excess availability of at least $7.5 million at any time.
Guarantee and Collateral
Obligations in respect of the ABL Facility are guaranteed by At Home II, and each of our material existing, newly acquired or created wholly-owned domestic restricted subsidiaries. Obligations under the ABL Credit Agreement, as well as obligations to the ABL Facility lenders and their affiliates under certain secured cash management agreements and secured hedge agreements, are secured by a first priority lien on the ABL Borrowers' and the guarantors' accounts receivable, inventory, deposit accounts, cash and cash equivalents, tax refunds and related tax payments, chattel paper, documents, instruments, general intangibles, securities accounts, and books, records, proceeds and supporting obligations relating to the foregoing (collectively, the "ABL Priority Collateral"), and a third priority lien on the ABL Borrowers' and the guarantors' and their wholly-owned subsidiaries' capital stock (which will be limited, in the case of any foreign subsidiaries, to 65% of the voting stock and 100% of the non-voting stock of any first-tier foreign subsidiaries), and the ABL Borrowers' and the guarantors' intercompany debt and all other assets other than the ABL Priority Collateral (collectively, the "Term Loan Priority Collateral"), as further detailed in (i) the ABL Security Agreement, dated October 5, 2011 (as amended by the Third Amendment and the Fourth Amendment) between the grantors and ABL Agent, (ii) the First Lien Security Agreement, dated June 5, 2015 between the grantors and the First Lien Agent (as defined below), (iii) the Second Lien Security Agreement, dated June 5, 2015 between the grantors and the Second Lien Agent (as defined below), (iv) the Intercreditor Agreement dated June 5, 2015 between At Home II, At Home III, the ABL Agent, the First Lien Agent, and the Second Lien Agent (the "ABL/Term Intercreditor Agreement"), and (v) the Intercreditor Agreement dated June 5, 2015 between At Home II, At Home III, the First Lien Agent and the Second Lien Agent (the "First Lien/Second Lien Intercreditor Agreement" and together with the ABL/Term
132
Intercreditor Agreement and ABL Security Agreement, First Lien Security Agreement and Second Lien Security Agreement, collectively, the "Collateral Agreements").
Covenants and Other Matters
The ABL Credit Agreement requires that we comply with a number of covenants, as well as certain financial tests. During the existence of an event of default or when we fail to maintain excess availability of at least the greater of $10.0 million and 10% of the line cap, the consolidated fixed charge coverage ratio of the most recently completed period of four consecutive quarters must be 1.00 to 1.00 or higher. The covenants also limit, in certain circumstances, our ability to take a variety of actions, including:
- •
- incur indebtedness;
- •
- create or maintain liens on property or assets;
- •
- make investments, loans and advances;
- •
- engage in acquisitions, mergers, consolidations and asset sales;
- •
- redeem debt;
- •
- pay dividends and distributions; and
- •
- enter into transactions with affiliates.
The ABL Borrowers' future compliance with its financial covenants under the ABL Credit Agreement will depend on its ability to maintain sufficient liquidity, generate earnings and manage its assets effectively. The ABL Credit Agreement also has various non-financial covenants, both requiring the ABL Borrowers and guarantors to refrain from taking certain future actions (as described above) and requiring each of the ABL Borrowers and guarantors to take certain actions, such as keeping in good standing its corporate existence, maintaining insurance, and providing the bank lending group with financial information on a timely basis. The ABL Credit Agreement also contains certain customary representations and warranties and events of default, including among other things payment defaults, breach of representations and warranties, covenant defaults, cross-defaults to certain indebtedness, certain events of bankruptcy, certain events under ERISA, material judgments, actual or asserted failure of any material guaranty or security document supporting the ABL Credit Agreement to be in force and effect, and change of control. If such an event of default occurs, the administrative agent under the ABL Credit Agreement would be entitled to take various actions, including the acceleration of amounts due under the ABL Facility and all actions permitted to be taken by a secured creditor.
Term Loan Facilities
General
At Home III entered into (i) the First Lien Facility, pursuant to a First Lien Credit Agreement (the "First Lien Credit Agreement"), with At Home II, the lenders party thereto, and Bank of America, N.A., as administrative agent and collateral agent (in such capacities, the "First Lien Agent"), dated June 5, 2015, and (ii) the Second Lien Facility, pursuant to a Second Lien Credit Agreement (the "Second Lien Credit Agreement" and, together with the First Lien Credit Agreement, the "Term Loan Credit Agreements"), with At Home II, the lenders party thereto, and Dynasty Financial II, LLC, as administrative agent and collateral agent (in such capacities, the "Second Lien Agent"), dated June 5, 2015.
The Term Loan Facilities provide for term loans of up to (i) $300.0 million under the First Lien Facility (the "First Lien Loan") and (ii) $130.0 million under the Second Lien Facility (the "Second Lien Loan" and together with the First Lien Loan, the "Term Loans"). The First Lien Loan
133
amortizes in nominal quarterly installments equal to 0.25% of the original aggregate principal amount of the First Lien Loan and matures on June 3, 2022. The Second Lien Loan has no amortization and matures on June 5, 2023. The Term Loan Facilities also permit us to add one or more incremental term loans up to $50.0 million (shared between the First Lien Facility and the Second Lien Facility) plus additional amounts subject to our compliance with, with respect to the First Lien Facility, a first lien net leverage ratio test, and, with respect to the Second Lien Facility, a secured net leverage ratio test.
As of August 1, 2015, we had $299.3 million outstanding under the First Lien Facility and $130.0 million outstanding under the Second Lien Facility.
Interest
Term Loans bear interest at a rate per annum equal to, at our option, either (a) adjusted LIBOR plus the applicable rate or (b) base rate (determined by reference to the greatest of the prime rate published by Bank of America, N.A., the federal funds effective rate plus 0.5% and one-month LIBOR plus 1%) plus the applicable rate. Until the occurrence of a qualifying initial public offering, the applicable rates under the First Lien Facility are 4.00% for LIBOR loans and 3.00% for base rate loans. After the occurrence of a qualifying IPO, the applicable rates under the First Lien Facility are subject to step-ups and step-downs based on secured net leverage ratio levels in accordance with the following schedule:
Pricing Level
|
Secured Net Leverage Ratio | Eurodollar Rate |
Base Rate | ||||||
|---|---|---|---|---|---|---|---|---|---|
I |
Greater than 3.50:1.00 | 4.00 | % | 3.00 | % | ||||
II |
Less than or equal to 3:50:1.00 | 3.50 | % | 2.50 | % | ||||
The applicable rates under the Second Lien Facility are 8.00% for LIBOR loans and 7.00% for base rate loans.
Optional and Mandatory Prepayments
At our option, the First Lien Loan may be prepaid at any time, in whole or in part, with notice to the First Lien Agent; provided however, any prepayment in connection with a repricing transaction made on or prior to June 5, 2016 shall be subject to a prepayment premium equal to the principal amount of the First Lien Loan subject to such prepayment multiplied by 1%. Any prepayment of all or any portion of the outstanding First Lien on or after June 5, 2016 shall not be subject to a premium.
At our option, the Second Lien Loan may be prepaid at any time (but subject to the restrictions contained in the First Lien/Second Lien Intercreditor Agreement), in whole or in part, with notice to the Second Lien Agent; provided however, any voluntary prepayment made on or prior to June 5, 2017 shall be subject to a prepayment premium equal to the principal amount of the Second Lien Loan subject to such prepayment multiplied by 1%. In addition, on and after June 5, 2017, any prepayment or repayment of the Second Lien Loan for whatever reason (whether optional, mandatory, at maturity or otherwise), in whole or in part, shall be made together with payment of an exit fee which increases over time from an amount equal to 4.50% of the amount of the Second Lien Loan being so prepaid or repaid in the case of any prepayment or repayment occurring on or after June 5, 2017 but prior to June 5, 2018 to an amount equal to 12.00% of the amount of the Second Lien Loan being so prepaid or repaid in the case of any prepayment or repayment occurring on or after June 5, 2022.
In addition, subject to the satisfaction of certain conditions, we are permitted to offer our lenders to repurchase loans held by them under the Term Loan Facilities at a discount.
Under certain circumstances and subject to certain exceptions, the Term Loan Facilities will be subject to mandatory prepayments in the amount equal to: (x) 100% of the net proceeds of certain
134
assets sales and issuances or incurrence of non-permitted indebtedness and (y) 50% of annual excess cash flow for any fiscal year, such percentage to decrease to 0% depending on the attainment of certain total leverage ratio targets. In addition, the Second Lien Loans are subject to mandatory prepayment upon consummation of any qualifying IPO, in an amount equal to the aggregate net proceeds resulting from such qualifying IPO.
Guarantee and Collateral
Our obligations in respect of the Term Loan Facilities are guaranteed by At Home II and each of our material existing and newly acquired or created wholly-owned domestic restricted subsidiaries. Our obligations under the Term Loan Facilities are secured by a first priority lien on the Term Loan Priority Collateral, and a second priority lien on the ABL Priority Collateral, as further detailed in the Collateral Agreements. As between the First Lien Facility and the Second Lien Facility, liens securing the Second Lien Loan are junior and subordinated to the lien securing the First Lien Loan.
Covenants and Other Matters
The Term Loan Credit Agreements have various non-financial covenants, customary representations and warranties, events of defaults and remedies, substantially similar to those described in respect of the ABL Credit Agreement above. There are no financial maintenance covenants in the Term Loan Credit Agreements.
135
SHARES ELIGIBLE FOR FUTURE SALE
The sale of a substantial amount of our common stock in the public market after this offering could adversely affect the prevailing market price of our common stock. Furthermore, because % of our common stock outstanding prior to the consummation of this offering will be subject to the contractual and legal restrictions on resale described below, the sale of a substantial amount of common stock in the public market after these restrictions lapse could adversely affect the prevailing market price of our common stock and our ability to raise equity capital in the future.
Upon completion of this offering, we expect to have outstanding an aggregate of shares of our common stock, assuming no exercise of outstanding options and assuming that the underwriters have not exercised their option to purchase additional shares. All of the shares of common stock sold in this offering will be freely transferable without restriction or further registration under the Securities Act (other than restrictions pursuant to lock-up agreements entered into by certain officers and directors purchasing shares through the LOYAL3 platform) by persons other than "affiliates," as that term is defined in Rule 144 under the Securities Act. Generally, the balance of our outstanding common stock are "restricted securities" within the meaning of Rule 144 under the Securities Act, subject to the limitations and restrictions that are described below. Common stock purchased by our affiliates will be "restricted securities" under Rule 144. Restricted securities may be sold in the public market only if registered or if they qualify for an exemption from registration under Rule 144 or Rule 701 under the Securities Act. These rules are summarized below.
Upon the expiration of the lock-up agreements described below 180 days after the date of this prospectus, and subject to the provisions of Rule 144, an additional shares will be available for sale in the public market. The sale of these restricted securities is subject, in the case of shares held by affiliates, to the volume restrictions contained in those rules.
Lock-up Agreements
In connection with this offering, we, our directors and executive officers and stockholders currently representing substantially all of the outstanding shares of our common stock will agree with the underwriters to enter into lock-up agreements described in "Underwriting," pursuant to which shares of our common stock outstanding after this offering will be restricted from immediate resale in accordance with the terms of such lock-up agreements without the prior written consent of Goldman, Sachs & Co. and Merrill Lynch, Pierce, Fenner & Smith Incorporated. Under these agreements, subject to limited exceptions, neither we nor any of our directors or executive officers or these stockholders may dispose of, hedge or otherwise transfer the economic consequences of ownership of any shares of common stock or securities convertible into or exchangeable or exercisable for shares of common stock. These restrictions will be in effect for a period of 180 days after the date of this prospectus. Certain transfers or dispositions can be made sooner, provided the transferee becomes bound to the terms of the lock-up.
Rule 144
In general, under Rule 144 as in effect on the date of this prospectus, beginning 90 days after the consummation of this offering, a person (or persons whose common stock is required to be aggregated), who is an affiliate, and who has beneficially owned our common stock for at least six months is entitled to sell in any three-month period a number of shares that does not exceed the greater of:
- •
- 1% of the number of shares then outstanding, which will equal approximately shares immediately after consummation of
this offering; or
- •
- the average weekly trading volume in our shares on during the four calendar weeks preceding the filing of a notice on Form 144 with respect to such a sale.
136
Sales by our affiliates under Rule 144 are also subject to manner of sale provisions and notice requirements and to the availability of current public information about us. An "affiliate" is a person that directly, or indirectly through one or more intermediaries, controls or is controlled by, or is under common control with an issuer.
Under Rule 144, a person (or persons whose shares are aggregated) who is not deemed to have been an affiliate of ours at any time during the 90 days preceding a sale, and who has beneficially owned the shares proposed to be sold for at least six months (including the holding period of any prior owner other than an affiliate), would be entitled to sell those shares subject only to availability of current public information about us, and after beneficially owning such shares for at least twelve months, would be entitled to sell an unlimited number of shares without restriction. To the extent that our affiliates sell their common stock, other than pursuant to Rule 144 or a registration statement, the purchaser's holding period for the purpose of effecting a sale under Rule 144 commences on the date of transfer from the affiliate.
Rule 701
In general, under Rule 701 as in effect on the date of this prospectus, any of our employees, directors, officers, consultants or advisors who purchased shares from us in reliance on Rule 701 in connection with a compensatory stock or option plan or other written agreement before the effective date of this offering, or who purchased shares from us after that date upon the exercise of options granted before that date, are eligible to resell such shares 90 days after the effective date of this offering in reliance upon Rule 144. If such person is not an affiliate, such sale may be made subject only to the manner of sale provisions of Rule 144. If such a person is an affiliate, such sale may be made under Rule 144 without compliance with the holding period requirement, but subject to the other Rule 144 restrictions described above.
Stock Plans
We intend to file a registration statement or statements on Form S-8 under the Securities Act covering shares of common stock reserved for issuance under our new omnibus incentive plan and pursuant to all option grants made prior to this offering under the stock option plan. Subject to lock-up arrangements, these registration statements are expected to be filed as soon as practicable after the closing date of this offering. Shares issued upon the exercise of stock options after the effective date of the applicable Form S-8 registration statement will be eligible for resale in the public market without restriction, subject to Rule 144 limitations applicable to affiliates and the lock-up agreements described above.
Registration Rights
Following this offering, some of our stockholders will, under some circumstances, have the right to require us to register their shares for future sale. See "Certain Relationships and Related Party Transactions—Registration Rights Agreement".
137
MATERIAL U.S. FEDERAL TAX CONSIDERATIONS FOR NON-U.S. HOLDERS OF OUR COMMON STOCK
The following is a summary of the material U.S. federal income and estate tax consequences of the ownership and disposition of our common stock that is being issued pursuant to this offering. This summary is limited to Non-U.S. Holders (as defined below) that hold our common stock as a capital asset (generally, property held for investment) for U.S. federal income tax purposes. This summary does not discuss all of the aspects of U.S. federal income and estate taxation that may be relevant to a Non-U.S. Holder in light of the Non-U.S. Holder's particular investment or other circumstances. Accordingly, all prospective Non-U.S. Holders should consult their own tax advisors with respect to the U.S. federal, state, local and non-U.S. tax consequences of the ownership and disposition of our common stock.
This summary is based on provisions of the U.S. Internal Revenue Code of 1986, as amended (which we refer to as the "Code"), applicable U.S. Treasury regulations and administrative and judicial interpretations, all as in effect or in existence on the date of this prospectus. Subsequent developments in U.S. federal income or estate tax law, including changes in law or differing interpretations, which may be applied retroactively, could alter the U.S. federal income and estate tax consequences of owning and disposing of our common stock as described in this summary. There can be no assurance that the Internal Revenue Service (the "IRS") will not take a contrary position with respect to one or more of the tax consequences described herein and we have not obtained, nor do we intend to obtain, a ruling from the IRS with respect to the U.S. federal income or estate tax consequences of the ownership or disposition of our common stock.
As used in this summary, the term "Non-U.S. Holder" means a beneficial owner of our common stock that is not, for U.S. federal income tax purposes:
- •
- an individual who is a citizen or resident of the United States;
- •
- a corporation (or other entity treated as a corporation for U.S. federal income tax purposes) created or organized in or under the
laws of the United States, any state thereof, or the District of Columbia;
- •
- an entity or arrangement treated as a partnership;
- •
- an estate whose income is includible in gross income for U.S. federal income tax purposes regardless of its source; or
- •
- a trust, if (1) a U.S. court is able to exercise primary supervision over the trust's administration and one or more "United States persons" (within the meaning of the Code) has the authority to control all of the trust's substantial decisions, or (2) the trust has a valid election in effect under applicable U.S. Treasury regulations to be treated as a United States person.
If an entity or arrangement treated as a partnership for U.S. federal income tax purposes holds our common stock, the tax treatment of a partner in such a partnership generally will depend upon the status of the partner, the activities of the partnership and certain determinations made at the partner level. Partnerships, and partners in partnerships, that hold our common stock should consult their own tax advisors as to the particular U.S. federal income and estate tax consequences of owning and disposing of our common stock that are applicable to them.
138
This summary does not consider any specific facts or circumstances that may apply to a Non-U.S. Holder and does not address any special tax rules that may apply to particular Non-U.S. Holders, such as:
- •
- a Non-U.S. Holder that is a financial institution, insurance company, tax-exempt organization, pension plan, broker, dealer or trader
in stocks, securities or currencies, U.S. expatriate, controlled foreign corporation or passive foreign investment company;
- •
- a Non-U.S. Holder holding our common stock as part of a conversion, constructive sale, wash sale or other integrated transaction or a
hedge, straddle or synthetic security;
- •
- a Non-U.S. Holder that holds or receives our common stock pursuant to the exercise of any employee stock option or otherwise as
compensation; or
- •
- a Non-U.S. Holder that at any time owns, directly, indirectly or constructively, 5% or more of our outstanding common stock.
In addition, this summary does not address any U.S. state or local, or non-U.S. or other tax consequences, or any U.S. federal income or estate tax consequences for beneficial owners of a Non-U.S. Holder, including shareholders of a controlled foreign corporation or passive foreign investment company that holds our common stock.
Each Non-U.S. Holder should consult its own tax advisor regarding the U.S. federal, state, local and non-U.S. income and other tax consequences of owning and disposing of our common stock.
Distributions on Our Common Stock
As discussed under "Dividend Policy" above, we do not intend to pay cash dividends on our common stock for the foreseeable future. If we make distributions of cash or property (other than certain pro rata distributions of our common stock) with respect to our common stock, any such distributions generally will constitute dividends for U.S. federal income tax purposes to the extent paid from our current or accumulated earnings and profits, as determined under U.S. federal income tax principles. If a distribution exceeds our current and accumulated earnings and profits, the excess will be treated as a nontaxable return of capital to the extent of the Non-U.S. Holder's adjusted tax basis in its common stock and will reduce (but not below zero) such Non-U.S. Holder's adjusted tax basis in its common stock. Any remaining excess will be treated as gain from a disposition of our common stock subject to the tax treatment described below in "Sales or Other Dispositions of Our Common Stock".
Distributions on our common stock that are treated as dividends, and that are not effectively connected with a Non-U.S. Holder's conduct of a trade or business in the United States, generally will be subject to withholding of U.S. federal income tax at a rate of 30%. A Non-U.S. Holder may be eligible for a lower rate under an applicable income tax treaty between the United States and its jurisdiction of tax residence. In order to claim the benefit of an applicable income tax treaty, a Non-U.S. Holder will be required to provide to the applicable withholding agent a properly executed IRS Form W-8BEN or W-8BEN-E (or other applicable form) in accordance with the applicable certification and disclosure requirements. Special rules apply to partnerships and other pass-through entities and these certification and disclosure requirements also may apply to beneficial owners of partnerships and other pass-through entities that hold our common stock.
Distributions on our common stock that are treated as dividends, and that are effectively connected with a Non-U.S. Holder's conduct of a trade or business in the United States will be taxed on a net income basis at the regular graduated rates and in the manner applicable to United States persons (unless the Non-U.S. Holder is eligible for and properly claims the benefit of an applicable income tax treaty and the dividends are not attributable to a permanent establishment or fixed base maintained by the Non-U.S. Holder in the United States, in which case the Non-U.S. Holder may be eligible for a lower rate under an applicable income tax treaty between the United States and its
139
jurisdiction of tax residence). Dividends that are effectively connected with a Non-U.S. Holder's conduct of a trade or business in the United States will not be subject to the withholding of U.S. federal income tax discussed above if the Non-U.S. Holder provides to the applicable withholding agent a properly executed IRS Form W-8ECI (or other applicable form) in accordance with the applicable certification and disclosure requirements. A Non-U.S. Holder that is treated as a corporation for U.S. federal income tax purposes may also be subject to a "branch profits" tax at a 30% rate (or a lower rate if the Non-U.S. Holder is eligible for a lower rate under an applicable income tax treaty) on the Non-U.S. Holder's earnings and profits (attributable to dividends on our common stock or otherwise) that are effectively connected with the Non-U.S. Holder's conduct of a trade or business within the United States, subject to certain adjustments.
The certifications described above must be provided to the applicable withholding agent prior to the payment of dividends and must be updated periodically. A Non-U.S. Holder may obtain a refund or credit of any excess amounts withheld by timely filing an appropriate claim for a refund with the IRS. Non-U.S. Holders should consult their own tax advisors regarding their eligibility for benefits under a relevant income tax treaty and the manner of claiming such benefits.
The foregoing discussion is subject to the discussion below under "Backup Withholding and Information Reporting" and "FATCA Withholding".
Sales or Other Dispositions of Our Common Stock
A Non-U.S. Holder generally will not be subject to U.S. federal income tax (including withholding thereof) on any gain recognized on sales or other dispositions of our common stock unless:
- •
- the gain is effectively connected with the Non-U.S. Holder's conduct of a trade or business in the United States (and, if required by
an applicable income tax treaty, is attributable to a permanent establishment or fixed base maintained by the Non-U.S. Holder in the United States); in this case, the gain will be subject to U.S.
federal income tax on a net income basis at the regular graduated rates and in the manner applicable to United States persons (unless an applicable income tax treaty provides otherwise) and, if the
Non-U.S. Holder is treated as a corporation for U.S. federal income tax purposes, the "branch profits tax" described above may also apply;
- •
- the Non-U.S. Holder is an individual who is present in the United States for more than 182 days in the taxable year of the
disposition and meets certain other requirements; in this case, except as otherwise provided by an applicable income tax treaty, the gain, which may be offset by certain U.S. source capital losses,
generally will be subject to a flat 30% U.S. federal income tax, even though the Non-U.S. Holder is not considered a resident of the United States under the Code; or
- •
- we are or have been a "United States real property holding corporation" for U.S. federal income tax purposes at any time during the shorter of (i) the five-year period ending on the date of disposition and (ii) the period that the Non-U.S. Holder held our common stock.
Generally, a corporation is a "United States real property holding corporation" if the fair market value of its "United States real property interests" equals or exceeds 50% of the sum of the fair market value of its worldwide real property interests plus its other assets used or held for use in a trade or business. We believe that we are not currently, and we do not anticipate becoming in the future, a United States real property holding corporation. However, because the determination of whether we are a United States real property holding corporation is made from time to time and depends on the relative fair market values of our assets, there can be no assurance in this regard. If we were a United States real property holding corporation, the tax relating to disposition of stock in a United States real property holding corporation generally will not apply to a Non-U.S. Holder whose holdings, direct, indirect and constructive, constituted 5% or less of our common stock at all times
140
during the applicable period, provided that our common stock is "regularly traded on an established securities market" (as provided in applicable U.S. Treasury regulations) at any time during the calendar year in which the disposition occurs. However, no assurance can be provided that our common stock will be regularly traded on an established securities market for purposes of the rules described above. Non-U.S. Holders should consult their own tax advisors regarding the possible adverse U.S. federal income tax consequences to them if we are, or were to become, a United States real property holding corporation.
The foregoing discussion is subject to the discussion below under "Backup Withholding and Information Reporting" and "FATCA Withholding".
Federal Estate Tax
Our common stock that is owned (or treated as owned) by an individual who is not a U.S. citizen or resident of the United States (as specially defined for U.S. federal estate tax purposes) at the time of death will be included in the individual's gross estate for U.S. federal estate tax purposes, unless an applicable estate tax or other treaty provides otherwise and, therefore, may be subject to U.S. federal estate tax.
Backup Withholding and Information Reporting
Backup withholding (currently at a rate of 28%) will not apply to payments of dividends on our common stock to a Non-U.S. Holder if the Non-U.S. Holder provides to the applicable withholding agent a properly executed IRS Form W-8BEN or W-8BEN-E (or other applicable form) certifying under penalties of perjury that the Non-U.S. Holder is not a United States person, or otherwise qualifies for an exemption. However, the applicable withholding agent generally will be required to report to the IRS and to such Non-U.S. Holder payments of dividends on our common stock and the amount of U.S. federal income tax, if any, withheld with respect to those payments. Copies of the information returns reporting such dividends and any withholding may also be made available to the tax authorities in the country in which the Non-U.S. Holder resides under the provisions of a treaty or agreement.
The gross proceeds from sales or other dispositions of our common stock may be subject, in certain circumstances discussed below, to U.S. backup withholding and information reporting. If a Non-U.S. Holder sells or otherwise disposes of our common stock outside the United States through a non-U.S. office of a non-U.S. broker and the sale or disposition proceeds are paid to the Non-U.S. Holder outside the United States, then the U.S. backup withholding and information reporting requirements generally will not apply to that payment. However, U.S. information reporting, but not U.S. backup withholding, will apply to a payment of sale or disposition proceeds, even if that payment is made outside the United States, if a Non-U.S. Holder sells our common stock through a non-U.S. office of a broker that is a United States person or has certain enumerated connections with the United States, unless the broker has documentary evidence in its files that the Non-U.S. Holder is not a United States person and certain other conditions are met or the Non-U.S. Holder otherwise qualifies for an exemption.
If a Non-U.S. Holder receives payments of the proceeds of sales or other dispositions of our common stock to or through a U.S. office of a broker, the payment will be subject to both U.S. backup withholding and information reporting unless the Non-U.S. Holder provides to the broker a properly executed IRS Form W-8BEN or W-8BEN-E (or other applicable form) certifying under penalties of perjury that the Non-U.S. Holder is not a United States person, or otherwise qualifies for an exemption.
Backup withholding is not an additional tax. Any amounts withheld under the backup withholding rules may be credited against the Non-U.S. Holder's U.S. federal income tax liability
141
(which may result in the Non-U.S. Holder being entitled to a refund), provided that the required information is timely furnished to the IRS.
FATCA Withholding
The Foreign Account Tax Compliance Act and related Treasury guidance (commonly referred to as "FATCA") impose U.S. federal withholding tax at a rate of 30% on payments to certain foreign entities of (i) U.S.-source dividends (including dividends paid on our common stock) and (ii) the gross proceeds from the sale or other disposition after December 31, 2016 (which date the IRS has announced it will to extend to December 31, 2018) of property that produces U.S.-source dividends (including sales or other dispositions of our common stock). This withholding tax generally applies to a foreign entity, whether acting as a beneficial owner or an intermediary, unless such foreign entity, depending on the type of foreign entity, (i) complies with certain information reporting requirements regarding its U.S. account holders and certain withholding obligations regarding certain payments to its account holders and certain other persons or (ii) provides information with respect to certain of its U.S. owners. Accordingly, the entity through which a Non-U.S. Holder holds its common stock will affect the determination of whether such withholding is required. Non-U.S. Holders are encouraged to consult their tax advisors regarding FATCA.
142
The company and the underwriters named below have entered into an underwriting agreement with respect to the shares being offered. Subject to certain conditions, each underwriter has severally agreed to purchase the number of shares indicated in the following table. Goldman, Sachs & Co. and Merrill Lynch, Pierce, Fenner & Smith Incorporated are the representatives of the underwriters.
Underwriters
|
Number of Shares | |||
|---|---|---|---|---|
| Goldman, Sachs & Co. | ||||
| Merrill Lynch, Pierce, Fenner & Smith Incorporated |
||||
| Jefferies LLC | ||||
| Morgan Stanley & Co. LLC | ||||
| Evercore Group L.L.C. | ||||
| William Blair & Company, L.L.C. | ||||
| Guggenheim Securities, LLC | ||||
| Stifel, Nicolaus & Company, Incorporated | ||||
| | | | | |
Total |
||||
| | | | | |
| | | | | |
| | | | | |
The underwriters are committed to take and pay for all of the shares being offered, if any are taken, other than the shares covered by the option described below unless and until this option is exercised.
The underwriters have an option to buy up to an additional shares from the company to cover sales by the underwriters of a greater number of shares than the total number set forth in the table above. They may exercise that option for 30 days. If any shares are purchased pursuant to this option, the underwriters will severally purchase shares in approximately the same proportion as set forth in the table above.
The following table shows the per share and total underwriting discounts and commissions to be paid to the underwriters by the company. Such amounts are shown assuming both no exercise and full exercise of the underwriters' option to purchase additional shares.
Paid by the Company
|
No Exercise | Full Exercise | |||||
|---|---|---|---|---|---|---|---|
Per Share |
$ | $ | |||||
Total |
$ | $ | |||||
Shares sold by the underwriters to the public will initially be offered at the initial public offering price set forth on the cover of this prospectus. Any shares sold by the underwriters to securities dealers may be sold at a discount of up to $ per share from the initial public offering price. After the initial offering of the shares, the representatives may change the offering price and the other selling terms. The offering of the shares by the underwriters is subject to receipt and acceptance and subject to the underwriters' right to reject any order in whole or in part.
The company and its officers, directors, and holders of substantially all of the company's common stock have agreed with the underwriters, subject to certain exceptions, not to dispose of or hedge any of their common stock or securities convertible into or exchangeable for shares of common stock during the period from the date of this prospectus continuing through the date 180 days after the date of this prospectus, except with the prior written consent of the representatives. This agreement does not apply to any existing employee benefit plans. See "Shares Available for Future Sale" for a discussion of certain transfer restrictions.
Prior to the offering, there has been no public market for the shares. The initial public offering price has been negotiated among the company and the representatives. Among the factors to
143
be considered in determining the initial public offering price of the shares, in addition to prevailing market conditions, will be the company's historical performance, estimates of the business potential and earnings prospects of the company, an assessment of the company's management and the consideration of the above factors in relation to market valuation of companies in related businesses.
An application has been made to list the common stock on the NYSE under the symbol "HOME".
In connection with the offering, the underwriters may purchase and sell shares of common stock in the open market. These transactions may include short sales, stabilizing transactions and purchases to cover positions created by short sales. Short sales involve the sale by the underwriters of a greater number of shares than they are required to purchase in the offering, and a short position represents the amount of such sales that have not been covered by subsequent purchases. A "covered short position" is a short position that is not greater than the amount of additional shares for which the underwriters' option described above may be exercised. The underwriters may cover any covered short position by either exercising their option to purchase additional shares or purchasing shares in the open market. In determining the source of shares to cover the covered short position, the underwriters will consider, among other things, the price of shares available for purchase in the open market as compared to the price at which they may purchase additional shares pursuant to the option described above. "Naked" short sales are any short sales that create a short position greater than the amount of additional shares for which the option described above may be exercised. The underwriters must cover any such naked short position by purchasing shares in the open market. A naked short position is more likely to be created if the underwriters are concerned that there may be downward pressure on the price of the common stock in the open market after pricing that could adversely affect investors who purchase in the offering. Stabilizing transactions consist of various bids for or purchases of common stock made by the underwriters in the open market prior to the completion of the offering.
The underwriters may also impose a penalty bid. This occurs when a particular underwriter repays to the underwriters a portion of the underwriting discount received by it because the representatives have repurchased shares sold by or for the account of such underwriter in stabilizing or short covering transactions.
Purchases to cover a short position and stabilizing transactions, as well as other purchases by the underwriters for their own accounts, may have the effect of preventing or retarding a decline in the market price of the company's stock, and together with the imposition of the penalty bid, may stabilize, maintain or otherwise affect the market price of the common stock. As a result, the price of the common stock may be higher than the price that otherwise might exist in the open market. The underwriters are not required to engage in these activities and may end any of these activities at any time. These transactions may be effected on the NYSE, in the over-the-counter market or otherwise.
The LOYAL3 Platform
At our request, the underwriters have reserved up to % of the shares of common stock offered by this prospectus to be offered to our directors, officers, employees, customers, certain business and other associates of ours and individual investors through a platform administered by LOYAL3 Securities, Inc., which we refer to in this prospectus as the "LOYAL3 platform." Purchases through the LOYAL3 platform will be at the initial public offering price, will be otherwise fee-free to investors and will be in dollar amounts that may include fractional shares. The LOYAL3 platform is designed to facilitate participation of individual purchasers in initial public offerings in amounts starting at $100. Any purchase of our common stock in this offering through the LOYAL3 platform will be at the same time and price as any other purchases in this offering, including purchases by institutions and other large investors. Sales of our common stock by investors using the LOYAL3 platform will be completed through a batch or combined order process typically only once per day. Individual investors in the United States who are interested in purchasing shares of our common stock in this offering
144
through the LOYAL3 platform may go to LOYAL3's website for information about how to open a LOYAL3 account, which is required to purchase common stock through the LOYAL3 platform. The LOYAL3 platform and the information on the LOYAL3 website do not form a part of this prospectus. LOYAL3 Securities, Inc. is a U.S. registered broker-dealer unaffiliated with our company and is participating in this offering as a member of the selling group.
For certain officers and directors purchasing shares through the LOYAL3 platform, the lock-up agreements contemplated in the sixth paragraph under the heading "Underwriting" shall govern with respect to their purchases. Goldman, Sachs & Co. and Merrill Lynch, Pierce, Fenner & Smith Incorporated in their sole discretion may release any of the securities subject to these lock-up agreements at any time, which, in the case of officers and directors, shall be with notice.
Notice to Prospective Investors in the European Economic Area
In relation to each Member State of the European Economic Area which has implemented the Prospectus Directive (each, a Relevant Member State), an offer of shares to the public may not be made in that Relevant Member State, except that an offer of shares to the public may be made at any time under the following exemptions under the Prospectus Directive, if they have been implemented in that Relevant Member State:
(a) to any legal entity which is a qualified investor as defined in the Prospectus Directive;
(b) to fewer than 100 or, if the Relevant Member State has implemented the relevant provisions of the 2010 Amending Directive, 150, natural or legal persons (other than qualified investors as defined in the Prospectus Directive) subject to obtaining the prior consent of the representatives for any such offer; or
(c) in any other circumstances falling within Article 3(2) of the Prospectus Directive,
provided that no such offer of shares shall result in a requirement for the publication of a prospectus pursuant to Article 3 of the Prospectus Directive or any measure implementing the Prospectus Directive in a Relevant Member State and each person who initially acquires any shares or to whom an offer is made will be deemed to have represented, warranted and agreed to and with the underwriters that it is a qualified investor within the meaning of the law in that Relevant Member State implementing Article 2(1)(e) of the Prospectus Directive.
For the purposes of this provision, the expression an "offer of shares to the public" in relation to any shares in any Relevant Member State means the communication in any form and by any means of sufficient information on the terms of the offer and the shares to be offered so as to enable an investor to decide to purchase or subscribe the shares, as the same may be varied in that Relevant Member State by any measure implementing the Prospectus Directive in that Relevant Member State, the expression Prospectus Directive means Directive 2003/71/EC (and amendments thereto, including the 2010 PD Amending Directive, to the extent implemented in the Relevant Member State) and includes any relevant implementing measure in each Relevant Member State.
In the case of any shares being offered to a financial intermediary as that term is used in Article 3(2) of the Prospectus Directive, such financial intermediary will also be deemed to have represented, acknowledged and agreed that the shares acquired by it in the offer have not been acquired on a non-discretionary basis on behalf of, nor have they been acquired with a view to their offer or resale to, persons in circumstances which may give rise to an offer of shares to the public other than their offer or resale in a Relevant Member State to qualified investors as so defined or in circumstances in which the prior consent of the underwriters has been obtained to each such proposed offer or resale.
145
Notice to Prospective Investors in the United Kingdom
In the United Kingdom, this prospectus is only addressed to and directed as qualified investors who are (i) investment professionals falling within Article 19(5) of the Financial Services and Markets Act 2000 (Financial Promotion) Order 2005 (the Order); or (ii) high net worth entities and other persons to whom it may lawfully be communicated, falling within Article 49(2)(a) to (d) of the Order (all such persons together being referred to as "relevant persons"). Any investment or investment activity to which this prospectus relates is available only to relevant persons and will only be engaged with relevant persons. Any person who is not a relevant person should not act or relay on this prospectus or any of its contents.
Notice to Prospective Investors in Hong Kong
The shares may not be offered or sold in Hong Kong by means of any document other than (i) in circumstances which do not constitute an offer to the public within the meaning of the Companies (Winding Up and Miscellaneous Provisions) Ordinance (Cap. 32 of the Laws of Hong Kong) ("Companies (Winding Up and Miscellaneous Provisions) Ordinance") or which do not constitute an invitation to the public within the meaning of the Securities and Futures Ordinance (Cap. 571 of the Laws of Hong Kong) ("Securities and Futures Ordinance"), or (ii) to "professional investors" as defined in the Securities and Futures Ordinance and any rules made thereunder, or (iii) in other circumstances which do not result in the document being a "prospectus" as defined in the Companies (Winding Up and Miscellaneous Provisions) Ordinance, and no advertisement, invitation or document relating to the shares may be issued or may be in the possession of any person for the purpose of issue (in each case whether in Hong Kong or elsewhere), which is directed at, or the contents of which are likely to be accessed or read by, the public in Hong Kong (except if permitted to do so under the securities laws of Hong Kong) other than with respect to shares which are or are intended to be disposed of only to persons outside Hong Kong or only to "professional investors" in Hong Kong as defined in the Securities and Futures Ordinance and any rules made thereunder.
Notice to Prospective Investors in Singapore
This prospectus has not been registered as a prospectus with the Monetary Authority of Singapore. Accordingly, this prospectus and any other document or material in connection with the offer or sale, or invitation for subscription or purchase, of the shares may not be circulated or distributed, nor may the shares be offered or sold, or be made the subject of an invitation for subscription or purchase, whether directly or indirectly, to persons in Singapore other than (i) to an institutional investor (as defined under Section 4A of the Securities and Futures Act, Chapter 289 of Singapore (the "SFA")) under Section 274 of the SFA, (ii) to a relevant person (as defined in Section 275(2) of the SFA) pursuant to Section 275(1) of the SFA, or any person pursuant to Section 275(1A) of the SFA, and in accordance with the conditions specified in Section 275 of the SFA or (iii) otherwise pursuant to, and in accordance with the conditions of, any other applicable provision of the SFA, in each case subject to conditions set forth in the SFA.
Where the shares are subscribed or purchased under Section 275 of the SFA by a relevant person which is a corporation (which is not an accredited investor (as defined in Section 4A of the SFA)) the sole business of which is to hold investments and the entire share capital of which is owned by one or more individuals, each of whom is an accredited investor, the securities (as defined in Section 239(1) of the SFA) of that corporation shall not be transferable for 6 months after that corporation has acquired the shares under Section 275 of the SFA except: (1) to an institutional investor under Section 274 of the SFA or to a relevant person (as defined in Section 275(2) of the SFA), (2) where such transfer arises from an offer in that corporation's securities pursuant to Section 275(1A) of the SFA, (3) where no consideration is or will be given for the transfer, (4) where the transfer is by operation of law, (5) as specified in Section 276(7) of the SFA, or (6) as specified in
146
Regulation 32 of the Securities and Futures (Offers of Investments) (Shares and Debentures) Regulations 2005 of Singapore ("Regulation 32").
Where the shares are subscribed or purchased under Section 275 of the SFA by a relevant person which is a trust (where the trustee is not an accredited investor (as defined in Section 4A of the SFA)) whose sole purpose is to hold investments and each beneficiary of the trust is an accredited investor, the beneficiaries' rights and interest (howsoever described) in that trust shall not be transferable for 6 months after that trust has acquired the shares under Section 275 of the SFA except: (1) to an institutional investor under Section 274 of the SFA or to a relevant person (as defined in Section 275(2) of the SFA), (2) where such transfer arises from an offer that is made on terms that such rights or interest are acquired at a consideration of not less than S$200,000 (or its equivalent in a foreign currency) for each transaction (whether such amount is to be paid for in cash or by exchange of securities or other assets), (3) where no consideration is or will be given for the transfer, (4) where the transfer is by operation of law, (5) as specified in Section 276(7) of the SFA, or (6) as specified in Regulation 32.
Notice to Prospective Investors in Japan
The securities have not been and will not be registered under the Financial Instruments and Exchange Act of Japan (Act No. 25 of 1948, as amended), or the FIEA. The securities may not be offered or sold, directly or indirectly, in Japan or to or for the benefit of any resident of Japan (including any person resident in Japan or any corporation or other entity organized under the laws of Japan) or to others for reoffering or resale, directly or indirectly, in Japan or to or for the benefit of any resident of Japan, except pursuant to an exemption from the registration requirements of the FIEA and otherwise in compliance with any relevant laws and regulations of Japan.
Notice to Prospective Investors in Switzerland
The shares may not be publicly offered in Switzerland and will not be listed on the SIX Swiss Exchange ("SIX") or on any other stock exchange or regulated trading facility in Switzerland. This document has been prepared without regard to the disclosure standards for issuance prospectuses under art. 652a or art. 1156 of the Swiss Code of Obligations or the disclosure standards for listing prospectuses under art. 27 ff. of the SIX Listing Rules or the listing rules of any other stock exchange or regulated trading facility in Switzerland. Neither this document nor any other offering or marketing material relating to the shares or the offering may be publicly distributed or otherwise made publicly available in Switzerland.
Neither this document nor any other offering or marketing material relating to the offering, the Company, the shares have been or will be filed with or approved by any Swiss regulatory authority. In particular, this document will not be filed with, and the offer of shares will not be supervised by, the Swiss Financial Market Supervisory Authority FINMA (FINMA), and the offer of shares has not been and will not be authorized under the Swiss Federal Act on Collective Investment Schemes ("CISA"). The investor protection afforded to acquirers of interests in collective investment schemes under the CISA does not extend to acquirers of shares.
Notice to Prospective Investors in the Dubai International Financial Centre
This prospectus relates to an Exempt Offer in accordance with the Offered Securities Rules of the Dubai Financial Services Authority ("DFSA"). This prospectus is intended for distribution only to persons of a type specified in the Offered Securities Rules of the DFSA. It must not be delivered to, or relied on by, any other person. The DFSA has no responsibility for reviewing or verifying any documents in connection with Exempt Offers. The DFSA has not approved this prospectus nor taken steps to verify the information set forth herein and has no responsibility for the prospectus. The shares to which this prospectus relates may be illiquid and/or subject to restrictions on their resale. Prospective purchasers of the shares offered should conduct their own due diligence on the shares. If you do not understand the contents of this prospectus you should consult an authorized financial advisor.
147
Notice to Prospective Investors in Australia
No placement document, prospectus, product disclosure statement or other disclosure document has been lodged with the Australian Securities and Investments Commission ("ASIC"), in relation to the offering. This prospectus does not constitute a prospectus, product disclosure statement or other disclosure document under the Corporations Act 2001 (the "Corporations Act"), and does not purport to include the information required for a prospectus, product disclosure statement or other disclosure document under the Corporations Act.
Any offer in Australia of the shares may only be made to persons (the "Exempt Investors") who are "sophisticated investors" (within the meaning of section 708(8) of the Corporations Act), "professional investors" (within the meaning of section 708(11) of the Corporations Act) or otherwise pursuant to one or more exemptions contained in section 708 of the Corporations Act so that it is lawful to offer the shares without disclosure to investors under Chapter 6D of the Corporations Act.
The shares applied for by Exempt Investors in Australia must not be offered for sale in Australia in the period of 12 months after the date of allotment under the offering, except in circumstances where disclosure to investors under Chapter 6D of the Corporations Act would not be required pursuant to an exemption under section 708 of the Corporations Act or otherwise or where the offer is pursuant to a disclosure document which complies with Chapter 6D of the Corporations Act. Any person acquiring shares must observe such Australian on-sale restrictions.
This prospectus contains general information only and does not take account of the investment objectives, financial situation or particular needs of any particular person. It does not contain any securities recommendations or financial product advice. Before making an investment decision, investors need to consider whether the information in this prospectus is appropriate to their needs, objectives and circumstances, and, if necessary, seek expert advice on those matters.
Notice to Prospective Investors in Canada
The shares may be sold only to purchasers purchasing, or deemed to be purchasing, as principal that are accredited investors, as defined in National Instrument 45-106 Prospectus Exemptions or subsection 73.3(1) of the Securities Act (Ontario), and are permitted clients, as defined in National Instrument 31-103 Registration Requirements, Exemptions and Ongoing Registrant Obligations. Any resale of the shares must be made in accordance with an exemption from, or in a transaction not subject to, the prospectus requirements of applicable securities laws.
Securities legislation in certain provinces or territories of Canada may provide a purchaser with remedies for rescission or damages if this prospectus (including any amendment thereto) contains a misrepresentation, provided that the remedies for rescission or damages are exercised by the purchaser within the time limit prescribed by the securities legislation of the purchaser's province or territory. The purchaser should refer to any applicable provisions of the securities legislation of the purchaser's province or territory for particulars of these rights or consult with a legal advisor.
Pursuant to section 3A.3 (or, in the case of securities issued or guaranteed by the government of a non-Canadian jurisdiction, section 3A.4) of National Instrument 33-105 Underwriting Conflicts (NI 33-105), the underwriters are not required to comply with the disclosure requirements of NI 33-105 regarding underwriter conflicts of interest in connection with this offering.
We estimate that the total expenses of the offering (including up to $ in reimbursement of underwriters' counsel's fees), excluding underwriting discounts and commissions, will be approximately $ .
We have agreed to indemnify the several underwriters against certain liabilities, including liabilities under the Securities Act of 1933.
148
The underwriters and their respective affiliates are full service financial institutions engaged in various activities, which may include sales and trading, commercial and investment banking, advisory, investment management, investment research, principal investment, hedging, market making, brokerage and other financial and non-financial activities and services. Certain of the underwriters and their respective affiliates have provided, and may in the future provide, a variety of these services to the issuer and to persons and entities with relationships with the issuer, for which they received or will receive customary fees and expenses. For example, Merrill Lynch, Pierce, Fenner & Smith Incorporated and Jefferies LLC, or one of their respective affiliates, acted as joint lead arrangers and joint book-running managers for, and act as agents and lenders under, our First Lien Facility. Additionally, Merrill Lynch, Pierce, Fenner & Smith Incorporated, or its affiliates, acted as a joint lead arranger and bookrunner for, and act as an agent and lender, under our ABL Facility.
In the ordinary course of their various business activities, the underwriters and their respective affiliates, officers, directors and employees may purchase, sell or hold a broad array of investments and actively trade securities, derivatives, loans, commodities, currencies, credit default swaps and other financial instruments for their own account and for the accounts of their customers, and such investment and trading activities may involve or relate to assets, securities and/or instruments of the issuer (directly, as collateral securing other obligations or otherwise) and/or persons and entities with relationships with the issuer. The underwriters and their respective affiliates may also communicate independent investment recommendations, market color or trading ideas and/or publish or express independent research views in respect of such assets, securities or instruments and may at any time hold, or recommend to clients that they should acquire, long and/or short positions in such assets, securities and instruments.
149
The validity of the shares of common stock offered hereby will be passed upon for us by Fried, Frank, Harris, Shriver & Jacobson LLP, New York, New York. Fried, Frank, Harris, Shriver & Jacobson LLP owns an indirect interest in less than 1% of our common stock through limited partnership interests in funds associated with AEA. The underwriters are being represented by Latham & Watkins LLP, New York, New York in connection with this offering.
The consolidated financial statements of At Home Group Inc. and its subsidiaries as of January 31, 2015 and January 25, 2014, and for each of the fiscal years then ended, appearing in this Prospectus and Registration Statement have been audited by Ernst & Young LLP, independent registered public accounting firm, as set forth in their report thereon appearing elsewhere herein, and are included in reliance upon such report given on the authority of such firm as experts in accounting and auditing.
WHERE YOU CAN FIND MORE INFORMATION
We have filed with the SEC a registration statement on Form S-1, including exhibits and schedules, under the Securities Act with respect to the common stock to be sold in this offering. As allowed by SEC rules, this prospectus, which constitutes a part of the registration statement, does not contain all of the information set forth in the registration statement or the exhibits and schedules that are part of the registration statement. For further information about us and our common stock, you should refer to the registration statement, including all amendments, supplements, schedules and exhibits thereto.
Statements contained in this prospectus regarding the contents of any contract or any other document that is filed as an exhibit to the registration statement are not necessarily complete, and each such statement is qualified in all respects by reference to the full text of such contract or other document filed as an exhibit to the registration statement.
You may read, without charge, and copy, at prescribed rates, all or any portion of the registration statement or any reports, statements or other information we file with or furnish to the SEC at the SEC's Public Reference Room at 100 F Street, N.E., Washington, DC 20549. You may also obtain copies of the documents at prescribed rates by writing to the Public Reference Section of the SEC. Please call the SEC at 1-800-SEC-0330 to obtain information on the operation of the Public Reference Room. In addition, the SEC maintains an internet site that contains reports, proxy and information statements, and other information regarding issuers that file electronically with the SEC. You can review the registration statement, as well as our future SEC filings, by accessing the SEC's website at www.sec.gov. You may also request copies of those documents, at no cost to you, by contacting us at the following address:
At
Home Group Inc.
1600 East Plano Parkway
Plano, Texas 75074
Attention: Chief Financial Officer
(972) 265-6227
As a result of this offering, we will become subject to the information and reporting requirements of the Securities Exchange Act and will file annual, quarterly and current reports, proxy statements and other information with the SEC. You can request copies of these documents, for a copying fee, by writing to the SEC. We intend to furnish our stockholders with annual reports containing financial statements audited by our independent auditors.
150
INDEX TO CONSOLIDATED FINANCIAL STATEMENTS
Report of Independent Registered Public Accounting Firm |
F-2 | |||
Consolidated Financial Statements |
||||
Fiscal Years Ended January 25, 2014 and January 31, 2015 |
||||
Consolidated Balance Sheets |
F-3 | |||
Consolidated Statements of Operations |
F-4 | |||
Consolidated Statements of Shareholders' Equity |
F-5 | |||
Consolidated Statements of Cash Flows |
F-6 | |||
Notes to Consolidated Financial Statements |
F-7 | |||
Schedule I—Condensed Financial Information of Registrant |
F-30 | |||
Interim Condensed Consolidated Financial Statements (Unaudited) |
||||
Twenty-six Weeks Ended July 26, 2014 and August 1, 2015 |
||||
Condensed Consolidated Balance Sheets |
F-34 | |||
Condensed Consolidated Statements of Operations |
F-35 | |||
Condensed Consolidated Statements of Cash Flows |
F-36 | |||
Notes to Condensed Consolidated Financial Statements |
F-37 |
F-1
Report of Independent Registered Public Accounting Firm
The
Board of Directors and Shareholders of
At Home Group Inc.
We have audited the accompanying consolidated balance sheets of At Home Group Inc. as of January 25, 2014 and January 31, 2015, and the related consolidated statements of operations, shareholders' equity and cash flows for each of the two years in the period ended January 31, 2015. Our audits also included the accompanying financial statement schedule. These financial statements and schedule are the responsibility of the Company's management. Our responsibility is to express an opinion on these financial statements and schedule based on our audits.
We conducted our audits in accordance with the standards of the Public Company Accounting Oversight Board (United States). Those standards require that we plan and perform the audit to obtain reasonable assurance about whether the financial statements are free of material misstatement. We were not engaged to perform an audit of the Company's internal control over financial reporting. Our audits included consideration of internal control over financial reporting as a basis for designing audit procedures that are appropriate in the circumstances, but not for the purpose of expressing an opinion on the effectiveness of the Company's internal control over financial reporting. Accordingly, we express no such opinion. An audit also includes examining, on a test basis, evidence supporting the amounts and disclosures in the financial statements, assessing the accounting principles used and significant estimates made by management, and evaluating the overall financial statement presentation. We believe that our audits provide a reasonable basis for our opinion.
In our opinion, the financial statements referred to above present fairly, in all material respects, the consolidated financial position of At Home Group Inc. at January 25, 2014 and January 31, 2015, and the consolidated results of its operations and its cash flows for each of the two years in the periods ended January 31, 2015, in conformity with U.S. generally accepted accounting principles. Also, in our opinion, the related financial statement schedule, when considered in relation to the basic financial statements taken as a whole, presents fairly in all material respects the information set forth therein.
/s/ Ernst & Young LLP
Dallas,
Texas
August 17, 2015
F-2
At Home Group Inc.
Consolidated Balance Sheets
(in thousands, except share data)
| |
January 25, 2014 | January 31, 2015 | |||||
|---|---|---|---|---|---|---|---|
Assets |
|||||||
Current assets: |
|||||||
Cash and cash equivalents |
$ | 4,971 | $ | 4,706 | |||
Inventories, net |
109,125 | 142,256 | |||||
Prepaid expenses |
3,867 | 4,758 | |||||
Current deferred tax asset |
2,162 | 6,875 | |||||
Other current assets |
352 | 4,041 | |||||
| | | | | | | | |
Total current assets |
120,477 | 162,636 | |||||
| | | | | | | | |
Property and equipment, net |
111,786 | 220,084 | |||||
Goodwill |
569,732 | 569,732 | |||||
Trade name |
4,389 | 853 | |||||
Debt issuance costs, net |
9,808 | 9,203 | |||||
Restricted cash |
17,857 | 17,260 | |||||
Other assets |
872 | 579 | |||||
| | | | | | | | |
Total assets |
$ | 834,921 | $ | 980,347 | |||
| | | | | | | | |
| | | | | | | | |
| | | | | | | | |
Liabilities and Shareholders' Equity |
|||||||
Current liabilities: |
|||||||
Accounts payable |
$ | 19,144 | $ | 31,638 | |||
Accrued liabilities |
43,020 | 56,679 | |||||
Revolving line of credit |
— | 67,400 | |||||
Current portion of deferred rent |
1,308 | 2,943 | |||||
Current portion of long-term debt |
557 | 758 | |||||
Income taxes payable |
6,028 | 515 | |||||
| | | | | | | | |
Total current liabilities |
70,057 | 159,933 | |||||
| | | | | | | | |
Long-term debt |
371,794 | 377,503 | |||||
Financing obligations |
— | 19,745 | |||||
Deferred rent |
29,958 | 51,226 | |||||
Deferred income taxes |
1,736 | 4,457 | |||||
Other long-term liabilities |
4,275 | 6,567 | |||||
| | | | | | | | |
Total liabilities |
477,820 | 619,431 | |||||
| | | | | | | | |
Shareholders' equity |
|||||||
Common stock, Class A; $0.01 par value; 1,000,000 shares authorized; 253,871 shares issued and outstanding |
3 | 3 | |||||
Common stock, Class B; $0.01 par value; 1,000,000 shares authorized; 142,803 shares issued and outstanding |
1 | 1 | |||||
Additional paid-in capital |
401,336 | 405,587 | |||||
Accumulated deficit |
(44,239 | ) | (44,675 | ) | |||
| | | | | | | | |
Total shareholders' equity |
357,101 | 360,916 | |||||
| | | | | | | | |
Total liabilities and shareholders' equity |
$ | 834,921 | $ | 980,347 | |||
| | | | | | | | |
| | | | | | | | |
| | | | | | | | |
See Notes to Consolidated Financial Statements.
F-3
At Home Group Inc.
Consolidated Statements of Operations
(in thousands)
| |
Fiscal Year Ended | ||||||
|---|---|---|---|---|---|---|---|
| |
January 25, 2014 | January 31, 2015 | |||||
Net sales |
$ | 403,966 | $ | 497,733 | |||
Cost of sales |
272,021 | 335,617 | |||||
| | | | | | | | |
Gross profit |
131,945 | 162,116 | |||||
| | | | | | | | |
Operating expenses |
|||||||
Selling, general and administrative expenses |
74,255 | 110,503 | |||||
Impairment of trade name |
37,500 | — | |||||
Depreciation and amortization |
1,262 | 5,310 | |||||
| | | | | | | | |
Total operating expenses |
113,017 | 115,813 | |||||
| | | | | | | | |
Operating income |
18,928 | 46,303 | |||||
Interest expense, net |
41,152 | 42,382 | |||||
| | | | | | | | |
(Loss) income before income taxes |
(22,224 | ) | 3,921 | ||||
Income tax provision |
59 | 4,357 | |||||
| | | | | | | | |
Net loss |
$ | (22,283 | ) | $ | (436 | ) | |
| | | | | | | | |
| | | | | | | | |
| | | | | | | | |
Earnings per share: |
|||||||
Net loss per common share: |
|||||||
Basic |
$ | (56.17 | ) | $ | (1.10 | ) | |
| | | | | | | | |
| | | | | | | | |
| | | | | | | | |
Diluted |
$ | (56.17 | ) | $ | (1.10 | ) | |
| | | | | | | | |
| | | | | | | | |
| | | | | | | | |
Weighted average shares outstanding: |
|||||||
Basic |
396,674 | 396,674 | |||||
| | | | | | | | |
| | | | | | | | |
| | | | | | | | |
Diluted |
396,674 | 396,674 | |||||
| | | | | | | | |
| | | | | | | | |
| | | | | | | | |
See Notes to Consolidated Financial Statements.
F-4
At Home Group Inc.
Consolidated Statements of Shareholders' Equity
For the Fiscal Years Ended January 25, 2014 and January 31, 2015
(in thousands, except share data)
| |
Common Stock Class A |
Common Stock Class B |
|
|
|
|||||||||||||||||
|---|---|---|---|---|---|---|---|---|---|---|---|---|---|---|---|---|---|---|---|---|---|---|
| |
Additional Paid-in Capital |
Accumulated Deficit |
|
|||||||||||||||||||
| |
Shares | Par Value | Shares | Par Value | Total | |||||||||||||||||
Balance, January 26, 2013 |
253,871 | $ | 3 | 142,803 | $ | 1 | $ | 396,963 | $ | (21,956 | ) | $ | 375,011 | |||||||||
Stock-based compensation |
— | — | — | — | 4,373 | — | 4,373 | |||||||||||||||
Net loss |
— | — | — | — | — | (22,283 | ) | (22,283 | ) | |||||||||||||
| | | | | | | | | | | | | | | | | | | | | | | |
Balance, January 25, 2014 |
253,871 | 3 | 142,803 | 1 | 401,336 | (44,239 | ) | 357,101 | ||||||||||||||
Stock-based compensation |
— | — | — | — | 4,251 | — | 4,251 | |||||||||||||||
Net loss |
— | — | — | — | — | (436 | ) | (436 | ) | |||||||||||||
| | | | | | | | | | | | | | | | | | | | | | | |
Balance, January 31, 2015 |
253,871 | $ | 3 | 142,803 | $ | 1 | $ | 405,587 | $ | (44,675 | ) | $ | 360,916 | |||||||||
| | | | | | | | | | | | | | | | | | | | | | | |
| | | | | | | | | | | | | | | | | | | | | | | |
| | | | | | | | | | | | | | | | | | | | | | | |
See Notes to Consolidated Financial Statements.
F-5
At Home Group Inc.
Consolidated Statements of Cash Flows
(in thousands)
| |
Fiscal Year Ended | ||||||
|---|---|---|---|---|---|---|---|
| |
January 25, 2014 | January 31, 2015 | |||||
Operating Activities |
|||||||
Net loss |
$ | (22,283 | ) | $ | (436 | ) | |
Adjustments to reconcile net loss to net cash provided by operating activities: |
|||||||
Depreciation and amortization |
13,132 | 23,317 | |||||
(Gain) loss on disposal of fixed assets |
(51 | ) | 746 | ||||
Non-cash interest expense |
1,431 | 1,780 | |||||
Amortization of deferred gain on sale-leaseback |
(328 | ) | (1,759 | ) | |||
Deferred income taxes |
(7,257 | ) | (1,992 | ) | |||
Stock-based compensation |
4,373 | 4,251 | |||||
Impairment of trade name |
37,500 | — | |||||
Changes in operating assets and liabilities: |
|||||||
Inventories |
(13,744 | ) | (33,131 | ) | |||
Prepaid expenses and other current assets |
1,388 | (4,581 | ) | ||||
Other assets |
35 | 287 | |||||
Accounts payable |
(5,722 | ) | 11,554 | ||||
Accrued liabilities |
22,000 | 15,950 | |||||
Income taxes payable |
3,664 | (5,513 | ) | ||||
Deferred rent |
1,557 | 4,848 | |||||
| | | | | | | | |
Net cash provided by operating activities |
35,695 | 15,321 | |||||
| | | | | | | | |
Investing Activities |
|||||||
Purchase of property and equipment |
(47,207 | ) | (137,044 | ) | |||
Purchase of intangible assets |
(389 | ) | (464 | ) | |||
Change in restricted cash |
(17,857 | ) | 597 | ||||
Net proceeds from sale of property and equipment |
35,143 | 36,813 | |||||
| | | | | | | | |
Net cash used in investing activities |
(30,310 | ) | (100,098 | ) | |||
| | | | | | | | |
Financing Activities |
|||||||
Payments under lines of credit |
(123,784 | ) | (212,400 | ) | |||
Proceeds from lines of credit |
120,884 | 279,800 | |||||
Payment of debt issuance costs |
(601 | ) | (956 | ) | |||
Proceeds from issuance of long-term debt |
— | 6,532 | |||||
Proceeds from financing obligations |
— | 12,158 | |||||
Payments on long-term debt |
(531 | ) | (622 | ) | |||
| | | | | | | | |
Net cash (used in) provided by financing activities |
(4,032 | ) | 84,512 | ||||
| | | | | | | | |
Increase (decrease) in cash and cash equivalents |
1,353 | (265 | ) | ||||
Cash and cash equivalents, beginning of period |
3,618 | 4,971 | |||||
| | | | | | | | |
Cash and cash equivalents, end of period |
$ | 4,971 | $ | 4,706 | |||
| | | | | | | | |
| | | | | | | | |
| | | | | | | | |
Supplemental Cash Flow Information |
|||||||
Cash paid for interest |
$ | 39,731 | $ | 40,616 | |||
Cash paid for income taxes |
$ | 1,979 | $ | 13,037 | |||
See Notes to Consolidated Financial Statements.
F-6
At Home Group Inc.
Notes to Consolidated Financial Statements
January 25, 2014 and January 31, 2015
1. Nature of Operations and Summary of Significant Accounting Policies
Description of Business
GRD Holding I Corporation ("GRD I"), a Delaware corporation, was incorporated on June 30, 2011. GRD I is the parent of GRD Holding II Corporation ('GRD II"), which owns 100% of GRD Holding III Corporation ("GRD III"). GRD III was organized for the purpose of acquiring all of the outstanding common stock of Garden Holdings Inc., a Delaware corporation. Garden Holdings Inc. owned, directly or indirectly, 100% of Garden Ridge Corporation and other entities.
On September 29, 2014, GRD I, GRDII, GRD III and its affiliates completed an entity restructuring and amended various corporate names to reflect the "At Home" brand. In particular, (i) GRD Holding I Corporation was renamed to At Home Group Inc. ("At Home Group"), (ii) GRD Holding II Corporation was renamed to At Home Holding II Inc. ("At Home II"), (iii) GRD Holding III Corporation was renamed to At Home Holding III Inc. ("At Home III"), (iv) Garden Holdings Inc. was converted from a Delaware corporation to a Delaware limited liability company named At Home Companies LLC ("At Home LLC"), (v) both Garden Ridge Corporation and Garden Ridge, L.P. were merged with and into Garden Ridge Management, LLC, and (vi) Garden Ridge Management, LLC was renamed At Home Stores LLC ("At Home Stores"). At Home Group and its consolidated wholly-owned subsidiaries are collectively referred to as "we", 'us", "our" and the "Company".
At Home is a home décor superstore focused exclusively on providing a broad assortment of products for every room, in every style at everyday low prices. We operate 81 home décor superstores in 21 states, primarily in the South Central, Southeastern and Midwestern regions of the United States.
Rebranding Initiative
During the fiscal year ended January 31, 2015, we launched a significant rebranding initiative through which we changed our brand and corporate name, redesigned stores and changed merchandise. As part of this initiative, we changed our name from "Garden Ridge" to "At Home". We completed the rebranding initiative during the first nine months of fiscal year 2015 and now all of our stores operate under the At Home brand.
Fiscal Year
We report on the basis of a 52- or 53-week fiscal year, which ends on the last Saturday in January. References to a fiscal year mean the year in which that fiscal year ends. References herein to "fiscal year 2015" relate to the 53 weeks ended January 31, 2015 and references to "fiscal year 2014" relate to the 52 weeks ended January 25, 2014.
Consolidation
The accompanying consolidated financial statements include the accounts of At Home Group and its consolidated wholly-owned subsidiaries. All intercompany balances and transactions have been eliminated in consolidation.
The Company does not have any components of other comprehensive income recorded within its consolidated financial statements, and, therefore, does not separately present a statement of comprehensive income in its consolidated financial statements.
Use of Estimates
Preparing financial statements in conformity with U.S. generally accepted accounting principles requires us to make estimates and assumptions that affect the reported amounts of certain assets,
F-7
At Home Group Inc.
Notes to Consolidated Financial Statements (Continued)
January 25, 2014 and January 31, 2015
1. Nature of Operations and Summary of Significant Accounting Policies (Continued)
liabilities, revenues and expenses, and related disclosure of contingent assets and liabilities at the date of the financial statements. We base our estimates on historical experience and on various other assumptions that we believe to be reasonable under the circumstances, the results of which form the basis for making judgments about the carrying values of assets and liabilities that are not readily apparent from other sources. Because of the use of estimates inherent in the financial reporting process, actual results may differ from these estimates.
Segment Information
Management has determined that we have one operating segment, and therefore, one reportable segment. Our chief operating decision maker ("CODM") is our Chief Executive Officer; our CODM reviews financial performance and allocates resources at a consolidated level on a recurring basis. All of our assets are located in the United States. All of our revenue is derived in the United States. It is impracticable for us to disclose revenue by each group of similar products.
Cash and Cash Equivalents
Cash and cash equivalents consists of highly liquid investments with original maturities of three months or less as well as credit card receivables. At January 25, 2014 and January 31, 2015, our cash and cash equivalents were comprised of primarily of credit card receivables.
Restricted Cash
From time to time, we consummate sale-leaseback transactions where the sale is treated as a like-kind exchange transaction for U.S. federal income tax purposes in accordance with Section 1031 of the Internal Revenue Code (the "Code"). Section 1031 of the Code allows companies to defer the recognition of taxable gain realized from the sale of property if you timely reinvest the proceeds in qualifying like-kind property. In addition, Section 1031 of the Code requires sale proceeds of the relinquished property to be held by a third-party intermediary, pending utilization thereof for the acquisition of a qualifying like-kind property. The $17.9 million and $17.3 million restricted cash balances as of January 25, 2014 and January 31, 2015, respectively, relate to sale proceeds that will be used for future qualifying property acquisitions. The remaining proceeds are expected to be fully utilized by the second quarter of fiscal year 2016.
Inventories
Inventories are comprised of finished merchandise and are stated at the lower of cost or market with cost determined using the weighted-average method. The cost of inventories include the actual landed cost of an item at the time it is received in our distribution center or at the point of shipment for certain international shipments, as well as transportation costs to our distribution center and to our retail stores, if applicable. Net inventory cost is recognized through cost of sales when the inventory is sold.
Physical inventory counts are performed for all of our stores at least once per year by a third-party inventory counting service. Inventory records are adjusted to reflect actual inventory counts and any resulting shortage ("shrinkage") is recognized. Reserves for shrinkage are estimated and recorded throughout the period as a percentage of sales based on the most recent physical inventory, in combination with current events and historical experience. We also evaluate our merchandise to ensure that the expected net realizable value of the merchandise held at the end of a fiscal period exceeds cost. In the event that the expected net realizable value is less than cost, we reduce the value of that inventory accordingly.
F-8
At Home Group Inc.
Notes to Consolidated Financial Statements (Continued)
January 25, 2014 and January 31, 2015
1. Nature of Operations and Summary of Significant Accounting Policies (Continued)
Consideration Received from Vendors
We receive vendor support in the form of cash payments or allowances for a variety of vendor-sponsored programs, such as volume rebates, markdown allowances and advertising. We also receive consideration for certain compliance programs. We have agreements in place with each vendor setting forth the specific conditions for each allowance.
Vendor support reduces our inventory costs based on the underlying provisions of the agreement. Vendor compliance charges are recorded as a reduction of the cost of merchandise inventories and a subsequent reduction in cost of sales when the inventory is sold.
Property and Equipment
Property and equipment is recorded at cost less accumulated depreciation and amortization. Depreciation of property and equipment other than leasehold improvements is recorded on a straight-line basis over the estimated useful lives of the assets ranging from 3 to 20 years. Leasehold improvements are amortized on a straight-line basis over the shorter of the remaining lease term, including renewals determined to be reasonably assured, or the estimated useful life of the related improvement.
We capitalize major replacements and improvements, expense routine maintenance and repairs as incurred. We remove the cost of assets sold or retired and the related accumulated depreciation or amortization from the consolidated balance sheet and include any resulting gain or loss in the accompanying consolidated statements of operations.
Capitalized Interest
We capitalize interest on borrowings during the active construction period of major capital projects. Capitalized interest is added to the cost of the underlying assets and is amortized over the useful lives of the assets. Our capitalized interest cost was approximately $0.2 million and $0.3 million for the fiscal years ended January 25, 2014 and January 31, 2015, respectively.
Fair Value Measurements
We follow the provisions of Accounting Standards Codification ("ASC") 820 (Topic 820, "Fair Value Measurements and Disclosures"). ASC 820 establishes a three-tiered fair value hierarchy that prioritizes inputs to valuation techniques used in fair value calculations.
- •
- Level 1—Unadjusted quoted market prices for identical assets or liabilities in active markets that we have the
ability to access.
- •
- Level 2—Quoted prices for similar assets or liabilities in active markets; quoted prices for identical or similar
assets or liabilities in inactive markets; or valuations based on models where the significant inputs are observable (e.g., interest rates, yield
curves, prepayment speeds, default rates, loss severities, etc.) or can be corroborated by observable market data.
- •
- Level 3—Valuations based on models where significant inputs are not observable. The unobservable inputs reflect our own assumptions about the assumptions that market participants would use.
ASC 820 requires us to maximize the use of observable inputs and minimize the use of unobservable inputs. If a financial instrument uses inputs that fall in different levels of the hierarchy,
F-9
At Home Group Inc.
Notes to Consolidated Financial Statements (Continued)
January 25, 2014 and January 31, 2015
1. Nature of Operations and Summary of Significant Accounting Policies (Continued)
the instrument is categorized based upon the lowest level of input that is significant to the fair value calculation.
The fair value of all current financial instruments approximates carrying value because of the short-term nature of these instruments. We have variable and fixed rates on our long-term debt. The fair value of long-term debt with variable rates approximates carrying value as the interest rates of these amounts approximate market rates. We determine fair value on our fixed rate debt by using quoted market prices and current interest rates.
At January 31, 2015, the fair value of our $360.0 million aggregate principal amount of 10.75% senior secured notes that mature on June 1, 2019 (the "Senior Secured Notes") was $392.4 million, which is approximately $32.4 million above the carrying value of $360.0 million. Fair value for the Senior Secured Notes was determined using Level 2 inputs.
At January 31, 2015, the fair value of our fixed rate mortgage due February 1, 2037 was $7.8 million, which was approximately $1.4 million above the carrying value of $6.4 million. Fair value for the fixed rate mortgage was determined using Level 2 inputs.
Goodwill
Goodwill is tested for impairment at least annually at the operating segment level; we have only one operating segment and we do not have a reporting unit that exists below our operating segment. If the implied fair value of goodwill is lower than its carrying amount, goodwill impairment is indicated and goodwill is written down to its implied fair value. We assess the business enterprise value using a combination of the income approach and market approach to determine the fair value of the Company to be compared against the carrying value of net assets. The income approach, using the discounted cash flow method, includes key factors used in the valuation of the Company (a Level 3 valuation) which include, but are not limited to, management's plans for future operations, recent operating results, income tax rates, and discounted projected future cash flows. Material assumptions used in our impairment analysis include: (1) cash flow projections for ten years assuming positive sales growth in the high teens (15%+) for the next 1 to 5 years with years 6 through 10 linearly trended to a normalized annual level of 3%; (2) terminal year sales growth rates of 3%; and (3) discount rates of 13.5% based on our weighted average cost of capital adjusted for risks associated with operations. The projected high sales growth is based on our plans to open 20 new stores in fiscal year 2016 and at least 20 new stores in fiscal year 2017 along with similar new store growth trends expected for the foreseeable future. Sales growth from comparable stores was assumed to be in the low single digits.
As of January 31, 2015, the fair value of our operating segment would have to decline by more than 5% to be considered for potential impairment. No impairment of goodwill was recognized during the fiscal years ended January 31, 2015 or January 25, 2014. However, the use of different assumptions, estimates or judgments with respect to the estimation of the projected future cash flows and the determination of the discount rate and sales growth rate used to calculate the net present value of projected future cash flows could materially increase or decrease our estimates of fair value. We believe our estimates are appropriate based upon current market conditions and the best information available at the assessment date. However, future impairment charges could be required if we do not achieve our current net sales and profitability projections, which would occur if we are not able to meet our new store growth targets, or the weighted average cost of capital increases.
F-10
At Home Group Inc.
Notes to Consolidated Financial Statements (Continued)
January 25, 2014 and January 31, 2015
1. Nature of Operations and Summary of Significant Accounting Policies (Continued)
Impairment of Long-Lived and Indefinite-Lived Assets
We evaluate the recoverability of the carrying value of long-lived assets whenever events or changes in circumstances indicate their carrying amount may not be recoverable. Our evaluation compares the carrying value of the assets with their estimated future undiscounted cash flows expected to result from the use and eventual disposition of the assets. We evaluate long-lived intangible assets at an individual store level, which is the lowest level of identifiable cash flows. We evaluate corporate assets or other long-lived assets that are not store-specific at the consolidated level.
To estimate store-specific future cash flows, we make assumptions about key store variables, including sales, growth rate, gross margin, payroll and other controllable expenses. For stores that are owned by us and do not meet the initial criteria are further evaluated taking into consideration the fair market value of the property compared to the carrying value of the assets. Furthermore, management considers other factors when evaluating stores for impairment, including the individual store's execution of its operating plan and other local market conditions. Our estimates are subject to uncertainty and may be affected by a number of factors outside our control, including general economic conditions and the competitive environment.
An impairment is recognized once all the factors noted above are taken into consideration and it is determined that the carrying amount of the store's assets are not recoverable. The impairment loss would be recognized in the amount by which the carrying amount of a long-lived asset exceeds its fair value, excluding assets that can be redeployed. No impairment of long-term assets was recognized during the fiscal years ended January 25, 2014 or January 31, 2015.
We test indefinite-lived trade name intangible assets annually for impairment or more frequently if impairment indicators arise. If the fair value of the indefinite-lived intangible asset is lower than its carrying amount, the asset is written down to its fair value. During fiscal year 2014, we launched a rebranding initiative that resulted in the conversion of the then existing "Garden Ridge" trade name to the new trade name "At Home". We performed an impairment analysis of the indefinite-lived trade name immediately before the conversion and, as a result, recognized a $37.5 million trade name impairment during the fiscal year ended January 25, 2014. The fair value of our trade name (a Level 3 valuation) was calculated using a relief-from-royalty approach, which assumes the value of the trade name is the discounted cash flows of the amount that would be paid by a hypothetical market participant had they not owned the trade name and instead licensed the trade name from another company. The remaining value of the Garden Ridge trade name of $4.0 million was reclassified as a definite-lived intangible asset and amortized over the period of the conversion to "At Home", which we estimated to be nine months. As of January 31, 2015, the Garden Ridge trade name definite-lived intangible asset is fully amortized and the carrying value of the At Home trade name was approximately $0.9 million.
Debt Issuance Costs
Debt issuance costs are costs incurred in connection with obtaining or modifying financing arrangements. These costs are capitalized and amortized over the term of the respective debt agreements. Total amortization expense related to debt issuance costs was approximately $1.4 million and $1.6 million for the fiscal years ended January 25, 2014 and January 31, 2015, respectively.
F-11
At Home Group Inc.
Notes to Consolidated Financial Statements (Continued)
January 25, 2014 and January 31, 2015
1. Nature of Operations and Summary of Significant Accounting Policies (Continued)
Deferred Rent
We recognize free rent periods, tenant improvement allowances and standard rent increases contained in our leases on a straight-line basis over the expected lease term, beginning when we first take possession of the property and including renewal option periods in those instances where exercising such options is reasonably assured. For leases where we are considered to be the owner of the construction project and receive tenant improvement allowances, we record these amounts received as a component of the financing obligation liability. (See Note 7—Financing Obligations)
Insurance Liabilities
For the period from December 1, 2013 through January 31, 2015, we were fully insured for workers' compensation and commercial general liability claims. Prior to that period, we used a combination of commercial insurance and self-insurance for workers' compensation and commercial general liability claims and purchased insurance coverage that limited our aggregate exposure for individual claims to $250,000 per workers' compensation and commercial general liability claim.
We utilized a combination of commercial insurance and self-insurance for employee-related health care plans. The cost of our health care plan is borne in part by our employees. We purchased insurance coverage that limited our aggregate exposure for individual claims to $175,000 per employee-related health care claim.
Health care reserves are based on actual claims experience and an estimate of claims incurred but not reported. Reserves for commercial general liability and workers' compensation are determined through the use of actuarial studies. Due to the judgments and estimates utilized in determining these reserves, they are subject to a high degree of variability. In the event our insurance carriers are unable to pay claims submitted to them, we would record a liability for such estimated payments we expect to incur.
Revenue Recognition
Revenue from sales of our merchandise is recognized when the customer takes possession of the merchandise. Revenue is presented net of sales taxes collected. We allow for merchandise to be returned within 60 days from the purchase date and provide a reserve for estimated returns. We use historical customer return behavior to estimate our reserve requirements, which are accounted for as a reduction in revenue; we also reduce cost of sales to reflect our estimates of the inventory cost of products that will be returned. As of January 25, 2014 and January 31, 2015, our sales returns reserves were approximately $0.3 million and $0.7 million, respectively.
We record a gift card liability on the date we issue the gift card to the customer. We record revenue and reduce the gift card liability as the customer redeems the gift card. As of January 25, 2014 and January 31, 2015, our gift card liability was approximately $0.7 million and $1.2 million, respectively. In addition, we recognize gift card breakage as revenue after 60 months of non-use. We recognized revenue of approximately $0.1 million for each of the fiscal years ended January 25, 2014 and January 31, 2015, respectively, related to such gift card balances.
Cost of Sales
Cost of sales are included in merchandise inventories and expensed as the merchandise is sold. We include the following expenses in cost of sales:
- •
- cost of merchandise, net of inventory shrinkage, damages and vendor allowances;
F-12
At Home Group Inc.
Notes to Consolidated Financial Statements (Continued)
January 25, 2014 and January 31, 2015
1. Nature of Operations and Summary of Significant Accounting Policies (Continued)
- •
- inbound freight and internal transportation costs such as distribution center-to-store freight costs;
- •
- costs of operating our distribution center, including labor, occupancy costs, supplies, and depreciation; and
- •
- store occupancy costs including rent, insurance, taxes, common area maintenance, utilities, repairs, maintenance and depreciation.
We record rent expense on a straight-line basis over the term of the lease beginning with the date we take possession of or control the physical access to the premises. We record tenant improvement allowances as a liability and adjust the liability on a straight-line basis as a reduction to rent expense over the lease term beginning with the date we take possession of or control the physical access to the premises.
Selling, General and Administrative Expenses
Selling, general and administrative expenses include payroll, benefits and other personnel expenses for corporate and store employees, including stock-based compensation expense, consulting, legal and other professional services expenses, advertising expenses, occupancy costs for our corporate headquarters and various other expenses.
Store Pre-Opening Costs
We expense pre-opening costs for new stores as they are incurred. During the fiscal years ended January 25, 2014 and January 31, 2015, store pre-opening costs were approximately $2.0 million and $8.2 million, respectively. Store pre-opening costs, such as occupancy expenses, are included in cost of sales and expenses, such as advertising and labor, are included in selling, general and administrative expenses.
Advertising
Advertising costs, which include billboard, newspaper, radio and other advertising mediums, are expensed as incurred and included in selling, general and administrative expenses in the accompanying consolidated statements of operations. Total advertising expenses were approximately $2.0 million and $8.1 million for the fiscal years ended January 25, 2014 and January 31, 2015, respectively.
Stock-Based Compensation
We account for stock-based compensation in accordance with ASC 718, (Topic 718, "Compensation—Stock Compensation"), which requires all stock-based payments to employees, including grants of employee stock options, to be recognized in the consolidated financial statements over the requisite service period. Compensation expense based upon the fair value of awards is recognized on a straight line basis, over the requisite service period for awards that actually vest. Stock-based compensation expense is recorded in selling, general and administrative expenses in the consolidated statements of operations.
F-13
At Home Group Inc.
Notes to Consolidated Financial Statements (Continued)
January 25, 2014 and January 31, 2015
1. Nature of Operations and Summary of Significant Accounting Policies (Continued)
We estimate fair value of each stock option grant on the date of grant based upon the Black-Scholes option pricing model. This model requires various significant judgmental assumptions in order to derive a final fair value determination for each type of award including the following:
- •
- Expected term—The expected term of the options represents the period of
time between the grant date of the options and the date the options are either exercised or canceled.
- •
- Expected volatility—The expected volatility is calculated based on the
historical volatility of the common stock for comparable companies.
- •
- Expected dividend yield—The expected dividend yield is based on our
expectation of not paying dividends on its common stock for the foreseeable future.
- •
- Risk-free interest rate—The risk-free interest rate is the average of the 3-year and 5-year U.S. Treasury rate in effect at the time of grant and with a maturity that approximates the expected term.
All grants of our stock options have an exercise price equal to or greater than the fair market value of our common stock on the date of grant. Because we are privately held and there is no public market for our common stock, the fair value of our equity was approved by our Board at the time option grants are awarded. In estimating the fair value of our common stock, we consider factors we believe are material to the valuation process including, but not limited to, our actual and projected financial results, risks and prospects and economic and market conditions. Our valuations utilized projections of our future performance, estimates of our weighted average cost of capital, and metrics based on the performance of a peer group of similar companies, including valuation multiples and stock price volatility.
We believe the combination of these methods provides an appropriate estimate of our expected fair value. We have considered the valuation analyses to determine the best estimate of the fair value of our common stock at each stock option grant date.
Income Taxes
The provision for income taxes is accounted for under the asset and liability method prescribed by ASC 740 (Topic 740, "Income Taxes"). Deferred tax assets and liabilities are recognized for the future tax consequences attributable to differences between the financial statement carrying amounts of existing assets and liabilities and their respective tax bases, operating losses and tax credit carryforwards. Deferred tax assets and liabilities are measured using the enacted tax rates expected to apply to taxable income in the years in which those temporary differences are expected to be recovered or settled. The effect on deferred tax assets and liabilities of a change in tax rates is recognized in income in the period the tax rate changes are enacted. We record a valuation allowance to reduce the carrying amounts to the amount that is believed more likely than not to be realized.
We recognize the tax benefit from an uncertain tax position only if it is more likely than not the tax position will be sustained on examination by the taxing authorities, based on the technical merits of the position. The tax benefits recognized in the financial statements from such positions are then measured based on the largest benefit that has a greater than 50% likelihood of being realized upon settlement.
F-14
At Home Group Inc.
Notes to Consolidated Financial Statements (Continued)
January 25, 2014 and January 31, 2015
1. Nature of Operations and Summary of Significant Accounting Policies (Continued)
Recent Accounting Pronouncements
In May 2014, the Financial Accounting Standards Board issued Accounting Standards Update No. 2014-09, "Revenue from Contracts with Customers" ("ASU 2014-09"). ASU 2014-09 supersedes the revenue recognition requirements in "Topic 605, Revenue Recognition", and requires entities to recognize revenue in a way that depicts the transfer of promised goods or services to customers in an amount that reflects the consideration to which the entity expects to be entitled to in exchange for those goods or services. ASU 2014-09 is effective for annual reporting periods beginning after December 15, 2016, including interim periods within that reporting period and is to be applied retrospectively, with early application not permitted. However, on April 1, 2015, the FASB proposed a deferral of the effective date of the standard by one year, but the proposal would also permit entities to adopt ASU 2014-09 as of the current effective date. We are currently evaluating the impact of ASU 2014-09.
In April 2015, the FASB issued ASU 2015-03, "Interest—Imputation of Interest (Subtopic 835-30): Simplifying the Presentation of Debt Issuance Costs", in order to simplify the presentation of debt issuance costs ("ASU 2015-03"). The ASU requires debt issuance costs to be presented on the balance sheet as a direct deduction from the related debt liability rather than an asset. ASU 2015-03 is effective for public companies for annual periods beginning after December 15, 2015, and interim periods thereafter, with early adoption permitted. The guidance also requires retrospective application to all prior periods presented. We are currently evaluating the impact of ASU 2015-03.
2. Property and Equipment
Property and equipment as of January 25, 2014 and January 31, 2015, consists of the following (in thousands):
| |
2014 | 2015 | |||||
|---|---|---|---|---|---|---|---|
Land |
$ | 22,026 | $ | 40,414 | |||
Buildings |
19,725 | 56,174 | |||||
Computer hardware and software |
4,374 | 9,170 | |||||
Equipment, furniture and fixtures |
18,059 | 50,555 | |||||
Leasehold improvements |
36,951 | 74,797 | |||||
Construction in progress |
38,815 | 25,486 | |||||
| | | | | | | | |
|
139,950 | 256,596 | |||||
Less: accumulated depreciation and amortization |
(28,164 | ) | (36,512 | ) | |||
| | | | | | | | |
Property and equipment, net |
$ | 111,786 | $ | 220,084 | |||
| | | | | | | | |
| | | | | | | | |
| | | | | | | | |
Depreciation and amortization expense for the fiscal years ended January 25, 2014 and January 31, 2015 totaled approximately $13.1 million and $23.3 million, respectively. Approximately $11.9 million and $18.0 million of depreciation and amortization expense is included in cost of sales for the fiscal years ended January 25, 2014 and January 31, 2015, respectively. In addition, depreciation and amortization expense for the fiscal year ended January 31, 2015 includes $4.0 million in amortization expense related to our former Garden Ridge trade name definite-lived intangible asset.
3. Sale-Leaseback Transactions
In October 2013, we sold our distribution center and corporate headquarters property located at 1600 East Plano Parkway, Plano, Texas for $35.8 million, resulting in a net gain of $27.6 million. The property continues to serve as our distribution center and corporate headquarters through a leaseback
F-15
At Home Group Inc.
Notes to Consolidated Financial Statements (Continued)
January 25, 2014 and January 31, 2015
3. Sale-Leaseback Transactions (Continued)
of the property entered into contemporaneously with the closing of the sale. Cumulative annual rent under the lease is $2.5 million, subject to annual escalations. The lease is being accounted for as an operating lease. The net gain on the sale of the property was deferred and is included in deferred rent liabilities in the accompanying consolidated balance sheets. The gain is amortized to rent expense on a straight-line basis through the lease term, or October 2033. The sale of this property is being treated as a like-kind exchange for U.S. federal income tax purposes in accordance with Section 1031 of the Code.
In September 2014, we sold four of our properties in Raleigh, North Carolina, Mesa, Arizona, Lubbock, Texas and Louisville, Kentucky for a total of $40.9 million, resulting in a net gain of $17.1 million. Contemporaneously with the closing of the sale, we entered into four leases, pursuant to which we leased back the properties for cumulative annual rent of $2.8 million, subject to annual escalations. The leases on the Raleigh, Lubbock and Louisville properties are being accounted for as operating leases. The lease on the Mesa property is being accounted for as a financing transaction in accordance with ASC 840-40-55 (Topic 840, "Leases") due to a prohibited form of continuing involvement related to an existing sublease on that property (See Note 7—Financing Obligations). The $17.1 million net gain associated with the sale of these properties has been deferred and is included in deferred rent liabilities in the accompanying consolidated balance sheets. The gain will be amortized to rent expense on a straight-line basis through the lease terms, or September 2029. The sale of the properties located in Lubbock and Louisville is being treated as like-kind exchanges for U.S. federal income tax purposes in accordance with Section 1031 of the Code.
In January 2015, we sold our property located in Omaha, Nebraska for approximately $8.0 million, resulting in a net gain of $2.7 million. Contemporaneously with the closing of the sale, we entered into a lease, pursuant to which we leased back the property for cumulative annual rent of $0.5 million, subject to annual escalations. The lease is being accounted for as an operating lease. The net gain on the sale of the properties has been deferred and is included in deferred rent liabilities in the accompanying consolidated balance sheets. The gain will be amortized to rent expense on a straight-line basis through the lease terms, or January 2030.
4. Accrued Liabilities
Accrued liabilities at January 25, 2014 and January 31, 2015, consist of the following (in thousands):
| |
2014 | 2015 | |||||
|---|---|---|---|---|---|---|---|
Inventory in-transit |
$ | 10,957 | $ | 17,486 | |||
Accrued payroll and other employee-related liabilities |
5,820 | 8,227 | |||||
Accrued taxes, other than income |
6,703 | 7,920 | |||||
Accrued interest |
6,507 | 6,599 | |||||
Insurance liabilities |
4,167 | 3,306 | |||||
Construction costs |
2,694 | 1,064 | |||||
Other |
6,172 | 12,077 | |||||
| | | | | | | | |
Total accrued liabilities |
$ | 43,020 | $ | 56,679 | |||
| | | | | | | | |
| | | | | | | | |
| | | | | | | | |
5. Revolving Line of Credit
In October 2011, At Home III and At Home Stores (collectively, the "ABL Borrower"), entered into an Asset-Based Lending Credit Facility ("ABL Facility") which provided for cash borrowings or issuances of letters of credit based on defined percentages of eligible inventory and
F-16
At Home Group Inc.
Notes to Consolidated Financial Statements (Continued)
January 25, 2014 and January 31, 2015
5. Revolving Line of Credit (Continued)
credit card receivable balances up to a maximum facility limit of $80.0 million. In May 2012, the ABL Borrower entered into the First Amendment to the Credit Agreement, which amended the ABL Credit Agreement to, among other things, permit the Senior Secured Notes to be issued. In May 2013, the ABL Borrower entered into the Second Amendment to the Credit Agreement, which amended the ABL Credit Agreement to increase the facility limit to $90.0 million, extend the maturity from October 2016 to May 2018, reduce the interest rate and fees and amend various other covenants and related definitions. In July 2014, the ABL Borrower entered into the Third Amendment to the Credit Agreement which further amended the ABL Credit Agreement to modify certain financial terms and other covenants. Such modifications included increasing the facility from $90.0 million to $140.0 million; extending the scheduled maturity date from May 2018 to July 2019; reducing the margin on borrowings by 0.25%; providing for the release of certain real property collateral in specified circumstances; adding Wells Fargo Bank, National Association as a new lender under the ABL Facility and amending various other covenants, terms and related definitions to provide additional flexibility with the ABL Facility. The ABL Facility is secured by substantially all of the ABL Borrower's assets with a first lien on certain assets, including primarily inventory and accounts receivable and related assets (the "ABL Priority Collateral"), and a second lien on all non-ABL Priority Collateral. The ABL Facility contains limitations customarily found in such agreements on the incurrence of additional debt, investments, dividends and any sale or merger of the Company and contains certain financial covenants.
Interest on borrowings under the ABL Credit Agreement is computed based on our average daily availability at our option: (x) the higher of (i) the Federal Funds Rate plus 1/2 of 1.00%, (ii) the bank's prime rate, and (iii) LIBOR plus 1.00%, plus in each case, an applicable margin of 0.25% to 0.75% or (y) the bank's LIBOR rate plus an applicable margin of 1.25% to 1.75%. The interest rate was 4.0% and 3.75% at January 25, 2014 and January 31, 2015, respectively.
As of January 31, 2015, approximately $67.4 million was outstanding under the ABL Credit Agreement, approximately $1.4 million was outstanding under letters of credit and we had availability of approximately $46.9 million. As of January 31, 2015, we were in compliance with all covenants prescribed in the ABL Credit Agreement.
The ABL Facility includes restrictions on the ability of the ABL Borrower and the subsidiary guarantors to incur additional liens and indebtedness, make investments and dispositions, pay dividends to At Home II or enter into other transactions, among other restrictions, in each case subject to certain exceptions. Under the ABL Facility, the ABL Borrower and the subsidiary guarantors are permitted to pay dividends to At Home II, (a) so long as after giving effect to such payment, (i) availability is equal to or greater than 15% of the loan cap (i.e., the lesser of (x) the aggregate lender commitments under the ABL Facility and (y) the borrowing base) and (ii) if availability is less than 20% of the loan cap, the consolidated fixed charge coverage ratio is equal to or greater than 1.0 to 1.0, and (b) pursuant to certain other limited exceptions.
F-17
At Home Group Inc.
Notes to Consolidated Financial Statements (Continued)
January 25, 2014 and January 31, 2015
6. Long-Term Debt
Long-term debt at January 25, 2014 and January 31, 2015, consists of the following (in thousands):
| |
2014 | 2015 | |||||
|---|---|---|---|---|---|---|---|
Senior Notes |
$ | 360,000 | $ | 360,000 | |||
Note payable, bank(a) |
6,502 | 6,376 | |||||
Note payable, bank(b) |
— | 3,838 | |||||
Note payable, bank(c) |
3,353 | 3,066 | |||||
Note payable, bank(d) |
— | 2,629 | |||||
Note payable, bank(e) |
2,496 | 2,352 | |||||
| | | | | | | | |
Total debt |
372,351 | 378,261 | |||||
Less: current maturities |
557 | 758 | |||||
| | | | | | | | |
Long-term debt |
$ | 371,794 | $ | 377,503 | |||
| | | | | | | | |
| | | | | | | | |
| | | | | | | | |
- (a)
- Matures
February 1, 2037; $42,697 payable monthly, including interest at 5.90%; secured by the location's land and building.
- (b)
- Matures
July 22, 2039; $19,174 payable monthly, including interest of 3.15% plus the index rate (1 month LIBOR rate) which is currently
3.306%; secured by the location's land and building.
- (c)
- Matures
November 24, 2023; $34,092 payable monthly, including interest at prime plus 0.50% (3.75% at January 31, 2015); secured by the
location's land and building.
- (d)
- Matures
August 15, 2039; $13,105 payable monthly, including interest at 3.15% plus the index rate (1 month LIBOR rate) which is currently
3.307%; secured by the location's land and building.
- (e)
- Matures April 7, 2026; $23,798 payable monthly, including interest at 5.75% until April 7, 2016, when such interest rate will change to prime plus 0.50%; secured by the location's land and building.
As of January 31, 2015, aggregate annual maturities of long-term debt are as follows (in thousands):
| |
2015 | |||
|---|---|---|---|---|
2016 |
$ | 758 | ||
2017 |
791 | |||
2018 |
830 | |||
2019 |
868 | |||
2020 |
360,908 | |||
Thereafter |
14,106 | |||
| | | | | |
|
$ | 378,261 | ||
| | | | | |
| | | | | |
| | | | | |
10.75% Senior Notes Due 2019
In May 2012, our wholly-owned subsidiary, At Home III, issued $360.0 million aggregate principal amount of Senior Secured Notes. The terms of the Senior Secured Notes are governed by the Indenture, dated May 16, 2012 (the "Indenture"), among At Home III, the guarantors party thereto
F-18
At Home Group Inc.
Notes to Consolidated Financial Statements (Continued)
January 25, 2014 and January 31, 2015
6. Long-Term Debt (Continued)
and Wells Fargo, National Association, as trustee (the "Trustee"). Interest is payable semi-annually in arrears on each June 1 and December 1, commencing on December 1, 2012.
The Senior Secured Notes are fully and unconditionally guaranteed, jointly and severally, on a senior secured basis by each of At Home III's existing and future domestic restricted subsidiaries (other than certain immaterial subsidiaries) that are wholly owned or guarantee any of At Home III's or its guarantors' indebtedness. The Senior Secured Notes and the related guarantees are secured, subject to certain exceptions, by (i) a first priority lien on non-ABL Priority Collateral, including first priority liens on any capital stock held by At Home III or a guarantor, and (ii) a second priority lien on the ABL Priority Collateral. The Senior Secured Notes and the related guarantees are At Home III's and the guarantors' senior secured obligations. The Senior Secured Notes rank pari passu in right of payment with all of At Home III's and the guarantors' existing and future senior indebtedness and senior in right of payment to all of At Home III's and the guarantors' subordinated indebtedness. The Senior Secured Notes are effectively subordinated to indebtedness incurred under At Home III's ABL Facility to the extent of the value of the ABL Priority Collateral.
In August 2014, the Indenture was amended to permit an additional $100.0 million of debt and lien capacity to incur debt secured by already owned or thereafter acquired real property and related assets; extend the time period within which to mortgage real property to secure the Senior Secured Notes; provide for the release of certain collateral in connection with the incurrence of specified permitted debt, and amend the definition of "Excluded Assets" to include real property subject to a lien permitted under the Indenture.
At any time prior to June 1, 2015, At Home III may redeem all or a part of the Senior Secured Notes at a redemption price equal to 100% of the principal amount of the Senior Secured Notes redeemed plus the Applicable Premium (as defined in the Indenture) and accrued and unpaid interest and Additional Interest (as defined in the Indenture), if any, to the date of redemption, subject to the right of holders of record on the relevant record date to receive interest due on the relevant interest payment date. On or after June 1, 2015, At Home III may redeem the Senior Secured Notes, in whole or in part, at a premium declining from 108.063%. In addition, At Home III is entitled to redeem up to 35% of the aggregate principal amount of the Senior Secured Notes before June 1, 2015 with the net proceeds that is raised in equity offerings at a redemption price equal to 110.75% of the principal amount of the Senior Secured Notes being redeemed plus accrued and unpaid interest, if any, to the date of redemption.
Upon a change in control, At Home III is required to offer to purchase all of the Senior Secured Notes at a price in cash equal to 101% of the aggregate principal amount thereof, plus accrued and unpaid interest.
The Indenture contains covenants limiting, among other things, At Home III's ability and the ability of its restricted subsidiaries to:
- •
- incur additional debt;
- •
- pay dividends or distributions on its capital stock or repurchase its capital stock, subject to certain exceptions;
- •
- issue stock of subsidiaries;
- •
- make certain investments;
- •
- create liens on its assets to secure debt;
- •
- enter into transactions with affiliates;
F-19
At Home Group Inc.
Notes to Consolidated Financial Statements (Continued)
January 25, 2014 and January 31, 2015
6. Long-Term Debt (Continued)
- •
- merge or consolidate with another company; or
- •
- sell or otherwise transfer assets.
The Indenture also provides for events of default, which, if certain of them occur, would permit the Trustee or holders of at least 30% in principal amount of the then outstanding Senior Secured Notes to declare the principal, premium, if any, interest and any other monetary obligations on all the then outstanding Senior Secured Notes to be due and payable immediately.
As of January 31, 2015, we were in compliance with all covenants prescribed in the Indenture.
In accordance with ASC 470 (Topic 470, "Debt"), we are amortizing $10.2 million in debt issuance costs as interest expense over the life of the Senior Secured Notes using the effective interest method.
The Indenture contains covenants limiting, among other things, At Home III's ability and the ability of its restricted subsidiaries to incur additional debt, pay dividends or distributions on its capital stock to any direct or indirect parent company (including At Home Group) or repurchase its capital stock, issue stock of subsidiaries, make certain investments, create liens on its assets to secure debt, enter into transactions with affiliates, merge or consolidate with another company or sell or otherwise transfer assets, in each case subject to certain exceptions. Under the Indenture, At Home III is permitted to pay dividends to any direct or indirect parent company (including At Home Group) (a) up to an amount equal to (i) a basket that builds based on 50% of At Home III's Consolidated Net Income (as defined in the Indenture) and certain other amounts, subject to various conditions including compliance with a fixed charge coverage ratio of 2.0 to 1.0, plus (ii) $10 million and (b) in certain additional limited amounts, subject to certain limited exceptions.
The restricted net assets of At Home Group's consolidated subsidiaries was $361.4 million as of January 31, 2015.
7. Financing Obligations
In some cases, the assets we lease require construction in order to ready the space for its intended use and, in certain cases, we are involved in the construction of leased assets. The construction period typically begins when we execute our lease agreement with the landlord and continues until the space is substantially complete and ready for its intended use. In accordance with ASC 840-40-55, we must consider the nature and extent of our involvement during the construction period and, in some cases, our involvement results in our being considered the accounting owner of the construction project. By completing the construction of key structural components of a leased building, we are deemed to have participated in the construction of the landlord asset. In such cases, we capitalize the landlord's construction costs, including the value of costs incurred up to the date we execute our lease and costs incurred during the remainder of construction period, as such costs are incurred. Additionally, ASC 840-40-55 requires us to recognize a financing obligation for construction costs incurred by the landlord. Once construction is complete, we are required to perform a sale-leaseback analysis pursuant to ASC 840-40 to determine if we can remove the landlord's assets and associated financing obligations from our consolidated balance sheet. In certain leases, we maintain various forms of "prohibited continuing involvement" in the property, thereby precluding us from derecognizing the asset and associated financing obligations following the construction completion. In those cases, we will continue to account for the landlord's asset as if we are the legal owner, and the financing obligation, similar to other debt, until the lease expires or is modified to remove the continuing involvement that prohibits derecognition. Once derecognition is permitted, we would be
F-20
At Home Group Inc.
Notes to Consolidated Financial Statements (Continued)
January 25, 2014 and January 31, 2015
7. Financing Obligations (Continued)
required to account for the lease as either operating or capital in accordance with ASC 840. As of January 31, 2015 we have not derecognized any landlord assets or associated financing obligations.
In September 2014, we sold our property in Mesa, Arizona and contemporaneously with the closing of the sale, we entered into a lease pursuant to which we leased back the property (see Note 3—Sale-Leaseback Transactions). At the time of the sale-leaseback transaction, a prohibited form of continuing involvement existed related to an existing sublease with a tenant for a portion of the property. In accordance with ASC 840, the lease was accounted for as a financing transaction with the property remaining on our books at its then current carrying amount, the proceeds received for the sale of the property were reflected as a financing obligation, and future rental payments to the landlord will be treated as debt service and applied to interest and principal.
Future minimum annual rental commitments for leases classified as financing obligations as of January 31, 2015, are as follows (in thousands):
| |
2015 | |||
|---|---|---|---|---|
2016 |
$ | 1,482 | ||
2017 |
1,901 | |||
2018 |
1,916 | |||
2019 |
1,931 | |||
2020 |
1,946 | |||
Thereafter |
13,132 | |||
| | | | | |
|
$ | 22,308 | ||
| | | | | |
| | | | | |
| | | | | |
8. Related Party Transactions
We pay management fees of approximately $2.6 million annually to our controlling shareholder, AEA Investors LP ("AEA"), an affiliate of our controlling shareholder, and affiliated co-investors. We recognized approximately $2.7 million of annual management fees and reimbursed expenses during each of the fiscal years ended January 25, 2014, and January 31, 2015. In addition, at January 31, 2015, debt investment funds affiliated with AEA held $20.0 million in principal of our outstanding Senior Secured Notes.
We pay management fees of approximately $0.9 million annually to Starr Investment Holdings, LLC ("Starr Investments"), an affiliated co-investor. We recognized approximately $0.9 million of annual management fees during each of the fiscal years ended January 25, 2014 and January 31, 2015.
In addition, Starr Indemnity & Liability Company, an affiliate of Starr Investments, is an underwriter for our general liability and workers' compensation insurance policies that were effective December 1, 2013. The total cost of the policies was approximately $2.3 million, of which approximately $0.4 million and $1.9 million was paid during the fiscal years ended January 25, 2014 and January 31, 2015, respectively. These policies expired on December 1, 2014 and were replaced with policies underwritten by an unrelated party.
Affiliates of AEA own a significant equity position in Dematic Corporation, an external vendor that designs, develops and delivers solutions that optimize a company's supply chain, improve performance and increase productivity through intelligent warehouse logistics and materials handling solutions. In February 2014, we executed an agreement with Dematic Corporation for the installation of a system to assist in the automation of our distribution center. During the fiscal year ended January 31, 2015, we paid Dematic Corporation approximately $7.2 million under the agreement which is primarily recorded in property and equipment, net in the accompanying consolidated balance sheet as of January 31, 2015.
F-21
At Home Group Inc.
Notes to Consolidated Financial Statements (Continued)
January 25, 2014 and January 31, 2015
8. Related Party Transactions (Continued)
Merry Mabbett Inc. ("MMI") is owned by Merry Mabbett Dean, who is the mother of Lewis L. Bird III, our Chief Executive Officer. During fiscal year 2014 and fiscal year 2015, Ms. Dean, through MMI, provided certain design services to us, including design for our home office, as well as design in our stores. In addition, through MMI, we purchased certain fixtures, furniture and equipment that is now owned and used by us in our home office, new store offices or in the product vignettes in the stores. During the fiscal years ended January 25, 2014 and January 31, 2015, we paid MMI approximately $0.7 million and $0.4 million, respectively, for fixtures, furniture and equipment and design related services.
9. Income Taxes
Our income tax provision for the fiscal years ended January 25, 2014 and January 31, 2015 was as follows (in thousands):
| |
2014 | 2015 | |||||
|---|---|---|---|---|---|---|---|
Current income tax expense |
|||||||
Federal |
$ | 5,119 | $ | 4,552 | |||
State |
2,197 | 1,797 | |||||
Deferred income tax expense (benefit) |
|||||||
Federal |
(9,032 | ) | (1,471 | ) | |||
State |
1,775 | (521 | ) | ||||
| | | | | | | | |
Income tax provision |
$ | 59 | $ | 4,357 | |||
| | | | | | | | |
| | | | | | | | |
| | | | | | | | |
Deferred tax assets and liabilities are determined based on the estimated future tax effects of the difference between the financial statement and tax basis of asset and liability balances using statutory tax rates. Tax effects of temporary differences that give rise to significant components of the deferred tax assets and liabilities are as follows at January 25, 2014 and January 31, 2015, respectively (in thousands):
| |
2014 | 2015 | |||||
|---|---|---|---|---|---|---|---|
Deferred tax assets |
|||||||
Inventory |
$ | 1,524 | $ | 2,006 | |||
Accruals |
3,319 | 5,135 | |||||
Deferred rent |
1,794 | 3,107 | |||||
Net operating losses |
409 | 286 | |||||
Deferred gains |
10,146 | 16,897 | |||||
Deferred compensation |
1,738 | 3,327 | |||||
Other, net |
1,789 | 1,188 | |||||
| | | | | | | | |
Total deferred tax assets |
20,719 | 31,946 | |||||
Less: Valuation allowance |
(5,952 | ) | (6,580 | ) | |||
| | | | | | | | |
Deferred tax assets, net of valuation |
14,767 | 25,366 | |||||
| | | | | | | | |
Deferred tax liabilities |
|||||||
Property and equipment |
(7,409 | ) | (18,513 | ) | |||
Debt cancellation income |
(5,519 | ) | (4,422 | ) | |||
Trade name |
(1,413 | ) | (13 | ) | |||
| | | | | | | | |
Total deferred tax liabilities |
(14,341 | ) | (22,948 | ) | |||
| | | | | | | | |
Net deferred tax asset/(liability) |
$ | 426 | $ | 2,418 | |||
| | | | | | | | |
| | | | | | | | |
| | | | | | | | |
F-22
At Home Group Inc.
Notes to Consolidated Financial Statements (Continued)
January 25, 2014 and January 31, 2015
9. Income Taxes (Continued)
We are required to assess the available positive and negative evidence to estimate if sufficient future income will be generated to utilize deferred tax assets. A significant piece of negative evidence that we consider is cumulative losses (generally defined as losses before income taxes) incurred over the most recent three-year period. Such evidence limits our ability to consider other subjective evidence. As of January 25, 2014 and January 31, 2015, cumulative losses were incurred over the applicable three-year period.
Our valuation allowances totaled $6.0 million and $6.6 million as of January 25, 2014 and January 31, 2015, respectively. The amount of the deferred tax asset considered realizable could be adjusted if negative evidence, such as three-year cumulative losses, no longer exists and additional consideration is given to other subjective evidence.
We had approximately $11.7 million of federal net operating loss carryforwards at January 26, 2013. These net operating losses were fully utilized during the fiscal year ended January 25, 2014.
We had approximately $11.0 million and $8.0 million of state net operating loss carryforwards at January 25, 2014 and January 31, 2015, respectively. The state net operating losses begin to expire in fiscal year 2016.
The reconciliation between the actual income tax provision and the income tax provision calculated at the federal statutory tax rate for the fiscal years ended January 25, 2014 and January 31, 2015 is as follows (dollars in thousands):
| |
2014 | 2015 | |||||
|---|---|---|---|---|---|---|---|
Income tax (benefit) provision at the federal statutory rate |
$ | (7,778 | ) | $ | 1,372 | ||
Permanent differences |
38 | 55 | |||||
State income taxes, net of federal income tax effect |
2,479 | 1,276 | |||||
Change in unrecognized tax benefits |
736 | 678 | |||||
Change in valuation allowance |
4,668 | 1,027 | |||||
Tax credits |
(84 | ) | (55 | ) | |||
Other |
— | 4 | |||||
| | | | | | | | |
Income tax provision |
$ | 59 | $ | 4,357 | |||
| | | | | | | | |
| | | | | | | | |
| | | | | | | | |
Effective tax rate |
0.26 | % | 111.12 | % | |||
Uncertain Tax Positions
We operate in a number of tax jurisdictions and are subject to examination of its income tax returns by tax authorities in those jurisdictions who may challenge any item on these returns. Because the tax matters challenged by tax authorities are typically complex, the ultimate outcome of these challenges is uncertain. In accordance with ASC 740 (Topic 740, "Income Taxes"), we recognize the benefits of uncertain tax positions in our consolidated financial statements only after determining that it is more likely than not that the uncertain tax positions will be sustained.
The total amount of unrecognized tax benefits as of January 31, 2015 was $5.7 million, all of which would favorably impact the effective tax rate if resolved in our favor.
F-23
At Home Group Inc.
Notes to Consolidated Financial Statements (Continued)
January 25, 2014 and January 31, 2015
9. Income Taxes (Continued)
A reconciliation of the beginning and ending amount of unrecognized tax benefits as of January 25, 2014 and January 31, 2015 is as follows (in thousands):
| |
2014 | 2015 | |||||
|---|---|---|---|---|---|---|---|
Balance, beginning of period |
$ | 3,138 | $ | 3,551 | |||
Additions based on tax positions related to the current year |
649 | 2,858 | |||||
Subtractions based on tax positions related to the prior year |
(1 | ) | — | ||||
Expiration of statute of limitations |
(235 | ) | (689 | ) | |||
| | | | | | | | |
Balance, end of period |
$ | 3,551 | $ | 5,720 | |||
| | | | | | | | |
| | | | | | | | |
| | | | | | | | |
We recognize accrued interest and penalties related to unrecognized tax benefits in our provision for income taxes. As of January 25, 2014 and January 31, 2015, there was approximately $0.6 million and $0.6 million, respectively, in accrued penalties. As of January 25, 2014 and January 31, 2015, there was approximately $0.2 million and $0.3 million, respectively, in accrued interest. In addition, we recognized approximately $0.1 million in interest expense during the fiscal year ended January 31, 2015.
In the normal course of business, we are subject to examination by taxing authorities in major U.S. federal and U.S. state jurisdictions. The period subject to examination for our federal return is fiscal year 2014 since all prior years have been audited with no changes and fiscal year 2012 to fiscal year 2014 for all major state tax returns. We believe that an adequate provision has been made for any adjustments that may result from tax examinations. However, the outcome of tax audits cannot be predicted with certainty. If any issues addressed in our tax audits are resolved in a manner not consistent with management's expectations, we could be required to adjust the provision for income tax in the period such resolution occurs.
10. Commitments and Contingencies
Leases
We lease space for certain of our retail properties, our distribution center and corporate office pursuant to operating leases that expire at various dates through 2035. A number of the leases have renewal options for various periods of time at our discretion. We are typically responsible for taxes, utilities, insurance, repairs and maintenance for these retail properties. Certain leases require the payment of contingent rent based on a specified percentage of stores' gross sales, as defined in the lease agreement, and are subject to certain limitations. No contingent rent was required to be paid for the fiscal years ended January 25, 2014 and January 31, 2015. Rent expense for the fiscal years ended January 25, 2014 and January 31, 2015 totaled approximately $37.9 million and $42.9 million, respectively.
F-24
At Home Group Inc.
Notes to Consolidated Financial Statements (Continued)
January 25, 2014 and January 31, 2015
10. Commitments and Contingencies (Continued)
Future minimum annual rental commitments for all operating leases as of January 31, 2015, are as follows (in thousands):
| |
2015 | |||
|---|---|---|---|---|
2016 |
$ | 44,764 | ||
2017 |
43,523 | |||
2018 |
42,101 | |||
2019 |
40,840 | |||
2020 |
38,036 | |||
Thereafter |
212,806 | |||
| | | | | |
|
$ | 422,070 | ||
| | | | | |
| | | | | |
| | | | | |
Minimum future annual rent receivable under operating subleases as of January 31, 2015 is approximately $0.2 million. Lease rental income was approximately $0.4 million and $0.2 million for the fiscal years ended January 25, 2014 and January 31, 2015, respectively.
Litigation
We are subject to claims and lawsuits that arise primarily in the ordinary course of business. It is the opinion of management that the disposition or ultimate resolution of such claims and lawsuits will not have a material adverse effect on our consolidated financial position, results of operations or liquidity.
11. Employee Benefit Plan
Effective October 1, 2014, we sponsor a 401(k) Savings Plan for eligible employees. Participation in the 401(k) Savings Plan is voluntary and available to any employee who is at least 18 years of age and has completed six months of service. Participants may elect to contribute up to 80% of their compensation on a pre-tax basis and up to 10% on an after-tax basis. In accordance with the provisions of the 401(k) Savings Plan, we make a safe harbor matching cash contribution to the account of each participant in an amount equal to 100% of the participant's pre-tax contributions that do not exceed 3% of the participant's considered annual compensation plus 50% of the participant's pre-tax contributions between 3% and 5% of the participant's considered annual compensation. Matching contributions, and the actual earnings thereon, vest to the participants immediately. Our matching contribution expenses were $0.2 million for the fiscal year ended January 31, 2015.
12. Capital Stock
At January 31, 2015, the authorized capital of the Company consisted of 3,500,000 shares of capital stock comprising 1,000,000 shares of Class A common stock, 1,000,000 shares of Class B common stock, 1,000,000 shares of Class C common stock and 500,000 shares of preferred stock. All classes of stock have a par value of $0.01 per share. The holders of Class A common stock and Class B common stock have certain preferential rights with respect to cash dividends and upon liquidation of the Company. If, upon any liquidation or change of control of the Company, the distributable proceeds are not sufficient to pay in full the liquidation preference payable to the holders of the outstanding shares of Class A common stock and Class B common stock, then all shares of Class B common stock shall be converted into Class C common stock immediately prior to the closing of such liquidation or change of control and the distributable proceeds shall be distributed ratably to the holders of shares of Class A common stock in accordance with, and in amount no greater than, the aggregate liquidation preference payable to such holders. After payment in full of the amounts to holders of Class A
F-25
At Home Group Inc.
Notes to Consolidated Financial Statements (Continued)
January 25, 2014 and January 31, 2015
12. Capital Stock (Continued)
common stock and Class B common stock, any remaining distributable proceeds shall be distributed ratably amount the holders of the Class C common stock.
Upon the earlier of the fifth anniversary of the issue date or the completion of an initial public offering of the shares of Class C Common Stock pursuant to an effective registration statement filed under the Securities Act of 1933, as amended, in connection with an underwritten offering, each share of Class A common stock and Class B Common Stock outstanding at such time shall automatically convert into fully paid and non-assessable shares of Class C common stock. The number of shares of Class C common stock to which a holder of Class A common stock or Class B common stock, as applicable, is entitled shall be calculated on a one-to-one basis, where each share of converting stock will be converted into one share of Class C common stock.
13. Earnings Per Share
In accordance with ASC 260, (Topic 260, "Earnings Per Share"), basic earnings per share is computed by dividing net income (loss) available to common stockholders by the weighted average number of common shares outstanding for the period. Diluted earnings per share is computed by dividing net income (loss) available to common stockholders by the weighted average shares outstanding for the period and include the dilutive impact of potential shares from the exercise of stock options. Common equivalent shares are excluded from the computation if their effect is anti-dilutive.
The following table sets forth the calculation of basic and diluted earnings per share for the fiscal years ended January 25, 2014 and January 31, 2015 as follows (in thousands, except per share data):
| |
2014 | 2015 | |||||
|---|---|---|---|---|---|---|---|
Numerator: |
|||||||
Net loss |
$ | (22,283 | ) | $ | (436 | ) | |
| | | | | | | | |
| | | | | | | | |
| | | | | | | | |
Denominator: |
|||||||
Weighted average common share outstanding—basic |
396,674 | 396,674 | |||||
Effect of dilutive securities: |
|||||||
Stock options |
— | — | |||||
| | | | | | | | |
Weighted average common share outstanding—diluted |
396,674 | 396,674 | |||||
| | | | | | | | |
| | | | | | | | |
| | | | | | | | |
Per common share: |
|||||||
Basic net loss per common share |
$ | (56.17 | ) | $ | (1.10 | ) | |
Diluted net loss per common share |
$ | (56.17 | ) | $ | (1.10 | ) | |
For the fiscal years ended January 25, 2014 and January 31, 2015, approximately 10,053 and 5,296, respectively, of stock options were excluded from the calculation of diluted net income per common share since their effect was anti-dilutive.
14. Stock-Based Compensation
We grant stock-based compensation awards to employees and non-employee directors under an equity compensation plan. In 2012, the members of our controlling shareholder, AEA, approved a Stock Option Plan (the "Plan") that permits the grant of share options and shares, both related to an affiliate of the Company, to our employees, reserving approximately 44,000 shares for future grants. At January 31, 2015, there were 2,423 shares available for future grant under the Plan.
F-26
At Home Group Inc.
Notes to Consolidated Financial Statements (Continued)
January 25, 2014 and January 31, 2015
14. Stock-Based Compensation (Continued)
We account for stock-based compensation in accordance with ASC 718, (Topic 718, "Compensation—Stock Compensation"), which requires all stock-based payments to employees, including grants of employee stock options, to be recognized in the consolidated financial statements over the requisite service period. Compensation expense based upon the fair value of awards is recognized on a straight line basis, over the requisite service period for awards that actually vest. Stock-based compensation expense is recorded in selling, general and administrative expenses in the consolidated statements of operations.
Option awards are granted with an exercise price equal to the fair market value of our common stock at the date of grant. The option awards generally vest based on four years of continuous service and have 10-year contractual terms. Certain option and share awards provide for accelerated vesting if there is a change in control (as defined in the Plan).
We estimate the fair value of each stock option grant on the date of grant based upon the Black-Scholes option-pricing model which includes the following variables: 1) exercise price of the instrument, 2) fair market value of the underlying stock on date of grant, 3) expected term, 4) expected volatility and 5) the risk-free interest rate. We utilized the following assumptions in estimating the fair value of the option grants for the fiscal years ended January 25, 2014 and January 31, 2015:
| |
2014 | 2015 | |||||
|---|---|---|---|---|---|---|---|
Weighted-average expected volatility |
42.4 | % | 39.0 | % | |||
Expected dividend yield |
— | % | — | % | |||
Weighted-average expected term (in years) |
4.0 | 4.0 | |||||
Weighted-average risk-free interest rate |
0.8 | % | 1.3 | % | |||
A summary of option activity under the Plan as of January 31, 2015, and changes during the fiscal year then ended, is presented below:
| |
Options | Weighted- Average Exercise Price |
Weighted- Average Remaining Contractual Term |
|||||
|---|---|---|---|---|---|---|---|---|
Outstanding, beginning of year |
39,229 | $ | 1,250 | |||||
Granted |
4,847 | 1,295 | ||||||
Exercised |
— | — | ||||||
Forfeited or expired |
(2,424 | ) | 1,250 | |||||
| | | | | | | | | |
Outstanding, end of year |
41,652 | $ | 1,255 | 8.09 years | ||||
| | | | | | | | | |
| | | | | | | | | |
| | | | | | | | | |
Exercisable, end of year |
15,592 | $ | 1,250 | 7.83 years | ||||
| | | | | | | | | |
| | | | | | | | | |
| | | | | | | | | |
F-27
At Home Group Inc.
Notes to Consolidated Financial Statements (Continued)
January 25, 2014 and January 31, 2015
14. Stock-Based Compensation (Continued)
A summary of nonvested options outstanding under the Plan as of January 31, 2015, and changes during the fiscal year then ended, is presented below:
| |
Options | Weighted- Average Grant Date Fair Value |
|||||
|---|---|---|---|---|---|---|---|
Nonvested, beginning of year |
33,444 | $ | 435 | ||||
Granted |
4,847 | 418 | |||||
Vested |
(9,807 | ) | 437 | ||||
Forfeited or expired |
(2,424 | ) | 436 | ||||
| | | | | | | | |
Nonvested, end of year |
26,060 | $ | 431 | ||||
| | | | | | | | |
| | | | | | | | |
| | | | | | | | |
We recognize stock-based compensation expense related to stock options of approximately $4.4 million and $4.3 million during the fiscal years ended January 25, 2014 and January 31, 2015, respectively.
As of January 31, 2015, there was approximately $9.3 million of total unrecognized compensation expense related to nonvested share-based compensation arrangements granted under the Plan that is expected to be recognized over a weighted-average period of 2.25 years.
15. Business Interruption Insurance
We maintain insurance for both property damage and business interruption relating to casualty events. Business interruption coverage includes lost profits and other costs incurred. Insurance recoveries related to business interruption are recorded when realized.
In October 2011, our store in Conroe, Texas was destroyed in a fire; it was reconstructed and reopened in late 2013. We received insurance reimbursements for the cost to rebuild the store and reimbursement of direct costs throughout fiscal year 2013 and fiscal year 2014 as incurred. In fiscal year 2014, approximately $2.5 million of insurance recoveries for business interruption were received and are included in selling, general and administrative expenses.
16. Subsequent Events
Subsequent events have been evaluated through August 17, 2015, which is the date that the consolidated financial statements were available to be issued.
On May 22, 2015, we sold our property located in Houston, Texas for approximately $6.7 million, resulting in a net gain of approximately $1.5 million. The net gain on the sale of the property will be recognized immediately in the consolidated statement of operations. The sale of this property is being treated as a like-kind exchange for U.S. federal income tax purposes in accordance with Section 1031 of the Code.
On June 5, 2015, our indirect wholly owned subsidiary, At Home Holding III Inc. ("Borrower") entered into a first lien credit agreement (the "First Lien Agreement"), by and among the Borrower, guaranteed by At Home II, a direct wholly owned subsidiary of ours, various lenders and Bank of America, N.A., as administrative agent and collateral agent. The First Lien Agreement provides for a $300.0 million term loan ("First Lien Term Loan"), which amount was borrowed on June 5, 2015. The First Lien Term Loan will mature on June 3, 2022, and is repayable in equal quarterly installments of $0.8 million for an annual aggregate amount equal to 1% of the original principal amount of $300.0 million. At Home III has the option of paying interest on a 1-month,
F-28
At Home Group Inc.
Notes to Consolidated Financial Statements (Continued)
January 25, 2014 and January 31, 2015
16. Subsequent Events (Continued)
2-month or quarterly basis on the First Lien Term Loan at an annual rate of LIBOR (subject to a 1% floor) plus 4.00%, subject to, after a qualifying IPO, a 0.50% reduction if a certain secured net leverage ratio level is met.
On June 5, 2015, the Borrower entered into a second lien credit agreement (the "Second Lien Agreement"), by and among the Borrower, At Home II and Dynasty Financial II, LLC, as administrative agent, collateral agent and lender. The Second Lien Agreement provides for a $130.0 million term loan (the "Second Lien Term Loan" and, together with the First Lien Term Loan, the "Term Loan Facilities"), which amount was borrowed on June 5, 2015. The Second Lien Term Loan will mature on June 5, 2023 and does not require periodic principal payments, with the total amount outstanding, plus accrued interest, due at maturity. At Home III has the option of paying interest on a 1-month, 2-month or quarterly basis on the Second Lien Facility at an annual rate of LIBOR (subject to a 1% floor) plus 8.00%.
The Term Loan Facilities have various non-financial covenants, customary representations and warranties, events of defaults and remedies, substantially similar to those described in respect of the ABL Facility. There are no financial maintenance covenants in the Term Loan Facilities.
At our option, the First Lien Term Loan may be prepaid on or prior to June 5, 2016 subject to, in the case of a repricing transaction, a prepayment premium equal to the principal amount of First Lien Term Loan subject to such prepayment multiplied by 1%. Any prepayment of all or any portion of the outstanding First Lien Term Loan on or after June 5, 2016 is not subject to a premium. At our option, the Second Lien Term Loan may also be prepaid (but subject to the restrictions contained in the First Lien Term Loan/Second Lien Intercreditor Agreement) on or prior to June 5, 2017 subject to a prepayment premium equal to the principal amount of Second Lien Term Loan subject to such prepayment multiplied by 1%. In addition, on and after June 5, 2017, any prepayment or repayment of the Second Lien Term Loan for whatever reason (whether optional, mandatory, at maturity or otherwise) is subject to the payment of an exit fee which increases over time from an amount equal to 4.50% of the amount of the Second Lien Loan being so prepaid or repaid in the case of any prepayment or repayment occurring on or after June 5, 2017 but prior to June 5, 2018 to an amount equal to 12.00% of the amount of the Second Lien Loan being so prepaid or repaid in the case of any prepayment or repayment occurring on or after June 5, 2022.
The Borrower used the net proceeds from the Term Loan Facilities (i) to effect the refinancing of all outstanding indebtedness under the Senior Secured Notes, (ii) to pay fees and expenses in connection with Term Loan Facilities and the redemption of the Senior Secured Notes, (iii) to repay certain amounts outstanding under the ABL Facility, and (iv) for general corporate purposes.
On June 5, 2015, At Home III completed the redemption of the Senior Secured Notes at a price equal to 108.063% for total cash consideration of $389.4 million, which includes a $29.0 million early redemption premium and $0.4 million of accrued interest. The redemption will result in a loss on extinguishment of debt in the amount of approximately $36.4 million.
On June 5, 2015, the ABL Borrower also entered into the Fourth Amendment to the Credit Agreement which further amended ABL Credit Agreement to modify certain provisions of the agreement to, among other things, permit the Term Loan Facilities to be issued and amend certain terms in the ABL Credit Agreement to be consistent with the terms set forth in the Term Loan Facilities.
F-29
Schedule I—Condensed Financial Information of Registrant
At Home Group Inc. (parent company only)
Condensed Balance Sheets
(in thousands)
| |
January 25, 2014 | January 31, 2015 | |||||
|---|---|---|---|---|---|---|---|
Assets |
|||||||
Current assets: |
|||||||
Receivable from subsidiaries |
$ | 6,028 | $ | 515 | |||
| | | | | | | | |
Total current assets |
6,028 | 515 | |||||
| | | | | | | | |
Investment in subsidiaries |
357,101 | 360,916 | |||||
| | | | | | | | |
Total assets |
$ | 363,129 | $ | 361,431 | |||
| | | | | | | | |
| | | | | | | | |
| | | | | | | | |
Liabilities and Shareholder's Equity |
|||||||
Current liabilities: |
|||||||
Income taxes payable |
$ | 6,028 | $ | 515 | |||
| | | | | | | | |
Total current liabilities |
6,028 | 515 | |||||
Noncurrent liabilities |
— | — | |||||
| | | | | | | | |
Total liabilities |
6,028 | 515 | |||||
| | | | | | | | |
Shareholder's Equity |
|||||||
Common stock, Class A; $0.01 par value; 1,000,000 shares authorized; 253,871 shares issued and outstanding |
3 | 3 | |||||
Common stock, Class B; $0.01 par value; 1,000,000 shares authorized; 142,803 shares issued and outstanding |
1 | 1 | |||||
Additional paid-in capital |
401,336 | 405,587 | |||||
Accumulated deficit |
(44,239 | ) | (44,675 | ) | |||
| | | | | | | | |
Total shareholder's equity |
357,101 | 360,916 | |||||
| | | | | | | | |
Total liabilities and shareholder's equity |
$ | 363,129 | $ | 361,431 | |||
| | | | | | | | |
| | | | | | | | |
| | | | | | | | |
See Notes to Condensed Financial Statements.
F-30
Schedule I—Condensed Financial Information of Registrant
At Home Group Inc. (parent company only)
Condensed Statements of Operations
(in thousands)
| |
Fiscal Year Ended | ||||||
|---|---|---|---|---|---|---|---|
| |
January 25, 2014 | January 31, 2015 | |||||
Net sales |
$ | — | $ | — | |||
Cost of sales |
— |
— |
|||||
| | | | | | | | |
Gross profit |
— | — | |||||
| | | | | | | | |
Operating Expenses |
|||||||
Selling, general and administrative expenses |
— | — | |||||
Depreciation and amortization |
— | — | |||||
| | | | | | | | |
Total operating expenses |
— | — | |||||
| | | | | | | | |
Operating income (loss) |
— |
— |
|||||
Interest expense, net |
— | — | |||||
| | | | | | | | |
Income (loss) before income taxes |
— | — | |||||
Income tax provision |
— | — | |||||
| | | | | | | | |
Income (loss) before equity in net income of subsidiaries |
— | — | |||||
Net loss of subsidiaries |
(22,283 | ) | (436 | ) | |||
| | | | | | | | |
Net loss |
$ | (22,283 | ) | $ | (436 | ) | |
| | | | | | | | |
| | | | | | | | |
| | | | | | | | |
See Notes to Condensed Financial Statements.
F-31
Schedule I—Condensed Financial Information of Registrant
At Home Group Inc. (parent company only)
Notes to Condensed Financial Statements
1. Basis of Presentation
In the parent-company-only financial statements, At Home Group Inc.'s ("Parent") investment in subsidiaries is stated at cost plus equity in undistributed earnings of subsidiaries since the date of acquisition. The parent-company-only financial statements should be read in conjunction with the Company's consolidated financial statements. A condensed statement of cash flows was not presented because At Home Group Inc.'s net operating activities has no cash impact and there were no investing or financing cash flow activities during the fiscal years ended January 25, 2014 and January 31, 2015.
2. Guarantees and Restrictions
At Home Holding III Inc. ("At Home III"), a subsidiary of the Parent, issued $360.0 million in aggregate principal amount of Senior Secured Notes on May 16, 2012 pursuant to the Indenture. Under the terms of the Indenture, the Senior Secured Notes are fully and unconditionally guaranteed, jointly and severally, on a senior secured basis by each of At Home III's existing and future domestic restricted subsidiaries (other than certain immaterial subsidiaries) that are wholly owned or guarantee any of At Home III's or its guarantors' indebtedness. In the event of a default under the Indenture, At Home Group III and its guaranteeing subsidiaries will be directly liable to the holders of the Senior Secured Notes. The Senior Secured Notes mature on June 1, 2019. The Indenture contains covenants limiting, among other things, At Home III's ability and the ability of its restricted subsidiaries to incur additional debt, pay dividends or distributions on its capital stock to any direct or indirect parent company (including Parent) or repurchase its capital stock, issue stock of subsidiaries, make certain investments, create liens on its assets to secure debt, enter into transactions with affiliates, merge or consolidate with another company or sell or otherwise transfer assets, in each case subject to certain exceptions. Under the Indenture, At Home III is permitted to pay dividends to any direct or indirect parent company (including Parent) (a) up to an amount equal to (i) a basket that builds based on 50% of At Home III's Consolidated Net Income (as defined in the Indenture) and certain other amounts, subject to various conditions including compliance with a fixed charge coverage ratio of 2.0 to 1.0, plus (ii) $10 million and (b) in certain additional limited amounts, subject to certain limited exceptions.
At Home III and its indirect wholly-owned subsidiary, At Home Stores LLC, are co-borrowers (in such capacities, the "ABL Borrowers") under the ABL Facility. The ABL Borrowers have $46.9 million of available credit under the ABL Facility which provides commitments of up to $140.0 million for revolving loans and letters of credit, as of January 31, 2015. At Home Holding II Inc. ("Holdings"), the direct parent of At Home III, and its direct and indirect domestic subsidiaries (other than the ABL Borrowers and certain immaterial subsidiaries)(the "ABL Subsidiary Guarantors" and, together with Holdings, the "ABL Guarantors") have guaranteed all obligations of the ABL Borrowers under the ABL Facility. In the event of a default under the ABL Facility, the ABL Borrowers and the Guarantors will be directly liable to the lenders under the ABL Facility. The ABL Facility, which matures on July 28, 2019, includes restrictions on the ability of ABL Borrowers and ABL Subsidiary Guarantors to incur additional liens and indebtedness, make investments and dispositions, pay dividends to Holdings or enter into other transactions, among other restrictions, in each case subject to certain exceptions. Under the ABL Facility, the ABL Borrowers and the ABL Subsidiary Guarantors are permitted to pay dividends to Holdings, (a) so long as after giving effect to such payment, (i) availability is equal to or greater than 15% of the loan cap (i.e., the lesser of (x) the aggregate lender commitments under the ABL Facility and (y) the borrowing base) and (ii) if availability is less than 20% of the loan cap, the consolidated fixed charge coverage ratio is equal to or greater than 1.0 to 1.0, and (b) pursuant to certain other limited exceptions.
F-32
Schedule I—Condensed Financial Information of Registrant
At Home Group Inc. (parent company only)
Notes to Condensed Financial Statements (Continued)
3. Subsequent Events
On June 5, 2015, At Home III ("Borrower") entered into a first lien credit agreement (the "First Lien Agreement"), by and among the Borrower, guaranteed by Holdings, various lenders and Bank of America, N.A., as administrative agent and collateral agent. The First Lien Agreement provides for a $300.0 million term loan ("First Lien Term Loan"), which amount was borrowed on June 5, 2015. The First Lien Term Loan will mature on June 3, 2022, and is repayable in equal quarterly installments of $0.8 million for an annual aggregate amount equal to 1% of the original principal amount of $300.0 million. At Home III has the option of paying interest on a 1-month, 2-month or quarterly basis on the First Lien Term Loan at an annual rate of LIBOR (subject to a 1% floor) plus 4.00%, subject to, after a qualifying IPO, a 0.50% reduction if a certain secured net leverage ratio level is met.
On June 5, 2015, the Borrower entered into a second lien credit agreement (the "Second Lien Agreement"), by and among the Borrower, Holdings and Dynasty Financial II, LLC, as administrative agent, collateral agent and lender. The Second Lien Agreement provides for a $130.0 million term loan (the "Second Lien Term Loan" and, together with the First Lien Term Loan, the "Term Loan Facilities"), which amount was borrowed on June 5, 2015. The Second Lien Term Loan will mature on June 5, 2023 and does not require periodic principal payments, with the total amount outstanding, plus accrued interest, due at maturity. At Home III has the option of paying interest on a 1-month, 2-month or quarterly basis on the Second Lien Term Loan at an annual rate of LIBOR (subject to a 1% floor) plus 8.00%.
The Term Loan Facilities include restrictions on the ability of the Borrower and its restricted subsidiaries to incur additional liens and indebtedness, make investments and dispositions, pay dividends to Holdings or enter into other transactions, among other restrictions, in each case subject to certain exceptions. Under the Term Loan Facilities, the Borrower is permitted to pay dividends to Holdings (a) up to an amount equal to, so long as immediately after giving effect thereto, no default or event of default has occurred and is continuing, (i) (x) $10 million under the First Lien Term Facility or (y) $11.5 million under the Second Lien Term Facility, plus (ii) a basket that builds based on (x) $30 million under the First Lien Term Facility or (y) $34.5 million under the Second Lien Term Facility, plus 50% of the Borrower's and its restricted subsidiaries Consolidated Net Income (as defined in the Term Loan Facilities) and certain other amounts, subject to various conditions including compliance with a minimum cash interest coverage ratio of 2.0 to 1.0, plus (iii) an unlimited amount, subject to pro forma compliance with a 3.0 to 1.0 total leverage ratio and (b) in certain additional limited amounts, subject to certain limited exceptions.
The Borrower used the net proceeds from the Term Loan Facilities (i) to effect the refinancing of all outstanding indebtedness under the Senior Secured Notes, (ii) to pay fees and expenses in connection with Term Loan Facilities and the redemption of the Senior Secured Notes, (iii) to repay certain amounts outstanding under the ABL Facility, and (iv) for general corporate purposes.
On June 5, 2015, At Home III completed the redemption of the Senior Secured Notes at a price equal to 108.063% for total cash consideration of $389.4 million, which includes a $29.0 million early redemption premium and $0.4 million of accrued interest.
On June 5, 2015, the ABL Borrowers also entered into the Fourth Amendment to the Credit Agreement which further amended the ABL Credit Agreement to modify certain provisions of the agreement to, among other things, permit the Term Loan Facilities to be issued and amend certain terms in the ABL Credit Agreement to be consistent with the terms set forth in the Term Loan Facilities.
F-33
At Home Group Inc.
Condensed Consolidated Balance Sheets
(in thousands, except share data)
(Unaudited)
| |
July 26, 2014 |
January 31, 2015 |
August 1, 2015 |
|||||||
|---|---|---|---|---|---|---|---|---|---|---|
Assets |
||||||||||
Current assets: |
||||||||||
Cash and cash equivalents |
$ | 5,011 | $ | 4,706 | $ | 6,151 | ||||
Inventories, net |
130,524 | 142,256 | 167,550 | |||||||
Prepaid expenses |
3,096 | 4,758 | 8,207 | |||||||
Current deferred tax asset |
2,162 | 6,875 | 4,671 | |||||||
Other current assets |
52 | 4,041 | 1,142 | |||||||
| | | | | | | | | | | |
Total current assets |
140,845 | 162,636 | 187,721 | |||||||
| | | | | | | | | | | |
Property and equipment, net |
182,058 | 220,084 | 249,398 | |||||||
Goodwill |
569,732 | 569,732 | 569,732 | |||||||
Trade name |
1,729 | 853 | 872 | |||||||
Debt issuance costs, net |
9,069 | 9,203 | 15,060 | |||||||
Restricted cash |
150 | 17,260 | 1,531 | |||||||
Noncurrent deferred tax asset |
2,498 | — | — | |||||||
Other assets |
1,341 | 579 | 1,753 | |||||||
| | | | | | | | | | | |
Total assets |
$ | 907,422 | $ | 980,347 | $ | 1,026,067 | ||||
| | | | | | | | | | | |
| | | | | | | | | | | |
| | | | | | | | | | | |
Liabilities and Shareholders' Equity |
||||||||||
Current liabilities: |
||||||||||
Accounts payable |
$ | 20,392 | $ | 31,638 | $ | 28,667 | ||||
Accrued liabilities |
43,192 | 56,679 | 55,010 | |||||||
Revolving line of credit |
67,739 | 67,400 | 70,300 | |||||||
Current portion of deferred rent |
1,325 | 2,943 | 3,330 | |||||||
Current portion of long-term debt |
571 | 758 | 3,953 | |||||||
Income taxes payable |
7,908 | 515 | 19,913 | |||||||
| | | | | | | | | | | |
Total current liabilities |
141,127 | 159,933 | 181,173 | |||||||
| | | | | | | | | | | |
Long-term debt |
371,502 | 377,503 | 441,240 | |||||||
Financing obligations |
— | 19,745 | 19,423 | |||||||
Deferred rent |
31,119 | 51,226 | 53,870 | |||||||
Deferred income taxes |
4,234 | 4,457 | 4,785 | |||||||
Other long-term liabilities |
4,302 | 6,567 | 6,709 | |||||||
| | | | | | | | | | | |
Total liabilities |
552,284 | 619,431 | 707,200 | |||||||
| | | | | | | | | | | |
Shareholders' equity |
||||||||||
Common stock, Class A; $0.01 par value; 1,000,000 shares authorized; 253,871 shares issued and outstanding |
3 | 3 | 3 | |||||||
Common stock, Class B; $0.01 par value; 1,000,000 shares authorized; 142,803 shares issued and outstanding |
1 | 1 | 1 | |||||||
Additional paid-in capital |
403,444 | 405,587 | 407,880 | |||||||
Accumulated deficit |
(48,310 | ) | (44,675 | ) | (89,017 | ) | ||||
| | | | | | | | | | | |
Total shareholders' equity |
355,138 | 360,916 | 318,867 | |||||||
| | | | | | | | | | | |
Total liabilities and shareholders' equity |
$ | 907,422 | $ | 980,347 | $ | 1,026,067 | ||||
| | | | | | | | | | | |
| | | | | | | | | | | |
| | | | | | | | | | | |
See Notes to Condensed Consolidated Financial Statements.
F-34
At Home Group Inc.
Condensed Consolidated Statement of Operations
(in thousands, except share and per share data)
(Unaudited)
| |
Twenty-six Weeks Ended | ||||||
|---|---|---|---|---|---|---|---|
| |
July 26, 2014 | August 1, 2015 | |||||
Net sales |
$ | 229,915 | $ | 297,224 | |||
Cost of sales |
150,617 | 197,147 | |||||
| | | | | | | | |
Gross profit |
79,298 | 100,077 | |||||
| | | | | | | | |
Operating Expenses |
|||||||
Selling, general and administrative expenses |
44,246 | 61,295 | |||||
Depreciation and amortization |
3,788 | 933 | |||||
| | | | | | | | |
Total operating expenses |
48,034 | 62,228 | |||||
| | | | | | | | |
Operating income |
31,264 | 37,849 | |||||
Interest expense, net |
20,553 | 19,768 | |||||
Loss on extinguishment of debt |
— | 36,046 | |||||
| | | | | | | | |
Income (loss) before income taxes |
10,711 | (17,965 | ) | ||||
Income tax provision |
14,782 | 26,377 | |||||
| | | | | | | | |
Net loss |
$ | (4,071 | ) | $ | (44,342 | ) | |
| | | | | | | | |
| | | | | | | | |
| | | | | | | | |
Earnings per share: |
|||||||
Net loss per common share: |
|||||||
Basic |
$ | (10.26 | ) | $ | (111.78 | ) | |
| | | | | | | | |
| | | | | | | | |
| | | | | | | | |
Diluted |
$ | (10.26 | ) | $ | (111.78 | ) | |
| | | | | | | | |
| | | | | | | | |
| | | | | | | | |
Weighted average shares outstanding: |
|||||||
Basic |
396,674 | 396,674 | |||||
| | | | | | | | |
| | | | | | | | |
| | | | | | | | |
Diluted |
396,674 | 396,674 | |||||
| | | | | | | | |
| | | | | | | | |
| | | | | | | | |
See Notes to Condensed Consolidated Financial Statements.
F-35
At Home Group Inc.
Condensed Consolidated Statement of Cash Flows
(in thousands)
(Unaudited)
| |
Twenty-six Weeks Ended | ||||||
|---|---|---|---|---|---|---|---|
| |
July 26, 2014 | August 1, 2015 | |||||
Operating Activities |
|||||||
Net loss |
$ | (4,071 | ) | $ | (44,342 | ) | |
Adjustments to reconcile net loss to net cash used in operating activities: |
|||||||
Depreciation and amortization |
10,418 | 13,194 | |||||
Loss (gain) on disposal of fixed assets |
138 | (1,831 | ) | ||||
Non-cash interest expense |
739 | 926 | |||||
Amortization of deferred gain on sale-leaseback |
(690 | ) | (1,377 | ) | |||
Deferred income taxes |
— | 2,533 | |||||
Stock-based compensation |
2,108 | 2,292 | |||||
Loss on extinguishment of debt |
— | 36,046 | |||||
Changes in operating assets and liabilities |
|||||||
Inventories |
(21,399 | ) | (25,294 | ) | |||
Prepaid expenses and other current assets |
1,071 | (550 | ) | ||||
Other assets |
(481 | ) | (1,173 | ) | |||
Accounts payable |
519 | (3,827 | ) | ||||
Accrued liabilities |
199 | (1,526 | ) | ||||
Income taxes payable |
1,880 | 19,398 | |||||
Deferred rent |
1,868 | 3,596 | |||||
| | | | | | | | |
Net cash used in operating activities |
(7,701 | ) | (1,935 | ) | |||
| | | | | | | | |
Investing Activities |
|||||||
Purchase of property and equipment |
(78,060 | ) | (45,322 | ) | |||
Purchase of intangible assets |
— | (19 | ) | ||||
Change in restricted cash |
17,707 | 15,729 | |||||
Net proceeds from sale of property and equipment |
634 | 6,341 | |||||
| | | | | | | | |
Net cash used in investing activities |
(59,719 | ) | (23,271 | ) | |||
| | | | | | | | |
Financing Activities |
|||||||
Payments under lines of credit |
(75,362 | ) | (104,500 | ) | |||
Proceeds from lines of credit |
143,100 | 107,400 | |||||
Payment of debt issuance costs |
— | (13,668 | ) | ||||
Proceeds from issuance of long-term debt |
— | 430,000 | |||||
Payment of Senior Secured Notes |
— | (389,027 | ) | ||||
Payments on financing obligations |
— | (149 | ) | ||||
Payments on long-term debt |
(278 | ) | (3,405 | ) | |||
| | | | | | | | |
Net cash provided by financing activities |
67,460 | 26,651 | |||||
| | | | | | | | |
Increase in cash and cash equivalents |
40 | 1,445 | |||||
Cash and cash equivalents, beginning of period |
4,971 | 4,706 | |||||
| | | | | | | | |
Cash and cash equivalents, end of period |
$ | 5,011 | $ | 6,151 | |||
| | | | | | | | |
| | | | | | | | |
| | | | | | | | |
Supplemental Cash Flow Information |
|||||||
Cash paid for interest |
$ | 19,906 | $ | 22,677 | |||
Cash paid for income taxes |
$ | 12,416 | $ | 909 | |||
See Notes to Condensed Consolidated Financial Statements.
F-36
At Home Group Inc.
Notes to Condensed Consolidated Financial Statements
(Unaudited)
1. Summary of Significant Accounting Policies
Basis of Presentation
These condensed financial statements include At Home Group Inc. and its wholly-owned subsidiaries (collectively referred to as "we", 'us", "our" and the "Company").
The accompanying unaudited condensed consolidated financial statements have been prepared in accordance with generally accepted accounting principles in the United States of America ("GAAP") for interim financial information in accordance with Article 10 of Regulation S-X. In the opinion of management, all adjustments (consisting of normal recurring adjustments) necessary for a fair presentation of the results of operations, financial position and cash flows for the periods presented have been included.
The condensed consolidated balance sheets as of July 26, 2014 and August 1, 2015, the condensed consolidated statement of operations and the condensed consolidated statement of cash flows for the twenty-six weeks ended July 26, 2014 and August 1, 2015 have been prepared by the Company and are unaudited. The consolidated balance sheet as of January 31, 2015 has been derived from the audited financial statements for the fiscal year then ended but does not include all of the information and notes required by GAAP for complete financial statements. These interim condensed consolidated financial statements should be read in conjunction with the consolidated financial statements as of and for the fiscal years ended January 25, 2014 and January 31, 2015 and the related notes thereto included elsewhere in this prospectus.
The Company does not have any components of other comprehensive income recorded within its condensed consolidated financial statements, and, therefore, does not separately present a statement of comprehensive income in its condensed consolidated financial statements.
Fiscal Year
We report on the basis of a 52- or 53-week fiscal year, which ends on the last Saturday in January. References to a fiscal year mean the year in which that fiscal year ends. References herein to "second fiscal quarter 2016" relate to the twenty-six weeks ended August 1, 2015 and references to "second fiscal quarter 2015" relate to the twenty-six weeks ended July 26, 2014.
Consolidation
The accompanying consolidated financial statements include the accounts of At Home Group and its consolidated wholly-owned subsidiaries. All intercompany balances and transactions have been eliminated in consolidation.
Use of Estimates
The preparation of these condensed consolidated financial statements in conformity with GAAP requires management to make estimates and assumptions that affect the reported amounts of assets and liabilities and disclosure of contingent assets and liabilities at the date of the financial statements, and the reported amounts of sales and expenses during the reporting period. Actual results could differ from those estimates.
Seasonality
Our business is moderately seasonal in nature and, therefore, the results of operations for the twenty-six weeks ended August 1, 2015 are not necessarily indicative of the operating results that may
F-37
At Home Group Inc.
Notes to Condensed Consolidated Financial Statements (Continued)
(Unaudited)
1. Summary of Significant Accounting Policies (Continued)
be expected for a full fiscal year. Historically, our business has realized a higher portion of net sales, operating income and cash flows from operations in the second and fourth fiscal quarters attributable primarily to the impact of summer and the year-end holiday decorating season, respectively.
Recent Accounting Pronouncements
In May 2014, the Financial Accounting Standards Board issued Accounting Standards Update No. 2014-09, "Revenue from Contracts with Customers" ("ASU 2014-09"). ASU 2014-09 supersedes the revenue recognition requirements in "Topic 605, Revenue Recognition," and requires entities to recognize revenue in a way that depicts the transfer of promised goods or services to customers in an amount that reflects the consideration to which the entity expects to be entitled to in exchange for those goods or services. ASU 2014-09 is effective for annual reporting periods beginning after December 15, 2016, including interim periods within that reporting period and is to be applied retrospectively, with early application not permitted. However, on April 1, 2015, the FASB proposed a deferral of the effective date of the standard by one year, but the proposal would also permit entities to adopt ASU 2014-09 as of the current effective date. We are currently evaluating the impact of ASU 2014-09.
In April 2015, the FASB issued ASU 2015-03, "Interest—Imputation of Interest (Subtopic 835-30): Simplifying the Presentation of Debt Issuance Costs", in order to simplify the presentation of debt issuance costs ("ASU 2015-03"). The ASU requires debt issuance costs to be presented on the balance sheet as a direct deduction from the related debt liability rather than an asset. ASU 2015-03 is effective for public companies for annual periods beginning after December 15, 2015, and interim periods thereafter, with early adoption permitted. The guidance also requires retrospective application to all prior periods presented. As of August 1, 2015, we had $15.1 million of net deferred debt issuance costs related to our Term Loan Facilities, ABL Facility and certain other long-term debt.
2. Fair Value Measurements
We follow the provisions of Accounting Standards Codification ("ASC") 820 (Topic 820, "Fair Value Measurements and Disclosures"). ASC 820 establishes a three-tiered fair value hierarchy that prioritizes inputs to valuation techniques used in fair value calculations.
- •
- Level 1—Unadjusted quoted market prices for identical assets or liabilities in active markets that we have the
ability to access.
- •
- Level 2—Quoted prices for similar assets or liabilities in active markets; quoted prices for identical or similar
assets or liabilities in inactive markets; or valuations based on models where the significant inputs are observable (e.g., interest rates, yield
curves, prepayment speeds, default rates, loss severities, etc.) or can be corroborated by observable market data.
- •
- Level 3—Valuations based on models where significant inputs are not observable. The unobservable inputs reflect our own assumptions about the assumptions that market participants would use.
ASC 820 requires us to maximize the use of observable inputs and minimize the use of unobservable inputs. If a financial instrument uses inputs that fall in different levels of the hierarchy, the instrument is categorized based upon the lowest level of input that is significant to the fair value calculation.
F-38
At Home Group Inc.
Notes to Condensed Consolidated Financial Statements (Continued)
(Unaudited)
2. Fair Value Measurements (Continued)
The fair value of all current financial instruments approximates carrying value because of the short-term nature of these instruments. We have variable and fixed rates on our long-term debt. The fair value of long-term debt with variable rates approximates carrying value as the interest rates of these amounts approximate market rates. We determine fair value on our fixed rate debt by using quoted market prices and current interest rates.
At August 1, 2015, the fair value of our fixed rate mortgage due February 1, 2037 was $7.6 million, which was approximately $1.3 million above the carrying value of $6.3 million. Fair value for the fixed rate mortgage was determined using Level 2 inputs.
3. Accrued Liabilities
Accrued liabilities consist of the following (in thousands):
| |
July 26, 2014 |
January 31, 2015 |
August 1, 2015 |
|||||||
|---|---|---|---|---|---|---|---|---|---|---|
Inventory in-transit |
$ | 13,244 | $ | 17,486 | $ | 16,457 | ||||
Accrued payroll and other employee-related liabilities |
4,506 | 8,227 | 6,445 | |||||||
Accrued taxes, other than income |
8,707 | 7,920 | 11,199 | |||||||
Accrued interest |
6,680 | 6,599 | 2,457 | |||||||
Insurance liabilities |
3,062 | 3,306 | 2,340 | |||||||
Construction costs |
— | 1,064 | 482 | |||||||
Other |
6,993 | 12,077 | 15,630 | |||||||
| | | | | | | | | | | |
Total accrued liabilities |
$ | 43,192 | $ | 56,679 | $ | 55,010 | ||||
| | | | | | | | | | | |
| | | | | | | | | | | |
| | | | | | | | | | | |
4. Revolving Line of Credit
Interest on borrowings under the ABL Credit Agreement is computed based on our average daily availability at our option: (x) the higher of (i) the Federal Funds Rate plus 1/2 of 1.00%, (ii) the bank's prime rate, and (iii) LIBOR plus 1.00%, plus in each case, an applicable margin of 0.25% to 0.75% or (y) the bank's LIBOR rate plus an applicable margin of 1.25% to 1.75%. The interest rate was 3.75%, 3.75% and 4.0% at July 26, 2014, January 31, 2015 and August 1, 2015, respectively.
On June 5, 2015, the ABL Borrower entered into the Fourth Amendment to the Credit Agreement which further amended ABL Credit Agreement to modify certain provisions of the agreement to, among other things, permit the Term Loan Facilities to be issued and amend certain terms in the ABL Credit Agreement to be consistent with the terms set forth in the Term Loan Facilities.
As of August 1, 2015, approximately $70.3 million was outstanding under the ABL Credit Agreement, approximately $0.7 million was outstanding under letters of credit and we had availability of approximately $69.0 million. As of August 1, 2015, we were in compliance with all covenants prescribed in the ABL Credit Agreement.
F-39
At Home Group Inc.
Notes to Condensed Consolidated Financial Statements (Continued)
(Unaudited)
5. Long-Term Debt
Long-term debt consists of the following (in thousands):
| |
July 26, 2014 |
January 31, 2015 |
August 1, 2015 |
|||||||
|---|---|---|---|---|---|---|---|---|---|---|
Senior Secured Notes |
$ | 360,000 | $ | 360,000 | $ | — | ||||
Term Loan Facilities |
— | — | 429,250 | |||||||
Note payable, bank(a) |
6,438 | 6,376 | 6,308 | |||||||
Note payable, bank(b) |
— | 3,838 | 3,787 | |||||||
Note payable, bank(c) |
3,210 | 3,066 | 2,917 | |||||||
Note payable, bank(d) |
— | 2,629 | 2,594 | |||||||
Note payable, bank(e) |
2,425 | 2,352 | — | |||||||
| | | | | | | | | | | |
Total debt |
372,073 | 378,261 | 444,856 | |||||||
Less: current maturities |
571 | 758 | 3,616 | |||||||
| | | | | | | | | | | |
Long-term debt |
$ | 371,502 | $ | 377,503 | $ | 441,240 | ||||
| | | | | | | | | | | |
| | | | | | | | | | | |
| | | | | | | | | | | |
- (a)
- Matures
February 1, 2037; $42,697 payable monthly, including interest at 5.90%; secured by the location's land and building.
- (b)
- Matures
July 22, 2039; $19,174 payable monthly, including interest of 3.15% plus the index rate (1 month LIBOR rate) which is currently
3.306%; secured by the location's land and building.
- (c)
- Matures
November 24, 2023; $34,092 payable monthly, including interest at prime plus 0.50% (3.75% at August 1, 2015); secured by the
location's land and building.
- (d)
- Matures
August 15, 2039; $13,105 payable monthly, including interest at 3.15% plus the index rate (1 month LIBOR rate) which is currently
3.307%; secured by the location's land and building.
- (e)
- Matures April 7, 2026; $23,798 payable monthly, including interest at 5.75% until April 7, 2016, when such interest rate will change to prime plus 0.50%; secured by the location's land and building.
On June 5, 2015, our indirect wholly owned subsidiary, At Home Holding III Inc. ("Borrower") entered into a first lien credit agreement (the "First Lien Agreement"), by and among the Borrower, guaranteed by At Home II, a direct wholly owned subsidiary of ours, various lenders and Bank of America, N.A., as administrative agent and collateral agent. The First Lien Agreement provides for a $300.0 million term loan ("First Lien Term Loan"), which amount was borrowed on June 5, 2015. The First Lien Term Loan will mature on June 3, 2022, and is repayable in equal quarterly installments of $0.8 million for an annual aggregate amount equal to 1% of the original principal amount of $300.0 million. At Home III has the option of paying interest on a 1-month, 2-month or quarterly basis on the First Lien Term Loan at an annual rate of LIBOR (subject to a 1% floor) plus 4.00%, subject to, after a qualifying IPO, a 0.50% reduction if a certain secured net leverage ratio level is met.
On June 5, 2015, the Borrower entered into a second lien credit agreement (the "Second Lien Agreement"), by and among the Borrower, At Home II and Dynasty Financial II, LLC, as
F-40
At Home Group Inc.
Notes to Condensed Consolidated Financial Statements (Continued)
(Unaudited)
5. Long-Term Debt (Continued)
administrative agent, collateral agent and lender. The Second Lien Agreement provides for a $130.0 million term loan (the "Second Lien Term Loan" and, together with the First Lien Term Loan, the "Term Loan Facilities"), which amount was borrowed on June 5, 2015. The Second Lien Term Loan will mature on June 5, 2023 and does not require periodic principal payments, with the total amount outstanding, plus accrued interest, due at maturity. At Home III has the option of paying interest on a 1-month, 2-month or quarterly basis on the Second Lien Term Loan at an annual rate of LIBOR (subject to a 1% floor) plus 8.00%.
The Term Loan Facilities have various non-financial covenants, customary representations and warranties, events of defaults and remedies, substantially similar to those described in respect of the ABL Credit Facility. There are no financial maintenance covenants in the Term Loan Facilities.
At our option, the First Lien Term Loan may be prepaid on or prior to June 5, 2016 subject to, in the case of a repricing transaction, a prepayment premium equal to the principal amount of First Lien Term Loan subject to such prepayment multiplied by 1%. Any prepayment of all or any portion of the outstanding First Lien on or after June 5, 2016 is not subject to a premium. At our option, the Second Lien Term Loan may also be prepaid (but subject to the restrictions contained in the First Lien Term Loan/Second Lien Intercreditor Agreement) on or prior to June 5, 2017 subject to a prepayment premium equal to the principal amount of Second Lien Term Loan subject to such prepayment multiplied by 1%. In addition, on and after the June 5, 2017, any prepayment or repayment of the Second Lien Term Loan for whatever reason (whether optional, mandatory, at maturity or otherwise) is subject to the payment of an exit fee which increases over time from an amount equal to 4.50% of the amount of the Second Lien Loan being so prepaid or repaid in the case of any prepayment or repayment occurring on or after June 5, 2017 but prior to June 5, 2018 to an amount equal to 12.00% of the amount of the Second Lien Loan being so prepaid or repaid in the case of any prepayment or repayment occurring on or after June 5, 2022.
The Borrower used the net proceeds from the Term Loan Facilities (i) to effect the refinancing of all outstanding indebtedness under the Senior Secured Notes, (ii) to pay fees and expenses in connection with Term Loan Facilities and the redemption of the Senior Secured Notes, (iii) to repay certain amounts outstanding under the ABL Facility, and (iv) for general corporate purposes.
On June 5, 2015, At Home III completed the redemption of the Senior Secured Notes at a price equal to 108.063% for total cash consideration of $389.4 million, which includes a $29.0 million early redemption premium and $0.4 million of accrued interest. The redemption resulted in a loss on extinguishment of debt in the amount of approximately $36.0 million.
6. Related Party Transactions
We pay management fees of approximately $2.6 million annually to our controlling shareholder, AEA Investors LP ("AEA"), an affiliate of our controlling shareholder, and affiliated co-investors. We recognized approximately $1.3 million and $1.4 million during the twenty-six weeks ended July 26, 2014 and August 1, 2015, respectively.
We pay management fees of approximately $0.9 million annually to Starr Investment Holdings, LLC ("Starr Investments"), an affiliated co-investor. We recognized approximately $0.5 million of management fees in each of the twenty-six weeks ended July 26, 2014 and August 1, 2015.
F-41
At Home Group Inc.
Notes to Condensed Consolidated Financial Statements (Continued)
(Unaudited)
6. Related Party Transactions (Continued)
In addition, Starr Indemnity & Liability Company, an affiliate of Starr Investments, is an underwriter for our general liability and workers' compensation insurance policies that were effective December 1, 2013. The total cost of the policies was approximately $1.3 million, which was paid during the twenty-six weeks ended July 26, 2014. These policies expired on December 1, 2014 and were replaced with policies underwritten by an unrelated party.
Affiliates of AEA own a significant equity position in Dematic Corporation, an external vendor that designs, develops and delivers solutions that optimize company's supply chain, improve performance and increase productivity through intelligent warehouse logistics and materials handling solutions. In February 2014, we executed an agreement with Dematic Corporation for the installation of a system to assist in the automation of our distribution center. During the twenty-six weeks ended July 26, 2014, we paid Dematic Corporation approximately $6.1 million under the agreement which is primarily recorded in property and equipment, net.
Merry Mabbett Inc. ("MMI") is owned by Merry Mabbett Dean, who is the mother of Lewis L. Bird III, our Chief Executive Officer. During the twenty-six weeks ended July 26, 2014 and August 1, 2015, Ms. Dean, through MMI, provided certain design services to us, including design for our home office, as well as design in our stores. In addition, through MMI, we purchased certain fixtures, furniture and equipment that is now owned and used by us in our home office, new store offices or in the product vignettes in the stores. During the twenty-six weeks ended July 26, 2014, we paid MMI approximately $0.1 million for fixtures, furniture and equipment. During the twenty-six weeks ended August 1, 2015, we paid MMI approximately $0.3 million for fixtures, furniture and equipment and design related services.
7. Income Taxes
Our effective income tax rate for the twenty-six weeks ended July 26, 2014 was 138.01% compared to (146.83)% for the twenty-six weeks ended August 1, 2015. The effective income tax rates differ significantly from federal statutory rates primarily due to the impact of state income taxes and changes in the valuation allowance on our deferred tax assets. We recorded a valuation allowance for both periods because we have concluded that it is more likely than not that certain net deferred tax assets will not be realized.
8. Commitments and Contingencies
Litigation
We are subject to claims and lawsuits that arise primarily in the ordinary course of business. It is the opinion of management that the disposition or ultimate resolution of such claims and lawsuits will not have a material adverse effect on our consolidated financial position, results of operations or liquidity.
9. Earnings Per Share
In accordance with ASC 260, (Topic 260, "Earnings Per Share"), basic earnings per share is computed by dividing net income (loss) available to common stockholders by the weighted average number of common shares outstanding for the period. Diluted earnings per share is computed by dividing net income (loss) available to common stockholders by the weighted average shares outstanding for the period and include the dilutive impact of potential shares from the exercise of stock options. Common equivalent shares are excluded from the computation if their effect is anti-dilutive.
F-42
At Home Group Inc.
Notes to Condensed Consolidated Financial Statements (Continued)
(Unaudited)
9. Earnings Per Share (Continued)
The following table sets forth the calculation of basic and diluted earnings per share for the twenty-six weeks ended July 26, 2014 and August 1, 2015 as follows (in thousands, except per share data):
| |
Twenty-six Weeks Ended | ||||||
|---|---|---|---|---|---|---|---|
| |
July 26, 2014 |
August 1, 2015 |
|||||
Numerator: |
|||||||
Net loss |
$ | (4,071 | ) | $ | (44,342 | ) | |
| | | | | | | | |
| | | | | | | | |
| | | | | | | | |
Denominator: |
|||||||
Weighted average common share outstanding—basic |
396,674 | 396,674 | |||||
Effect of dilutive securities: |
|||||||
Stock options |
— | — | |||||
| | | | | | | | |
Weighted average common share outstanding—diluted |
396,674 | 396,674 | |||||
| | | | | | | | |
| | | | | | | | |
| | | | | | | | |
Per common share: |
|||||||
Basic net loss per common share |
$ | (10.26 | ) | $ | (111.78 | ) | |
Diluted net loss per common share |
$ | (10.26 | ) | $ | (111.78 | ) | |
For the twenty-six weeks ended July 26, 2014 and August 1, 2015, approximately 40,215 and 43,059, respectively, of stock options were excluded from the calculation of diluted net (loss) income per common share since their effect was anti-dilutive.
10. Subsequent Events
Subsequent events have been evaluated through September 24, 2015, which is the date that the condensed consolidated financial statements were available to be issued.
On September 15, 2015, we sold five of our properties in Grand Prairie, Texas, Toledo, Ohio, Pharr, Texas, New Braunfels, Texas, and Gulfport, Mississippi for a total of $40.2 million. Contemporaneously with the closing of the sale, we entered into a lease pursuant to which we leased back the properties for cumulative annual rent of $2.7 million, subject to annual escalations. Approximately $5.5 million of the proceeds from the sale were used to pay off notes payable related the Grand Prairie and New Braunfels properties.
F-43
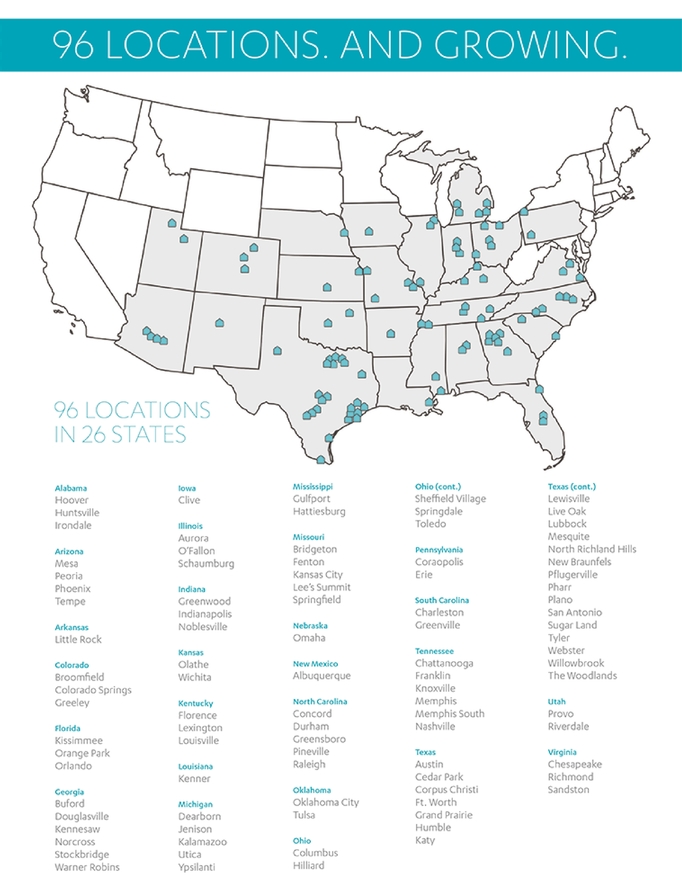

Through and including , 2015 (the 25th day after the date of this prospectus), all dealers effecting transactions in these securities, whether or not participating in this offering, may be required to deliver a prospectus. This is in addition to a dealer's obligation to deliver a prospectus when acting as an underwriter and with respect to an unsold allotment or subscription.
PART II
INFORMATION NOT REQUIRED IN PROSPECTUS
Item 13. Other Expenses of Issuance and Distribution
The following table sets forth all the costs and expenses, other than underwriting discounts, payable in connection with the sale of the shares of common stock being registered hereby. Except as otherwise noted, the Registrant will pay all of the costs and expenses set forth in the following table. All amounts shown below are estimates, except the SEC registration fee, the FINRA filing fee and the NYSE listing fee:
| |
Amount | |||
|---|---|---|---|---|
SEC registration fee |
$ | 11,620 | ||
FINRA filing fee |
15,500 | |||
NYSE listing fee |
25,000 | |||
Printing and engraving expenses |
* | |||
Legal fees and expenses |
* | |||
Accounting fees and expenses |
* | |||
Blue Sky fees and expenses |
* | |||
Transfer agent and registrar fees |
* | |||
Miscellaneous expenses |
* | |||
| | | | | |
Total |
$ | * | ||
| | | | | |
| | | | | |
| | | | | |
- *
- To be filed by amendment.
Item 14. Indemnification of Directors and Officers
Section 102 of the Delaware law allows a corporation to eliminate the personal liability of a director to the corporation or its stockholders for monetary damages for breach of fiduciary duty as a director, except in cases where the director breached his or her duty of loyalty to the corporation or its stockholders, failed to act in good faith, engaged in intentional misconduct or a knowing violation of the law, willfully or negligently authorized the unlawful payment of a dividend or approved an unlawful stock redemption or repurchase or obtained an improper personal benefit. The registrant's certificate of incorporation contains a provision which eliminates directors' personal liability as set forth above.
The registrant's certificate of incorporation and bylaws provide in effect that the registrant shall indemnify its directors and officers to the extent permitted by the Delaware law. Section 145 of the Delaware law provides that a Delaware corporation has the power to indemnify its directors, officers, employees and agents in certain circumstances. Subsection (a) of Section 145 of the Delaware law empowers a corporation to indemnify any director, officer, employee or agent, or former director, officer, employee or agent, who was or is a party or is threatened to be made a party to any threatened, pending or completed action, suit or proceeding, whether civil, criminal, administrative or investigative (other than an action by or in the right of the corporation), against expenses (including attorneys' fees), judgments, fines and amounts paid in settlement actually and reasonably incurred in connection with such action, suit or proceeding provided that such director, officer, employee or agent acted in good faith and in a manner he or she reasonably believed to be in or not opposed to the best interests of the corporation, and, with respect to any criminal action or proceeding, provided that such director, officer, employee or agent had no reasonable cause to believe that his or her conduct was unlawful.
Subsection (b) of Section 145 of the Delaware law empowers a corporation to indemnify any director, officer, employee or agent, or former director, officer, employee or agent, who was or is a party or is threatened to be made a party to any threatened, pending or completed action or suit by or
II-1
in the right of the corporation to procure a judgment in its favor by reason of the fact that such person acted in any of the capacities set forth above, against expenses (including attorneys' fees) actually and reasonably incurred in connection with the defense or settlement of such action or suit provided that such person acted in good faith and in a manner he or she reasonably believed to be in or not opposed to the best interests of the corporation, except that no indemnification may be made in respect of any claim, issue or matter as to which such person shall have been adjudged to be liable to the corporation unless and only to the extent that the Court of Chancery shall determine that despite the adjudication of liability such person is fairly and reasonably entitled to indemnity for such expenses which the court shall deem proper.
Section 145 further provides that to the extent that a director or officer or employee of a corporation has been successful in the defense of any action, suit or proceeding referred to in subsections (a) and (b) or in the defense of any claim, issue or matter therein, he or she shall be indemnified against expenses (including attorneys' fees) actually and reasonably incurred by him or her in connection therewith; that indemnification provided by Section 145 shall not be deemed exclusive of any other rights to which the party seeking indemnification may be entitled; and the corporation is empowered to purchase and maintain insurance on behalf of a director, officer, employee or agent of the corporation against any liability asserted against him or her or incurred by him or her in any such capacity or arising out of his or her status as such whether or not the corporation would have the power to indemnify him or her against such liabilities under Section 145; and that, unless indemnification is ordered by a court, the determination that indemnification under subsections (a) and (b) of Section 145 is proper because the director, officer, employee or agent has met the applicable standard of conduct under such subsections shall be made by (1) a majority vote of the directors who are not parties to such action, suit or proceeding, even though less than a quorum, or (2) if there are no such directors, or if such directors so direct, by independent legal counsel in a written opinion, or (3) by the stockholders.
The registrant has in effect insurance policies for general officers' and directors' liability insurance covering all of its officers and directors.
Item 15. Recent Sales of Unregistered Securities
During the three years preceding the filing of this registration statement, we have issued the following securities which were not registered under the Securities Act of 1933, as amended (all share numbers before the proposed split):
During the past three years, we issued options to purchase an aggregate of 43,874 shares of common stock under the 2012 Option Plan.
The issuances of the securities in the transactions described above were deemed to be exempt from registration under the Securities Act in reliance upon Section 4(a)(2) of the Securities Act and/or Rules 506 and 701 promulgated thereunder. The securities were issued directly by the registrant and did not involve a public offering or general solicitation. The recipients of such securities represented their intentions to acquire the securities for investment purposes only and not with a view to, or for sale in connection with, any distribution thereof.
Item 16. Exhibits and Financial Statement Schedules
(a) Exhibits.
See the Exhibit Index attached to this registration statement, which is incorporated by reference herein.
II-2
(b) Financial Statement Schedules.
Schedules not listed above have been omitted because the information required to be set forth therein is not applicable or is shown in the financial statements or the notes thereto.
The undersigned registrant hereby undertakes to provide to the underwriters at the closing specified in the underwriting agreement certificates in such denominations and registered in such names as required by the underwriters to permit prompt delivery to each purchaser.
Insofar as indemnification for liabilities arising under the Securities Act of 1933 may be permitted to directors, officers and controlling persons of the registrant pursuant to the foregoing provisions, or otherwise, the registrant has been advised that in the opinion of the Securities and Exchange Commission such indemnification is against public policy as expressed in the Securities Act and is, therefore, unenforceable. In the event that a claim for indemnification against such liabilities (other than the payment by the registrant of expenses incurred or paid by a director, officer or controlling person of the registrant in the successful defense of any action, suit or proceeding) is asserted by such director, officer or controlling person in connection with the securities being registered, the registrant will, unless in the opinion of its counsel the matter has been settled by controlling precedent, submit to a court of appropriate jurisdiction the question whether such indemnification by it is against public policy as expressed in the Securities Act and will be governed by the final adjudication of such issue.
The undersigned registrant hereby undertakes that:
(1) For purposes of determining any liability under the Securities Act of 1933, the information omitted from the form of prospectus filed as part of this registration statement in reliance upon Rule 430A and contained in a form of prospectus filed by the registrant pursuant to Rule 424(b)(1) or (4) or 497(h) under the Securities Act shall be deemed to be part of this registration statement as of the time it was declared effective.
(2) For the purpose of determining any liability under the Securities Act of 1933, each post-effective amendment that contains a form of prospectus shall be deemed to be a new registration statement relating to the securities offered therein, and the offering of such securities at that time shall be deemed to be the initial bona fide offering thereof.
(3) For the purpose of determining liability of the registrant under the Securities Act of 1933 to any purchaser in the initial distribution of the securities, the undersigned registrant undertakes that in a primary offering of securities of the undersigned registrant pursuant to this registration statement, regardless of the underwriting method used to sell the securities to the purchaser, if the securities are offered or sold to such purchaser by means of any of the following communications, the undersigned registrant will be a seller to the purchaser and will be considered to offer or sell such securities to such purchaser:
(i) Any preliminary prospectus or prospectus of the undersigned registrant relating to the offering required to be filed pursuant to Rule 424 under the Securities Act;
(ii) Any free writing prospectus relating to the offering prepared by or on behalf of the undersigned registrant or used or referred to by the undersigned registrant;
(iii) The portion of any other free writing prospectus relating to the offering containing material information about the undersigned registrant or its securities provided by or on behalf of the undersigned registrant; and
(iv) Any other communication that is an offer in the offering made by the undersigned registrant to the purchaser.
II-3
Pursuant to the requirements of the Securities Act of 1933, as amended, the registrant has duly caused this Registration Statement to be signed on its behalf by the undersigned, thereunto duly authorized, in the City of Plano, State of Texas, on this 6th day of October, 2015.
| AT HOME GROUP INC. | ||||||
By: |
/s/ JUDD T. NYSTROM |
|||||
| Name: | Judd T. Nystrom | |||||
| Title: | Chief Financial Officer | |||||
Pursuant to the requirements of the Securities Act of 1933, this registration statement has been signed below by the following persons in the capacities and on the dates indicated.
Signature
|
Title
|
Date
|
||
|---|---|---|---|---|
| * Lewis L. Bird III |
Chief Executive Officer and Director (Principal Executive Officer) | October 6, 2015 | ||
/s/ JUDD T. NYSTROM Judd T. Nystrom |
Chief Financial Officer (Principal Financial Officer and Principal Accounting Officer) |
October 6, 2015 |
||
* Martin C. Eltrich, III |
Director |
October 6, 2015 |
||
* Brian R. Hoesterey |
Director |
October 6, 2015 |
||
* Geoffrey G. Clark |
Director |
October 6, 2015 |
||
* Allen I. Questrom |
Director |
October 6, 2015 |
||
* Wendy A. Beck |
Director |
October 6, 2015 |
II-4
Signature
|
Title
|
Date
|
||
|---|---|---|---|---|
| * Larry D. Stone |
Director | October 6, 2015 | ||
* Philip L. Francis |
Director |
October 6, 2015 |
| *By: | /s/ JUDD T. NYSTROM Judd T. Nystrom Attorney-in-fact |
II-5
| Exhibit No. | Exhibit Description | ||
|---|---|---|---|
| 1.1 | * | Form of Underwriting Agreement. | |
3.1 |
* |
Form of Amended and Restated Certificate of Incorporation of the Company, to be effective upon the closing of this offering. |
|
3.2 |
* |
Form of Amended and Restated Bylaws of the Company, to be effective upon the closing of this offering. |
|
4.1 |
* |
Specimen Common Stock Certificate of the Company. |
|
4.2 |
* |
Form of Stockholders' Agreement. |
|
4.3 |
* |
Form of Registration Rights Agreement. |
|
5.1 |
* |
Opinion of Fried, Frank, Harris, Shriver & Jacobson LLP. |
|
10.1 |
+ |
Senior Secured Asset Based Revolving Credit Facility, dated October 5, 2011, by and among At Home Holding III Inc. and At Home Stores LLC, with At Home Holding II Inc. as parent guarantor, certain of At Home Holding II Inc.'s indirect wholly-owned domestic subsidiaries as subsidiary guarantors, the lenders party thereto and Bank of America, N.A., as administrative agent and collateral agent. |
|
10.1.1 |
+ |
First Amendment to Credit Agreement, dated May 9, 2012, by and among At Home Holding III Inc. and At Home Stores LLC, with At Home Holding II Inc. as parent guarantor, certain of At Home Holding II Inc.'s indirect wholly-owned domestic subsidiaries as subsidiary guarantors, the lenders party thereto and Bank of America, N.A., as administrative agent and collateral agent. |
|
10.1.2 |
+ |
Second Amendment to Credit Agreement, dated May 23, 2013, by and among At Home Holding III Inc. and At Home Stores LLC, with At Home Holding II Inc. as parent guarantor, certain of At Home Holding II Inc.'s indirect wholly-owned domestic subsidiaries as subsidiary guarantors, the lenders party thereto and Bank of America, N.A., as administrative agent and collateral agent. |
|
10.1.3 |
+ |
Third Amendment to Credit Agreement, dated July 28, 2014, by and among At Home Holding III Inc. and At Home Stores LLC, with At Home Holding II Inc. as parent guarantor, certain of At Home Holding II Inc.'s indirect wholly-owned domestic subsidiaries as subsidiary guarantors, the lenders party thereto and Bank of America, N.A., as administrative agent and collateral agent. |
|
10.1.4 |
+ |
Assumption and Ratification Agreement, dated September 29, 2014, by and among At Home Holding III Inc. and At Home Stores LLC, with At Home Holding II Inc. as parent guarantor, certain of At Home Holding II Inc.'s indirect wholly-owned domestic subsidiaries as subsidiary guarantors, the lenders party thereto and Bank of America, N.A., as administrative agent and collateral agent. |
|
10.1.5 |
+ |
Fourth Amendment to Credit Agreement, dated June 5, 2015, by and among At Home Holding III Inc. and At Home Stores LLC, with At Home Holding II Inc. as parent guarantor, certain of At Home Holding II Inc.'s indirect wholly-owned domestic subsidiaries as subsidiary guarantors, the lenders party thereto and Bank of America, N.A., as administrative agent and collateral agent. |
|
II-6
| Exhibit No. | Exhibit Description | ||
|---|---|---|---|
| 10.2 | + | Senior Secured First Lien Term Loan Facility, dated June 5, 2015, by and between At Home Holding III Inc., with At Home Holding II Inc. as parent guarantor, certain of At Home Holding II Inc.'s indirect wholly-owned domestic subsidiaries as subsidiary guarantors, the lenders party thereto and Bank of America, N.A., as administrative agent and collateral agent. | |
10.3 |
+ |
Senior Secured Second Lien Term Loan Facility, dated June 5, 2015, by and between At Home Holding III Inc., with At Home Holding II Inc. as parent guarantor, certain of At Home Holding II Inc.'s indirect wholly-owned domestic subsidiaries as subsidiary guarantors, the lenders party thereto and Dynasty Financial II, LLC, as administrative agent and collateral agent. |
|
10.4 |
+† |
Employment Agreement by and between Garden Ridge Corporation, At Home Group Inc. (f/k/a GRD Holding I Corporation) and Lewis L. Bird III, dated as of November 15, 2012. |
|
10.4.1 |
+† |
Amendment to Employment Agreement by and between Garden Ridge Corporation, At Home Group Inc. (f/k/a GRD Holding I Corporation) and Lewis L. Bird III, dated as of November 1, 2013. |
|
10.5 |
+† |
Employment Agreement by and between Garden Ridge Corporation, At Home Group Inc. (f/k/a GRD Holding I Corporation) and Judd T. Nystrom, dated as of January 25, 2013. |
|
10.5.1 |
+† |
Amendment to Employment Agreement by and between Garden Ridge Corporation, At Home Group Inc. (f/k/a GRD Holding I Corporation) and Judd T. Nystrom, dated as of November 1, 2013. |
|
10.6 |
+† |
Employment Agreement by and between Garden Ridge Corporation, At Home Group Inc. (f/k/a GRD Holding I Corporation) and Peter S.G. Corsa, dated as of February 2, 2013. |
|
10.6.1 |
+† |
Amendment to Employment Agreement by and between Garden Ridge Corporation, At Home Group Inc. (f/k/a GRD Holding I Corporation) and Peter S.G. Corsa, dated as of November 1, 2013. |
|
10.7 |
+† |
At Home Group Inc. (f/k/a GRD Holding I Corporation) Stock Option Plan, effective as of November 12, 2012. |
|
10.8 |
+† |
Nonqualified Stock Option Agreement by and between At Home Group Inc. (f/k/a GRD Holding I Corporation) and Lewis L. Bird III, dated as of November 26, 2012. |
|
10.8.1 |
+† |
Letter Agreement by and between At Home Group Inc. (f/k/a GRD Holding I Corporation) and Lewis L. Bird III, dated as of November 26, 2012. |
|
10.8.2 |
+† |
Amendment to Nonqualified Stock Option Agreement by and between At Home Group Inc. (f/k/a GRD Holding I Corporation) and Lewis L. Bird III, dated as of December 4, 2012. |
|
10.9 |
+† |
Nonqualified Stock Option Agreement by and between At Home Group Inc. (f/k/a GRD Holding I Corporation) and Judd T. Nystrom, dated as of January 31, 2013. |
|
10.9.1 |
+† |
Amendment to Nonqualified Stock Option Agreement between At Home Group Inc. (f/k/a GRD Holding I Corporation) and Judd T. Nystrom, dated as of February 18, 2013. |
|
10.10 |
+† |
Nonqualified Stock Option Agreement by and between At Home Group Inc. (f/k/a GRD Holding I Corporation) and Judd T. Nystrom, dated as of June 3, 2014. |
|
10.11 |
+† |
Nonqualified Stock Option Agreement by and between At Home Group Inc. (f/k/a GRD Holding I Corporation) and Peter S.G. Corsa, dated as of January 10, 2013. |
|
II-7
| Exhibit No. | Exhibit Description | ||
|---|---|---|---|
| 10.11.1 | +† | Amendment to Nonqualified Stock Option Agreement between At Home Group Inc. (f/k/a GRD Holding I Corporation) and Peter S.G. Corsa, dated as of March 25, 2013. | |
10.12 |
+† |
Nonqualified Stock Option Agreement by and between At Home Group Inc. (f/k/a GRD Holding I Corporation) and Peter S.G. Corsa, dated as of June 3, 2014. |
|
10.13 |
*† |
At Home Group Inc. Annual Bonus Plan. |
|
10.14 |
*† |
At Home Group Inc. Equity Incentive Plan. |
|
10.15 |
*† |
At Home Group Inc. Form of Option Award Agreement. |
|
10.16 |
* |
Form of Indemnification Agreement. |
|
21.1 |
+ |
List of subsidiaries of At Home Group Inc. |
|
23.1 |
** |
Consent of Ernst & Young LLP, independent registered public accounting firm. |
|
23.2 |
* |
Consent of Fried, Frank, Harris, Shriver & Jacobson LLP (included in Exhibit 5.1). |
|
23.3 |
+ |
Consent of Buxton Company. |
|
23.4 |
+ |
Consent of Russell Research, Inc. |
|
24.1 |
+ |
Power of Attorney. |
|
- *
- To
be filed by amendment.
- **
- Filed
herewith.
- +
- Previously
filed.
- †
- Indicates management contracts or compensatory plans or arrangements in which our executive officers or directors participate.
II-8