Attached files
| file | filename |
|---|---|
| 8-K - 8-K - NephroGenex, Inc. | a15-20684_18k.htm |
Exhibit 99.1
|
|
Corporate Presentation October 2015 |
|
|
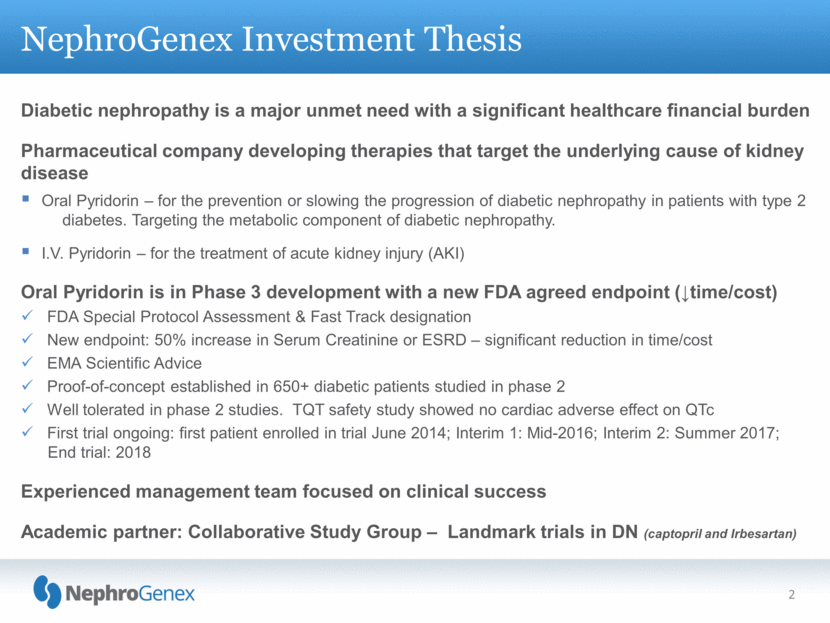
NephroGenex Investment Thesis 2 Diabetic nephropathy is a major unmet need with a significant healthcare financial burden Pharmaceutical company developing therapies that target the underlying cause of kidney disease Oral Pyridorin – for the prevention or slowing the progression of diabetic nephropathy in patients with type 2 diabetes. Targeting the metabolic component of diabetic nephropathy. I.V. Pyridorin – for the treatment of acute kidney injury (AKI) Oral Pyridorin is in Phase 3 development with a new FDA agreed endpoint (time/cost) FDA Special Protocol Assessment & Fast Track designation New endpoint: 50% increase in Serum Creatinine or ESRD – significant reduction in time/cost EMA Scientific Advice Proof-of-concept established in 650+ diabetic patients studied in phase 2 Well tolerated in phase 2 studies. TQT safety study showed no cardiac adverse effect on QTc First trial ongoing: first patient enrolled in trial June 2014; Interim 1: Mid-2016; Interim 2: Summer 2017; End trial: 2018 Experienced management team focused on clinical success Academic partner: Collaborative Study Group – Landmark trials in DN (captopril and Irbesartan) |
|
|
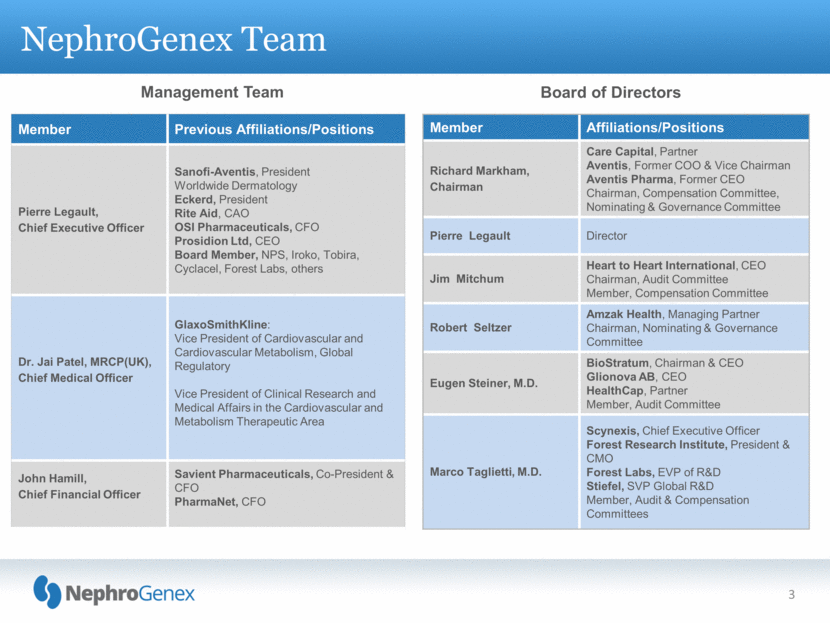
NephroGenex Team Member Previous Affiliations/Positions Pierre Legault, Chief Executive Officer Sanofi-Aventis, President Worldwide Dermatology Eckerd, President Rite Aid, CAO OSI Pharmaceuticals, CFO Prosidion Ltd, CEO Board Member, NPS, Iroko, Tobira, Cyclacel, Forest Labs, others Dr. Jai Patel, MRCP(UK), Chief Medical Officer GlaxoSmithKline: Vice President of Cardiovascular and Cardiovascular Metabolism, Global Regulatory Vice President of Clinical Research and Medical Affairs in the Cardiovascular and Metabolism Therapeutic Area John Hamill, Chief Financial Officer Savient Pharmaceuticals, Co-President & CFO PharmaNet, CFO Management Team Board of Directors Member Affiliations/Positions Richard Markham, Chairman Care Capital, Partner Aventis, Former COO & Vice Chairman Aventis Pharma, Former CEO Chairman, Compensation Committee, Nominating & Governance Committee Pierre Legault Director Jim Mitchum Heart to Heart International, CEO Chairman, Audit Committee Member, Compensation Committee Robert Seltzer Amzak Health, Managing Partner Chairman, Nominating & Governance Committee Eugen Steiner, M.D. BioStratum, Chairman & CEO Glionova AB, CEO HealthCap, Partner Member, Audit Committee Marco Taglietti, M.D. Scynexis, Chief Executive Officer Forest Research Institute, President & CMO Forest Labs, EVP of R&D Stiefel, SVP Global R&D Member, Audit & Compensation Committees 3 |
|
|
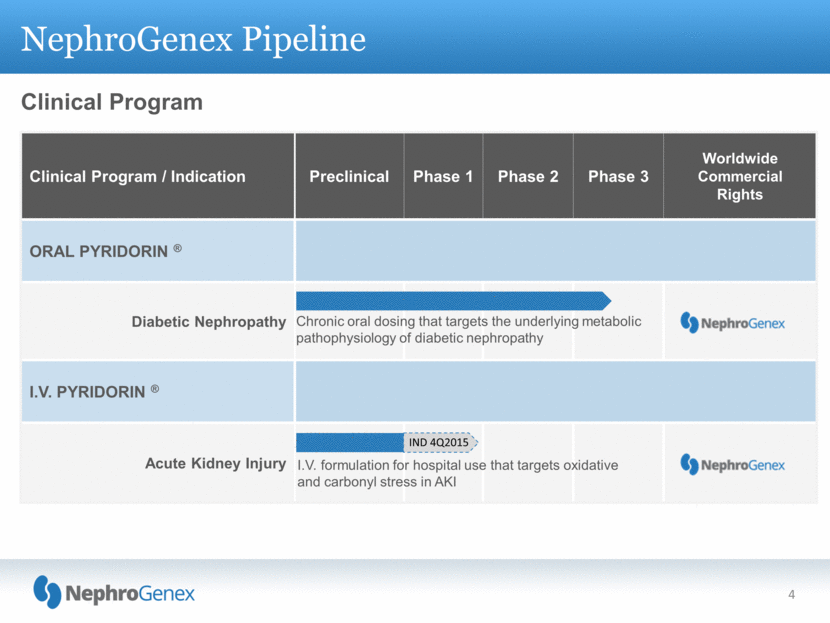
NephroGenex Pipeline Clinical Program Clinical Program / Indication Preclinical Phase 1 Phase 2 Phase 3 Worldwide Commercial Rights ORAL PYRIDORIN ® Diabetic Nephropathy I.V. PYRIDORIN ® Acute Kidney Injury Chronic oral dosing that targets the underlying metabolic pathophysiology of diabetic nephropathy I.V. formulation for hospital use that targets oxidative and carbonyl stress in AKI 4 IND 4Q2015 |
|
|
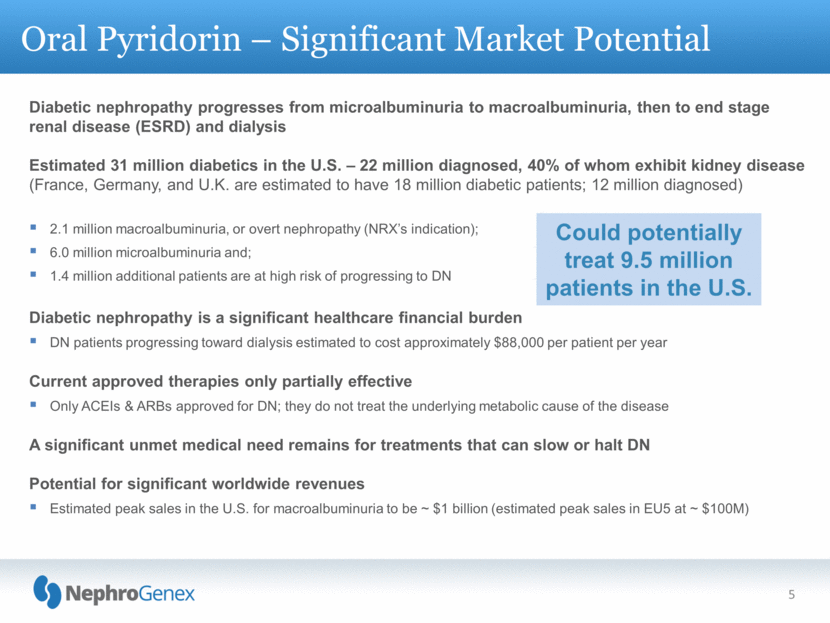
Oral Pyridorin – Significant Market Potential 5 Diabetic nephropathy progresses from microalbuminuria to macroalbuminuria, then to end stage renal disease (ESRD) and dialysis Estimated 31 million diabetics in the U.S. – 22 million diagnosed, 40% of whom exhibit kidney disease (France, Germany, and U.K. are estimated to have 18 million diabetic patients; 12 million diagnosed) 2.1 million macroalbuminuria, or overt nephropathy (NRX’s indication); 6.0 million microalbuminuria and; 1.4 million additional patients are at high risk of progressing to DN Diabetic nephropathy is a significant healthcare financial burden DN patients progressing toward dialysis estimated to cost approximately $88,000 per patient per year Current approved therapies only partially effective Only ACEIs & ARBs approved for DN; they do not treat the underlying metabolic cause of the disease A significant unmet medical need remains for treatments that can slow or halt DN Potential for significant worldwide revenues Estimated peak sales in the U.S. for macroalbuminuria to be ~ $1 billion (estimated peak sales in EU5 at ~ $100M) Could potentially treat 9.5 million patients in the U.S. |
|
|
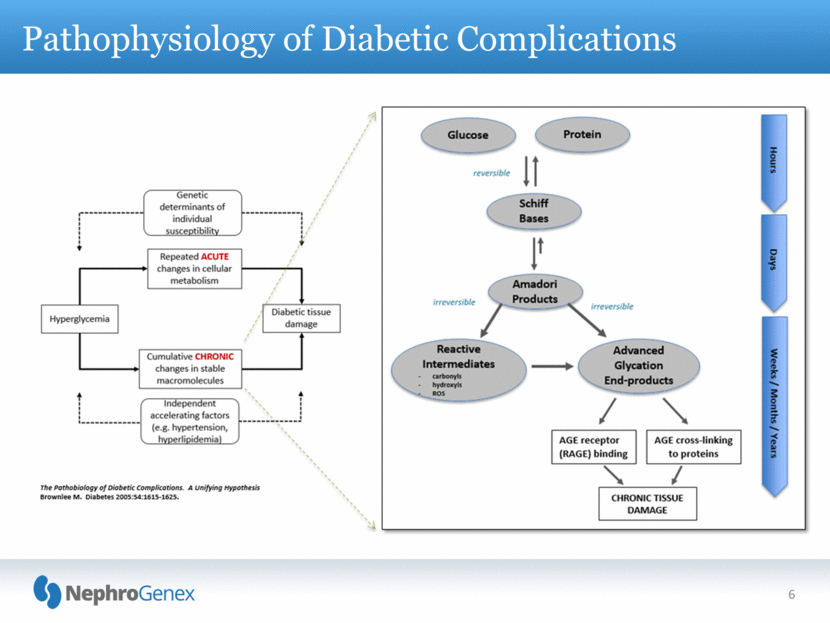
6 Pathophysiology of Diabetic Complications |
|
|
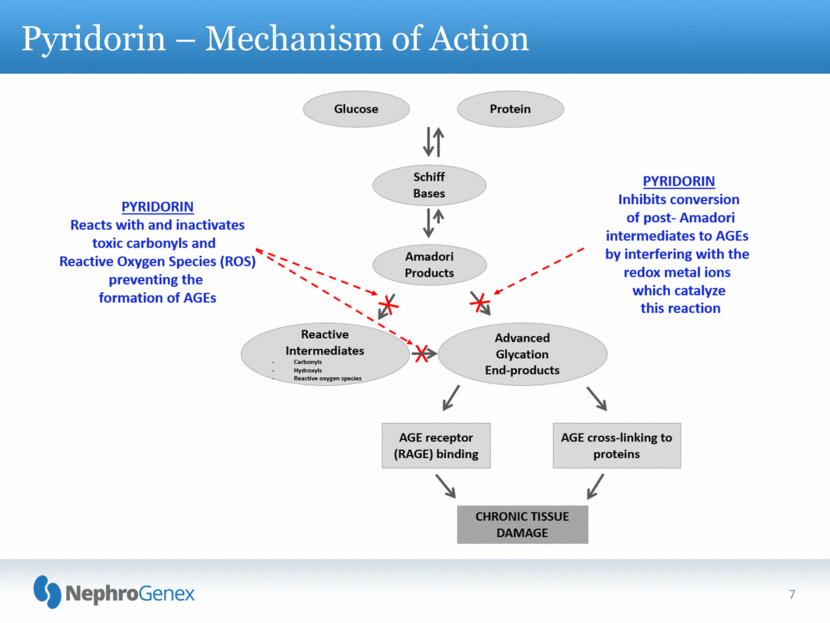
7 Pyridorin – Mechanism of Action |
|
|
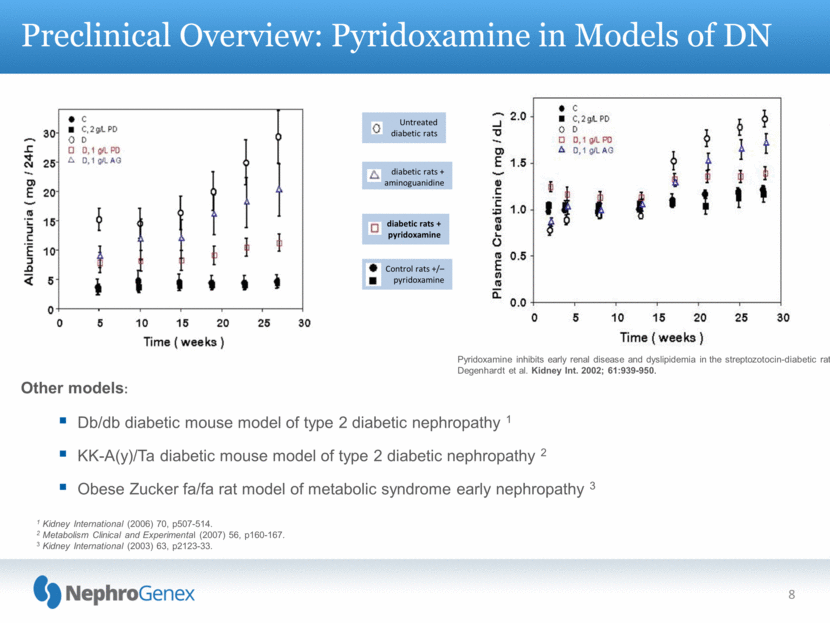
8 Other models: Db/db diabetic mouse model of type 2 diabetic nephropathy 1 KK-A(y)/Ta diabetic mouse model of type 2 diabetic nephropathy 2 Obese Zucker fa/fa rat model of metabolic syndrome early nephropathy 3 Preclinical Overview: Pyridoxamine in Models of DN Control rats +/– pyridoxamine Untreated diabetic rats diabetic rats + aminoguanidine diabetic rats + pyridoxamine Pyridoxamine inhibits early renal disease and dyslipidemia in the streptozotocin-diabetic rat. Degenhardt et al. Kidney Int. 2002; 61:939-950. 1 Kidney International (2006) 70, p507-514. 2 Metabolism Clinical and Experimental (2007) 56, p160-167. 3 Kidney International (2003) 63, p2123-33. |
|
|
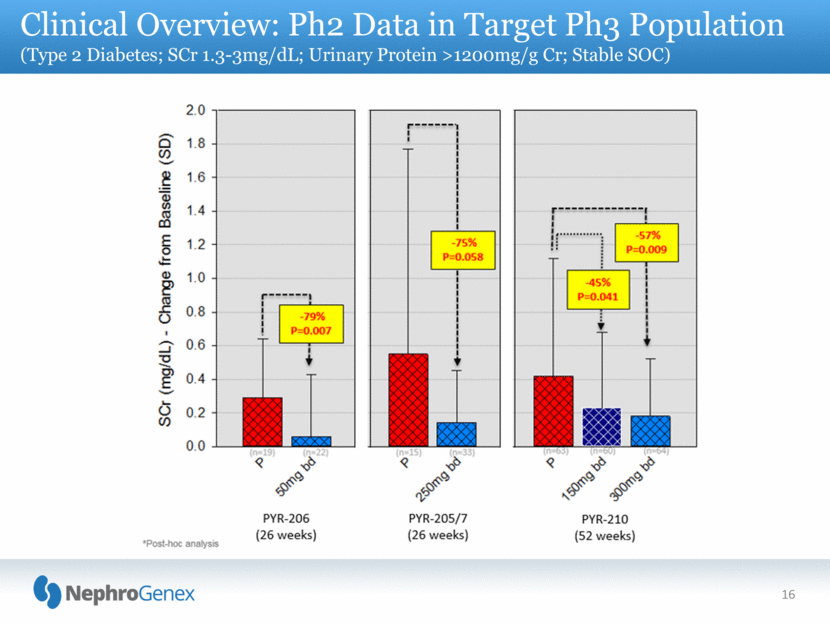
9 Clinical Overview: Ph2 Data in Target Ph3 Population (Type 2 Diabetes; SCr 1.3-3mg/dL; Urinary Protein >1200mg/g Cr; Stable SOC) |

|
|
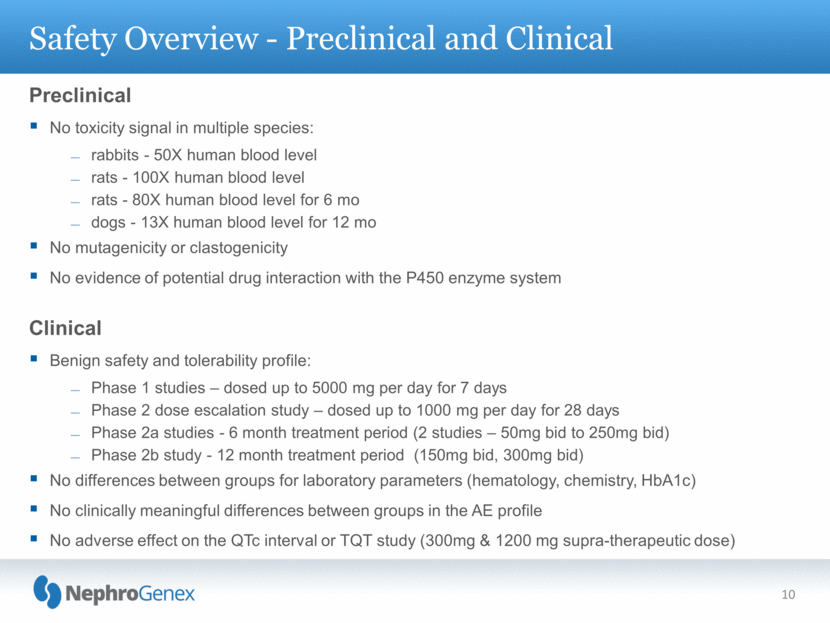
10 Preclinical No toxicity signal in multiple species: rabbits - 50X human blood level rats - 100X human blood level rats - 80X human blood level for 6 mo dogs - 13X human blood level for 12 mo No mutagenicity or clastogenicity No evidence of potential drug interaction with the P450 enzyme system Clinical Benign safety and tolerability profile: Phase 1 studies – dosed up to 5000 mg per day for 7 days Phase 2 dose escalation study – dosed up to 1000 mg per day for 28 days Phase 2a studies - 6 month treatment period (2 studies – 50mg bid to 250mg bid) Phase 2b study - 12 month treatment period (150mg bid, 300mg bid) No differences between groups for laboratory parameters (hematology, chemistry, HbA1c) No clinically meaningful differences between groups in the AE profile No adverse effect on the QTc interval or TQT study (300mg & 1200 mg supra-therapeutic dose) Safety Overview - Preclinical and Clinical 10 |
|
|
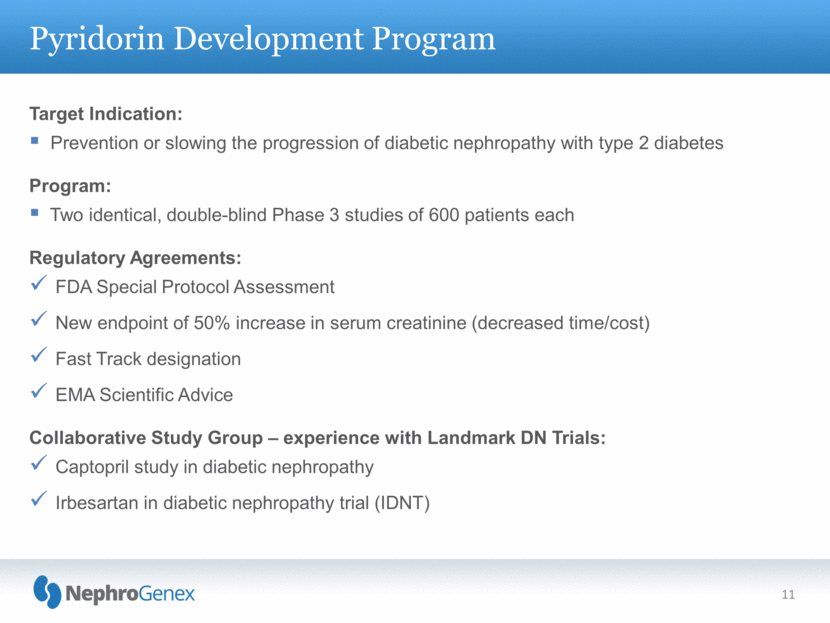
11 Target Indication: Prevention or slowing the progression of diabetic nephropathy with type 2 diabetes Program: Two identical, double-blind Phase 3 studies of 600 patients each Regulatory Agreements: FDA Special Protocol Assessment New endpoint of 50% increase in serum creatinine (decreased time/cost) Fast Track designation EMA Scientific Advice Collaborative Study Group – experience with Landmark DN Trials: Captopril study in diabetic nephropathy Irbesartan in diabetic nephropathy trial (IDNT) Pyridorin Development Program |
|
|
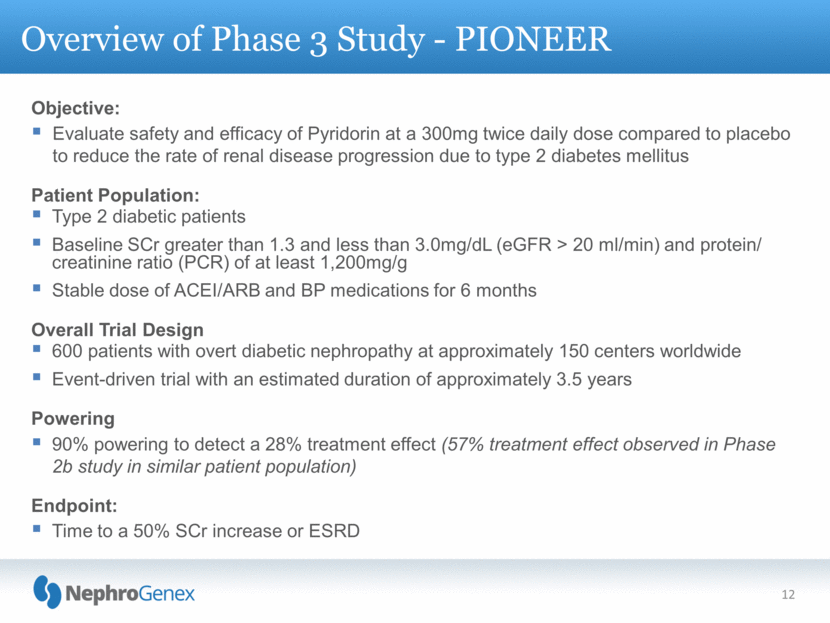
Objective: Evaluate safety and efficacy of Pyridorin at a 300mg twice daily dose compared to placebo to reduce the rate of renal disease progression due to type 2 diabetes mellitus Patient Population: Type 2 diabetic patients Baseline SCr greater than 1.3 and less than 3.0mg/dL (eGFR > 20 ml/min) and protein/ creatinine ratio (PCR) of at least 1,200mg/g Stable dose of ACEI/ARB and BP medications for 6 months Overall Trial Design 600 patients with overt diabetic nephropathy at approximately 150 centers worldwide Event-driven trial with an estimated duration of approximately 3.5 years Powering 90% powering to detect a 28% treatment effect (57% treatment effect observed in Phase 2b study in similar patient population) Endpoint: Time to a 50% SCr increase or ESRD Overview of Phase 3 Study - PIONEER 12 |
|
|
Primary Endpoints: Evaluate Pyridorin 300mg twice daily (BID) efficacy compared to placebo in reducing the rate of progression of renal disease due to type 2 diabetes mellitus. With time to the composite endpoint consisting of the earliest event amongst: A serum creatinine (SCr) increase of >50% from baseline, or End stage renal disease (ESRD) Key Secondary Endpoints: Time to the composite endpoint event of a SCr increase of 100% from baseline or ESRD Safety of Pyridorin compared to placebo, as assessed by adverse events, 12-lead electrocardiograms (ECGs), vital signs, physical examination, clinical chemistries, glycosylated hemoglobin (HbA1c), and hematology Additional secondary objectives of the study (Pyridorin 300mg BID to placebo) at year 1 and 2: Change in SCr from baseline Change in serum cystatin-C from baseline Change in urine protein/creatinine ratio (PCR) from baseline Change in urinary transforming growth factor-beta (TGF-) excretion from baseline PIONEER Pyridorin Phase 3 Trials Protocol 13 ESRD is defined as the initiation of permanent dialysis, receiving a kidney transplant, or a SCr value 6.0mg/dL (528 mol/L) with a second SCr confirmation value 6.0mg/dL (528 mol/L) obtained 4 – 6 weeks later |
|
|
PIONEER Phase 3 Interim Analysis 14 DSMB: Monitoring unblinded safety information on an ongoing basis Interim Analysis 1* (mid-2016): Independent biostatistician will undertake an interim analysis when at least 150 patients have completed a minimum of 12 months on treatment Interim Analysis 2* (summer-2017): Independent biostatistician will undertake an interim analysis when approximately 50% of the primary endpoint events of 50% increase in SCr or ESRD have been accrued Interim Analysis Output: The study is on track to reach the primary endpoint The study will need additional events than originally planned to reach the primary endpoint The study is unlikely to reach the primary endpoint and results should be examined to generate new hypothesis for investigation * Timing and design to be finalized & agreed with FDA |
|
|
Summary of Phase 2 Data |
|
|
16 Clinical Overview: Ph2 Data in Target Ph3 Population (Type 2 Diabetes; SCr 1.3-3mg/dL; Urinary Protein >1200mg/g Cr; Stable SOC) |
|
|
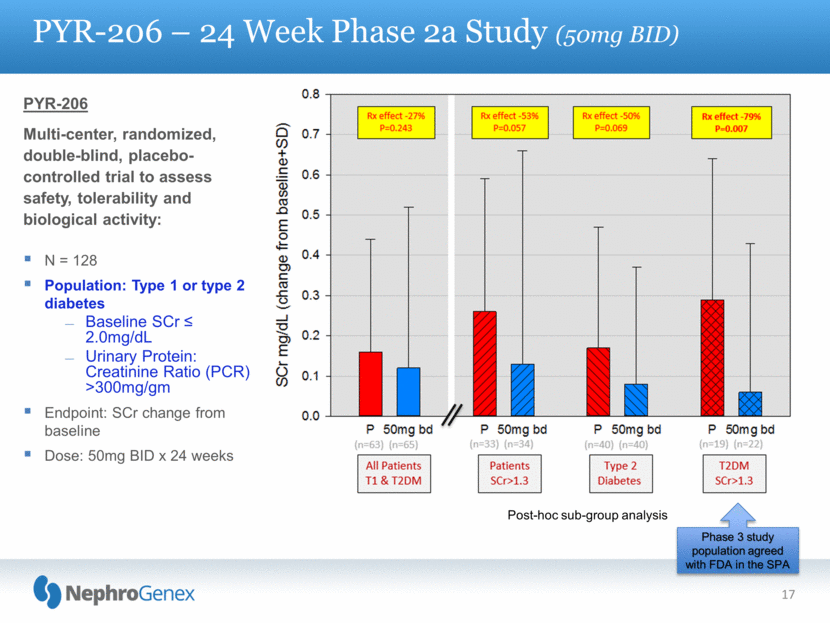
17 PYR-206 – 24 Week Phase 2a Study (50mg BID) PYR-206 Multi-center, randomized, double-blind, placebo-controlled trial to assess safety, tolerability and biological activity: N = 128 Population: Type 1 or type 2 diabetes Baseline SCr < 2.0mg/dL Urinary Protein: Creatinine Ratio (PCR) >300mg/gm Endpoint: SCr change from baseline Dose: 50mg BID x 24 weeks Post-hoc sub-group analysis Phase 3 study population agreed with FDA in the SPA |
|
|
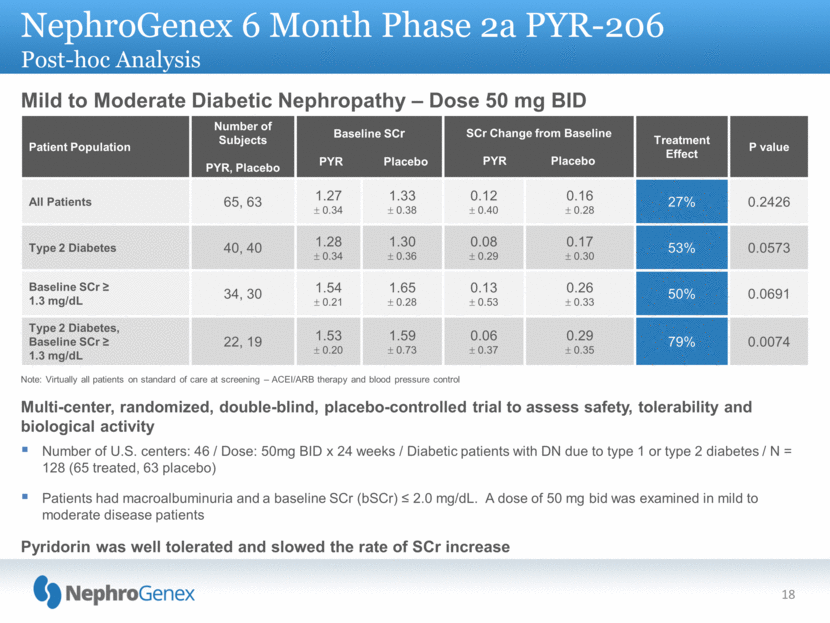
NephroGenex 6 Month Phase 2a PYR-206 Post-hoc Analysis Mild to Moderate Diabetic Nephropathy – Dose 50 mg BID Patient Population Number of Subjects PYR, Placebo Baseline SCr PYR Placebo SCr Change from Baseline PYR Placebo Treatment Effect P value All Patients 65, 63 1.27 0.34 1.33 0.38 0.12 0.40 0.16 0.28 27% 0.2426 Type 2 Diabetes 40, 40 1.28 0.34 1.30 0.36 0.08 0.29 0.17 0.30 53% 0.0573 Baseline SCr 1.3 mg/dL 34, 30 1.54 0.21 1.65 0.28 0.13 0.53 0.26 0.33 50% 0.0691 Type 2 Diabetes, Baseline SCr 1.3 mg/dL 22, 19 1.53 0.20 1.59 0.73 0.06 0.37 0.29 0.35 79% 0.0074 Note: Virtually all patients on standard of care at screening – ACEI/ARB therapy and blood pressure control Multi-center, randomized, double-blind, placebo-controlled trial to assess safety, tolerability and biological activity Number of U.S. centers: 46 / Dose: 50mg BID x 24 weeks / Diabetic patients with DN due to type 1 or type 2 diabetes / N = 128 (65 treated, 63 placebo) Patients had macroalbuminuria and a baseline SCr (bSCr) 2.0 mg/dL. A dose of 50 mg bid was examined in mild to moderate disease patients Pyridorin was well tolerated and slowed the rate of SCr increase 18 |
|
|
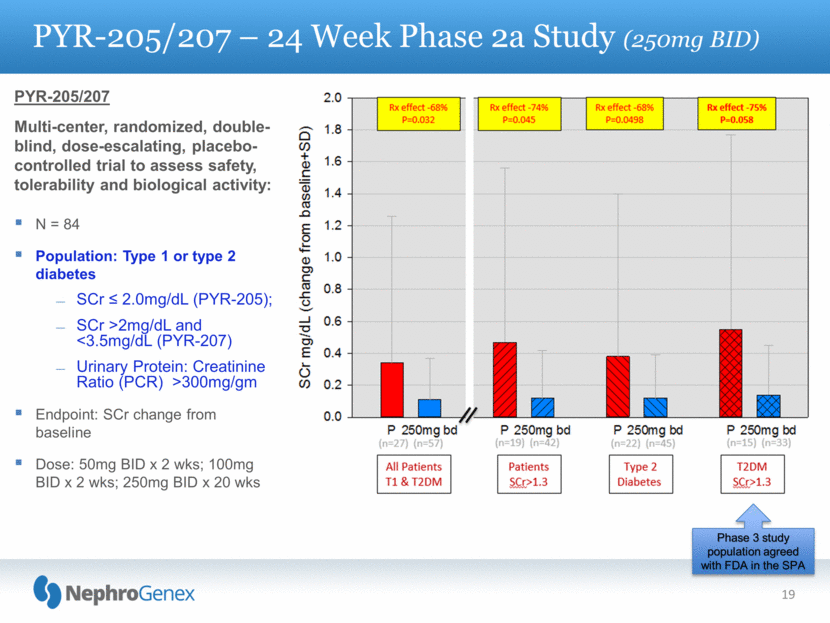
19 PYR-205/207 – 24 Week Phase 2a Study (250mg BID) PYR-205/207 Multi-center, randomized, double-blind, dose-escalating, placebo-controlled trial to assess safety, tolerability and biological activity: N = 84 Population: Type 1 or type 2 diabetes SCr 2.0mg/dL (PYR-205); SCr >2mg/dL and <3.5mg/dL (PYR-207) Urinary Protein: Creatinine Ratio (PCR) >300mg/gm Endpoint: SCr change from baseline Dose: 50mg BID x 2 wks; 100mg BID x 2 wks; 250mg BID x 20 wks Phase 3 study population agreed with FDA in the SPA |
|
|
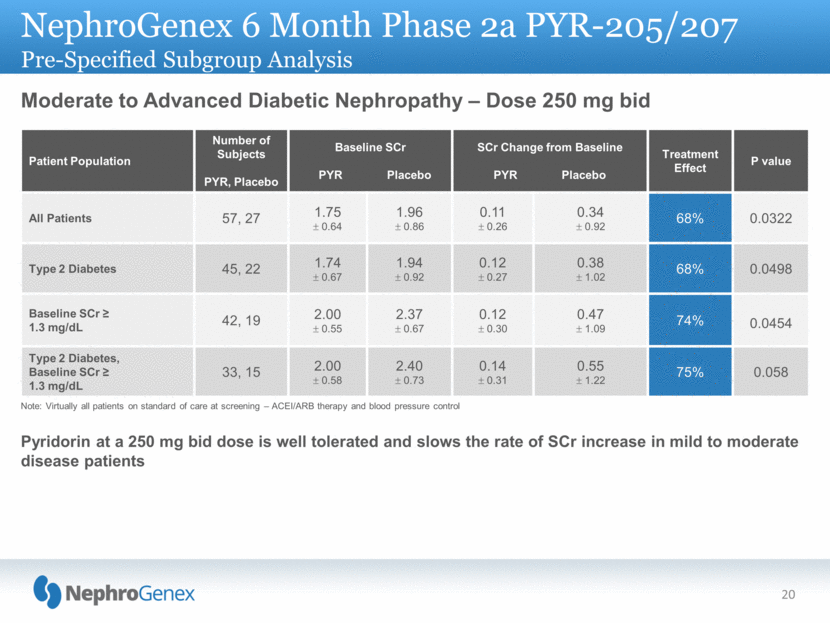
NephroGenex 6 Month Phase 2a PYR-205/207 Pre-Specified Subgroup Analysis Moderate to Advanced Diabetic Nephropathy – Dose 250 mg bid Note: Virtually all patients on standard of care at screening – ACEI/ARB therapy and blood pressure control Pyridorin at a 250 mg bid dose is well tolerated and slows the rate of SCr increase in mild to moderate disease patients 20 Patient Population Number of Subjects PYR, Placebo Baseline SCr PYR Placebo SCr Change from Baseline PYR Placebo Treatment Effect P value All Patients 57, 27 1.75 0.64 1.96 0.86 0.11 0.26 0.34 0.92 68% 0.0322 Type 2 Diabetes 45, 22 1.74 0.67 1.94 0.92 0.12 0.27 0.38 1.02 68% 0.0498 Baseline SCr > 1.3 mg/dL 42, 19 2.00 0.55 2.37 0.67 0.12 0.30 0.47 1.09 74% 0.0454 Type 2 Diabetes, Baseline SCr 1.3 mg/dL 33, 15 2.00 0.58 2.40 0.73 0.14 0.31 0.55 1.22 75% 0.058 |
|
|
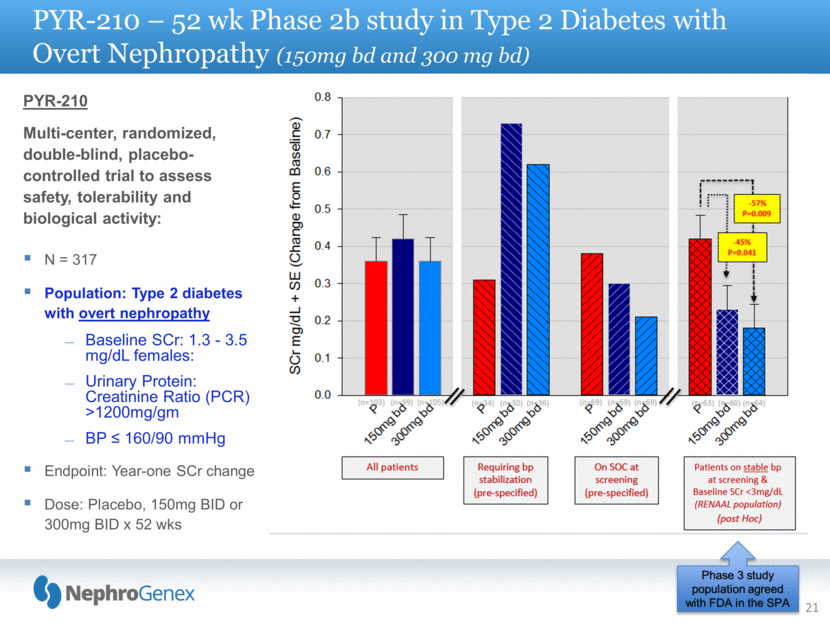
21 PYR-210 – 52 wk Phase 2b study in Type 2 Diabetes with Overt Nephropathy (150mg bd and 300 mg bd) PYR-210 Multi-center, randomized, double-blind, placebo-controlled trial to assess safety, tolerability and biological activity: N = 317 Population: Type 2 diabetes with overt nephropathy Baseline SCr: 1.3 - 3.5 mg/dL females: Urinary Protein: Creatinine Ratio (PCR) >1200mg/gm BP 160/90 mmHg Endpoint: Year-one SCr change Dose: Placebo, 150mg BID or 300mg BID x 52 wks Phase 3 study population agreed with FDA in the SPA |
|
|
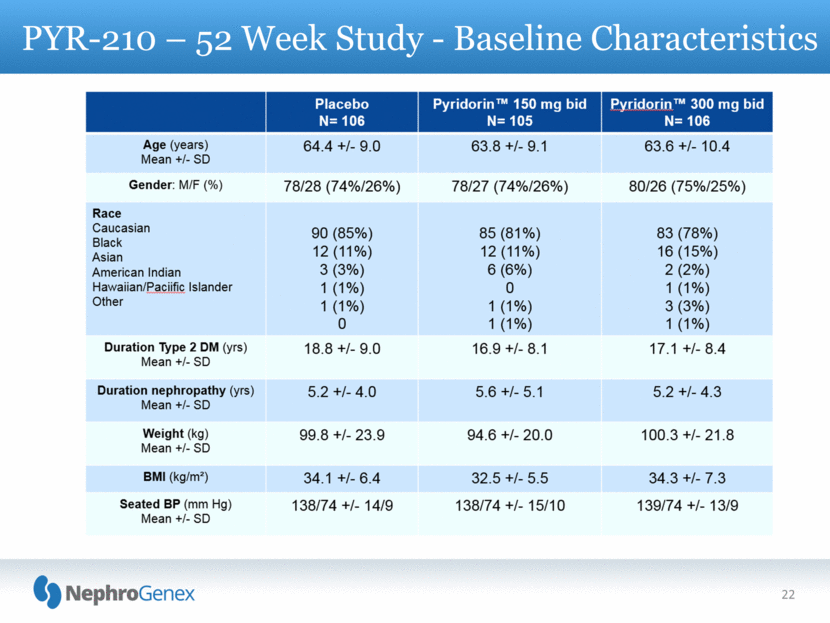
22 PYR-210 – 52 Week Study - Baseline Characteristics |
|
|
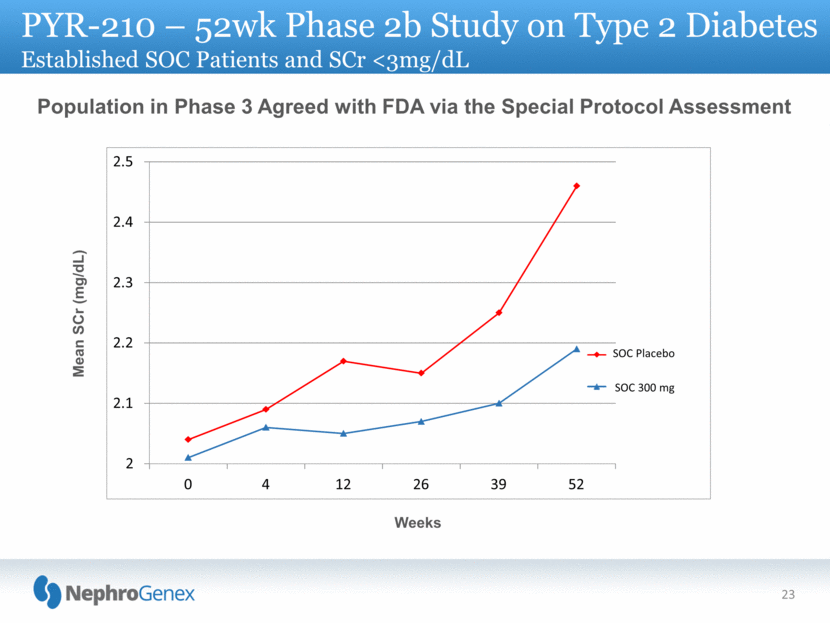
2 2.1 2.2 2.3 2.4 2.5 0 4 12 26 39 52 SOC Placebo SOC 300 mg 23 Population in Phase 3 Agreed with FDA via the Special Protocol Assessment Weeks Mean SCr (mg/dL) PYR-210 – 52wk Phase 2b Study on Type 2 Diabetes Established SOC Patients and SCr <3mg/dL |
|
|
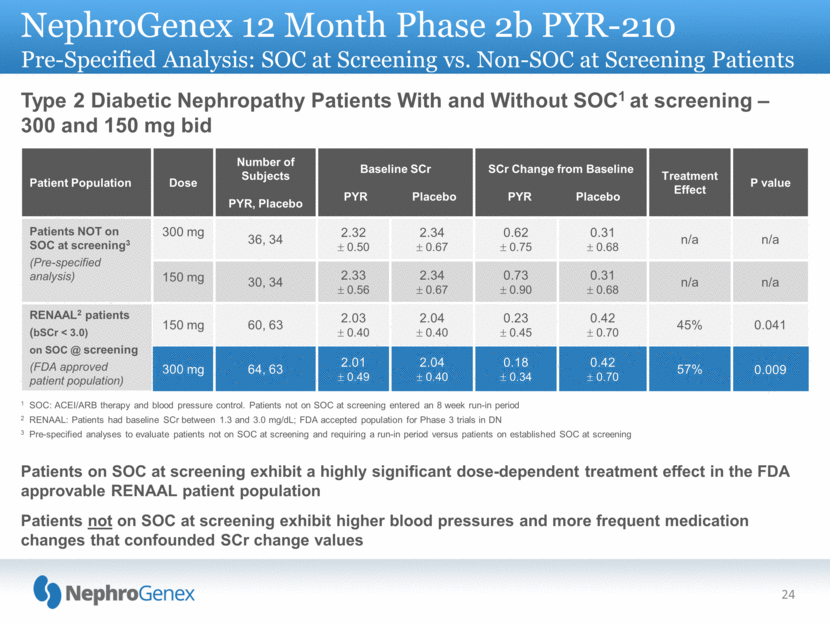
NephroGenex 12 Month Phase 2b PYR-210 Pre-Specified Analysis: SOC at Screening vs. Non-SOC at Screening Patients analysis Type 2 Diabetic Nephropathy Patients With and Without SOC1 at screening – 300 and 150 mg bid 1 SOC: ACEI/ARB therapy and blood pressure control. Patients not on SOC at screening entered an 8 week run-in period 2 RENAAL: Patients had baseline SCr between 1.3 and 3.0 mg/dL; FDA accepted population for Phase 3 trials in DN 3 Pre-specified analyses to evaluate patients not on SOC at screening and requiring a run-in period versus patients on established SOC at screening Patients on SOC at screening exhibit a highly significant dose-dependent treatment effect in the FDA approvable RENAAL patient population Patients not on SOC at screening exhibit higher blood pressures and more frequent medication changes that confounded SCr change values 24 Patient Population Dose Number of Subjects PYR, Placebo Baseline SCr PYR Placebo SCr Change from Baseline PYR Placebo Treatment Effect P value Patients NOT on SOC at screening3 (Pre-specified analysis) 300 mg 36, 34 2.32 0.50 2.34 0.67 0.62 0.75 0.31 0.68 n/a n/a 150 mg 30, 34 2.33 0.56 2.34 0.67 0.73 0.90 0.31 0.68 n/a n/a RENAAL2 patients (bSCr < 3.0) on SOC @ screening (FDA approved patient population) 150 mg 60, 63 2.03 0.40 2.04 0.40 0.23 0.45 0.42 0.70 45% 0.041 300 mg 64, 63 2.01 0.49 2.04 0.40 0.18 0.34 0.42 0.70 57% 0.009 |
|
|
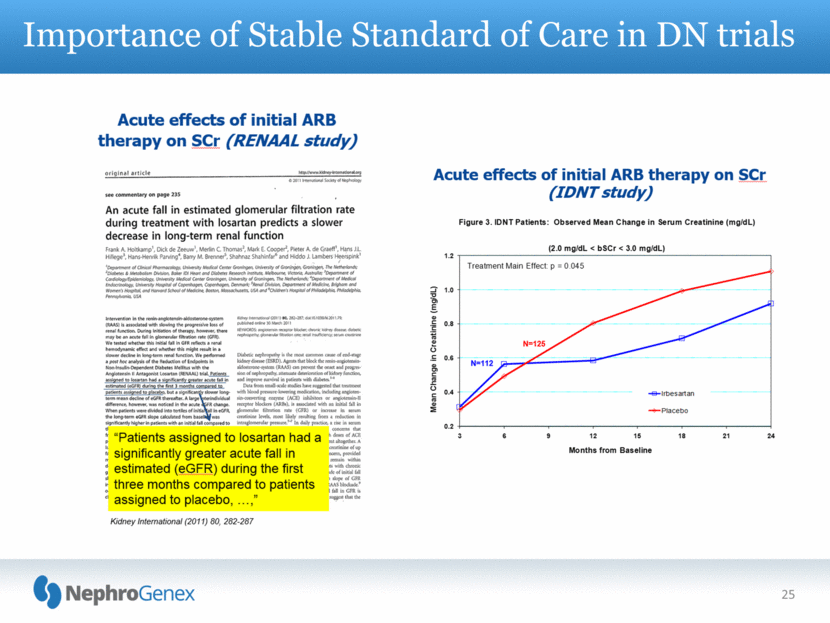
25 Importance of Stable Standard of Care in DN trials |
|
|
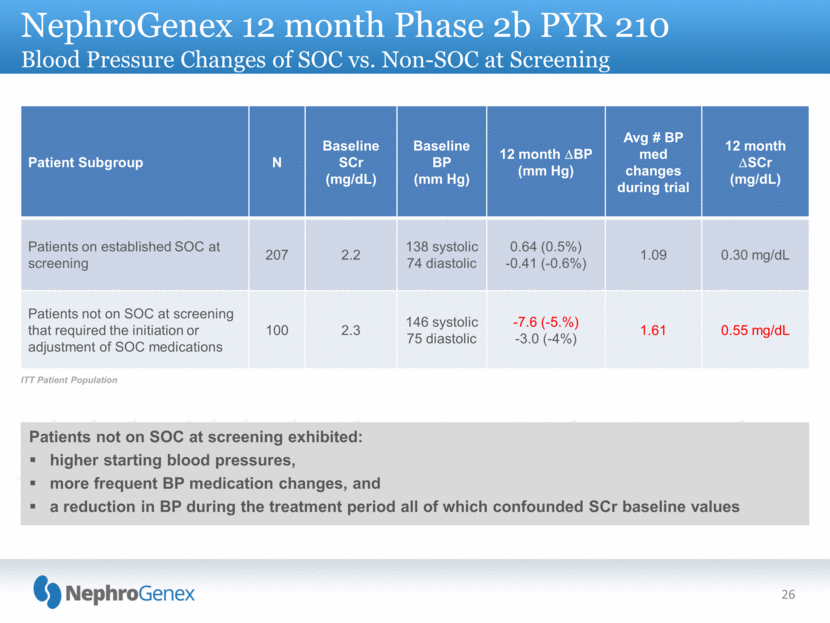
NephroGenex 12 month Phase 2b PYR 210 Blood Pressure Changes of SOC vs. Non-SOC at Screening analysis 26 Patients not on SOC at screening exhibited: higher starting blood pressures, more frequent BP medication changes, and a reduction in BP during the treatment period all of which confounded SCr baseline values ITT Patient Population Patient Subgroup N Baseline SCr (mg/dL) Baseline BP (mm Hg) 12 month BP (mm Hg) Avg # BP med changes during trial 12 month SCr (mg/dL) Patients on established SOC at screening 207 2.2 138 systolic 74 diastolic 0.64 (0.5%) -0.41 (-0.6%) 1.09 0.30 mg/dL Patients not on SOC at screening that required the initiation or adjustment of SOC medications 100 2.3 146 systolic 75 diastolic -7.6 (-5.%) -3.0 (-4%) 1.61 0.55 mg/dL |
|
|
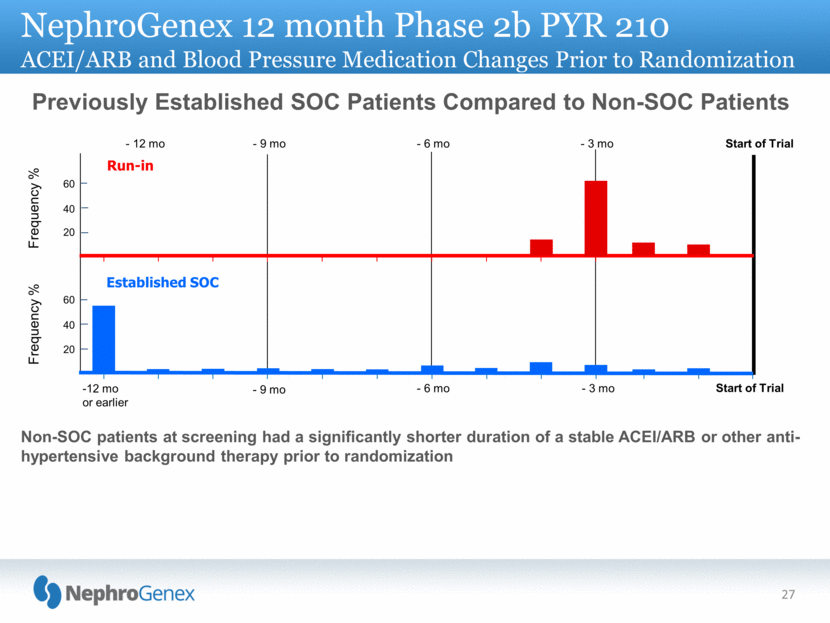
NephroGenex 12 month Phase 2b PYR 210 ACEI/ARB and Blood Pressure Medication Changes Prior to Randomization analysis 27 Frequency % Run-in Start of Trial - 6 mo Frequency % - 12 mo Established SOC - 9 mo - 3 mo Start of Trial - 6 mo 12 mo or earlier - 9 mo - 3 mo 60 20 60 20 40 40 Non-SOC patients at screening had a significantly shorter duration of a stable ACEI/ARB or other anti-hypertensive background therapy prior to randomization Previously Established SOC Patients Compared to Non-SOC Patients |
|
|
28 The FDA is aware of this observed effect and requires sponsors to account for possible acute changes in SCr arising from ACEi/ARB/BP medication changes that could impact the SCr baseline and SCr-based calculated treatment effects. A pre-specified analysis was included in the Phase 2b Statistical Analysis Plan to evaluate the adequacy of an 8 week stabilization period on the year-one SCr change endpoint. The 8-week run-in period was not adequate to establish a stable baseline in patients with more advanced diabetic kidney disease. These data established the basis for the FDA agreeing to exclude patients not on long term stable standard of care medications from the PYR-311 patient population. Importance of Stable Standard of Care in DN trials |
|
|
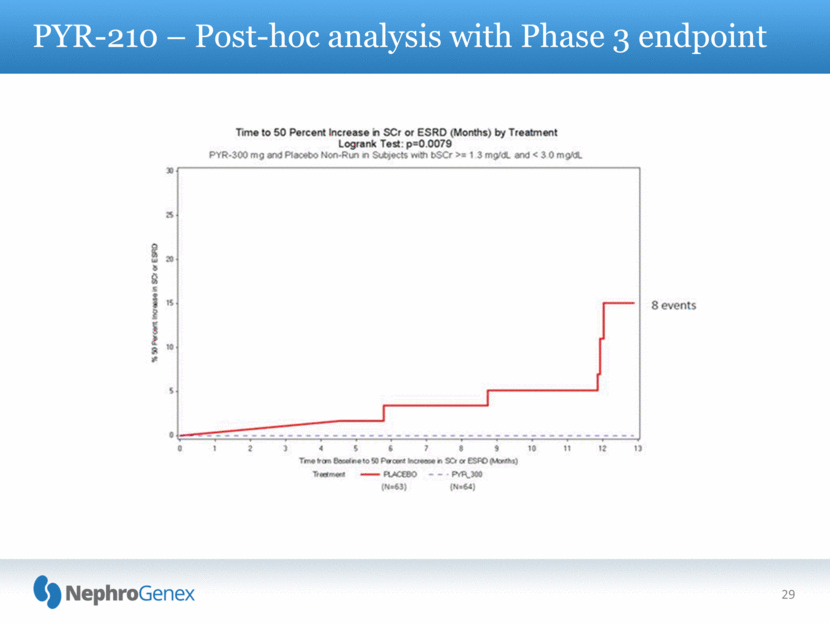
29 PYR-210 – Post-hoc analysis with Phase 3 endpoint |
|
|
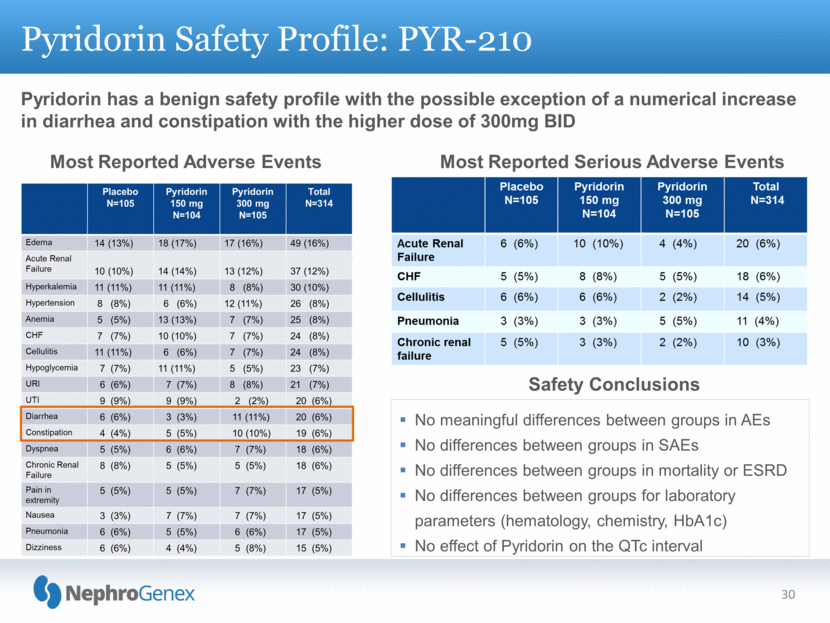
Pyridorin has a benign safety profile with the possible exception of a numerical increase in diarrhea and constipation with the higher dose of 300mg BID Pyridorin Safety Profile: PYR-210 30 Most Reported Adverse Events Most Reported Serious Adverse Events No meaningful differences between groups in AEs No differences between groups in SAEs No differences between groups in mortality or ESRD No differences between groups for laboratory parameters (hematology, chemistry, HbA1c) No effect of Pyridorin on the QTc interval Safety Conclusions |
|
|
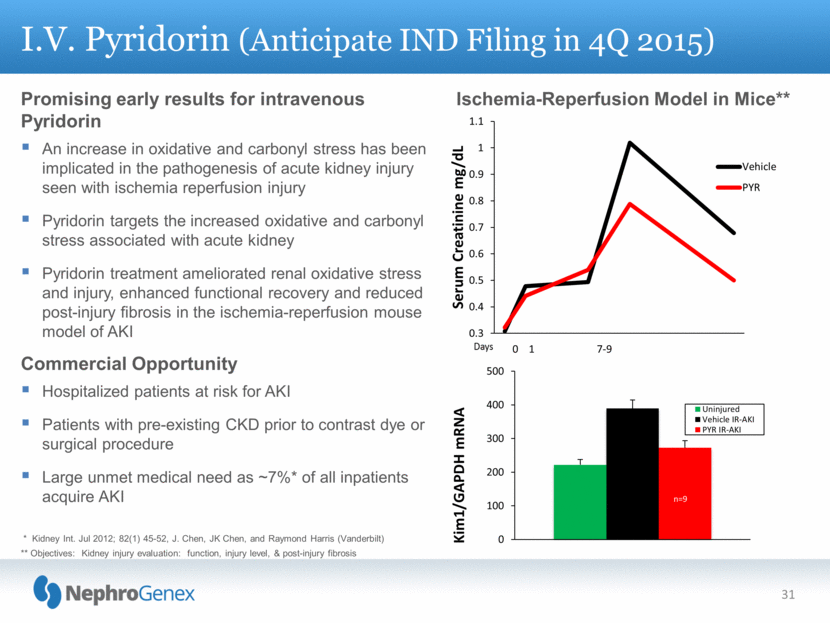
Promising early results for intravenous Pyridorin An increase in oxidative and carbonyl stress has been implicated in the pathogenesis of acute kidney injury seen with ischemia reperfusion injury Pyridorin targets the increased oxidative and carbonyl stress associated with acute kidney Pyridorin treatment ameliorated renal oxidative stress and injury, enhanced functional recovery and reduced post-injury fibrosis in the ischemia-reperfusion mouse model of AKI Commercial Opportunity Hospitalized patients at risk for AKI Patients with pre-existing CKD prior to contrast dye or surgical procedure Large unmet medical need as ~7%* of all inpatients acquire AKI I.V. Pyridorin (Anticipate IND Filing in 4Q 2015) * Kidney Int. Jul 2012; 82(1) 45-52, J. Chen, JK Chen, and Raymond Harris (Vanderbilt) ** Objectives: Kidney injury evaluation: function, injury level, & post-injury fibrosis Ischemia-Reperfusion Model in Mice** 31 0 100 200 300 400 500 Kim1/GAPDH mRNA Uninjured Vehicle IR-AKI PYR IR-AKI n=9 n=10 n=10 0.3 0.4 0.5 0.6 0.7 0.8 0.9 1 1.1 Serum Creatinine mg/dL Vehicle PYR 0 1 7 - 9 |
|
|
No composition of matter claim since this molecule already exists in the human body in microscopic quantities U.S. Method of use (including patient population and dosage) patent December 2028 (with anticipated patent term extension) Method of manufacture patent February 2025 NCE - 5 year exclusivity Europe In most EU countries method of use (including patient population and dosage) patent June 2029 (with anticipated 5 year patent term extension) NCE - 10 year exclusivity Canada Method of use (including patient population and dosage) patent June 2024 NCE - 8 year exclusivity Japan NCE - up to 8 year exclusivity No future royalties, one minimal $200K milestone at approval 32 Exclusivity Patents and New Chemical Entity (NCE) |
|
|
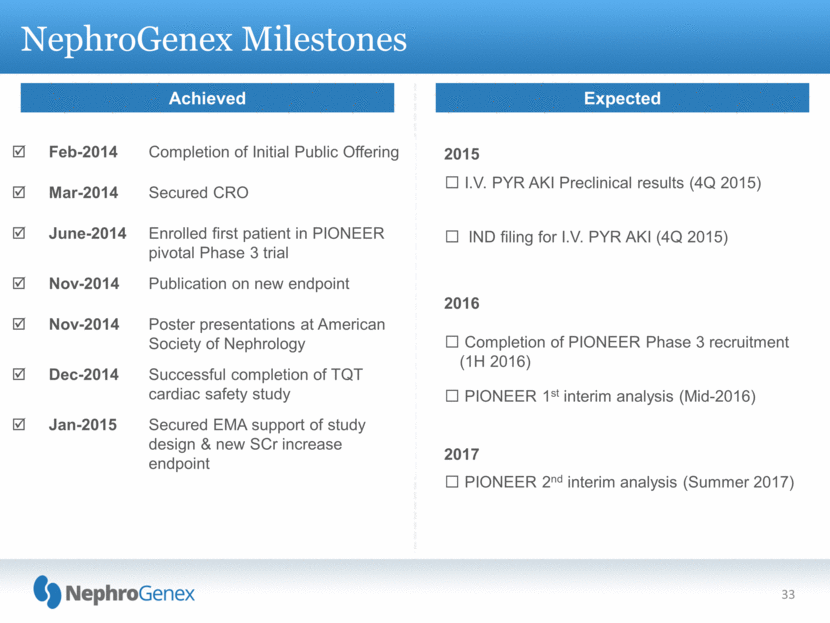
NephroGenex Milestones 33 Achieved Expected Feb-2014 Completion of Initial Public Offering Mar-2014 Secured CRO June-2014 Enrolled first patient in PIONEER pivotal Phase 3 trial Nov-2014 Publication on new endpoint Nov-2014 Poster presentations at American Society of Nephrology Dec-2014 Successful completion of TQT cardiac safety study Jan-2015 Secured EMA support of study design & new SCr increase endpoint 2015 I.V. PYR AKI Preclinical results (4Q 2015) IND filing for I.V. PYR AKI (4Q 2015) 2016 Completion of PIONEER Phase 3 recruitment (1H 2016) PIONEER 1st interim analysis (Mid-2016) 2017 PIONEER 2nd interim analysis (Summer 2017) |
|
|
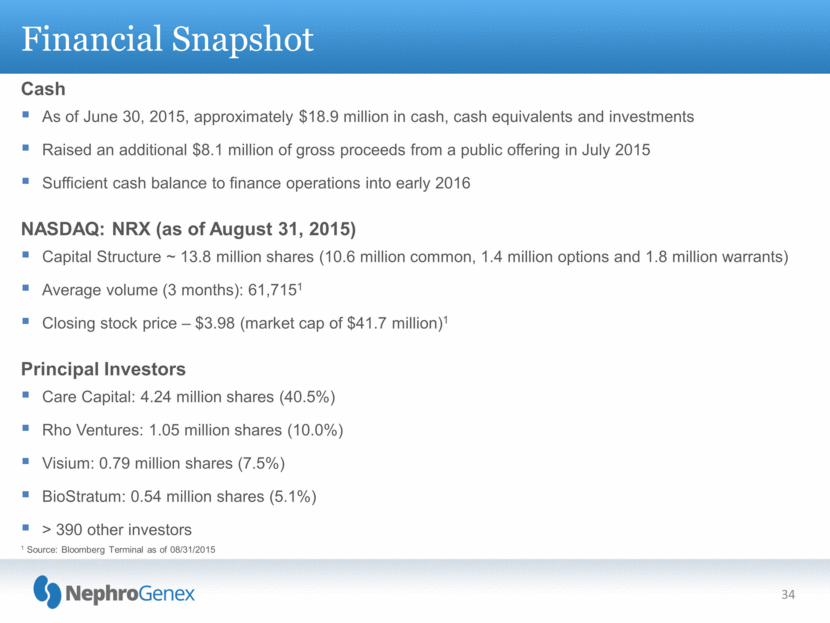
Financial Snapshot Cash As of June 30, 2015, approximately $18.9 million in cash, cash equivalents and investments Raised an additional $8.1 million of gross proceeds from a public offering in July 2015 Sufficient cash balance to finance operations into early 2016 NASDAQ: NRX (as of August 31, 2015) Capital Structure ~ 13.8 million shares (10.6 million common, 1.4 million options and 1.8 million warrants) Average volume (3 months): 61,7151 Closing stock price – $3.98 (market cap of $41.7 million)1 Principal Investors Care Capital: 4.24 million shares (40.5%) Rho Ventures: 1.05 million shares (10.0%) Visium: 0.79 million shares (7.5%) BioStratum: 0.54 million shares (5.1%) > 390 other investors 34 1 Source: Bloomberg Terminal as of 08/31/2015 |
|
|
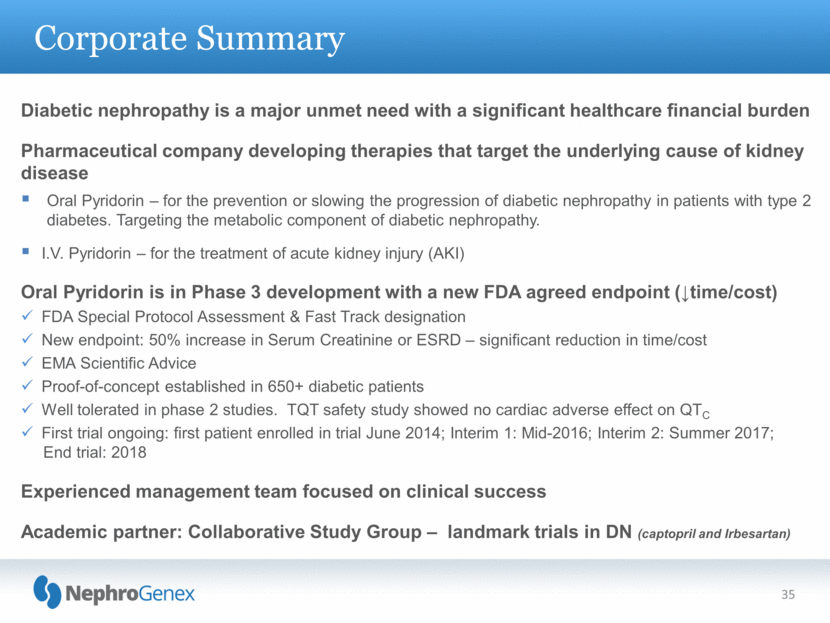
Corporate Summary 35 Diabetic nephropathy is a major unmet need with a significant healthcare financial burden Pharmaceutical company developing therapies that target the underlying cause of kidney disease Oral Pyridorin – for the prevention or slowing the progression of diabetic nephropathy in patients with type 2 diabetes. Targeting the metabolic component of diabetic nephropathy. I.V. Pyridorin – for the treatment of acute kidney injury (AKI) Oral Pyridorin is in Phase 3 development with a new FDA agreed endpoint (time/cost) FDA Special Protocol Assessment & Fast Track designation New endpoint: 50% increase in Serum Creatinine or ESRD – significant reduction in time/cost EMA Scientific Advice Proof-of-concept established in 650+ diabetic patients Well tolerated in phase 2 studies. TQT safety study showed no cardiac adverse effect on QTC First trial ongoing: first patient enrolled in trial June 2014; Interim 1: Mid-2016; Interim 2: Summer 2017; End trial: 2018 Experienced management team focused on clinical success Academic partner: Collaborative Study Group – landmark trials in DN (captopril and Irbesartan) |
|
|
Appendix |
|
|
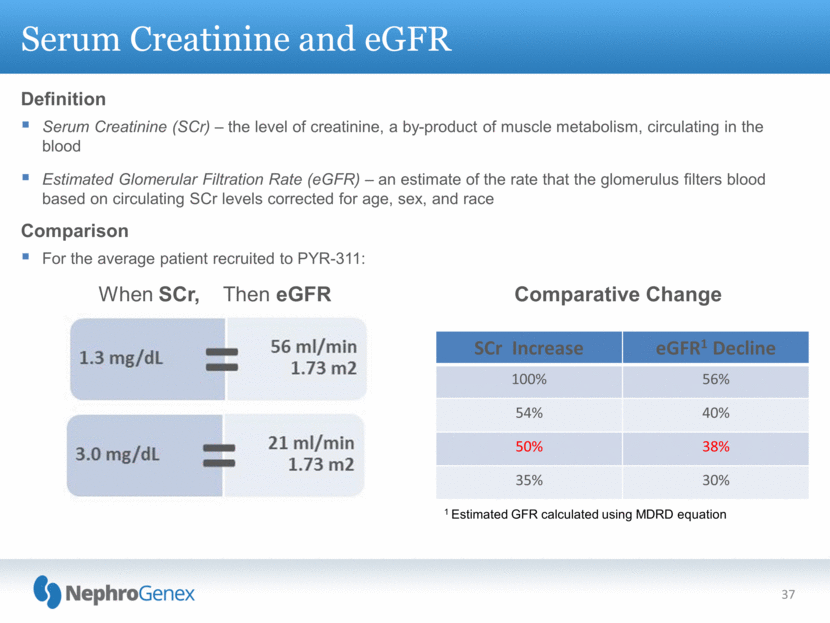
Definition Serum Creatinine (SCr) – the level of creatinine, a by-product of muscle metabolism, circulating in the blood Estimated Glomerular Filtration Rate (eGFR) – an estimate of the rate that the glomerulus filters blood based on circulating SCr levels corrected for age, sex, and race Comparison For the average patient recruited to PYR-311: Serum Creatinine and eGFR 37 When SCr, Then eGFR Comparative Change 1 Estimated GFR calculated using MDRD equation SCr Increase eGFR1 Decline 100% 56% 54% 40% 50% 38% 35% 30% |
|
|
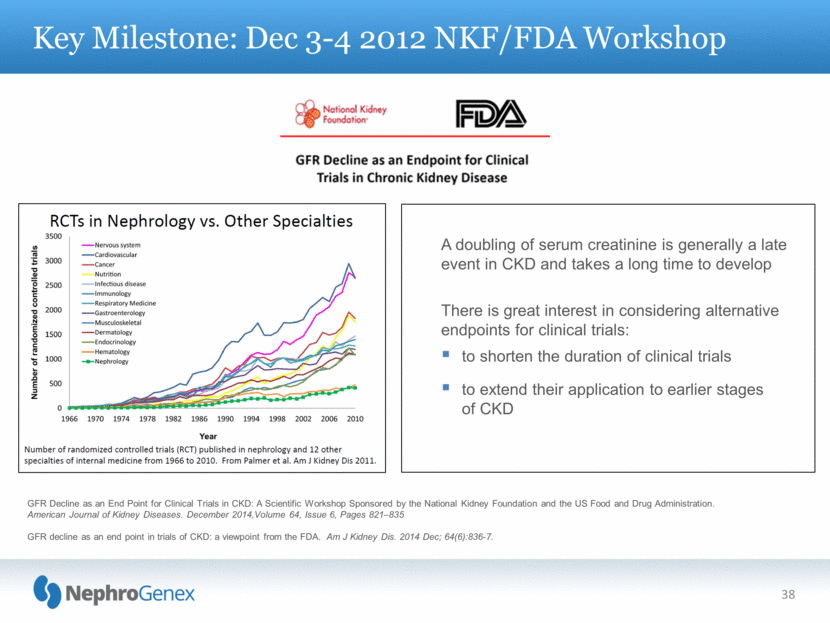
38 Key Milestone: Dec 3-4 2012 NKF/FDA Workshop A doubling of serum creatinine is generally a late event in CKD and takes a long time to develop There is great interest in considering alternative endpoints for clinical trials: to shorten the duration of clinical trials to extend their application to earlier stages of CKD GFR Decline as an End Point for Clinical Trials in CKD: A Scientific Workshop Sponsored by the National Kidney Foundation and the US Food and Drug Administration. American Journal of Kidney Diseases. December 2014,Volume 64, Issue 6, Pages 821–835 GFR decline as an end point in trials of CKD: a viewpoint from the FDA. Am J Kidney Dis. 2014 Dec; 64(6):836-7. |