Attached files
| file | filename |
|---|---|
| 8-K - 8-K - BALL Corp | a15-20441_18k.htm |
Exhibit 99.1
|
|
Ball Corporation Overview Scott C. Morrison Jeff Knobel Senior Vice President and CFO Vice President and Treasurer Ann Scott Vice President, Investor Relations Goldman Sachs EMEA Leveraged Finance Conference and European Meetings October 6 - 9, 2015 |
|
|
Forward-Looking Statements This presentation contains “forward-looking” statements concerning future events and financial performance. Words such as “expects,” “anticipates,” “estimates” and similar expressions identify forward-looking statements. Such statements are subject to risks and uncertainties, which could cause actual results to differ materially from those expressed or implied. The company undertakes no obligation to publicly update or revise any forward-looking statements, whether as a result of new information, future events or otherwise. Key risks and uncertainties are summarized in filings with the Securities and Exchange Commission, including Exhibit 99 in our Form 10-K, which are available on our website and at www.sec.gov. Factors that might affect: a) our packaging segments include product demand fluctuations; availability/cost of raw materials; competitive packaging, pricing and substitution; changes in climate and weather; crop yields; competitive activity; failure to achieve productivity improvements or cost reductions; mandatory deposit or other restrictive packaging laws; customer and supplier consolidation, power and supply chain influence; changes in major customer or supplier contracts or loss of a major customer or supplier; political instability and sanctions; and changes in foreign exchange or tax rates; b) our aerospace segment include funding, authorization, availability and returns of government and commercial contracts; and delays, extensions and technical uncertainties affecting segment contracts; c) the company as a whole include those listed plus: changes in senior management; regulatory action or issues including tax, environmental, health and workplace safety, including U.S. FDA and other actions or public concerns affecting products filled in our containers, or chemicals or substances used in raw materials or in the manufacturing process; technological developments and innovations; litigation; strikes; labor cost changes; rates of return on assets of the company’s defined benefit retirement plans; pension changes; uncertainties surrounding the U.S. government budget, sequestration and debt limit; reduced cash flow; ability to achieve cost-out initiatives; interest rates affecting our debt; and successful or unsuccessful acquisitions and divestitures, including, with respect to the proposed Rexam PLC acquisition, the effect of the announcement of the acquisition on our business relationships, operating results and business generally; the occurrence of any event or other circumstances that could give rise to the termination of our definitive agreement with Rexam PLC in respect of the acquisition; the outcome of any legal proceedings that may be instituted against us related to the definitive agreement with Rexam PLC; and the failure to satisfy conditions to completion of the acquisition of Rexam PLC, including the receipt of all required regulatory approvals. Reconciliation of certain non-GAAP financial measures: Throughout this presentation, we will be discussing Free Cash Flow (FCF), Earnings Before Interest, Tax, Depreciation and Amortization (EBITDA) and comparable EBITDA, all of which do not conform to accounting principles generally accepted in the United States (GAAP). For additional information and the reconciliation of FCF, EBITDA and comparable EBITDA to the appropriate GAAP measure as required by the SEC Regulation G, please refer to the Appendix. |
|
|
Important Information This document is provided for informational purposes only and is neither an offer to purchase nor a solicitation of an offer to sell, shares of Ball Corporation ("Ball") or Rexam Plc ("Rexam"). Further to the announcement released by Ball Acquisition Limited on February 19, 2015 (the “Announcement”) of its offer to acquire the entire issued and to be issued share capital of Rexam (the “Offer"), (i) such Offer will be made pursuant to the terms of a circular to be issued by Rexam to its shareholders in due course following satisfaction or waiver of certain pre-conditions, setting out the terms and conditions of the Offer, including details of how to vote in respect of the Offer (the "Circular"), and (ii) Ball will in due course following satisfaction of waiver of certain pre-conditions publish a prospectus for the purposes of EU Directive 2003/71/EC (together with any applicable implementing measures in any Member State, the "Prospectus Directive") in relation to shares which will be issued by it in connection with the Offer (the "Prospectus"). Any decision in respect of, or in response to, the Offer should be made only on the basis of the information in the Circular and the Prospectus. Investors are advised to read the Circular and the Prospectus carefully. This document is an advertisement and not a prospectus for the purposes of the Prospectus Directive. Accordingly, investors should not subscribe for, or purchase, any securities except on the basis of the information to be contained in the Prospectus, when published, which will be prepared in accordance with the Prospectus Directive. Copies of the Prospectus, when published, will be available from Ball’s website at www.ball.com. The Ball Responsible Officers (as defined in the Announcement) each accept responsibility for the information contained in this document. To the best of the knowledge and belief of the Ball Responsible Officers (who have taken all reasonable care to ensure that such is the case), the information contained in this document for which they are responsible is in accordance with the facts and does not omit anything likely to affect the import of such information. No profit forecast Nothing contained herein shall be deemed to be a forecast, projection or estimate of the future financial performance of Ball, Rexam or the combined business following completion of the combination, unless otherwise stated. |
|
|
Important Information Disclosure requirements of the UK Takeover Code Rexam is a company subject to the jurisdiction of the UK Takeover Code (the “Code”) Under Rule 8.3(a) of the Code, any person who is interested in 1 per cent. or more of any class of relevant securities of an offeree company or of any securities exchange offeror (being any offeror other than an offeror in respect of which it has been announced that its offer is, or is likely to be, solely in cash) must make an Opening Position Disclosure following the commencement of the offer period and, if later, following the announcement in which any securities exchange offeror is first identified. An Opening Position Disclosure must contain details of the person’s interests and short positions in, and rights to subscribe for, any relevant securities of each of (i) the offeree company and (ii) any securities exchange offeror(s). An Opening Position Disclosure by a person to whom Rule 8.3(a) applies must be made by no later than 3.30 pm (London time) on the 10th Business Day following the commencement of the offer period and, if appropriate, by no later than 3.30 pm (London time) on the 10th Business Day following the announcement in which any securities exchange offeror is first identified. Relevant persons who deal in the relevant securities of the offeree company or of a securities exchange offeror prior to the deadline for making an Opening Position Disclosure must instead make a Dealing Disclosure. Under Rule 8.3(b) of the Code, any person who is, or becomes, interested in 1 per cent. or more of any class of relevant securities of the offeree company or of any securities exchange offeror must make a Dealing Disclosure if the person deals in any relevant securities of the offeree company or of any securities exchange offeror. A Dealing Disclosure must contain details of the dealing concerned and of the person’s interests and short positions in, and rights to subscribe for, any relevant securities of each of (i) the offeree company and (ii) any securities exchange offeror, save to the extent that these details have previously been disclosed under Rule 8. A Dealing Disclosure by a person to whom Rule 8.3(b) applies must be made by no later than 3.30 pm (London time) on the Business Day following the date of the relevant dealing. Disclosures are therefore required in the shares of Ball and Rexam. If two or more persons act together pursuant to an agreement or understanding, whether formal or informal, to acquire or control an interest in relevant securities of an offeree company or a securities exchange offeror, they will be deemed to be a single person for the purpose of Rule 8.3. Opening Position Disclosures must also be made by the offeree company and by any offeror and Dealing Disclosures must also be made by the offeree company, by any offeror and by any persons acting in concert with any of them (see Rules 8.1, 8.2 and 8.4). Details of the offeree and offeror companies in respect of whose relevant securities Opening Position Disclosures and Dealing Disclosures must be made can be found in the Disclosure Table on the Panel’s website at www.thetakeoverpanel.org.uk, including details of the number of relevant securities in issue, when the offer period commenced and when any offeror was first identified. You should contact the Panel’s Market Surveillance Unit on +44 (0)20 7638 0129 if you are in any doubt as to whether you are required to make an Opening Position Disclosure or a Dealing Disclosure. |
|
|
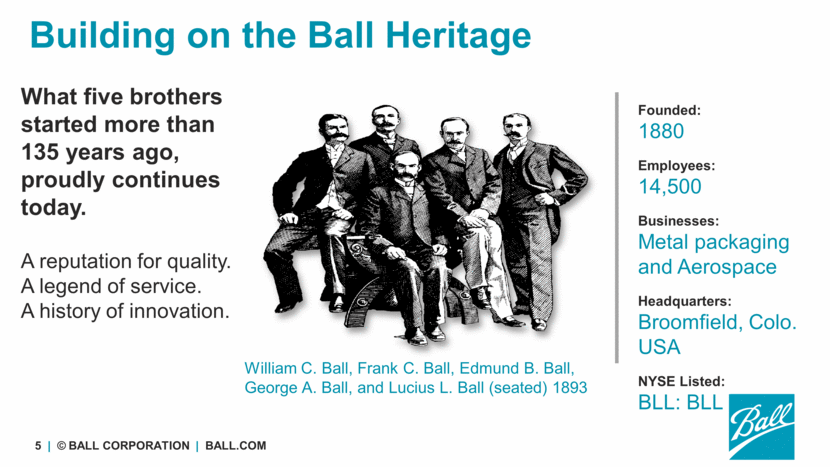
Building on the Ball Heritage Founded: 1880 Employees: 14,500 Businesses: Metal packaging and Aerospace Headquarters: Broomfield, Colo. USA NYSE Listed: BLL: BLL What five brothers started more than 135 years ago, proudly continues today. A reputation for quality. A legend of service. A history of innovation. William C. Ball, Frank C. Ball, Edmund B. Ball, George A. Ball, and Lucius L. Ball (seated) 1893 |
|
|
Key Performance Drivers Going Forward Maximize Value of Existing Business Portfolio and Diverse Customer Base Drive for 10 Vision Maintain Disciplined Financial Strategy Utilize Free Cash Flow to Create Value Execute on Growth Capital Projects Continue Progress on Proposed M&A Generate EVA$ Over Time |
|
|
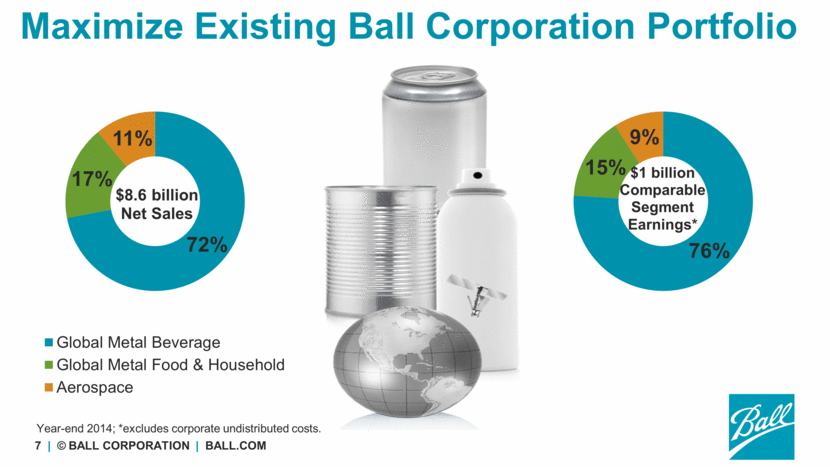
Maximize Existing Ball Corporation Portfolio Year-end 2014; *excludes corporate undistributed costs. 72% 17% 11% $8.6 billion Net Sales Global Metal Beverage Global Metal Food & Household Aerospace 76% 15% 9% $1 billion Comparable Segment Earnings* |
|
|
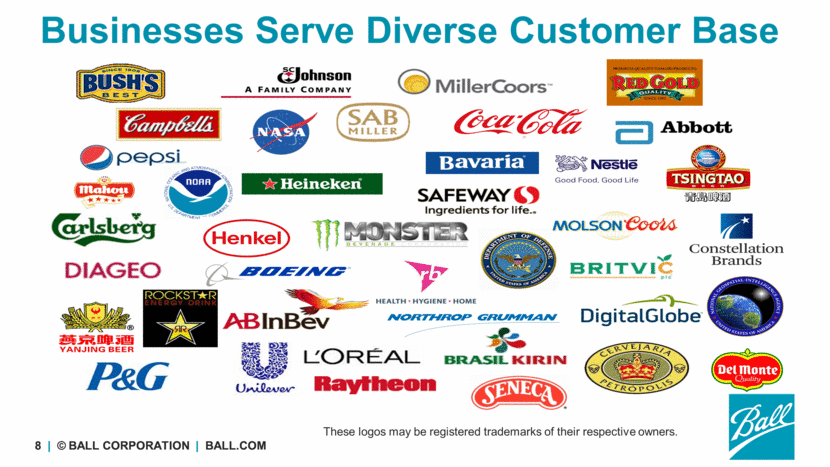
Businesses Serve Diverse Customer Base These logos may be registered trademarks of their respective owners. |
|
|
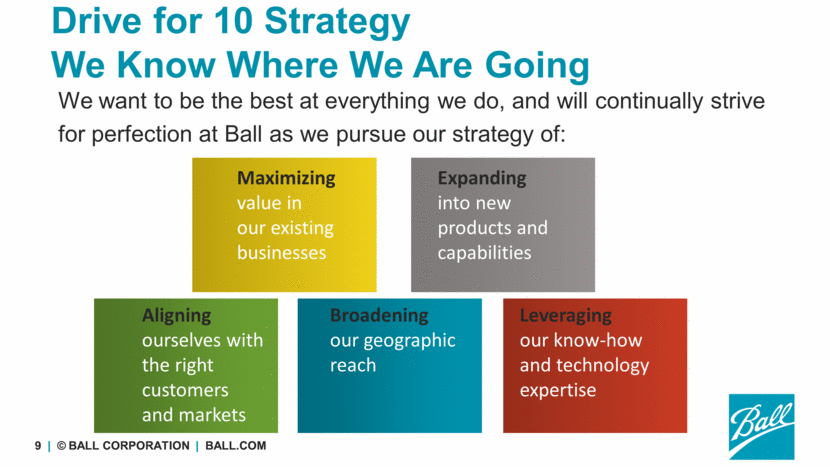
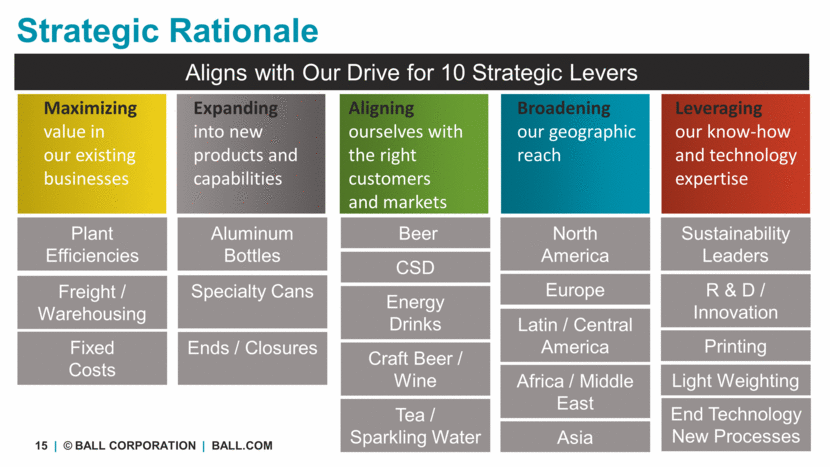
Drive for 10 Strategy We Know Where We Are Going We want to be the best at everything we do, and will continually strive for perfection at Ball as we pursue our strategy of: Maximizing value in our existing businesses Aligning ourselves with the right customers and markets Expanding into new products and capabilities Broadening our geographic reach Leveraging our know-how and technology expertise |
|
|
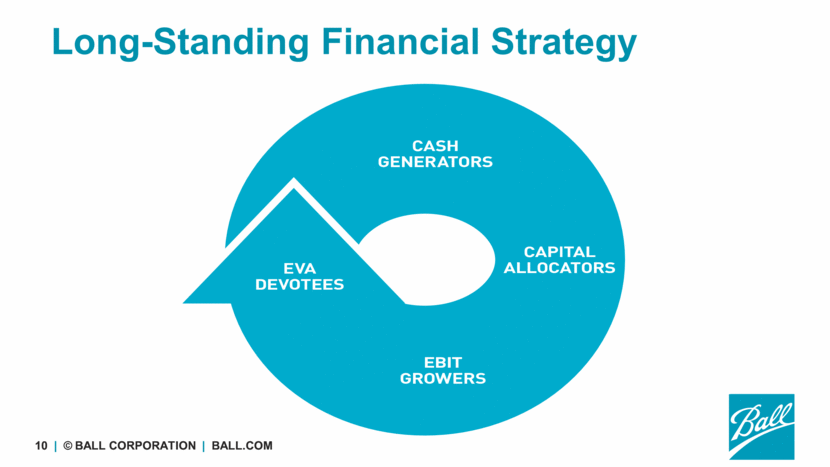
Long-Standing Financial Strategy |
|
|
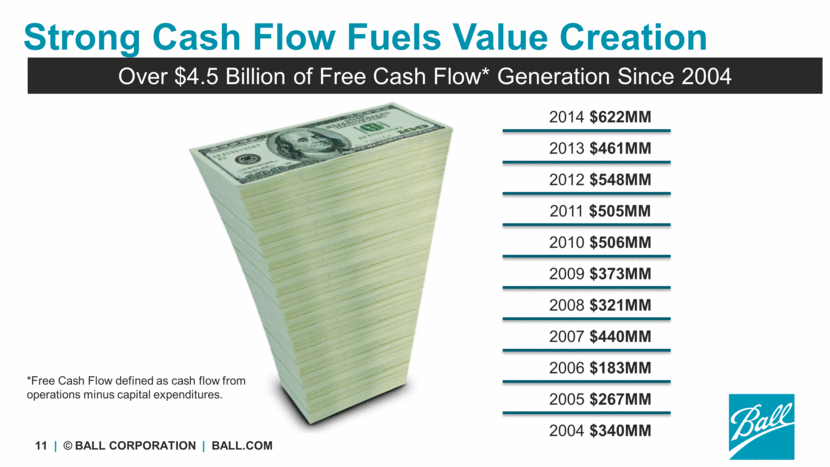
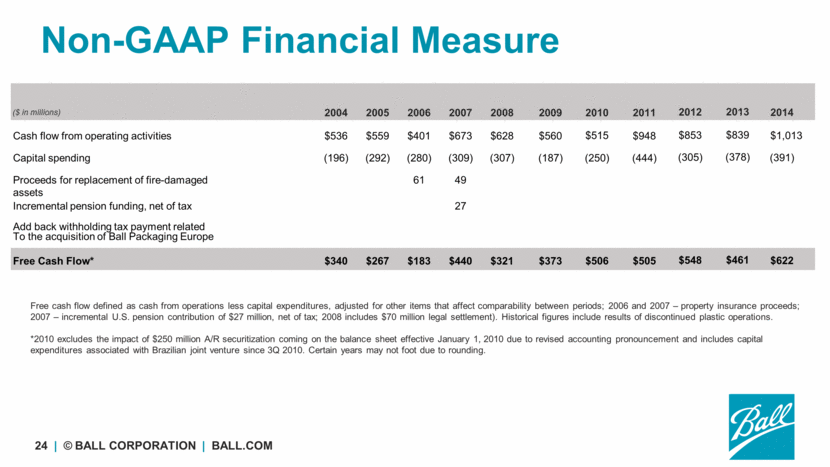
Strong Cash Flow Fuels Value Creation 2008 $321MM 2007 $440MM 2006 $183MM 2005 $267MM 2004 $340MM 2011 $505MM 2010 $506MM 2009 $373MM 2012 $548MM 2013 $461MM 2014 $622MM *Free Cash Flow defined as cash flow from operations minus capital expenditures. Over $4.5 Billion of Free Cash Flow* Generation Since 2004 |
|
|
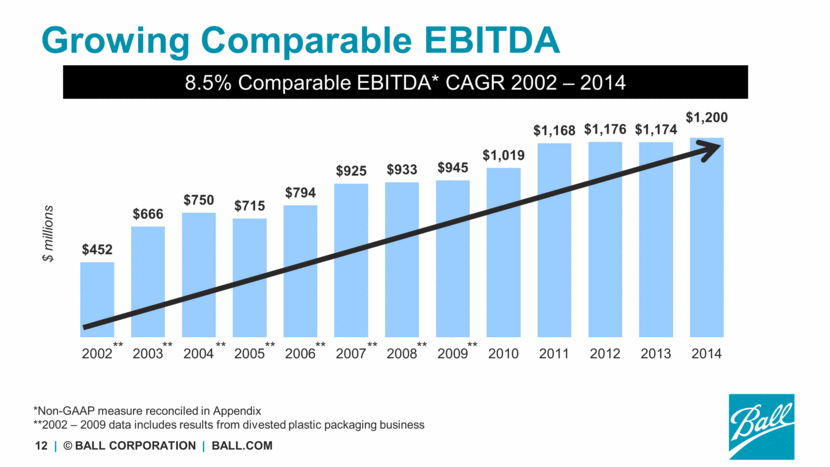
Growing Comparable EBITDA *Non-GAAP measure reconciled in Appendix **2002 – 2009 data includes results from divested plastic packaging business $ millions ** ** ** ** ** ** ** ** 8.5% Comparable EBITDA* CAGR 2002 – 2014 $452 $666 $750 $715 $794 $925 $933 $945 $1,019 $1,168 $1,176 $1,174 $1,200 2002 2003 2004 2005 2006 2007 2008 2009 2010 2011 2012 2013 2014 |
|
|
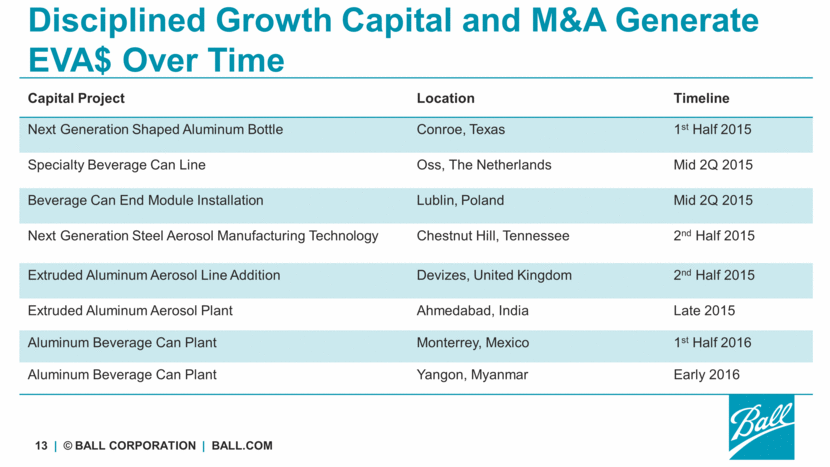
Disciplined Growth Capital and M&A Generate EVA$ Over Time Capital Project Location Timeline Next Generation Shaped Aluminum Bottle Conroe, Texas 1st Half 2015 Specialty Beverage Can Line Oss, The Netherlands Mid 2Q 2015 Beverage Can End Module Installation Lublin, Poland Mid 2Q 2015 Next Generation Steel Aerosol Manufacturing Technology Chestnut Hill, Tennessee 2nd Half 2015 Extruded Aluminum Aerosol Line Addition Devizes, United Kingdom 2nd Half 2015 Extruded Aluminum Aerosol Plant Ahmedabad, India Late 2015 Aluminum Beverage Can Plant Monterrey, Mexico 1st Half 2016 Aluminum Beverage Can Plant Yangon, Myanmar Early 2016 |
|
|
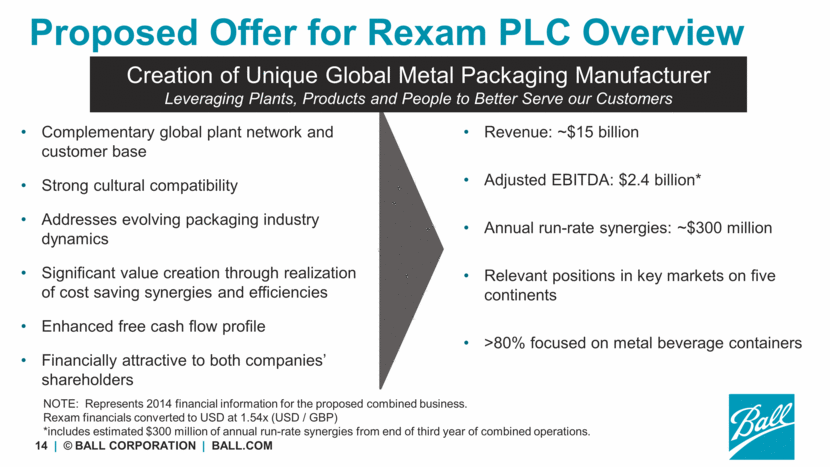
Proposed Offer for Rexam PLC Overview Complementary global plant network and customer base Strong cultural compatibility Addresses evolving packaging industry dynamics Significant value creation through realization of cost saving synergies and efficiencies Enhanced free cash flow profile Financially attractive to both companies’ shareholders Revenue: ~$15 billion Adjusted EBITDA: $2.4 billion* Annual run-rate synergies: ~$300 million Relevant positions in key markets on five continents >80% focused on metal beverage containers Creation of Unique Global Metal Packaging Manufacturer Leveraging Plants, Products and People to Better Serve our Customers NOTE: Represents 2014 financial information for the proposed combined business. Rexam financials converted to USD at 1.54x (USD / GBP) *includes estimated $300 million of annual run-rate synergies from end of third year of combined operations. |
|
|
Strategic Rationale Aligns with Our Drive for 10 Strategic Levers Plant Efficiencies Freight / Warehousing Specialty Cans Aluminum Bottles Beer CSD Latin / Central America Africa / Middle East Energy Drinks Craft Beer / Wine North America Europe Fixed Costs Ends / Closures Tea / Sparkling Water Asia Maximizing value in our existing businesses Expanding into new products and capabilities Aligning ourselves with the right customers and markets Broadening our geographic reach Leveraging our know-how and technology expertise Sustainability Leaders Printing R & D / Innovation Light Weighting End Technology New Processes |
|
|
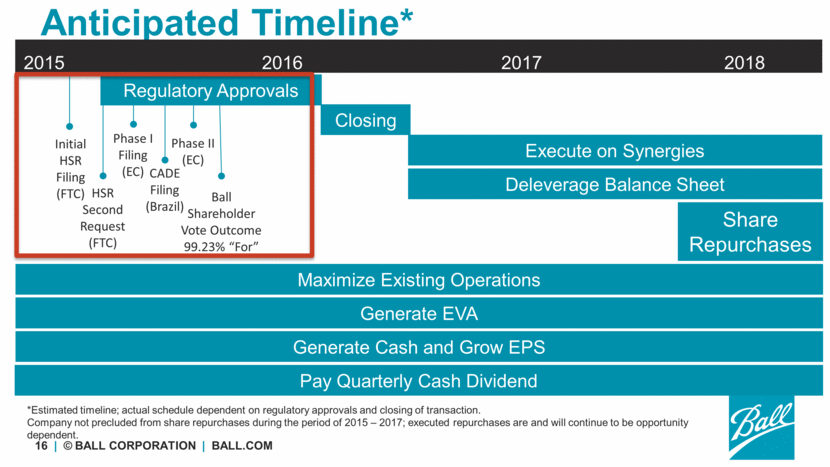
Anticipated Timeline* *Estimated timeline; actual schedule dependent on regulatory approvals and closing of transaction. Company not precluded from share repurchases during the period of 2015 – 2017; executed repurchases are and will continue to be opportunity dependent. Closing Execute on Synergies Deleverage Balance Sheet Share Repurchases Maximize Existing Operations Regulatory Approvals Generate EVA Generate Cash and Grow EPS 2015 2016 2017 2018 Pay Quarterly Cash Dividend Initial HSR Filing (FTC) HSR Second Request (FTC) Phase I Filing (EC) Ball Shareholder Vote Outcome 99.23% “For” CADE Filing (Brazil) Phase II (EC) |
|
|
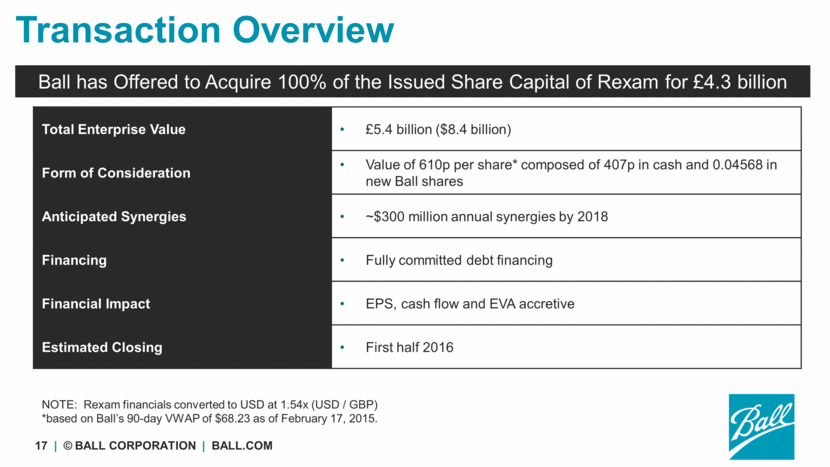
Transaction Overview Total Enterprise Value £5.4 billion ($8.4 billion) Form of Consideration Value of 610p per share* composed of 407p in cash and 0.04568 in new Ball shares Anticipated Synergies ~$300 million annual synergies by 2018 Financing Fully committed debt financing Financial Impact EPS, cash flow and EVA accretive Estimated Closing First half 2016 Ball has Offered to Acquire 100% of the Issued Share Capital of Rexam for £4.3 billion NOTE: Rexam financials converted to USD at 1.54x (USD / GBP) *based on Ball’s 90-day VWAP of $68.23 as of February 17, 2015. |
|
|
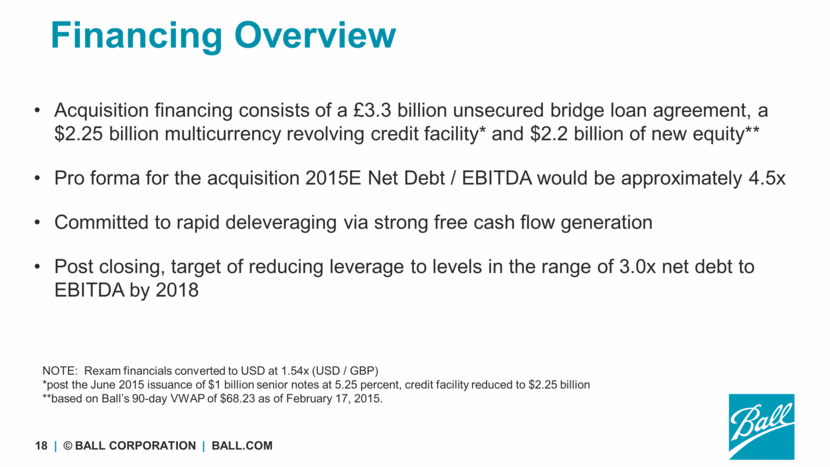
Acquisition financing consists of a £3.3 billion unsecured bridge loan agreement, a $2.25 billion multicurrency revolving credit facility* and $2.2 billion of new equity** Pro forma for the acquisition 2015E Net Debt / EBITDA would be approximately 4.5x Committed to rapid deleveraging via strong free cash flow generation Post closing, target of reducing leverage to levels in the range of 3.0x net debt to EBITDA by 2018 Financing Overview NOTE: Rexam financials converted to USD at 1.54x (USD / GBP) *post the June 2015 issuance of $1 billion senior notes at 5.25 percent, credit facility reduced to $2.25 billion **based on Ball’s 90-day VWAP of $68.23 as of February 17, 2015. |
|
|
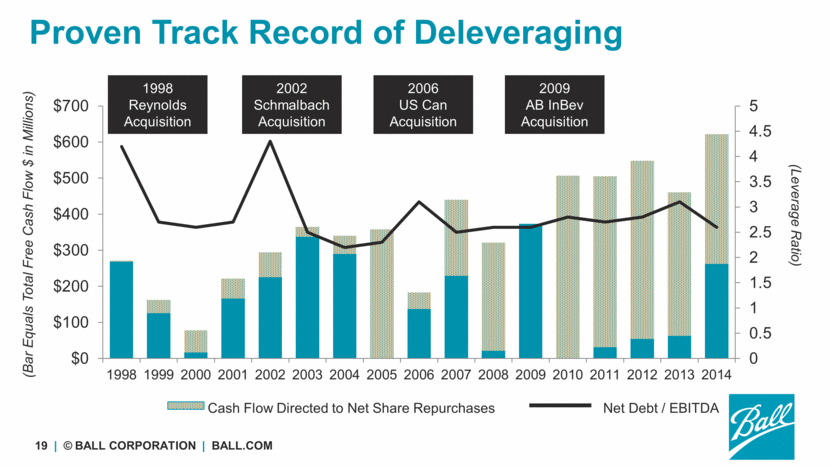
Proven Track Record of Deleveraging 2002 Schmalbach Acquisition 1998 Reynolds Acquisition 2006 US Can Acquisition 2009 AB InBev Acquisition (Bar Equals Total Free Cash Flow $ in Millions) (Leverage Ratio) Cash Flow Directed to Net Share Repurchases Net Debt / EBITDA |
|
|
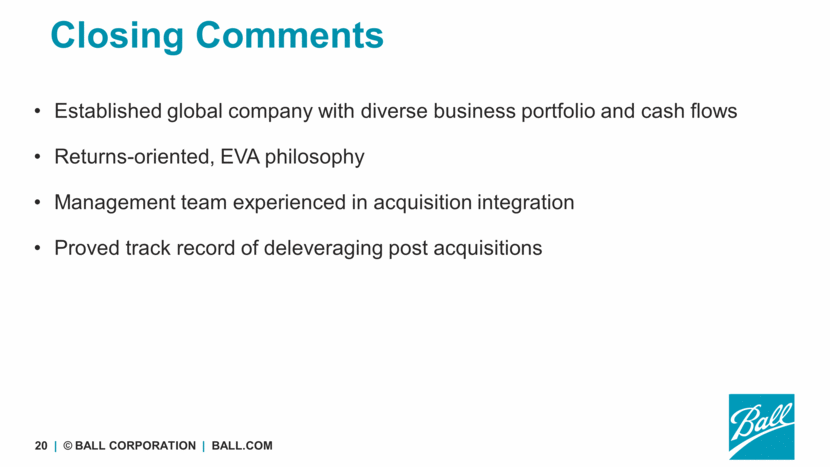
Established global company with diverse business portfolio and cash flows Returns-oriented, EVA philosophy Management team experienced in acquisition integration Proved track record of deleveraging post acquisitions Closing Comments |
|
|
Q & A Session |
|
|
Non-GAAP Financial Measures Reconciliation |
|
|
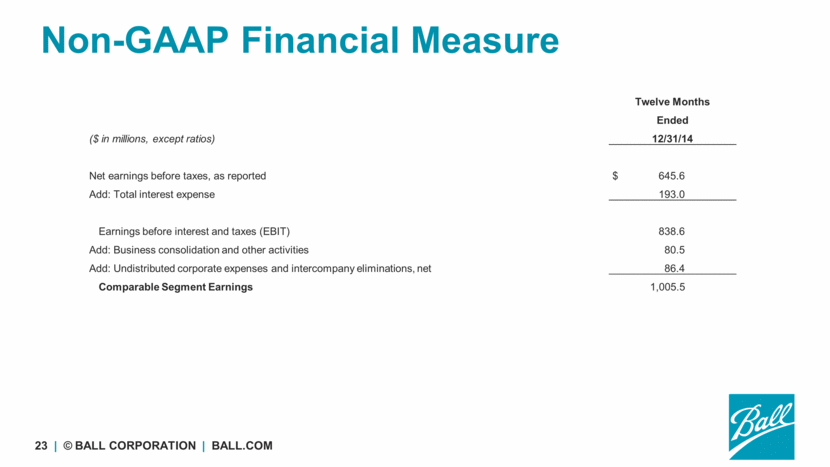
Non-GAAP Financial Measure Twelve Months Ended ($ in millions, except ratios) 12/31/14 Net earnings before taxes, as reported $ 645.6 Add: Total interest expense 193.0 Earnings before interest and taxes (EBIT) 838.6 Add: Business consolidation and other activities 80.5 Add: Undistributed corporate expenses and intercompany eliminations, net 86.4 Comparable Segment Earnings 1,005.5 |
|
|
Non-GAAP Financial Measure ($ in millions) 2004 2005 2006 2007 2008 2009 Cash flow from operating activities $536 $559 $401 $673 $628 $560 Capital spending (196) (292) (280) (309) (307) (187) Proceeds for replacement of fire-damaged assets 61 49 Incremental pension funding, net of tax 27 Add back withholding tax payment related To the acquisition of Ball Packaging Europe Free Cash Flow* $340 $267 $183 $440 $321 $373 2010 2011 $515 $948 (250) (444) $506 $505 2012 $853 (305) $548 2013 $839 (378) $461 Free cash flow defined as cash from operations less capital expenditures, adjusted for other items that affect comparability between periods; 2006 and 2007 – property insurance proceeds; 2007 – incremental U.S. pension contribution of $27 million, net of tax; 2008 includes $70 million legal settlement). Historical figures include results of discontinued plastic operations. *2010 excludes the impact of $250 million A/R securitization coming on the balance sheet effective January 1, 2010 due to revised accounting pronouncement and includes capital expenditures associated with Brazilian joint venture since 3Q 2010. Certain years may not foot due to rounding. 2014 $1,013 (391) $622 |
|
|
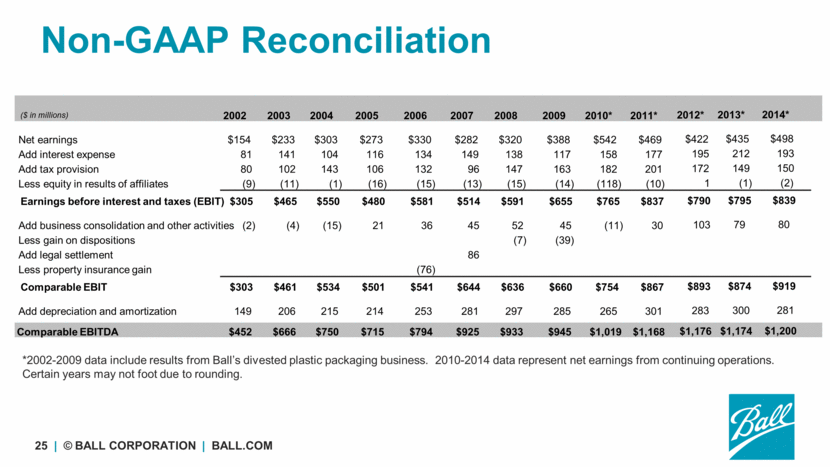
Non-GAAP Reconciliation ($ in millions) 2002 2003 2004 2005 2006 2007 2008 2009 $154 $233 $303 $273 $330 $282 $320 $388 81 141 104 116 134 149 138 117 80 102 143 106 132 96 147 163 (9) (11) (1) (16) (15) (13) (15) (14) $305 $465 $550 $480 $581 $514 $591 $655 (2) (4) (15) 21 36 45 52 45 (7) (39) 86 (76) $303 $461 $534 $501 $541 $644 $636 $660 Net earnings Add interest expense Add tax provision Less equity in results of affiliates Earnings before interest and taxes (EBIT) Add business consolidation and other activities Less gain on dispositions Add legal settlement Less property insurance gain Comparable EBIT Add depreciation and amortization 149 206 215 214 253 281 297 285 Comparable EBITDA $452 $666 $750 $715 $794 $925 $933 $945 2010* $542 158 182 (118) $765 (11) $754 265 $1,019 2011* $469 177 201 (10) $837 30 $867 301 $1,168 *2002-2009 data include results from Ball’s divested plastic packaging business. 2010-2014 data represent net earnings from continuing operations. Certain years may not foot due to rounding. 2012* $422 195 172 1 $790 103 $893 283 $1,176 2013* $435 212 149 (1) $795 79 $874 300 $1,174 2014* $498 193 150 (2) $839 80 $919 281 $1,200 |

