Attached files
| file | filename |
|---|---|
| EX-31.3 - EXHIBIT 31.3 - Towers Watson & Co. | tw-ex313_10ka.htm |
| EX-32.2 - EXHIBIT 32.2 - Towers Watson & Co. | tw-ex322_10ka.htm |
| EX-31.4 - EXHIBIT 31.4 - Towers Watson & Co. | tw-ex314_10ka.htm |
UNITED STATES
SECURITIES AND EXCHANGE COMMISSION
Washington, D.C. 20549
FORM 10-K/A
Amendment No. 1
(Mark One)
ý | ANNUAL REPORT PURSUANT TO SECTION 13 OR 15 (d) OF THE SECURITIES EXCHANGE ACT OF 1934 |
For the fiscal year ended June 30, 2015
or
¨ | TRANSITION REPORT PURSUANT TO SECTION 13 OR 15 (d) OF THE SECURITIES EXCHANGE ACT OF 1934 |
For the transition period from ______ to ______
Commission File Number: 001-34594
TOWERS WATSON & CO.
(Exact name of registrant as specified in its charter)
Delaware | 27-0676603 |
(State or other jurisdiction of incorporation or organization) | (I.R.S. Employer Identification No.) |
901 N. Glebe Road, Arlington, VA 22203
(Address of principal executive offices) (Zip Code)
(703) 258-8000
(Registrant’s telephone number, including area code)
Securities registered pursuant to Section 12(b) of the Act:
Title of each class | Name of each exchange on which registered |
Class A Common Stock, $0.01 par value | NASDAQ Global Select Market |
Securities registered pursuant to Section 12(g) of the Act: None
Indicate by check mark if the registrant is a well-known seasoned issuer, as defined in Rule 405 of the Securities Act. Yes ý No ¨
Indicate by check mark if the registrant is not required to file reports pursuant to Section 13 or Section 15(d) of the Act. Yes ¨ No ý
Indicate by check mark whether the registrant (1) has filed all reports required to be filed by Section 13 or 15(d) of the Securities Exchange Act of 1934 during the preceding 12 months (or for such shorter period that the registrant was required to file such reports), and (2) has been subject to such filing requirements for the past 90 days. Yes ý No ¨
Indicate by check mark whether the registrant has submitted electronically and posted on its corporate Website, if any, every Interactive Data File required to be submitted and posted pursuant to Rule 405 of Regulation S-T (§ 232.405 of this chapter) during the preceding 12 months (or for such shorter period that the registrant was required to submit and post such files). Yes ý No ¨
Indicate by check mark if disclosure of delinquent filers pursuant to Item 405 of Regulation S-K (§ 229.405 of this chapter) is not contained herein, and will not be contained, to the best of registrant’s knowledge, in definitive proxy or information statements incorporated by reference in Part III of this Form 10-K or any amendment to this Form 10-K ý
Indicate by check mark whether the registrant is a large accelerated filer, an accelerated filer, a non-accelerated filer, or a smaller reporting company. See the definitions of “large accelerated filer,” “accelerated filer” and “smaller reporting company” in Rule 12b-2 of the Exchange Act.
Large accelerated filer | ý | Accelerated filer | ¨ |
Non-accelerated filer | ¨ (Do not check if a smaller reporting company) | Smaller reporting company | ¨ |
Indicate by check mark whether the registrant is a shell company (as defined in Rule 12b-2 of the Act). Yes ¨ No ý
1
The aggregate market value of the registrant’s voting and non-voting common stock held by non-affiliates of the registrant was approximately $7,310,423,100 based on the closing price as of the last business day of the registrant’s most recently completed second fiscal quarter, December 31, 2014.
As of September 25, 2015, there were 69,440,096 outstanding shares of Class A common stock at a par value of $0.01.
DOCUMENTS INCORPORATED BY REFERENCE
Portions of the Form S-4 Registration Statement filed by Willis Group Holdings Public Limited Company on August 27, 2015 are incorporated by reference into Part III of this Annual Report.
EXPLANATORY NOTE
Towers Watson & Co. is filing this Amendment No. 1 on Form 10-K/A (“Amendment”) to amend its Annual Report on Form 10-K for the year ended June 30, 2015, filed with the Securities and Exchange Commission (“SEC”) on August 14, 2015 (“Original 10-K”). We are filing this Amendment to the Original 10-K to include the information required by Items 10 through 14 of Part III of Form 10-K. Except for the addition of the Part III information, no other changes have been made to the Original 10-K. This Amendment does not reflect events occurring after the filing of the Original 10-K or modify or update those disclosures affected by subsequent events.
2
INDEX
Page | ||
PART IV. | ||
Certifications | ||
3
Part III
Item 10. Directors, Executive Officers and Corporate Governance
Information with respect to the executive officers of the Company is provided in Part I, Item 1 under the heading “Executive Officers of the Company”. Information as to the individuals serving on the board of directors of the Company is incorporated by reference to the Form S-4 Registration Statement filed by Willis Group Holdings Public Limited Company on August 27, 2015.
Audit Committee
The Audit Committee’s principal responsibilities, as set forth in its charter, are to assist the Board in overseeing the Company’s financial reporting process that is established and implemented by management. The Audit Committee oversees the work of the independent registered public accounting firm and also reviews information provided by the Company’s Director of Internal Audit, independent registered public accounting firm, and management concerning internal accounting procedures and controls.
The Audit Committee is currently composed of four independent Directors, Victor F. Ganzi (Chair), Leslie S. Heisz, Gilbert T. Ray and Paul Thomas, all of whom meet the current independence requirements of NASDAQ’s listing standards. The Board of Directors has determined that Mr. Ganzi is both independent and an audit committee financial expert, as defined by SEC guidelines and NASDAQ listing standards.
Section 16(a) Beneficial Ownership Reporting Compliance
Section 16(a) of the Securities Exchange Act of 1934, as amended, requires the Company’s executive officers and directors, among others, to file with the SEC initial reports of ownership and reports of changes in ownership of the Company’s securities. In addition to requiring prompt disclosure of open-market purchases or sales of Company shares, Section 16(a) applies to a number of other technical situations. The Company maintains and periodically updates a number of procedures to assist in identifying reportable transactions, and assists the Company’s executive officers and directors in preparing initial reports of ownership and reports of changes in ownership and filing those reports with the SEC on their behalf.
Based solely on a review of the copies of such forms furnished to the Company and written representations from the Company’s Section 16 officers and directors, the Company believes that all of such officers and directors filed required reports on a timely basis under Section 16(a) during fiscal year 2015.
Item 11. Executive Compensation
Compensation Discussion and Analysis
Beginning on page 6 of this Form 10-K/A, we present specific information about the compensation for the fiscal year beginning July 1, 2014 through June 30, 2015 (fiscal year 2015) to the following individuals, whom we refer to as our named executives:
• | John J. Haley, Chairman of the Board, President and Chief Executive Officer |
• | Roger F. Millay, Vice President and Chief Financial Officer |
• | James K. Foreman, Managing Director, Exchange Solutions |
• | Gene H. Wickes, Managing Director, Benefits |
• | Carl A. Hess, Managing Director, The Americas |
This Compensation Discussion and Analysis provides you with an overview and analysis of (i) the compensation programs for our named executives; (ii) the decisions made with respect to the compensation of our named executives by the Compensation Committee (the “Committee”) of the Board of Directors under those programs, including material factors considered by the Committee; and (iii) the processes utilized by the Committee in making those decisions.
Executive Summary
2015 Business Highlights
Fiscal year 2015 was a year for growth and progress toward our newly introduced “Towers Watson: 2020” strategy to deliver sustainable, profitable growth. We expanded our capabilities and expertise with the acquisitions of Saville Consulting Group
4
Limited (“Saville”) and Acclaris Holdings, Inc. (“Acclaris”). We also saw strong growth in our OneExchange membership and made significant progress toward achieving our Continuous Improvement target of $100 million run-rate savings and successfully implementing Workplace 2020 across a number of offices. Workplace 2020 is an effort to better utilize our space, keep pace with the evolving needs of our associates and clients, and complement the way our associates work today and will work in the future, by focusing on reducing office-related expenses while sustaining our brand, associate engagement and collaboration.
About Our Growth Strategy
Our three-part Growth Strategy is focused on profitable growth. First, organic growth relates to opportunities to expand our client base and capitalize on our existing businesses. Second, inorganic growth includes strategic moves that allow us to enter existing adjacent spaces, whether by adding scale to an existing business, helping us take our core services into new markets or establishing a new business. Third, innovation incorporates a disciplined approach to help us develop and deliver best-in-class client product and service offerings, beginning with ideas and business model designs, and progressing through acceptance testing and launch.
Key financial results are highlighted below:
In fiscal year 2014, we entered into an agreement to sell our Brokerage business to Jardine Lloyd Thompson Group plc. The financial results above reflect the reclassification of the operating results of our Brokerage business as discontinued operations in our consolidated statements of operations for fiscal years 2014 and 2013.
We use Adjusted Diluted EPS and Adjusted EBITDA (which are both non-U.S. GAAP measures) to eliminate the effect of acquisition-related expenses from the financial results of our operations. A full discussion of our use of non-U.S. GAAP measures to provide a baseline for evaluating and comparing our operating results, and a reconciliation of Adjusted Diluted EPS to diluted EPS and of Adjusted EBITDA to net income before non-controlling interests, can be found at pages 51-53 of the Company’s Annual Report on Form 10-K for the fiscal year ended June 30, 2015.
Our strong performance track record and our discipline in managing costs is validated by the course of our Total Shareholder Return (TSR)-a meaningful measure of performance to our stockholders. The table below shows Towers Watson’s comparative total return to stockholders from June 30, 2010, the first fiscal year end following the effective date of the merger of Watson Wyatt Worldwide, Inc. and Towers, Perrin, Forster & Crosby, Inc. (the “Towers Perrin | Watson Wyatt Merger”), through June 30, 2015.
5
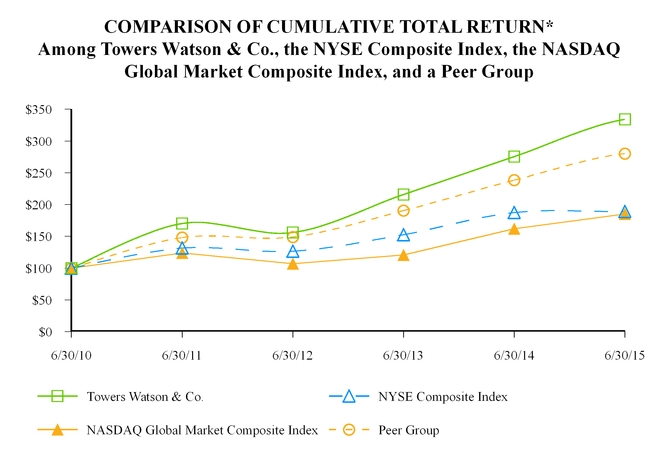
*$100 invested on 6/30/10 in stock or 6/30/10 in index, including reinvestment of dividends. Fiscal year ending June 30.
6/30/2010 | 6/30/2011 | 6/30/2012 | 6/30/2013 | 6/30/2014 | 6/30/2015 | ||||||||||||
Towers Watson & Co. | 100.00 | 170.07 | 156.06 | 215.69 | 275.38 | 334.04 | |||||||||||
NYSE Composite | 100.00 | 131.51 | 126.62 | 152.63 | 187.35 | 188.84 | |||||||||||
NASDAQ Global Market Composite | 100.00 | 123.66 | 106.93 | 120.76 | 161.82 | 184.98 | |||||||||||
Peer Group | 100.00 | 148.01 | 148.99 | 190.44 | 238.35 | 280.31 | |||||||||||
The graph above depicts total cumulative stockholder return on $100.00 invested on June 30, 2010, in (i) Towers Watson & Co. common stock, (ii) the New York Stock Exchange Composite Index, (iii) the NASDAQ Global Market Composite Index; and (iv) a peer group index comprised of the common stock of Aon plc and Marsh & McLennan Companies, Inc. and certain publicly traded companies within the management consulting services standard industrial classification code having a reported market capitalization exceeding $150 million. The graph assumes reinvestment of dividends.
Companies included in the peer group index include: Accenture plc; Aon plc; CEB Inc.; FTI Consulting, Inc.; Huron Consulting Group Inc.; Marsh & McLennan Companies, Inc.; Maximus, Inc.; and Navigant Consulting, Inc. These peer companies are used for financial comparison purposes and differ from the peers we use for evaluating compensation levels as described under “Use of Peer Company Data” on page 17 of this CD&A.
2015 CEO Pay at a Glance
We remain focused on the continuous improvement of our executive compensation program to ensure alignment with our compensation philosophy, Growth Strategy and shareholder interests, as well as market best practices. The significant majority of our CEO pay is variable and linked to drivers of financial performance and our Growth Strategy. Mr. Haley’s total direct compensation (i.e., base salary, fiscal year-end bonus, and target value of Performance-vested restricted stock units (“PVRSUs”) for fiscal year 2015 was approximately $5.5 million, an increase of approximately 12.5% over last year. This increase is attributable primarily to an increase in Mr. Haley’s fiscal year-end bonus from the previous fiscal year. The chart below shows the elements of CEO compensation awarded for the last three fiscal years and how the performance-based variable amount has changed as a percentage of total direct compensation.
6
Our PVRSUs: The Primary Link to Performance and Pay
We only use one form of long-term incentive compensation in our executive compensation program at Towers Watson -PVRSUs or performance-vested restricted stock units. This means that all long-term incentive compensation is driven by Company financial and stock-price performance.
Executives become vested in a number of PVRSUs at the end of a three-year performance period, based on the achievement of specified performance goals. Any PVRSUs that become vested are payable in shares of Class A Common Stock of the Company. Dividend equivalents will accrue on the PVRSUs, but are only paid to the same extent and at the same time as the underlying shares vest.
The first time PVRSUs were granted was in July 2010 - shortly after Towers Watson was formed as a Company. In fiscal year 2015, our PVRSU grants were paid out at 144% of target for the July 1, 2012 to June 30, 2015 performance cycle. (See page 22 for information about the number of shares acquired by our named executives and the value realized on vesting.)
“Say on Pay” Vote
At our 2014 annual meeting, over 97% of the stockholders who voted on the “say-on-pay” proposal approved the compensation of our named executives. Although this vote was non-binding, the Committee has considered, and will continue to consider shareholder input and the results of this vote when making compensation decisions for our executive officers, although that consideration did not directly affect the Company’s executive compensation decisions or policies in fiscal year 2015. The Company regularly engages with shareholders on a range of topics, including compensation. The Committee will continue to consider stockholder feedback and relevant competitive factors in determining compensation for our named executives.
Summary of Our Executive Compensation Practices
What We Do | What We Don’t Do | |||
l | Heavy emphasis on variable compensation | l | Have not entered into employment agreements with U.S. executive officers | |
l | Performance-based long-term incentives | |||
l | Stock ownership guidelines | l | No change-in-control severance agreements | |
l | Clawback and anti-hedging and anti-pledging policies | l | No tax gross-ups | |
l | Double-trigger equity vesting upon a change in control | l | No significant perquisites | |
7
Our Executive Compensation Programs in Detail
Our Pay Philosophy
The Company’s executive compensation philosophy is summarized below:
Objectives | l | Attract, motivate and retain the senior talent needed to ensure our success through the use of competitive compensation structures with strong links to Company and individual performance |
l | Align executive compensation with our overall business strategies and values | |
l | Focus executives on creating long-term stockholder value | |
Pay Positioning | l | Total cash (base salary and fiscal year-end bonus) is at the market median of our peer group |
l | Total direct compensation (base salary, fiscal year-end bonus and target value of PVRSUs) is between the 25th and 50th percentile of our peer group | |
l | Take into account the impact of pension value in positioning total direct compensation | |
Pay Mix | l | Use a mix of fixed and variable pay to balance our objectives, competitive practice and specific roles in the organization |
l | Align the financial interests of our executives with those of our stockholders via long-term incentive awards and stock ownership guidelines | |
Our philosophy is supported by the following elements in our executive compensation program:
Element | Form | Purpose |
Base Salary | Cash (Fixed) | Provides a competitive level of pay that reflects the executive’s experience, role and responsibilities |
Fiscal Year-End Bonus | Cash (Performance-Based Variable) | Rewards achievement of individual, business segment/function and/or overall Company results for the most recently completed fiscal year |
Long-Term Incentive Compensation: PVRSUs | Equity (Performance-Based Variable) | Drives financial performance that links to long-term value creation and business strategies |
8
The charts below show that most of our named executives’ total direct compensation is variable (82% for our CEO and an average of 70% for our other named executives) based upon fiscal year 2015 compensation.
Base Salary
The Committee reviews and approves base salary levels and potential changes at the beginning of each fiscal year, which changes (if any) become effective on October 1 of that year. Base salary decisions generally reflect the Committee’s consideration of median compensation data of our peer group for comparable positions, published survey data, and subjective factors including the individual’s experience and past performance.
Mr. Haley makes salary recommendations to the Committee for the named executives other than himself. For fiscal year 2015, Mr. Haley recommended salary increases for the other named executives that ranged from 2.7 percent to 3.3 percent, effective October 1, 2014, which range was consistent with our average salary increase budget on a global basis. Mr. Haley discussed each recommendation with the Committee and, thereafter, the Committee approved the recommended salaries.
From October 1, 2011 through September 30, 2014, Mr. Haley’s annual base salary was $981,000. Effective October 1, 2014, Mr. Haley’s annual base salary was adjusted to $1,010,000, a 3.0 percent increase from his previous year’s base salary. In determining Mr. Haley’s base salary increase, the principal factors that the Compensation Committee considered were the Company’s overall financial results and salary levels of CEOs in the Company’s peer group.
Fiscal Year-End Bonuses
The Company’s named executives participate in an annual fiscal year-end bonus program, which is administered under the stockholder-approved Towers Watson & Co. Incentive Compensation Plan. Pursuant to this program, for fiscal year 2015, the Committee established each named executive’s bonus target as a percentage of base salary. These percentages remained unchanged for fiscal year 2015. These levels were designed to result in target total cash compensation (base salary and target fiscal year-end bonus) at the market median, while also taking into account internal pay equity considerations across the Company’s operations.
9
Name | Target Bonus as a Percentage of Base Salary | Target Bonus | Actual Bonus | Actual Bonus as a Percentage of Target Bonus |
Mr. Haley | 125% | $1,262,500 | $2,020,000 | 160% |
Mr. Millay | 80% | $496,000 | $670,000 | 135% |
Mr. Foreman | 80% | $508,000 | $550,000 | 108% |
Mr. Wickes | 80% | $508,000 | $760,000 | 150% |
Mr. Hess | 80% | $452,000 | $660,000 | 146% |
Fiscal year-end bonuses are awarded as a percentage of target and are discretionarily determined, guided by a framework designed to consider both quantitative and qualitative outcomes against goals. Goals are developed at the beginning of the fiscal year for each named executive based upon the business conditions and areas of opportunity that exist.
The following sections discuss the criteria the Committee applied in determining bonuses for the CEO and other named executives for fiscal year 2015.
CEO Bonus: Performance Results
The principal factors taken into account by the Committee in determining Mr. Haley’s fiscal year 2015 bonus were his performance against the below-described financial quantitative and strategic qualitative goals, with no specific weighting assigned to any specific metric or goal.
Financial results play a significant role in the determination of the CEO’s bonus. The Company exceeded both its earnings per share (“EPS”) goal and its revenue goal. The financial goals that the Committee considered were:
Financial Goals | Result |
Adjusted Diluted EPS of $5.76 | $6.46 |
Adjusted Revenue of $3.653 Billion | $3.760 Billion |
The Financial Goals and Performance Results are calculated using the currency rates applied to the goals approved by the compensation committee which differ from the rates used in our financial statements. We use Adjusted Diluted EPS and Adjusted Revenue calculated at the compensation committee approved currency rates to eliminate the effect of acquisition-related expenses, currency rate changes, and other non-operating income and expense from our results of operations. A reconciliation to the information reported in the financial statements is as follows:
Adjusted Revenue | Adjusted Diluted EPS | |||||||||||||
Revenue | $ | 3,644,953 | Diluted EPS | $ | 5.50 | |||||||||
Currency translation and other non-operating income | 114,839 | Acquisition related adjustments (1) | 0.69 | |||||||||||
Adjusted Revenue | $ | 3,759,792 | Currency translation and other non-operating income and expense | 0.27 | ||||||||||
(Thousands of U.S. Dollars) | ||||||||||||||
Adjusted Diluted EPS | $ | 6.46 | ||||||||||||
(1) The adjustments to diluted earnings per share of certain acquisition-related items are net of tax. In calculating the net of tax amounts, all adjustments were tax effected at the applicable effective tax rate for the year ended June 30, 2015, which was 34.2%.
10
The Committee also evaluated Mr. Haley’s performance against a number of qualitative goals, including:
Qualitative Goals | Key Goals | Performance Highlights | ||
Growth Strategy | l | Generate short-term and long-term growth using a balanced strategy of organic growth, innovation, and inorganic growth | l | Introduced a refreshed Growth Strategy called “Towers Watson 2020” to focus associates globally on growth opportunities and sustaining a profitable business mix. |
l | Continued support for innovation through our Innovation Office and operation of the New Venture Investment Committee. | |||
l | Completed Acclaris and Saville acquisitions. | |||
l | Led the strategic decision to pursue the Company’s pending merger with Willis Group Holdings Public Limited Company (the “Willis Merger”). | |||
Risk management | l | Monitor and ensure effective risk management | l | Continued ongoing risk management framework with the Risk Committee of the Board, making adjustments as required due to business or environmental changes. |
l | Prepared for retirement of top Risk Officer at the end of the fiscal year and named a successor without delay. | |||
Succession planning | l | Ensure Towers Watson has a robust bench of potential leaders to take on executive roles | l | Actively monitored succession plans for self and key leaders, and ensured appropriate development efforts were undertaken. |
Inclusion and Diversity (I&D) | l | Advance leader and associate engagement on I&D as an important business imperative | l | Maintained personal commitment and visibility around I&D, including participation in the United Nations’ World Autism Awareness Day. |
l | Held senior leaders accountable for incorporating I&D principles into talent management decisions across Towers Watson. | |||
Given the strong overall financial results in a challenging market for professional services, as well as progress made on the many longer term, strategic efforts as noted above, and the growth demonstrated as compared to our competitors, the Committee recommended a bonus for Mr. Haley of 160% of target. This amount was subsequently confirmed by the Board of Directors.
Other Named Executives’ Bonuses: Performance Results
Towers Watson uses a scorecard approach within the bonus program framework to assess performance on an annual basis. All Towers Watson associates, including our named executives other than the CEO, use the scorecard in setting goals at the beginning of each fiscal year across four key performance areas. The four focus areas are based upon pre-established objectives that reflect both Company-wide (“Enterprise”) accountabilities and segment- or region-specific results (“Line of Sight”).

A named executive’s actual bonus recommendation is then determined by Mr. Haley based on an evaluation of Company, region/segment (if applicable) and individual performance versus the weighted objectives. While this process reflects a methodical approach to evaluating the job performance of our named executives, achievement of these goals is evaluated subjectively, and the amount of fiscal year-end bonuses awarded as a percentage of target is discretionarily determined.
11
In determining bonus payments for fiscal year 2015 for the named executives, the Committee asked for recommendations from Mr. Haley. In making his recommendations for the named executives, Mr. Haley reviewed the performance of each of the named executives against his individual, business segment/region/function and overall Company goals for the fiscal year. Mr. Haley discussed each recommendation with the Committee, which has final authority to determine the actual bonus amounts.
In addition to the overall financial performance of the Company during the fiscal year, the bonus recommendations provided to the Committee by Mr. Haley took into account the qualitative assessment described below of each named executive’s performance during the fiscal year:
Named Executive | Weighting | Performance Highlights | |
Mr. Millay (Chief Financial Officer) | 100% Enterprise | l | Led a highly effective Finance team that was able to monitor business results and identify areas of opportunity early. |
l | Co-led, with the Chief Administrative Officer, implementation planning and ongoing Continuous Improvement efforts resulting in significant progress toward achieving our Continuous Improvement target of $100 million run-rate savings. | ||
l | Oversaw strong shareholder engagement through Investor Relations function and personal discussions. | ||
l | Active participant in confidential discussions and due diligence with Willis Group Holdings Public Limited Company (“Willis”) relating to pending Willis Merger. | ||
Given the strong financial results for the fiscal year, as well as progress made on several strategic efforts as noted above, Mr. Haley recommended, and the Committee approved, a bonus for Mr. Millay of 135% of target. | |||
Mr. Foreman (Segment Leader, Exchange Solutions) | 40% Line of Sight 60% Enterprise | l | The Exchange Solutions Segment achieved 36% revenue growth for the year, primarily as a result of increased membership in the Retiree and Access Exchanges and growing membership in the Actives and Health and Welfare practices. |
l | Re-organized the Exchange Solutions Segment to respond to market developments and improve operations. | ||
l | Active participant in the marketplace and in shareholder engagement efforts. | ||
Given the strong financial results for the fiscal year, as well as progress made in the critical Exchange Solutions Segment as noted above, Mr. Haley recommended, and the Committee approved, a bonus for Mr. Foreman of 108% of target. | |||
Mr. Wickes (Segment Leader, Benefits) | l | The Benefits Segment achieved 6% revenue growth and net operating income margin of 36%. | |
l | Continued development of Global Heath & Group Benefits network, an anticipated future source of growth. | ||
l | Launched new products including master trust vehicles in the EMEA region. | ||
l | Active participant in confidential discussions and due diligence with Willis relating to pending Willis Merger. | ||
Given the strong financial results for the fiscal year, as well as the leadership contributions made on several strategic efforts as noted above, Mr. Haley recommended, and the Committee approved, a bonus for Mr. Wickes of 150% of target. | |||
Mr. Hess (Region Leader, Americas) | l | Implemented Client Development Group redeployment and leverage plans; re-focused sales activity to target the most promising large-scale opportunities and actively engaged with current and potential clients. | |
l | Drove restructuring of research functions to better align with business requirements. | ||
l | Sponsor of Out@TW associate resource community and highly visible promoter of The Americas Inclusion & Diversity efforts, serving as a role model for the Company. | ||
Given the strong financial results for the fiscal year, and noting the overall Line of Sight performance, Mr. Haley recommended, and the Committee approved, a bonus for Mr. Hess of 146% of target. | |||
12
Long-Term Incentive Compensation: PVRSUs
The Company’s named executives participate in the stockholder-approved 2009 Long-Term Incentive Plan. Towers Watson uses only one form of long-term compensation in our executive compensation program-PVRSUs or performance vested restricted stock units. This means that long-term incentive compensation is 100% linked to Company financial performance and stock price. Executives become vested in a number of PVRSUs at the end of a three-year performance period, based on the achievement of specified performance goals.
For the 2015-2017 performance period, the Committee established each named executive’s award opportunity as a percentage of base salary. Individual target grant amounts, based on the grant date fair value, were set at 245% of base salary for the Chairman and Chief Executive Officer and 125% of base salary for the other named executives and are unchanged from fiscal year 2014. These levels were designed to result in target total direct compensation (base salary, target fiscal year-end bonuses, and target value of PVRSUs) between the 25th and 50th percentile of our peer group.
Awards Granted for the 2015 - 2017 Performance Period
The Committee specified two distinct performance metrics for PVRSUs granted to the Company’s named executives for the 2015-2017 performance period: organic revenue growth (based on fiscal year 2017 revenue versus fiscal year 2014 revenue) as the primary metric and average three-year adjusted earnings per share (“Adjusted EPS”) as a modifier. These metrics were selected to focus our named executives on driving profitable organic revenue growth, while also maintaining stable profit margins at a relatively high level.
The actual number of PVRSUs that will vest and become payable is first determined by applying a performance factor based on organic revenue achievement to the target number of PVRSUs. The number of PVRSUs earned based on organic revenue achievement is then further adjusted by the Adjusted EPS performance factor. The Adjusted EPS results used as a modifier were decreased in fiscal year 2015 from the goals established for PVRSUs granted in the prior fiscal year to a targeted three-year average of $5.97. This reduction occurred in order to account for the impact on our operating results from the sale of our Brokerage line of business in fiscal year 2014. Named executives may therefore earn between zero (if the minimum threshold for either metric is not achieved) and 204% of their target number of PVRSUs for the 2015-2017 performance period.
Organic Revenue Growth | Adjusted EPS | Total Award Opportunity (as a Percentage of Target) | ||
Potential Achievement | Performance Factor | Potential Achievement | Performance Factor | |
<106.5% | 0% | <$5.65 | 0% | 0% |
111.5% | 100% | $5.97 | 100% | 100% |
117.5% | 170% | $6.14 | 120% | 204% |
See pages 20 to 21 related to the table on Grants of Plan-Based Awards in Fiscal Year 2015 for more information on the target performance goals and the formula to be used to determine the amount payable based on results for the 2015-2017 performance period.
The Committee has the authority to exercise negative discretion in determining the number of PVRSUs that become vested and payable at the end of the performance period to each named executive.
Named executives generally will forfeit unvested PVRSUs upon a termination of employment prior to the end of the performance period. However, in all jurisdictions in which a benefit can lawfully be conditioned on age and/or years of service, the awards will continue to vest following a “qualifying retirement”, subject to (i) achievement of the performance conditions with respect to the PVRSUs; (ii) compliance with certain non-competition obligations; and (iii) completion of the first fiscal year (July 1 to June 30) of service during the performance period at or before the date of retirement.
In connection with the pending Willis Merger, it is anticipated that each outstanding PVRSU will be converted into a service-vesting award corresponding to a number of Willis ordinary shares (rounded down to the nearest whole share) equal to the product of (a) the applicable number of shares of Company common stock subject to such PVRSU and (b) 2.6490 (the “Exchange Ratio”). The applicable number of shares of Company common stock subject to be so converted will be determined by applying the target level of performance or, if greater, the actual performance through the most recent date prior to the effective time for which performance goal achievement can reasonably be determined. Following the Willis Merger, the converted PVRSUs will no longer be subject to performance-based vesting criteria. Otherwise, PVRSUs so assumed and converted will continue to have, and will be subject to, the same time-based vesting and other terms and conditions as applied
13
to the applicable PVRSU award immediately prior to the effective time of the Willis Merger, except that the PVRSUs will vest if the executive’s employment is terminated without cause within 12 months following the effective time of the Willis Merger.
Other Pay Programs and Policies
Clawback and Hedging Policies
The Company has adopted a formal “clawback” policy applicable to annual and long-term performance-based incentive awards made to its executive officers. Under this policy, the Company will, to the extent permitted by governing law, seek to recoup performance-based compensation paid to its executive officers to the extent that such compensation was based on financial results that the Company is required to restate as a result of non-compliance with applicable accounting standards as generally applied. The Company also may seek to recoup such compensation, to the extent permitted by governing law and determined appropriate by the Committee, in the event that the Company is required to restate its financial results as a result of misconduct on the part of any participant in such compensation arrangement or in the event that incorrect financial information was used in the determination of such compensation (regardless of whether such incorrect information results in a restatement of the Company’s financial results).
In addition, under our insider trading policy, an officer, member of the Board of Directors or designated insider may not engage in short selling Company common stock at any time. Such individuals are prohibited from hedging and from using instruments or arrangements for margin borrowing or stock lending, pledging or placing any “stop loss” orders or any other “limit order” in relation to securities of the Company.
Stock Ownership Guidelines
Our stock ownership guidelines are intended to align associates’ financial interest with the interests of other stockholders and the Company.
The stock ownership guidelines are expressed as a multiple of base salary. Mr. Haley’s ownership requirement is five times his base salary. The ownership requirement for the other named executives is two times their respective base salaries. The aforementioned guidelines are prorated over the first six years of employment with Towers Watson as measured beginning July 1, 2010. Each of our named executives had satisfied his guideline as of June 30, 2015, and owned substantially more stock than required by the guidelines.
Retirement and Savings Plans
Each of the named executives participates in qualified and supplemental non-qualified defined benefit plans sponsored by the Company that are available to associates in the United States. The Company’s sponsorship of such plans is consistent with its belief that defined benefit plans continue to represent a crucial and viable means to provide for the future retirement security of our associates and to encourage sustained service with the Company. When the Committee assesses the competitiveness of executive compensation, it takes into account the impact of changes in pension value to positioning of total compensation. More details regarding the defined benefit plans are included in the discussion following the Pension Benefits table on page 24. Each of our named executives is also eligible to participate in a 401(k) plan that is available to associates in the United States.
The Towers Watson defined benefit plans provide benefits using a stable value formula for service rendered on or after January 1, 2012. Under this formula, the qualified and supplemental non-qualified plans will provide each eligible participant with a lump sum benefit payable at age 65 equal to 15 percent of each covered year’s pay up to the Social Security wage base, and 20 percent of each covered year’s pay in excess of the wage base, with pay for these purposes consisting of salary, bonuses and, for non-executives, any overtime wages. The lump sum will be reduced for benefit commencement prior to age 62. Participants in the qualified pension plan may, in most instances, choose to receive the value of their lump sum benefit as an annuity at the time of retirement.
On August 16, 2013, the Committee recommended, and the Board (with Mr. Haley recusing himself) approved, freezing the portion of the lump sum benefit payable to Mr. Haley upon his retirement under the non-qualified defined benefit plan attributable to his accrued benefit under the legacy Watson Wyatt formula at $17,597,266, its value as of June 30, 2013. The Committee recommended this change as a retention tool, because, otherwise, Mr. Haley could have been incentivized to retire if he believed interest rates would increase (which would cause the lump sum value of his benefit to decline). This benefit is subject to applicable tax withholding. Mr. Haley will also continue to be entitled to any benefits earned under the non-qualified defined benefit plan stable value formula attributable to his service after January 1, 2012. Additional information on the legacy Watson Wyatt benefit under the non-qualified defined benefit plan is included in the discussion following the Pension Benefits Table on page 24.
14
Non-Qualified Deferred Savings Plan for U.S. Employees
On November 14, 2013, the Compensation Committee approved the Towers Watson Non-Qualified Deferred Savings Plan for U.S. Employees (the “Towers Watson Deferred Savings Plan”). The Towers Watson Deferred Savings Plan is an unfunded deferred compensation plan for select management and other highly-compensated associates, including the Company’s executive officers. The purpose of the Towers Watson Deferred Savings Plan is to provide a select group of associates who contribute significantly to the future success of the Company with a means to defer receipt of a portion of their compensation, and potentially to receive a discretionary matching contribution from the Company. All associate deferrals, and all Company matches, are credited in the form of Company stock units and will be paid in shares of Company stock under the Towers Watson & Co. 2009 Long Term Incentive Plan. As a result, the value of the notional account is aligned with the value of the Company’s stock. Payments will be made on the first business day of the month following the date that is six months after the participant’s separation from service. This transitioned from the prior arrangement whereby all eligible associates received an annual cash distribution for the “missed” Company match related to compensation above IRS limits. Effective January 1, 2014 under the new Towers Watson Deferred Savings Plan, eligible associates are required to make their own compensation deferrals in order to receive credit for the match.
Employee Welfare Benefit Plans
Our named executives are eligible to participate in the medical, life insurance and other welfare benefits available to all other associates. There are no special medical plans or other welfare plans for our named executives, except that the named executives are covered by an officers’ and directors’ liability policy that the Company provides only to certain of its senior executives and its non-employee directors.
Severance and Other Benefits
The Company has not entered into employment agreements or change-in-control severance agreements with its named executives and does not provide any form of tax gross-ups or significant perquisites. Named executives are eligible for the same severance pay plan as all U.S.-based associates. The plan provides for severance pay in an amount equal to three weeks’ base pay for each completed year of the named executive’s service, plus twelve weeks, up to a maximum of 44 weeks’ pay, payable in a lump sum upon termination.
Tax and Accounting Treatments of Elements of Compensation
Section 162(m) of the Internal Revenue Code (the “Code”) disallows a tax deduction for the Company for compensation paid to certain executives exceeding $1 million in any taxable year, excluding compensation that is considered to be “performance based.” Annual fiscal year-end bonuses paid to senior executives and PVRSUs may qualify as “performance-based compensation” that is not counted toward the $1 million limitation on deductibility of compensation. However, the rules and regulations promulgated under Section 162(m) of the Code are complicated and subject to change from time to time, sometimes with retroactive effect. In addition, a number of requirements must be met in order for particular compensation to so qualify. As such, there can be no assurance that any compensation will be deductible under all circumstances.
At the beginning of fiscal year 2015, in accordance with the terms of the stockholder-approved Towers Watson & Co. Incentive Compensation Plan, the Committee established the maximum annual bonus award as 2.5 percent of net income for the fiscal year in the case of the CEO and 1.5 percent of net income for each other named executive. For fiscal year 2015, the Committee certified the amount of net income as defined under the plan for the performance period and each participant’s maximum award under the plan, and determined each participant’s actual award as described above, exercising discretion so that the bonuses actually paid were well below the maximum incentive awards permissible under the performance goals.
As a result, it is expected that the 2015 fiscal year-end bonuses paid to the named executives under the Incentive Compensation Plan will not be counted toward the $1 million limitation on deductibility of compensation. Likewise, because they were granted under a stockholder-approved plan and other requirements were satisfied, it is expected that the PVRSUs awarded to the named executives will not be subject to the $1 million limitation on deductibility of compensation.
Compensation Decision Process and Methodology
Role of the Committee
The Committee is responsible for evaluating the compensation levels for each of the named executives and for administering the Company’s executive compensation program. The Committee reviews and approves all components of executive compensation for the named executives. Each year, the Committee reviews and approves the corporate goals and key objectives related to the compensation of the CEO and reviews the key objectives of the named executives and evaluates their performance in light of those goals and objectives. In addition, the Committee reviews a pay-for-performance assessment of the
15
CEO that includes a review of the Company’s financial performance versus the peer group (as described below) over a one- and three-year period. The following metrics are reviewed for the Company and the peer group:
• | Revenue growth |
• | Earnings before interest, taxes, depreciation and amortization (“EBITDA”) (growth and margin) |
• | Net Income growth |
• | EPS growth |
• | Total Shareholder Return (stock price plus dividends) |
In reviewing the Company’s pay programs, the Committee considers whether the programs encourage unnecessary or excessive risk taking that might have an adverse impact on the Company and has determined that the Company’s compensation programs do not create risks that are reasonably likely to result in a material adverse impact to the Company.
Role of Internal and External Compensation Consultants
The Committee has engaged Compensation Advisory Partners, LLC (“CAP”) as its compensation consultant to support its responsibilities. CAP’s work is performed directly under the guidance of the Committee, in cooperation with management, to assist the Committee with executing its executive compensation-related responsibilities. In such role, CAP serves as an objective third-party advisor in assessing the reasonableness of compensation levels and the appropriateness of the design of the Company’s evolving executive compensation program structure. The Committee has the sole authority to retain and terminate the services of CAP.
In fiscal year 2015, CAP supported the Committee by:
• | Conducting a competitive review and analysis of the Company’s current executive compensation program in comparison to competitive market survey data and executive pay and performance at a specified peer group of companies, for reference in determining the appropriate levels for future long-term incentive awards and in making fiscal year 2015 compensation decisions; |
• | Performing a comprehensive risk assessment of the Company’s executive compensation plans, practices and policies for the purpose of confirming/evaluating whether the Company’s executive compensation program is sufficiently balanced and does not create incentives for excessive risk taking; |
• | Recommending and evaluating companies to be included in the Committee’s peer group; |
• | Reviewing competitive long-term incentive practices and goals set for the fiscal year 2015 PVRSU awards; |
• | Providing information on executive compensation trends, as requested; and |
• | Participating in many of the Committee’s meetings and conference calls (there were six such meetings or calls during fiscal year 2015) and, when requested by the Committee chair, in the Committee’s executive sessions. |
Also, for the fiscal year ended June 30, 2015, the Company’s Human Resources department used internal Company executive compensation consultants to provide various services. These services included assisting in recommending financial and other targets to be achieved under the Company’s compensation and incentive programs and in preparing analyses of financial data, peer group comparisons and other briefing materials for management’s review, which information was ultimately shared with the Committee.
The Committee has assessed the independence of CAP, considering the following six factors and other factors that it deemed relevant: (1) the absence of other services provided to the Company by CAP; (2) the amount of fees paid by the Company to CAP as a percentage of CAP’s total revenue; (3) the policies or procedures maintained by CAP that are designed to prevent conflicts of interest; (4) the absence of any business or personal relationships between the individual employees of CAP involved in the engagement and a member of the Committee; (5) the absence of any Company stock owned by CAP’s employees involved in the engagement; and (6) the absence of any business or personal relationships between our executive officers and CAP or the employees of CAP involved in the engagement.
The Role of the CEO and Management
The CEO does not participate in the Committee’s determination of his own compensation. However, he makes
16
recommendations to the Committee for each of the other named executives. The CEO bases these recommendations on his assessment of each executive’s performance, as well as business segment/region/function and overall Company goals for the fiscal year as described above. The Committee reviews the CEO’s recommendations, makes adjustments as it determines appropriate, and approves compensation at its sole discretion.
Use of Peer Company Data
In making its determinations for fiscal year 2015, the Committee relied on publicly available information for a select group of peer companies, commissioned compensation survey data and its own knowledge of the market for key executives. The peer group was selected by the Committee based on the recommendations of CAP and input from management on the comparability of the business operations of potential peer group companies. Information about the peer group companies was used to inform decisions regarding the assessment of competitive pay levels and mix, annual performance/merit driven compensation and future program design.
The peer group companies include those few public companies with human resources consulting lines of business. Because many of the Company’s direct competitors are privately owned (e.g., the Hay Group) or are subsidiaries of larger public companies (e.g., Mercer Human Resource Consulting, Aon Hewitt and Buck Consultants), the number of direct competitors for which public information is available for peer group comparison is limited. Therefore, additional peer group companies in other industries were selected using the following criteria:
• | Reasonably comparable size (based on revenue and market capitalization); |
• | Positive EBITDA; |
• | High human capital/low financial capital business model; and |
• | Global reach. |
For conducting a competitive assessment of the compensation levels of each of its named executives for fiscal year 2015, the Committee approved the following peer group of sixteen companies, which remains unchanged from that used for the Committee’s fiscal year 2014 assessment:
l | AllianceBernstein Holdings L.P. | l | FTI Consulting, Inc. |
l | Aon plc* | l | Gartner, Inc. |
l | Arthur J. Gallagher & Co. | l | Marsh & McLennan Companies, Inc.* |
l | Booz Allen Hamilton Holding Corporation | l | Moody’s Corporation |
l | CACI International Inc. | l | Paychex, Inc. |
l | Cognizant Technologies Solutions | l | Robert Half International Inc. |
l | Dun & Bradstreet, Inc. | l | Unisys |
l | Equifax Inc. | l | Willis Group Holdings plc |
*The full peer group is used while examining pay levels, while these direct competitors (Aon plc and Marsh & McLennan Companies, Inc.) receive greater focus for pay practice information (i.e., the specific mix of compensation including base, bonus, long term incentives, etc.) relating to the CEOs of their relevant subsidiaries, Aon Hewitt and Mercer Human Resource Consulting, respectively.
Towers Watson continues to approximate the median in terms of revenues and is near the 75th percentile in terms of market capitalization among this peer group. The competitive assessment performed by CAP at the beginning of the fiscal year, using publicly-disclosed compensation data from the Company’s peer group, as well as published survey data then available, indicated that overall, the Towers Watson executives’ target total direct compensation (target total cash plus target long-term incentive opportunity) was positioned near the 25th percentile for most of the executives, including the CEO.
17
COMPENSATION COMMITTEE REPORT
Our Committee is composed of four independent Directors, each of whom meets the independence requirements of the NASDAQ listing standards and the rules and regulations of the SEC. The Compensation Committee operates under a written charter adopted by the Board. Our charter can be viewed on the Company’s website (www.towerswatson.com) in the Investor Relations section.
We have reviewed and discussed the Compensation Discussion and Analysis (CD&A) with the CEO and CFO. Based upon our review and such discussion, we recommended to the Board that the CD&A be included in the Form 10-K/A.
THE COMPENSATION COMMITTEE:
Gilbert T. Ray (Chair)
Linda D. Rabbitt
Brendan R. O’Neill
Wilhelm Zeller
Compensation of Executive Officers
General Overview
The tables and narratives set forth below provide specified information concerning the compensation of our named executives. The Summary Compensation Table below reports compensation paid or accrued by Towers Watson with respect to services rendered to Towers Watson for the fiscal year ended June 30, 2015 and the two prior fiscal years.
Summary Compensation Table
Name and Principal Position | Fiscal Year | Salary (1) | Bonus (2) | Stock Awards (3) | Change in Pension Value and Non-Equity Nonqualified Deferred Compensation Earnings (4) | All other Compensation(5) | Total | |||||||||||||||||||
John J. Haley | 2015 | $ | 1,002,750 | $ | 2,020,000 | $ | 2,474,495 | $ | 665,075 | $ | 109,825 | $ | 6,272,145 | |||||||||||||
Chairman of the Board, President and Chief Executive Officer | 2014 | $ | 981,000 | $ | 1,500,000 | $ | 2,403,401 | $ | 1,811,884 | $ | 114,954 | $ | 6,811,239 | |||||||||||||
2013 | $ | 981,000 | $ | 1,656,000 | $ | 2,403,434 | $ | 680,005 | $ | 112,692 | $ | 5,833,131 | ||||||||||||||
Roger F. Millay | 2015 | $ | 615,000 | $ | 670,000 | $ | 774,955 | $ | 262,655 | $ | 58,324 | $ | 2,380,934 | |||||||||||||
Vice President and Chief Financial Officer | 2014 | $ | 600,000 | $ | 525,000 | $ | 749,984 | $ | 259,957 | $ | 61,443 | $ | 2,196,384 | |||||||||||||
2013 | $ | 600,000 | $ | 575,000 | $ | 749,957 | $ | 188,360 | $ | 53,649 | $ | 2,166,966 | ||||||||||||||
James K. Foreman | 2015 | $ | 630,000 | $ | 550,000 | $ | 793,659 | $ | 474,857 | $ | 50,923 | $ | 2,499,439 | |||||||||||||
Managing Director, Exchange Solutions | 2014 | $ | 615,000 | $ | 550,000 | $ | 768,728 | $ | 416,541 | $ | 53,605 | $ | 2,403,874 | |||||||||||||
2013 | $ | 615,000 | $ | 650,000 | $ | 768,736 | $ | 229,185 | $ | 50,818 | $ | 2,313,739 | ||||||||||||||
Gene H. Wickes | 2015 | $ | 630,000 | $ | 760,000 | $ | 793,659 | $ | 311,711 | $ | 60,212 | $ | 2,555,582 | |||||||||||||
Managing Director, Benefits | 2014 | $ | 608,750 | $ | 550,000 | $ | 768,728 | $ | 439,470 | $ | 64,017 | $ | 2,430,965 | |||||||||||||
2013 | $ | 590,000 | $ | 635,000 | $ | 737,456 | $ | 859,928 | $ | 60,226 | $ | 2,882,610 | ||||||||||||||
Carl A. Hess | 2015 | $ | 561,250 | $ | 660,000 | $ | 706,241 | $ | 303,809 | $ | 47,823 | $ | 2,279,123 | |||||||||||||
Managing Director, The Americas | ||||||||||||||||||||||||||
(1) | Salary adjustments become effective on October 1 of each fiscal year. Effective October 1, 2014, Mr. Haley’s base salary increased from $981,000 to $1,010,000, Mr. Millay’s base salary increased from $600,000 to $620,000, Mr. Foreman’s base salary increased from $615,000 to $635,000, Mr. Wickes’ base salary increased from $615,000 to $635,000 and Mr. |
18
Hess’ base salary increased from $550,000 to $565,000. Thus, the salary amounts shown in the Summary Compensation Table for fiscal year 2015 reflect three months of salary at the rate in effect prior to October 1, 2014 and nine months of salary at the new rate effective October 1, 2014.
(2) | Reflects the value of fiscal year-end bonuses earned during the applicable fiscal year and which were paid in the following fiscal year (e.g., bonuses earned in fiscal year 2015 were paid in September 2015 and are reported in the row for fiscal year 2015). The fiscal year-end bonus program is a discretionary bonus program, which is designed to reward achievement of individual, business segment/function and/or overall results for the Company during the fiscal year. For fiscal year 2015, Mr. Haley’s target bonus was 125 percent of his base salary, and the target bonus for Messrs. Millay, Foreman, Wickes and Hess was 80 percent of base salary, in each case at the rate in effect at the end of the fiscal year. The amount of the bonus awarded as a percentage of target was discretionarily determined at fiscal year-end by the Committee based on the achievement of individual, business segment/function and/or overall results for the Company during the fiscal year, as described above in the Compensation Discussion and Analysis. |
(3) | For fiscal year 2015, amounts shown represent the aggregate target grant date fair value under applicable accounting standards of PVRSU awards under the Company’s 2009 Long Term Incentive Plan, as discussed in Note 16 to the Company’s Consolidated Financial Statements in the Company’s Annual Report on Form 10-K for the fiscal year ended June 30, 2015. The aggregate grant date fair value of the 2015 PVRSU awards, assuming the maximum level of achievement of the performance metrics over the three-year performance period beginning July 1, 2014 and ending June 30, 2017, is $5,048,009 for Mr. Haley, $1,580,916 for Mr. Millay, $1,619,124 for Mr. Foreman, $1,619,124 for Mr. Wickes and $1,440,788 for Mr. Hess. |
(4) | This column reflects any aggregate increase in actuarial present values of accumulated benefits during the relevant fiscal year for the named executives under the Towers Watson Pension Plan and the Towers Watson SERP. Any increase in actuarial present value was determined using assumptions that are the same as those used in Towers Watson’s financial statements for the fiscal year ended June 30, 2015, except that retirement is assumed to occur at the earliest unreduced retirement age for the named executives, and no pre-retirement terminations or deaths are assumed to occur. |
The earliest unreduced retirement age for Messrs. Millay and Hess is age 62. The earliest unreduced retirement age assumed for Mr. Foreman is age 60 because the majority of his accrued benefits is unreduced at age 60. The earliest unreduced retirement age for Mr. Haley and Mr. Wickes are their current ages because they were over age 62 at the end of the fiscal year.
The increases in the actuarial present values for Messrs. Haley, Millay, Foreman, Wickes and Hess for fiscal year 2015 of $665,075, $262,655, $474,857, $311,711 and $303,809, respectively, can be attributed to several factors. First, the assumed discount rate used to determine the value of benefits changed from 4.75 percent to 5.00 percent for benefits from the Towers Watson SERP. The discount rate change had the effect of decreasing the present values. The assumed interest rate for estimating the lump sum value of the Towers Watson SERP benefits payable at retirement was changed from 1.75 percent, 2.25 percent, 2.75 percent and 3.00 percent for retirements in fiscal year 2015, 2016, 2017 and 2018 and thereafter, respectively, to 1.50 percent, 2.00 percent, 2.50 percent and 3.00 percent for retirements in fiscal year 2016, 2017, 2018 and 2019 and thereafter, respectively. The mortality assumption for the Towers Watson Pension Plan was changed from the prescribed annuitant table under Internal Revenue Code Section 430(h)(3)(A) for the 2014 plan year to the RP-2014 white collar annuitant table with improvements from 2006-2015 based on Scale BB-2D and future improvements grading down linearly to 0% over ten years. The assumption changes increased the actuarial present value amounts by $131,870 for Mr. Haley, $113,467 for Mr. Foreman, $186,853 for Mr. Wickes and $8,962 for Mr. Hess, and decreased the actuarial present value amounts by $2,972 for Mr. Millay. Second, each of the named executives accrued an additional year of service, which increased the present values by $585,995 for Mr. Haley, $205,743 for Mr. Millay, $176,060 for Mr. Foreman, $266,923 for Mr. Wickes and $161,264 for Mr. Hess. Third, the passage of time means that Messrs. Millay, Foreman and Hess are all one year closer to their assumed retirement dates and therefore payment of benefits, resulting in increases to the actuarial present value. For Messrs. Haley and Wickes, the passage of time results in a decrease to the actuarial present value because their benefits were assumed to have commenced and they have foregone receipt of benefits because of their continued employment.
(5) | For the fiscal year ended June 30, 2015, all other compensation consists of (a) Company matching contributions made to a Towers Watson qualified savings plan in the amount of $10,600 for each of Messrs. Haley, Millay and Wickes, $10,888 for Mr. Foreman and $11,251 for Mr. Hess; (b) Company matching contributions made in the form of fully vested restricted stock units to a defined contribution supplemental executive retirement plan in the amount of $89,462 for Mr. Haley, $34,967 for Mr. Millay, $36,567 for Mr. Foreman, $36,567 for Mr. Wickes, and $26,867 for Mr. Hess; (c) premiums paid for group term life insurance in the amount of $51 for Mr. Haley and $1,026 for each of Messrs. Millay, Foreman and Wickes and $888 for Mr. Hess; and (d) other miscellaneous compensation, including payment for the cash out or sale back |
19
to the Company of excess unused paid time off (all U.S.-based associates are subject to the same paid time off limits) in the amount of $9,712 for Mr. Haley, $11,731 for Mr. Millay, $2,442 for Mr. Foreman, $12,019 for Mr. Wickes and $8,817 for Mr. Hess.
Towers Watson provides no perquisites or other personal benefits having an aggregate incremental cost for any named executive in excess of $10,000, and as a result, the value of any such perquisites or other personal benefits is not included in this column.
Grants of Plan-Based Awards in Fiscal Year 2015
The table below shows the PVRSUs that were granted to each of the named executives during fiscal year 2015 under the Company’s 2009 Long Term Incentive Plan.
Estimated Future Payouts Under Equity Incentive Plan Awards | |||||||||||||||
Name | Grant Date | Threshold Number of Shares | Target Number of Shares | Maximum Number of Shares | Grant Date Fair Value of Stock Awards | ||||||||||
John J. Haley | 9/25/2014 | 2,474 | 24,740 | 50,470 | $ | 2,474,495 | |||||||||
Roger F. Millay | 9/25/2014 | 775 | 7,748 | 15,806 | $ | 774,955 | |||||||||
James K. Foreman | 9/25/2014 | 794 | 7,935 | 16,188 | $ | 793,659 | |||||||||
Gene H. Wickes | 9/25/2014 | 794 | 7,935 | 16,188 | $ | 793,659 | |||||||||
Carl A. Hess | 9/25/2014 | 707 | 7,061 | 14,405 | $ | 706,241 | |||||||||
Amounts shown under the “Estimated Future Payouts Under Equity Incentive Plan Awards” columns represent threshold, target and maximum number of PVRSU Awards that may be earned (that is, become vested) under the Company’s 2009 Long Term Incentive Plan following the end of the three-year performance period beginning July 1, d 2014 and ending June 30, 2017. Amounts actually earned are payable in shares of Company stock. Dividend equivalents are accrued during the performance period for outstanding awards but are only paid out when and to the extent such awards are earned. See a discussion of the PVRSU Awards in the Compensation Discussion and Analysis beginning on page 7 of this disclosure.
For the fiscal year 2015 PVRSU Awards, the Committee established organic revenue growth during the performance period (based on fiscal year 2017 revenue versus fiscal year 2014 revenue on a constant currency basis) and three-year average adjusted EPS as the performance metrics for the PVRSU Awards. For the fiscal 2015 through 2017 performance period, the number of PVRSUs that may become vested and payable pursuant to the Award shall be determined as the product of multiplying items (a), (b) and (c) below, where:
(a) | is the target number of PVRSUs subject to the Award; |
(b) | is the contingent percentage (as set forth in Table A) that corresponds to the percentage growth in Company organic revenue achieved over the performance period; and |
(c) | is the three-year average adjusted EPS multiplier (as set forth in Table B) that corresponds to the average adjusted EPS over the three-year performance period ending June 30, 2017. |
Table A | ||
Fiscal Year 2017 Company Organic Revenue as a Percentage of Fiscal Year 2014 Company Organic Revenue | Contingent Percentage of Award Earned | |
≥ 117.5% | 170% | |
≥ 115.5% | 140% | |
≥ 113.5% | 120% | |
≥ 111.5% | 100% | |
≥ 109.5% | 90% | |
≥ 108.5% | 75% | |
≥ 107.5% | 50% | |
≥ 106.5% | 25% | |
< 106.5% | 0% | |
20
Table B | ||
Three-Year Average Adjusted EPS for the Three-Year Performance Period Ending June 30, 2017 | Contingent Percentage of Award Earned | |
< $5.65 | 0% | |
≥ $5.65 | 40% | |
≥ $5.81 | 80% | |
≥ $5.97 | 100% | |
≥ $6.14 | 120% | |
For example, at the end of the three-year performance period, if organic revenue growth is 113.8% and the three-year average adjusted EPS for the three-year performance period ending June 30, 2017 is $6.10, Mr. Haley would vest in 29,688 PVRSUs (24,740 x 120% x 100%), in addition to the dividend equivalents credited to his PVRSU Award during the performance period that would vest on the same basis.
Outstanding Equity Awards at 2015 Fiscal Year-End
The following table sets forth information concerning the outstanding stock awards held at June 30, 2015 by each of the named executives.
Option Awards | Stock Awards | |||||||||||
Name | Number of Securities Underlying Unexercised Options Exercisable(1) | Option Exercise Price(2) | Option Expiration Date | Equity Incentive Plan Awards: Number of Unearned Shares(3) | Equity Incentive Plan Awards: Market or Payout Value of Unearned Shares(4) | |||||||
John J. Haley | 0 | N/A | N/A | |||||||||
32,972(5) | $ | 4,147,878 | ||||||||||
50,728(6) | $ | 6,381,582 | ||||||||||
Roger F. Millay | 12,073 | 45.88 | 3/4/17 | |||||||||
10,289(5) | $ | 1,294,356 | ||||||||||
15,887(6) | $ | 1,998,585 | ||||||||||
James K. Foreman | 0 | N/A | N/A | |||||||||
10,546(5) | $ | 1,326,687 | ||||||||||
16,271(6) | $ | 2,046,892 | ||||||||||
Gene H. Wickes | 0 | N/A | N/A | |||||||||
10,546(5) | 1,326,687 | |||||||||||
16,271(6) | 2,046,892 | |||||||||||
Carl A. Hess | 0 | N/A | N/A | |||||||||
3,925(5) | 493,765 | |||||||||||
14,4796) | 1,821,458 | |||||||||||
(1) | All options reported are fully vested and represent the right to purchase Towers Watson Class A Common Stock at the stated exercise price. |
(2) | All option exercise prices were set at the closing price on the date of grant of Watson Wyatt common stock (for those options issued prior to the Towers Perrin | Watson Wyatt Merger) or Towers Watson Class A Common Stock (for those options issued subsequent to the Towers Perrin | Watson Wyatt Merger). |
(3) | Represents the number of PVRSUs granted under the Company’s 2009 Long Term Incentive Plan and credited with dividend equivalents, assuming projected earn-out of 144 percent following completion of the three-year performance period ending June 30, 2016 and assuming projected earn-out of 204 percent following completion of the three-year |
21
performance period ending June 30, 2017, such projections based on actual performance through June 30, 2015. Awards vest at between zero and 204 percent of the target number of PVRSUs based on the extent to which specified performance metrics are achieved over the applicable three-year performance period, subject to the named executive’s continued employment with the Company through the end of the performance period. See the discussion following the table on Grants of Plan-Based Awards in Fiscal Year 2015 on page 20 for more information on the formula to be used to determine the amount payable based on results for the fiscal year 2015 through 2017 performance period.
The Committee has the authority to exercise negative discretion in determining the number of PVRSUs that become vested and payable pursuant to the PVRSU Awards.
(4) | Reflects the value as calculated based on the closing price of the Company’s stock on June 30, 2015 of $125.80 per share. |
(5) | Represents an award of PVRSUs granted for the three-year performance period beginning July 1, 2013 and ending June 30, 2016. |
(6) | Represents an award of PVRSUs granted for the three-year performance period beginning July 1, 2014 and ending June 30, 2017. |
Options Exercised and Stock Vested During the Fiscal Year Ended June 30, 2015
The following table sets forth information concerning option awards that were exercised and stock awards that vested during fiscal year 2015 for each of the named executives.
Option Awards | Stock Awards | |||||||||||||||
Name | Number of Shares Acquired on Exercise | Value Realized on Exercise | Number of Shares Acquired on Vesting | Value Realized on Vesting | ||||||||||||
John J. Haley | 106,933 | $ | 9,663,905 | |||||||||||||
64,617 | (1) | $ | 8,128,819 | (2) | ||||||||||||
Roger F. Millay | 13,042 | $ | 910,324 | |||||||||||||
20,163 | (1) | $ | 2,536,505 | (2) | ||||||||||||
James K. Foreman | — | $ | — | |||||||||||||
20,668 | (1) | $ | 2,600,034 | (2) | ||||||||||||
Gene H. Wickes | 21,005 | $ | 1,859,968 | |||||||||||||
19,827 | (1) | $ | 2,494,237 | (2) | ||||||||||||
Carl A. Hess | — | $ | — | |||||||||||||
— | $ | — | ||||||||||||||
(1) | Represents the number of PVRSUs that vested for the three-year performance period beginning July 1, 2012 and ending June 30, 2015, including the vesting of accrued dividend equivalents. |
For the fiscal year 2013 PVRSU Awards, the Committee established organic revenue growth during the performance period (based on fiscal year 2015 revenue versus fiscal year 2012 revenue on a constant currency basis) and three-year average adjusted EPS as the performance metrics for the PVRSU Awards. For the fiscal 2013 through 2015 performance period, the number of PVRSUs that became vested and payable was determined as the product of multiplying items (a), (b) and (c) below, where:
(a) | was the target number of PVRSUs subject to the award; |
(b) | was the contingent percentage (as set forth in Table A) that corresponds to the percentage growth in Company organic revenue achieved over the performance period; and |
(c) | was the three-year average adjusted EPS multiplier (as set forth in Table B) that corresponds to the average adjusted EPS over the three-year performance period ending June 30, 2015. |
22
Table A | ||
Fiscal Year 2017 Company Organic Revenue as a Percentage of Fiscal Year 2014 Company Organic Revenue | Contingent Percentage of Award Earned | |
≥ 117.5% | 170% | |
≥ 115.5% | 140% | |
≥ 113.5% | 120% | |
≥ 111.5% | 100% | |
≥ 109.5% | 90% | |
≥ 108.5% | 75% | |
≥ 107.5% | 50% | |
≥ 106.5% | 25% | |
< 106.5% | 0% | |
Table B | ||
Three-Year Average Adjusted EPS for the Three-Year Performance Period Ending June 30, 2017 | Contingent Percentage of Award Earned | |
< $5.65 | 0% | |
≥ $5.65 | 40% | |
≥ $5.81 | 80% | |
≥ $5.97 | 100% | |
≥ $6.14 | 120% | |
Following the completion of the fiscal year 2013 through 2015 performance period, the Committee certified that revenue growth exceeded 113.5 percent, and that three-year average adjusted EPS for the three-year period ending June 30, 2015 exceeded $5.90. As a result, the Committee determined that PVRSU awards for the fiscal year 2013 through 2015 performance period had vested, and should be paid out, at 144 percent (120 percent multiplied by 120 percent).
The Committee did not exercise negative discretion in determining the number of PVRSUs that became vested and payable pursuant to the PVRSU Awards.
(2) | Reflects the value as calculated based on the closing price of Towers Watson Class A common stock on June 30, 2015 of $125.80 per share. The shares were actually distributed on September 15, 2015 following certification by the Committee. The actual value of stock awarded on the distribution date, based on the Company’s closing share price on the prior business day of $119.30, was $7,708,793 for Mr. Haley, $2,405,449 for Mr. Millay, $2,465,758 for Mr. Foreman and $2,365,324 for Mr. Wickes. |
Pension Benefits at 2015 Fiscal Year-End
With respect to each of the named executives, the table below provides information as of June 30, 2015 regarding the number of years of credited service and the present value of accumulated benefits payable at the earliest unreduced retirement age with respect to the Towers Watson Pension Plan and the Towers Watson SERP.
Messrs. Haley, Millay, Foreman, Wickes and Hess received distributions of $16,544, $5,431, $6,919, $6,760 and $2,794, respectively, from the Towers Watson SERP during the fiscal year ended June 30, 2015 to pay the associate portion of the Social Security tax attributable to benefits earned under the plan, as well as to cover the income tax thereon. Mr. Wickes received distributions of $31,827 from the Towers Watson Pension Plan during fiscal year 2015 for a prior period of service with Towers Perrin.
23
Pension Benefits | ||||||||||||
Name | Plan | Number of Years Credited Service | Present Value of Accumulated Benefit(1) | Payments During the Twelve Months Ended June 30, 2015 | ||||||||
John J. Haley | Towers Watson Pension Plan | 38.17 | $ | 2,281,838 | $ | — | ||||||
Towers Watson SERP | 38.17 | 19,000,574 | 16,554 | |||||||||
Total | $ | 21,282,412 | $ | 16,554 | ||||||||
Roger F. Millay | Towers Watson Pension Plan | 6.83 | $ | 322,303 | $ | — | ||||||
Towers Watson SERP | 6.83 | 1,205,611 | 5,431 | |||||||||
Total | $ | 1,527,914 | $ | 5,431 | ||||||||
James K. Foreman | Towers Watson Pension Plan | 29.00 | $ | 917,809 | $ | — | ||||||
Towers Watson SERP | 29.00 | 2,935,557 | 6,919 | |||||||||
Total | $ | 3,853,366 | $ | 6,919 | ||||||||
Gene H. Wickes | Towers Watson Pension Plan | 36.50 (2) | $ | 1,610,703 | $ | 31,827 | ||||||
Towers Watson SERP | 36.50 (2) | 4,959,080 | 6,760 | |||||||||
Total | $ | 6,569,783 | $ | 38,587 | ||||||||
Carl A. Hess | Towers Watson Pension Plan | 25.92 | $ | 1,051,480 | $ | — | ||||||
Towers Watson SERP | 25.92 | 2,079,507 | 2,794 | |||||||||
Total | $ | 3,130,987 | $ | 2,794 | ||||||||
(1) | The assumptions and methodology used in calculating the estimated present value shown in this column are the same as those used and disclosed in Note 11, “Retirement Benefits,” to our audited financial statements for the fiscal year ended June 30, 2015, beginning on page 84 of the Company’s Annual Report on Form 10-K, except the named executives are assumed to retire at their earliest unreduced retirement age and no pre-retirement terminations or deaths are assumed to occur. Also, no additional compensation or service is assumed beyond the June 30, 2015 calculation date. The specific relevant assumptions include a discount rate of 5.00 percent for the Towers Watson Pension Plan and 5.00 percent for the Towers Watson SERP, and post-retirement lump sum interest rates for the legacy Watson Wyatt and legacy Towers Perrin final average pay formulas in the Towers Watson SERP of 1.50 percent for retirements occurring during fiscal year 2016, 2.00 percent for retirements occurring during fiscal year 2017, 2.50 percent for retirements occurring during fiscal year 2018 and 3.00 percent for retirements occurring after fiscal year 2018. The mortality assumption for the Towers Watson Pension Plan is the RP-2014 white collar annuitant table with improvements from 2006 to 2015 based on Scale BB-2D with future improvements grading down linearly to 0% over 10 years. In addition, for the legacy Watson Wyatt and legacy Towers Perrin final average pay formulas in the Towers Watson SERP benefits, which require the conversion of life annuity benefits into a lump sum or annual installments, post-retirement mortality was based on the 1983 Group Annuity Mortality table (blended 50/50 for males and females) for Messrs. Haley, Millay, Wickes and Hess, while the UP-94 Static Mortality table (blended 90/10 for males and females) was used for Mr. Foreman. |
Effective December 31, 2011, benefit accruals were frozen under the qualified and nonqualified defined benefit plans that had been maintained by Towers Perrin and Watson Wyatt for U.S. associates, and benefits began to accrue under the stable value pension design for service rendered on or after January 1, 2012.
(2) | Includes 18 years of service with Towers Perrin before joining Watson Wyatt. |
Towers Watson Pension Plan
The Towers Watson Pension Plan is a broad-based, tax-qualified defined benefit pension plan that provides a benefit to eligible associates of Towers Watson. In general, all U.S. salaried and hourly associates, with the exception of associates paid on a bi-weekly basis and associates joining the Company through the Company’s acquisition of Extend Health, Inc. during fiscal year
24
2012, Liazon Corporation during fiscal year 2013 and Acclaris, Inc. during fiscal year 2015, and subsequent Extend Health, Liazon and Acclaris new hires, are eligible to participate.
The Towers Watson Pension Plan provides benefits using a stable value formula. Under the stable value formula, each eligible participant will earn a lump sum benefit at the Participant’s Normal Retirement Age (65) equal to 15 percent of each covered year’s pay up to the Social Security wage base, and 20 percent of each covered year’s pay in excess of the wage base, with pay for this purpose consisting of salary, bonus and, for non-executives, any overtime. The lump sum is unreduced at age 62 and for commencement prior to age 62, it is reduced at a compounding rate of 5 percent per year. Participants may choose to receive the value of their lump sum benefit as an actuarial equivalent annuity at the time of retirement. The standard form of benefit payment for benefits earned under the stable value provisions is a single life annuity benefit for participants who are not married and a 100 percent joint and contingent annuity for married participants. Alternatively, participants may elect a joint and contingent annuity with a continuation percentage of either 50 percent or 75 percent or a certain and continuous annuity with either 5 or 10 years of guaranteed payments. A single lump sum benefit is also available.
Benefits earned prior to December 31, 2011 are specified in the legacy formulas as outlined below.
Legacy Watson Wyatt Formulas
Benefit accruals earned under these formulas ceased on December 31, 2011. Defined benefit plan accruals after December 31, 2011 are earned under the stable value provisions described above.
Benefits earned under the legacy Watson Wyatt Pension formulas by participants who were employed by Watson Wyatt prior to the Towers Perrin | Watson Wyatt Merger or who were hired into a Watson Wyatt office prior to January 1, 2011 were based upon combined years of service with Watson Wyatt and Towers Watson through the earlier of date of termination and December 31, 2011 and the highest consecutive 60-month average of total compensation (base pay, overtime and bonus) through the earlier of date of termination and December 31, 2011. The credited service amounts shown in the table above for Messrs. Haley, Millay, Wickes and Hess represent actual combined years of service with Watson Wyatt and Towers Watson.
The standard form of benefit payment is a single life annuity benefit for participants who are not married and a 100 percent joint and contingent annuity benefit for married participants. Alternatively, participants may elect a joint and contingent annuity with a continuation percentage of 50, 75 or 100 percent, or a certain and continuous annuity benefit with 5 or 10 years of guaranteed payments, subject to the plan provisions and statutory limits. The payout option must be elected by the participant before benefit payments begin.
The monthly benefit at normal retirement (age 65) is equal to 1.7 percent times the participant’s average monthly compensation for the 60 consecutive months with the highest compensation plus 0.4 percent times the average monthly compensation for the 60 consecutive months with the highest compensation that exceeds the Social Security Covered Compensation (as defined in the plan), all times the number of completed years and months of continuous service up to 25 years. Mr. Haley’s benefits are based on the maximum 25 years of credited service.
For terminations after June 30, 2003, the early retirement age is age 55 with five years of service (except as noted below for grandfathered associates). For associates who are eligible for early retirement and who retire prior to age 62, gross benefits are reduced 8 percent per year between ages 58 and 62, and 6 percent per year between ages 55 and 58. For deferred vested associates who retire prior to age 65, gross benefits are actuarially reduced from age 65. As of June 30, 2014, Mr. Haley, Mr. Millay, Mr. Wickes and Mr. Hess are eligible for early retirement benefits.
Associates who were employed by Watson Wyatt on June 30, 2003 were grandfathered in prior pension plan provisions for five years, or until June 30, 2008. During the five-year grandfathering period, eligible associates continued to accrue benefits under the legacy Watson Wyatt provisions in effect before July 1, 2003, except that the five-year certain and continuous annuity form of payment was not grandfathered. Under these provisions, the same formula described above is used except that an associate’s average pay is determined to be the highest average 36 consecutive months of total pay. In addition, the benefit can never be less than the June 30, 2003 accrued benefit indexed by 3 percent each year.
Benefits accrued under the grandfathered formulas were frozen on the earlier of June 30, 2008 or termination of employment, except for the formula that indexes the June 30, 2003 accrued benefit which was frozen at December 31, 2011. At retirement or termination, whether before or after June 30, 2008, an associate’s accrued benefit will not be less than the frozen grandfathered benefit. If the associate terminates employment after age 50, the frozen grandfathered benefit will be reduced by 5 percent per year for commencement before age 60. For termination before age 50, this benefit will be actuarially reduced from age 65. Grandfathered associates who attain age 50 with 10 years of service will be eligible for early retirement. Messrs. Haley, Wickes and Hess currently qualify for the grandfathered provisions and are eligible for early retirement under those provisions.
25
Legacy Towers Perrin Formulas
In general, all U.S. associates who were employed by Towers Perrin prior to the Towers Perrin | Watson Wyatt Merger or who were hired into a legacy Towers Perrin office prior to January 1, 2011, with the exception of those associates paid on a bi-weekly basis, were eligible for benefits under these provisions. Associates earned benefits under two formulas up to the limits on compensation and benefits under the Code. Under the first formula, benefits were based upon final average plan compensation as of the earlier of the date of the participant’s termination of employment or December 31, 2007, for which plan compensation included base pay and both the bonus paid under the individual bonus program and the bonus paid under the Principal bonus program for the year in which they were earned. Under the second formula, benefits were determined using a cash balance methodology, for which plan compensation included base pay, the bonus paid under the individual bonus program and other incentive bonuses when paid, but did not include the bonus paid under the Principal bonus program. The normal retirement age under these provisions is the later of (i) age 65 and (ii) the earlier of (a) three years of service under the plan or (b) the fifth anniversary of employment.
Active associates as of January 1, 2003 accrued benefits under both the final average earnings formula and the cash balance formula until December 31, 2007. Upon termination of employment, the values of the benefits under both of these formulas are compared, with the participant receiving the greater of the two. Associates hired (or rehired) on or after January 1, 2003, but prior to January 1, 2011, earned benefits solely under the cash balance formula. Beginning January 1, 2008 through December 31, 2011, benefits were earned only under the cash balance formula. Mr. Foreman has earned benefits under both the final average earnings formula and the cash balance formula and is eligible to retire with reduced benefits as described below. The credited service amount shown for Mr. Foreman represent actual combined years of service with Towers Watson and Towers Perrin.
Final Average Earnings Formula
Benefits earned under the final average earnings formula are equal to 2 percent of the final five-year average of plan compensation (subject to the IRS statutory maximum) as of the earlier of termination of employment or December 31, 2007, multiplied by credited service as of December 31, 2007, subject to a maximum of 20 years. Under this formula, participants may retire as early as age 50 with 5 years of service and receive a reduced benefit. A participant may retire early with an unreduced benefit after the later of age 60 or 3 years of service. This is the participant’s unreduced early retirement date. Reduction factors are based upon either 5 percent per year or actuarial equivalent reductions based on the specified assumptions in Code Section 417(e)(3) from age 60, whichever produces the greater benefit.
Prior to October 1, 2008, the accrued benefit for participants terminating prior to eligibility for early retirement was equal to 2 percent of the final five-year average of plan compensation (subject to the IRS statutory maximum) multiplied by credited service projected to unreduced early retirement date (maximum of 20 years) multiplied by the ratio of credited service as of the earlier of date of termination or December 31, 2007 divided by projected credited service as of the unreduced early retirement date. Participants terminating after October 1, 2008 are not subject to such projection and proration. Mr. Foreman terminated his employment prior to his early retirement eligibility and after January 1, 2003, and was subsequently rehired. His benefit earned prior to his termination date is subject to the projection and proration described above.
Participants earning benefits under the final average earnings formula are also entitled to a Social Security supplemental benefit. This benefit is equal to $9,600 per year multiplied by the ratio of the participant’s credited service at the earlier of date of termination or December 31, 2007 to the participant’s projected service at unreduced early retirement date. This amount is payable from the later of the participant’s unreduced early retirement date or actual retirement date to the date the participant attains age 62.
Participants with service prior to December 31, 1993 are entitled to a subsidized joint and survivor spousal annuity, provided that they terminate employment after attaining age 50. The subsidized percentage equals 100 percent multiplied by the ratio of credited service as of December 31, 1993 divided by credited service at the earlier of date of termination or December 31, 2007, both subject to a maximum of 20 years.
Mr. Wickes terminated employment with Towers Perrin in 1996 prior to attaining age 50.
Cash Balance Formula
Benefits earned under the cash balance formula are expressed in the form of a notional account balance. Each month a participant’s cash balance account was increased by (1) pay credits based on the participant’s plan compensation for that month and (2) interest credits based on the participant’s hypothetical account balance at the end of the prior month. As of December 31, 2011, pay credits were frozen, but interest credits continue. Pay credits were 5 percent of plan compensation up to the
26
Social Security taxable wage base and 10 percent of pay over the Social Security taxable wage base, subject to the IRS statutory maximum on plan compensation. Interest credits are based on 10-year Treasury bond yields.
An opening cash balance account was established for all active plan participants as of January 1, 2003. This opening account balance was equal to the present value of the final average earnings accrued benefit and Social Security supplemental benefit payable at the participant’s unreduced early retirement date. Since his rehire through December 31, 2011, Mr. Foreman only earned benefits under the cash balance formula.
Participants with benefits under both the final average earnings formula and the cash balance formula may elect to receive their entire benefit as an annuity with the Social Security supplement or receive their cash balance formula benefit as a lump sum with the remaining benefit value distributed as an annuity. Participants with benefits under just the cash balance formula may receive their entire benefit as a lump sum payment or as an actuarially equivalent annuity.
Towers Watson SERP
The Towers Watson SERP is designed to restore benefits to plan participants whose qualified plan compensation or benefit levels are impacted by Internal Revenue Code maximums. For service rendered after December 31, 2011, benefits are earned under the stable value formula set forth in the Towers Watson Pension Plan, where the participant would accrue a lump sum payable at Normal Retirement Age (65) equal to 20% of plan compensation for the SERP. For purposes of the SERP, plan compensation is the same as the qualified plan, but only amounts over the Internal Revenue Code limit ($265,000 for 2015) shall be considered in determining the SERP benefit. A participant will receive a lump sum distribution six months after termination of employment equal to his or her stable value account with reductions for payments made prior to age 62 of a compounding 5 percent per year. Other than the timing and form of payment, all other stable value provisions are the same as those described in the Towers Watson Pension Plan.
Legacy Watson Wyatt Formulas
The legacy Watson Wyatt Excess Benefit and Watson Wyatt Excess Compensation formulas were designed to restore to eligible associates the reductions to their pension benefit imposed by Code limitations. When the excess formula benefits are added to the benefit provided by the legacy Watson Wyatt qualified plan formula, eligible associates will receive a total benefit equal to the benefit that would have been provided by the Watson Wyatt Pension Plan formula had the limitations not existed. The form of benefit payment provided under the excess plans for retirement eligible individuals is a lump sum generally payable six months following the termination of employment for the named executive. The portion of the vested benefit earned before January 1, 2005 is payable immediately at the end of the month following the retirement date. For associates that are not retirement eligible, the benefit accrued prior to June 30, 2003 is paid as a lump sum with the accrued benefit earned after June 30, 2003 paid as a life annuity at age 65.
On August 16, 2013, the Committee recommended, and the Board (with Mr. Haley recusing himself) approved, freezing the portion of the lump sum benefit payable to Mr. Haley upon his retirement attributable to his accrued benefit under the legacy Watson Wyatt formula at $17,597,266, its value as of June 30, 2013. The Committee recommended this change as a retention tool, because, otherwise, Mr. Haley could have been incentivized to retire if he believed interest rates would increase (which would cause the lump sum value of his benefit to decline). This benefit is subject to applicable tax withholding. Mr. Haley will also continue to be entitled to any benefits earned under the Towers Watson SERP attributable to his service after January 1, 2012.
Legacy Towers Perrin Formulas
The benefits provided under the Towers Perrin Restoration formula will be approximately equal to the difference between the benefits provided under the legacy Towers Perrin qualified formula and benefits that would have been provided under such formula if not for the limitations applicable to qualified plans under the Code, except that:
• | Participants with service prior to December 31, 1993 are entitled to a subsidized joint and survivor spousal annuity, provided that they terminate employment after attaining age 50. The subsidized percentage on the total benefit equals 60 percent multiplied by the ratio of credited service as of December 31, 1993 divided by credited service at the earlier of the date of termination or December 31, 2007, both subject to a maximum of 20 years. |
• | For participants terminating prior to eligibility for early retirement with an unreduced benefit, the total accrued benefit is equal to 2 percent of the final five-year average of plan compensation (subject to the IRS statutory maximum) multiplied by credited service projected to unreduced early retirement date (maximum of 20 years) multiplied by the ratio of credited service as of the earlier of date of termination or December 31, 2007 divided by projected credited service as of unreduced early retirement date. |
27
Benefits earned under this formula are distributed in four approximately equal annual installments, beginning six months after separation from service.
With respect to the Towers Watson Pension Plan and the Towers Watson SERP, the amounts shown in the Pension Benefit Table above are actuarial present values of the benefits accumulated through June 30, 2015. An actuarial present value is calculated by estimating expected future payments starting at an assumed retirement age, weighting the estimated payments by the estimated probability of surviving to each post-retirement age, and discounting the weighted payments at an assumed discount rate to reflect the time value of money. The actuarial present value represents an estimate of the amount which, if invested today at the discount rate, would be sufficient on an average basis to provide estimated future payments based on the current accumulated benefit. The assumed retirement age for each executive is the earliest age at which the executive could retire without any benefit reduction due to age (age 62, except for the final average earnings portion of the legacy Towers Perrin formulas, which was age 60) or the current age if the executive has already attained such earliest age. Actual benefit present values upon an executive’s retirement will vary from these estimates depending upon many factors, including an executive’s actual retirement age.
Nonqualified Deferred Compensation for the Fiscal Year Ended June 30, 2015
The following table provides information as of June 30, 2015 concerning the Watson Wyatt nonqualified deferred compensation plans assumed by Towers Watson in connection with the Towers Perrin | Watson Wyatt Merger, in which Messrs. Haley, Millay, Wickes and Hess are participants. In connection with approval of the stable value pension plan amendments discussed above, Watson Wyatt also froze contributions under the Watson Wyatt Deferred Savings Plan (“WWDSP”), effective immediately following the date that contributions were made for the short plan year ended December 31, 2011.
The table also provides information as of June 30, 2015 concerning the Towers Watson Non-Qualified Deferred Savings Plan for U.S. Employees (“TWDSP”) adopted by the Company effective January 1, 2014.
Name | Nonqualified Deferred Compensation Plan | Executive Contributions for the Fiscal Year Ended June 30, 2015 | Registrant Contributions for the Fiscal Year Ended June 30, 2015 | Aggregate Earnings for the Fiscal Year Ended June 30, 2015 | Aggregate Withdrawals/ Distributions | Aggregate Balance at June 30, 2015(5) | ||||||||||||||||
John J. Haley | WWDSP(1) | $ | — | $ | — | $ | 20,476 | (3) | $ | — | $ | 666,291 | ||||||||||
TWDSP(2) | $ | 134,193 | $ | 89,462 | $ | 62,409 | (4) | $ | — | $ | 286,064 | |||||||||||
Roger F. Millay | WWDSP(1) | $ | — | $ | — | $ | 2,246 | (3) | $ | — | $ | 73,099 | ||||||||||
TWDSP(2) | $ | 52,450 | $ | 34,967 | $ | 20,033 | (4) | $ | — | $ | 107,450 | |||||||||||
James K. Foreman | TWDSP(2) | $ | 54,850 | $ | 36,567 | $ | 21,459 | (4) | $ | — | $ | 112,876 | ||||||||||
Gene H. Wickes | WWDSP(1) | $ | — | $ | — | $ | 7,988 | (3) | $ | — | $ | 259,960 | ||||||||||
TWDSP(2) | $ | 54,850 | $ | 36,567 | $ | 21,459 | (4) | $ | — | $ | 112,876 | |||||||||||
Carl A. Hess | WWDSP(1) | $ | — | $ | — | $ | 2,910 | (3) | $ | — | $ | 94,691 | ||||||||||
TWDSP(2) | $ | 40,300 | $ | 26,867 | $ | 12,084 | (4) | $ | — | $ | 79,251 | |||||||||||
(1) | With respect to Messrs. Haley, Millay, Wickes and Hess, the Watson Wyatt Deferred Savings Plan was established to supplement the benefits of those participants in the Watson Wyatt & Company Savings Plan for U.S. employees whose company matching contributions to the Savings Plan are limited by the compensation and elective deferral limitations, or the nondiscrimination requirements, imposed by the Code. The Watson Wyatt Deferred Savings Plan does not allow for associate contributions. Participants generally vest in their account after three years of service. Messrs. Haley, Millay, Wickes and Hess are fully vested in their account balances in the Watson Wyatt Deferred Savings Plan. Participants are eligible for payment of their vested account balance upon termination of employment or retirement. |
(2) | The Towers Watson Deferred Savings Plan is an unfunded deferred compensation plan for select management and other highly-compensated associates who contribute significantly to the future success of the Company, including the Company’s executive officers. The purpose of the Towers Watson Deferred Savings Plan is to provide this group with a means to defer receipt of a portion of their compensation, and potentially to receive a discretionary matching |
28
contribution from the Company. All associate deferrals, and all Company matches, are credited in the form of Company stock units and will be paid in shares of Company stock under the Company’s 2009 Long Term Incentive Plan. As a result, the value of the notional account set forth in the “Aggregate Balance at June 30, 2015” column is aligned with the value of the Company’s underlying stock. Payments will be made from this plan on the first business day of the month following the date that is six months after the participant’s separation from service.
(3) | Represents interest earned during the fiscal year ended June 30, 2015 on the account balance in the Watson Wyatt Deferred Savings Plan. Interest under the Watson Wyatt Deferred Savings Plan is calculated using the prime rate of interest as reported by Towers Watson’s primary bank, determined as of the first day of the calendar year. |
(4) | Represents the increase in value during fiscal year 2015 of Company stock units credited to an associate’s account from associate deferrals and discretionary Company matching contributions. |
(5) | Other than past years’ accruals attributable to above-market interest and the amount shown as registrant contributions for the fiscal year ended June 30, 2015, no portion of the amounts shown has been reported in the Summary Compensation Table for the fiscal year ended June 30, 2015 or in prior fiscal years. Of the balances reported for the Watson Wyatt Deferred Savings Plan, $283,896 for Mr. Haley, $64,229 for Mr. Millay and $120,150 for Mr. Wickes is attributable to Watson Wyatt contributions reported in the Summary Compensation Table for prior fiscal years, and $14,761 for Mr. Haley, $232 for Mr. Millay and $5,365 for Mr. Wickes is attributable to above-market interest accruals reported in the Summary Compensation Table for prior fiscal years. |
The balances reported for the Towers Watson Deferred Savings Plan reflect the value of Company stock units credited to an associate’s account from associate deferrals and discretionary Company matching contributions as calculated based on the closing price of the Company’s stock on June 30, 2015 of $125.80 per share. Of the balances reported for the Towers Watson Non-Qualified Deferred Savings Plan for U.S. Employees, $9,220 for Mr. Haley, $1,600 for Mr. Millay, $1,900 for Mr. Foreman and $1,900 for Mr. Wickes is attributable to Towers Watson contributions reported in the Summary Compensation Table for prior fiscal years.
29
Potential Post-Termination Payments and Benefits
The account values payable to Messrs. Haley, Millay, Foreman, Wickes and Hess through the Nonqualified Deferred Compensation Plans are shown in the Nonqualified Deferred Compensation for the Fiscal Year Ended June 30, 2015 table and would not change based on early retirement, death, disability or a change in control of Towers Watson. The value of benefits payable to Messrs. Haley, Millay, Foreman, Wickes and Hess under the Towers Watson Pension Plan or the Towers Watson SERP outlined above may increase (or decrease) in the event of the early retirement, pre-retirement death or disability of the named executive. Benefits do not become payable under the Towers Watson Pension Plan or the Towers Watson SERP as a result of a change in control of Towers Watson. Using the assumptions employed in the Pension Benefits table on page 24 (the “PBT”) with the exception of using the actual Towers Watson SERP lump sum interest rates as of June 30, 2015, the present value of the pension and disability benefit (as applicable) payable to the named executives as of June 30, 2015 in the event of early retirement, death or disability is shown in the following table.
Total Present Value as of June 30, 2015 in case of: | ||||||||||||||||||||||||||
Name | Plan | Early Retirement(1) | Increase / (Decrease) from PBT | Pre-Retirement Death(2) | Increase / (Decrease) from PBT | Disability(3) | Increase / (Decrease) from PBT | |||||||||||||||||||
John J. | TW Pension Plan | $ | 2,281,838 | $ | — | $ | 1,982,068 | $ | (299,770 | ) | $ | 2,281,838 | $ | — | ||||||||||||
Haley | TW SERP | 19,000,574 | — | 19,000,574 | — | 19,000,574 | — | |||||||||||||||||||
Disability | — | — | — | — | — | — | ||||||||||||||||||||
Total | $ | 21,282,412 | $ | — | $ | 20,982,642 | $ | (299,770 | ) | $ | 21,282,412 | $ | — | |||||||||||||
Roger F. | TW Pension Plan | $ | 300,425 | $ | (21,878 | ) | $ | 292,576 | $ | (29,727 | ) | $ | 500,272 | $ | 177,969 | |||||||||||
Millay | TW SERP | 1,320,089 | 114,478 | 1,320,089 | 114,478 | 1,339,570 | 133,959 | |||||||||||||||||||
Disability | — | — | — | — | 2,166,335 | 2,166,335 | ||||||||||||||||||||
Total | $ | 1,620,514 | $ | 92,600 | $ | 1,612,665 | $ | 84,751 | $ | 4,006,177 | $ | 2,478,263 | ||||||||||||||
James K. | TW Pension Plan | $ | 932,003 | $ | 14,194 | $ | 622,087 | $ | (295,722 | ) | $ | 941,424 | $ | 23,615 | ||||||||||||
Foreman | TW SERP | 3,359,971 | 424,414 | 3,359,971 | 424,414 | 2,496,209 | (439,348 | ) | ||||||||||||||||||
Disability | — | — | — | — | 2,286,887 | 2,286,887 | ||||||||||||||||||||
Total | $ | 4,291,974 | $ | 438,608 | $ | 3,982,058 | $ | 128,692 | $ | 5,724,520 | $ | 1,871,154 | ||||||||||||||
Gene H. | TW Pension Plan | $ | 1,610,703 | $ | — | $ | 1,486,120 | $ | (124,583 | ) | $ | 1,555,824 | $ | (54,879 | ) | |||||||||||
Wickes | TW SERP | 5,220,251 | 261,171 | 5,220,251 | 261,171 | 4,022,663 | (936,417 | ) | ||||||||||||||||||
Disability | — | — | — | — | 683,184 | 683,184 | ||||||||||||||||||||
Total | $ | 6,830,954 | $ | 261,171 | $ | 6,706,371 | $ | 136,588 | $ | 6,261,671 | $ | (308,112 | ) | |||||||||||||
Carl A. | TW Pension Plan | $ | 962,134 | $ | (89,346 | ) | $ | 830,885 | $ | (220,595 | ) | $ | 1,155,232 | $ | 103,752 | |||||||||||
Hess | TW SERP | 1,787,530 | (291,977 | ) | 1,787,530 | (291,977 | ) | 2,042,587 | (36,920 | ) | ||||||||||||||||
Disability | — | — | — | — | 3,073,499 | 3,073,499 | ||||||||||||||||||||
Total | $ | 2,749,664 | $ | (381,323 | ) | $ | 2,618,415 | $ | (512,572 | ) | $ | 6,271,318 | $ | 3,140,331 | ||||||||||||
(1) | The increase for early retirement compared to the PBT is due primarily to reflecting the immediate early retirement benefit payable under the legacy Watson Wyatt and legacy Towers Perrin final average earnings formulas for those under the unreduced retirement age. The early retirement factors available to the named executives through the legacy provisions reflect a “subsidy” compared to the benefit at unreduced retirement age. Note that these factors are generally available to all plan participants eligible for final average earnings benefits, depending on age and service conditions. An additional cause for the increase is the use of the actual lump sum interest rate for the Towers Watson SERP benefit as of June 30, 2015 compared to the rate assumed in future years for financial accounting purposes. |
The Towers Watson Pension Plan benefit attributable to the stable value formula is assumed payable to the named executives as a lump sum at retirement. The Towers Watson Pension Plan benefit for Messrs. Haley, Millay, Wickes and Hess attributable to the legacy Watson Wyatt formula is payable as an annuity at retirement. The Towers Watson Pension Plan benefit for Mr. Foreman attributable to his cash balance and stable value benefits is assumed payable as a lump sum at retirement with the remaining legacy Towers Perrin formula benefit value distributed as an annuity. The Towers Watson SERP benefit attributable to the stable value formula and the legacy Watson Wyatt formula is payable
30
as a lump sum upon early retirement. The Towers Watson SERP benefit attributable to the legacy Towers Perrin formula is payable in four approximately equal annual installments beginning six months after early retirement. Messrs. Haley, Millay, Foreman, Wickes and Hess are currently eligible for early retirement under the terms of the Towers Watson Pension Plan and the Towers Watson SERP.
(2) | In case of death, the stable value benefits earned by the named executives are immediately payable to the surviving spouse or beneficiary in a lump sum. |
For Messrs. Haley, Millay, Wickes and Hess, the legacy Watson Wyatt qualified formula provides a death benefit to the named executive’s spouse assuming the named executive retired on the date of his death, elected the 100 percent joint and contingent benefit form and died the next day. The legacy Watson Wyatt nonqualified formula provides a death benefit to the participant’s spouse, or the designated beneficiary of an unmarried participant, payable in an immediate lump sum equal to the amount that would have been payable to the participant if the participant had retired on the date of the participant’s death. This benefit is provided if the participant is early retirement eligible at death and is available to all plan participants with a legacy Watson Wyatt formula benefit.
For Mr. Foreman, the legacy Towers Perrin qualified formula provides a death benefit equal to the greater of his cash balance account through December 31, 2007 and the value of the survivor portion of his final average earnings benefit, plus his cash balance account earned from January 1, 2008 through December 31, 2011. The legacy Towers Perrin nonqualified formula provides benefits payable upon his death as an active associate equal to the amount he would have received if terminating employment on the date of his death. The qualified death benefit is assumed to be paid as a lump sum to his spouse, immediately upon death, from the Towers Watson Pension Plan. The nonqualified death benefit is assumed to be paid in four approximately equal annual installments beginning six months after the date of death from the Towers Watson SERP.
Decreases in the Towers Watson Pension Plan benefit value as compared to the amounts shown in the Pension Benefits table are due to the payment of benefits related to the survivor portion of the final average earnings benefit only. Increases in the Towers Watson SERP benefit value as compared to the amounts shown in the Pension Benefits table are due primarily to the assumed earlier payment date of the benefit.
(3) | In case of disability, Towers Watson provides a disability benefit equal to 60 percent of base salary plus target bonus, subject to a maximum monthly benefit of $30,000. This benefit is payable until age 65 or for at least 12 months, assuming the participant continues to meet the definition of disability. The table shows the value of the temporary disability benefit that would be payable to age 65 along with the pension benefits payable at age 65. Participants also receive continued benefit accruals for pension purposes while on disability. The continued benefit accruals are provided as additional stable value accruals under the plans at the same base pay level prior to their disability. |
In addition, upon any termination of employment, Messrs. Haley, Millay, Foreman, Wickes and Hess may be entitled to benefits that are provided generally by the Company to salaried associates, including distributions under the Company’s 401(k) plan, health care benefits, disability benefits and accrued vacation pay. Mr. Haley, in addition to accruing annual vacation during the fiscal year ended June 30, 2015, has a frozen vacation balance from prior years which, if unused, will be paid out to him upon termination of employment at his then current rate of hourly base salary. At June 30, 2015, the liability for frozen vacation pay was $317,203 for Mr. Haley. In the context of any particular separation from Towers Watson, the company and the executive may mutually agree on severance terms that could include additional benefits or payments.
Messrs. Haley, Millay, Foreman, Wickes and Hess do not have employment agreements with Towers Watson. In addition, Towers Watson has not entered into any current change in control agreements with any of Messrs. Haley, Millay, Foreman, Wickes or Hess.
PVRSUs
Named executives generally will forfeit unvested PVRSUs upon a termination of employment prior to the end of the performance period. On September 22, 2011, the Committee approved an amendment to the form of PVRSU award agreement. The amendment to the PVRSU award agreement (including all currently outstanding award agreements) provides that in all jurisdictions in which a benefit can lawfully be conditioned on age and/or years of service, the awards will continue to vest following a “qualifying retirement”, subject to (i) the performance conditions with respect to the PVRSUs; (ii) compliance with certain non-competition obligations; and (iii) completion of the first fiscal year (July 1 to June 30) of service during the performance period at or before the date of retirement. For associates who participate in a company-sponsored pension plan, a “qualifying retirement” is defined as a retirement under the pension plan in which the associate participates unless the Committee determines that a basis exists for termination for cause (as defined in the Plan). For associates who do not
31
participate in a company-sponsored pension plan or who participate in a plan that does not include a definition of retirement, a “qualifying retirement” will be separately defined by the Committee based upon the recommendations of management.
Following a change in control of the Company, vesting will remain subject to the named executive’s continued employment through the end of the performance period; provided, however, that if a named executive’s service is terminated without cause upon or within 12 months following the change in control, the PVRSUs immediately will become vested. The number of PVRSUs that may vest following a change in control is generally determined based on the greater of (a) the 100 percent target level or (b) the amount determined based upon the Company’s actual financial performance through the most recent date prior to the change in control for which achievement of the financial performance goals can reasonably be determined. The pending Willis Merger will constitute a change in control for this purpose. However, as described above, at the effective time of the Willis Merger, the PVRSUs will be converted into strictly service-vesting awards with respect to Willis ordinary shares and the number of shares subject to such converted awards following the Willis Merger will be fixed at such time.
If a change in control had occurred and a named executive’s employment had been terminated on June 30, 2015, the value of PVRSUs that he or she would have received (based on the Company’s closing stock price on June 30, 2015 of $125.80 and including accrued dividend equivalents) would have been $10,529,586 for Mr. Haley, $3,293,067 for Mr. Millay, $3,373,704 for Mr. Foreman, $3,373,704 for Mr. Wickes and $2,315,223 for Mr. Hess. If a named executive had retired from the Company on June 30, 2015 in a “qualifying retirement,” the value of PVRSUs as of June 30, 2015 that he or she would receive in the future would be $4,111,270 for Mr. Haley, $1,314,987 for Mr. Foreman, $1,314,987 for Mr. Wickes and $489,865 for Mr. Hess, assuming projected earn-out of 144 percent (excluding dividend equivalents) following completion of the three-year performance period ending June 30, 2016, and $6,349,126 for Mr. Haley, $2,036,450 for Mr. Foreman, $2,036,450 for Mr. Wickes and $1,812,149 for Mr. Hess, assuming projected earn-out of 204 percent (excluding dividend equivalents) following completion of the three-year performance period ending June 30, 2017. Mr. Millay does not have sufficient age and service for a “qualifying retirement.”
Towers Watson Severance Pay Plan
Effective July 1, 2011, Towers Watson adopted a severance pay plan for U.S.-based associates, which would include any named executives who are not otherwise subject to individually negotiated severance agreements. As of June 30, 2015, none of the named executives were subject to individually negotiated severance agreements. The plan provides for severance pay for eligible associates whose employment has been terminated involuntarily for reasons other than performance. For eligible senior level associates, including the eligible named executives, the plan provides for severance pay in an amount equal to three weeks’ base pay for each completed year of the associate’s service, plus twelve weeks, up to a maximum of 44 weeks’ pay payable in a lump sum upon such involuntary termination. As of June 30, 2015, amounts payable to the eligible named executives upon a qualifying severance would have been $854,615 for Mr. Haley, $357,692 for Mr. Millay, $439,615 for Mr. Foreman, $537,308 for Mr. Wickes and $478,077 for Mr. Hess. In the context of any particular separation from Towers Watson, the Company and an executive may mutually agree on severance terms that could include additional benefits or payments.
Compensation of Directors
Our Board of Directors relies on the Committee, which is composed of independent directors, to recommend the form and amount of compensation to be paid to our non-employee directors.
During the fiscal year ended June 30, 2015, we provided the following compensation to our non-employee directors pursuant to the Towers Watson & Co. Compensation Plan for Non-Employee Directors:
32
Directors’ Compensation for the Fiscal Year Ended June 30, 2015
Name | Fees Earned or Paid in Cash | Stock Awards(1) | Total | ||||||||||
Victor F. Ganzi | $ | 104,079 | $ | 120,000 | $ | 224,079 | |||||||
Leslie S. Heisz | $ | 88,817 | $ | 120,000 | $ | 208,817 | |||||||
Brendan O’Neill | $ | 93,587 | $ | 120,000 | $ | 213,587 | |||||||
Linda D. Rabbitt | $ | 109,079 | $ | 120,000 | $ | 229,079 | |||||||
Gilbert T. Ray | $ | 103,587 | $ | 120,000 | $ | 223,587 | |||||||
Paul Thomas | $ | 89,079 | $ | 120,000 | $ | 209,079 | |||||||
Wilhelm Zeller | $ | 93,933 | $ | 120,000 | $ | 213,933 | |||||||
(1) | Represents the aggregate grant date fair value under applicable accounting standards of restricted stock units (“RSUs”) awarded under the Towers Watson & Co. 2009 Long Term Incentive Plan, based on the grant date value of our common shares. As of June 30, 2015, each non-employee director, held 287.83 unvested Towers Watson RSUs. |
Effective November 16, 2012, the schedule of fees payable to non-employee directors pursuant to the Towers Watson & Co. Compensation Plan for Non-Employee Directors (“Director Compensation Plan”) is as follows:
1. | Annual Cash Retainer: $60,000 per year, paid quarterly. On August 22, 2014, the Board of Directors amended the Director Compensation Plan to increase the Annual Cash Retainer to $70,000 per year, paid quarterly. The first quarterly payment following the amendment was pro-rated to reflect the higher amount based on the August 22, 2014 amendment date. The remaining quarterly payments in fiscal year 2015 fully reflected the increased amount. |
2. | Annual Restricted Stock Unit (RSU) Grant: Annual RSUs, equivalent to $120,000, granted at the beginning of each fiscal year (with the number of shares underlying the RSUs based on the closing price per share of the Company’s Class A Common Stock on the last business day of the just completed fiscal year) for services to be provided during the current fiscal year. Annual RSUs vest in equal quarterly installments over a 12-month period beginning on the date of grant, and unless deferred under the terms of the Voluntary Deferred Compensation Plan for Non-Employee Directors, shall be paid upon vesting. Each RSU represents a notional unit interest equal in value to a share of the Company’s Class A Common Stock. All RSUs payable to non-employee directors under the plan are issued pursuant to the terms of the Towers Watson & Co. 2009 Long Term Incentive Plan. |
The August 22, 2014 amendment of the Director Compensation Plan increased the amount of the Annual RSU Grant to $130,000, first effective with the annual grant made at the beginning of fiscal year 2016.
3. | Committee Member Fees: |
a. | Audit Committee: $15,000 annual retainer, paid quarterly |
b. | Compensation Committee: $10,000 annual retainer, paid quarterly |
c. | Nominating and Governance Committee: $5,000 annual retainer, paid quarterly |
d. | Risk Committee: $5,000 annual retainer, paid quarterly |
4. | Committee Chair Fees (paid in lieu of Committee Member Fees): |
a. | Audit Committee Chair: $30,000 annual retainer, paid quarterly |
b. | Compensation Committee Chair: $20,000 annual retainer, paid quarterly |
c. | Nominating and Governance Committee Chair: $15,000 annual retainer, paid quarterly |
d. | Risk Committee Chair: $15,000 annual retainer, paid quarterly |
e. | Lead Director Annual Retainer (paid in addition to regular Board and Committee Fees): $25,000 per year, paid quarterly |
33
Additional Terms Applicable to Director Compensation. Vesting of RSUs is conditioned upon continued service as a director of the Company, provided that vesting shall be accelerated upon the director’s death or disability or upon a Change in Control. RSUs will be paid out in shares of Class A Common Stock on the date of vesting to an account established for each non-employee director at a brokerage firm designated by the Company. Notwithstanding the foregoing, a non-employee director can elect to defer all or any portion of his/her director compensation pursuant to the terms of the Towers Watson & Co. Voluntary Deferred Compensation Plan for Non-Employee Directors and in accordance with deferral procedures established by the Company, in which case cash fees and/or shares of Class A Common Stock issuable under RSUs (and under any associated Dividend Equivalent Rights) that are deferred will be paid out at the time and in the manner provided for pursuant to such deferral. As of June 30, 2015, Mr. Ganzi had deferred $53,112 of fees payable in cash plus accumulated interest and 1,906.41 vested shares and reinvested dividends, Ms. Heisz had deferred 3,362.41 vested shares and reinvested dividends, Mr. O’Neill had deferred 8,957.63 vested shares and reinvested dividends, Ms. Rabbitt had deferred 2,704.24 vested shares and reinvested dividends, Mr. Ray had deferred 8,957.62 vested shares and reinvested dividends, Mr. Thomas had deferred $118,338 of fees payable in cash plus accumulated interest and 1,871.27 vested shares and reinvested dividends, and Mr. Zeller had deferred $229,738 of fees payable in cash plus accumulated interest and deferred 4,334.71 vested shares and reinvested dividends.
Director Stock Ownership Policy. Non-employee directors are expected to accumulate shares of Towers Watson Class A Common Stock at least equal to five times the annual cash retainer (i.e., $350,000 for fiscal year 2015), valued as of the last day of the Company’s fiscal year. Each non-employee director has five years from the date of appointment to achieve compliance with such ownership guidelines. Until the ownership level is reached, non-employee directors are expected to sell only shares of Class A Common Stock needed to pay state and federal taxes associated with the equity granted. If as a result of a stock price decline subsequent to a non-employee director meeting the ownership requirements the non-employee director does not satisfy the requirements as of the Company’s fiscal year-end, he/she need not “buy up” to a new number of shares to satisfy the ownership policy. However, he/she is expected to retain the number of shares that originally were acquired to reach the share ownership threshold. Each of our non-employee directors had satisfied his or her guideline as of June 30, 2015.
Compensation Committee Interlocks and Insider Participation
None of our executive officers serves as a member of the Board of Directors or compensation committee of any entity that has one or more of its executive officers serving as a member of the Compensation Committee. In addition, none of our executive officers serves as a member of the compensation committee of any entity that has one or more of its executive officers serving as a member of our Board of Directors.
Item 12. Security Ownership of Certain Beneficial Owners and Management and Related Stockholder Matters
Information with respect to the security ownership of certain beneficial owners and management is incorporated by reference to the Form S-4 Registration Statement filed by Willis Group Holdings Public Limited Company on August 27, 2015.
Securities Authorized for Issuance Under Equity Compensation Plans
In connection with the Towers Perrin | Watson Wyatt Merger, Towers Watson assumed the amended and restated Watson Wyatt 2001 Employee Stock Purchase Plan, the Watson Wyatt 2000 Long-Term Incentive Plan and the Watson Wyatt & Company Holdings Incentive Compensation Plan, and created the Towers Watson & Co. 2009 Long Term Incentive Plan. Towers Watson did not assume the Watson Wyatt 2001 Deferred Stock Unit Plan for Selected Employees or the Watson Wyatt Amended Compensation Plan for Outside Directors.
Towers Watson & Co. Employee Stock Purchase Plan
Towers Watson assumed the amended and restated Watson Wyatt 2001 Employee Stock Purchase Plan (the “Stock Purchase Plan”) which enabled employees to purchase shares of Towers Watson stock at a 5 percent discount. The Stock Purchase Plan is a non-compensatory plan under generally accepted accounting principles of stock-based compensation. As a result, no compensation expense is recognized in conjunction with this plan. Watson Wyatt originally registered 750,000 shares of its Class A common stock on December 19, 2001 and an additional 1,500,000 shares of its Class A common stock on December 16, 2003, of which 196,424 shares remained available for issuance immediately prior to the Towers Perrin | Watson Wyatt Merger at which time 4,500,000 additional shares were added. Towers Watson filed a Form S-8 Registration Statement in the third quarter of fiscal 2010 registering the 4,696,424 shares available for issuance under the Stock Purchase Plan. Towers Watson suspended contributions to the Stock Purchase Plan in 2012. See Note 15 of the Notes to the Consolidated Financial Statements in the Annual Report on Form 10-K filed on August 14, 2015 for additional information on the Company’s plans.
34
Extend Health, Inc. 2007 Equity Incentive Plan
In connection with the acquisition of Extend Health in May 2012, Towers Watson filed a Form S-8 Registration Statement and assumed the Extend Health, Inc. 2007 Equity Incentive Plan. The outstanding assumed unvested stock options were converted into options to acquire shares of Towers Watson Class A common stock using a conversion ratio stated in the merger agreement for the exercise price and number of options. The Extend Health options are exercisable for 377,614 shares of Towers Watson Class A common stock. The Form S-8 Registration Statement also covers 55,514 shares of Towers Watson Class A common stock available for issuance under the plan.
Liazon Corporation 2008 Stock Option Plan and 2011 Equity Incentive Plan
In connection with the acquisition of Liazon Corporation in November 2013, Towers Watson filed a Form S-8 Registration Statement and assumed the Liazon Corporation 2008 Stock Option Plan and the Liazon Corporation 2011 Equity Incentive Plan, as amended. The assumed options are exercisable for 37,162 shares of Towers Watson Class A common stock. Upon vesting, the assumed restricted stock units will convert into 70,533 shares of Towers Watson Class A common stock. The registration also covers 18,531 shares of Towers Watson Class A common stock available for issuance under the plans.
The following chart gives aggregate information regarding grants under all of the Company’s equity compensation plans through June 30, 2015:
Plan Category | Number of shares to be issued upon exercise of outstanding options, warrants and rights | Weighted-average exercise price of outstanding options, warrants and rights | Number of shares remaining available for future issuance under equity compensation plans (excluding shares reflected in the first column) | ||||||||
Equity compensation plans approved by stockholders | 361,057 | $ | 45.24 | (1) | 13,930,229 | (2) | |||||
Equity compensation plans not approved by stockholders | 82,441 | (3) | $ | 10.20 | 74,045 | (4) | |||||
Total | 443,498 | $ | 20.76 | 14,004,274 | |||||||
(1) The weighted-average exercise price does not take into account the shares issuable upon vesting of outstanding restricted stock awards, which have no exercise price.
(2) Includes 4,464,490 shares available for issuance under the Stock Purchase Plan and 9,465,739 shares available for issuance under the Towers Watson & Co 2009 Long-Term Incentive Plan.
(3) Represents 82,441 of the 485,309 options and RSUs originally assumed in the Extend Health and Liazon acquisitions and the 74,045 shares available for issuance under those plans.
(4) Represents 55,514 shares available for issuance under Extend Health Plan and 18,531 shares available for issuance under Liazon Plan.
Item 13. Certain Relationships and Related Transactions, and Director Independence
Review, Approval or Ratification of Transactions with Related Persons
Our Related Person Transactions Policy (the “Policy”) is designed to avoid entering into transactions with Directors, executive officers, immediate family members and certain other persons with specified relationships to the Company (a “Related Person”) except where clearly in the interest of the Company and appropriately reviewed and approved. This Policy is set forth in writing and administered by the Audit Committee and applies to any transaction or relationship or series of similar transactions, arrangements or relationships with a Related Person (a “Related Person Transaction”). Under the Policy, Related Persons must inform the Chief Financial Officer of any proposed Related Person Transaction, and the Chief Financial Officer must seek approval of the Audit Committee for any proposed transaction with a Related Person of which he is informed or becomes aware.
The Audit Committee will review the material facts of any Related Person Transaction and approve such transaction prior to committing the Company to such transaction. If advance approval is inadvertently not obtained, then the Audit Committee must ratify the Related Person Transaction or take other appropriate action. In making its determination, the Audit Committee will consider all relevant factors, including (i) the extent of the Related Person’s interest in the Related Person Transaction, (ii) if applicable, the availability of other sources of comparable products or services, (iii) whether the terms of the Related Person
35
Transaction are no less favorable than terms generally available in unaffiliated transactions under like circumstances, (iv) benefit to the Company, and (v) the aggregate value of the Related Person Transaction.
Related Person Transactions
Since the beginning of fiscal year 2015, there were no transactions with any Related Person requiring disclosure.
Director Independence
The Board is composed of a majority of Directors who qualify as independent Directors pursuant to the corporate governance standards for companies listed on the NASDAQ. The Board committee structure includes an Audit Committee, Compensation Committee, Nominating and Governance Committee and a Risk Committee, all of these committees consisting entirely of independent Directors.
In determining independence, each year the Board affirmatively determines whether Directors have any material relationship with the Company. When assessing the materiality of a Director’s relationship with the Company, the Board considers all relevant facts and circumstances, not merely from the Director’s standpoint, but from that of the persons or organizations with which the Director has an affiliation, and the frequency or regularity of the services, if any, provided to or by such persons or organizations, whether the services are being carried out at arm’s length in the ordinary course of business and whether the services are being provided substantially on the same terms to the Company as those prevailing at the time from unrelated parties for comparable transactions. Material relationships can include commercial, banking, industrial, consulting, legal, accounting, charitable and familial relationships. A Director will not be considered independent if the Director:
1. | has an Immediate Family Member who is now, or has been in the past three years, an Executive Officer of the Company or any of its subsidiaries or other Affiliates; |
2. | now, or in the past three years, has been employed by the Company or any of its subsidiaries or other Affiliates; |
3. | has received, or has an Immediate Family Member who has received, more than $120,000 during any twelve-month period within the last three fiscal years in direct compensation from the Company, other than (i) director and committee fees or (ii) pension or other forms of deferred compensation for prior service (provided such compensation is not contingent in any way on continued service); |
4. | has accepted, or has an Immediate Family Member who has accepted, more than $120,000 in compensation from the Company or any subsidiary of the Company during any period of 12 consecutive months within the Company’s current fiscal year or any of the previous three fiscal years, other than (i) compensation paid to an Immediate Family Member who is or was an employee (other than an executive officer) of the Company or any of its subsidiaries; or (ii) benefits under a tax-qualified retirement plan, or non-discretionary compensation; |
5. | is, or has an Immediate Family Member who is, currently a partner of a firm that is the Company’s internal or external auditor; |
6. | is a current employee of the Company’s internal or external auditor; |
7. | has an Immediate Family Member who is a current employee of the Company’s internal or external auditor and who participates in the firm’s audit, assurance or tax compliance (but not tax planning) practice; |
8. | has, or had an Immediate Family Member who has, served within the last three years as a partner or employee of the Company’s internal or external auditor and personally worked on the Company’s audit within that time; |
9. | is employed, or has an Immediate Family Member currently employed, or is or had an Immediate Family Member employed during the previous three years, as an Executive Officer of another company where any of the Company’s present Executive Officers serve or served at the same time on that company’s compensation committee; |
10. | is currently an employee, or has an Immediate Family Member who is currently an Executive Officer, of a company (including any business entity or any nonprofit organization) that has made payments to, or received payments from, the Company for property or services in an amount which, in any of the last three fiscal years, exceeds the greater of $1 million, or 2% of such other company’s consolidated gross revenues; |
11. | is, or has an Immediate Family Member who is, currently a partner in, controlling shareholder or owner of, or executive officer of any organization (including any business entity or any nonprofit organization) to which the Company made, or from which the Company received, payments for property or services, in the current fiscal |
36
year or any of the past three fiscal years, that exceed 5% of the recipient’s consolidated gross revenues for that year, or $200,000, whichever is more.
For these purposes, an “Immediate Family Member” includes a Director’s spouse, parents, stepparents, children, siblings, mother and father-in-law, sons and daughters-in-law, brothers and sisters-in-law, and anyone (other than a tenant or employee) who shares the Director’s home.
Applying these standards, and because there were no transactions, relationships or arrangements that triggered any of these questions, the Board has determined that the following Directors are independent: Victor F. Ganzi, Leslie S. Heisz, Brendan R. O’Neill, Linda D. Rabbitt, Gilbert T. Ray, Paul Thomas and Wilhelm Zeller. In making these determinations, the Board determined that none of the independent Directors, their family members or organizations with which the Directors are affiliated have any material direct or indirect relationship with the Company.
Item 14. Principal Accounting Fees and Services
Fees Paid to the Independent Registered Public Accounting Firm
The Audit Committee has responsibility for the appointment, compensation and oversight of the work of the independent registered auditor. Deloitte is the Company’s independent registered public accounting firm and audited the Company’s financial statements for fiscal year 2015.
As part of its oversight responsibility, the Audit Committee must pre-approve all permissible services to be performed by the independent registered public accounting firm. The Audit Committee has established policies and procedures for the pre-approval of audit and non-audit services to be performed by the independent registered public accounting firm.
Under the policy, the Committee must give prior approval for any amount or specific type of service within four categories: (i) audit, (ii) audit-related, (iii) tax services, and (iv) to the extent permitted by law, other services that the independent registered public accounting firm provides. Prior to the annual engagement, the Audit Committee may grant pre-approval for specific independent registered public accounting firm services within these four categories at maximum pre-approved fee levels. If circumstances arise that would require the Company to engage the independent registered public accounting firm for additional services not contemplated in the original pre-approval, then the engagement for such services would require separate pre-approval by the Audit Committee. The Chair of the Audit Committee is authorized to approve a request for pre-approval provided the additional service is presented to the Audit Committee for approval at its next scheduled meeting.
The following table presents fees for professional audit services rendered by Deloitte for the audit of the Company’s annual financial statements for the fiscal years ended June 30, 2014 and 2015.
Fee Category | 2014 Deloitte & Touche LLP | 2015 Deloitte & Touche LLP | ||||||
Audit Fees (1) | $ | 6,042,498 | $ | 5,695,399 | ||||
Audit-Related Fees (2) | 1,077,685 | 1,238,336 | ||||||
Tax Fees (3) | 67,512 | 45,299 | ||||||
Subtotal | 7,187,695 | 6,979,034 | ||||||
All Other Fees (4) | 5,000 | 5,000 | ||||||
Total Fees | $ | 7,192,695 | $ | 6,984,034 | ||||
(1) | Audit Fees - consists of fees billed for professional services performed by Deloitte for the audit of the Company’s annual financial statements, review and audit of internal controls to ascertain compliance with the Sarbanes-Oxley Act, review of financial statements included in the Company’s quarterly and annual filings, and services that are normally provided in connection with statutory and regulatory filings or engagements. |
(2) | Audit-Related Fees - includes fees for benefit plan audits, assurance and related services performed by Deloitte that are reasonably related to the performance of the audit or review of the Company’s financial statements and are not reported under “Audit Fees.” |
(3) | Tax Fees - includes fees for professional services performed by Deloitte for tax compliance, tax advice, and tax planning. |
(4) | All Other Fees - consists of fees for all products or services provided by Deloitte that do not fall into any of the other three categories above. Fees of $5,000 for each of the fiscal years ended 2015 and 2014, respectively, represent fees for the Company’s subscriptions to certain of Deloitte’s database products. |
37
Part IV
Item 15. Exhibits
The exhibits listed in the accompanying exhibit index are filed as part of this Form 10-K/A.
EXHIBITS.
In reviewing the agreements included or incorporated by reference as exhibits to this Annual Report on Form 10-K/A, it is important to note that they are included to provide investors with information regarding their terms, and are not intended to provide any other factual or disclosure information about Towers Watson or the other parties to the agreements. The agreements contain representations and warranties made by each of the parties to the applicable agreement. These representations and warranties have been made solely for the benefit of the other parties to the applicable agreement, and: should not be treated as categorical statements of fact, but rather as a way of allocating risk between the parties; have in some cases been qualified by disclosures that were made to the other party in connection with the negotiation of the applicable agreement, which disclosures are not necessarily reflected in the agreement; may apply standards of materiality in a way that is different from what may be material to investors; and were made only as of the date of the applicable agreement or such other date or dates as may be specified in the agreement and are subject to more recent developments.
Accordingly, these representations and warranties may not describe the actual state of affairs as of the date they were made or at any other time. Additional information about Towers Watson may be found elsewhere in this Annual Report on Form 10-K/A and our other public filings, which are available without charge through the SEC’s website at http://www.sec.gov.
EXHIBIT INDEX
_______________________
Exhibit | |
Number | Description of Exhibit |
31.3 | Certification of the Registrant’s Chief Executive Officer, John J. Haley, pursuant to Rule 13a-14 of the Securities Exchange Act of 1934. * |
31.4 | Certification of the Registrant’s Chief Financial Officer, Roger F. Millay, pursuant to Rule 13a-14 of the Securities Exchange Act of 1934. * |
32.2 | Certification of the Registrant’s Chief Executive Officer, John J. Haley, and Chief Financial Officer, Roger F. Millay, pursuant to 18 U.S.C. Section 1350, as adopted pursuant to Section 906 of the Sarbanes-Oxley Act of 2002. * |
* Filed herewith.
38
SIGNATURES
Pursuant to the requirements of Section 13 or 15(d) of the Securities Exchange Act of 1934, the registrant has duly caused this report to be signed on its behalf by the undersigned, thereunto duly authorized.
TOWERS WATSON & CO. (Registrant) | ||
Date: October 2, 2015 | By: | /s/ Michael M. Thomson |
Michael M. Thomson | ||
Controller and Principal Accounting Officer | ||
39