Attached files
| file | filename |
|---|---|
| EX-32.2 - EXHIBIT 32.2 - QUANTUMSPHERE, INC. | s101863_ex32-2.htm |
| EX-32.1 - EXHIBIT 32.1 - QUANTUMSPHERE, INC. | s101863_ex32-1.htm |
| EX-31.2 - EXHIBIT 31.2 - QUANTUMSPHERE, INC. | s101863_ex31-2.htm |
| EX-31.1 - EXHIBIT 31.1 - QUANTUMSPHERE, INC. | s101863_ex31-1.htm |
UNITED
STATES
SECURITIES AND EXCHANGE COMMISSION
WASHINGTON, D.C. 20549
FORM 10-K
| þ | ANNUAL REPORT PURSUANT TO SECTION 13 OR 15(d) OF THE SECURITIES EXCHANGE ACT OF 1934 | |
| For the fiscal year ended June 30, 2015 | ||
| ☐ | TRANSITION REPORT PURSUANT TO SECTION 13 OR 15(d) OF THE SECURITIES EXCHANGE ACT OF 1934 |
QUANTUMSPHERE,
INC.
(Exact name of registrant as specified in its charter)
000-53913
(Commission File Number)
| Nevada | 20-3925307 | |
| (State or other jurisdiction of | (I.R.S. Employer Identification No.) | |
| Incorporation or organization) |
2905
Tech Center Drive, Santa Ana, CA 92705
(Address of principal executive offices, with zip code)
714-545-6266
(Registrant’s telephone number, including area code)
Securities Registered pursuant to Section 12(b) of the Act: None.
Securities Registered pursuant to Section 12(g) of the Exchange Act: Common Stock, $.001 par Value
Indicate by check mark if the registrant is a well-known seasoned issuer, as defined in Rule 405 of the Securities Act. YES ☐ NO þ
Indicate by check mark if the registrant is not required to file reports pursuant to Section 13 or Section 15(d) of the Act. YES ☐ NO þ
Indicate by check mark whether the registrant (1) has filed all reports required to be filed by Section 13 or 15(d) of the Securities Exchange Act of 1934 during the preceding 12 months (or for such shorter period that the registrant was required to file such reports), and (2) has been subject to such filing requirements for the past 90 days. YES þ NO ☐
Indicate by check mark whether the registrant has submitted electronically and posted on its corporate Web site, if any, every Interactive Data File required to be submitted and posted pursuant to Rule 405 of Regulation S-T during the preceding 12 months (or for such shorter period that the registrant was required to submit and post such files). YES þ NO ☐
Indicate by check mark if disclosure of delinquent filers pursuant to Item 405 of Regulation S-K is not contained herein, and will not be contained, to the best of registrant’s knowledge, in definitive proxy or information statements incorporated by reference in Part III of this Form 10-K or any amendment to this Form 10-K. þ
Indicate by check mark whether registrant is a large accelerated filer, an accelerated filer, a non-accelerated filer, or a smaller reporting company. See the definitions of “large accelerated filer,” “accelerated filer” and “smaller reporting company” in Rule 12b-2 of the Exchange Act.
| Large accelerated filer ☐ | Accelerated filer ☐ | Non-accelerated filer ☐ | Smaller reporting company þ |
Indicate by check mark whether the registrant is a shell company (as defined in Rule 12b-2 of the Act). YES ☐ NO þ
The aggregate market value of the registrants common stock as of December 28, 2014, the last business day of the registrant’s most recently completed second fiscal quarter, held by non-affiliates of the registrant was approximately $36,346,376 (based on the last subscription price for our common stock of $2.00).
As of September 28, 2015, 22,511,884 shares of the registrant’s common stock were outstanding.
| -1- |
TABLE OF CONTENTS
| -2- |
Overview
QuantumSphere, Inc., formerly known as Way Cool Imports, Inc., was incorporated in the State of Nevada on December 1, 2005 (referred to as the “Registrant”). On April 22, 2014, we entered into an Agreement and Plan of Merger with QuantumSphere, Inc., a California corporation (“QSI”), whereby, among other things, QSI would merge with a wholly-owned subsidiary of the Registrant. On April 22, 2014, the parties consummated the merger and QSI became a wholly-owned subsidiary of the Registrant. Subsequently, on April 25, 2014, we filed Articles of Merger with the Nevada Secretary of State for the purposes of effecting a short-form merger of QSI with and into the Registrant. As part of the short-form merger, we amended our Articles of Incorporation to changes our name from “Way Cool Imports, Inc.” to “QuantumSphere, Inc.” The Articles of Merger were effective upon filing. In June 2014, the Company elected to change its year end from December 31 to June 30. As used in this Annual Report on Form 10-K, the references to “we” or “our” reflect the Registrant and its operations post-merger, i.e., inclusive of QSI and its operations.
We develop and manufacture proprietary high-performance catalysts, integrated components, and end-use products across a range of carefully selected chemicals markets, typically in conjunction with the sector’s larger participants. Our proprietary high-performance products can be utilized in thermo-chemical (chemical production) applications and have demonstrated the ability to reduce costs and increase efficiency in the generation, storage, and use of energy.
Platform Technology & Catalyst Market
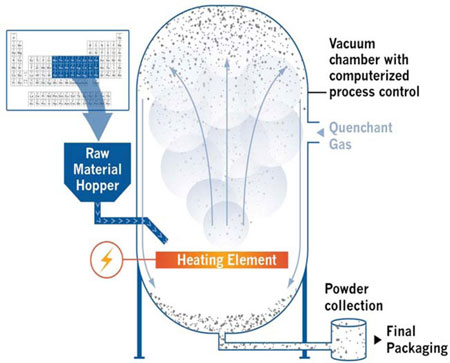
Our high value, end use applications in the chemicals sectors emanate from our award winning, patented, nanocatalyst manufacturing platform technology. Our platform technology allows us to manufacture, in an automated manner, highly uniform, 99.99% pure, narrowly distributed, nano-particles with high catalytic activity. We view ourselves as a products company, rather than an advanced materials company, with the products we distribute being made possible through our break-through platform technology.
We spent the first several years following our inception, designing, fabricating, testing, refining, improving, automating, and scaling our closed-loop, proprietary nanocatalyst manufacturing platform technology. In terms of the production of advanced nanocatalyst materials, we have progressed from a few grams per day to capacity of 300 kilograms per month in our existing manufacturing facility. This is essential as scale is required with each of the end use applications we are pursuing today and anticipate pursuing in the future.
Importantly, in 2007, we secured two broad patents on the QSI manufacturing technology process itself and, in 2010, we achieved ISO 9001:2008 certification for quality management systems related to our nanocatalyst manufacturing platform technology. With respect to our intellectual property relating to the platform technology, we have not disclosed our proprietary algorithms and software that are used in the manufacturing process. We treat the foregoing as our “Coca-Cola” trade secret that will remain proprietary. Other key features of our platform technology include the ability to rapidly scale the manufacturing process in a highly automated, modular fashion at low capital cost.
| -3- |
The following image depicts our nanocatalyst manufacturing platform technology and a portion of the periodic table of elements we convert and integrate into various commercial products.
By way of background, the catalyst market is a multi-billion dollar global industry. According to an industry study prepared by The Freedonia Group, the global catalyst markets exceeded $14 billion in 2013 with worldwide demand for catalysts to increase to $19.5 billion in 2016.1 Of this amount, nanocatalysts are expected to play a critical role in reducing costs and increasing efficiency in the generation, storage, and usage of energy with an estimated market of $6.6 billion by 2018.2
A nanometer (nm) is one billionth of a meter, or 1,000 times smaller than the diameter of a human hair, or roughly the size of a marble when compared to the earth. QSI catalysts typically measure 20-50 nm in size with a very narrow particle size distribution, and have surface area of up to 100 meters square per gram, roughly covering the size of a soccer field with just a small amount of material. A catalyst is a material that helps facilitate chemical reactions and can make chemical reactions happen more efficiently. The greater the surface area of the catalyst, the more efficient the chemical reaction, resulting in lower cost, higher performance end-use applications (e.g., chemical synthesis).
1 World Catalysts: Industry Study with Forecasts for 2016 & 2021, February 2013 (The Freedonia Group).
2 “Need to Curb Automobile & Industrial Emissions Drives the Global Nanocatalysts Market, According to New Report by Global Industry Analysts, Inc.”, PRWEB, November 23, 2013
(http://www.benzinga.com/pressreleases/13/11/p4106559/need-to-curb-automobile-industrial-emissions-drives-the-global-nanocata).
| -4- |
Our advanced catalysts have superior properties including their spherical shape, controlled oxide layer, narrow particle size distribution, high purity, low agglomeration, and large surface area. We believe these combined physical characteristics translate into greater efficiency in the generation, storage, and use of energy. Leveraging our patented, automated, highly scalable, and environmentally safe nanocatalyst manufacturing process, we manufacture a number of high-quality metals, bi-metallic alloys, and catalysts at the nano-scale including iron, silver, copper, nickel, manganese, and cobalt. We also offer custom dispersions and several specialty metals and catalysts including gold, palladium, aluminum, and tin.
Presently, we have sixteen dedicated gas phase condensation reactors which we utilize in the manufacture of nanocatalysts. With sixteen reactors, our capacity is approximately 300 kilograms per month (the foregoing is based on nano-iron production utilizing three production shifts, and the overall monthly kilogram production will depend on the catalysts being produced given varying production rates among catalysts we manufacture). Given the manner in which we have designed our production reactors, we are able to quickly scale and adjust production runs to satisfy our customers’ advanced material needs and delivery timelines. In addition, we leverage our technical knowledge and process chemistry expertise to offer custom dispersions, alloys and integrated catalytic solutions for the energy storage and chemical sectors. For example, we have a customer based in Israel that uses a highly active catalyst blend of nano-silver and nano-palladium to increase performance and lower cost in a platinum-free alkaline fuel cell, used for back-up power applications.
Chemicals Opportunity
QSI catalysts have the potential to benefit multiple, multi-billion dollar process applications in the refining, petrochemical, chemical, and pharmaceutical industries. Currently, the lead application and commercialization focus is in the global ammonia synthesis market. Ammonia production is a highly critical and energy-intensive process that occurs by combining hydrogen and nitrogen under high pressure and temperature in the presence of an iron catalyst. Though many incremental improvements have been achieved in both process and catalyst technology over the last 100 years, the industry is ripe for a paradigm shift in ammonia synthesis efficiency. Other applications of our nano catalysts in the chemicals industry, outside of the ammonia sector, are being pursued and are presently in the lab validation phase.
The Critical Role of Catalysts within the Chemicals Industry
A multi-billion dollar global industry, catalysts are essential to the world’s industrial production. As much as 90% of all chemical processes utilize catalysts (e.g., petroleum refining, pollution abatement, and production of fuels and chemicals) and 60% of all consumer and industrial products (e.g., fertilizers, plastics, pharmaceuticals, and batteries) are made using catalysts.3 Catalysts are now seen as a preferred way to improve process efficiency, lower costs, increase output, use less energy, and meet both performance and environmental standards. This is placing a strong emphasis on the development of new catalysts with higher activity, increased longevity, and reduced environmental and/or health impact. Our high surface area catalysts have demonstrated the ability to deliver much higher activity in multiple lab validations and, thus, greater efficiencies than existing commercial iron catalysts.
3 “Wide Participation in the 21st Annual Saudi-Japan Symposium “Catalysts in Petroleum Refining & Petrochemicals” at KFUPM”, King Fahd University of Petroleum & Minerals Press Release dated November 29, 2011 (http://web.kfupm.edu.sa/SitePages/en/UniversityNewsDetails.aspx?CUSTOMID=147).
| -5- |
Ammonia Market Overview
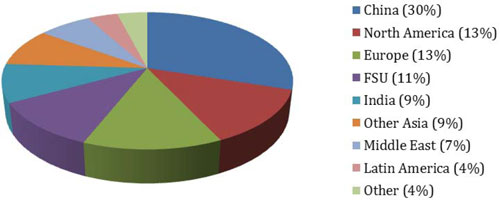
Globally, the amount of ammonia produced annually consumes more than 1% of the world’s energy supply.4 Nearly 80% of the global ammonia output is used as agricultural fertilizer for both food and non-food crops including biofuel feedstock.5 In addition, ammonia plants produce nearly 1% of the world’s total carbon dioxide emissions.6 Annual world production is heavily concentrated in China, accounting for more than 33% of ammonia produced today.7
Ammonia Market Status
On May 27, 2015, the Company entered into a multi-year Joint Development Agreement with Swiss-based Casale, S.A. (Casale), a global leader in production technologies for ammonia, urea, melamine, methanol, syngas, nitrates and phosphates. Casale’s reactor production technologies are utilized in approximately 38 percent of global ammonia production and 39 percent of global methanol production. Casale and QSI have agreed to collaborate on commercial technologies for ammonia, methanol, and other industrial chemicals, which collectively account for several hundred billion USD of production annually. Casale also agreed to utilize QSI as its exclusive provider of nanocatalysts for its chemical synthesis processes during the term of the agreement due to QSI’s demonstrated increase in catalytic activity and patented high-volume manufacturing process. The first objective of the Joint Development Agreement is to validate and optimize QSI-Nano catalysts with Casale production reactor technologies. Following a successful validation phase, the second objective is to enter into a long-term agreement with Casale for the joint global distribution and sale of QSI-Nano catalysts with Casale reactor technologies to chemical plant owners and operators.
To date, we have spent six years testing internally and externally validating the increased efficiencies of our QSI-Nano® iron catalysts, known as FeNix™, with several industry leaders in the UK, Switzerland, Germany, and more recently in China. In the last year, we were able to achieve a commercial validation of our FeNix™ catalyst in an ammonia plant owned and operated by the JH Group in China in May 2015. JH Group is the eleventh largest producer of ammonia in China. We are now in the process of arranging a second commercial validation of our FeNix™ catalyst in the western hemisphere in the first half of 2016. Upon achieving a second commercial validation, our objective is to achieve commercial purchase orders for our FeNix™ catalyst by the end of calendar 2016.
4 “New Revelations in Ammonia Synthesis,” University of Cambridge Press Release, November 17, 2000
(http://www.cam.ac.uk/news/new-revelations-in-ammonia-synthesis).
5 “Ammonia Production,” Encyclopedia of Earth, March 15, 2012 (http://www.eoearth.org/view/article/170573).
6 “Inventory of U.S. Greenhouse Gas Emissions and Sinks: 1990-2012 – Executive Summary,” U.S. EPA, 2014, (http://www.epa.gov/climatechange/Downloads/ghgemissions/US-GHG-Inventory-2014-Chapter-Executive-Summary.pdf).
7 “Biofuels Production, Improving Diets and Growing Economies in ‘BIC’ Countries Driving Global Demand for Ammonia, New IHS Study Says,” IHS, March 5, 2014 (http://press.ihs.com/press-release/ammonia/biofuels-production-improving-diets-and-growing-economies-bic-countries-drivin).
| -6- |
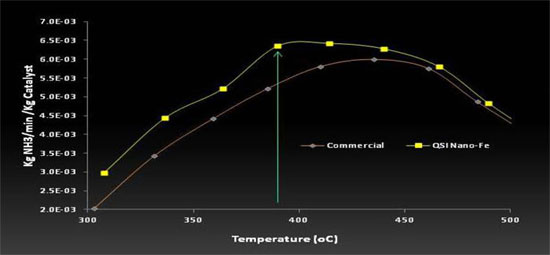
Our Competitive Advantage
The figure below illustrates the performance difference between a FeNix™ coated and an uncoated commercial iron catalyst used in the production of ammonia. In sum, a 1.5% coating (by weight) of FeNix™ catalysts onto existing commercial iron catalysts produces up to a 20% increase in catalyst activity (per QSI in-house lab validation and thereafter confirmed in a China commercial validation completed in May 2015 where we realized 10% to 15% production increase). In addition, our research and development indicates an ammonia plant may alternatively choose to decrease the pressure and heat required for ammonia production, and achieve the same ammonia production (output), and in doing so save up to 5% in energy costs and reduce emissions.
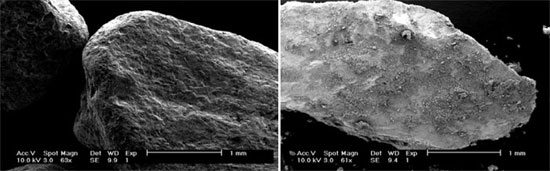
The TEM image on the left below represents a commercial iron catalyst (uncoated), while the TEM image on the right is the commercial iron catalyst coated with FeNix™ at a 1.5% loading.
| -7- |
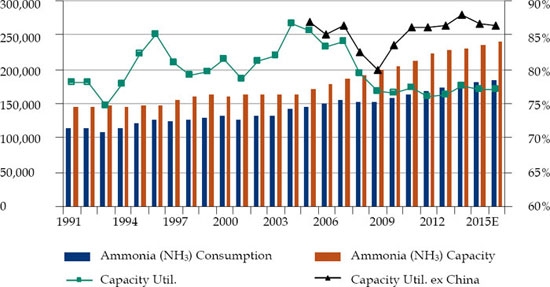
Global Ammonia Market
Ammonia is the building block of the global nitrogen industry. According to a January 9, 2014 research report by Bank of America Merrill Lynch,8 approximately 78% of ammonia is used in fertilizer where it is processed into downstream products like urea or direct-applied. Ammonia is produced in anhydrous form by catalytic reaction between nitrogen and hydrogen from natural gas or coal. The same report states that the demand for ammonia has grown 2% per year since 2000 and is expected to grow 2.5% per year through 2016 due to higher fertilizer demand in Asia and Latin America, where the capacity for ammonia has grown 2.5% per year since 2000 and is expected to maintain that annual rate of growth through 2016. The chart below shows the global ammonia supply and demand in 1,000 metric tons from 1991 to 2016.
Ammonia Global Demand by Region – 2013E
In addition to the foregoing, Fertecon has estimated global ammonia production as follows for the period 2010 thru 2015, where the worldwide production capacity is estimated to increase from 177,230,000 metric tons in 2009/2010 to 310,542,000 metric tons in the foreseeable future.
8 Research report by Bank of America Merrill Lynch dated January 9, 2014 and entitled, “Move to Neutral from Buy; methanol surge priced in?” (citing Fertecon, Green Markets, FMC, CRU BofA Merrill Lynch Global Research estimates).
| -8- |
Ammonia Production Capacity by Region (in 1000 metric tons)9
| Region | 2009/10 | 2010/11 | 2011/12 | 2012/13 | 2013/14 | 2014/15 | 2015/16 | 2016/17 | Indefinite | |||||||||||||||||||||||||||
| North America | 16,425 | 16,737 | 17,013 | 17,603 | 17,807 | 17,886 | 19,146 | 19,146 | 26,461 | |||||||||||||||||||||||||||
| Latin America | 11,737 | 11,737 | 11,011 | 11,011 | 11,442 | 12,797 | 13,623 | 13,634 | 18,539 | |||||||||||||||||||||||||||
| Western Europe | 12,491 | 12,391 | 12,391 | 12,391 | 12,391 | 12,391 | 12,391 | 12,391 | 12,391 | |||||||||||||||||||||||||||
| Central Europe | 8,385 | 8,385 | 7,785 | 7,785 | 7,785 | 7,785 | 7,785 | 7,785 | 9,804 | |||||||||||||||||||||||||||
| Eurasia | 26,353 | 26,223 | 26,676 | 26,920 | 26,920 | 27,320 | 28,697 | 29,093 | 36,069 | |||||||||||||||||||||||||||
| Africa | 6,966 | 6,966 | 7,466 | 9,168 | 11,346 | 11,988 | 12,748 | 12,748 | 21,801 | |||||||||||||||||||||||||||
| West Asia | 15,407 | 16,496 | 17,596 | 17,596 | 19,827 | 21,247 | 21,632 | 21,632 | 25,993 | |||||||||||||||||||||||||||
| South Asia | 18,907 | 20,443 | 20,443 | 21,326 | 22,052 | 22,778 | 22,778 | 22,778 | 35,800 | |||||||||||||||||||||||||||
| East Asia | 58,534 | 61,946 | 68,903 | 73,762 | 88,235 | 95,487 | 98,005 | 98,005 | 119,550 | |||||||||||||||||||||||||||
| -- China | (47,327 | ) | (50,614 | ) | (57,571 | ) | (61,664 | ) | (76,137 | ) | (81,605 | ) | (83,463 | ) | (83,463 | ) | (101,326 | ) | ||||||||||||||||||
| Total Asia | 92,848 | 98,885 | 106,942 | 112,684 | 130,114 | 139,512 | 142,415 | 142,415 | 181,343 | |||||||||||||||||||||||||||
| Oceania | 2,025 | 2,025 | 2,110 | 2,110 | 2,259 | 2,259 | 2,259 | 2,259 | 4,133 | |||||||||||||||||||||||||||
| World Total | 177,230 | 183,349 | 191,394 | 199,672 | 220,064 | 231,938 | 239,064 | 239,471 | 310,541 | |||||||||||||||||||||||||||
Ammonia Production & Growth
Demand for fertilizer is escalating worldwide. Countries around the globe are aggressively increasing their agricultural output of both grains and livestock, and commodity crop prices are at record highs, encouraging farmers to fertilize heavily in search of higher yields. As fertilizer demand grows, supply is ramping up to meet it, and in the case of the U.S., it has benefited from the rapid expansion of the nation’s natural gas sector over the past several years given historically low prices.
But unlike many of the industries capitalizing on the low price of natural gas, ammonia producers outside of China and India do not typically use it as a fuel source. They use it as an ingredient—a source of abundant, accessible hydrogen. Ammonia production is, relatively speaking, fairly simple. The inputs are nitrogen, hydrogen and energy used to stimulate a reaction understood by first year chemistry students:
N2 + 3H2 => 2NH3
The nitrogen used in the process is taken from the air, but hydrogen sources vary depending on when and where ammonia production is happening. When ammonia plants first came online in the 1940s, most used water as their source of hydrogen; energy-intensive electrolysis decoupled the hydrogen and oxygen. By adding a catalyst, pressure and air, then a cooling phase, you can generate hydrogen with some oxygen. However, electrolysis is an expensive proposition, and ammonia plants today have a far cheaper source of hydrogen: hydrocarbons.
According to Scientific American, no ammonia plants have broken ground in the U.S. in more than 20 years.10 Despite the foregoing, in the next several years, there will be as many as 14 new ammonia plants in the U.S., with nearly 12 million tons of new capacity and $10 billion of expected investment. Several older plants are also being recommissioned and upgraded. Oklahoma, Louisiana, Iowa, North Dakota, Wyoming, Texas and Indiana are among the planned or proposed sites. This boom, driven by low natural gas prices, the main ingredient in ammonia production, will drive a corresponding surge in the industry’s already substantial carbon footprint.
9 See, Worldwide Ammonia Capacity Listing by Plant, International Fertilizer Development Center (June 2013).
10 “Fertilizer Plants Spring Up to Take Advantage of U.S.’s Cheap Natural Gas,” Scientific American, April 25, 2013 (http://www.scientificamerican.com/article/fertilizer-plants-grow-thanks-to-cheap-natural-gas).
| -9- |
Ammonia’s Greenhouse Impact
In 2011, U.S. ammonia-producing facilities released 25 million tons of greenhouse gases (nearly all of it CO2)—just under 14% of the chemical-manufacturing sector’s total carbon footprint (and about 0.1% of total U.S. emissions).11 Globally, ammonia production represents as much as 3% to 5% of carbon emissions, according to industry sources.12 These figures do not take into account the supply chain of natural gas production, energy-related emissions in the production process, fertilizer application (and misapplication) or industrial use of urea and other ammonia products.
This larger footprint is a concern, particularly as the industry expands. Glen Buckley, an industry consultant at NPK Fertilizer Advisory Services (and former chief economist at U.S. fertilizer giant CF Industries), estimates that only about six million tons of the proposed U.S. capacity will actually get funding and get built—still, that’s a more than 50% increase in total ammonia capacity nationwide.
Metal-Air Batteries
| Our battery technology consists of a high performance gas diffusion air electrode or cathode (i.e., the “engine inside” the battery) originally developed by QSI for Energizer and powered by high performance QSI-Nano® manganese catalyst material. In the past year, we have increased the manufacturing capacity of our battery electrode line to produce several hundred feet of our high rate air cathode material per shift. However, we have recently decided to discontinue our attempts to commercialize our Metal-Air batteries. We have determined that opportunities in the chemicals sector offer far greater gross margins and thus would be a better use of our financial and management resources. Therefore, we have decided to attempt to either sell or license our battery technology to another company. We are actively exploring opportunities in this regard, and we do not anticipate the writedown of any fixed assets. |  |
11 Ibid.
12 Ibid.
| -10- |
Raw Materials; Principal Suppliers
We engage a number of suppliers for our equipment and for our bulk raw materials and gases. In the manufacture of our nanocatalysts, we use a range of equipment from a number of suppliers in order to assemble our proprietary reactors. As for the bulk raw materials and gases used in our nanocatalyst manufacturing process, we contract with a number of companies and make our purchase decisions based on the prevailing market prices for such bulk raw materials and gases. We periodically audit these suppliers to ensure the quality of the bulk raw materials and gases provided. We have not entered into any long-term supply agreements for any of our equipment or our bulk raw materials and gases.
Competition and Differentiation
Our value discipline combines safety, quality, price, service and an approach to doing business that customers reward with loyalty and appreciation. This value discipline is designed to create a two-way street of value and profitability between QSI and our customers. Our strategy is built on three central tenets:
| · | Increasing revenue growth by improving market focus; |
| · | Enhancing profitability through process development and the efficient use of assets; and |
| · | Creating and enhancing customer value through continued innovation. |
Our nanocatalyst manufacturing process is capable of delivering high surface area nanocatalysts to a wide array of industries. Specifically, our advanced materials and integrated catalytic solutions empower the chemical synthesis industry sector with the potential to transform and revolutionize their product offerings. We believe that our proprietary manufacturing technology offers measurable improvement over existing manufacturing processes and has the potential to transform nanoscale catalysts applications from costly, inefficient processes to feasible, dynamic, and profitable assets.
We believe that our state-of-the-art technology will compete based on its:
| · | Industry-low manufacturing costs; |
| · | Highly scalable, fully automated manufacturing process; |
| · | Consistent particle size distribution; |
| · | Low levels of agglomeration and impurities; |
| · | Highly uniform dispersion; and |
| · | Environmentally friendly process. |
In terms of the catalyst market, we will face potential worldwide competition from advanced materials and chemical companies, and suppliers of traditional materials. The actual or potential competitors are larger, more established and more diversified than we are. Although we are focusing on specific market segments and opportunities where our nanocatalysts have demonstrated increased efficiencies and performance, we will compete against lower priced traditional materials for certain customer applications. In some product or process applications, the benefits of using nanomaterials may not be viewed as justifying a process change or outweigh the additional costs of such a process change.
| -11- |
Many of our competitors have greater market presence, longer operating histories, stronger name recognition, larger customer bases and significantly greater financial, technical, sales and marketing, research and development, manufacturing and other resources than we have. In addition, the number of start-up and development-stage companies involved in nanomaterials continues to grow on a global basis, posing increasing competitive risks. Although a number of these companies are associated with university or national laboratories and may be engaged primarily in funded research rather than commercial production, they may represent competitive risks in the future. Moreover, if one or more of our competitors were to merge or partner with another of our competitors or develop alternatives to our nanocatalysts or our manufacturing process, our ability to compete effectively will be adversely affected. We anticipate that foreign competition will play a greater role in the nanomaterials arena in the future.
Research and Development
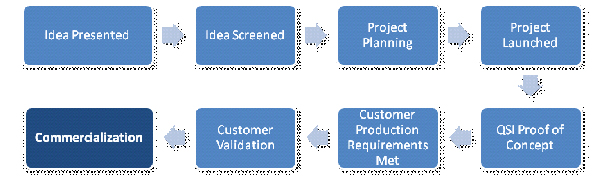
We maintain a disciplined approached to planning, tracking and conducting our research and development projects. Research and development ideas present themselves from both internal and external sources.
| -12- |
As depicted below, our science team meets frequently for brainstorming activities and maintains a master list of potential research and development ideas. In addition, our board of directors receives periodic briefings on all major research and development efforts and proposed initiatives.
To leverage our research and development capabilities, we have previously entered into and continue to discuss establishing research and development agreements with strategic parties in the chemical manufacturing industry.
Intellectual Property
Since our inception, our strategy has been to invest heavily in intellectual property protection and to build a strong IP portfolio around core nanocatalysts manufacturing, process integration technologies, as well as targeted end-use applications where our solutions add significant value and breakthrough results. This is done in such a way as to maximize the potential for prevailing in litigation and inhibiting competition from choosing to litigate. The QSI team includes an expert patent litigator with 20+ years of industry experience who has prevailed in multiple high profile patent cases, both in the U.S. and abroad. QSI maintains a patented production process and, as of September 28, 2015, has nine issued patents and three pending patent applications related to the manufacturing process and various end-use applications before the United States Patent and Trademark Office. In addition, we have three registered trademarks.
The patent for QSI’s platform gas phase condensation process was awarded on October 16, 2007, and includes broad claims on the manufacturing system that produces advanced metals and catalysts at the nano-scale. Additional patent applications have been filed covering QSI-Nano® catalysts in raw metal powder form, QSI-Nano® catalysts dispersed into custom liquid solutions / ink formulations used for coating various monolithic structures and membrane structures, QSI-Nano® catalysts integrated into physical electrode assemblies for other energy storage (battery) components, and QSI-Nano® iron catalysts used in the ammonia synthesis production process.
QSI’s patent portfolio protects the following principal areas:
| · | Advanced catalyst manufacturing; |
| · | Thermo-catalysis (highly efficient chemical production); and |
| · | Electro-catalysis (advanced metal-air battery electrodes, cells, portable power systems). |
Development results are formally vetted through a short list of criteria for assessing whether to seek to protect a “development” via a patent or whether to preserve it as a trade secret. This vetting process has produced a more efficient use of the capital QSI has allocated for its IP portfolio. Generally, if the development rests upon a methodology that is not likely to be either easily reverse engineered or invented independently by a competitor, then QSI elects to protect such methodology as a trade secret and preserve it with appropriate confidentiality procedures. QSI has relied on such confidentiality procedures for our software and algorithms that are associated with our nano-catalyst manufacturing process.
| -13- |
To the extent that the development has commercial value to QSI – either because it reflects a viable product in the future for QSI to manufacture and sell, or it reflects technology likely to be adopted by a competitor - then it is worthwhile to consider seeking patent protection. QSI believes that even in those cases where QSI is not going to market a product, it is wise to protect an invention that a competitor is likely to adopt. Thus far, this approach has resulted in nine high-value patents issued and three patent applications pending.
Depending upon the timeline for developing the technology at issue, or how well the development concept has been crystallized, it may be appropriate to simply file a provisional patent application rather than a non-provisional application. In the case where it is still early in development or concept, QSI will typically file what is essentially a white paper as a provisional application, which does not get examined, but secures an early priority date of invention. Where the technology at issue is fairly advanced in development, or the concept is sufficiently crystallized to know the full scope of the advantages over the prior art, QSI will typically file a non-provisional patent application. At that point, QSI develops a claim strategy that focuses on (1) highlighting the “gee whiz” that reflects the solution to the problem addressed while distinguishing the closest known prior art, and (2) addressing who the potential infringers might be (e.g., manufacturers, OEMs, distributors, customers, users, etc.). This claim strategy also takes into account the regions in which QSI intends to file for patent protection. All claims are formulated with an eye toward broad protection and litigation strategy. Active assessments are made as to how to prevail in cases in which QSI could choose to threaten potential infringers as well as to inhibit others from potentially challenging QSI.
Government Regulation
We are subject to federal, state and local laws and regulations applicable to businesses generally. Before we commercially introduce our products into certain markets, we may be required, or may voluntarily determine to obtain approval of our materials and/or products from one or more of the organizations engaged in regulating product safety. These approvals could require significant time and resources from our technical staff, and, if redesign were necessary, could result in a delay in the introduction of our products in those markets. Due to the continuous changes in the regulatory landscape, we cannot assure investors that federal, state or local laws, rules or regulations will not be amended or adopted in the future that could make compliance much more difficult or expensive.
The chemicals sector is governed by a variety of local, county, state, national and foreign rules and regulations. We are anticipating selling our nano-iron catalysts to ammonia plant operators for purposes of coating existing commercial iron catalysts to increase ammonia production yield and/or decrease energy consumption at these ammonia plants. Our ammonia plant customers will continue to handle all compliance with such laws, rules and regulations in their respective countries. With respect to the manufacture of the nano-iron catalysts, we have taken significant best practice measures in close coordination with various environmental agencies and advocate groups in relation to the manufacture and transport of catalysts. Despite the foregoing, there can be no assurance that additional or modified regulations relating to tariffs, as well as the transportation, importability, storage, use and disposal of nanomaterials, particularly nano-iron, will not be imposed by the U.S. or the countries into which our nano-iron catalysts may be shipped in the future.
| -14- |
Environmental, Health and Safety Policy
It is our environmental, health and safety, or EH&S, policy to ensure that our business practices continuously enhance the safety and health of all team members, the communities we operate in, and the environment. As a responsible corporate citizen, we observe strict compliance with all applicable laws, regulations, and responsible practices. In addition, we maintain an open partnership approach with regulatory agencies to develop guidance, regulations, and best practices for safely working with nanomaterials. We have a “Vision of Zero” – zero incidents, zero injuries and illnesses, zero accidents and zero environmental harm. Our EH&S policy is guided by our safety values of:
Leadership. We take an active leadership role in understanding and managing potential risks and hazards arising from working with nanomaterials. Our management provides the vision, the driving force, and resources needed to involve all employees in establishing a safe and healthy workplace environment.
Knowledge. As nanomaterials pose new challenges to understanding, predicting, and managing potential hazards and risks, we conduct periodic worksite analyses that study all working conditions to identify, prevent, and eliminate existing or potential hazards. The results of these studies are shared with all employees under a comprehensive EH&S training program as well as posted in product Material Safety Data Sheets (“MSDS”). We have also participated in various government-funded university research studies dealing with environmental safety and handling concerns. In addition, pertinent data is made available to customers, partners, industry groups, regulatory agencies, universities and community first responders.
Prevention. To prevent any harmful impact to the safety and health of the employees, the community, and the environment, we employ established safety systems in our operations, including, without limitation, administrative and engineering controls, personal protective equipment, safe work practices, preventive maintenance, and emergency preparedness programs.
Sustainability. We actively work to conserve resources and minimize or eliminate adverse EH&S effects and risks that may be associated with our products, services and operations. In addition, we will strive towards a “green supply chain” by the choice of suppliers, materials, services, and process and plant designs to ensure sustainability of operations and lifecycle product stewardship.
Continuous Improvement. We manages our business and operations with the goal of continuously upgrading our understanding of the EH&S impact of nanomaterials and systematically adapting our mode of operations to reach and maintain our policy of “Vision of Zero.”
Employees
As of September 28, 2015, we have 9 employees and 1 independent contractor. None of our employees are represented under a collective bargaining agreement.
Properties
We lease our principal offices located at 2905 Tech Center Dr., Santa Ana, California, consisting of 7,357 square feet of offices, laboratory and manufacturing space. Effective March 1, 2014, we entered into a new lease of our current facilities for a period of three years and concluding on February 28, 2017. The lease rate for the period March 1, 2015 through February 29, 2016 is $8,336 per month. The lease rate for the period March 1, 2016 through February 28, 2017 is $8,586 per month.
| -15- |
The investment in our common stock involves a number of significant risks. You should consider carefully the following information about these risks before investing in our common stock. If any of the following risk events actually occur, the business, our results of operations, and our financial condition would likely suffer, and investors could lose part or all of their investment. It is impossible to accurately predict the results to investors, as we have limited operating history as a public company. Prior to purchasing any of our common stock, you should carefully consider the following risks.
Risks Related to Our Business
We have a limited operating history and have experienced operating losses since our inception and may incur additional operating losses in the future. If we fail to generate significant revenue from the sale of our products, we may be unable to continue operations.
From inception through June 30, 2015, we have generated losses in excess of $42.1 million on revenues of approximately $2.2 million. As we have not yet generated substantive revenues, we will not be profitable until we establish a significant customer base and realize several million dollars in annual revenues. We expect to continue to lose money unless we are able to generate sufficient revenues and cash flows. If we are unable to generate sufficient revenues and cash flows to meet our costs of operations, we may be forced to cease our business. Our continued operations are dependent upon our ability to generate revenues from operations and obtain further financing. If we are unable to generate sufficient revenues and obtain sufficient financing, our current business plans could fail and we may be forced to close our business.
Our capitalization is limited and we will need additional funds to sustain our operations. If we are unable to raise additional capital, as needed, the future growth of our business and operations will be severely limited.
A limiting factor on our growth, including our ability to penetrate new markets such as the chemicals sector, attract new customers and deliver new products in a timely matter, is our limited capitalization compared to other companies in the industry. Our currently available capital resources are limited, and are only adequate to fund our operations and business objectives until November 30, 2015, assuming no revenues are realized from our current business plan, no equity or debt financing is procured, and no exercise of derivative securities (i.e., expiring options and warrants with a low exercise price per share) occurs. We will require additional financing in the form of debt or equity securities, or a combination thereof, and we are presently working with multiple interested prospective and existing investors in this regard. If additional financing is not procured, we will not achieve our revenue and profit objectives and may be forced to cease some or all of our operations. There can be no assurance that future debt or equity financing will be available to us on a timely basis, on acceptable terms, or at all. If we are unable to raise additional funds on acceptable terms, our business operations and business prospects will be adversely affected.
We have not generated significant revenue and may never be profitable.
Our ability to generate significant revenue and achieve profitability depends on our ability to complete additional commercial validations of our nanocatalysts in chemical production and receive significant purchase orders. We do not anticipate generating measurable revenues from sales of our nanocatalysts in chemical production until calendar Q1 of 2017 at the earliest, following an anticipated second commercial validation in a commercial ammonia plant located in the western hemisphere.
Because of the numerous risks and uncertainties associated with our additional commercial validations and obtaining significant purchase orders, we are unable to predict the timing or amount of increased expenses, and when, or if, we will be able to achieve or maintain profitability. Even if we are able to generate significant revenues from the sale of our products, we may not become profitable and may need to obtain additional funding to continue operations.
| -16- |
We have not generated gross profit and may never generate gross profit.
Our ability to generate gross profit depends on our ability to achieve significant revenue to cover our fixed costs of goods sold and our variable costs of goods sold related to materials production. We do not anticipate generating gross profit until calendar Q1 2017 at the earliest, and if at all, as we do not anticipate generating significant revenue until calendar Q1 2017 at the earliest. If we do not generate significant revenues, we may need to obtain additional funding to continue our operations.
We are dependent on our key personnel to operate our business, which could adversely affect our ability to operate if we are unable to retain or replace these persons. We may also require additional personnel, however, there can be no assurance that we will be able to hire or retain qualified personnel.
Our future performance will be substantially dependent on the continued services and on the performance of our senior management and other key personnel, particularly, Kevin D. Maloney, our Chief Executive Officer and President and Gregory L. Hrncir, our Chief Strategy Officer, among others. Our performance also depends on our ability to attract, retain and motivate other officers and key employees. The loss of the services of Messrs. Maloney and Hrncir, or any other key personnel could have a material adverse effect on our business, prospects, financial condition and results of operations. Our success will also depend upon our ability to recruit and retain additional qualified personnel.
There can be no assurance that sales, if any, of our nanocatalysts for use in the chemicals sector will result in profitability.
We have developed and patented a process to manufacture a variety of nanocatalysts, and have used these nanocatalysts to augment chemical production in an ammonia plant in China that resulted in commercial validation in May 2015. However, there is no guarantee that the use of nanocatalysts in chemicals applications will result in profitability or long-term viability. Our future success is a function of use of our nanocatalysts in the chemicals sector. There are no guarantees that use of one or more of our catalysts for one or more applications in the chemicals sector will occur. In the event this does not occur, our results of operations would be adversely affected and we may be forced to cease our business.
We only have one manufacturing facility
We manufacture all of our nano-catalysts at our Santa Ana, California facility. In the event of a fire, flood, tornado, earthquake or other form of a catastrophic event, we would be unable to fulfill any then existing demand for our products, if any, and would not be able to do so for several quarters, depending upon the severity of the event. While we carry what we believe to be sufficient property and casualty insurance, given the nature of our operations and our manufacturing equipment being of a bespoke nature, we will not be able to quickly replace our manufacturing and other equipment in a rapid fashion. As a result, should a catastrophic event occur which results in the loss of all or a measurable portion of our manufacturing equipment, our financial condition and results of operation would be materially adversely affected.
| -17- |
Our operations may expose us to litigation, tax, environmental and other legal compliance risks.
We are subject to a variety of litigation, tax, environmental, health and safety, and other legal compliance risks. These risks include, among other things, possible liability relating to product liability matters, personal injuries, intellectual property rights, contract-related claims, government contracts, taxes, tariffs, health and safety liabilities, environmental matters and compliance with U.S. and foreign laws, competition laws and laws governing improper business practices. We or one of our business units could be charged with wrongdoing as a result of such matters. If convicted or found liable, we could be subject to significant fines, penalties, repayments or other damages (in certain cases, treble damages). As a global business, we are subject to complex laws and regulations in the U.S. and other countries in which we intend to operate. Those laws and regulations may be interpreted in different ways. They may also change from time to time, subject to related interpretations and other guidance. Changes in laws or regulations could result in higher expenses, payments, tariffs and taxes, and uncertainty relating to laws or regulations may also affect how we conduct our operations and structure our investments and could limit our ability to enforce our rights.
In the area of taxes, changes in tax laws and regulations in the U.S. and other countries, as well as changes in related interpretations and other tax guidance could materially impact our tax receivables and liabilities and our deferred tax assets and tax liabilities. Additionally, in the ordinary course of business, we are subject to examinations by various authorities, including tax authorities. Although we are not subject to any current investigations, there could be additional investigations launched in the future by governmental authorities in various jurisdictions and existing investigations could be expanded. The global and diverse nature of our operations means that these risks will continue to exist and legal proceedings and contingencies may arise from time to time. Our results may be affected by the outcome of legal proceedings and other contingencies that cannot be predicted with certainty.
We face competition from companies that have substantially greater capital resources, research and development, manufacturing and marketing resources than we have in the chemicals sector.
While we believe that we have significant competitive benefits offered by our proprietary platform technology for use in the chemicals sector, there are competitors with much longer operating histories, greater name recognition, larger customer bases and significantly greater financial, technical and marketing resources than we do. Such competition could materially adversely affect our business, operating results or financial condition.
Our future revenues are very difficult to predict with any accuracy.
It is not feasible to predict with accuracy or assurance the timing or the amount of revenues that we will receive from the sale, or license, of our products. Any delay in the integration of one or more of our nanocatalysts in the chemicals sector, could result in significant delays in the realization of revenues, the need to raise additional capital through the issuance of additional equity or debt securities sooner than we intend, and may allow competitors to reach certain of such markets with products before we do. In view of the emerging nature of the technology involved in certain of these markets, and the attendant uncertainty as to whether our products will achieve meaningful commercial acceptance, if at all, there can be no assurance that we will realize revenues sufficient to achieve profitability.
We will have to establish distribution channels in the chemicals sector.
We have no experience in the license or sale of nanocatalysts in the chemicals sector. While we have retained the services of individuals with experience and relationships in the chemicals industry, we lack deep domain expertise in the chemicals sector. Further, should we be unsuccessful in establishing such distribution channels as well as recruiting, managing and retaining additional internal and external sales and business development personnel, our business, operating results and financial condition could be adversely affected.
| -18- |
We may face increased pricing pressures from current and future competitors and, accordingly, there can be no assurance that competitive pressures will not require us to reduce our prices on our nanocatalysts.
It is likely that we will experience significant competitive pressure over time. Accordingly, the use and pricing of our nanocatalysts in the chemicals sector may decline as the market becomes more competitive. Any material reduction in the price of our nanocatalysts will negatively affect our gross margin and results of operations.
We rely heavily on collaborative partners such as distributors, manufacturers and vendors and our relationships with such parties may restrict or limit our business operations.
We are currently working with several third party entities in the validation and optimization of our nanocatalysts for use in the chemicals sector. Our current and future collaborations and joint ventures are important as they allow greater access to funds, to research, development and testing resources, validation, and to manufacturing, sales and distribution resources that we would otherwise not have. We intend to continue to significantly rely on such collaborative and joint venture arrangements. Some of the risks and uncertainties related to the reliance on such collaborations and joint ventures in the chemicals sector include the fact that such relationships could actually serve to limit or restrict us, while our partners are free to pursue other catalyst solutions either on their own or with others. Further, our partners may terminate a collaborative technology relationship and such termination may require us to seek other partners, or expend substantial resources to pursue these activities independently.
We may be subject to product liability claims, which could damage our reputation, cause us to lose customers, and expose us to liabilities in excess of our product liability insurance coverage to cover any claims.
Our nanocatalysts proposed to be used in the chemicals sector must be handled according to strict guidelines to ensure safety. We have obtained product liability insurance, but we can make no assurance that the product liability insurance we have procured will be sufficient to cover any potential product liability claim. Failure to maintain sufficient insurance coverage could have a material adverse effect on our business, prospects and results of operations if claims are made that exceed the coverage we have obtained.
The anticipated growth of our business will result in a corresponding growth in the demands on our management and our operating systems and internal controls.
Any future growth may strain existing management resources and operational, financial, human and management information systems and controls, which may not be adequate to support our operations and will require us to develop further financial and management controls, reporting systems and procedures. There can be no assurance that we will be able to develop such controls, systems or procedures effectively, or on a timely basis. Our failure to do so could have a material adverse effect on our business, operating results and financial condition.
Although we have entered into confidentiality and non-compete agreements with all of our employees and consultants, if we are unable to protect our proprietary information against unauthorized use by others, our competitive position could be harmed.
Our proprietary information is critically important to our competitive position and is a significant aspect of the products we provide. If we are unable to protect our proprietary information against unauthorized use by others, our competitive position could be harmed. We enter into confidentiality and noncompete agreements with our employees and consultants, and control access to, and distribution of, our documentation and other proprietary information. Despite these precautions, we cannot assure you that these strategies will be adequate to prevent misappropriation of our proprietary information. Therefore, we could be required to expend significant amounts to defend our rights to proprietary information in the future if a breach were to occur.
| -19- |
Risks Related to the Chemicals Production Industry
If we fail to obtain strategic partnerships with key players in the chemicals sector, our results of operation will be adversely affected.
If we are unsuccessful in creating long-term strategic partnerships with ammonia catalyst providers, ammonia plant owners and operators, and ammonia reactor engineering and design firms in the chemicals sector, our overall business, financial condition and results of operations could be materially adversely affected.
We have no experience operating in the multi-billion global chemicals industry.
While we have significant experience in the manufacturing of nanocatalysts over the last 12 years, we have no experience working with conglomerates in the chemicals industry. We are operating without the assistance of experienced agents at this time; provided, however, we are in discussions with several global players in the ammonia industry, but there is no assurance that we will reach a definitive agreement with them, or an agreement which is on favorable terms. Our lack of experience could prove to be detrimental to our operating results and overall business prospects and condition.
As part of the sale of our QSI-Nano® iron catalysts, we will be required to coat these catalysts onto existing commercial iron catalysts used by ammonia producers and we have no commercial experience in doing so.
As part of the sale of QSI-Nano® iron catalysts to ammonia producers we will be required to coat our catalysts onto commercial iron substrates and we have very limited lab experience in doing so. Although we have developed our own coating machine that has demonstrated favorable early test results, we will need significantly more testing and development before our coating machine is fully proven, if at all. In sum, the coating process has many risks, we have very limited experience, it requires significant capital expenditure, and is a critical part of our overall value proposition. If we are not successful in implementing the coating process on a timely basis in each geographic region in which we anticipate operating, then our business condition and results of operation will be adversely affected.
Doing business in China has inherent risks and the ammonia plants in China use less pure hydrogen and nitrogen gases in the production of ammonia than that which has been used by QSI and is typically used in ammonia production in other regions around the world.
Doing business in China is fraught with risks, including but not limited to, theft of intellectual property, failure to make timely or full payment on goods delivered, major cultural and language differences and barriers, an economy in China that seems to have hit its peak and may be on the decline, currency risk, legal and tax issues, tariffs, etc. Each of the foregoing risks are real and we take them seriously, not the least of which is theft of intellectual property which we have addressed solidly by taking the firm position that the manufacture of our QSI-Nano® iron will never be undertaken in China. In addition, Chinese ammonia producers use “medium-dirty” nitrogen and hydrogen gas in the production of ammonia as opposed to the 99.9%+ pure gas utilized by QSI in our five years of QSI-Nano® iron testing. We do not know what effect the “less pure” gases used by the Chinese ammonia operators will have on our operating results in a commercial plant. Both the risks of doing business in China as well as the “medium dirty” gas utilized by ammonia operators in China could have a materially adverse effect on our business operations and financial condition.
| -20- |
We presently have sixteen gas-phase condensation reactors in our prototype facility in Santa Ana, California and will require significant scale-up should significant purchase orders be received.
If we are successful in achieving significant purchase orders for our QSI-Nano® iron catalysts, we will likely be required to significantly expand our base of reactors in a relatively short period of time. We have no experience in large-scale manufacturing, including the planning, design, permitting, build-out, and operation phases. Further, if we are required to expand we would likely need to do so in a state other than California, such as southern Nevada or Utah, given the extremely high electricity costs in California, and electricity being the largest component of our cost of goods. In sum, there is a host of issues surrounding a major manufacturing expansion, which will place significant burden on our management, financial, and other resources, all of which could have an effect on our overall business.
Warranty claims and product liability claims could harm our business, results of operations and financial condition.
Through the introduction of our nanocatalysts for use in the chemicals sector (with ammonia being the lead application), we will be exposed to potential warranty and product liability claims in the event that our products fail to perform as expected or such failure of our products results, or is alleged to result, in bodily injury or property damage (or both). Although we do not anticipate any claims, such claims may arise despite our quality controls and proper testing, either due to a defect during manufacturing or due to any individual or enterprise’s improper use of our products. In addition, if any of our products are or are alleged to be defective, then we may be required to participate in a recall of them. If a warranty or product liability claim is brought against us, regardless of merit or eventual outcome, such claim or recall may result in damage to our reputation, breach of contracts with our customers, decreased demand for our products, costly litigation, loss of revenue, and the inability to commercialize some products.
Risks Related to our Common Stock
You may find it difficult to sell our common stock.
There has been a limited trading market in our common stock. While we expect that this will change in the future, we cannot assure you that an active trading market for our common stock will develop or be sustained. Regardless of whether an active and liquid public market exists, negative fluctuations in our actual or anticipated operating results will likely cause the market price of our common stock to fall, making it more difficult for you to sell our common stock at a favorable price, or at all.
We intend to issue additional stock options to employees and consultants in the future, which will result in dilution to existing and new investors.
In the future, we will provide additional compensation to our employees, officers, directors, consultants and independent contractors through an equity incentive plan. Our equity incentive plan permits the issuance of options to purchase shares of common stock and restricted shares of our common stock. Because stock options granted under the plan will generally only be exercised when the exercise price for such option is below the then market value of the common stock, the exercise of such options will cause dilution to the book value per share of our common stock and to existing and new investors.
| -21- |
We do not intend to pay dividends on our common stock in the foreseeable future.
You should not rely on an investment in our common stock to provide dividend income. It is our present intention that all future earnings, if applicable, will be reinvested and used for ongoing product development as well as working capital. Any determination to pay dividends in the future will be made at the discretion of our board of directors and will depend on our results of operations, financial conditions, contractual restrictions, restrictions imposed by applicable laws and other factors that our board of directors deems relevant. In addition, our ability to pay dividends may be limited or prohibited by the terms of future financings and/or credit facilities. Accordingly, investors in our common stock should not expect dividends to be paid on their shares of common stock in the foreseeable future. Further, investors must rely on sales of their common stock after price appreciation, which may never occur, as the only way to realize any return on their investment. As a result, investors seeking cash dividends should not purchase our common stock.
Anti-takeover provisions in our Articles of Incorporation and Bylaws or provisions of Nevada law could prevent or delay a change in control, even if a change of control would benefit our stockholders.
Provisions of our Articles of Incorporation and Bylaws, as well as provisions of Nevada law, could discourage, delay or prevent a merger, acquisition or other change in control, even if a change in control would benefit our stockholders. These provisions:
| · | Establish advance notice requirements for nominations for election to the board of directors or for proposing matters that can be acted upon by stockholders at stockholder meetings; |
| · | Authorize our board of directors to issue “blank check” preferred stock to increase the number of outstanding shares and thwart a takeover attempt; |
| · | Require the written request of at least 75% of the voting power of our capital stock in order to compel management to call a special meeting of the stockholders; and |
| · | Prohibit stockholder action by written consent and require that all stockholder actions be taken at a meeting of our stockholders, unless otherwise specifically required by our Articles of Incorporation or the Nevada Revised Statutes. |
In addition, the Nevada Revised Statutes contain provisions governing the acquisition of a controlling interest in certain Nevada corporations. These laws provide generally that any person that acquires 20% or more of the outstanding voting shares of certain Nevada corporations in the secondary public or private market must follow certain formalities before such acquisition or they may be denied voting rights, unless a majority of the disinterested stockholders of the corporation elects to restore such voting rights in whole or in part. These laws will apply to us if we have 200 or more stockholders of record, at least 100 of whom have addresses in Nevada, unless our Articles of Incorporation or Bylaws in effect on the tenth day after the acquisition of a controlling interest provide otherwise. These laws provide that a person acquires a “controlling interest” whenever a person acquires shares of a subject corporation that, but for the application of these provisions of the Nevada Revised Statutes, would enable that person to exercise
| · | One-fifth or more, but less than one-third; |
| · | One-third or more, but less than a majority; or |
| · | A majority or more, of all of the voting power of the corporation in the election of directors. |
Once an acquirer crosses one of these thresholds, shares, which it acquired in the transaction taking it over the threshold and within the 90 days immediately preceding the date when the acquiring person acquired or offered to acquire a controlling interest, become “control shares.” These laws may have a chilling effect on certain transactions if our Articles of Incorporation or Bylaws are not amended to provide that these provisions do not apply to us or to an acquisition of a controlling interest, or if our disinterested stockholders do not confer voting rights in the control shares.
| -22- |
Nevada law also provides that if a person is the “beneficial owner” of 10% or more of the voting power of certain Nevada corporations, such person is an “interested stockholder” and may not engage in any “combination” with the corporation for a period of two years from the date such person first became an interested stockholder, unless the combination or the transaction by which the person first became an interested stockholder is approved by the board of directors of the corporation before the person first became an interested stockholder. Another exception to this prohibition is if the combination is approved by the affirmative vote of the holders of stock representing a majority of the outstanding voting power not beneficially owned by the interested stockholder at a meeting, no earlier than two years after the date that the person first became an interested stockholder. These laws generally apply to Nevada corporations with 200 or more stockholders of record, but a Nevada corporation may elect in its Articles of Incorporation not to be governed by these particular laws.
Nevada law also provides that directors may resist a change or potential change in control if the directors determine that the change is opposed to, or not in the best interest of, the corporation.
Risks Related to Our Securities, Tax Concerns And Reporting Requirements
There is a limited market for our common stock.
Only a very limited trading market currently exists for our common stock. As a result, any broker/dealer that makes a market in our common stock or other person that buys or sells our common stock could have a significant influence over our common stock price at any given time. We cannot assure our stockholders that a market for our common stock will be sustained. There is no assurance that our shares will have any greater liquidity than shares which do not trade on a public market, particularly given recent changes in legislation related to shell companies which will further restrict the ability of our stockholders to sell their shares in the public market.
Our stock price is likely to be volatile.
There is generally significant volatility in the market prices and limited liquidity of securities of companies at our stage. Contributing to this volatility are various events that can affect our stock price in a positive or negative manner. These events include, but are not limited to: governmental regulations or actions; market acceptance and sales growth of our products; litigation involving our industry; developments or disputes concerning our patents or other proprietary rights; departure of key personnel; future sales of our securities; fluctuations in our financial results or those of companies that are perceived to be similar to us; investors’ general perception of us; announcements by us of significant contracts, acquisitions, strategic partnerships, joint ventures or capital commitments, and general economic, industry and market conditions. If any of these events occur, it could cause our stock price to fall.
The price of our common stock may be adversely affected by the future issuance and sale of shares of our common stock or other equity securities.
We cannot predict the size of future issuances or sales of our common stock or other equity securities future acquisitions or capital raising activities, or the effect, if any, that such issuances or sales may have on the market price of our common stock. The issuance and sale of substantial amounts of common stock or other equity securities or announcement that such issuances and sales may occur, could adversely affect the market price of our common stock. As of September 28, 2015, we had 22,511,884 shares of common stock issued and outstanding, and an additional 477,488,116 shares of common stock and 10,000,000 shares of preferred stock authorized for issuance. Any decline in the price of our common stock may encourage short sales, which could place further downward pressure on the price of our common stock and may impair our ability to raise additional capital through the sale of equity securities.
| -23- |
Our reduced stock price may adversely affect our liquidity.
Our common stock has limited trading history. Many market makers are reluctant to make a market in stock with a trading price of less than $5.00 per share, as well as shares quoted on the OTCBB. To the extent that we have fewer market makers for our common stock, our volume and liquidity will likely decline, which could further depress our stock price.
Additional risks may exist since we became public through a “reverse merger.”
Because we became public by means of a “reverse merger,” we may not be able to attract the attention of major brokerage firms. Securities analysts of major brokerage firms may not provide coverage of us since there is little incentive to brokerage firms to recommend the purchase of our common stock. We cannot assure you that brokerage firms will want to conduct any secondary offerings on our behalf in the future.
Our reporting obligations as a public company are costly.
Operating a public company involves substantial costs to comply with reporting obligations under federal securities laws, which are continuing to increase as provisions of the Sarbanes-Oxley Act of 2002 are implemented. We may not reach sufficient size to justify our public reporting status. If we were forced to become a private company following the Merger, then our stockholders may lose their ability to sell their shares and there would be substantial costs associated with becoming a private company.
Our shares are “penny stock”.
In general, “penny stock” includes securities of companies which are not listed on the principal stock exchanges and have a bid price in the market of less than $5.00; and companies with net tangible assets of less than $2 million ($5 million if the issuer has been in continuous operation for less than three years), or which have recorded revenues of less than $6 million in the last three years. As “penny stock,” our stock therefore is subject to Rule 15g-9, which imposes additional sales practice requirements on broker-dealers which sell such securities to persons other than established customers and “accredited investors” (generally, individuals with net worth in excess of $1 million or annual incomes exceeding $200,000, or $300,000 together with their spouses, or individuals who are the officers or directors of the issuer of the securities). For transactions covered by Rule 15g-9, a broker-dealer must make a special suitability determination for the purchaser and have received the purchaser’s written consent to the transaction prior to sale. Consequently, this rule may adversely affect the ability of broker-dealers to sell our stock, and therefore may adversely affect stockholders’ ability to sell the stock in the public market.
The requirements of being a public company may strain our resources, divert management’s attention and affect our ability to attract and retain qualified members of the board of directors.
As a public company, we are subject to the reporting requirements of the Securities Exchange Act of 1934, as amended, or the Exchange Act, the Sarbanes-Oxley Act, the Dodd-Frank Act, the listing requirements of the OTCBB and other applicable securities rules and regulations. Compliance with these rules and regulations requires significant legal and financial compliance costs, makes some activities more difficult, time-consuming or costly and increases demand on our systems and resources. The Exchange Act requires, among other things, that we file annual, quarterly and current reports with respect to our business and operating results. The Sarbanes-Oxley Act requires, among other things, that we maintain effective disclosure controls and procedures and internal control over financial reporting. In order to maintain and, if required, improve our disclosure controls and procedures and internal control over financial reporting to meet this standard, significant resources and management oversight may be required. As a result, management’s attention may be diverted from other business concerns, which could harm our business and operating results. Although we have already hired additional employees to comply with these requirements, we may need to hire more employees in the future, which will increase our costs and expenses.
| -24- |
In addition, changing laws, regulations and standards relating to corporate governance and public disclosure are creating uncertainty for public companies, increasing legal and financial compliance costs and making some activities more time consuming. These laws, regulations and standards are subject to varying interpretations, in many cases due to their lack of specificity, and, as a result, their application in practice may evolve over time as new guidance is provided by regulatory and governing bodies. This could result in continuing uncertainty regarding compliance matters and higher costs necessitated by ongoing revisions to disclosure and governance practices. We intend to invest resources to comply with evolving laws, regulations and standards, and this investment may result in increased general and administrative expenses and a diversion of management’s time and attention from revenue-generating activities to compliance activities. If our efforts to comply with new laws, regulations and standards differ from the activities intended by regulatory or governing bodies due to ambiguities related to practice, regulatory authorities may initiate legal proceedings against us and our business may be harmed.
We also expect that being a public company with these new rules and regulations will make it more expensive for us to obtain director and officer liability insurance, and we may be required to accept reduced coverage or incur substantially higher costs to obtain coverage. These factors could also make it more difficult for us to attract and retain qualified members for our board of directors, particularly to serve any committees, and qualified executive officers.
As a result of disclosure of information in filings required of a public company, our business and financial condition will become more visible, which we believe may result in threatened or actual litigation, including by competitors and other third parties. If such claims are successful, our business and operating results could be harmed, and even if the claims do not result in litigation or are resolved in our favor, these claims, and the time and resources necessary to resolve them, could divert the resources of our management and harm our business and operating results.
We will be obligated to develop and maintain proper and effective internal controls over financial reporting.
We are required, pursuant to Section 404 of the Sarbanes-Oxley Act, to furnish a report by management on, among other things, the effectiveness of our internal control over financial reporting annually. This assessment will need to include disclosure of any material weaknesses identified by our management in our internal control over financial reporting.
We may not be able to complete our evaluation, testing and any required remediation in a timely fashion. During the evaluation and testing process, if we identify one or more material weaknesses in our internal control over financial reporting, we will be unable to assert that our internal controls are effective.
If we are unable to assert that our internal control over financial reporting is effective, or if our auditors are unable to express an opinion on the effectiveness of our internal controls, we could lose investor confidence in the accuracy and completeness of our financial reports, which would cause the price of our common stock to decline.
| -25- |
The recently enacted JOBS Act will allow us to postpone the date by which we must comply with certain laws and regulations and to reduce the amount of information provided in reports filed with the SEC.
We cannot be certain if the reduced disclosure requirements applicable to emerging growth companies will make our common stock less attractive to investors. We are and we will remain an “emerging growth company,” as defined in the JOBS Act until the earliest to occur of: (1) the last day of the fiscal year following the fifth anniversary of the date of the first sale of our common stock pursuant to an effective registration statement under the Securities Act; (2) the last day of the fiscal year where we have total annual gross revenues of at least $1.0 billion; (3) the date on which we are deemed to be a large accelerated filer, which means the market value of our common stock that is held by non-affiliates exceeded $700.0 million as of the prior June 30; and (4) the date on which we have issued more than $1.0 billion in non-convertible debt during the prior three-year period.
For so long as we remain an emerging growth company, we will not be required to:
| · | Have an auditor report on our internal control over financial reporting pursuant to Section 404(b) of the Sarbanes-Oxley Act; |
| · | Comply with any requirement that may be adopted by the Public Company Accounting Oversight Board regarding mandatory audit firm rotation or a supplement to the auditor’s report providing additional information about the audit and the financial statements (i.e., an auditor discussion and analysis); |
| · | Submit certain executive compensation matters to shareholder non-binding advisory votes; |
| · | Submit for shareholder approval golden parachute payments not previously approved; and |
| · | Disclose certain executive compensation related items such as the correlation between executive compensation and financial performance and comparisons of the Chief Executive Officer’s compensation to median employee compensation, when such disclosure requirements are adopted. |
In addition, Section 102(b)(1) of the JOBS Act also provides that an emerging growth company can take advantage of the extended transition period provided in Section 7(a)(2)(B) of the Securities Act for complying with new or revised accounting standards. An emerging growth company can therefore delay the adoption of certain accounting standards until those standards would otherwise apply to private companies. We have elected to use the extended transition period for complying with new or revised accounting standards under Section 102(b)(1) of the JOBS Act. As a result of this election, our financial statements may not be comparable to companies that comply with public company effective dates.
We cannot predict if investors will find our common stock less attractive because we may rely on some of these exemptions. If some investors find our common stock less attractive as a result, there may be a less active trading market for our common stock and our stock price may be more volatile. If we avail ourselves of certain exemptions from various reporting requirements, our reduced disclosure may make it more difficult for investors and securities analysts to evaluate us and may result in less investor confidence.
| -26- |
Sales of a substantial number of shares of our common stock in the public market by our existing stockholders could cause our stock price to fall.
We have not entered into any lock-up agreements with any of our existing shareholders. As a result, sales of a substantial number of shares of our common stock in the public market could depress the market price of our common stock and could impair our ability to raise capital through the sale of additional equity securities. We are unable to predict the effect that sales may have on the prevailing market price of our common stock.
Item 1B Unresolved Staff Comments
None.
We lease our principal offices located at 2905 Tech Center Dr., Santa Ana, California, consisting of 7,357 square feet of offices, laboratory and manufacturing space. Effective March 1, 2014, we entered into a new lease of our current facilities for a period of three years and concluding on February 28, 2017. The lease rate for the period March 1, 2015 through February 29, 2016 is $8,336 per month. The lease rate for the period March 1, 2016 through February 28, 2017 is $8,586 per month.
From time to time the Registrant may be named in claims arising in the ordinary course of business. Currently, no legal proceedings or claims are pending against us or involve us that, in the opinion of our management, could reasonably be expected to have a material adverse effect on our business or financial condition.
Item 4. Mine Safety Disclosures
None.
| -27- |
Item 5. Market for Registrant’s Common Equity, Related Stockholder Matters, and Issuer Purchase of Equity Securities
Market Information
Our common stock is quoted on the Over the Counter Bulletin Board (“OTCBB”), under the symbol “QSIM.” There was not an active market and no trading volume through June 23, 2015.
| Closing Bid | Closing Ask | ||||||||
| 2015 | High | Low | High | Low | |||||
| June 24 thru June 30 | 2.50 | 2.50 | 3.75 | 3.30 | |||||
The above quotations, as provided by OTC Markets Group, Inc., represent prices between dealers and do not include retail markup, markdown or commission. In addition, these quotations do not represent actual transactions.
Security Holders
As of September 28, 2015, we had 22,511,884 shares of common stock outstanding held of record by approximately 283 stockholders.
Dividends
We have not paid dividends on our common stock to date. We currently intend to retain future earnings, if any, to fund our operations and the development and growth of our business and, therefore, do not anticipate paying cash dividends on our common stock within the foreseeable future. Any future payment of dividends on our common stock will be determined by our board of directors and will depend on our financial condition, results of operations, contractual obligations and other factors deemed relevant by our board of directors.
| -28- |
Securities Authorized for Issuance under Equity Compensation Plans
Our 2014 Equity Incentive Plan (our “Incentive Plan”) is administered by our Board of Directors and provides for the granting of stock awards to employees, officers, directors and other service providers of the Registrant. Security holders have approved the stock plan. The following table sets forth certain information with respect our Incentive Plan as of June 30, 2015:
| Plan category | Number
of securities to be issued upon exercise of outstanding options, warrants and rights |
Weighted-average
exercise price of outstanding options, warrants and rights |
Number
of securities remaining available for future issuance under equity compensation plans (excluding securities reflected in column(a)) |
| (a) | (b) | (c) | |
| Equity compensation plans approved by security holders |
5,566,827 | $1.53 | 1,056,006 |
| Equity compensation plans not approved by security holders |
— | — | — |
| Total | 5,566,827 | $1.53 | 1,056,006 |
Recent Sales of Unregistered Securities
Previously Reported.
Item 6. Selected Financial Data
Not applicable.
| -29- |
Item 7. Management’s Discussion and Analysis of Financial Conditions and Results of Operations
Forward Looking Statements
This Annual Report on Form 10-K contains statements that must be deemed “forward-looking” statements under Section 27A of the Securities Act, including, among other things, discussions as to our business strategies, expectations, market position and services, anticipated revenues and performance, future operations, profitability, liquidity and capital resources. Words including, but not limited to, “may,” “will,” “likely,” “should,” “could,” “expect,” “plan,” “anticipate,” “believe,” “estimate,” “predict,” “intend,” “potential,” “continue,” “seek,” or the negative of these terms or other comparable terminology. Although we believe that the expectations reflected in such forward-looking statements are generally reasonable and reflect the current views of our management, such statements are inherently uncertain, and we can give no assurance that such statements will ultimately prove to be correct. Our operations are subject to a number of uncertainties and risks, many of which are outside our control, and any one of which, or any combination of which, could materially adversely affect our results of operations. Important factors, including, but not limited to, those discussed in the section titled “Risk Factors,” beginning on page 16 of this Form 10-K, could cause actual results to differ materially from such statements. Therefore, you are cautioned not to place undue reliance on these forward-looking statements.
These forward-looking statements may relate to the following:
| · | our future operating results and business prospects; |
| · | our ability to develop and market products that compete effectively in our targeted market segments; |
| · | market acceptance of our current and future products and the degree and nature of our competition; |
| · | our ability to meet customer demand; |
| · | our ability to protect and enforce our current and future intellectual property; |
| · | our ability to obtain sufficient funding to continue to pursue our business plan; |
| · | our ability to implement a long-term business strategy that will be profitable or generate sufficient cash flow; |
| · | our ability to manage our foreign manufacturing and development operations and international business risks; |
| · | the loss of any of our key members of management; |
| · | changes in our industry, interest rates or the general economy; and |
| · | changes in governmental regulations, tax rates and similar matters. |
| -30- |
We believe that the expectations reflected in the forward-looking statements are reasonable. However, there may be events in the future that we are not able to accurately predict or control and that may cause our actual results to differ materially from the expectations we describe in our forward-looking statements. Except as required by applicable law, we do not plan to publicly update or revise any forward-looking statements, whether as a result of any new information, future events, or otherwise.
Overview
QuantumSphere, Inc. was incorporated in the State of Nevada on December 1, 2005 and formerly known as Way Cool Imports, Inc. (“WYCC”). On April 22, 2014, WYCC entered into the Merger Agreement with QuantumSphere, Inc., a California corporation (“QSI”), whereby, QSI would merge with Way Cool Merger Sub, Inc., a Nevada corporation and wholly-owned subsidiary of WYCC. On April 22, 2014, the parties consummated the merger and QSI became a wholly-owned subsidiary of WYCC. As part of the merger, WYCC issued 17,185,217 shares of common stock to QSI shareholders, options to purchase 5,942,078 shares of common stock, and warrants to purchase 9,883,233 shares of common stock. The merger was considered a public shell reverse merger and, accordingly, accounted for as a recapitalization of QSI.
Subsequent to the merger, on April 25, 2014, WYCC filed Articles of Merger with the Nevada Secretary of State for the purposes of effecting a short-form merger of WYCC with and into QSI. The merger of WYCC with QSI, its wholly-owned subsidiary, is referred to as a short-form merger and did not require the approval of WYCC’s stockholders. As part of the Articles of Merger, WYCC amended its Articles of Incorporation to change its name from “Way Cool Imports, Inc.” to “QuantumSphere, Inc.” The Articles of Merger were effective upon filing.
On June 23, 2014, we reported our decision to change our fiscal year end to June 30 from a fiscal year ending on December 31. This action created a “transition period” (as defined), which is the six month period ended June 30, 2014. Under the SEC’s reporting rules, a registrant is required to file a separate transition report for transition periods that cover a period of six months or greater. Rule 13a-10 of the Securities and Exchange Act of 1934, as amended (the “Exchange Act”), requires registrants that have a transition period of six months or greater to file audited financial statements for that transition period on the form appropriate for annual reports of the registrant. Accordingly, our audited statement of operations and cash flows for the six month transition period ended June 30, 2014 were filed on Form 10-KT on September 26, 2014.
Dr. Douglas Carpenter, our Chief Technology Officer, has been on medical leave since November 4, 2014 due to a serious medical condition. Effective May 15, 2015, Dr. Carpenter transitioned to a consulting role with the Company and served on our Scientific Advisory Board. On August 5, 2015, Dr. Carpenter’s consulting role and position on our Scientific Advisory Board ended. We anticipate undertaking a search for a new Chief Technology Officer in the second half of this year and remain confident the Company has the necessary resources to continue to handle Dr. Carpenter’s former duties. We do not believe this change will have a material effect on business operations.
On May 5, 2015, the Company announced that commercial validation of its nano-iron catalyst had been achieved in a production-scale ammonia plant in China.
On May 27, 2015, the Company entered into a multi-year Joint Development Agreement with Swiss-based Casale, S.A. (Casale), a global leader in production technologies for ammonia, urea, melamine, methanol, syngas, nitrates and phosphates. Casale’s reactor production technologies are utilized in approximately 38 percent of global ammonia production and 39 percent of global methanol production. Casale and QSI have agreed to collaborate on commercial technologies for ammonia, methanol, and other industrial chemicals, which collectively account for several hundred billion USD of production annually. Casale also agreed to utilize QSI as its exclusive provider of nanocatalysts for its chemical synthesis processes during the term of the agreement due to QSI’s demonstrated increase in catalytic activity and patented high-volume manufacturing process. The first objective of the Joint Development Agreement is to validate and optimize QSI-Nano catalysts with Casale production reactor technologies. Following a successful validation phase, the second objective is to enter into a long-term agreement with Casale for the joint global distribution and sale of QSI-Nano catalysts with Casale reactor technologies to chemical plant owners and operators.
Emerging Growth Company
We are an “emerging growth company,” as defined in the Jumpstart Our Business Startups Act of 2012 (the “JOBS Act”). We will remain an emerging growth company until the earlier of the following: (1) the last day of the fiscal year following the fifth anniversary of the date of the first sale of our common stock pursuant to an effective registration statement under the Securities Act of 1933, as amended (the “Securities Act”); (2) the last day of the fiscal year where we have total annual gross revenues of at least $1.0 billion; (3) the date on which we are deemed to be a large accelerated filer, which means the market value of our common stock that is held by non-affiliates exceeded $700.0 million as of the prior June 30; and (4) the date on which we have issued more than $1.0 billion in non-convertible debt during the prior three-year period.
| -31- |
As an emerging growth company, we may take advantage of specified reduced disclosure and other requirements that may otherwise be applicable to public companies. These provisions include:
| · | Only two years of audited consolidated financial statements in addition to any required unaudited interim financial statements with correspondingly reduced “Management’s Discussion and Analysis of Financial Condition and Results of Operations” disclosure; |
| · | Reduced disclosure about our executive compensation arrangements; |
| · | No requirement that we hold non-binding advisory votes on executive compensation or golden parachute arrangements; and |
| · | Exemption from the auditor attestation requirement in the assessment of our internal control over financial reporting. |
We have taken advantage of some of these reduced burdens and may continue to do so for so long as we remain an emerging growth company, and thus the information we provide stockholders may be different from what you might receive from other public companies in which you hold shares.
To the extent that we continue to qualify as a “smaller reporting company,” as such term is defined in Rule 12b-2 under the Securities Exchange Act of 1934, as amended (the “Exchange Act”), after we cease to qualify as an emerging growth company, certain of the exemptions available to us as an emerging growth company may continue to be available to us as a smaller reporting company, including: (1) not being required to comply with the auditor attestation requirements of our internal control over financial reporting under Section 404(b) of the Sarbanes-Oxley Act of 2002; (2) scaled executive compensation disclosures; and (3) the requirement to provide only two years of audited financial statements, instead of three years.
Critical Accounting Policies and Estimates
Use of Estimates. We make estimates and assumptions that affect the reported amounts of assets and liabilities and the disclosure of contingent assets and liabilities at the date of the financial statements. The use of estimates may also affect the reported amounts of revenues and expenses during the reporting periods. Significant estimates made by management include, among others, realization of capitalized assets, valuation of equity instruments, and deferred income tax valuation allowances. Actual results could differ from those estimates.
Revenue Recognition. We recognize revenue when all four of the following criteria are met: (1) persuasive evidence that an arrangement exists; (2) delivery of the products and/or services has occurred; (3) the selling price is fixed or determinable; and (4) collectability is reasonably assured. We do not grant customers the right to return the products after such products have been accepted. Amounts billed for shipping and handling are recorded as a component of net sales and the cost incurred for freight is included as a component of operating expenses in the statements of operations.
| -32- |
Property and Equipment. Purchased property and equipment is stated at cost, less accumulated depreciation. Repairs and maintenance of equipment are charged to expense as incurred. Expenditures for major renewals and betterments that extend the useful lives of property and equipment are capitalized. Gains or losses on dispositions of property and equipment are included in the results of operations when realized. Depreciation is computed using the straight-line method over the estimated useful lives of the related assets, ranging from three to seven years. Leasehold improvements are amortized over the shorter of terms of the leases or their estimated useful lives. Depreciation expense on assets acquired under capital leases is included in depreciation expense.
Patents. Costs incurred in applying for patents relating to our process for production of nanomaterials have been capitalized. Patents are amortized to reflect the pattern of economic benefits consumed, on a straight-line basis, over the estimated periods benefited. As of June 30, 2015, nine patents have been issued and three patents are pending. Additional significant costs may be required for the continued development of end-use applications for our technology.
Impairment of Long-Lived Assets. Long-lived assets and intangible assets to be held and used are reviewed for impairment whenever events or changes in circumstances indicate that the carrying amount of an asset may not be recoverable. We evaluate potential impairment by comparing the carrying amount of the assets with the estimated undiscounted future cash flows associated with them. Should the review indicate that an asset is not recoverable, our carrying value of the asset would be reduced by the estimated shortfall to fair value.
Income Taxes. Deferred income taxes are recognized for the tax consequences in future years of differences between the tax basis of assets and liabilities and their financial reporting amounts at each period end, based on enacted tax laws and statutory tax rates applicable to the periods in which the differences are expected to affect taxable income. Valuation allowances are established, when necessary, to reduce deferred tax assets to the amount expected to be realized. The provision for income taxes represents the tax payable for the period, if any, and the change during the period in deferred tax assets and liabilities.
Stock-Based Compensation. We measure all employee stock-based compensation awards using the Black-Scholes-Merton valuation model and allocate the related expense over the requisite service period. The expected volatility is based on the historical volatility of our stock as determined by its private placement offerings, the expected life of the award is based on the simplified method. We account for nonemployee stock-based transactions using the fair value of the consideration received (i.e. the value of the goods or services) or the fair value of the equity instruments issued, whichever is more reliably measurable.
Results of Operations
The following sets forth a discussion and analysis of the financial condition and results of operations of QSI for the years ended June 30, 2015 and 2014. This discussion and analysis should be read in conjunction with our consolidated financial statements appearing elsewhere in this Form 10-K. The following discussion contains forward-looking statements. Our actual results may differ significantly from the results discussed in such forward-looking statements. Factors that could cause or contribute to such differences include, but are not limited to, those discussed in the section titled “Risk Factors,” beginning on page 16 of this Form 10-K.
Year Ended June 30, 2015 Compared to Year Ended June 30, 2014
The following discussions are based on the consolidated balance sheets as of June 30, 2015 and June 30, 2014 and statements of operations for the years ended June 30, 2015 and 2014 and notes thereto.
| -33- |
The tables presented below, which compare QSI’s results of operations from one period to another, present the results for each period and the change in those results from one period to another in dollars. The columns present the following:
| · | The first two data columns in each table show the dollar results for each period presented. |
| · | The column entitled “Dollar variance” shows the change in results. This column shows favorable changes as positive and unfavorable changes as negative. For example, when net sales increase from one period to the next, that change is shown as a positive number. Conversely, when expenses increase from one period to the next, that change is shown as a negative. |
Year Ended June 30, 2015 Compared to Year Ended June 30, 2014 | Year Ended June 30, 2015 | Year Ended June 30, 2014 (unaudited) | Dollar variance favorable (unfavorable) | |||||||||
| Net Sales | $ | 48,047 | $ | 176,382 | $ | (128,335 | ) | |||||
| Cost of Sales | 14,448 | 55,594 | 41,146 | |||||||||
| Gross Profit | 33,599 | 120,788 | (87,189 | ) | ||||||||
| Operating Expenses | ||||||||||||
| Research and development | 2,137,628 | 1,365,111 | (772,517 | ) | ||||||||
| Selling, marketing, and advertising | 73,862 | 46,313 | (27,549 | ) | ||||||||
| General and administrative | 2,392,467 | 2,563,441 | 170,974 | |||||||||
| Total operating expenses | 4,603,957 | 3,974,865 | (629,092 | ) | ||||||||
| Loss from Operations | (4,570,358 | ) | (3,854,077 | ) | (716,281 | ) | ||||||
| Other Income (Expense) | ||||||||||||
| Interest expense, net | (80,131 | ) | (494,727 | ) | 414,596 | |||||||
| Interest expense – amortization of note discounts | (228,404 | ) | (86,784 | ) | (141,620 | ) | ||||||
| Loss from change in fair value of derivative liabilities | (449,600 | ) | — | (449,600 | ) | |||||||
| Gain on disposal of assets | 17,353 | 8,000 | 9,353 | |||||||||
| Loss on intangible assets | (12,283 | ) | — | (12,283 | ) | |||||||
| Other income | 15,284 | 69,500 | (54,216 | ) | ||||||||
| Total other expense, net | (737,781 | ) | (504,011 | ) | (233,770 | ) | ||||||
| Loss Before Provision for Income Taxes | (5,308,139 | ) | (4,358,088 | ) | (950,051 | ) | ||||||
| Provision for Income Taxes | 800 | 1,600 | (800 | ) | ||||||||
| Net Loss | $ | (5,308,939 | ) | $ | (4,359,688 | ) | $ | (949,251 | ) | |||
| -34- |
Net Sales. Net sales decreased by $128,335 in the year ended June 30, 2015 compared to the year ended June 30, 2014, reflecting a decrease in sales of $102,500 of silver palladium to one customer and the balance various nanomaterials and electrodes.
For the years ended June 30, 2015 and 2014, 30% and 58% of net sales were to one and one company, respectively.
For the year ended June 30, 2015, 36% of net sales were to Korea. For the year ended June 30, 2014, 58% of net sales were to Israel.
Gross Profit. Gross profit decreased by $87,189 in the year ended June 30, 2015 compared to the year ended June 30, 2014. The decrease resulted from decrease of $128,335 in sales and increases of $470,269 in manufacturing salaries and related expenses, $305,730 in depreciation, $96,087 in utilities, $37,848 in production materials, $17,412 in miscellaneous expenses, and $10,604 in repairs and maintenance, offset by increased allocation of $535,705 to Research and Development for ammonia research, $377,723 to Research and Development for production of nano iron for validation in China, and $65,668 to inventory for nano iron produced for future sales.
Research and Development. Research and development expenses increased by $772,517 in the year ended June 30, 2015 compared to the year ended June 30, 2014. The increase resulted from increases of $535,705 in research on ammonia production, $377,723 in production of nano iron for validation in China, and $15,884 in miscellaneous expenses, offset by $108,964 less salaries and related expenses due to less employees and $47,831 less in research on the MetAir® Ranger battery.
Selling, Marketing and Advertising Expenses. Selling, marketing and advertising expenses increased by $27,549 in the year ended June 30, 2015 compared to the year ended June 30, 2014. The increase resulted from increases of $14,940 in outside consultants and $14,250 in marketing expense, offset by $1,641 less miscellaneous expenses.
General and Administrative Expenses. General and administrative expenses decreased by $170,974 in the year ended June 30, 2015 compared to the year ended June 30, 2014. The decrease resulted from decreases of $384,581 legal expenses (primarily related to the reverse merger of April 2014), $22,668 outside consultants, $12,540 audit expense, and $13,977 miscellaneous expense, offset by increases of $111,225 insurance (primarily D&O insurance), $107,384 board members compensation (primarily options expenses), $19,631 payroll and related expenses, $13,141 public filing expenses, and $11,411 outside services.
Interest Expense. Interest expense decreased by $414,596 in the year ended June 30, 2015 compared to the year ended June 30, 2014. The decrease resulted from the conversion of $6,642,500 of notes payable to common stock on April 22, 2014 as part of the reverse merger
Interest Expense – Amortization of Note Discounts. Interest expense – amortization of note discounts increased by $141,620 in the year ended June 30, 2015 compared to the year ended June 30, 2014. $182,100 of the increase resulted from the May 2015 calculation of the fair value of the derivative liabilities for the $510,000 convertible notes payable issued in May 2015. Fair value of $692,100 was determined by the Monte Carlo simulation. $510,000 was recorded as a discount to the convertible noted payable and the the amount ($182,100) that the fair value exceeded the value of the notes was recorded to expense.
Loss from Change in Fair Value of Derivative Liabilities. Loss from change in fair value of derivative liabilities increased by $449,600 in the year ended June 30, 2015 compared to the year ended June 30, 2014. Fair value was recalculated at June 30, 2015 using the Monte Carlo simulation. That resulted in an uncrease in fair value of $449,600.
| -35- |
Gain on Disposal of Assets. Gain on disposal of assets increased by $9,353 in the year ended June 30, 2015 compared to the year ended June 30, 2014. A fully depreciated piece of equipment was sold for $17,353 in the year ended June 30, 2015 compared to two fully depreciated pieces of equipment sold for $8,000 in the year ended June 30, 2014.
Loss on Intangible Assets. Loss on intangible assets increased by $12,283 in the year ended June 30, 2015 compared to the year ended June 30, 2014. Upon review of the legal work in relation to potential patents applications, we determined that some patent applications would no longer be pursued and thus we expensed those capitalized costs.
Other Income. Other income decreased by $54,216 in the year ended June 30, 2015 compared to the year ended June 30, 2014. Other income of $15,284 for the year ended June 30, 2015 was the result of personal property tax refunds. Other income of $69,500 for the year ended June 30, 2014 was the result of favorable settlements of amounts owed by or owed to us.
Liquidity and Capital Resources
As of June 30, 2015, we had current assets of $503,319, including $398,570 in cash and cash equivalents.
Cash decreased $2,304,319 from $2,702,889 at June 30, 2014 to $398,570 at June 30, 2015. Net cash used in operating activities of $3,367,414 in the year ended June 30, 2015 included $5,308,939 operating loss, $65,668 increase in inventory, and $17,353 gain on disposal of fixed assets, offset by $36,416 increase in accounts payable and accrued expenses, $18,147 decrease in prepaid expenses, $2,958 decrease in accounts receivable, and non-cash expenses of $449,600 in loss from change in fair value of derivative liabilities, $873,613 for stock based compensation, $385,773 for depreciation, $228,404 amortization of notes discounts, and $12,283 for intangible assets written off. Net cash used in operating activities was $2,424,936 for the year ended June 30, 2014.
$197,962 of cash was used in investing activities in the year ended June 30, 2015. $193,479 of cash was used for the purchase of property and equipment, and $4,483 of cash was used for the development of patents. $1,434,257 of cash was used in investing activities in the year ended June 30, 2014.
$1,261,057 in cash was provided by financing activities in the year ended June 30, 2015, due to $880,000 in common stock options exercised, $510,000 in convertible notes issued, and $127,500 in other note issued, offset by $144,559 payments on notes payable and $111,884 in common stock repurchases. $6,186,847 in cash was provided by financing activities in the year ended June 30, 2014.
We estimate that, as of the date of this filing, our current cash will be depleted by November 30, 2015. We are presently working on securing debt capital from third parties. In the event additional funding is not obtained by December 1, 2015, we will take measures to reduce our operating expenses, such as general and administrative, research and development, and selling, marketing and advertising.
| -36- |
We monitor our financial resources on an ongoing basis and may adjust planned business activities and operations as needed to ensure that we have sufficient operating capital. We evaluate our capital needs, and the availability and cost of capital on an ongoing basis and expect to seek capital when and on such terms as deemed appropriate based upon an assessment of then-current liquidity, capital needs, and the availability and cost of capital. We expect that any capital we raise will be through the issuance of equity securities, the exercise of warrants and options, or the issuance of debt instruments, including convertible debt instruments. We believe that we will be able to obtain financing when and as needed, but the capital may be expensive.
Other Commitments and Contingencies
Our commitments and contingencies as of June 30, 2015 consisted of our lease agreement for our principal corporate offices located in Santa Ana, California and leased equipment. Accordingly, the following table only summarizes our minimum lease payments for the next five years and thereafter:
| Year Ending June 30, | Amount | ||||
| 2016 | $ | 105,500 | |||
| 2017 | $ | 70,926 | |||
| Total | $ | 176,426 | |||
The above minimum lease payments include a new lease for our principal corporate offices that was signed in March 2014. The lease period is from March 2014 through February 2017.
We do not have any off-balance sheet arrangements.
We do not believe that the current levels of inflation in the United States have had a significant impact on our operations. If current levels of inflations hold steady, we do not believe future operations will be negatively impacted.
The following sets forth a discussion and analysis of the financial condition and results of operations of QSI for the six months ended June 30, 2014 and 2013. This discussion and analysis should be read in conjunction with our consolidated financial statements appearing elsewhere in this Form 10-K. The following discussion contains forward-looking statements. Our actual results may differ significantly from the results discussed in such forward-looking statements. Factors that could cause or contribute to such differences include, but are not limited to, those discussed in the section titled “Risk Factors,” beginning on page 16 of this Form 10-K.
Six Months Ended June 30, 2014 Year Compared to Six Months Ended June 30, 2013
The following discussions are based on the consolidated balance sheets as of June 30, 2014 and December 31, 2013 and statement of operations for the six months ended June 30, 2014 and June 30, 2013 and notes thereto.
The tables presented below, which compare QSI’s results of operations from one period to another, present the results for each period and the change in those results from one period to another in dollars. The columns present the following:
| · | The first two data columns in each table show the dollar results for each period presented. |
| -37- |
| · | The column entitled “Dollar variance” shows the change in results in dollars. This column shows favorable changes as positive and unfavorable changes as negative. For example, when net sales increase from one period to the next, that change is shown as a positive number. Conversely, when expenses increase from one period to the next, that change is shown as a negative. |
Six Months Ended June 30, 2014 Compared to Six Months Ended June 30, 2013 | 2014 | 2013 (unaudited) | Dollar variance favorable (unfavorable) | |||||||||
| Net Sales | $ | 20,095 | $ | 87,773 | $ | (67,678 | ) | |||||
| Cost of Sales | 2,315 | 29,463 | 27,148 | |||||||||
| Gross Profit | 17,780 | 58,310 | (40,530 | ) | ||||||||
| Operating Expenses | ||||||||||||
| Research and development | 832,428 | 379,296 | (453,132 | ) | ||||||||
| Selling, marketing, and advertising | 19,918 | 2,174 | (17,744 | ) | ||||||||
| General and administrative | 1,627,313 | 413,856 | (1,213,457 | ) | ||||||||
| Total operating expenses | 2,479,659 | 795,326 | (1,684,333 | ) | ||||||||
| Loss from Operations | (2,461,879 | ) | (737,016 | ) | (1,724,863 | ) | ||||||
| Other Income (Expense) | ||||||||||||
| Interest expense, net | (301,045 | ) | (72,689 | ) | (228,356 | ) | ||||||
| Interest expense – amortization of note discounts | (313 | ) | (216,908 | ) | 216,595 | |||||||
| Gain on disposal of assets | 8,000 | 10,000 | (2,000 | ) | ||||||||
| Other income | 69,500 | — | 69,500 | |||||||||
| Total other expense, net | (223,858 | ) | (279,597 | ) | 55,739 | |||||||
| Loss Before Provision for Income Taxes | (2,685,737 | ) | (1,016,613 | ) | (1,669,124 | ) | ||||||
| Provision for Income Taxes | 800 | — | (800 | ) | ||||||||
| Net Loss | $ | (2,686,537 | ) | $ | (1,016,613 | ) | $ | (1,669,924 | ) | |||
Net Sales. Net sales decreased by $67,678 in the six months ended June 30, 2014 compared to the six months ended June 30, 2013, reflecting a decrease in sales of various nanomaterials and electrodes.
For the six months ended June 30, 2014 and 2013, 81% and 76% of net sales were to five and three companies, respectively.
For the six months ended June 30, 2014, 44% of net sales were to South Korea and 17% of net sales were to Japan. For the six months ended June 30, 2013, 62% of net sales were to Israel.
| -38- |
Gross Profit. Gross profit decreased by $40,530 in the six months ended June 30, 2014 compared to the six months ended June 30, 2013. The decrease resulted from a decrease of $67,678 in net sales offset by a decrease of $27,148 in cost of sales.
Research and Development. Research and development expenses increased by $453,132 in the six months ended June 30, 2014 compared to the six months ended June 30, 2013. The increase resulted from increases of $216,954 in ammonia nano iron research & development, $136,874 in salaries and related expenses due to more employees, $89,466 in research on the MetAir® Ranger battery, and $9,838 in miscellaneous expenses.
Selling, Marketing and Advertising Expenses. Selling, marketing and advertising expenses increased by $17,744 in the six months ended June 30, 2014 compared to the six months ended June 30, 2013. The increase resulted from increases of $5,990 in marketing expense, $3,986 in outside consultants, and $7,768 in miscellaneous expenses.
General and Administrative Expenses. General and administrative expenses increased by $1,213,457 in the six months ended June 30, 2014 compared to the six months ended June 30, 2013. The increase resulted from $561,522 payroll and related expenses, $246,475 board members compensation, $140,241 legal expense and $114,490 audit expense related to the reverse merger, $45,555 business insurance, $48,556 outside consultants and outside services, $22,682 public filing expenses, and $33,936 miscellaneous expenses. .
Interest Expense. Interest expense increased by $228,356 in the six months ended June 30, 2014 compared to the six months ended June 30, 2013. The increase resulted from an increase in notes payable from $1,767,500 at June 30, 2013 to $6,642,500 at April 22, 2014 when the notes payable were converted to common stock as part of the reverse merger.
Interest Expense – Amortization of Note Discounts. Debt discount amortization decreased by $216,595 in the six months ended June 30, 2014 compared to the six months ended June 30, 2013. The decrease was due to convertible notes payable in 2014 having a mandatory conversion feature and thus did not have warrants discounts.
Other Income. Other income increased by $69,500 in the six months ended June 30, 2014 compared to the six months ended June 30, 2013. Other income was the result of favorable settlements of amounts owed by or owed to the Company.
Item 7A. Quantitative and Qualitative Disclosures About Market Risk
None.
ITEM 8. Financial Statements and Supplementary Data
Reference is made to the consolidated financial statements and accompanying notes included in this report, which begin on page F-1.
ITEM 9. Changes in and Disagreements with Accountants on Accounting and Financial Disclosure.
None.
| -39- |
Item 9A. Controls and Procedures
Disclosure Controls and Procedures
Based on their evaluation as of June 30, 2015, which is the end of the period covered by this annual report on Form 10-K, our principal executive officer and principal financial officer have concluded that our disclosure controls and procedures (as defined in Rules 13a-15(e) or 15d-15(e) of the Exchange Act) are effective, based upon an evaluation of those controls and procedures required by paragraph (b) of Rule 13a-15 or Rule 15d-15 of the Exchange Act.
Internal Control Over Financial Reporting
Our management is responsible for establishing and maintaining adequate internal control over financial reporting as defined in Rules 13a-15(f) or Rule 15(d)-15(f) under the Securities Exchange Act of 1934, as amended. Our internal control over financial reporting is a process designed to provide reasonable assurance regarding the reliability of financial reporting and the preparation of financial statements for external purposes in accordance with accounting principles generally accepted in the United States of America. Internal control over financial reporting includes those written policies and procedures that:
| · | pertain to the maintenance of records that, in reasonable detail, accurately and fairly reflect the transactions and dispositions of our assets; |
| · | provide reasonable assurance that transactions are recorded as necessary to permit preparation of financial statements in accordance with accounting principles generally accepted in the United States of America; |
| · | provide reasonable assurance that our receipts and expenditures are being made only in accordance with authorization of our management; and |
| · | provide reasonable assurance regarding prevention or timely detection of unauthorized acquisition, use or disposition of assets that could have a material effect on our consolidated financial statements. |
Internal control over financial reporting includes the controls themselves and monitoring and actions taken to correct deficiencies as identified.
Our management assessed the effectiveness of our internal control over financial reporting as of June 30, 2015. Our management’s assessment was based on criteria for effective internal control over financial reporting described in “Internal Control – Integrated Framework” issued by the Committee of Sponsoring Organizations of the Treadway Commission. Our management’s assessment included an evaluation of the design of our internal control over financial reporting and testing of the operational effectiveness of our internal control over financial reporting. Based on this assessment, our management determined that, as of June 30, 2015, we maintained effective internal control over financial reporting.
| There have been no changes in our internal controls over financial reporting identified in connection with the evaluation required by paragraph (d) of Exchange Act Rules 13a-15 or 15d-15 that occurred during our last fiscal quarter that have materially affected, or are reasonably likely to materially affect, our internal control over financial reporting above. |
| -40- |
None.
| -41- |
ITEM 10. Directors, Executive Officers and Corporate Governance
The information required under this item is incorporated herein by reference to the Registrant’s definitive proxy statement pursuant to Regulation 14A, which proxy statement will be filed with the Securities and Exchange Commission not later than 120 days after the close of the Registrant’s fiscal year ended June 30, 2015.
ITEM 11. Executive Compensation
The information required under this item is incorporated herein by reference to the Registrant’s definitive proxy statement pursuant to Regulation 14A, which proxy statement will be filed with the Securities and Exchange Commission not later than 120 days after the close of the Registrant’s fiscal year ended June 30, 2015.
ITEM 12. Security Ownership of Certain Beneficial Owners and Management
The information required under this item is incorporated herein by reference to the Registrant’s definitive proxy statement pursuant to Regulation 14A, which proxy statement will be filed with the Securities and Exchange Commission not later than 120 days after the close of the Registrant’s fiscal year ended June 30, 2015.
ITEM 13. Certain Relationships and Related Transactions, and Director Independence
The information required under this item is incorporated herein by reference to the Registrant’s definitive proxy statement pursuant to Regulation 14A, which proxy statement will be filed with the Securities and Exchange Commission not later than 120 days after the close of the Registrant’s fiscal year ended June 30, 2015.
ITEM 14. Principal Accounting Fees and Services
The information required under this item is incorporated herein by reference to the Registrant’s definitive proxy statement pursuant to Regulation 14A, which proxy statement will be filed with the Securities and Exchange Commission not later than 120 days after the close of the Registrant’s fiscal year ended June 30, 2015.
| -42- |
ITEM 15. Exhibits, Financial Statements Schedules
| (a) | The following documents are filed as a part of this Annual Report on Form 10-K: |
| (1) | Financial Statements: |
See index to financial statements on page F-1
| (2) | Schedules: |
All schedules to the financial statements are omitted as the required information is either inapplicable or presented in the financial statements or notes thereto
| (3) | Exhibits: |
The information required by this Item is set forth in the Exhibit Index hereto which is incorporated herein by reference
| (b) | Exhibits. |
The information required by this Item is set forth in the Exhibit Index hereto which is incorporated herein by reference
| -43- |
Pursuant to the requirements of the Securities Exchange Act of 1934, the Registrant has duly caused this report to be signed on its behalf by the undersigned hereunto duly authorized.
| QUANTUMSPHERE, INC. | ||||
| Date: September 28, 2015 | By: | /s/ Kevin D. Maloney | ||
| Kevin D. Maloney | ||||
| Title: | President and Chief Executive Officer | |||
We, the undersigned officers and directors of QuantumSphere, Inc., a Nevada Corporation “the Registrant”) hereby severally constitute and appoint Kevin D. Maloney and Gregory L. Hrncir, his true and lawful attorneys-in-fact and agents, each with full power and authority (acting alone and without the others) to execute and deliver in the name and on behalf of the undersigned as such officers and directors, the Annual Report of the Registrant on Form 10-K for the fiscal year ended June 30, 2015 (the “Annual Report”) under the Securities Exchange Act of 1934, as amended, and to execute and deliver any and all amendments to the Annual Report for filing with the Securities and Exchange Commission; and in connection with the foregoing, to do any and all acts and things and execute any and all instruments which such attorneys and agents may deem necessary or advisable to enable the Company to comply with the securities laws of the United States and of any state or other political subdivision thereof. The undersigned hereby grants unto such attorney and agents, and each of them, full power of substitution and revocation in the premises and hereby ratifies and confirms all that such attorneys-in-fact and agents may do or cause to be done by virtue of these presents.
Pursuant to the requirements of the Securities Exchange Act of 1934, this report has been signed below by the following persons on behalf of the registrant and in the capacities, and on the dates indicated below.
| Signature | Title | Date | ||
| /s/ Kevin D. Maloney | President and Chief Executive Officer, Chairman (Principal Executive Officer) | September 28, 2015 | ||
| Kevin D. Maloney | ||||
| /s/ Stephen C. Gillings | Chief Financial Officer and Treasurer (Principal Financial and Accounting Officer) | September 28, 2015 | ||
| Stephen C. Gillings | ||||
| /s/ Marc H. Goroff, Ph.D. | Director | September 28, 2015 | ||
| Marc H. Goroff, Ph.D. | ||||
| /s/ Steven S. Myers | Director | September 28, 2015 | ||
| Steven S. Myers | ||||
| /s/ Jeffery W. Palmer | Director | September 28, 2015 | ||
| Jeffery W. Palmer | ||||
| /s/ Francis C. Poli | Director | September 28, 2015 | ||
| Francis C. Poli | ||||
| /s/ Robert S. Venable | Director | September 28, 2015 | ||
| Robert S. Venable | ||||
| -44- |
| Exhibit Number |
Description | |
| 23.1 | Consent of Squar, Milner, Peterson, Miranda & Williamson, LLP filed herewith. | |
| 31.1 | Certification pursuant to Rule 13a-14(a)/15d-14(a), filed herewith. | |
| 31.2 | Certification pursuant to Rule 13a-14(a)/15d-14(a), filed herewith. | |
| 32.1 | Certification pursuant to 18 U.S.C. Section 1350, as adopted pursuant to Section 906 of the Sarbanes-Oxley Act of 2002. (Filed herewith). | |
| 32.2 | Certification pursuant to 18 U.S.C. Section 1350, as adopted pursuant to Section 906 of the Sarbanes-Oxley Act of 2002. (Filed herewith). |
| -45- |
QUANTUMSPHERE, INC.
INDEX TO FINANCIAL STATEMENTS
| -46- |
QuantumSphere, Inc.
Financial Statements
June 30, 2015
INDEX TO THE FINANCIAL STATEMENTS
REPORT OF INDEPENDENT
REGISTERED
PUBLIC ACCOUNTING FIRM
To the Board of Directors and Stockholders
QuantumSphere, Inc.
Santa Ana, California
We have audited the accompanying balance sheets of QuantumSphere, Inc. (the “Company”) as of June 30, 2015 and 2014, and the related statements of operations, stockholders’ equity (deficit), and cash flows for the years ended June 30, 2015 and December 31, 2013 and for the six month period ended June 30, 2014. These financial statements are the responsibility of the Company’s management. Our responsibility is to express an opinion on these financial statements based on our audits.
We conducted our audits in accordance with the standards of the Public Company Accounting Oversight Board (United States). Those standards require that we plan and perform the audits to obtain reasonable assurance about whether the financial statements are free of material misstatement. The Company is not required to have, nor were we engaged to perform, an audit of its internal control over financial reporting. Our audits included consideration of internal control over financial reporting as a basis for designing audit procedures that are appropriate in the circumstances, but not for the purpose of expressing an opinion on the effectiveness of the Company’s internal control over financial reporting. Accordingly, we express no such opinion. An audit also includes examining, on a test basis, evidence supporting the amounts and disclosures in the financial statements, assessing the accounting principles used and significant estimates made by management, as well as evaluating the overall financial statement presentation. We believe that our audits provide a reasonable basis for our opinion.
In our opinion, the financial statements referred to above present fairly, in all material respects, the financial position of QuantumSphere, Inc. as of June 30, 2015 and 2014, and the results of operations and cash flows for the years ended June 30, 2015 and December 31, 2013 and the six month period ended June 30, 2014, in conformity with accounting principles generally accepted in the United States of America.
The accompanying financial statements have been prepared assuming that the Company will continue as a going concern. As discussed in Note 2 to the financial statements, the Company has recurring losses from operations since inception and has limited working capital. These factors raise substantial doubt about the Company’s ability to continue as a going concern. Management’s plans in regard to these matters are also described in Note 2. The accompanying financial statements do not include any adjustments that might result from the outcome of this uncertainty.
/S/ SQUAR MILNER LLP
Newport Beach, California
September 25, 2015
| June 30, 2015 | June 30, 2014 | |||||||
| ASSETS | ||||||||
| Current Assets | ||||||||
| Cash | $ | 398,570 | $ | 2,702,889 | ||||
| Inventory | 65,668 | — | ||||||
| Prepaid expenses and other current assets | 39,081 | 60,186 | ||||||
| Total current assets | 503,319 | 2,763,075 | ||||||
| Property and Equipment, net | 1,346,346 | 1,533,588 | ||||||
| Patents, net | 99,447 | 112,299 | ||||||
| Other Assets | 24,578 | 24,578 | ||||||
| Total assets | $ | 1,973,690 | $ | 4,433,540 | ||||
| LIABILITIES AND STOCKHOLDERS’ EQUITY (DEFICIT) | ||||||||
| Current Liabilities | ||||||||
| Accounts payable and accrued expenses | $ | 425,582 | $ | 501,051 | ||||
| Note payable, net of discount | 197,639 | 130,786 | ||||||
| Convertible notes payable, net of discounts | 42,500 | — | ||||||
| Derivatives liabilities | 1,141,700 | — | ||||||
| Total current liabilities | 1,807,421 | 631,837 | ||||||
| Note payable, long-term portion, net of discounts | 276,392 | 358,245 | ||||||
| Total liabilities | 2,083,813 | 990,082 | ||||||
| Stockholders’ Equity (Deficit) | ||||||||
Convertible preferred stock — 10,000,000 shares authorized, no shares issued and outstanding | — | — | ||||||
Common stock — 500,000,000 shares authorized, 22,261,884 and 21,385,217 shares issued and outstanding as of June 30, 2015 and 2014, respectively. | 22,262 | 21,385 | ||||||
| Additional paid-in capital | 41,987,111 | 40,232,630 | ||||||
| Accumulated deficit | (42,119,496 | ) | (36,810,557 | ) | ||||
| Total stockholders’ equity (deficit) | (110,123 | ) | 3,443,458 | |||||
| Total liabilities and stockholders’ equity (deficit) | $ | 1,973,690 | $ | 4,433,540 | ||||
| Page 2 | The accompanying notes are an integral part of these financial statements. |
|
QUANTUMSPHERE, INC. |
| Year Ended June 30, 2015 | Six Months Ended | Year Ended December 31, 2013 | ||||||||||
| Net Sales | $ | 48,047 | $ | 20,095 | $ | 244,061 | ||||||
| Cost of Sales | 14,448 | 2,311 | 82,761 | |||||||||
| Gross Profit | 33,599 | 17,784 | 161,300 | |||||||||
| Operating Expenses | ||||||||||||
| Research and development | 2,137,628 | 832,432 | 911,960 | |||||||||
| Selling, marketing and advertising | 73,862 | 19,918 | 28,569 | |||||||||
| General and administrative | 2,392,467 | 1,627,313 | 1,349,984 | |||||||||
| Total operating expenses | 4,603,957 | 2,479,663 | 2,290,513 | |||||||||
| Loss from Operations | (4,570,358 | ) | (2,461,879 | ) | (2,129,213 | ) | ||||||
| Other (Expense) Income | ||||||||||||
| Interest expense, net | (80,131 | ) | (301,045 | ) | (266,371 | ) | ||||||
| Interest expense – amortization of note discounts | (228,404 | ) | (313 | ) | (303,379 | ) | ||||||
| Loss from change in fair value of derivative liabilities | (449,600 | ) | — | — | ||||||||
| Gain on disposal of assets | 17,353 | 8,000 | 10,000 | |||||||||
| Loss on intangible assets | (12,283 | ) | — | — | ||||||||
| Other income | 15,284 | 69,500 | — | |||||||||
| Total other expense, net | (737,781 | ) | (223,858 | ) | (559,750 | ) | ||||||
| Loss Before Provision for Income Taxes | (5,308,139 | ) | (2,685,737 | ) | (2,688,963 | ) | ||||||
| Provision for Income Taxes | 800 | 800 | 800 | |||||||||
| Net Loss | $ | (5,308,939 | ) | $ | (2,686,537 | ) | $ | (2,689,763 | ) | |||
| Basic and Diluted Loss Per Common Share | $ | (0.24 | ) | $ | (0.18 | ) | $ | (0.24 | ) | |||
| Basic and Diluted Weighted-Average Common Shares Outstanding | 21,998,528 | 14,971,068 | 11,056,059 | |||||||||
| Page 3 | The accompanying notes are an integral part of these financial statements. |
|
QUANTUMSPHERE,
INC. |
| Convertible Preferred Stock | Common Stock | Additional Paid-in | Accumulated | |||||||||||||||||||||||||
| Shares | Amount | Shares | Amount | Capital | Deficit | Total | ||||||||||||||||||||||
| BALANCE – December 31, 2012 | — | $ | — | 11,056,059 | $ | 21,496,878 | $ | 8,214,260 | $ | (31,434,257 | ) | $ | (1,723,119 | ) | ||||||||||||||
| Issuance of warrants with debt and related beneficial conversion feature | — | — | — | — | 262,276 | — | 262,276 | |||||||||||||||||||||
| Stock-based compensation | — | — | — | — | 1,130,936 | — | 1,130,936 | |||||||||||||||||||||
| Net loss | — | — | — | — | — | (2,689,763 | ) | (2,689,763 | ) | |||||||||||||||||||
| BALANCE – December 31, 2013 | — | — | 11,056,059 | 21,496,878 | 9,607,472 | (34,124,020 | ) | (3,019,670 | ) | |||||||||||||||||||
| Conversion of notes payable and related accrued interest to common stock | — | — | 5,447,194 | 7,216,781 | — | — | 7,216,781 | |||||||||||||||||||||
| Shares issued for cash, $2.00 per share | — | — | 1,267,000 | 2,534,000 | — | — | 2,534,000 | |||||||||||||||||||||
| Common stock buy back | — | — | (585,036 | ) | (1,173,430 | ) | — | — | (1,173,430 | ) | ||||||||||||||||||
| Shares issued to Way Cool shareholders and effect of reverse merger | — | — | 4,200,000 | (30,052,844 | ) | 30,052,844 | — | — | ||||||||||||||||||||
| Issuance of warrants with debt | — | — | — | — | 11,282 | — | 11,282 | |||||||||||||||||||||
| Stock-based compensation | — | — | — | — | 561,032 | — | 561,032 | |||||||||||||||||||||
| Net loss | — | — | — | — | — | (2,686,537 | ) | (2,686,537 | ) | |||||||||||||||||||
| BALANCE – June 30, 2014 | — | — | 21,385,217 | 21,385 | 40,232,630 | (36,810,557 | ) | 3,443,458 | ||||||||||||||||||||
| Options exercised | — | — | 876,667 | 877 | 879,123 | — | 880,000 | |||||||||||||||||||||
| Issuance of warrants with debt | — | — | — | — | 1,745 | — | 1,745 | |||||||||||||||||||||
| Stock-based compensation | — | — | — | — | 873,613 | — | 873,613 | |||||||||||||||||||||
| Net loss | — | — | — | — | — | (5,308,939 | ) | (5,308,939 | ) | |||||||||||||||||||
| BALANCE – June 30, 2015 | — | $ | — | 22,261,884 | $ | 22,262 | $ | 41,987,111 | $ | (42,119,496 | ) | $ | (110,123 | ) | ||||||||||||||
| Page 4 | The accompanying notes are an integral part of these financial statements. |
QUANTUMSPHERE,
INC. |
| Year Ended June 30, 2015 | Six Months Ended June 30, 2014 | Year Ended December 31, 2013 | ||||||||||
| CASH FLOWS FROM OPERATING ACTIVITIES | ||||||||||||
| Net loss | $ | (5,308,939 | ) | $ | (2,686,537 | ) | $ | (2,689,763 | ) | |||
| Adjustments to reconcile net loss to net cash used in operating activities: | ||||||||||||
| Depreciation and amortization | 385,773 | 34,240 | 56,209 | |||||||||
| Loss on intangible assets | 12,283 | — | — | |||||||||
| Loss (gain) on disposal of fixed assets | (17,353 | ) | (8,000 | ) | (10,000 | ) | ||||||
| Stock-based compensation | 873,613 | 561,031 | 1,130,936 | |||||||||
| Loss from change in fair value of derivative liabilities | 449,600 | — | — | |||||||||
| Interest expense – amortization of note discounts | 228,404 | 313 | 303,379 | |||||||||
| Changes in operating assets and liabilities: | ||||||||||||
| Accounts receivable | 2,958 | 15,636 | (9,784 | ) | ||||||||
| Inventory | (65,668 | ) | — | — | ||||||||
| Prepaid expenses and other current assets | 18,147 | (27,116 | ) | (16,988 | ) | |||||||
| Other assets | — | (15,817 | ) | — | ||||||||
| Accounts payable and accrued expenses | 36,415 | (298,686 | ) | (74,235 | ) | |||||||
| Deferred revenue | — | — | (24,000 | ) | ||||||||
| Net cash used in operating activities | (3,384,767 | ) | (2,424,936 | ) | (1,334,246 | ) | ||||||
| CASH FLOWS FROM INVESTING ACTIVITIES | ||||||||||||
| Payments for development of patents | (4,483 | ) | (5,165 | ) | (18,421 | ) | ||||||
| Purchase of property and equipment | (193,479 | ) | (1,437,092 | ) | (101,960 | ) | ||||||
| Cash received from disposal of equipment | 17,353 | 8,000 | 10,000 | |||||||||
| Net cash used in investing activities | (180,609 | ) | (1,434,257 | ) | (110,381 | ) | ||||||
| CASH FLOWS FROM FINANCING ACTIVITIES | ||||||||||||
| Proceeds from issuance of common stock | — | 2,534,000 | — | |||||||||
| Proceeds from exercise of common stock options | 880,000 | — | — | |||||||||
| Proceeds from issuances of notes payable | 637,500 | 4,500,000 | 2,025,000 | |||||||||
| Principal payments on notes payable | (144,559 | ) | (25,000 | ) | (250,000 | ) | ||||||
| Common stock repurchase | (111,884 | ) | (822,153 | ) | — | |||||||
| Net cash provided by financing activities | 1,261,057 | 6,186,847 | 1,775,000 | |||||||||
| NET INCREASE (DECREASE) IN CASH | (2,304,319 | ) | 2,327,654 | 330,373 | ||||||||
| CASH – beginning of period | 2,702,889 | 375,235 | 44,862 | |||||||||
| CASH – end of period | $ | 398,570 | $ | 2,702,889 | $ | 375,235 | ||||||
| ADDITIONAL CASH FLOW INFORMATION | ||||||||||||
| Interest paid | $ | 75,315 | $ | 8,170 | $ | 34,954 | ||||||
| Income taxes paid | $ | 800 | $ | 800 | $ | 800 | ||||||
(continued)
| Page 5 | The accompanying notes are an integral part of these financial statements. |
| QUANTUMSPHERE, INC. STATEMENTS OF CASH FLOWS For the Year Ended June 30, 2015, the Six Months Ended June 30, 2014 and the Year Ended December 31, 2013
|
SUPPLEMENTAL SCHEDULE OF NONCASH INVESTING AND FINANCING ACTIVITIES
During the year ended June 30, 2015, the Company entered into the following noncash transactions:
| · | Issued 321,305 warrants to purchase common stock with a relative fair value of approximately $692,000 in connection with the issuance of notes payable. |
| · | Issued 35,000 options to purchase common stock with a fair value of approximately $25,000 in connection with services rendered. |
| · | Common share repurchase recorded as accrued liability of approximately $112,000. |
During the six months ended June 30, 2014, the Company entered into the following noncash transactions:
| · | Issued 5,447,194 shares of common stock in exchange for approximately $7,217,000 of notes payable and accrued interest. |
| · | Issued 20,000 warrants to purchase common stock with a relative fair value of approximately $11,000 in connection with the issuance of notes payable and recorded as debt discount. |
| · | Issued 15,000 options to purchase common stock with a fair value of approximately $13,000 in connection with services rendered. |
| · | Shares cancelled and repurchased but not yet paid approximating $351,000. |
During the year ended December 31, 2013, the Company entered into the following noncash transactions:
| · | Issued 700,000 warrants to purchase common stock with a relative fair value of approximately $262,000 in connection with the issuance of notes payable and recorded as debt discount. |
| · | Issued 560,541 options to purchase common stock valued at approximately $729,000 to satisfy certain accrued expenses. |
| Page 6 | The accompanying notes are an integral part of these financial statements. |
QUANTUMSPHERE, INC. For the Year Ended June 30, 2015, the Six Months Ended June 30, 2014 and the Year Ended December 31, 2013
|
1. ORGANIZATION AND BUSINESS
QuantumSphere, Inc. (the “Company” or “QuantumSphere”) was organized under the laws of the State of California on January 31, 2003. The Company has developed a process to manufacture metallic nanopowders with end-use applications in the battery and chemical sectors. The Company’s products are used on a stand-alone basis, in the validation of Company nano-iron catalysts coated onto commercial iron catalysts used in the production of ammonia on a prospective basis, and research, development and initial marketing of zinc-air battery products. The Company’s major activities to date have included capital formation, research and development, and marketing of its metallic nanopowder products.
In June 2014, the Company elected to change its year end from December 31 to June 30.
Dr. Douglas Carpenter, our Chief Technology Officer, has been on medical leave since November 4, 2014 due to a serious medical condition. Effective May 15, 2015, Dr. Carpenter transitioned to a consulting role with the Company and served on our Scientific Advisory Board. On August 5, 2015, Dr. Carpenter’s consulting role and position on our Scientific Advisory Board ended. We anticipate undertaking a search for a new Chief Technology Officer in the second half of this year and remain confident the Company has the necessary resources to continue to handle Dr. Carpenter’s former duties. We do not believe this change will have a material effect on business operations.
On May 5, 2015, the Company announced that commercial validation of its nano-iron catalyst had been achieved in a production-scale ammonia plant in China.
2. SUMMARY OF SIGNIFICANT ACCOUNTING POLICIES
The Summary of significant accounting policies presented below is designed to assist in understanding the Company’s financial statements. Such financial statements and accompanying notes are the representations of Company’s management, who are responsible for their integrity and objectivity. These accounting policies conform to accounting principles generally accepted in the United States of America (“U.S. GAAP”) in all material respects, and have been consistently applied in preparing the accompanying financial statements.
| Page 7 |
QUANTUMSPHERE, INC. NOTES TO FINANCIAL STATEMENTS For the Year Ended June 30, 2015, the Six Months Ended June 30, 2014 and the Year Ended December 31, 2013
|
Use of Estimates
The accompanying financial statements are prepared in conformity with U.S. GAAP and require management to make estimates and assumptions that affect the reported amounts of assets and liabilities and the disclosure of contingent assets and liabilities at the date of the financial statements. The use of estimates may also affect the reported amounts of revenues and expenses during the reporting periods. Significant estimates made by management include, among others, fair value of derivative liabilities, realization of capitalized assets, valuation of equity instruments, and deferred income tax asset valuation allowances. Actual results could differ from those estimates.
Revenue Recognition
The Company recognizes revenue when all four of the following criteria are met: (i) persuasive evidence that an arrangement exists; (ii) delivery of the products and/or services has occurred; (iii) the selling price is fixed or determinable; and (iv) collectability is reasonably assured. The Company does not grant customers the right to return the products after such products have been accepted. Amounts billed for shipping and handling are recorded as a component of net sales and the cost incurred for freight is included as a component of operating expenses in the statements of operations.
Cash and Cash Equivalents
The Company considers demand deposits, U.S. treasury securities and highly-liquid debt investments purchased with original maturities of three months or less to be cash equivalents. The Company did not have any cash equivalents as of June 30, 2015 and June 30, 2014.
The Company maintains its cash in major banks. From time to time, the Company’s cash balances exceed the Federal Deposit Insurance Corporation limit. The Company has not experienced and does not anticipate any losses relating to these amounts.
Inventory
Inventory consists primarily of manufactured nano materials and is comprised of raw materials, labor and manufacturing overhead. Inventory is stated at the lower of cost, determined on a first-in, first-out basis, or market. At June 30, 2015 and 2014, the Company did not have an excess and obsolete reserve. An inventory reserve is created when potentially slow-moving or obsolete inventories are identified in order to reflect the appropriate inventory value. Changes in economic conditions, production requirements, and lower than expected customer demand could result in additional obsolete or slow-moving inventory that cannot be sold or must be sold at reduced prices and could result in additional reserve provisions.
Property and Equipment
Property and equipment is stated at cost, less accumulated depreciation. Repairs and maintenance of equipment are charged to expense as incurred. Expenditures for major renewals and betterments that extend the useful lives of property and equipment are capitalized. Gains or losses on dispositions of property and equipment are included in the results of operations when realized. Depreciation is computed using the straight-line method over the estimated useful lives of the related assets, ranging from three to seven years. Leasehold improvements are amortized over the shorter of terms of the leases or their estimated useful lives. Depreciation expense on assets acquired under capital leases is included in depreciation expense.
| Page 8 |
QUANTUMSPHERE, INC. NOTES TO FINANCIAL STATEMENTS For the Year Ended June 30, 2015, the Six Months Ended June 30, 2014 and the Year Ended December 31, 2013
|
Patents
Costs incurred in applying for patents relating to the Company’s process for production of nanopowders have been capitalized. Patents are amortized to reflect the pattern of economic benefits consumed, on a straight-line basis, over the estimated periods benefited. As of June 30, 2015, nine patents have been issued and three patents are pending approval. Amortization relating to issued patents was not significant during the periods presented. Additional significant costs may be required for the continued development of end-use applications for the Company’s technology. Patents costs are reviewed periodically as to if any patents are no longer being pursued and associated costs should be written off. For the year ended June 30, 2015, the Company wrote off $12,283 in capitalized patents costs.
Impairment of Long-Lived Assets
Long-lived assets and intangible assets to be held and used are reviewed for impairment whenever events or changes in circumstances indicate that the carrying amount of an asset may not be recoverable. The Company evaluates potential impairment by comparing the carrying amount of the assets with the estimated undiscounted future cash flows associated with them. Should the review indicate that an asset is not recoverable, the Company’s carrying value of the asset would be reduced by the estimated shortfall to fair value.
Fair Value of Financial Instruments and Certain Other Assets and Liabilities
The Company follows the guidance of U.S. GAAP with respect to assets and liabilities that are measured at fair value. U.S. GAAP establishes a three-tier fair value hierarchy, which prioritizes the inputs used in measuring fair value as follows:
| · | Level 1: Observable inputs such as quoted prices in active markets; |
| · | Level 2: Inputs, other than the quoted prices in active markets, that are observable either directly or indirectly; and |
| · | Level 3: Unobservable inputs in which there is little or no market data, which require the reporting entity to develop its own assumptions |
The Company’s financial instruments consist of cash, accounts receivable, accounts payable and accrued expenses and debt. The carrying amount approximates fair value because of the short-term nature of these items.
Other than derivative liabilities, the Company did not have any assets or liabilities that are measured at fair value on a recurring or nonrecurring basis during the years ended June 30, 2015 and December 31, 2013, and the six months ended June 30, 2014.
Derivative Liabilities
A derivative is an instrument whose value is “derived” from an underlying instrument or index such as a future, forward, swap, option contract, or other financial instrument with similar characteristics, including certain derivative instruments embedded in other contracts and for hedging activities. As a matter of policy, we do not invest in separable financial derivatives or engage in hedging transactions. However, we have entered into certain financing transactions that involve financial equity instruments containing certain features that have resulted in the instruments being deemed derivatives. We may engage in other similar complex financing transactions in the future, but not with the intention to enter into derivative instruments. Derivatives are measured at fair value using the Monte Carlo simulation pricing model and marked to market through earnings. However, such new and/or complex instruments may have immature or limited markets. As a result, the pricing models used for valuation of derivatives often incorporate significant estimates and assumptions. Changes in these subjective assumptions can materially affect the estimate of the fair value of derivative liabilities and, consequently, the related amount recognized as loss due to change in fair value of derivative liabilities on the consolidated statement of operations. Furthermore, depending on the terms of a derivative, the valuation of derivatives may be removed from the financial statements upon exercise or conversion of the underlying instrument into some other security. The classification of a derivative instrument is reassessed at each balance sheet date. If the classification changes as a result of events during a reporting period, the instrument is reclassified as of the date of the event that caused the reclassification. There is no limit on the number of times a contract may be reclassified.
Research and Development Costs
Research and development costs are expensed as incurred. Costs incurred for research and development for new or improved processes to produce nanopowders as well as end use applications for the nanopowders are expensed until the production process or applications have been determined to be commercially viable. Costs incurred after the production process is viable and a working model of the equipment has been completed will be capitalized as long-lived assets.
Page 9 |
QUANTUMSPHERE, INC. NOTES TO FINANCIAL STATEMENTS For the Year Ended June 30, 2015, the Six Months Ended June 30, 2014 and the Year Ended December 31, 2013
|
2. SUMMARY OF SIGNIFICANT ACCOUNTING POLICIES (continued)
Income Taxes
Deferred income taxes are recognized for the tax consequences in future years of differences between the tax basis of assets and liabilities and their financial reporting amounts at each period end based on enacted tax laws and statutory tax rates applicable to the periods in which the differences are expected to affect taxable income. Valuation allowances are established, when necessary, to reduce deferred tax assets to the amount expected to be realized. The provision for income taxes represents the tax payable for the period, if any, and the change during the period in deferred tax assets and liabilities.
The Company provides for tax contingencies, if any, for federal, state and local exposures relating to audit results, tax planning initiatives and compliance responsibilities. The development of these reserves requires judgments about tax issues, potential outcomes and timing. Although the outcome of such matters is uncertain, in management’s opinion adequate provisions for income taxes have been made for potential liabilities emanating from these reviews. If actual outcomes differ materially from these estimates, they could have a material impact on the Company’s results.
Loss Per Share
The Company calculates basic loss per share by dividing the net loss attributable to common stockholders by the weighted-average number of common shares outstanding. Diluted loss per share is computed similar to basic loss per share, except that the denominator is increased to include the number of additional common shares that would have been outstanding if such additional common shares had been issued and were dilutive.
Potential common shares, consisting of options and warrants, totaling 12,921,728, 13,629,643, and 10,946,415, have been excluded from the computations of diluted net loss per share because the effect would have been anti-dilutive for the year ended June 30, 2015, the six months ended June 30, 2014, and the year ended December 31, 2013, respectively.
Stock-Based Compensation
The Company measures all employee stock-based compensation awards using the Black-Scholes-Merton valuation model and allocates the related expense over the requisite service period. The expected volatility is based on the historical volatility of the Company’s stock as determined by its private placement offerings; the expected life of the award is determined using the simplified method.
The Company accounts for nonemployee stock-based transactions using the fair value of the consideration received (i.e. the value of the goods or services) or the fair value of the equity instruments issued, whichever is more reliably measurable.
Reclassifications
The Company has reclassified certain prior period amounts to conform with current period presentation, in particular with regard to enhanced allocation of research and development costs that were previously classified as cost of goods sold.
Risks and Uncertainties
The Company faces risks and uncertainties relating to its ability to successfully implement and fulfill its strategy. Among other things, these risks include the ability to obtain revenues; manage operations; competition; attract, retain and motivate qualified personnel; maintain and develop new strategic relationships; and the ability to anticipate and adapt to the changing nanotechnology market and any changes in government regulations.
Page 10 |
QUANTUMSPHERE, INC. NOTES TO FINANCIAL STATEMENTS For the Year Ended June 30, 2015, the Six Months Ended June 30, 2014 and the Year Ended December 31, 2013
|
2. SUMMARY OF SIGNIFICANT ACCOUNTING POLICIES (continued)
Therefore, the Company may be subject to the risks of delays in consummating contracts with customers and suppliers, raising sufficient capital to achieve its objectives and other uncertainties, including financial, operational, technological, regulatory and other risks associated with an emerging business, including the potential risks of business failure. Technology and manufacturing companies with whom the Company is expected to compete, in general, are well capitalized. The Company is competing against entities with the financial and intellectual resources and expressed intent of performing rapid technological innovation. The Company’s resources are limited and must be allocated to focused objectives in order to succeed.
Recent Accounting Pronouncements
In August 2014, the FASB issued ASU 2014-15, “Presentation of Financial Statements-Going Concern (Subtopic 205-40).” This ASU provides guidance to determine when and how to disclose going-concern uncertainties in the financial statements. The new standard requires management to assess an entity’s ability to continue as a going concern, and to provide related footnote disclosure in certain circumstances. ASU 2014-15 will be effective for all entities in the first annual period ending after December 15, 2016. Earlier adoption is permitted. ASU 2014-15 will be effective for the Company beginning June 30, 2017. The Company does not believe that this pronouncement will have an impact on its consolidated financial statements.
In May 2014, the FASB issued ASU 2014-09, “Revenue from Contracts with Customers (Topic 606),” which is the new comprehensive revenue recognition standard that will supersede all existing revenue recognition guidance under U.S. GAAP. The standard’s core principle is that a company will recognize revenue when it transfers promised goods or services to a customer in an amount that reflects the consideration to which the company expects to be entitled in exchange for those goods or services. In July 2015, the FASB voted to defer the effective date by one year to December 15, 2017 for interim and annual reporting periods beginning after that date and permitted early adoption of the standard, but not before the original effective date of December 15, 2016. The Company is currently evaluating the impact of adopting this guidance.
Going Concern
The Company has incurred recurring losses from operations from inception and has limited working capital. As of June 30, 2015, the Company had an accumulated deficit of approximately $42 million. The Company’s activities will necessitate significant uses of working capital beyond fiscal 2015. Additionally, the Company’s capital requirements will depend on many factors, including the success of its continued research and development efforts and the status of competitive products. The Company plans to continue financing its operations with cash received from financing activities. Management is currently working on securing additional debt capital from financing activities to sustain operations until the Company is able to generate sufficient cash flows from operations. There is no assurance that the Company will be able to raise sufficient capital to continue operations and, if available, on terms satisfactory to the Company. The Company currently has sufficient cash for operations through November 2015.
3. SELECTED FINANCIAL STATEMENT CAPTIONS
Property and equipment as of June 30, 2015 and 2014 consisted of the following:
| June 30, 2015 | June 30, 2014 | |||||||
| Production equipment | $ | 1,948,794 | $ | 1,775,638 | ||||
| Computer equipment and software | 57,864 | 53,203 | ||||||
| Office furniture and equipment | 11,972 | 8,751 | ||||||
| Leasehold improvements | 11,842 | 5,609 | ||||||
| Scientific equipment | 61,284 | 55,077 | ||||||
| Lab furniture and fixtures | 41,942 | 52,655 | ||||||
| 2,133,698 | 1,950,933 | |||||||
| Accumulated depreciation and amortization | (787,352 | ) | (417,345 | ) | ||||
| $ | 1,346,346 | $ | 1,533,588 | |||||
Page 11 |
| QUANTUMSPHERE, INC. |
| NOTES TO FINANCIAL STATEMENTS |
| For the Year Ended June 30, 2015, the Six Months Ended June 30, 2014 and the Year Ended December 31, 2013 |
| 3. | SELECTED FINANCIAL STATEMENT CAPTIONS (continued) |
Accounts payable and accrued expenses as of June 30, 2015 and 2014 consisted of the following:
| June 30, 2015 | June 30, 2014 | |||||||
| Stock cancellation liability (Note 6) | $ | 239,392 | $ | 351,276 | ||||
| Accounts payable | 66,482 | 61,623 | ||||||
| Other accrued professional fees | 22,666 | 30,683 | ||||||
| Accrued compensation and related expenses | 87,581 | 23,747 | ||||||
| Accrued legal | — | 18,493 | ||||||
| Accrued interest | 4,817 | — | ||||||
| Other accrued expenses | 4,644 | 15,229 | ||||||
| $ | 425,582 | $ | 501,051 | |||||
| 4. | NOTE PAYABLE |
On June 19, 2014, the Company signed a loan and security agreement with Novus Capital Group that provides up to two loans, each in the amount of $500,000. The initial loan of $500,000 was funded on June 19, 2014. The Company did not meet the additional equity requirement for funding of the second loan of $500,000. The loans accrue at an annual rate of 15.5%, have a term of thirty-six months, and monthly payments on each loan are $17,455, beginning August 10, 2014 for the initial loan. The agreement includes a warrant to purchase 30,000 shares of common stock at an exercise price of $2.00 per share that expires July 1, 2019; 20,000 warrants vested upon the initial funding of $500,000, and 10,000 warrants vest upon the second funding of $500,000. The initial vested warrants were valued at approximately $11,000, using the Black Scholes Merton option pricing model, and recorded as a discount to the note payable.
On June 5, 2015, the Company signed a loan and security agreement with Novus Capital Group that provides an additional loan in the amount of $127,500. The loan accrues at an annual rate of 15.5%, has a term of thirty-six months, and monthly payments are $4,451, beginning July 10, 2015. The agreement includes a warrant to purchase 2,555 shares of common stock at an exercise price of $2.00 per share that expires June 30, 2020. The vested warrants were valued at approximately $1,745, using the Black Scholes Merton option pricing model, and recorded as a discount to the note payable.
The two loans with Novus Capital Group are secured by substantially all of the Company’s assets.
| 5. | CONVERTIBLE NOTES PAYABLE |
| Page 12 |
| QUANTUMSPHERE, INC. |
| NOTES TO FINANCIAL STATEMENTS |
| For the Year Ended June 30, 2015, the Six Months Ended June 30, 2014 and the Year Ended December 31, 2013 |
In May 2015, the Company issued convertible promissory notes (“Series O Notes”) totaling $510,000. The Series O Notes bear interest at the rate of 10% per annum, with a default rate of 18% per annum. The Series O Notes will mature upon the earlier of (i) one year from the date of the issuance of the notes, or (ii) closing of an equity financing of Four Million Dollars or more (Qualifying Equity Financing”). All outstanding principal and accrued interest under the Notes will be automatically converted into shares of common stock at the closing of a Qualifying Equity Offering based upon a conversion price equal to the lesser of (i) a twenty percent (20.0%) discount to the price per share of common stock of the Qualifying Equity Financing, or (ii) a twenty percent (20.0%) discount to the closing bid price of the Company’s common stock on the Closing Date. Alternatively, the outstanding principal and accrued interest may be voluntarily converted, at the sole discretion of the Lender, at any time prior to the close of the Qualifying Equity Offering, in whole or in part, at a conversion price per share equal to a twenty percent (20.0%) discount to the closing bid price of the Company’s common stock. In connection with the Series O Notes, the Company also issued Warrants equal to 50% of the face value of the Series O Notes based upon an exercise price equal to the lesser of (i) a twenty percent (20.0%) discount to the price per share of common stock of a Qualifying Equity Financing, or (ii) a twenty percent (20.0%) discount to the closing bid price of the Company’s common stock on the Closing Date. The Warrants shall be exercisable for a period of five (5) years. For the tables below for outstanding and exercisable warrants, the exercise price of the warrants has been set at $1.60 as this represents a 20% discount to the closing bid price of $2.00 on May 28, 2015, the closing date for the notes payable. As a Qualifying Equity Financing has not yet occurred, the total number of warrants to be issued was not yet fixed. Due to the price protection features of the convertible note as well as the variable number of warrants that can be issued in connection with these notes, both the embedded conversion feature and the warrants were considered to be derivative liabilities. As such, the Company allocated the entire face amount of the notes as a debt discount and amortized the discount using the effective interest method. As of June 30, 2015, the unamortized discount on the notes was approximately $472,000.
| Page 13 |
| QUANTUMSPHERE, INC. |
| NOTES TO FINANCIAL STATEMENTS |
| For the Year Ended June 30, 2015, the Six Months Ended June 30, 2014 and the Year Ended December 31, 2013 |
| 6. | STOCKHOLDERS’ EQUITY (DEFICIT) |
Common Stock
In early April 2014, the Company executed a 10,000 for 1 reverse split. As a result of the reverse split, the Company cancelled and repurchased fractional shares comprising approximately 585,000 shares of common stock for $2.00 per share. Shortly after the reverse split, the Company executed a 1 for 10,000 forward split. As of June 30, 2015, the Company had approximately $239,000 of unredeemed cancelled fractional shares, which are classified as accrued liabilities.
Stock Options
In 2004, the Company adopted the 2004 Stock Option and Incentive Plan (the “2004 Plan”) for directors, employees, consultants and other persons acting on behalf of the Company.
Options granted under the 2004 Plan vest on the date of grant, over a fixed period of time, or upon the occurrence of certain events and are exercisable for up to ten years. As of June 30, 2015, the total shares authorized for issuance were 7,500,000 shares of common stock. As of June 30, 2015, there were 1,056,006 shares of common stock available for grant under the 2004 Plan.
During the year ended June 30, 2015, 870,000 options were exercised at a price of $1.00 per share and 6,667 options were exercised at a price of $1.50 per share.
During the year ended June 30, 2015, the Company issued to employees, officers, directors, advisory board and consultants options to purchase 570,000 shares of common stock, which are exercisable at a price of $2.00 per share (the “2015 Options”).
During the six months ended June 30, 2014, the Company issued to employees, officers, directors, advisory board and consultants options to purchase 161,000 shares of common stock, which are exercisable at a price of $2.00 per share, collectively (the “2014 Options”).
During the year ended December 31, 2013, the Company issued to employees, officers, directors, advisory board and consultants options to purchase 2,170,540 shares of common stock, which are exercisable at a price ranging from $1.30 to $1.80 per share, collectively (the “2013 Options”). As payment for a portion of accrued compensation of approximately $729,000 to consultants, 560,541 of the 2013 Options were issued. Of the 2,170,540 options granted, 200,000 options were granted each to three employees. 50,000 each vest over thirty-six months and the balance vest 50,000 each upon certain milestones being met. As of June 30, 2015, vesting milestone has been met for 50,000 additional options each (for achieving $3.0 million additional equity), leaving 100,000 each for which certain milestones have not yet been met (50,000 upon a profitable quarter, 50,000 upon $10.0 million in annual revenue).
| Page 14 |
| QUANTUMSPHERE, INC. |
| NOTES TO FINANCIAL STATEMENTS |
| For the Year Ended June 30, 2015, the Six Months Ended June 30, 2014 and the Year Ended December 31, 2013 |
The fair value of stock options granted were estimated on their respective grant dates using the Black-Scholes-Merton option pricing model and the following assumptions for the year ended June 30, 2015, the six months ended June 30, 2014 and the year ended December 31, 2013:
| Year
ended June 30, 2015 |
Six
Months ended June 30, 2014 |
Year
ended December 31, 2013 | ||||
| Risk free interest rate | 0.9% - 1.8% | 0.8% - 1.7% | 1.0% - 1.4% | |||
| Expected term | 3 - 6 years | 3 - 6 years | 6 years | |||
| Expected volatility | 44.2% - 52.1% | 44.5% - 44.9% | 45.1% - 45.5% | |||
| Dividend yield | — | — | — |
Stock compensation expense related to options was $729,000, $544,000, and $1,044,000 for the year ended June 30, 2015, the six months ended June 30, 2014, and the year ended December 31, 2013, respectively. Unrecognized compensation costs related to non-vested stock options was $266,000 as of June 30, 2015. The related cost is expected to be recognized over the remaining weighted-average vesting period of 1.0 years.
| Page 15 |
| QUANTUMSPHERE, INC. |
| NOTES TO FINANCIAL STATEMENTS |
| For the Year Ended June 30, 2015, the Six Months Ended June 30, 2014 and the Year Ended December 31, 2013 |
| 6. | STOCKHOLDERS’ EQUITY (DEFICIT) (continued) |
Stock Options (continued)
A summary of the status of the options granted is as follows:
| Shares | Weighted- Average Exercise Price | Average Remaining Contractual Term (Years) | ||||||||||
| Outstanding – December 31, 2012 | 3,834,204 | $1.48 | ||||||||||
| Granted | 2,170,540 | $1.50 | ||||||||||
| Forfeited or expired | (30,000 | ) | $1.45 | |||||||||
| Outstanding – December 31, 2013 | 5,974,744 | $1.47 | 6.6 | |||||||||
| Granted | 161,000 | $2.00 | ||||||||||
| Forfeited or expired | (47,666 | ) | $1.46 | |||||||||
| Outstanding – June 30, 2014 | 6,088,078 | $1.48 | 6.3 | |||||||||
| Granted | 570,000 | $2.00 | ||||||||||
| Exercised | (876,667 | ) | $1.00 | |||||||||
| Forfeited or expired | (214,584 | ) | $1.74 | |||||||||
| Outstanding – June 30, 2015 | 5,566,827 | $1.53 | 6.0 | |||||||||
| Exercisable: | ||||||||||||
| June 30, 2014 | 4,639,173 | $1.46 | 5.4 | |||||||||
| June 30, 2015 | 4,774,101 | $1.52 | 5.6 |
A summary of the status of the Company’s nonvested options and changes are presented below:
| Shares | Weighted- Average Grant-Date Fair Value | |||||||
| Nonvested - December 31, 2012 | 600,295 | $0.68 | ||||||
| Granted | 2,170,540 | $0.82 | ||||||
| Vested | (1,107,139 | ) | $1.00 | |||||
| Nonvested - December 31, 2013 | 1,663,696 | $0.65 | ||||||
| Granted | 161,000 | $0.60 | ||||||
| Forfeited or expired | (15,826 | ) | $0.55 | |||||
| Vested | (359,965 | ) | $0.59 | |||||
| Nonvested – June 30, 2014 | 1,448,905 | $0.67 | ||||||
| Granted | 570,000 | $0.59 | ||||||
| Vested | (1,122,984 | ) | $0.61 | |||||
| Forfeited or expired | (103,195 | ) | $0.62 | |||||
| Nonvested – June 30, 2015 | 792,726 | $0.71 | ||||||
| Page 16 |
QUANTUMSPHERE, INC.
NOTES TO FINANCIAL STATEMENTS
For the Year Ended June 30, 2015, the Six Months Ended June 30, 2014 and the Year Ended December 31, 2013
6. STOCKHOLDERS’ EQUITY (DEFICIT) (continued)
Stock Options (continued)
The aggregate intrinsic value of vested and exercisable stock options was approximately $9,839,000 and $1,296,000 as of June 30, 2015 and 2014, respectively.
Warrants
During the six months ended June 30, 2014, the Company issued warrants to purchase 250,000 shares of common stock that vested immediately, exercisable for a period of seven years at $2.00 per share to the board of directors of the Company.
During the year ended December 31, 2013, the Company issued warrants to purchase 500,000 shares of common stock, exercisable for a period of seven years at $1.30 per share, to a member of management subject to satisfaction of certain vesting conditions and are exercisable for up to seven years. 125,000 vested immediately and the balance vest 125,000 each upon certain milestones being met. As of June 30, 2015, vesting milestones have been met for 250,000 additional warrants (125,000 for achieving $3.0 million additional equity, 125,000 upon commercial validation of nano iron in China), leaving 125,000 for which the milestone has not yet been met (upon $10.0 million in annual revenue).
The fair value of warrants granted were estimated on their respective grant dates using the Black-Scholes-Merton option pricing model and the following assumptions for the year ended June 30, 2015, the six months ended June 30, 2014, and the year ended December 31, 2013:
| Year ended June 30, 2015 | Six Months ended June 30, 2014 | Year ended December 31, 2013 | |||||||||
| Risk free interest rate | 1.8 | % | 1.8 | % | 1.5 | % | |||||
| Expected term | 5 years | 5 years | 7 years | ||||||||
| Expected volatility | 52.9 | % | 44.9 | % | 45.3 | % | |||||
| Dividend yield | — | — | — | ||||||||
Stock compensation expense related to warrants was $144,000, $17,000 and $87,000 for the year ended June 30, 2015, the six months ended June 30, 2014, and the year ended December 31, 2013, respectively. Unrecognized compensation costs related to non-vested warrants was approximately $2,625,000 as of June 30, 2015. The related cost is expected to be recognized over the remaining weighted-average vesting period of 3.8 years.
The Company also issued warrants in connection with the issuance of notes payable. See Notes 4 and 5.
| Page 17 |
QUANTUMSPHERE, INC.
NOTES TO FINANCIAL STATEMENTS
For the Year Ended June 30, 2015, the Six Months Ended June 30, 2014 and the Year Ended December 31, 2013
6. STOCKHOLDERS’ EQUITY (DEFICIT) (continued)
Warrants (continued)
A summary of the status of all warrants granted is as follows:
| Shares | Weighted- Average Exercise Price |
Average Remaining Contractual Term (Years) |
||||||||||||
| Outstanding – December 31, 2012 | 6,417,311 | $2.13 | ||||||||||||
| Granted | 1,200,000 | $0.98 | ||||||||||||
| Forfeited | (356,944 | ) | $1.50 | |||||||||||
| Outstanding – December 31, 2013 | 7,260,367 | $1.97 | 3.0 | |||||||||||
| Granted | 6,219,145 | $1.52 | ||||||||||||
| Forfeited | (520,710 | ) | $3.25 | |||||||||||
| Outstanding – June 30, 2014 | 12,958,802 | $1.73 | 3.8 | |||||||||||
| Granted | 321,305 | $1.60 | ||||||||||||
| Forfeited | (1,507,480 | ) | $3.97 | |||||||||||
| Outstanding – June 30, 2015 | 11,772,627 | $1.44 | 3.2 | |||||||||||
| Exercisable: | ||||||||||||||
| June 30, 2014 | 8,990,470 | $1.73 | 3.4 | |||||||||||
| June 30, 2015 | 8,147,627 | $1.41 | 2.9 | |||||||||||
A summary of the status of the Company’s nonvested warrants granted in exchange for services or under compensation arrangements is presented below:
| Shares | Weighted- Average Grant-Date Fair Value |
|||||||||
| Nonvested - December 31, 2012 | 1,022,221 | $0.56 | ||||||||
| Granted | 1,200,000 | $0.98 | ||||||||
| Forfeited | (356,944 | ) | $0.57 | |||||||
| Vested | (1,240,277 | ) | $0.55 | |||||||
| Nonvested - December 31, 2013 | 625,000 | $0.59 | ||||||||
| Granted | 6,219,145 | $0.72 | ||||||||
| Vested | (2,875,813 | ) | $0.70 | |||||||
| Nonvested – June 30, 2014 | 3,968,332 | $0.71 | ||||||||
| Granted | 321,305 | $1.07 | ||||||||
| Forfeited | (10,000 | ) | $0.58 | |||||||
| Vested | (654,637 | ) | $0.56 | |||||||
| Nonvested – June 30, 2015 | 3,625,000 | $0.72 | ||||||||
| Page 18 |
QUANTUMSPHERE, INC.
NOTES TO FINANCIAL STATEMENTS
For the Year Ended June 30, 2015, the Six Months Ended June 30, 2014 and the Year Ended December 31, 2013
6. STOCKHOLDERS’ EQUITY (DEFICIT) (continued)
Warrants (continued)
The aggregate intrinsic value of vested and exercisable warrants was approximately $15,740,000 and $1,892,000 as of June 30, 2015 and 2014, respectively.
7. INCOME TAXES
For the year ended June 30, 2015, the six months ended June 30, 2014 and the year ended December 31, 2013, the provision for income taxes consists entirely of state income taxes.
The following is a reconciliation of the provision for income taxes computed at the statutory federal rate of 34% to the net provision for income taxes for the year ended June 30, 2015, the six months ended June 30, 2014, and the year ended December 31, 2013:
| 2015 | 2014 | 2013 | ||||||||||
| Benefit at statutory rate (34%) | $ | (1,805,000 | ) | $ | (913,000 | ) | $ | (914,000 | ) | |||
| State tax benefit, net of federal tax benefit | (224,000 | ) | (124,000 | ) | (115,000 | ) | ||||||
| Stock based compensation and other | 378,000 | 192,000 | 240,000 | |||||||||
| Change in valuation allowance | 1,651,800 | 845,800 | 789,800 | |||||||||
| Net provision for income taxes | $ | 800 | $ | 800 | $ | 800 |
Significant components of deferred tax assets and liabilities at June 30, 2015 and June 30, 2014 and consist of tax net operating loss carryforwards offset by full valuation allowances on deferred tax assets. Management believes that, based on a number of factors, including the available objective evidence it is more likely than not that deferred tax assets will not be realized. The ultimate realization of deferred tax assets is dependent upon the generation of future taxable income during periods in which those temporary differences become deductible.
As of June 30, 2015 and June 30, 2014, the Company’s deferred tax assets were primarily comprised of net operating losses totaling approximately $11,247,000 and $9,800,000, respectively. As of June 30, 2015, the Company had federal and state tax net operating loss carryforwards of approximately $28,528,000 and $26,636,000, respectively. If unused, the federal and state net operating losses begin to expire in 2025 and 2015, respectively. Utilization of the net operating loss carryforwards may be subject to a substantial annual limitation due to ownership change limitations that may have occurred or that could occur in the future, as required by Section 382 of the Internal Revenue Code of 1986, as amended, as well as similar state provisions. The Company has not completed a study to assess whether an ownership change has occurred or whether there have been multiple ownership changes since the Company’s formation due to the complexity and cost associated with such a study, and the fact that there may be additional such ownership changes in the future.
| Page 19 |
QUANTUMSPHERE, INC.
NOTES TO FINANCIAL STATEMENTS
For the Year Ended June 30, 2015, the Six Months Ended June 30, 2014 and the Year Ended December 31, 2013
7. INCOME TAXES (continued)
The Company does not believe it has any uncertain income tax positions that could materially affect its financial statements. The Company’s federal and state income tax returns remain open to agency examination for the standard statute length of time after filing.
8. COMMITMENTS AND CONTINGENCIES
The Company has noncancelable operating lease commitments for equipment through December 2016 and real property through February 2017. Rent expense under operating leases is recognized on the straight-line basis over the term of the leases. Rent expense for the year ended June 30, 2015, the six months ended June 30, 2014 and the year ended December 31, 2013 were approximately $105,000, $42,000 and $104,000, respectively.
Future minimum lease payments under operating leases approximate the following for the fiscal years ending June 30:
| 2016 | $ | 105,000 | ||||
| 2017 | 71,000 | |||||
| $ | 176,000 |
9. CONCENTRATIONS
For the twelve months ended June 30, 2015, 36% of net sales were to South Korea and 13% of net sales were to Canada. For the six months ended June 30, 2014, 44% of net sales were to South Korea and 17% of net sales were to Japan. For the year ended December 31, 2013, 65% of net sales were to Israel. For the year ended June 30, 2015, 30% of net sales were to one customer. For the six months ended June 30, 2014, 56% of net sales were to two customers. For the year ended December 31, 2013, 65%, of net sales were to one customer. No other significant customers or foreign sales were noted during the year ended June 30, 2015, the six months ended June 30, 2014, or the year ended December 31, 2013.
| Page 20 |
QUANTUMSPHERE, INC.
NOTES TO FINANCIAL STATEMENTS
For the Year Ended June 30, 2015, the Six Months Ended June 30, 2014 and the Year Ended December 31, 2013
10. COMPARABLE YEAR INFORMATION (UNAUDITED)
The Company’s condensed statement of operations was as follows for the twelve months ended June 30, 2014:
| Net Sales | $ | 176,382 | ||
| Cost of Sales | 55,594 | |||
| Gross Profit | 120,788 | |||
| Operating Expenses | ||||
| Research and development | 1,365,111 | |||
| Selling, marketing and advertising | 46,313 | |||
| General and administrative | 2,563,441 | |||
| Total Operating Expenses | 3,974,865 | |||
| Loss from Operations | (3,854,077 | ) | ||
| Other Income (Expense) | (505,611 | ) | ||
| Net Loss | $ | (4,359,688 | ) | |
| Basic and Diluted Loss Per Common Share | $ | (0.34 | ) | |
| Basic and Diluted Weighted-Average Common Shares Outstanding | 12,997,474 |
Potential common shares, consisting of options and warrants, totaling 13,629,643 have been excluded from the computations of diluted net loss per share because the effect would have been anti-dilutive.
11. SUBSEQUENT EVENTS (UNAUDITED)
The Company has evaluated subsequent events from June 30, 2015 through the date the accompanying financial statements were filed with the Securities and Exchange Commission.
In September 2015, the Company issued $325,000 in unsecured notes. The notes mature in six months and have warrants attached. See the 8-K filed September 21, 2015 for further discussion of such notes.
| Page 21 |
EXHIBIT INDEX
| Exhibit Number |
Description | |
| 2.1 | Agreement and Plan of Merger dated November 15, 2013. (6)(*) | |
| 2.2 | Amended and Restated Agreement and Plan of Merger dated April 22, 2014. (6)(*) | |
| 3.1 | Articles of Incorporation, as filed with the Nevada Secretary of State on December 1, 2005. (1) | |
| 3.2 | Certificate of Amendment to Articles of Incorporation, as filed with the Nevada Secretary of State on June 7, 2011. (4) | |
| 3.3 | Bylaws. (1) | |
| 3.4 | Amended and Restated Bylaws dated April 22, 2014. (3) | |
| 3.5 | Articles of Merger dated April 25, 2014, as filed with the Nevada Secretary of State on April 25, 2014. (3) | |
| 10.1 | Form of Convertible Promissory Note. (3) | |
| 10.2 | Form of Amended & Restated Convertible Promissory Note. (3) | |
| 10.3 | Form of 15% Secured Convertible Promissory Note. (3) | |
| 10.4 | Form of Warrant Agreement. (3) | |
| 10.5 | Form of Registration Rights Agreement. (3) | |
| 10.6 | Standard Industrial/Commercial Single Tenant Lease Agreement dated February 20, 2014 by and between Winchester Equity Group, LLC, and QuantumSphere, Inc. (3) | |
| 10.7 | Form of Executive Employment Agreement. (3) | |
| 10.8 | Form of Indemnification Agreement. (3) | |
| 10.9 | 2014 Equity Incentive Plan. (3) | |
| 10.10 | Form of 2014 Equity Incentive Plan Award Agreement. (3) | |
| 10.11 | Form of Consulting Agreement. (3) | |
| 10.12 | Executive Employment Agreement dated March 17, 2014 by and between QuantumSphere, Inc. and Kevin D. Maloney. (4) | |
| 10.13 | Executive Employment Agreement dated March 17, 2014 by and between QuantumSphere, Inc. and R. Douglas Carpenter. (4) | |
| 10.14 | Executive Employment Agreement dated March 17, 2014 by and between QuantumSphere, Inc. and Gregory L. Hrncir. (4) | |
| 10.15 | Executive Employment Agreement dated March 17, 2014 by and between QuantumSphere, Inc. and Tom Candelaria. (4) | |
| 10.16 | Agency Agreement dated April 8, 2013 by and between QuantumSphere, Inc. and Beijing LuckyStar Co. Ltd.. (4) | |
| 10.17 | Addendum No. 1 to Agency Agreement dated December 23, 2013 by and between QuantumSphere, Inc. and Beijing LuckyStar Co. Ltd.. (4) | |
| 10.18 | Raw Material Supply Agreement by and between QuantumSphere, Inc. and Freeport Cobalt Americas LLC. (4) |
| -47- |
| Exhibit Number |
Description | |
| 10.19 | Strategic Alliance Agreement by and between QuantumSphere, Inc. and Freeport Cobalt Americas LLC. (4) | |
| 10.20 | Loan and Security Agreement by and between QuantumSphere, Inc. and Novus Capital Group, LLC. (5) | |
| 10.21 | Form of Note Purchase Agreement (7) | |
| 10.22 | Form of 10% Subordinated Convertible Promissory Note (7) | |
| 10.23 | Form of Common Stock Purchase Warrant (7) | |
| 10.24 | Form of Security Agreement (7) | |
| 10.25 | Form of Registration Rights Agreement (7) | |
| 10.26 | Form of Note Purchase Agreement (8) | |
| 10.27 | Form of Promissory Note (8) | |
| 10.28 | Form of Common Stock Purchase Warrant (8) | |
| 10.29 | Form of Registration Rights Agreement (8) | |
| 16.1 | [Letter from HJ & Associates, L.L.C. to the Securities and Exchange Commission dated April 28, 2014. (2)] | |
| 17 | Letter of resignation from Richard J. Berman (9) | |
| 31.1 | Certification of Chief Executive Officer pursuant to Rule 13a-14(a)/15d-14(a), filed herewith. | |
| 31.2 | Certification of Chief Financial Officer Certification pursuant to Rule 13a-14(a)/15d-14(a), filed herewith. | |
| 32.1 | Certification of Chief Executive Officer pursuant to 18 U.S.C. Section 1350, as adopted pursuant to Section 906 of the Sarbanes-Oxley Act of 2002. (Filed herewith). | |
| 32.2 | Certification of Chief Financial Officer pursuant to 18 U.S.C. Section 1350, as adopted pursuant to Section 906 of the Sarbanes-Oxley Act of 2002. (Filed herewith). | |
| 101.INS | XBRL Instance Document. ** | |
| 101.SCH | XBRL Taxonomy Extension Schema Document. ** | |
| 101.CAL | Taxonomy Extension Calculation Linkbase Document ** | |
| 101.LAB | XBRL Taxonomy Extension Label Linkbase Document. ** | |
| 101.PRE | XBRL Taxonomy Extension Presentation Linkbase Document. ** | |
| 101.DEF | XBRL Taxonomy Extension Definition Linkbase Document. ** |
| (1) | Previously filed with the Registrant’s Form 10SB12G filed on March 23, 2010. | |
| (2) | Previously filed with the Registrant’s Form 8-K filed on November 20, 2013. | |
| (3) | Previously filed with the Registrant’s Form 8-K filed on April 28, 2014. |
| -48- |
| (4) | Previously filed with the Registrant’s Form 8-K/A filed on June 16, 2014. | |
| (5) | Previously filed with the Registrant’s Form 8-K filed on June 23, 2014. | |
| (6) | Previously filed with the Registrant’s Form 8-K/A filed on July 9, 2014. | |
| (7) | Previously filed with the Registrant’s Form 8-K filed on June 1, 2015. | |
| (8) | Previously filed with the Registrant’s Form 8-K filed on September 21, 2015. | |
| (9) | Previously filed with the Registrant’s Form 8-K filed on August 8, 2014 | |
| (*) | Schedules and exhibits have been omitted pursuant to Item 601(b)(2) of Regulation S-K. The Registrant hereby undertakes to furnish supplementally copies of any of the omitted schedules upon request by the Securities and Exchange Commission; provided, however, the Registrant may request confidential treatment pursuant to Rule 24b-2 of the Securities Exchange Act of 1934, as amended, for any schedule or exhibit so furnished. | |
| (**) | Furnished herewith. In accordance with Rule 406T of Regulation S-T, the information in these exhibits shall not be deemed to be “filed” for purposes of Section 18 of the Securities Exchange Act of 1934, as amended, or otherwise subject to liability under that section, and shall not be incorporated by reference into any registration statement or other document filed under the Securities Act of 1933, as amended, except as expressly set forth by specific reference in such filing. |
| -49- |