Attached files
| file | filename |
|---|---|
| EX-10.2 - EX-10.2 - Multi Packaging Solutions International Ltd | d945269dex102.htm |
| EX-10.8 - EX-10.8 - Multi Packaging Solutions International Ltd | d945269dex108.htm |
| EX-23.3 - EX-23.3 - Multi Packaging Solutions International Ltd | d945269dex233.htm |
| EX-10.5 - EX-10.5 - Multi Packaging Solutions International Ltd | d945269dex105.htm |
| EX-23.4 - EX-23.4 - Multi Packaging Solutions International Ltd | d945269dex234.htm |
| EX-23.9 - EX-23.9 - Multi Packaging Solutions International Ltd | d945269dex239.htm |
| EX-5.1 - EX-5.1 - Multi Packaging Solutions International Ltd | d945269dex51.htm |
| EX-23.2 - EX-23.2 - Multi Packaging Solutions International Ltd | d945269dex232.htm |
| EX-10.4 - EX-10.4 - Multi Packaging Solutions International Ltd | d945269dex104.htm |
| EX-10.3 - EX-10.3 - Multi Packaging Solutions International Ltd | d945269dex103.htm |
| EX-23.8 - EX-23.8 - Multi Packaging Solutions International Ltd | d945269dex238.htm |
| EX-23.5 - EX-23.5 - Multi Packaging Solutions International Ltd | d945269dex235.htm |
Table of Contents
As filed with the Securities and Exchange Commission on September 30, 2015
Registration No. 333-205278
UNITED STATES
SECURITIES AND EXCHANGE COMMISSION
Washington, D.C. 20549
AMENDMENT NO. 3
TO
FORM S-1
REGISTRATION STATEMENT
UNDER
THE SECURITIES ACT OF 1933
Multi Packaging Solutions International Limited
(Exact name of registrant as specified in its charter)
| Bermuda | 2759 | 98-1249740 | ||
| (State or other jurisdiction of incorporation or organization) | (Primary Standard Industrial Classification Code Number) | (I.R.S. Employer Identification No.) |
Clarendon House, 2 Church Street
Hamilton HM 11, Bermuda
(441) 295-5950
(Address, including zip code, and telephone number, including area code, of the registrant’s principal executive offices)
William H. Hogan
Executive Vice President and Chief Financial Officer
Multi Packaging Solutions International Limited
150 E 52nd St, 28th Floor
New York, New York 10022
(646) 885-0005
(Name, address, including zip code, and telephone number, including area code, of agent for service)
Copies to:
| Patrick H. Shannon Jason M. Licht Latham & Watkins LLP 555 Eleventh Street, NW Washington, D.C. 20004 (202) 637-2200 |
Marko Zatylny Ropes & Gray LLP 800 Boylston Street Boston, MA 02199-3600 (617) 951-7000 |
Approximate date of commencement of proposed sale to the public: As soon as practicable after the effective date of this registration statement.
If any of the securities being registered on this form are to be offered on a delayed or continuous basis pursuant to Rule 415 under the Securities Act of 1933, check the following box. ¨
If this form is filed to register additional securities for an offering pursuant to Rule 462(b) under the Securities Act, check the following box and list the Securities Act registration statement number of the earlier effective registration statement for the same offering. ¨
If this form is a post-effective amendment filed pursuant to Rule 462(c) under the Securities Act, check the following box and list the Securities Act registration statement number of the earlier effective registration statement for the same offering. ¨
If this form is a post-effective amendment filed pursuant to Rule 462(d) under the Securities Act, check the following box and list the Securities Act registration statement number of the earlier effective registration statement for the same offering. ¨
Indicate by check mark whether the registrant is a large accelerated filer, an accelerated filer, a non-accelerated filer, or a smaller reporting company. See definitions of “large accelerated filer,” “accelerated filer,” and “smaller reporting company” in Rule 12b-2 of the Exchange Act. (Check one):
| Large accelerated filer | ¨ | Accelerated filer | ¨ | |||
| Non-accelerated filer | x | Smaller reporting company | ¨ | |||
The registrant hereby amends this registration statement on such date or dates as may be necessary to delay its effective date until the registrant shall file a further amendment that specifically states that this registration statement shall thereafter become effective in accordance with Section 8(a) of the Securities Act of 1933 or until this registration statement shall become effective on such date as the Commission, acting pursuant to said Section 8(a), may determine.
Table of Contents
The information in this preliminary prospectus is not complete and may be changed. Neither we nor the selling shareholders may sell these securities until the registration statement filed with the Securities and Exchange Commission is effective. This preliminary prospectus is not an offer to sell these securities and it is not soliciting an offer to buy these securities in any state where the offer or sale is not permitted.
Subject to Completion
Preliminary Prospectus dated September 30, 2015
PROSPECTUS
Shares

Multi Packaging Solutions International Limited
Common Shares
This is Multi Packaging Solutions International Limited’s initial public offering. We are selling common shares in this offering. The selling shareholders named in this prospectus, including investment funds controlled by The Carlyle Group (“Carlyle”) and Madison Dearborn Partners, LLC (“Madison Dearborn” and, together with Carlyle, the “Sponsors”), are selling common shares in this offering.
We expect the public offering price to be between $ and $ per share. Currently, no public market exists for our common shares. We have applied for listing of our common shares on the New York Stock Exchange (the “NYSE”) under the symbol “MPSX”.
We are an “emerging growth company” as defined by the Jumpstart Our Business Startups Act of 2012 and, as such, we have elected to comply with certain reduced public company reporting requirements for this prospectus and future filings.
Investing in the common shares involves risks that are described in the “Risk Factors” section beginning on page 25 of this prospectus.
| Per Share |
Total | |||||||
| Public offering price |
$ | $ | ||||||
| Underwriting discount (1) |
$ | $ | ||||||
| Proceeds, before expenses, to us |
$ | $ | ||||||
| Proceeds to selling shareholders |
$ | $ | ||||||
| (1) | We have agreed to reimburse the underwriters for certain expenses in connection with this offering. See the section entitled “Underwriting” for additional information regarding underwriting compensation. |
The underwriters may also purchase up to an additional common shares from the selling shareholders at the public offering price, less the underwriting discount, within 30 days from the date of this prospectus. We will not receive any of the proceeds from the sale of common shares by the selling shareholders in this offering, including from any exercise by the underwriters of their option to purchase additional common shares.
Neither the Securities and Exchange Commission nor any state securities commission has approved or disapproved of these securities or determined if this prospectus is truthful or complete. Any representation to the contrary is a criminal offense.
The common shares will be ready for delivery on or about , 2015.
| BofA Merrill Lynch | Barclays |
Citigroup
| Credit Suisse | Goldman, Sachs & Co. | UBS Investment Bank |
| Baird | BMO Capital Markets |
The date of this prospectus is , 2015.
Table of Contents

Table of Contents
| Page | ||||
| 1 | ||||
| 25 | ||||
| 47 | ||||
| 49 | ||||
| 50 | ||||
| 51 | ||||
| 53 | ||||
| 55 | ||||
| Management’s Discussion and Analysis of Financial Condition and Results of Operations |
57 | |||
| 83 | ||||
| 86 | ||||
| 102 | ||||
| 107 | ||||
| 115 | ||||
| 117 | ||||
| 120 | ||||
| 127 | ||||
| 129 | ||||
| 135 | ||||
| 139 | ||||
| 147 | ||||
| 147 | ||||
| 147 | ||||
| 148 | ||||
| F-1 | ||||
We are responsible for the information contained in this prospectus and in any related free-writing prospectus we prepare or authorize. We and the selling shareholders have not authorized anyone to give you any other information, and we and the selling shareholders take no responsibility for any other information that others may give you. We and the selling shareholders are offering to sell, and seeking offers to buy, the common shares only in jurisdictions where offers and sales are permitted.
Common shares may be offered or sold in Bermuda only in compliance with the provisions of the Investment Business Act of 1998, which regulates the sale of securities in Bermuda. Further, the Bermuda Monetary Authority (the “BMA”) must approve all issues and transfers of shares of a Bermuda exempted company under the Exchange Control Act, 1972 and regulations made thereunder. The BMA has given general permission which will permit the issue of the common shares by Multi Packaging Solutions International Limited and the transfer of such common shares among non-residents for Bermuda exchange control purposes so long as voting securities of Multi Packaging Solutions International Limited are admitted for trading on the NYSE or any other appointed stock exchange. In giving such permission, the BMA accepts no responsibility for the financial soundness of any proposal or for the correctness of any statements made or opinions expressed herein.
i
Table of Contents
BASIS OF PRESENTATION AND OTHER INFORMATION
Multi Packaging Solutions International Limited
Unless the context otherwise requires, all references to “MPS Limited,” the “Company,” “we,” “us” and “our” refer to Multi Packaging Solutions International Limited, a Bermuda exempted company incorporated under the laws of Bermuda on June 19, 2015, together with the entities that will become its consolidated subsidiaries prior to completion of this offering contemplated hereby. The entities that will become the consolidated subsidiaries of MPS Limited consist of Multi Packaging Solutions Global Holdings Limited, which we refer to as “MPS Holdings,” and its subsidiaries. Prior to the completion of this offering, MPS Limited will become the direct parent company of MPS Holdings through a series of internal reorganizational transactions. These reorganizational transactions will include the exchanging of shares of MPS Holdings held by investment funds controlled by Madison Dearborn and Carlyle for new shares in MPS Limited. Upon pricing of the offering contemplated hereby, the investment fund controlled by Carlyle that currently directly holds the shares of MPS Holdings (and will hold the common shares of MPS Limited once MPS Limited becomes the direct parent company of MPS Holdings) will be liquidated and the ultimate holder of those shares (after a series of additional upstream liquidations) will be CEP III Chase S.à r.l., Chase Manco, L.P. and certain employees of the Company. We collectively refer to these reorganizational transactions as the “Reorg Transactions.” In connection with the Reorg Transactions, we (through one of our subsidiaries) plan to acquire the noncontrolling interests in one of our German subsidiaries from related parties and we will be required to pay approximately $1.2 million related to German real estate transfer taxes.
As MPS Limited will have no other interest in any operations other than those of MPS Holdings, the historical financial information presented in this prospectus is that of MPS Holdings. With respect to the historical and pro forma financial information and other data presented in this prospectus, including under the headings “Prospectus Summary—Summary Historical Audited Consolidated and Unaudited Pro Forma Combined Financial Information,” “Capitalization,” “Selected Historical Financial Information” and “Management’s Discussion and Analysis of Financial Condition and Results of Operations,” and our financial statements and related notes thereto and our unaudited pro forma combined financial statements appearing elsewhere in this prospectus, all references to the “Company,” “we,” “us” and “our” refer to MPS Holdings, unless the context requires otherwise.
Multi Packaging Solutions Global Holdings Limited
On August 15, 2013, Multi Packaging Solutions, Inc. and its primary shareholder, IPC/Packaging LLC, entered into an Agreement and Plan of Merger to be purchased by Mustang Parent Corp. (“Mustang”), an entity controlled by funds advised by Madison Dearborn. The acquisition of Multi Packaging Solutions, Inc. by Madison Dearborn is referred to as the “Madison Dearborn Transaction.” On November 18, 2013, an investment fund controlled by Madison Dearborn and an investment fund controlled by Carlyle entered into a Combination Agreement, whereby Madison Dearborn contributed 100% of the outstanding equity of Mustang to Chesapeake Finance 2 Limited (“Chesapeake”), in exchange for a 50% equity interest in Chesapeake. The other 50% equity interest in Chesapeake is held by funds advised by Carlyle. The combination transaction between Chesapeake and Mustang was consummated on February 14, 2014 and was accounted for as a reverse acquisition with Chesapeake as the legal acquiror and new parent entity, and Mustang as the legal subsidiary but the accounting acquiror. Subsequently, Chesapeake changed its name to Multi Packaging Solutions Global Holdings Limited.
The financial information prior to the February 14, 2014 completion of the combination reflects that of Mustang and its predecessor.
ii
Table of Contents
MARKET AND INDUSTRY DATA
The market data and other statistical information used throughout this prospectus are based on independent industry publications, reports by market research firms or other published independent sources. Some market data and statistical information are also based on our good faith estimates, which are derived from management’s knowledge of our industry and such independent sources referred to above. Certain market, ranking and industry data included in this prospectus, including the size of certain markets, the market opportunity across our primary addressable markets, and our size or position and the positions of our competitors within these markets, including our services relative to our competitors, are based on estimates of our management. These estimates have been derived from our management’s knowledge and experience in the markets in which we operate, as well as information obtained from surveys, reports by market research firms, our customers, distributors, suppliers, trade and business organizations and other contacts in the markets in which we operate. Unless otherwise noted, all of our market share, market opportunity and market position information presented in this prospectus is an approximation based on management’s knowledge. Our market share and market position in each of our businesses and product groups, unless otherwise noted, is based on our sales relative to the estimated sales in the markets we serve. References herein to our being a leader in a market or product category refer to our belief that we have a leading market share position in each specified market, unless the context otherwise requires. In addition, the discussion herein regarding our various markets is based on how we define the markets for our products, which products may be either part of larger overall markets or markets that include other types of products and services.
Certain monetary amounts, percentages and other figures included in this prospectus have been subject to rounding adjustments. Accordingly, figures shown as totals in certain tables or charts may not be the arithmetic aggregation of the figures that precede them, and figures expressed as percentages in the text may not total 100% or, as applicable, when aggregated may not be the arithmetic aggregation of the percentages that precede them.
TRADEMARKS
We own or otherwise have rights to the trademarks, service marks, copyrights and trade names, including those mentioned in this prospectus, used in conjunction with the marketing and sale of our products and services. This prospectus includes trademarks, which are protected under applicable intellectual property laws and are our property and the property of our subsidiaries. This prospectus also contains trademarks, service marks, copyrights and trade names of other companies, which are the property of their respective owners. We do not intend our use or display of other companies’ trademarks, service marks, copyrights or trade names to imply a relationship with, or endorsement or sponsorship of us by, any other companies. Solely for convenience, our trademarks, service marks, trade names and copyrights referred to in this prospectus may appear without the ®,™ or © symbols, but such references are not intended to indicate, in any way, that we will not assert, to the fullest extent under applicable law, our rights or the right of the applicable licensor to these trademarks, service marks, trade names and copyrights.
iii
Table of Contents
This summary highlights information contained elsewhere in this prospectus. Because this is only a summary, it does not contain all of the information that may be important to you. You should read this entire prospectus and should consider, among other things, the matters set forth under “Risk Factors,” “Selected Historical Financial Information” and “Management’s Discussion and Analysis of Financial Condition and Results of Operations,” and our financial statements and related notes thereto appearing elsewhere in this prospectus before making your investment decision. Unless the context otherwise requires or otherwise provided herein, references herein to the “Company,” “we,” “us,” “our” and “our company” refer to MPS Limited, together with the entities that will become its consolidated subsidiaries prior to the completion of this offering. See “Basis of Presentation and Other Information.” References herein to “fiscal year” refer to our fiscal years, which end on June 30. See “—Summary Historical Audited Consolidated and Unaudited Pro Forma Combined Financial Information.” References herein to the financial measures “EBITDA” and “Adjusted EBITDA” refer to financial measures that do not comply with generally accepted accounting principles in the United States (“U.S. GAAP”). For information about how we calculate EBITDA and Adjusted EBITDA, see footnote 4 to the table under the heading “—Summary Historical Audited Consolidated and Unaudited Pro Forma Combined Financial Information.” References to “pro forma” reflect numbers giving effect to all acquisitions that have been completed through June 30, 2015 as if the relevant acquisitions occurred as of the beginning of the period referenced. References to “acquisition adjusted pro forma net sales” and “acquisition adjusted pro forma Adjusted EBITDA” give effect to net sales and EBITDA, respectively, for BP Media Limited, which was acquired on July 1, 2015. See footnotes 2 and 5 to the table under the heading “—Summary Historical Audited Consolidated and Unaudited Pro Forma Combined Financial Information” for further detail on these metrics.
Company Overview
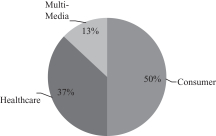
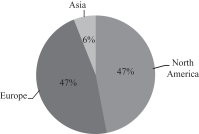
We are a leading, global provider of value-added specialty packaging solutions, based on sales, focused on high complexity products for the consumer, healthcare and multi-media markets. We provide our customers with an extensive array of print-based specialty packaging solutions, including premium folding cartons, inserts, labels and rigid packaging across a variety of substrates and finishes, which are complemented by value-added services, including creative design, new product development and customized supply chain solutions. For the fiscal year ended June 30, 2015, approximately 47%, 47% and 6% of our acquisition adjusted pro forma net sales came from our North American, European and Asian segments, respectively. We believe that our core addressable consumer and healthcare end markets, which account for approximately 87% of our acquisition adjusted pro forma net sales, encompass attractive, resilient and growing packaging categories, and we believe we are a leader in these end markets across North America and Europe based on sales. Additionally, we believe we have a market-leading position in the multi-media specialty packaging sector based on sales, which accounts for 13% of our acquisition adjusted pro forma global net sales. For the fiscal year ended June 30, 2015, acquisition adjusted pro forma net sales and acquisition adjusted pro forma Adjusted EBITDA were $1,830.4 million and $246.1 million, respectively.
Based on management estimates, we believe the market opportunity across our primary addressable markets is currently in excess of $17 billion of annual sales. We believe we are market leaders in a fragmented industry as we are one of the few large scale participants serving our addressable markets on a global basis. Competition in our addressable markets is based on stringent quality specifications, significant customer service standards and meaningful investment requirements. Our competitive position in our addressable markets is bolstered by our ability to provide comprehensive product solutions, which often include combination or bundled products, across our global platform driving new customer wins and strengthening our existing customer relationships through product and geographic cross-selling opportunities. Furthermore, the highly fragmented nature of our industry presents numerous acquisition opportunities as we continue to lead consolidation within our core businesses.
1
Table of Contents
We have long-term relationships with our blue chip customer base, who are leaders in our target end markets and include AstraZeneca, Coty, Diageo, Estée Lauder, GlaxoSmithKline, L’Oréal, Mondelēz International, Nestlé, Pernod Ricard, Pfizer and Sony. Our relationships with our top 20 customers average 34 years, with many of our customers operating under multi-year contracts. No one customer accounts for more than 5% of our acquisition adjusted pro forma net sales for the fiscal year ended June 30, 2015. Servicing our customers requires us to meet stringent quality specifications, a high level of customer service and meaningful investment requirements. Our healthcare customers, for example, require exacting standards of manufacturing in order to meet their regulatory requirements, and we are at the front end of our consumer customers’ branding and marketing strategy, enhancing the visual impact at the shelf while also ensuring product integrity and regulatory compliance.
We believe we are one of the few companies in our addressable markets which offers a full range of products across multiple geographies. This unique capability presents a compelling value proposition to our customers as they continue to rationalize their supply chain and seek to partner with global suppliers. Our global manufacturing footprint consists of 59 manufacturing sites and nine sales offices across North America, Europe and Asia. Our strategically located facilities have enabled us to grow our business by leveraging our customer relationships across multiple geographies and products, and drive incremental growth through our ability to integrate and improve our customers’ supply chains. Additionally, our global manufacturing footprint is supported by our sales and design teams, which consist of a dedicated research and development group, more than 115 structural and graphic designers and over 230 sales personnel.
Since 2005, we have evolved from our initial U.S. platform of five facilities into a global specialty packaging leader, based on sales, through completing a total of 15 transactions. Our acquisitions expanded our core end markets and added complementary products and locations. In 2014, we entered into a transformational merger with Chesapeake Finance 2 Limited (“Chesapeake”), acquired the North American and Asian print businesses of AGI-Shorewood Group (“ASG”) and completed five additional acquisitions, which further expanded our global footprint and significantly diversified our product and end market profile. We are in the early stages of leveraging the benefits of these combinations. For example, we believe there is untapped cross-sell potential through opportunities from the MPS and Chesapeake combination in terms of increasing sales to existing customers in new product areas and geographies. Additionally, we estimate that as of June 30, 2015 we have realized a total of approximately $28 million of synergies from the Chesapeake and ASG transactions, which is expected to result in an annualized run-rate as of the same date of approximately $36 million. We believe that these targeted savings and synergy programs will eventually achieve an annualized run-rate of approximately $40 million, although we cannot make any assurances that such an annualized run-rate will be achieved.
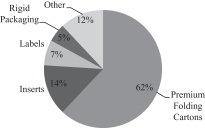
The charts below illustrate our diversification by geographic region, end market and product offering as a percentage of acquisition adjusted pro forma net sales for the fiscal year ended June 30, 2015.
| By Geography |
By End Market |
By Product Offering | ||
|
|
|
|
2
Table of Contents
Our Products
We provide our customers a comprehensive suite of value-added specialty packaging solutions, including premium folding cartons, inserts, labels and rigid packaging, which utilize a wide variety of substrates (e.g., paper and paperboard, pressure sensitive labels, plastic, foil) and finishes (e.g., UV coatings, film lamination, stamping, embossing). We also employ an array of value-add decorative technologies to create iridescent, holographic, textured and dimensional effects to provide differentiated specialty packaging products to our customers.
The table below outlines our key product offerings and their competitive advantages.
| Premium Folding |
Inserts |
Labels |
Rigid Packaging |
Other Consumer | ||||||
| Fiscal Year 2015 Acquisition Adjusted Pro Forma Net Sales |
$1,138 million 62% of total |
$260 million 14% of total |
$126 million 7% of total |
$97 million 5% of total |
$209 million 12% of total | |||||
| Products | • Paperboard cartons |
• Healthcare inserts, outserts • Booklets • Folders • Slipsheets |
• Pressure sensitive • Extended content • Cut & stack |
• Rigid boxes • Tubes |
• Transaction cards • Grower tags • Brochures • Product literature | |||||
| Key Competitive Advantages |
• Breadth of product offering • Geographic proximity to customers • Advanced and innovative technology |
• Design and manufacturing capability • Breadth of folding technologies • Global presence |
• Wide variety of product and service capabilities • Product quality and consistency • Ability to handle the increasing complexity |
• Creative product solutions • Geographic proximity to customers • Significant manufacturing capabilities in our key geographies • Dedicated sourcing team focused on supplementing the key offerings to our customers |
• Unique end-to-end ability to service open and closed loop transaction cards • Provide multiple value-added print solutions | |||||
| Product Examples |

|
|
|

|
| |||||


3
Table of Contents
Premium Folding Cartons
Premium folding cartons are widely used, versatile forms of secondary packaging, which play an important role in our customers’ branding and marketing strategy by influencing purchase decisions at the point-of-sale by conveying an exceptional appearance, shelf presence and impact through the use of specialty graphics, a variety of printed finishes and other creative designs. Our folding carton offering competes at the premium end of the market, utilizes high quality inputs such as solid bleached sulfate, and is manufactured with various features and finishes, including lamination, embossing, foil stamping and windowing.
Additionally, our premium folding cartons offering must adhere to stringent regulatory requirements by playing a key role in our customers’ product safety as well as ensuring product authenticity, accurate product information and product compliance to the end customer. Our folding carton customers oftentimes purchase associated labels and inserts. Leveraging cross-selling opportunities is a key strategic initiative of recently completed acquisitions.
Inserts
We provide inserts for all the end markets we serve, with the majority of our sales in this category being to the healthcare end market. Inserts are of particular importance in the healthcare end market given stringent regulations to ensure the accuracy of product information. Numerous regulatory bodies require an increasing level of product information to be made available to the consumer. Providing this increasing amount of information requires larger and, in many instances, more complex inserts. Regulations evolve and consequently, product disclosure requirements change, oftentimes on short notice, which requires the need for a flexible manufacturing footprint and process capabilities, as well as quick reaction and turn-around of insert production. Our ability to be integrated with our customers’ information management systems allow us to monitor customer demand and limit their exposure to inventory obsolescence when product disclosure changes.
Labels
Labels are one of the most visible and recognizable packaging components and are used in a wide variety of applications serving as the primary means of identifying products to consumers, while creating shelf appeal and brand recognition for products. Labels also function as a conduit for fulfilling regulatory requirements, communicating product-related information to consumers and contributing to product integrity and security. We supply a broad range of pressure sensitive labels, including single-panel, multi-panel, multi-ply and extended content labels, as well as cut and stack labels through the application of multiple print technologies, including digital, flexographic and offset printing.
The majority of our sales in this category are pressure sensitive labels sold primarily into the healthcare market which, like our inserts, are subject to stringent regulations to ensure the accuracy of product information. Additionally, we supply both pressure sensitive and cut and stack labels to the consumer products markets where decorative labels are utilized to differentiate products at the retail point-of-sale.
Rigid Packaging
Our rigid packaging offering is composed of rigid boxes, which are commonly used to present ultra-premium products and vary from rigid top load boxes for the high-end spirits market to specialized boxes for perfumes and other luxury products. We recently completed two strategic acquisitions which added to our internal manufacturing capability for customized/high-end rigid boxes. We believe our rigid packaging offering presents a meaningful growth opportunity in the future.
4
Table of Contents
Other Consumer Products Packaging
We offer a number of additional print-based specialty packaging products, including transaction cards, point-of-purchase displays, brochures, product literature, marketing materials and grower tags and plant stakes for the horticultural market. Our transaction cards and card services offerings are of a particular focus. We provide our customers a comprehensive end-to-end solution for credit, debit, general prepaid reloadable, gift, loyalty, hospitality, insurance and other card-based programs. Our integrated supply chain for cards, carriers, multi-packs and point-of-purchase displays greatly simplifies the development and execution of card programs and drives competitive differentiation.
Value-Added Services
We complement our broad product offering with several value-added services, such as creative design and new product development for which we have a team of more than 115 structural designers and graphic designers across a number of key locations. We also provide our customers with customized supply chain solutions, including vendor managed inventory (“VMI”) programs. VMI solutions help customers manage production based on actual demand to reduce lead times, minimize inventory, eliminate waste and enhance supply chain security. Our ability to provide on-demand services for our customers via digital print technology has allowed us to reduce our lead times. Shorter lead times provide a distinct advantage in consumer and healthcare-facing industries where companies must move quickly to introduce new products and ramp-up supply in response to market trends and consumer demand. Shorter lead times also limit our customers’ exposure to inventory obsolescence. Our value-added services build entrenched partnerships with customers and allow us to become a more critical part of the supply chain by helping to improve workflow efficiencies and reduce our customers’ total cost of ownership for packaging materials.
5
Table of Contents
Our End Markets
The following table illustrates our sales, key drivers, end use, customers and competitors for each of our end markets. Additionally, the table reflects our estimates of our addressable market size and growth.
| Consumer |
Healthcare |
Multi-Media | ||||
| Fiscal Year 2015 Acquisition Adjusted Pro Forma Net Sales |
$920 million 50% of total |
$673 million 37% of total |
$237 million 13% of total | |||
| Key Drivers | • Brand differentiation • Enhanced design attributes • Product innovation • Rapid refresh cycles |
• Population demographics • Proliferation of pharmaceutical products • Regulatory requirements |
• Commemorative, special editions • Games and gaming platforms | |||
| 2015 Addressable Market(1) |
• $8+ billion |
• $8+ billion |
• $0.3 billion | |||
| Market Growth 2015E – 2020E CAGR(1) |
• 2.0% |
• 6.0% |
• (7.0)% | |||
| End Use | • Personal care • Spirits • Cosmetics • Confectionary |
• Over-the-counter (branded and private label) and ethical pharmaceuticals • Medical devices • Nutritional and dietary supplements, vitamins and minerals |
• Home video • Recorded music • Video games • Software | |||
| Representative Customers |
• Coty • Diageo • Estée Lauder • Henkel • L’Oréal • Mondelēz International • Nestlé • Pernod Ricard |
• AstraZeneca • GlaxoSmithKline • Merck • Pfizer |
• Electronic Arts • Paramount Pictures • Sony • Universal Pictures Home Entertainment • Universal Music • Warner Home Video | |||
| Select Competitors | • Arkay Packaging • Autajon • CCL Industries • Edelmann Group • Multi-Color Corporation |
• CCL Industries • Essentra • Jones Packaging • Nosco |
• ASG Europe • Bert-Co Industries • Wynalda Packaging | |||
| (1) | Based on management estimates of annual sales. |
6
Table of Contents
Consumer (50% of Fiscal Year 2015 Acquisition Adjusted Pro Forma Net Sales)
We focus on the premium end of the personal care, spirits, cosmetics and confectionary markets where high-impact graphics and innovative designs and finishes help brands drive “top-of-mind” positioning at the point-of-purchase. Our multinational customers not only require innovative product solutions, which our leading global design division has positioned us well to deliver, but they have also increasingly centralized their procurement functions seeking fewer, more strategic partners capable of meeting their packaging needs across a range of products, services and geographies. We are well-positioned to benefit from this trend in vendor rationalization by leveraging our ability to deliver a broad range of solutions on a local basis while simultaneously providing global coverage to our multinational customers.
Healthcare (37% of Fiscal Year 2015 Acquisition Adjusted Pro Forma Net Sales)
Our healthcare packaging offering is used in a wide variety of applications including over-the-counter (“OTC”) and prescription pharmaceuticals, medical devices, nutritional and dietary supplements, vitamins and minerals. The healthcare packaging market is characterized by significant technical requirements, recession-resilient demand characteristics and numerous growth opportunities. Healthcare packaging has stringent quality specifications, prerequisite manufacturing standards, including audits and certifications of facilities, and compliance with ever-increasing regulatory requirements. Product innovation also plays a key role in the industry as pharmaceutical manufacturers increasingly incorporate authentication features into packaging to assist in the prevention of counterfeiting. We have developed strong relationships with leading healthcare companies as a result of our high-quality products, expertise in print technologies, excellent customer service and customized supply solutions, which we believe positions us well as the healthcare sector continues to consolidate its packaging spend to those suppliers who can provide consistent high-quality service on a multi-country basis.
Multi-Media (13% of Fiscal Year 2015 Acquisition Adjusted Pro Forma Net Sales)
Our multi-media end market sales are focused on high quality specialty packaging, which often requires quick response, including commemorative and special editions for home videos, recorded music, video games and software. The production of packaging for multi-media customers requires dedicated equipment, order volumes, enterprise resource planning (“ERP”) systems and customer relationships, all of which are significant competitive advantages over any new market entrants.
Our Competitive Strengths
Industry leader focused on attractive end markets
We believe that we are a leading supplier, based on sales, in our core addressable consumer and healthcare end markets, which account for approximately 87% of our acquisition adjusted pro forma global net sales. The global markets for consumer and healthcare packaging have proven to be recession resistant over time, experiencing steady growth in excess of gross domestic product (“GDP”), which is expected to continue. For example, based on management estimates, we estimate that the annual sales for the healthcare packaging market grew at a compound annual growth rate (“CAGR”) of 6.4% from 2010 to 2015. Over the same period, based on management estimates, we believe annual sales for the remainder of our addressable market in the consumer end market grew at a CAGR of approximately 2.9%. According to the International Monetary Fund, GDP growth in the United States and European Union during the same period will average 2.3% and 0.9% per year, respectively.
Scale benefits in a fragmented industry
As one of the leading global providers, based on sales, of value-added specialty packaging solutions in a highly fragmented industry, our scale provides us with competitive advantages including: innovative design and new product development, purchasing leverage, value-added supply chain solutions (e.g., VMI) and redundant
7
Table of Contents
manufacturing capacity from our global footprint. Further, our scale has resulted in a global manufacturing platform that enables us to reliably serve our multinational customers intent on consolidating their supplier bases across multiple geographies. Our scale provides us with a significant competitive advantage, as most other market participants lack the financial resources to replicate our enterprise capabilities. Additionally, our scale provides us with the financial flexibility to selectively pursue and integrate bolt-on acquisition opportunities in this highly fragmented industry.
Long-term relationships with a diverse, blue chip customer base
We have long-term customer relationships driven by our local and global presence, breadth of products, value-added service offering and innovative packaging solutions. Our customers include AstraZeneca, Coty, Diageo, Estée Lauder, GlaxoSmithKline, L’Oréal, Mondelēz International, Nestlé, Pernod Ricard, Pfizer and Sony. Our relationships with our top 20 customers average 34 years, with no one customer accounting for more than 5% of our acquisition adjusted pro forma net sales for the twelve-month period ended June 30, 2015 and our top ten customers accounting for less than 26% of acquisition adjusted pro forma net sales for the same time period.
Strategically located global manufacturing footprint and high quality asset base
Our global packaging footprint provides us with the ability to serve our customers across North America, Europe and Asia. We believe this is a key competitive differentiator in a fragmented industry that has predominantly regional and locally focused peers, and positions us to continue to grow in our core end markets. Our global sales, design and manufacturing capabilities enable us to simplify and economize our global customers’ supply chains through executing global supply contracts with key multinational customers. We believe our global production management capabilities and technologically advanced asset base positions us as a “provider-of-choice” for customers looking for product quality in emerging markets. We continually invest in our asset base to ensure we have state-of-the-art technology and high-performing equipment and implement operating best practices across our sites.
Product innovation capabilities and complementary service offering
We believe our new product development capabilities result in products with unique performance characteristics that add value for our customers, drive customer loyalty and support our overall profitability. Furthermore, as design and regulations continue to evolve, we believe it is imperative to constantly innovate in order to comprehensively address customer needs.
Our innovative product offering is complemented with several value-added services and technologies that our larger customers demand, including creative design, new product development and bespoke supply chain solutions such as VMI. Our creative team includes more than 115 structural designers and graphic designers across a number of key locations. We believe our sales and design capabilities, in tandem with our global footprint, facilitate a superior speed-to-market versus our competitors, which enables us to provide customers with faster product turnaround that leads to reduced inventory and product obsolescence when introducing new and redesigned products. Our value-added services, such as on-demand printing and customer-dedicated presses and facilities, allow us to build entrenched partnerships with customers and facilitate us in becoming a more critical part of the supply chain by helping to improve workflow efficiencies and reduce our customers’ total cost of ownership for packaging materials. In this fragmented industry, our size and financial resources enable us to continuously innovate, which we believe is a significant competitive advantage.
Proven acquisition track record
We have a successful track record of acquiring strategically relevant companies, establishing and realizing savings and synergy programs and integrating acquired operations and customers into our global platform.
8
Table of Contents
Through successful execution and integration of acquired businesses, we have expanded our geographic reach and product and service offering, which has enabled us to better serve our large multinational customers, as well as penetrate new regional and local customers in our key end markets. We have expanded the operating margins of companies we have acquired, achieving our synergy targets and leveraging our platform as evidenced by our accreting EBITDA margins subsequent to each acquisition.
Strong earnings growth, margin improvement and free cash flow generation
We have a successful track record of creating shareholder value since our inception. We have consistently delivered growth through a focus on attractive products and end markets, operational excellence and executing value accretive acquisitions. Adjusted EBITDA has grown at a CAGR of 36.1% from fiscal year 2006 to fiscal year 2013. Over the same period we have increased Adjusted EBITDA margins from 9.8% to 15.0%. The chart below illustrates our growth in Adjusted EBITDA and related margin. The pro forma results below reflect the acquisitions we made through June 30, 2015 as if they occurred on July 1, 2013. The pro forma Adjusted EBITDA margin is lower than historical periods primarily due to the lower historical Adjusted EBITDA margin for the acquired ASG businesses and is reflective of the potential accretion opportunity available to us.
Adjusted EBITDA ($ in millions)
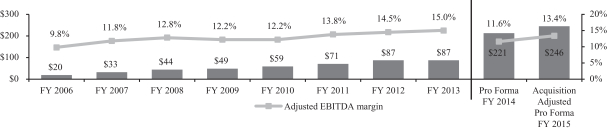
| Note: | Our fiscal year ends June 30th. See footnote 4 set forth in “—Summary Historical Audited Consolidated and Unaudited Pro Forma Combined Financial Information” for a reconciliation of Adjusted EBITDA to net income. |
We have also consistently demonstrated our ability to generate strong cash flows driven by efficient investment of capital, good working capital control and operational discipline throughout the Company. Our capital investment requirements have generally been in the range of 3.5 to 3.9% of net sales, achieving strong free cash flow conversion relative to our Adjusted EBITDA margin. Our free cash flow conversion (defined as Adjusted EBITDA less capital expenditures) has averaged over 70% over the last seven years.
Free Cash Flow Conversion
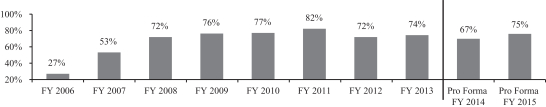
| Note: | Free cash flow is defined as Adjusted EBITDA less capital expenditures. Free cash flow conversion is defined as free cash flow divided by Adjusted EBITDA. See footnote 4 set forth in “—Summary Historical Audited Consolidated and Unaudited Pro Forma Combined Financial Information” for a reconciliation of Adjusted EBITDA to net income. Pro forma FY 2015 is calculated using acquisition adjusted pro forma Adjusted EBITDA. |
9
Table of Contents
Experienced management team with strong track record of execution
Our seasoned and capable senior management team consisting of 30 individuals averages more than 20 years of direct industry experience and brings an impressive track record of both operating businesses and sourcing and integrating acquisitions. We are led by our Chief Executive Officer, Marc Shore, the former Chairman and CEO of Shorewood Packaging Corporation (“Shorewood”), which completed an initial public offering in October 1986 and was eventually sold to International Paper in February 2000, resulting in a total return of 22% on a compounded annual basis over that period. At MPS, Mr. Shore and the management team are responsible for taking us from $209 million of net sales in our first full year of operation in 2006 to $1.8 billion in pro forma net sales for the twelve months ended June 30, 2015. Mr. Shore is joined by Dennis Kaltman, our President, and William Hogan, our Executive Vice President and Chief Financial Officer, both of whom helped build Shorewood alongside Mr. Shore and have worked with him for over 17 years. Mr. Kaltman and Mr. Hogan joined MPS in July 2005 and February 2006, respectively, and have more than 50 years of combined experience in the print-based specialty packaging industry. This management team is supported by a large number of seasoned employees, many who have joined from acquired businesses and have extensive operational experience and strong customer relationships.
Our Strategies
We seek to continue to take advantage of our competitive strengths by pursuing the following business strategies:
Position for organic growth in core markets
We seek to further develop our product capabilities and geographic reach in order to: enhance our existing customer relationships; take advantage of positive growth dynamics within our core consumer and healthcare markets; and focus on market segments where we have sustainable, competitive advantages. Additionally, our footprint in Asia and Eastern Europe gives us access to higher growth emerging markets.
| • | Consumer: As traditional forms of advertising media have continued to fragment, it is becoming increasingly important to have high quality packaging in order to capture consumers’ attention at point-of-sale in order to help brands differentiate their products in a cost effective way and gain “top-of-mind” positioning. Security and safety concerns are resulting in the growth of tamper-proof packaging. Additionally, increasing focus on environmental issues and recyclability of materials represents an opportunity for us to further strengthen our market position. Finally, continued compression in the product life cycle of consumer goods and a rapid refresh cycle have led to a growing need for new and differentiated packaging products. Our strength in new product development positions us to benefit from this trend. |
| • | Healthcare: An aging population demographic, increasing consumer awareness regarding health and wellness, generic pharmaceutical SKU proliferation and evolving regulatory standards are expected to be key drivers of continued growth. The growing global population has increased the market for pharmaceuticals, an effect that is amplified by demographic shifts as the universe for pharmaceuticals targeting chronic diseases has expanded. We believe that we have a market leading position in the healthcare end market based on sales, which coupled with our multinational presence, give us global scale and a significant opportunity to follow customers looking to consolidate their supply chains. |
Leverage our scale and differentiated approach to market to increase market share
We believe our ability to serve our customers through our global presence, breadth of products, value-added service offering and innovative packaging solutions is a competitive advantage, as our global customers increasingly require their packaging providers to supply multiple products across multiple regions. Our ability to be a “one-stop shop” on a global basis for our customers simplifies and optimizes their supply chains and
10
Table of Contents
represents a significant opportunity to take market share from smaller, local and regionally focused specialty packaging providers. Our extensive range of complementary high value-added products and solutions supports our value proposition to our customers and creates a “stickiness” to our customer relationships.
Continue to leverage cross-sell potential opportunities
We believe we can continue to increase our share of specialty packaging sales to our existing customers through meaningful geographic and product cross-selling opportunities related to our merger with Chesapeake and purchase of ASG. Our ability to provide multiple products across numerous locations enables us to maximize cross-selling opportunities to our existing customers. For example, Chesapeake brought European spirits and confectionary capability which we can leverage into the United States, while we brought a broader personal care and healthcare customer base seeking suppliers with capabilities in Europe. This “one-stop shop” nature of our business yields economic benefits to our customers that are difficult for our competitors to achieve. We are only beginning to realize new sales opportunities as a consequence of bringing MPS, Chesapeake and ASG together.
Continue pursuit of operational excellence
Continuous operational improvement is core to our strategy. We consistently benchmark our sites against each other in terms of profitability metrics and key performance indicators across our equipment to optimize our processes. We continue to develop and implement operating best practices and remediate underperforming sites through utilization improvement, expense management and facility rationalizations. Over the last five years we have invested over $330 million in our manufacturing network to provide and improve scale and geographic coverage, operational flexibility, security of redundant capacity and ensure site accreditation. Our key cost savings initiatives include improving our productivity and asset utilization, optimizing our industrial footprint and investing capital efficiently. Through these key savings initiatives as well as our global lean manufacturing efforts, we believe we will continue to drive operational excellence in order to further improve our operating margins.
Continue disciplined acquisition strategy
We have established a track record of successfully sourcing, executing and integrating strategic, value accretive acquisitions in the fragmented specialty packaging industry. We maintain and monitor a list of potential acquisition targets and we believe we will continue to be able to achieve and execute acquisitions at attractive post-synergy valuations. Since 2005, we have completed 15 acquisitions at what we believe were attractive pre-synergy and post-synergy multiples. As a result of our management’s tenure in the industry, most of our acquisitions have been identified and initiated by our management team outside of formal sale processes.
Drive margin expansion and synergy benefits from recent acquisitions
We are focused on continuing to drive synergies from recent acquisitions to reduce costs and increase our Adjusted EBITDA margins. We are in the process of executing synergies related to the Chesapeake merger and ASG acquisition, both of which were completed in calendar year 2014. Specifically, we estimate that as of June 30, 2015 we have realized a total of approximately $28 million of synergies from the Chesapeake and ASG transactions, which is expected to result in an annualized run-rate as of the same date of approximately $36 million. We believe that these targeted savings and synergy programs will eventually achieve an annualized run-rate of approximately $40 million, although we cannot make any assurances that such an annualized run-rate will be achieved. These savings come from procurement, leveraging our existing selling, general and administrative functions, optimizing workflow within and across sites and driving strong operational performance through close monitoring and management.
11
Table of Contents
Maximize free cash flow generation
Free cash flow generation continues to be a focus of our business, and our consistent free cash flow generation is a result of: (i) a stable gross margin profile that reflects the value of the products and services we provide; (ii) management’s focus on operational efficiency; (iii) disciplined capital expenditures focused on attractive, high return on investment projects and the ability to repurpose machinery; and (iv) the optimization of operations and realization of synergies from acquisitions, including leveraging our fixed-cost base. We believe our execution of operational improvements and acquisition integration, supplemented with modest capital expenditure requirements, will continue to drive our free cash flow in the future.
Risks Related to Our Business
Investing in our common shares involves substantial risk. You should carefully consider all of the information in this prospectus prior to investing in our common shares. There are several risks related to our business and our ability to leverage our strengths that are described under “Risk Factors” elsewhere in this prospectus. Among these important risks are the following:
| • | our ability to compete against competitors with greater resources or lower operating costs; |
| • | adverse developments in economic conditions, including downturns in the geographies and target markets that we serve; |
| • | difficulties in restructuring operations, closing facilities or disposing of assets; |
| • | our ability to successfully integrate our acquisitions and identify and integrate future acquisitions; |
| • | our ability to realize the growth opportunities and cost savings and synergies we anticipate from the initiatives that we undertake; |
| • | changes in technology trends and our ability to develop and market new products to respond to changing customer preferences and regulatory environment; |
| • | the impact of electronic media and similar technological changes, including the substitution of physical products for digital content; |
| • | seasonal fluctuations; |
| • | the impact of significant regulations and compliance expenditures as a result of environmental, health and safety laws; |
| • | risks associated with our non-U.S. operations; |
| • | exposure to foreign currency exchange rate volatility; |
| • | the loss of, or reduced purchases by, one or more of our large customers; |
| • | failure to attract and retain key personnel; |
| • | increased information technology security threats and targeted cybercrime; |
| • | changes in the cost and availability of raw materials; |
| • | operational problems at our facilities; |
| • | the impact of any labor disputes or increased labor costs; |
| • | the failure of quality control measures and systems resulting in faulty or contaminated products; |
| • | the occurrence or threat of extraordinary events, including natural disasters and domestic and international terrorist attacks; |
| • | increased energy or transportation costs; |
12
Table of Contents
| • | our ability to develop product innovations and improve production technology and expertise; |
| • | the impact of litigation, uninsured judgments or increased insurance premiums; |
| • | an impairment of our goodwill or intangible assets; |
| • | our ability to comply with all applicable export control laws and regulations of the United States and other countries and restrictions imposed by the Foreign Corrupt Practices Act; |
| • | the impact of regulations to address climate change; |
| • | risks associated with the funding of our pension plans, including actions by governmental authorities; |
| • | the impact of regulations related to conflict minerals; |
| • | our ability to acquire and protect our intellectual property rights and avoid claims of intellectual property infringement; |
| • | risks related to our substantial indebtedness; |
| • | failure of internal controls over financial reporting; and |
| • | the ability of Carlyle and Madison Dearborn to control us. |
Our Anticipated Corporate Structure After the Offering
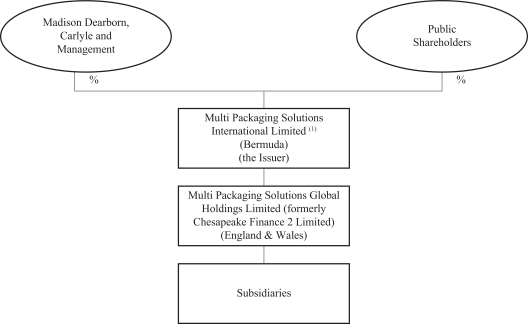
| (1) | Prior to the completion of this offering, the Issuer will become the direct parent company of MPS Holdings as a result of the investment vehicles controlled by Madison Dearborn and Carlyle exchanging their shares in MPS Holdings for new shares in the Issuer. |
13
Table of Contents
Our Principal Shareholders
On August 15, 2013, Multi Packaging Solutions, Inc. and its primary shareholder, IPC/Packaging LLC, entered into an Agreement and Plan of Merger to be purchased by Mustang, an entity controlled by funds advised by Madison Dearborn. On November 18, 2013, an investment fund controlled by Madison Dearborn and an investment fund controlled by Carlyle entered into a Combination Agreement and the combination was consummated on February 14, 2014. Pursuant to the Combination Agreement, Madison Dearborn contributed 100% of the outstanding equity of Mustang to Chesapeake, in exchange for a 50% equity interest in Chesapeake. The other 50% equity interest in Chesapeake is held by funds advised by Carlyle. The transaction between Chesapeake and Mustang was accounted for as a reverse acquisition with Chesapeake as the legal acquiror and new parent entity, and Mustang as the legal subsidiary but the accounting acquiror. Subsequently, Chesapeake changed its name to Multi Packaging Solutions Global Holdings Limited. On June 19, 2015, Multi Packaging Solutions International Limited, the registrant, was formed in Bermuda. Affiliates of Madison Dearborn and Carlyle collectively currently beneficially own all of our common shares, as well as the ordinary shares of Multi Packaging Solutions Global Holdings Limited. See “Basis of Presentation and Other Information—Multi Packaging Solutions International Limited.” Following consummation of this offering affiliates of Madison Dearborn and Carlyle will continue to be controlling shareholders and will have the right to designate a number of directors to our board pursuant to a shareholders’ agreement. See “Certain Relationships and Related Party Transactions—Shareholders’ Agreement.”
Carlyle
Founded in 1987, Carlyle is a global alternative asset manager and one of the world’s largest global private equity firms with approximately $193 billion of assets under management across 130 funds and 156 fund of funds vehicles as of June 30, 2015. Carlyle invests across four segments – Corporate Private Equity, Real Assets, Global Market Strategies and Investment Solutions – in Africa, Asia, Australia, Europe, the Middle East, North America and South America. Carlyle has expertise in various industries, including aerospace, defense & government services, consumer & retail, energy, financial services, healthcare, industrial, real estate, technology & business services, telecommunications & media and transportation. Carlyle employs more than 1,650 employees, including more than 700 investment professionals, in 40 offices across six continents.
Madison Dearborn
Madison Dearborn, based in Chicago, is an experienced private equity investment firm that has raised over $18 billion of capital. Since its formation in 1992, Madison Dearborn’s investment funds have invested in approximately 130 companies across a broad spectrum of industries, including basic industries; business and government services; consumer; financial and transaction services; healthcare; and telecom, media and technology services. Madison Dearborn’s objective is to invest in companies with strong competitive characteristics that it believes have the potential for significant long-term equity appreciation. To achieve this objective, Madison Dearborn seeks to partner with outstanding management teams that have a solid understanding of their businesses as well as track records of building shareholder value.
Implications of Being an Emerging Growth Company
As a company with less than $1.0 billion in gross revenue during our last fiscal year before our first public filing, we qualified as an “emerging growth company” as defined in the Jumpstart Our Business Startups Act of 2012 (the “JOBS Act”). An “emerging growth company” may take advantage of reduced reporting requirements that are otherwise applicable to public companies. These provisions include, but are not limited to:
| • | being permitted to present only two years of audited financial statements and only two years of related results of operations in the Management’s Discussion and Analysis of Financial Condition and Results of Operations section in this prospectus; |
14
Table of Contents
| • | being permitted to adopt any new or revised accounting standards using the same timeframe as private companies (if such standard applies to private companies); |
| • | not being required to comply with the auditor attestation requirements of Section 404 of the Sarbanes-Oxley Act of 2002 (the “Sarbanes-Oxley Act”); |
| • | reduced disclosure obligations regarding executive compensation in our periodic reports, proxy statements and registration statements; and |
| • | exemptions from the requirements of holding a nonbinding advisory vote on executive compensation and shareholder approval of any golden parachute payments not previously approved. |
We may take advantage of these provisions until the last day of our fiscal year following the fifth anniversary of the date of the first sale of our common equity securities pursuant to an effective registration statement under the Securities Act of 1933, as amended (the “Securities Act”), which such fifth anniversary will occur in 2021. However, if specified events occur prior to the end of such five-year period, including if we become a “large accelerated filer,” our annual gross revenues exceed $1.0 billion or we issue more than $1.0 billion of non-convertible debt in any three-year period, we will cease to be an emerging growth company prior to the end of such five-year period.
We have elected to take advantage of some of the reduced disclosure obligations listed above in this prospectus, and may elect to take advantage of other reduced reporting requirements in future filings. As a result, the information that we provide to our shareholders may be different than you might receive from other public reporting companies in which you hold equity interests.
Company Information
Multi Packaging Solutions International Limited was incorporated pursuant to the laws of Bermuda on June 19, 2015. Our principal executive offices are located at 150 E 52nd St., 28th Floor, New York, New York, 10022, and our telephone number is (646) 885-0005. Our website address is www.multipkg.com. Information on, or accessible through, our website is not part of this prospectus, nor is such content incorporated by reference herein. You should rely only on the information contained in this prospectus when making a decision as to whether to invest in our common shares.
We maintain a registered office in Bermuda at Clarendon House, 2 Church Street, Hamilton HM 11, Bermuda. The telephone number of our registered office is (441) 295-5950.
15
Table of Contents
The Offering
| Common shares offered by us |
shares. |
| Common shares offered by the selling shareholders |
shares. |
| Total common shares offered |
shares. |
| Selling shareholders |
The selling shareholders identified in “Principal and Selling Shareholders.” |
| Common shares outstanding after this offering |
shares. |
| Option to purchase additional common shares |
The selling shareholders have granted the underwriters a 30-day option from the date of this prospectus to purchase up to an additional common shares at the initial public offering price, less underwriting discounts and commissions. |
| Use of proceeds |
We estimate the net proceeds to us from this offering will be approximately $ million, based on an assumed public offering price of $ per share, which is the midpoint of the estimated offering price range set forth on the cover page of this prospectus, after deducting assumed underwriting discounts and commissions and other estimated offering expenses payable by us. We intend to use the net proceeds from this offering to repay certain indebtedness and to pay related premiums, accrued and unpaid interest and to pay expenses related to this offering. See “Use of Proceeds” for additional information. To the extent that the public offering price is lower than $ per share, which is the midpoint of the estimated offering price range set forth on the cover page of this prospectus, and our cash proceeds are lower than we have estimated, or our offering expenses are greater than we have estimated, the amount of the indebtedness that we will repay will be reduced. To the extent that the public offering price is higher than $ per share, which is the midpoint of the estimated offering price range set forth on the cover page of this prospectus, and our cash proceeds are higher than we have estimated, or our offering expenses are less than we have estimated, the amount of the indebtedness that we will repay will be increased. We will not receive any net proceeds from the sale of common shares by the selling shareholders, including from any exercise by the underwriters of their option to purchase additional common shares. For more information about the selling shareholders, see “Principal and Selling Shareholders.” See “Use of Proceeds” for additional information. |
| Dividend policy |
We do not currently pay and do not currently anticipate paying dividends on our common shares following this offering. Any declaration and payment of future dividends to holders of our |
16
Table of Contents
| common shares may be limited by restrictive covenants in our debt agreements, and will be at the sole discretion of the Board of Directors of MPS Limited (our “Board of Directors”) and will depend on many factors, including our financial condition, earnings, capital requirements, level of indebtedness, statutory and contractual restrictions applying to the payment of dividends and other considerations that our Board of Directors deems relevant. In addition, Bermuda law imposes requirements that may restrict our ability to pay dividends to holders of our common shares. Under the Companies Act, 1981, we may declare and pay a dividend only if we have reasonable grounds to believe that we are, or would be after the payment, able to pay our liabilities as they become due and if the realizable value of our assets would thereby not be less than our liabilities. See “Dividend Policy,” “Management’s Discussion and Analysis of Financial Condition and Results of Operations—Liquidity and Capital Resources” and “Description of Share Capital.” |
| Reserved Share Program |
At our request, the underwriters have reserved for sale, at the initial public offering price, up to 5% of the common shares offered by this prospectus for sale to some of our directors, officers, employees, business associates and related persons through a Reserved Share Program. If these persons purchase reserved common shares it will reduce the number of common shares available for sale to the general public. Any reserved common shares that are not so purchased will be offered by the underwriters to the general public on the same terms as the other common shares offered by this prospectus. |
| Proposed stock exchange symbol |
“MPSX”. |
| Risk factors |
See “Risk Factors” beginning on page 25 of this prospectus for a discussion of factors you should carefully consider before deciding to invest in our common shares. |
The number of common shares to be outstanding after completion of this offering is based on common shares outstanding as of , 2015, which includes common shares to be sold by the selling shareholders, and excludes common shares reserved for issuance under our 2015 Incentive Plan (the “2015 Plan”), which we plan to adopt in connection with this offering.
Unless we specifically state otherwise, all information in this prospectus assumes:
| • | no exercise of the option to purchase additional common shares by the underwriters; |
| • | an initial offering price of $ per share, which is the midpoint of the estimated offering price range set forth on the cover page of this prospectus; |
| • | the completion of a -for- split of our common shares (the “common share split”), which will occur prior to the closing of this offering; and |
| • | the adoption of our amended and restated bye-laws immediately prior to the closing of this offering. |
17
Table of Contents
Summary Historical Audited Consolidated and Unaudited Pro Forma Combined Financial Information
The following table sets forth our summary historical audited consolidated and unaudited pro forma combined financial information for the periods and dates indicated.
The balance sheet data as of June 30, 2014 and 2015 and the statements of operations and cash flow data for the fiscal year ended June 30, 2013, the period from July 1, 2013 to August 14, 2013, the period from August 15, 2013 to June 30, 2014 and the fiscal year ended June 30, 2015 have been derived from the audited consolidated financial statements of MPS Holdings appearing elsewhere in this prospectus. The balance sheet data as of June 30, 2013 has been derived from the audited consolidated financial statements of MPS Holdings not included in this prospectus.
The statements of operations and cash flow data are presented for the Predecessor period, which relates to the period preceding the Madison Dearborn Transaction, and the Successor period, which relates the period succeeding the Madison Dearborn Transaction.
We have derived the summary unaudited pro forma combined financial data for the year ended June 30, 2015 from our unaudited pro forma combined financial statements appearing elsewhere in this prospectus.
The unaudited pro forma combined financial data for the year ended June 30, 2015 give effect to the following transactions as if they had occurred on July 1, 2014:
| • | the acquisition of Armstrong Packaging Limited on July 8, 2014; |
| • | the acquisitions of the Non-European Folding Carton and Lithographic Printing Business of AGI Global Holdings Coöperatief U.A. and the U.S. Folding Carton and Lithographic Printing Business of Atlas AGI Holdings LLC on November 21, 2014; and |
| • | the acquisition of Presentation Products Group on February 28, 2015. |
We refer to the foregoing collectively as the “Transactions.” See “Management’s Discussion and Analysis of Financial Condition and Results of Operations—Key Transactions.”
The unaudited pro forma combined financial data for the year ended June 30, 2015 do not give effect to the acquisition of BP Media Limited on July 1, 2015, the impact of which is not material to the Company’s financial results.
The summary unaudited pro forma combined financial data is for informational purposes only and does not purport to represent what our results of operations would have been if the Transactions had occurred as of those dates or what those results will be for future periods. We cannot assure you that the assumptions used by our management, which they believe are reasonable, for preparation of the summary unaudited pro forma combined financial data will prove to be correct.
Historical results are not indicative of the results to be expected in the future. You should read the following data together with the more detailed information contained in “Management’s Discussion and Analysis of Financial Condition and Results of Operations” and our consolidated financial statements and the accompanying notes thereto and our unaudited pro forma combined financial statements appearing elsewhere in this prospectus.
18
Table of Contents
Statement of Operations
| Fiscal year ended June 30, 2014 |
||||||||||||||||||||||||||
| Predecessor | Successor | Pro forma | ||||||||||||||||||||||||
| (Dollars in thousands, except per share data) | Fiscal year ended June 30, 2013 |
Period from July 1, 2013 to August 14, 2013 |
Period from August 15, 2013 to June 30, 2014 |
Fiscal year ended June 30, 2015 |
Twelve months ended June 30, 2014(1) |
Twelve months ended June 30, 2015 |
||||||||||||||||||||
| Net sales |
$ | 579,401 | $ | 74,081 | $ | 814,213 | $ | 1,617,640 | $ | 1,902,429 | $ | 1,807,513 | (2) | |||||||||||||
| Cost of goods sold |
456,958 | 58,054 | 668,441 | 1,285,673 |
|
1,517,731 |
|
1,447,787 | ||||||||||||||||||
|
|
|
|
|
|
|
|
|
|
|
|
|
|
||||||||||||||
| Gross margin |
122,443 | 16,027 | 145,772 | 331,967 |
|
384,698 |
|
359,726 | ||||||||||||||||||
| Selling, general and administrative expenses: |
||||||||||||||||||||||||||
| Selling, general and administrative expenses |
76,260 | 9,729 | 135,212 | 247,360 | 366,055 | 271,373 | ||||||||||||||||||||
| Management fees and expenses |
2,315 | 264 | — | — | 4,882 | 236 | ||||||||||||||||||||
| Transaction and other related expenses |
3,080 | 28,370 | 38,844 | 13,630 |
|
85,224 |
|
2,203 | ||||||||||||||||||
|
|
|
|
|
|
|
|
|
|
|
|
|
|
||||||||||||||
| 81,655 | 38,363 | 174,056 | 260,990 |
|
456,161 |
|
273,812 | |||||||||||||||||||
|
|
|
|
|
|
|
|
|
|
|
|
|
|
||||||||||||||
| Operating income (loss) |
40,788 | (22,336 | ) | (28,284 | ) | 70,977 |
|
(71,463 |
) |
85,914 | ||||||||||||||||
| Other income (expense): |
||||||||||||||||||||||||||
| Other income, net |
1,426 | 1,063 | 370 | 10,625 | 4,643 | 14,612 | ||||||||||||||||||||
| Debt extinguishment charges |
(4,140 | ) | (14,042 | ) | — | (1,019 | ) | (14,042 | ) | (1,019) | ||||||||||||||||
| Interest expense |
(24,546 | ) | (3,991 | ) | (43,215 | ) | (75,437 | ) |
|
(84,983 |
) |
(77,936) | ||||||||||||||
|
|
|
|
|
|
|
|
|
|
|
|
|
|
||||||||||||||
| Total other expense, net |
(27,260 | ) | (16,970 | ) | (42,845 | ) | (65,831 | ) |
|
(94,382 |
) |
(64,343) | ||||||||||||||
|
|
|
|
|
|
|
|
|
|
|
|
|
|||||||||||||||
| Income (loss) before income taxes |
13,528 | (39,306 | ) | (71,129 | ) | 5,146 |
|
(165,845 |
) |
21,571 | ||||||||||||||||
| Income taxes (benefit) expense |
4,195 | (15,621 | ) | (19,481 | ) | (1,880) |
|
(45,425 |
) |
7,399 | ||||||||||||||||
|
|
|
|
|
|
|
|
|
|
|
|
|
|
||||||||||||||
| Net income (loss) |
9,333 | (23,685 | ) | (51,648 | ) | 7,026 |
|
(120,420 |
) |
14,172 | ||||||||||||||||
| Less net income attributable to noncontrolling interest |
— | — | 216 | 527 |
|
(853 |
) |
527 | ||||||||||||||||||
|
|
|
|
|
|
|
|
|
|
|
|
|
|
||||||||||||||
| Net income (loss) attributable to the Company |
$ | 9,333 | $ | (23,685 | ) | $ | (51,864 | ) | $ | 6,499 |
$ |
(119,567 |
) |
13,645 | ||||||||||||
| Preferred stock dividends |
(9,275 | ) | (25 | ) | — | — |
|
— |
|
— | ||||||||||||||||
|
|
|
|
|
|
|
|
|
|
|
|
|
|
||||||||||||||
| Income available (loss attributable) to common shareholders |
$ | 58 | $ | (23,710 | ) | $ | (51,864 | ) | $ | 6,499 |
$ |
(119,567 |
) |
$ | 13,645 | |||||||||||
|
|
|
|
|
|
|
|
|
|
|
|
|
|
||||||||||||||
| Earnings (loss) per share: |
||||||||||||||||||||||||||
| Basic |
$ | .50 | $ | (203.74 | ) | $ | (.35 | ) | $ | .03 | $ | (.58 | ) | $ | .07 | |||||||||||
| Diluted |
$ | .49 | $ | (203.74 | ) | $ | (.35 | ) | $ | .03 | $ | (.58 | ) | $ | .07 | |||||||||||
| Weighted average shares outstanding: |
||||||||||||||||||||||||||
| Basic |
116,110 | 116,373 | 148,027,204 | 207,302,868 | 207,302,868 | 207,302,868 | ||||||||||||||||||||
| Diluted |
119,073 | 116,373 | 148,027,204 | 207,302,868 | 207,302,868 | 207,302,868 | ||||||||||||||||||||
Balance Sheet Data
| Predecessor | Successor | |||||||||||||
| (Dollars in thousands) | As of June 30, 2013 |
As of June 30, 2014 |
As of June 30, 2015 |
|||||||||||
| Total debt |
$ | 389,198 | $ | 1,133,202 | $ | 1,188,389 | ||||||||
| Cash and cash equivalents |
27,123 | 27,533 | 55,675 | |||||||||||
| Net debt (3) |
362,075 | 1,105,669 | 1,132,714 | |||||||||||
19
Table of Contents
Other Financial Data
| Fiscal year ended June 30, 2014 |
||||||||||||||||||||||||||||
| Predecessor | Successor | Successor | Pro forma | |||||||||||||||||||||||||
| (Dollars in thousands) | Fiscal year ended June 30, 2013 |
Period from July 1, 2013 to August 14, 2013 |
Period from August 15, 2013 to June 30, 2014 |
Fiscal year ended June 30, 2015 |
Twelve months ended June 30, 2014 |
Twelve months ended June 30, 2015 |
||||||||||||||||||||||
| EBITDA (4) |
$ | 74,734 | $ | (31,543 | ) | $ | 45,292 | $ | 212,286 | $ | 61,604 | $ | 235,275 | |||||||||||||||
| Adjusted EBITDA (4) |
86,675 | 10,471 | 118,790 | 230,962 | 221,226 | 244,068 | (5) | |||||||||||||||||||||
| Adjusted EBITDA margin (6) |
15.0 | % | 14.1 | % | 14.6 | % | 14.3 | % | 11.6 | % | 13.5 | % | ||||||||||||||||
| Capital expenditures |
22,433 | 2,741 | 39,888 | 59,535 | 72,354 | 62,483 | ||||||||||||||||||||||
| Free cash flow (7) |
64,242 | 7,730 | 78,902 | 171,427 | 148,872 | 181,585 | ||||||||||||||||||||||
| Interest expense |
24,546 | 3,991 | 43,215 | 75,437 | 84,983 | 77,936 | ||||||||||||||||||||||
| (1) | The unaudited pro forma financial data for the year ended June 30, 2014 give effect to the following transactions as if they had occurred on July 1, 2013: (i) the merger with Chesapeake on February 14, 2014, accounted for as a reverse acquisition, whereby MPS Holdings was the accounting acquirer; (ii) the acquisition of Integrated Print Solutions, LLC on April 4, 2014; (iii) the acquisition of JLI Acquisition, Inc. on April 4, 2014; (iv) the acquisition of Armstrong Packaging Limited on July 8, 2014; (v) the acquisitions of the Non-European Folding Carton and Lithographic Printing Business of AGI Global Holdings Coöperatief U.A. and the U.S. Folding Carton and Lithographic Printing Business of Atlas AGI Holdings LLC on November 21, 2014; and (vi) the acquisition of Presentation Products Group on February 28, 2015. The primary adjustments compared to the audited results presented elsewhere in this prospectus are associated with net sales adjustments of approximately $20.1 million, cost of goods sold adjustments related to depreciation and carve-out of $39.1 million, cost of goods sold adjustments related to inventory valuation of $3.7 million, selling general and administrative expenses of $7.9 million, transaction costs of $37.0 million, adjustments to other income of $(16.7) million, increased interest expense of $3.6 million and adjustments for income tax at the effective rate of $(12.1) million. |
| (2) | Does not include $23.0 million of net sales for the twelve-month period ended June 30, 2015 for BP Media Limited (“BP Media”), which we acquired on July 1, 2015. |
| (3) | Net debt represents total debt less cash and cash equivalents. |
| (4) | To supplement our financial information presented in accordance with U.S. GAAP, we use the following additional non-U.S. GAAP financial measures to clarify and enhance an understanding of past performance: EBITDA, Adjusted EBITDA and free cash flow. We believe that the presentation of these financial measures enhances an investor’s understanding of our financial performance. We further believe that these financial measures are useful financial metrics to assess our operating performance from period to period by excluding certain items that we believe are not representative of our core business. We also believe that these financial measures provide investors with a useful tool for assessing the comparability between periods of our ability to generate cash from operations sufficient to pay taxes, to service debt and to undertake capital expenditures. We use certain of these financial measures for business planning purposes and in measuring our performance relative to that of our competitors. |
EBITDA consists of net income (loss) attributable to MPS Holdings before interest, taxes, depreciation and amortization. Adjusted EBITDA consists of EBITDA adjusted for transaction costs, management fees, stock based and deferred compensation, multi-employer plan exits, debt extinguishment costs, amortization of inventory step-up, restructuring charges, (gain)/loss on sale of fixed assets, contract start-up costs and amortization costs, legal settlements, impairment charges and items that form part of other income/(expense). In the case of Adjusted EBITDA, we believe that making such adjustments provides investors meaningful information to understand our operating results and ability to analyze financial and business trends on a period to period basis.
20
Table of Contents
We believe these financial measures are commonly used by investors to evaluate our performance and that of our competitors. However, our use of the terms EBITDA, Adjusted EBITDA and free cash flow may vary from that of others in our industry. These financial measures should not be considered as alternatives to operating income (loss), net income (loss), earnings per share or any other performance measures derived in accordance with U.S. GAAP as measures of operating performance or operating cash flows or as measures of liquidity.
EBITDA, Adjusted EBITDA and free cash flow have important limitations as analytical tools and you should not consider them in isolation or as substitutes for analysis of our results as reported under U.S. GAAP. Some of these limitations are:
| • | EBITDA, Adjusted EBITDA and free cash flow: |
| • | exclude certain tax payments that may represent a reduction in cash available to us; |
| • | exclude certain impairments and adjustments for purchase accounting; |
| • | do not reflect changes in, or cash requirements for, our working capital needs; |
| • | do not reflect the significant interest expense, or the cash requirements necessary to service interest or principal payments on our debt; and |
| • | additionally, EBITDA and Adjusted EBITDA do not reflect our cash expenditures, or future requirements, for capital expenditures or contractual commitments; |
| • | although depreciation and amortization are non-cash charges, the assets being depreciated and amortized will often have to be replaced in the future, and EBITDA, Adjusted EBITDA and free cash flow do not reflect any cash requirements for such replacements; and |
| • | other companies in our industry may calculate EBITDA, Adjusted EBITDA and free cash flow differently than we do, limiting their usefulness as comparative measures. |
Because of these limitations, EBITDA, Adjusted EBITDA and free cash flow should not be considered as measures of discretionary cash available to us to invest in the growth of our business. We compensate for these limitations by relying primarily on our U.S. GAAP results and using these financial measures only supplementally.
In calculating EBITDA, Adjusted EBITDA and free cash flow, we add back certain non-cash, nonrecurring and other items and make certain adjustments that are based on assumptions and estimates that may prove to have been inaccurate. In addition, in evaluating these financial measures, you should be aware that in the future we may incur expenses similar to those eliminated in this presentation. Our presentation of EBITDA, Adjusted EBITDA and free cash flow should not be construed as an inference that our future results will be unaffected by unusual or nonrecurring items.
21
Table of Contents
The following tables reconcile net income (loss) attributable to MPS Holdings to EBITDA and Adjusted EBITDA for the periods presented:
| Twelve months ended June 30, 2014 |
||||||||||||||||||||||||
| Predecessor | Successor | Pro forma | ||||||||||||||||||||||
| (Dollars in thousands) | Fiscal year ended June 30, 2013 |
Period from July 1, 2013 to August 14, 2013 |
Period from August 15, 2013 to June 30, 2014 |
Fiscal year ended June 30, 2015 |
Twelve months ended June 30, 2014 |
Twelve months ended June 30, 2015 |
||||||||||||||||||
| Net income (loss) |
$ | 9,333 | $ | (23,685 | ) | $ | (51,648 | ) | $ | 7,026 | $ | (120,420 | ) | $ | 14,172 | |||||||||
| Depreciation and amortization |
36,660 | 3,772 | 73,206 | 131,703 | 142,466 | 135,768 | ||||||||||||||||||
| Interest expense |
24,546 | 3,991 | 43,215 | 75,437 | 84,983 | 77,936 | ||||||||||||||||||
| Income tax expense (benefit) |
4,195 | (15,621 | ) | (19,481 | ) | (1,880 | ) | (45,425 | ) | 7,399 | ||||||||||||||
|
|
|
|
|
|
|
|
|
|
|
|
|
|||||||||||||
| EBITDA |
74,734 | (31,543 | ) | 45,292 | 212,286 | 61,604 | 235,275 | |||||||||||||||||
| Transaction costs (a) |
3,080 | 28,370 | 38,844 | 13,630 | 85,224 | 2,203 | ||||||||||||||||||
| Management fees (b) |
2,315 | 264 | — | — | 4,882 | 236 | ||||||||||||||||||
| Stock based and deferred compensation (c) |
2,578 | 125 | 1,534 | 5,722 | 1,618 | 5,722 | ||||||||||||||||||
| Multi-employer plan exits (d) |
— | (676 | ) | 9,250 | — | 8,574 | — | |||||||||||||||||
| Debt extinguishment costs (e) |
4,140 | 14,042 | — | 1,019 | 14,042 | 1,019 | ||||||||||||||||||
| Purchase accounting adjustments (f) |
— | — | 10,836 | 3,094 | 6,415 | 3,094 | ||||||||||||||||||
| Restructuring charges (g) |
736 | 3 | 10,037 | 6,419 | 30,542 | 7,307 | ||||||||||||||||||
| (Gain) loss on sale of fixed assets (h) |
(853 | ) | (96 | ) | 2,278 | 584 | 3,221 | 428 | ||||||||||||||||
| Impairment charges (i) |
2,112 | — | 1,006 | — | 3,348 | — | ||||||||||||||||||
| Foreign currency (gains) losses |
220 | (364 | ) | (777 | ) | (12,171 | ) | — | (12,171 | ) | ||||||||||||||
| Other adjustments to EBITDA (k) |
(2,387 | ) | 346 | 490 | 379 | 1,756 | 955 | |||||||||||||||||
|
|
|
|
|
|
|
|
|
|
|
|
|
|||||||||||||
| Adjusted EBITDA |
$ | 86,675 | $ | 10,471 | $ | 118,790 | $ | 230,962 | $ | 221,226 | $ | 244,068 | (5) | |||||||||||
|
|
|
|
|
|
|
|
|
|
|
|
|
|||||||||||||
22
Table of Contents
| Year ended June 30, | Pro forma year ended June 30, |
|||||||||||||||||||||||||||||||||||||||
| (Dollars in thousands) | 2006 | 2007 | 2008 | 2009 | 2010 | 2011 | 2012 | 2013 | 2014 | 2015 | ||||||||||||||||||||||||||||||
| Net income (loss) |
$ | (12,564 | ) | $ | 2,101 | $ | 1,285 | $ | (2,088 | ) | $ | 4,677 | $ | 3,195 | $ | 4,136 | $ | 9,333 | $ | (120,420 | ) | $ | 14,172 | |||||||||||||||||
| Depreciation and amortization |
15,302 | 21,055 | 22,888 | 27,868 | 31,674 | 32,699 | 38,841 | 36,660 | 142,466 | 135,768 | ||||||||||||||||||||||||||||||
| Interest expense |
10,296 | 12,710 | 13,396 | 17,534 | 15,902 | 17,515 | 19,490 | 24,546 | 84,983 | 77,936 | ||||||||||||||||||||||||||||||
| Income tax expense (benefit) |
1,080 | (5,778 | ) | 2,382 | 299 | 4,248 | 6,589 | 1,260 | 4,195 | (45,425 | ) | 7,399 | ||||||||||||||||||||||||||||
|
|
|
|
|
|
|
|
|
|
|
|
|
|
|
|
|
|
|
|
|
|||||||||||||||||||||
| EBITDA |
14,114 | 30,088 | 39,951 | 43,613 | 56,501 | 59,998 | 63,727 | 74,734 | 61,604 | 235,275 | ||||||||||||||||||||||||||||||
| Transaction costs (a) |
711 | — | 969 | 388 | — | 8,642 | — | 3,080 | 85,224 | 2,203 | ||||||||||||||||||||||||||||||
| Management fees (b) |
814 | 1,049 | 990 | 1,373 | 1,521 | 1,730 | 1,984 | 2,315 | 4,882 | 236 | ||||||||||||||||||||||||||||||
| Equity based and deferred compensation (c) |
1,520 | 1,520 | 1,520 | 1,564 | 578 | 197 | 600 | 2,578 | 1,618 | 5,722 | ||||||||||||||||||||||||||||||
| Multi-employer plan exits (d) |
— | — | — | — | — | — | 4,591 | — | 8,574 | — | ||||||||||||||||||||||||||||||
| Debt extinguishment costs (e) |
— | — | — | — | — | — | — | 4,140 | 14,042 | 1,019 | ||||||||||||||||||||||||||||||
| Purchase accounting adjustments (f) |
3,250 | — | — | — | — | 251 | 1,310 | — | 6,415 | 3,094 | ||||||||||||||||||||||||||||||
| Restructuring charges (g) |
— | — | — | 1,562 | 563 | 1,444 | 3,717 | 736 | 30,542 | 7,307 | ||||||||||||||||||||||||||||||
| (Gain) loss on sale of fixed assets (h) |
— | — | — | 107 | (257 | ) | 260 | (359 | ) | (853 | ) | 3,221 | 428 | |||||||||||||||||||||||||||
| Impairment charges (i) |
— | — | — | — | — | — | 7,705 | 2,112 | 3,348 | — | ||||||||||||||||||||||||||||||
| Legal settlement (j) |
— | — | 300 | 99 | — | (1,620 | ) | 120 | — | — | |
— |
| |||||||||||||||||||||||||||
| Foreign currency (gains) losses |
— | — | — | — | — | — | — | 220 | — | (12,171 | ) | |||||||||||||||||||||||||||||
| Other adjustments to EBITDA (k) |
— | — | 173 | 527 | 309 | 19 | 3,140 | (2,387 | ) | 1,756 | 955 | |||||||||||||||||||||||||||||
|
|
|
|
|
|
|
|
|
|
|
|
|
|
|
|
|
|
|
|
|
|||||||||||||||||||||
| Adjusted EBITDA |
$ | 20,409 | $ | 32,657 | $ | 43,903 | $ | 49,233 | $ | 59,215 | $ | 70,921 | $ | 86,535 | $ | 86,675 | $ | 221,226 | $ | 244,068 | (5) | |||||||||||||||||||
|
|
|
|
|
|
|
|
|
|
|
|
|
|
|
|
|
|
|
|
|
|||||||||||||||||||||
| (a) | Fees related to change in equity ownership, mergers and acquisitions. |
| (b) | We entered into a management agreement with an affiliate which required quarterly payments equal to the greater of a fixed annual fee or a percentage of our annual EBITDA. The successor sponsors do not have an annual management fee. |
| (c) | We record expense related to equity compensation, contingent compensation based on performance targets of CD Cartondruck AG (which we acquired in 2011), as well as deferred compensation agreements from certain acquisitions. |
| (d) | We participated in three multi employer pension plans and recorded a liability for all three plans. In 2014, we exited one of the plans which resulted in a gain. |
| (e) | We settled the remaining principal balance of the Predecessor debt which resulted in fees as well as a write-off of old deferred finance fees. For the fiscal year ended June 30, 2015, we recorded extinguishment of debt in the amount of $1,019 for the pro rata share of deferred financing fees and original issue discount that was extinguished. |
| (f) | Relates to amortization of purchase price/inventory adjustments in connection with purchase accounting fair valuation, amortization of deferred revenue related to government grants and fair value lease amortization as of the applicable opening balance sheet date. |
| (g) | Costs relating to reorganization. |
| (h) | Gains or losses incurred due to the sale of fixed assets. |
| (i) | Includes impairment charges associated with the write-off of non-consolidated investments, and a non-cash trade name impairment which was the result of management’s decision to discontinue investment in a legacy trade name. |
23
Table of Contents
| (j) | Costs associated with a non-operating legal settlement. |
| (k) | Comprised of: (i) currency gains and losses, (ii) gain on settlement of Series C shares, (iii) gains on derivatives, (iv) other interest costs and (v) contract amortization cost. |
| (5) | Does not include $2.0 million of EBITDA and net income for the twelve-month period ended June 30, 2015 for BP Media, which we acquired on July 1, 2015. |
| (6) | Adjusted EBITDA margin represents Adjusted EBITDA for the relevant period divided by net sales. The table below sets forth the calculation of our Adjusted EBITDA margin. |
| Year ended June 30, | Pro forma year ended June 30, |
|||||||||||||||||||||||||||||||||||||||
| (Dollars in thousands) |
2006 | 2007 | 2008 | 2009 | 2010 | 2011 | 2012 | 2013 | 2014 | 2015 | ||||||||||||||||||||||||||||||
| Adjusted EBITDA |
$ | 20,409 | $ | 32,657 | $ | 43,903 | $ | 49,233 | $ | 59,215 | $ | 70,921 | $ | 86,535 | $ | 86,675 | $ | 221,226 | $ | 244,068 | (5) | |||||||||||||||||||
|
|
|
|
|
|
|
|
|
|
|
|
|
|
|
|
|
|
|
|
|
|||||||||||||||||||||
| Net sales |
208,663 | 276,728 | 344,147 | 404,374 | 484,133 | 514,695 | 596,414 | 579,401 | 1,902,429 | 1,807,513 | ||||||||||||||||||||||||||||||
|
|
|
|
|
|
|
|
|
|
|
|
|
|
|
|
|
|
|
|
|
|||||||||||||||||||||
| Adjusted EBITDA % |
9.8% | 11.8% | 12.8% | 12.2% | 12.2% | 13.8% | 14.5% | 15.0% | 11.6% | (a) | 13.5% | (a) | ||||||||||||||||||||||||||||
|
|
|
|
|
|
|
|
|
|
|
|
|
|
|
|
|
|
|
|
|
|||||||||||||||||||||
| (a) | Reflects the acquisitions we made through June 30, 2015 as if they occurred on July 1, 2013. The pro forma Adjusted EBITDA margin is lower than historical periods primarily due to the lower historical Adjusted EBITDA margin for the acquired ASG businesses and is reflective of the potential accretion opportunity available to us. |
| (7) | Free cash flow represents Adjusted EBITDA less capital expenditures. Free cash flow conversion represents free cash flow divided by Adjusted EBITDA. The table below sets forth our free cash flow and free cash flow conversion. |
| Year ended June 30, | Pro forma year ended June 30, |
|||||||||||||||||||||||||||||||||||||||
| (Dollars in thousands) | 2006 | 2007 | 2008 | 2009 | 2010 | 2011 | 2012 | 2013 | 2014 | 2015 | ||||||||||||||||||||||||||||||
| Adjusted EBITDA |
$ | 20,409 | $ | 32,657 | $ | 43,903 | $ | 49,233 | $ | 59,215 | $ | 70,921 | $ | 86,535 | $ | 86,675 | $ | 221,226 | $ | 244,068 | (5) | |||||||||||||||||||
| Capital Expenditures |
(14,939 | ) | (15,280 | ) | (12,214 | ) | (11,662 | ) | (13,732 | ) | (12,671 | ) | (24,345 | ) | (22,433 | ) | (72,354 | ) | (62,483) | |||||||||||||||||||||
|
|
|
|
|
|
|
|
|
|
|
|
|
|
|
|
|
|
|
|
|
|||||||||||||||||||||
| Free Cash Flow |
$ | 5,470 | $ | 17,377 | $ | 31,689 | $ | 37,571 | $ | 45,483 | $ | 58,250 | $ | 62,190 | $ | 64,242 | $ | 148,872 | $ | 181,585 | ||||||||||||||||||||
|
|
|
|
|
|
|
|
|
|
|
|
|
|
|
|
|
|
|
|
|
|||||||||||||||||||||
| Free Cash Flow Conversion |
27% | 53% | 72% | 76% | 77% | 82% | 72% | 74% | 67% | 74% | ||||||||||||||||||||||||||||||
|
|
|
|
|
|
|
|
|
|
|
|
|
|
|
|
|
|
|
|
|
|||||||||||||||||||||
24
Table of Contents
An investment in our common shares involves a high degree of risk. You should consider carefully the following risks, together with the other information contained in this prospectus, before you decide whether to buy our common shares. If any of the events contemplated by the following discussion of risks should occur, our business, results of operations, financial condition and cash flows could suffer significantly. As a result, the market price of our common shares could decline, and you may lose all or part of the money you paid to buy our common shares. The following is a summary of all the material risks known to us.
Risks Related to Our Business
We face competition in our markets, which may harm our financial performance and growth prospects.
We operate in a competitive market in which we face competition in each of our product lines from numerous competitors. We compete on the basis of product quality and reliability, breadth of product offering, manufacturing capability and flexibility, delivery times and range, technical capability, product innovation, customer service, price and completeness of order fulfillment. Certain of our competitors may have lower operating costs, greater operational flexibility, greater productive capacity, more financial flexibility and other resources that are greater than ours. We also face competition to a certain extent from companies that produce alternative products including plastic, board, paper, foil-based and other products that we do not currently offer. In addition, changes within the packaging industries, including the consolidation of our competitors, and consolidation of our customers, have occurred and may continue to occur. As a result of the foregoing factors, we may lose customers or be forced to reduce prices, which could have a material adverse effect on our business, financial condition and operating results. In addition, because of the level of fixed costs in our specialty print-based packaging business, our profitability is sensitive to changes in the balance between supply and demand in the specialty print-based packaging market. Competitors with lower operating costs than ours will have a competitive advantage over us with respect to products that are particularly price-sensitive. Increased production capacity within the industry could cause an oversupply resulting in lower prices, which could have a material adverse effect on our business, financial condition and operating results.
Our business performance may be impacted by general economic conditions, including downturns in the geographies and target markets that we serve.
The growth of our business and demand for our products is affected by changes in the health of the overall global economy and regional economies. Demand for our products is principally driven by consumer consumption of the products sold in the packages or with the inserts and labels we produce, which is affected by general economic conditions and changes in consumer preferences. Our primary end markets are consumer products, such as personal care, spirits, cosmetics and confectionary products, healthcare products, such as pharmaceuticals, medical devices, nutritional supplements and vitamins, and multi-media products, such as home videos, video games and software. Downturns or periods of economic weakness in these markets could result in decreased demand for our products. In general, our business may be adversely affected by decreases in the overall level of global economic activity, such as decreases in business and consumer spending. In particular, our business could be adversely affected by any economic downturn that results in difficulties for any of our major customers.
We may encounter difficulties in restructuring operations, closing facilities and disposing of assets and facilities.
We have closed facilities, sold assets and otherwise restructured operations in an effort to improve our cost competitiveness and profitability. Some of these activities are ongoing, and there is no guarantee that any such activities will not divert the attention of management or disrupt our operations or achieve the intended cost and operations improvements. These activities, and any future activities we may undertake, could have a material adverse effect on our business, financial condition and operating results.
25
Table of Contents
If we are unable to successfully integrate our acquisitions and identify and integrate future acquisitions, our results of operations could be adversely affected.
We have completed a number of acquisitions, including the transformative combination with Chesapeake. We continue to integrate acquisitions into our business, but may not be able to do so successfully. Furthermore, we may seek to identify and complete additional acquisitions that meet our strategic and financial return criteria. However, there can be no assurance that we will be able to locate suitable targets or acquire them on acceptable terms or, because of limitations imposed by the agreements governing our indebtedness, that we will be able to finance future acquisitions. Acquisitions involve a number of risks, including risks related to:
| • | the diversion of management’s attention and resources to the assimilation of the acquired companies and their employees and to the management of expanding operations; |
| • | increased costs of integration activities; |
| • | disruption of our existing business operations; |
| • | the incorporation of acquired products into our current offerings; |
| • | problems associated with maintaining relationships with employees and customers of acquired businesses as a result of changes in ownership and management; |
| • | the increasing demands on our operational systems resulting from integration of the systems of acquired businesses; |
| • | the ability to integrate and implement effective disclosure controls and procedures and internal controls over financial reporting within the allowable timeframe; |
| • | possible adverse effects on our reported operating results, particularly during the first several reporting periods after such acquisitions are completed; and |
| • | the difficulty of converting acquired companies to our corporate culture and brands. |
We may become responsible for unanticipated liabilities and contingencies that we failed or were unable to discover in the course of performing due diligence in connection with historical acquisitions or any future acquisitions. We have typically required sellers to indemnify us against certain undisclosed liabilities. However, we cannot assure you that indemnification rights we have obtained, or will in the future obtain, will be enforceable, collectible or sufficient in amount, scope or duration to fully offset the possible liabilities associated with the business or property acquired. Any of these liabilities, individually or in the aggregate, could have a material adverse effect on our business, financial condition and results of operations.
In addition, we may not be able to successfully integrate future acquisitions without substantial costs, delays or other problems. The costs of such integration could have a material adverse effect on our operating results and financial condition. Although we conduct what we believe to be a prudent level of investigation regarding the businesses we purchase, in light of the circumstances of each transaction, an unavoidable level of risk remains regarding the actual condition of these businesses. Until we actually assume operating control of such businesses and their assets and operations, we may not be able to ascertain the actual value or understand the potential liabilities of the acquired entities and their operations.
We may not realize the growth opportunities and cost savings and synergies that are anticipated from our acquisitions and the other initiatives that we undertake.
The benefits that we expect to achieve as a result of our acquisitions will depend in part on our ability to realize anticipated growth opportunities and cost savings and synergies. Our success in realizing these opportunities and synergies and the timing of this realization depend on the successful integration of the acquired businesses and operations with our business and operations and the adoption of best practices. Even if we are able to integrate these businesses and operations successfully, this integration may not result in the realization of the full benefits
26
Table of Contents
of the growth opportunities and synergies we currently expect from this integration within the anticipated timeframe or at all. Accordingly, the benefits from these acquisitions may be offset by unanticipated costs or delays in integrating the companies.
Furthermore, we may not realize all of the cost savings and synergies we expect to achieve from our current strategic initiatives due to a variety of risks, including, but not limited to, difficulties in integrating shared services within our business, higher than expected employee severance or retention costs, higher than expected overhead expenses, delays in the anticipated timing of activities related to our cost savings plans and other unexpected costs associated with operating our business. If we are unable to achieve the cost savings or synergies that we expect to achieve from our strategic initiatives, or if the implementation of these initiatives adversely affect our operations or cost more or take longer to effectuate than we expect, it could adversely affect our business, financial condition and results of operations.
If we cannot effectively anticipate technology trends and develop and market new products to respond to changing customer preferences and regulatory environment, our revenue, earnings and cash flow could be adversely affected.
We are a specialty packaging company serving the consumer, healthcare and multi-media markets. Our success in these markets depends on our ability to offer differentiated solutions to capture market share and grow scale. To enable this, we must continually develop and introduce new products and services in a timely manner to keep pace with technological and regulatory developments and achieve customer acceptance. In addition, the services and products that we provide to customers may not meet the needs of our customers as the business models of our customers evolve. Our customers may decide to decrease their product packaging or forego the packaging of certain products entirely. Regulatory developments can also significantly alter the market for our solutions. For example, a move to electronic distribution of disclaimers and other paperless regimes could negatively impact our healthcare inserts and labels businesses. In addition, it is difficult to successfully predict the products and services our customers will demand. The success of our business depends in part on our ability to identify and respond promptly to changes in customer preferences, expectations and needs. If we do not timely assess and respond to changing customer expectations, preferences and needs, our financial condition, results of operations or cash flows could be adversely affected.
The impact of electronic media and similar technological changes, including the substitution of physical products for digital content, may continue to adversely affect sales in the multi-media end market.
The multi-media landscape is experiencing rapid change due to the impact of electronic media and digital content delivery on the demand for physical products. Improvements in the accessibility and quality of digital media through the online distribution and hosting of media content, pay-per-view and on-demand entertainment services and mobile technologies has resulted, and will likely continue to result, in increased digital substitution by consumers. Ongoing consumer acceptance of such digital media will result in a decrease in demand for physical music, video game and home video units. This will likely in turn decrease the demand for certain of our multi-media packaging solutions and consequently result in reduced pricing for our products, which could adversely affect our business, financial condition and results of operations. For example, our multi-media sales in Europe have declined in each of the two most recent fiscal years and would have declined in North America over the same period if not for the increased sales that resulted from the ASG acquisition.
We are affected by seasonality.
Historically, our business experiences some seasonal fluctuations, with a greater portion of our consumer and multi-media sales occurring in the first and second fiscal quarters, reflecting increased demand for our customers’ products during the holiday selling seasons. In addition, healthcare sales are generally stronger in the second and third fiscal quarters, which correspond with the annual cold and flu season. As a result of this seasonality, any factors negatively affecting us during these periods of any year, including unfavorable economic
27
Table of Contents
conditions, could have a material adverse effect on our financial condition and results of operations for the entire year.
Our operations could expose us to significant regulations and compliance expenditures as a result of environmental, health and safety laws.
Our business and facilities are subject to a wide range of federal, state, local and foreign general and industry-specific environmental, health and safety laws and regulations, including those relating to air emissions, wastewater discharges, management and disposal of regulated materials and site remediation. Certain of our operations require environmental permits or other approvals from governmental authorities, and certain of these permits and approvals are subject to expiration, denial, revocation or modification under various circumstances. We are also subject to frequent inspections and monitoring by government enforcement authorities. Compliance with these laws, regulations, permits and approvals is a significant factor in our business. From time to time we incur, and may in the future incur, significant capital and operating expenditures to achieve and maintain compliance with applicable environmental laws, regulations, permits and approvals. Our failure to comply with applicable environmental laws and regulations or permit or approval requirements could result in substantial civil or criminal fines or penalties or enforcement actions, including regulatory or judicial orders enjoining or curtailing operations or requiring remedial or corrective measures, installation of pollution control equipment or other actions or costs, which could have a material adverse effect on our business, financial condition and operating results.
In addition, as an owner and operator of real estate, we may be responsible under environmental laws and regulations for the investigation, remediation and monitoring, as well as associated costs, expenses and third-party damages, including tort liability and natural resource damages, relating to past or present releases or threats of releases of regulated materials at, on, under or from our properties. Liability under these laws may be imposed without regard to whether we knew of or were responsible for the presence of those materials on our property; may be joint and several, meaning that the entire liability may be imposed on each party without regard to contribution; and may be retroactive and may not be limited to the value of the property. In addition, we or others may discover new material environmental liabilities, including liabilities related to third-party owned properties that we or our predecessors formerly owned or operated, or at which we or our predecessors have disposed of, or arranged for the disposal of, certain regulated materials. We may be involved in administrative or judicial proceedings and inquiries in the future relating to such environmental matters, which could have a material adverse effect on our business, financial condition and operating results.
New environmental laws or regulations (or changes in existing laws or regulations or their enforcement) may be enacted that require significant expenditures by us. If the resulting expenses significantly exceed our expectations, our business, financial condition and operating results could be materially and adversely affected.
We are also subject to various federal, state, local and foreign requirements concerning safety and health conditions at our manufacturing facilities. The operation of manufacturing facilities involves many risks, including the failure or substandard performance of equipment, suspension of operations and new governmental statutes, regulations, guidelines and policies. Our and our customers’ operations are also subject to various hazards incidental to the production, use, handling, processing, storage and transportation of certain hazardous materials. These hazards can cause personal injury, severe damage to and destruction of property and equipment and environmental damage. Furthermore, we may become subject to claims with respect to workplace exposure, workers’ compensation and other matters. We may be subject to material financial penalties or liabilities for noncompliance with safety and health requirements, as well as potential business disruption, if any of our facilities or a portion of any facility is required to be temporarily closed as a result of any significant injury or any noncompliance with applicable requirements.
The occurrence of material operational problems, including, but not limited to, the above events, could have a material adverse effect on our business, financial condition and results of operations.
28
Table of Contents
A significant part of our business is conducted outside of the United States, exposing us to additional risks that may not exist in the United States, which in turn could cause our business and operating results to suffer.
We have material operations outside of the United States. For the twelve months ended June 30, 2015, approximately 58% of our total net sales, on an acquisition adjusted pro forma basis, were generated from sales outside of the United States. Our international operations are subject to risks, including risks related to:
| • | foreign currency exchange rate fluctuations, including devaluations; |
| • | local political or economic instability, including local inflationary pressures; |
| • | restrictive government regulation, including changes in governmental regulation; |
| • | changes in import/export duties; |
| • | changes in laws and policies, including the laws and policies of the United States, affecting trade and foreign investment; |
| • | lack of experience in certain foreign markets; |
| • | difficulties and costs of staffing and managing operations in certain foreign countries; |
| • | work stoppages or other changes in labor conditions in foreign jurisdictions, which tend to have more expansive legal rights for labor unions and works councils; |
| • | difficulties in enforcing agreements and collecting accounts receivables on a timely basis or at all; and |
| • | adverse tax consequences or overlapping tax structures. |
We plan to continue to market and sell our products internationally to respond to customer requirements and market opportunities. Establishing operations in any foreign country or region presents risks such as those described above as well as risks specific to the particular country or region. In addition, until a payment history is established over time with customers in a new geographic area or region, the likelihood of collecting receivables generated by such operations could be less than our expectations. As a result, there is a greater risk that the reserves set with respect to the collection of such receivables may be inadequate. If our operations in any foreign country are unsuccessful, we could incur significant losses and we may not be profitable.
In addition, changes in policies or laws of the United States or foreign governments resulting in, among other things, changes in regulations and the approval process, higher taxation, currency conversion limitations, restrictions on fund transfers or the expropriation of private enterprises, could reduce the anticipated benefits of our international expansion. If we fail to realize the anticipated revenue growth of our future international operations, our business and operating results could suffer.
Currency risk may adversely affect our financial condition and cash flows.
A substantial portion of our revenues are derived from outside the United States. We anticipate that revenues from international customers will continue to represent a substantial portion of our revenues for the foreseeable future. Because we generate revenues in foreign currencies, we are subject to the effects of exchange rate fluctuations. For the preparation of our consolidated financial statements, the financial results of our foreign subsidiaries are translated into U.S. dollars using average exchange rates during the applicable period. If the U.S. dollar appreciates against the foreign currencies, as has occurred in recent months, the revenues we recognize from sales by certain of our subsidiaries and the value of balance sheet items denominated in foreign currencies will be adversely impacted.
Furthermore, many of our foreign operations import or buy raw materials in a currency other than their functional currency, which can impact the operating results for these operations if we are unable to mitigate the impact of the currency exchange fluctuations. We may not be successful in achieving natural balances in currencies
29
Table of Contents
throughout our international operations. In addition, if the effective price of our products were to increase as a result of fluctuations in foreign currency exchange rates, demand for our products could decline and adversely affect our results of operations and financial condition. We cannot accurately predict the effects of exchange rate fluctuations upon our future operating results because of the number of currencies involved, the variability of currency exposures and the potential volatility of currency exchange rates. Accordingly, fluctuations in foreign exchange rates may have an adverse effect on our financial condition and cash flows.
Our largest customers together have historically accounted for a significant portion of our net sales volume. Accordingly, our business may be adversely affected by the loss of, or reduced purchases by, one or more of our large customers.
For the twelve months ended June 30, 2015, our largest single customer accounted for 5% of our acquisition adjusted pro forma net sales and our top ten customers accounted for approximately 26% of our acquisition adjusted pro forma net sales. On occasion, a customer may relocate where certain of its products are manufactured to a location which we are not able to serve, resulting in the loss of business. If, for this or any other reason, one of our key customers were to purchase significantly less of our products in the future or were to terminate its purchases from us, and we are not able to sell our products to new customers at comparable or greater levels, it could have a material adverse effect on our business, prospects, financial condition and results of operations.
Our business may suffer if we are unable to attract and retain key personnel.
We depend on the members of our management team and other key personnel. These employees have industry experience and relationships that we rely on to successfully implement our business plan. The loss of the services of our management team and/or other key personnel or the lack of success in attracting or retaining new and/or replacement personnel could have a material adverse effect on our business, financial position and results of operations.
Increased information technology security threats and more sophisticated and targeted cybercrime could pose a risk to our systems, networks, products, solutions and services.
Increased global security threats and more sophisticated and targeted cybercrime pose a risk to the security of our systems and networks and the confidentiality, availability and integrity of our data. While we attempt to mitigate these risks by employing a number of measures, including employee training, comprehensive monitoring of our networks and systems and maintenance of backup and protective systems, our systems, networks, products, solutions and services remain potentially vulnerable to advanced persistent threats. Depending on their nature and scope, such threats could potentially lead to the compromise of confidential information, improper use of our systems and networks, manipulation and destruction of data, defective products, production downtimes and operational disruptions, which in turn could adversely affect our reputation, competitiveness and results of operations.
Our business and financial performance may be harmed by future increases in raw material costs.
Our business requires various raw materials which are purchased from third-party suppliers. These materials include paperboard, foils, inks, adhesives, coatings, resins, films, waxes, other chemicals and packaging supplies. The costs of these materials are subject to market fluctuations that are beyond our control. Future market conditions and/or the terms of our contracts with customers may prevent us from passing on raw material cost increases to our customers through selling price increases. In addition, we may not be able to achieve manufacturing productivity gains or other cost reductions to offset the impact of rising raw material cost. As a result, higher raw material costs may have a material adverse effect on our business, financial condition and operating results.
30
Table of Contents
Unforeseen or recurring operational problems at any of our facilities may cause significant lost production.
Our manufacturing process could be affected by operational problems that could impair our production capability. Each of our facilities contains complex and sophisticated machines that are used in our manufacturing process. Disruptions or shutdowns at any of our facilities could be caused by:
| • | outages to conduct maintenance activities that cannot be performed safely during operations; |
| • | prolonged power failures or reductions, including the effect of lightning strikes on our electrical supply; |
| • | breakdown, failure or substandard performance of any of our presses, diecutters and print and packaging-related machinery or other equipment; |
| • | noncompliance with material environmental requirements or permits; |
| • | disruptions in the transportation infrastructure, including railroad tracks, bridges, tunnels or roads; |
| • | fires, floods, earthquakes, tornadoes, hurricanes, significant winter storms or other catastrophic disasters; or |
| • | other operational problems. |
If our facilities are shut down, they may experience delays due to startup periods, regardless of the reason for the shutdown. Those startup periods could range from several days to several weeks or longer, depending on the reason for the shutdown and other factors. Any prolonged disruption in operations at any of our facilities could cause significant lost production, which would have a material adverse effect on our business, financial condition and operating results. To avoid such disruptions, we may also be required to incur substantial costs in keeping our facilities in good operating condition.
Labor disputes or increased labor costs could materially adversely affect our operating results.
As of June 30, 2015, we employed approximately 8,900 people, of which 3,400 are located in North America, 4,600 are located in Europe and the remainder are located in Asia. The majority of our workforce is non-union; however, we do participate in some collective bargaining agreements with various unions, which provide specified benefits to certain union employees, and certain of our employees in foreign jurisdictions are represented by works councils. Approximately 7% of our employees in North America are unionized and approximately 72% of our employees in Europe are members of a union or works council or otherwise covered by labor agreements. The labor agreements with our North American unions are set to expire at various dates between 2016 and 2017, at which time we expect to negotiate a renewal of such agreements. To date, we have not experienced a stoppage in work or poor labor relations at any of our facilities. Management believes that our relations with our employees are good; however, as these labor contracts expire, there can be no assurances that there will be no strikes, work stoppages or other labor disputes as we negotiate new or renewed contracts. Any significant work stoppages or any significant increase in labor costs could have a material adverse effect on our business, financial condition and operating results.
Failure of quality control measures and systems resulting in faulty or contaminated product could have a material adverse effect on our business.
We have quality control measures and systems in place to ensure the maximum safety and quality of our products. The consequences of a product not meeting these standards due to, among other things, accidental or malicious raw materials contamination or supply chain contamination caused by human error or equipment fault, could be severe. Such consequences might include adverse effects on consumer health, litigation exposure, loss of market share, financial costs and loss of revenues.
31
Table of Contents
In addition, if our products fail to meet our usual standards, we may be required to incur substantial costs in taking appropriate corrective action (up to and including recalling products from end consumers) and to reimburse customers and/or end consumers for losses that they suffer as a result of this failure. Customers and end consumers may seek to recover these losses through litigation and, under applicable legal rules, may succeed in any such claim despite there being no negligence or other fault on our part. Placing an unsafe product on the market, failing to notify the regulatory authorities of a safety issue, failing to take appropriate corrective action and failing to meet other regulatory requirements relating to product safety could lead to regulatory investigation, enforcement action and/or prosecution. Any product quality or safety issue may also result in adverse publicity, which may damage our reputation. This could in turn have a material adverse effect on our business, financial condition and results of operations. Although we have not had material claims for damages for defective products in the past and have not conducted any substantial product recalls or other material corrective action in recent years, these events may occur in the future.
In certain contracts, we provide guarantees that our products are produced in accordance with customer specifications regarding the proper functioning of our products and the conformity of a product to the specific use defined by the customer. In addition, if the product contained in packaging manufactured by us is faulty or contaminated, it is possible that the manufacturer of the product in question may allege that the packaging we provided is the cause of the fault or contamination, even if the packaging complies with contractual specifications. If packaging produced by us fails to open properly or to preserve the integrity of its contents, we could face liability to our customers and to third parties for bodily injury or other tangible or intangible damages suffered as a result. Such liability, if it were to be established in relation to a sufficient volume of claims or to claims for sufficiently large amounts, could have a material adverse effect on our business, financial condition and results of operations.
The occurrence or threat of extraordinary events, including natural disasters and domestic and international terrorist attacks, may disrupt our operations and decrease demand for our products.
Natural disasters and other weather-related disruptions and domestic and international terrorist attacks could affect our ability to sell to our customers by impacting many of our customers and our suppliers of certain raw materials, which would have an adverse impact on volume and cost for some of our products. If natural disasters or terrorist attacks occur in the future, they could negatively affect the results of operations in the affected regions, as well as have adverse impacts on the global economy.
Our energy or transportation costs may be higher than we anticipated, which could have a material adverse effect on our business, financial condition and operating results.
Energy, including energy sourced from coal, diesel fuel, electricity and natural gas, represents a significant portion of our manufacturing costs. At times, energy costs have fluctuated significantly and such fluctuations have primarily impacted us in the logistics processes, with a more minor impact on manufacturing costs. In addition, we distribute our products primarily by truck and rail. Reduced availability of trucks or rail cars could negatively impact our ability to ship our products in a timely manner. There can be no assurance that we will be able to recoup any increases in transportation rates or fuel surcharges through price increases for our products. If energy or transportation costs are greater than anticipated, our business, financial condition and operating results may be materially adversely affected.
If we are unable to develop product innovations and improve our production technology and expertise, we could lose customers or market share.
Our success may depend on our ability to adapt to technological changes in the specialty print-based packaging industry. If we are unable to develop and introduce new products on a timely basis, or enhance existing products, in response to changing market conditions or customer requirements or demands, our business, financial condition and operating results could be materially adversely affected.
32
Table of Contents
We are subject to litigation in the ordinary course of business, and uninsured judgments or a rise in insurance premiums may adversely impact our results of operations.
In the ordinary course of business, we are subject to various claims and litigation, including actions brought against us by our employees. Any such claims, regardless of merit, could be time-consuming and expensive to defend and could divert management’s attention and resources. For instance, in our healthcare end market, we print information on our labels, inserts and packages that, if incorrect, could give rise to product liability claims.
In accordance with customary practice, we maintain insurance against some, but not all, of these potential claims. We may elect not to obtain insurance if we believe that the cost of available insurance is excessive relative to the risks presented. The levels of insurance we maintain may not be adequate to fully cover any and all losses or liabilities. Further, we may not be able to maintain insurance at commercially acceptable premium levels or at all.
If any significant accident, judgment, claim (or a series of claims) or other event is not fully insured or indemnified against, it could have a material adverse impact on our business, financial condition and results of operations. There can be no assurance as to the actual amount of these liabilities or the timing thereof. We cannot be certain that the outcome of current or future litigation will not have a material adverse impact on our business and results of operations.
Our total assets include substantial amounts of goodwill and intangible assets and an impairment of our goodwill or intangible assets could adversely affect our results of operations.
Goodwill and intangible assets represented approximately 48% of our total assets as of June 30, 2015. We evaluate our goodwill for impairment on an annual basis and at other times during the year if events or circumstances indicate that it is more likely than not that the fair value is below the carrying value. We evaluate intangible assets for impairment when facts or circumstances suggest that the carrying value of these assets may not be recoverable. Our evaluation of impairment requires us to make certain estimates and assumptions, including projections of future results. Such estimates and assumptions may not prove to be accurate in the future. After performing our evaluation for impairment, including an analysis to determine the recoverability of intangible assets, we will record a noncash impairment loss when the carrying value of the underlying asset, asset group or reporting unit exceeds its fair value. If these impairment losses are significant, our results of operations could be adversely affected.
Our business operations are subject to a number of U.S. federal laws and regulations, including trade sanctions administered by the Office of Foreign Assets Control of the U.S. Department of Treasury and the U.S. Department of Commerce, as well as restrictions imposed by the Foreign Corrupt Practices Act, which could adversely affect our operations if violated.
We must comply with all applicable export control laws and regulations of the United States and other countries. We cannot provide products or services to certain countries or individuals subject to U.S. trade sanctions administered by the Office of Foreign Assets Control of the U.S. Department of the Treasury or the U.S. Department of Commerce. In addition, we are subject to the Foreign Corrupt Practices Act and the anti-corruption laws of other countries, which generally prohibit bribes of anything of value, including unreasonable gifts, to government officials. While we have implemented safeguards and policies designed to promote compliance with applicable laws, these safeguards and policies may prove to be less than effective, and our employees or agents may engage in conduct for which we might be held responsible. Violations of these laws or regulations could result in significant sanctions including fines, onerous compliance requirements, the denial of export privileges, reputational damage and loss of authorizations needed to conduct aspects of our international business, which could adversely affect our business, financial condition and results of operations.
33
Table of Contents
Existing and proposed regulations to address climate change by limiting greenhouse gas emissions may cause us to incur significant additional operating and capital expenses.
Certain of our operations result in emissions of greenhouse gases (“GHG”), such as carbon dioxide and methane. Growing concern about the sources and impacts of global climate change has led to a number of national and supranational legislative and administrative measures, both proposed and enacted, to monitor, regulate and limit carbon dioxide and other GHG emissions, including in the United States, the European Union and China. Such measures, for example, could adversely affect our energy supply, or the costs (and types) of raw materials we use for fuel, or impose costs on us associated with GHG emissions resulting from our operations. Although we believe it is likely that GHG emissions will continue to be regulated in the United States, the European Union, China and elsewhere in the future, we cannot yet predict the form such regulation will take (such as a cap-and-trade program, technology mandate, emissions tax or other regulatory mechanism) or, consequently, estimate the direct or indirect financial impact to our business.
We are exposed to risks in connection with the funding of our pension commitments.
We operate three defined benefit pension plans in the United Kingdom: the Field Group Pension Plan (“FGPP”), the Chesapeake Pension Plan (“CPP”) and the GCM Retirement Benefits Scheme (“GCM”) (collectively, the “DB Plans”). As of June 30, 2014, the total underfunded status of our pension plans on a U.S. GAAP basis was $22.4 million. The most recent actuarially calculated scheme-specific funding deficit in respect of each of the DB Plans was £63.6 million (as combined between all three plans). A preliminary actuarial valuation of the FGPP as of October 31, 2014 indicates that the FGPP’s scheme-specific funding deficit was £12.9 million, which would decrease the combined scheme-specific funding deficit in respect of the DB Plans to £54.1 million. However, this actuarial valuation is yet to be finalized, and the funding assumptions underpinning it need to be agreed by us with the trustees of the FGPP. Depending on the outcome of those discussions, the deficit figures in the preliminary valuation may be subject to change and could potentially increase in the finalized valuation.
Contributions to the DB Plans are payable in accordance with the schedule of contributions and the recovery plans which are separately in place in respect of all three arrangements. All of the DB Plans are currently open to future benefit accrual and the contribution rates payable by the company to the DB Plans reflect this in order to help fund those future accrual benefits. The contribution rates also take account of the deficits in each of the DB Plans to seek to make good those funding shortfalls within the timeframes specified in the recovery plans.
Should a wind-up trigger or insolvency event occur in relation to the DB Plans, the buy-out deficit will become due and payable by the employers. The deficit of the FGPP on a buy-out basis was £166.1 million ($259.8 million) as of August 20, 2013. The preliminary actuarial valuation of the FGPP as of October 31, 2014 discussed above indicates that the buy-out deficit of the FGPP was £150.1 million ($240.1 million). The buy-out deficit was £21.5 million ($32.5 million) as of April 5, 2013 for the CPP and was £3.6 million ($5.7 million) as of February 1, 2013 for the GCM. Unless any future security is granted to the trustees of any of the three plans, those debts would rank as unsecured if the participating employers in any of the three plans became insolvent in the future.
We are currently in negotiations with the trustees of the DB Plans which might soon result in a parental company guarantee being given to the trustees of each of the DB Plans to cover contributions due under the current recovery plans to fund the DB Plans up to the scheme-specific funding level basis.
Our defined benefit pension plan obligations are financed predominantly through externally invested pension plan assets via externally managed funds and insurance companies. The values attributable to the externally invested pension plan assets are subject to fluctuations in the capital markets that are beyond our influence. Unfavorable developments in the capital markets could result in a substantial coverage shortfall for these pension obligations, resulting in a significant increase in our net pension obligations. In addition, deterioration in our financial condition could lead to an increased funding commitment to the trustees, which could further exacerbate any financial difficulties we could face at such time. Any such increases in our net pension
34
Table of Contents
obligations could adversely affect our financial condition due to increased additional outflow of funds to finance the pension obligations. Also, we are exposed to risks associated with longevity and interest rate and inflation rate changes in connection with our pension commitments, as an interest rate increase or decrease in longevity could have an adverse effect on our liabilities under these pension plans. Furthermore, a strengthening of the regulatory funding regime could increase requirements for cash funding, demanding more financial resources to meet governmentally mandated pension requirements. The realization of any of these risks could require us to make significant additional payments to meet our pension commitments, which could have a material adverse effect on our business, financial condition and results of operations.
The Pensions Regulator in the United Kingdom has the statutory power in certain circumstances to issue contribution notices or financial support directions which, if issued, could result in significant liabilities arising for us.
Under the Pensions Act 2004, the Pensions Regulator in the United Kingdom may issue a contribution notice to any employer in the DB Plans or any person who is connected with or is an associate of any employer in any of those plans where the Pensions Regulator is of the opinion that the relevant person has been a party to an act, or a deliberate failure to act, which had as its main purpose (or one of its main purposes) the avoidance of pension liabilities. Under the Pensions Act 2008, the Pensions Regulator has been granted the power to issue a contribution notice if it is of the opinion that the relevant person has been a party to an act, or a deliberate failure to act, which has a materially detrimental effect on a pension plan without sufficient mitigation having been provided. The Pensions Regulator can only issue a contribution notice where it believes it is reasonable to do so and can generally only do so in respect of any act or failure to act which has taken place in the previous six years.
The terms “associate” and “connected person,” which are taken from the Insolvency Act 1986, are widely defined and could cover our significant shareholders and others deemed to be shadow directors.
If the Pensions Regulator considers that any of the employers participating in the DB Plans are “insufficiently resourced” or a “service company,” it may impose a financial support direction requiring us or any member of the Group, or any person associated or connected with that employer, to put in place financial support in relation to the relevant plan. The Pensions Regulator can only issue a financial support direction where it believes it is reasonable to do so and can generally only do so in respect of circumstances which have occurred in the previous two years.
Liabilities imposed under a contribution notice or financial support direction may be up to the amount of the buy-out deficit in the relevant DB Plan.
Regulations related to conflict minerals could adversely impact our business.
The Dodd-Frank Wall Street Reform and Consumer Protection Act contains provisions to improve transparency and accountability concerning the supply of certain minerals, known as conflict minerals, originating from the Democratic Republic of Congo (the “DRC”) and adjoining countries. As a result, in August 2012 the SEC adopted annual disclosure and reporting requirements for those companies who use conflict minerals mined from the DRC and adjoining countries in their products. Because certain of our products include tin, these new requirements will require due diligence efforts this year, with initial disclosure requirements beginning in 2016 at the earliest. There will be costs associated with complying with these disclosure requirements, including for diligence of our suppliers to determine the sources of conflict minerals used in our products and, if applicable, a third-party audit of our diligence process, and other potential changes to products, processes or sources of supply as a consequence of such verification activities. The implementation of these rules could adversely affect the sourcing, supply and pricing of materials used in our products. As there may be only a limited number of suppliers offering “conflict free” conflict minerals, we cannot be sure that we will be able to obtain necessary conflict minerals from such suppliers in sufficient quantities or at competitive prices. Conversely, we will be required to make similar certifications to our suppliers. If we are unable or fail to make the requisite certifications, our suppliers may terminate their relationship with us. Also, we may face adverse effects to our
35
Table of Contents
reputation if we determine that certain of our products contain minerals not determined to be “conflict free” or if we are unable to sufficiently verify the origins for all conflict minerals used in our products through the procedures we may implement.
We may not be successful in acquiring and protecting our intellectual property rights or in avoiding claims that we infringed on the intellectual property rights of others.
Our ability to develop, acquire, and retain necessary intellectual property rights is important to our continued success and competitive position. If we were unable to protect our existing intellectual property rights, develop new rights, or if others developed similar or improved technologies there can be no assurance that such events would not be material to our results of operations, financial condition or cash flows. Some of our business depends in part on our ability to obtain, or license from third parties, patents, trademarks, trade secrets and similar proprietary rights without infringing on the proprietary rights of third parties. Although we believe our intellectual property rights are sufficient to allow us to conduct our business without incurring liability to third parties, our products may infringe on the intellectual property rights of such persons. Furthermore, no assurance can be given that we will not be subject to claims asserting the infringement of the intellectual property rights of third parties seeking damages, the payment of royalties or licensing fees and/or injunctions against the sale of our products. Any such litigation, regardless of merit, could be protracted and costly and could have a material adverse effect on our business, financial condition and results of operations.
We may be subject to increased income taxes, and other restrictions and limitations, if we were to decide to repatriate any of our income, capital or cash to the United States or other jurisdictions.
Government regulations and restrictions in some countries may limit the amount of income, capital or cash that may be distributed or otherwise transferred to other jurisdictions. For example, the transfer of income, capital or cash from one country to another is often subject to restrictions such as the need for certain governmental consents. Even where there is no outright restriction, the mechanics of repatriation or, in certain countries, the lack of the availability of foreign currency (such as U.S. dollars) to non-governmental entities, may affect certain aspects of our operations. In the event we need to repatriate our non-U.S. income, capital or cash from a particular country to fund operations in another part of the world, we may need to repatriate some of our non-U.S. cash balances out of the country where they are located to another jurisdiction and we may be subject to additional income taxes in the jurisdiction receiving the cash. Any of these scenarios may subject us to costs, restrictions and/or limitations that result in us being unable to use our cash in the manner we desire, which may have a material adverse effect on our results of operations and financial condition.
Our status as a foreign corporation for U.S. federal tax purposes could be affected by IRS action or a change in U.S. tax law.
On February 14, 2014, Chesapeake, a corporation organized under the laws of England and Wales, completed the acquisition of Mustang, a Delaware corporation, in exchange for a 50% equity interest in Chesapeake. Chesapeake subsequently changed its name to Multi Packaging Solutions Global Holdings Limited and, prior to the completion of this offering, will become a wholly owned subsidiary of MPS Limited. A corporation is generally considered a tax resident in the jurisdiction of its organization or incorporation for U.S. federal income tax purposes. Because MPS Limited is a Bermuda incorporated entity, it would generally be classified as a foreign corporation under these rules. Section 7874 of the U.S. Internal Revenue Code of 1986, as amended (the “Code”), provides an exception to this general rule, however, under which a foreign incorporated entity may, in certain circumstances, be treated as a U.S. corporation for U.S. federal tax purposes. The Company believes that it (and, prior to the Reorg Transactions, MPS Holdings) has satisfied the requirements under Section 7874 of the Code to be treated as a foreign corporation, taking into account any impact of both the Mustang acquisition and the Reorg Transactions in the analysis. There is limited guidance, however, regarding the application of Section 7874 of the Code. As a consequence, there can be no assurance that the IRS will agree with the position that the Company has satisfied the requirements under Section 7874 of the Code to be treated as a foreign corporation or that the IRS will not otherwise challenge the Company’s status as a foreign corporation. If such a challenge by
36
Table of Contents
the IRS were successful, significant adverse tax consequences would result for the Company. Further, recent legislative and administrative proposals have addressed Section 7874 of the Code, some of which, if enacted, could have prospective or retroactive application to the Company, its shareholders and affiliates. Consequently, there can be no assurance that there will not exist in the future a change in law that might cause the Company to be treated as a domestic corporation for U.S. federal income tax purposes, including with retroactive effect. If such a change in law were implemented, significant adverse tax consequences would result for the Company.
Risks Related to Our Indebtedness
We have substantial debt, which could adversely affect our financial health and our ability to obtain financing in the future, react to changes in our business and meet our obligations with respect to our indebtedness.
As of June 30, 2015, after giving effect to this offering and the use of proceeds therefrom as set forth under the heading “Use of Proceeds,” we would have had approximately $ million of indebtedness on a consolidated basis, including $ million of the 8.500% senior unsecured notes due 2021 (the “Notes”) and $ million of the Term Loans (as defined below). In addition, we had $49.7 million in borrowing capacity under our U.S. dollar revolving credit facility and £50.0 million ($78.6 million) in borrowing capacity available under our Pounds Sterling revolving credit facility. As of June 30, 2015, we had $0.3 million of outstanding letters of credit under our U.S. dollar revolving credit facility.
Our substantial debt could have important consequences to you. Because of our substantial debt:
| • | it may be more difficult for us to satisfy our obligations to our lenders and creditors, resulting in possible defaults on and acceleration of such debt; |
| • | our ability to make loans and investments or engage in acquisitions without issuing additional equity or obtaining additional debt financing may be impaired in the future; |
| • | our ability to obtain additional financing with reasonable terms and conditions for working capital, capital expenditures, acquisitions, debt service requirements or general corporate purposes may be impaired in the future; |
| • | a substantial portion of our cash flow from operations must be dedicated to the payment of principal and interest on our debt, thereby reducing the funds available to us for other purposes; |
| • | we are exposed to the risk of increased interest rates as, over the term of our debt, the interest cost on a significant portion of our indebtedness is subject to changes in interest rates; |
| • | we may be more vulnerable to general adverse economic and industry conditions; |
| • | we may be at a competitive disadvantage compared to our competitors who have less debt or comparable debt at more favorable interest rates and who, as a result, may be better positioned to withstand economic downturns or to finance capital expenditures or acquisitions; |
| • | our costs of borrowing may increase; |
| • | we may be unable to refinance our debt on terms as favorable as our existing debt or at all; and |
| • | our flexibility to adjust to changing market conditions and our ability to withstand competitive pressures could be limited, or we may be prevented from carrying out capital spending that is necessary or important to our growth strategy and efforts to improve the operating margins of our businesses. |
Despite our current indebtedness level, we and our subsidiaries may be able to incur substantially more debt, which could further exacerbate the risks associated with our substantial indebtedness.
We and our subsidiaries may be able to incur substantial additional indebtedness in the future. Subject to certain limitations, the credit agreement governing our senior secured credit facilities and the indenture governing our Notes do not prohibit us or our subsidiaries from incurring additional indebtedness. In addition, the credit agreement governing our senior secured credit facilities and the indenture governing our Notes also permit us,
37
Table of Contents
our subsidiaries or our parents to accrue interest, accrue accreted value, accrue amortization of original issue discount and pay interest or dividends in the form of additional indebtedness. The restrictions on the incurrence of additional indebtedness are subject to a number of thresholds, qualifications and exceptions, and the additional indebtedness incurred in compliance with these restrictions could be substantial. Additionally, these restrictions also will not prevent us from incurring obligations that, although preferential to our common shares in terms of payment, do not constitute indebtedness. In addition, as of June 30, 2015 we had $49.7 million of borrowing capacity available under our U.S. dollar revolving credit facility and £50.0 million ($78.6 million) of borrowing capacity available under our Pounds Sterling revolving credit facility. As of June 30, 2015 we had $0.3 million of outstanding letters of credit under our U.S. dollar revolving credit facility.
If new debt is added to our or our subsidiaries’ current debt levels, the related risks that we now face would increase, and we may not be able to meet all our debt obligations. See “Management’s Discussion and Analysis of Financial Condition and Results of Operations—Liquidity and Capital Resources.”
The agreements and instruments governing our debt contain restrictions and limitations that could significantly impact our management’s flexibility or our financial and operational flexibility to operate our business and could adversely affect you.
The credit agreement governing our senior secured credit facilities and/or the indenture governing our Notes contain, and certain of our current or future rollover foreign debt facilities may contain, covenants that, among other things, restrict our ability to:
| • | dispose of assets, including capital stock of our subsidiaries; |
| • | incur additional indebtedness (including guarantees of additional indebtedness); |
| • | prepay other indebtedness or amend other debt instruments; |
| • | pay dividends or redeem, repurchase or retire our capital stock or our other indebtedness and make certain payments; |
| • | create restrictions on the payment of dividends or other amounts to us from our restricted subsidiaries that are not guarantors; |
| • | create liens on assets; |
| • | enter into sale and leaseback transactions; |
| • | engage in certain asset sales, mergers, acquisitions, consolidations or sales of all or substantially all of our assets; |
| • | engage in certain transactions with affiliates; |
| • | permit restrictions on our subsidiaries’ ability to pay dividends; |
| • | change our business; |
| • | consolidate, merge, sell or otherwise dispose of all or substantially all of our assets; |
| • | enter into transactions with our affiliates; |
| • | designate our subsidiaries as unrestricted subsidiaries; and |
| • | make loans and investments (including joint ventures). |
The restrictions in the credit agreement governing our senior secured credit facilities, the indenture governing the Notes and rollover foreign debt facilities may prevent us from taking actions that we believe would be in the best interests of our business and may make it difficult for us to execute our business strategy successfully or effectively compete with companies that are not similarly restricted. We may also incur future debt obligations that might subject us to additional restrictive covenants that could affect our financial and operational flexibility.
38
Table of Contents
Our ability to comply with the covenants and restrictions contained in the credit agreement governing our senior secured credit facilities, the indenture governing the Notes and our rollover foreign debt facilities may be affected by economic, financial and industry conditions beyond our control. The breach of any of these covenants or restrictions could result in a default under the credit agreement governing our senior secured credit facilities, the indenture governing the Notes and our rollover foreign debt facilities that would permit the applicable lenders or noteholders, as the case may be, to declare all amounts outstanding thereunder to be due and payable, together with accrued and unpaid interest. In addition, such a default or acceleration may result in the acceleration of any other debt to which a cross-acceleration or cross-default provision applies. If we are unable to repay debt, lenders having secured obligations, such as the lenders under our senior secured credit facilities and our rollover foreign debt facilities, could proceed against the collateral securing the debt. In any such case, we may be unable to borrow under our senior secured credit facilities and our rollover foreign debt facilities and may not be able to repay the amounts due under our senior secured credit facilities, our rollover foreign debt facilities or the Notes. This could have serious consequences to our financial condition and results of operations and could cause us to become bankrupt or insolvent.
We are dependent upon our lenders for financing to execute our business strategy and meet our liquidity needs. If our lenders are unable or unwilling to fund borrowings under their credit commitments or we are unable to borrow, it could negatively impact our business.
During periods of volatile credit markets, there is risk that any lenders, even those with strong balance sheets and sound lending practices, could fail or refuse to honor their legal commitments and obligations under existing credit commitments, including but not limited to extending credit up to the maximum permitted by a credit facility. If our lenders are unable or unwilling to fund borrowings under their revolving credit commitments or we are unable to borrow, it could be difficult in such environments to obtain sufficient liquidity to meet our operational needs.
Our ability to obtain additional capital on commercially reasonable terms may be limited.
Although we believe our cash and cash equivalents, together with cash we expect to generate from operations and availability under our revolving credit facility, provide adequate resources to fund ongoing operating requirements, we may need to seek additional financing to compete effectively.
If we are unable to obtain capital on commercially reasonable terms, or at all, it could:
| • | reduce funds available to us for purposes such as working capital, capital expenditures, research and development, strategic acquisitions and other general corporate purposes; |
| • | restrict our ability to introduce new products or exploit business opportunities; and |
| • | increase our vulnerability to economic downturns and competitive pressures in the markets in which we operate, |
any and all of which could place us at a competitive disadvantage.
Certain of our indebtedness bears interest at variable rates and/or is denominated in a foreign currency, which subjects us to interest rate risk and foreign exchange risk, each of which could cause our debt service obligations to increase significantly.
Borrowings under our senior secured credit facilities, which totaled $996.8 million as of June 30, 2015, are at variable rates of interest and expose us to interest rate risk. If interest rates increase, our debt service obligations on the variable rate indebtedness will increase even if the amount borrowed remains the same, and our net income and cash flows, including cash available for servicing our indebtedness, will correspondingly decrease. The term loan under our senior secured credit facilities includes a floor on the applicable benchmark London Interbank Offered Rate (“LIBOR”), Euro Interbank Offered Rate (“EURIBOR”) or prime rate, which is in excess of the specified LIBOR, EURIBOR or prime rate that would otherwise apply. Assuming our senior secured credit facilities are fully drawn, each 0.125% change in assumed blended interest rates would result in an approximate $1.2 million change
39
Table of Contents
in annual interest expense on indebtedness under our senior secured credit facilities. We have entered, and in the future may enter, into interest rate swaps that involve the exchange of floating for fixed rate interest payments in order to reduce interest rate volatility. However, we may not maintain interest rate swaps with respect to all of our variable rate indebtedness, and any swaps we have entered into or may enter into in the future may not fully mitigate our interest rate risk, which may prove disadvantageous or may create additional risks.
In addition, certain of our borrowings under our senior secured credit facilities are denominated in Euros and British pounds sterling, which do not necessarily correspond to the cash flow we generate in these currencies. Sharp changes in the exchange rates between the currencies in which we borrow and the currencies in which we generate cash flow could adversely affect us. In particular, for example, the exchange rate between the U.S. Dollar and the Euro has experienced significant volatility and may continue to fluctuate materially in the future. Certain of the Term Loans were borrowed in Euros and Pounds Sterling, while our functional currency is the U.S. Dollar and we maintain our accounting records in U.S. Dollars. As a result, unrealized foreign exchange gains and losses will occur upon the translation of the Euro-denominated and Pounds Sterling-denominated debt into U.S. Dollars. These unrealized foreign exchange gains or losses are recognized in profit or loss. In the future we may enter into contractual arrangements designed to hedge a portion of the foreign currency exchange risk associated with our Euro-denominated and Pounds Sterling-denominated debt. If these hedging arrangements are unsuccessful, we may experience a material adverse effect on our business and results of operations.
Risks Related to this Offering and Ownership of our Common Shares
We are an “emerging growth company” and as a result of the reduced disclosure and governance requirements applicable to emerging growth companies, our common shares may be less attractive to investors.
We are an “emerging growth company” as defined in the JOBS Act, and we intend to take advantage of certain exemptions from various reporting requirements that are applicable to other public companies that are not emerging growth companies, including not being required to comply with the auditor attestation requirements of Section 404 of the Sarbanes-Oxley Act, reduced disclosure obligations regarding executive compensation in our periodic reports and proxy statements, and exemptions from the requirements of holding a nonbinding advisory vote on executive compensation and shareholder approval of any golden parachute payments not previously approved.
We cannot predict if investors will find our common shares less attractive because we will rely on these exemptions. If some investors find our common shares less attractive as a result, there may be a less active trading market for our common shares and our share price may be more volatile. We may take advantage of these reporting exemptions until we are no longer an emerging growth company. We could be an “emerging growth company” for up to five years. For additional information about the implications of qualifying as an emerging growth company, see “Prospectus Summary—Implications of Being an Emerging Growth Company.”
Because our operations are conducted through our subsidiaries, we are largely dependent on our receipt of distributions and dividends or other payments from our subsidiaries for cash to fund all of our operations and expenses, including making future dividend payments, if any.
Our principal assets are the equity interests we own in our operating subsidiaries, either directly or indirectly. As a result, we are dependent upon cash dividends, distributions or other transfers we receive from our subsidiaries in order to repay any debt we may incur, to make interest payments with respect to such debt and to meet our other obligations. As a result, our ability to service our debt or to make future dividend payments, if any, is largely dependent on the earnings of our subsidiaries and the payment of those earnings to us in the form of dividends, loans or advances and through repayment of loans or advances from us.
The ability of our subsidiaries to pay dividends and make payments to us will depend on their operating results and may be restricted by, among other things, applicable corporate, tax and other laws and regulations and agreements of those subsidiaries, as well as by the terms of the credit agreement governing our senior secured
40
Table of Contents
credit facilities and the indenture governing the Notes. Any right that we have to receive any assets of or distributions from any subsidiary upon its bankruptcy, dissolution, liquidation or reorganization, or to realize proceeds from the sale of the assets of any subsidiary, may be junior to the claims of that subsidiary’s creditors, including trade creditors. In addition, there may be significant tax and other legal restrictions on the ability of foreign subsidiaries to remit money to us.
There is no existing market for our common shares, and we do not know if one will develop to provide you with adequate liquidity to sell our common shares at prices equal to or greater than the price you paid in this offering.
Prior to this offering, there has not been a public market for our common shares. We cannot predict the extent to which investor interest in our company will lead to the development of an active trading market on the stock exchange on which we list our common shares or otherwise or how liquid that market might become. If an active trading market does not develop, you may have difficulty selling any of our common shares that you buy. The initial public offering price for the common shares will be determined by negotiations between us and the representatives of the underwriters and may not be indicative of prices that will prevail in the open market following this offering. Consequently, you may not be able to sell our common shares at prices equal to or greater than the price you paid in this offering, or at all.
The price of our common shares may fluctuate significantly, and you could lose all or part of your investment.
Volatility in the market price of our common shares may prevent you from being able to sell your common shares at or above the price you paid for your common shares. The market price of our common shares could fluctuate significantly for various reasons, including:
| • | our operating and financial performance and prospects; |
| • | our quarterly or annual earnings or those of other companies in our industry; |
| • | the public’s reaction to our press releases, our other public announcements and our filings with the SEC; |
| • | changes in, or failure to meet, earnings estimates or recommendations by research analysts who track our common shares or the stock of other companies in our industry; |
| • | the failure of research analysts to cover our common shares; |
| • | credit ratings downgrades or other negative actions by ratings agencies for us or our subsidiaries; |
| • | strategic actions by us, our customers or our competitors, such as acquisitions or restructurings; |
| • | new laws or regulations or new interpretations of existing laws or regulations applicable to our business; |
| • | changes in accounting standards, policies, guidance, interpretations or principles; |
| • | the impact on our profitability temporarily caused by the time lag between when we experience cost increases until these increases flow through cost of sales because of our method of accounting for inventory, or the impact from our inability to pass on such price increases to our customers; |
| • | material litigations or government investigations; |
| • | changes in general conditions in the United States and global economies or financial markets, including those resulting from war, incidents of terrorism or responses to such events; |
| • | changes in key personnel; |
| • | sales of common shares by us, affiliates of Carlyle or Madison Dearborn or members of our management team; |
| • | termination or expiration of lock-up agreements with our management team and principal shareholders; |
| • | the granting of restricted common shares and share options; |
41
Table of Contents
| • | volume of trading in our common shares; and |
| • | the realization of any risks described under this “Risk Factors” section. |
In addition, in recent years, the stock market has experienced significant price and volume fluctuations. This volatility has had a significant impact on the market price of securities issued by many companies, including companies in our industry. The changes frequently appear to occur without regard to the operating performance of the affected companies. As a result, the price of our common shares could fluctuate based upon factors that have little or nothing to do with us, and these fluctuations could materially reduce our share price and cause you to lose all or part of your investment. Further, in the past, market fluctuations and price declines in a company’s stock have led to securities class action litigations. If such a suit were to arise, it could have a substantial cost and divert our resources regardless of the outcome.
If we fail to maintain proper and effective internal control over financial reporting, our ability to produce accurate and timely financial statements could be impaired and investors’ views of us could be harmed.
We are not currently required to comply with the rules of the SEC implementing Section 404 of the Sarbanes-Oxley Act and are therefore not required to make a formal assessment of the effectiveness of our internal control over financial reporting for the purpose. Upon becoming a public company, we will be required to maintain internal control over financial reporting and to report any material weaknesses in such internal controls. In addition, beginning with our second annual report on Form 10-K, we will be required to furnish a report by management on the effectiveness of our internal control over financial reporting, pursuant to Section 404 of the Sarbanes-Oxley Act. However, as an emerging growth company, our independent registered public accounting firm will not be required to express an opinion as to the effectiveness of our internal control over financial reporting pursuant to Section 404 until the later of the year following our first annual report on Form 10-K or the date we are no longer an emerging growth company. At such time, our independent registered public accounting firm may issue a report that is adverse in the event it is not satisfied with the level at which our controls are documented, designed or operating. The process of designing, implementing and testing the internal control over financial reporting required to comply with this obligation is time-consuming, costly and complicated. If we are not able to comply with the requirements of Section 404 in a timely manner, or if we or our independent registered public accounting firm identify deficiencies in our internal control over financial reporting that are deemed to be material weaknesses, the market price of common shares could decline and we could be subject to sanctions or investigations by the stock exchange on which we list our common shares, the SEC or other regulatory authorities, which would require additional financial and management resources.
Our ability to successfully implement our business plan and comply with Section 404 requires us to be able to prepare timely and accurate financial statements. Any delay in the implementation of, or disruption in the transition to, new or enhanced systems, procedures or controls, may cause our operations to suffer and we may be unable to conclude that our internal control over financial reporting is effective and, when required, to obtain an unqualified report on internal controls from our auditors. Moreover, we cannot be certain that these measures would ensure that we implement and maintain adequate controls over our financial processes and reporting in the future. Even if we were to conclude, and our auditors were to concur, that our internal control over financial reporting provided reasonable assurance regarding the reliability of financial reporting and the preparation of financial statements for external purposes in accordance with U.S. GAAP, because of its inherent limitations, internal control over financial reporting may not prevent or detect fraud or misstatements. This, in turn, could have an adverse impact on trading prices for our common shares, and could adversely affect our ability to access the capital markets.
We will incur increased costs as a result of operating as a publicly traded company, and our management will be required to devote substantial time to new compliance initiatives.
As a publicly traded company, we will incur additional legal, accounting and other expenses that we did not previously incur, which we expect will be between $2.0 million and $3.0 million per year. In addition, the
42
Table of Contents
Sarbanes-Oxley Act, the Dodd-Frank Wall Street Reform and Consumer Protection Act and the rules of the Securities and Exchange Commission (the “SEC”) and the stock exchange on which our common shares are listed, have imposed various requirements on public companies. Our management and other personnel will need to devote a substantial amount of time to these compliance initiatives as well as investor relations. Moreover, these rules and regulations will increase our legal and financial compliance costs and will make some activities more time-consuming and costly. For example, we expect these rules and regulations to make it more difficult and more expensive for us to obtain director and officer liability insurance, and we may be required to incur additional costs to maintain the same or similar coverage.
Furthermore, if we are not able to comply with the requirements of Section 404 of the Sarbanes-Oxley Act in a timely manner, the market price of our common shares could decline and we could be subject to potential delisting by the stock exchange on which our common shares are listed and review by such exchange, the SEC or other regulatory authorities, which would require the expenditure by us of additional financial and management resources. As a result, our shareholders could lose confidence in our financial reporting, which would harm our business and the market price of our common shares.
We are controlled by Carlyle and Madison Dearborn, whose interests in our business may be different than yours.
As of June 30, 2015, entities controlled by affiliates of Carlyle and Madison Dearborn each owned 50% of our common shares on a fully diluted basis and are able to control our affairs in all cases. Following this offering, these entities will continue to own approximately % and % of our common shares, respectively (or % and %, respectively, if the underwriters exercise their option to purchase additional shares in full). Certain members of management hold interests in these entities. Pursuant to the shareholders’ agreement, a majority of our Board of Directors will be designated by affiliates of Carlyle and Madison Dearborn. See “Certain Relationships and Related Party Transactions.” As a result, affiliates of Carlyle and Madison Dearborn or their respective designees to our Board of Directors will have the ability to control the appointment of our management, the entering into of mergers, sales of substantially all or all of our assets and other extraordinary transactions and influence amendments to our memorandum of association and bye-laws. So long as affiliates of Carlyle and Madison Dearborn collectively continue to own and/or control a majority of our common shares, they will have the ability to control the vote in any election of directors and will have the ability to prevent any transaction that requires shareholder approval regardless of whether other shareholders believe the transaction is in our best interests. In any of these matters, the interests of Carlyle and Madison Dearborn may differ from or conflict with your interests. Moreover, this concentration of ownership may also adversely affect the trading price for our common shares to the extent investors perceive disadvantages in owning stock of a company with controlling shareholders. In addition, Carlyle and Madison Dearborn are in the business of making investments in companies and may, from time to time, acquire interests in businesses that directly or indirectly compete with our business, as well as businesses that are significant existing or potential suppliers or customers. Carlyle or Madison Dearborn may acquire or seek to acquire assets that we seek to acquire and, as a result, those acquisition opportunities may not be available to us or may be more expensive for us to pursue.
We do not intend to pay dividends on our common shares for the foreseeable future and, consequently, your ability to achieve a return on your investment will depend on appreciation in the price of our common shares.
We do not intend to declare and pay dividends on our common shares for the foreseeable future. We currently intend to invest our future earnings, if any, to fund our growth. Therefore, you are not likely to receive any dividends on your common shares for the foreseeable future and the success of an investment in our common shares will depend upon any future appreciation in their value. There is no guarantee that our common shares will appreciate in value or even maintain the price at which our shareholders have purchased their shares. The payment of future dividends will be at the discretion of our Board of Directors and will depend on, among other things, our earnings, financial condition, capital requirements, level of indebtedness, statutory and contractual restrictions applying to the payment of dividends and other considerations that our Board of Directors deems relevant. Specifically, we are subject to Bermuda legal constraints that may affect our ability to pay dividends on
43
Table of Contents
our common shares and make other payments. Under Bermuda law, a company may not declare or pay dividends if there are reasonable grounds for believing that: (i) the company is, or would after the payment be, unable to pay its liabilities as they become due or (ii) the realizable value of its assets would thereby be less than its liabilities. The credit agreement governing our senior secured credit facilities and the indenture governing our Notes also effectively limit our ability to pay dividends. As a consequence of these limitations and restrictions, we may not be able to make, or may have to reduce or eliminate, the payment of dividends on our common shares.
You may suffer immediate and substantial dilution.
The initial public offering price per share of our common shares is substantially higher than our net tangible book deficit per share immediately after the offering. As a result, you may pay a price per share that substantially exceeds the tangible book value of our assets after subtracting our liabilities. At an offering price of $ per share, which is the midpoint of the estimated offering price range set forth on the cover page of this prospectus, you may incur immediate and substantial dilution in the amount of $ per share. You will experience additional dilution upon the exercise of options and warrants to purchase our common shares if any are granted in the future, and the issuance and vesting of restricted shares or other equity awards under our existing or future equity incentive plans.
Future sales of our common shares in the public market could lower our share price, and any additional capital raised by us through the sale of equity or convertible debt securities may dilute your ownership in us and may adversely affect the market price of our common shares.
We and our shareholders may sell additional common shares in subsequent public offerings. We may also issue additional common shares or convertible debt securities to finance future acquisitions. After the consummation of this offering, we will have common shares authorized and common shares outstanding. This number includes common shares that we are selling in this offering, which may be resold immediately in the public market. Of the remaining common shares, , or % of our total outstanding common shares, are restricted from immediate resale under the lock-up agreements between our current shareholders and the underwriters described in “Underwriting,” but may be sold into the market in the near future. These common shares will become available for sale following the expiration of the lock-up agreements, which, without the prior consent of , is 180 days after the date of this prospectus, subject to compliance with the applicable requirements under Rule 144 of the Securities Act.
We cannot predict the size of future issuances of our common shares or the effect, if any, that future issuances and sales of our common shares will have on the market price of our common shares. Sales of substantial amounts of our common shares (including sales pursuant to Carlyle’s and Madison Dearborn’s registration rights, sales by members of management and shares issued in connection with an acquisition), or the perception that such sales could occur, may adversely affect prevailing market prices for our common shares. See “Certain Relationships and Related Party Transactions” and “Shares Eligible for Future Sale.”
We are a “controlled company” within the meaning of the rules of the stock exchange on which we list our common shares and, as a result, expect to qualify for, and intend to rely on, exemptions from certain corporate governance requirements. You will not have the same protections afforded to shareholders of companies that are subject to such requirements.
Following the consummation of this offering, we expect affiliates of Carlyle and Madison Dearborn will collectively continue to own a majority in voting power of the outstanding common shares. As a result, we expect to be a “controlled company” within the meaning of the corporate governance standards of the stock exchange on which we list our common shares. Under these rules, a company of which more than 50% of the voting power is held by an individual, group or another company is a “controlled company” and may elect not to comply with certain corporate governance requirements, including:
| • | the requirement that a majority of such company’s Board of Directors consist of independent directors; |
44
Table of Contents
| • | the requirement that such company have a nominating and corporate governance committee that is composed entirely of independent directors with a written charter addressing the committee’s purpose and responsibilities; |
| • | the requirement that such company have a compensation committee that is composed entirely of independent directors with a written charter addressing the committee’s purpose and responsibilities; and |
| • | the requirement for an annual performance evaluation of such company’s nominating and corporate governance committee and compensation committee. |
Following this offering, we intend to utilize these exemptions if we continue to qualify as a “controlled company.” If we do utilize the exemption, we will not have a majority of independent directors and our nominating and corporate governance and compensation committees will not consist entirely of independent directors and such committees will not be subject to annual performance evaluations. Accordingly, you will not have the same protections afforded to shareholders of companies that are subject to all of the corporate governance requirements of the stock exchange on which we list our common shares.
If Carlyle and Madison Dearborn sell a controlling interest in us to a third party in a private transaction, you may not realize any change-of-control premium on our common shares and we may become subject to the control of a presently unknown third party.
Following the completion of this offering, Carlyle and Madison Dearborn will beneficially own a substantial majority of our common shares. Carlyle and Madison Dearborn will have the ability, should they choose to do so, to sell some or all of our common shares in a privately negotiated transaction, which, if sufficient in size, could result in our change of control. The ability of Carlyle and Madison Dearborn to privately sell such shares may not be subject to any requirement for a concurrent offer to be made to acquire all of our common shares that will be publicly traded hereafter, which could prevent you from realizing any change-of-control premium on your common shares that may otherwise accrue to Carlyle and Madison Dearborn upon their private sale of our common shares. Additionally, if Carlyle and Madison Dearborn privately sell a significant equity interest in us, we may become subject to the control of a presently unknown third party. Such third party may have interests that conflict with the interests of our other shareholders.
We are a Bermuda company and it may be difficult for you to enforce judgments against us or our directors and executive officers.
We are a Bermuda exempted company. As a result, the rights of our shareholders are governed by Bermuda law and our memorandum of association and bye-laws. The rights of shareholders under Bermuda law may differ from the rights of shareholders of companies incorporated in another jurisdiction, and a substantial portion of our assets are located outside the United States. As a result, it may be difficult for investors to effect service of process on those persons in the United States or to enforce in the United States judgments obtained in U.S. courts against us or those persons based on the civil liability provisions of the U.S. securities laws. It is doubtful whether courts in Bermuda will enforce judgments obtained in other jurisdictions, including the United States, against us or our directors or officers under the securities laws of those jurisdictions or entertain actions in Bermuda against us or our directors or officers under the securities laws of other jurisdictions.
Bermuda law differs from the laws in effect in the United States and may afford less protection to our shareholders.
We are organized under the laws of Bermuda. As a result, our corporate affairs are governed by the Companies Act, 1981 (the “Companies Act”), which differs in some material respects from laws typically applicable to U.S. corporations and shareholders, including the provisions relating to interested directors, amalgamations, mergers and acquisitions, takeovers, shareholder lawsuits and indemnification of directors. Generally, the duties of directors and officers of a Bermuda company are owed to the company only. Shareholders of Bermuda
45
Table of Contents
companies typically do not have rights to take action against directors or officers of the company and may only do so in limited circumstances. Shareholder class actions are not available under Bermuda law. The circumstances in which shareholder derivative actions may be available under Bermuda law are substantially more proscribed and less clear than they would be to shareholders of U.S. corporations. The Bermuda courts, however, would ordinarily be expected to permit a shareholder to commence an action in the name of a company to remedy a wrong to the company where the act complained of is alleged to be beyond the corporate power of the company or illegal, or would result in the violation of the company’s memorandum of association or bye-laws. Furthermore, consideration would be given by a Bermuda court to acts that are alleged to constitute a fraud against the minority shareholders or, for instance, where an act requires the approval of a greater percentage of the company’s shareholders than those who actually approved it.
When the affairs of a company are being conducted in a manner that is oppressive or prejudicial to the interests of some shareholders, one or more shareholders may apply to the Supreme Court of Bermuda, which may make such order as it sees fit, including an order regulating the conduct of the company’s affairs in the future or ordering the purchase of the shares of any shareholders by other shareholders or by the company, in circumstances where the facts would otherwise justify the winding up of the company on just and equitable grounds but to do so would unfairly prejudice the shareholders applying for the assistance of the court. Additionally, under our bye-laws and as permitted by Bermuda law, each shareholder has waived any claim or right of action against our directors or officers for any action taken by directors or officers in the performance of their duties, except for actions involving fraud or dishonesty. In addition, the rights of our shareholders and the fiduciary responsibilities of our directors under Bermuda law are not as clearly established as under statutes or judicial precedent in existence in jurisdictions in the United States, particularly the State of Delaware. Therefore, our shareholders may have more difficulty protecting their interests than would shareholders of a corporation incorporated in a jurisdiction within the United States.
We may be treated as a “foreign financial institution” under the U.S. Foreign Account Tax Compliance Act, which could impose withholding requirements on certain payments made with respect to the common shares after December 31, 2018.
Certain provisions of the Code and applicable U.S. Treasury regulations (commonly collectively referred to as “FATCA”) generally impose a 30% withholding tax regime with respect to certain “foreign passthru payments” made by a “foreign financial institution” (an “FFI”). Under current guidance, it is not clear whether we would be treated as an FFI for purposes of FATCA. If we were to be treated as an FFI, such withholding may be imposed on such payments to any other FFI (including an intermediary through which an investor may hold the common shares) that is not a “participating FFI” (as defined under FATCA) or any other investor who does not provide information sufficient to establish that the investor is not subject to withholding under FATCA, unless such other FFI or investor is otherwise exempt from FATCA. Under current guidance, the term “foreign passthru payment” is not defined, and it is therefore not clear whether or to what extent payments on the common shares would be considered foreign passthru payments. Withholding on foreign passthru payments would not be required with respect to payments made before the later of January 1, 2019 and the date of publication in the Federal Register of final regulations defining the term “foreign passthru payment.” The United States has entered into various intergovernmental agreements, including intergovernmental agreements between the United States and Bermuda and between the United States and the United Kingdom, which potentially modify the rules described above. Prospective investors in the common shares should consult their tax advisors regarding the potential impact of FATCA, the intergovernmental agreements and any non-U.S. legislation implementing FATCA on their potential investment in the common shares.
46
Table of Contents
Any statements made in this prospectus that are not statements of historical fact, including statements about our beliefs and expectations, are forward-looking statements and should be evaluated as such. Forward-looking statements include information concerning possible or assumed future results of operations, including descriptions of our business plan and strategies. These statements often include words such as “anticipate,” “expect,” “suggests,” “plan,” “believe,” “intend,” “estimates,” “targets,” “projects,” “should,” “could,” “would,” “may,” “will,” “forecast,” and other similar expressions. These forward-looking statements are contained throughout this prospectus, including the sections entitled “Prospectus Summary,” “Risk Factors,” “Capitalization,” “Management’s Discussion and Analysis of Financial Condition and Results of Operations” and “Business.” We base these forward-looking statements or projections on our current expectations, plans and assumptions that we have made in light of our experience in the industry, as well as our perceptions of historical trends, current conditions, expected future developments and other factors we believe are appropriate under the circumstances and at such time. As you read and consider this prospectus, you should understand that these statements are not guarantees of performance or results. The forward-looking statements and projections are subject to and involve risks, uncertainties and assumptions and you should not place undue reliance on these forward-looking statements or projections. Although we believe that these forward-looking statements and projections are based on reasonable assumptions at the time they are made, you should be aware that many factors could affect our actual financial results or results of operations and could cause actual results to differ materially from those expressed in the forward-looking statements and projections. Factors that may materially affect such forward-looking statements and projections include:
| • | our ability to compete against competitors with greater resources or lower operating costs; |
| • | adverse developments in economic conditions, including downturns in the geographies and target markets that we serve; |
| • | difficulties in restructuring operations, closing facilities or disposing of assets; |
| • | our ability to successfully integrate our acquisitions and identify and integrate future acquisitions; |
| • | our ability to realize the growth opportunities and cost savings and synergies we anticipate from the initiatives that we undertake; |
| • | changes in technology trends and our ability to develop and market new products to respond to changing customer preferences and regulatory environment; |
| • | the impact of electronic media and similar technological changes, including the substitution of physical products for digital content; |
| • | seasonal fluctuations; |
| • | the impact of significant regulations and compliance expenditures as a result of environmental, health and safety laws; |
| • | risks associated with our non-U.S. operations; |
| • | exposure to foreign currency exchange rate volatility; |
| • | the loss of, or reduced purchases by, one or more of our large customers; |
| • | failure to attract and retain key personnel; |
| • | increased information technology security threats and targeted cybercrime; |
| • | changes in the cost and availability of raw materials; |
| • | operational problems at our facilities; |
| • | the impact of any labor disputes or increased labor costs; |
47
Table of Contents
| • | the failure of quality control measures and systems resulting in faulty or contaminated products; |
| • | the occurrence or threat of extraordinary events, including natural disasters and domestic and international terrorist attacks; |
| • | increased energy or transportation costs; |
| • | our ability to develop product innovations and improve production technology and expertise; |
| • | the impact of litigation, uninsured judgments or increased insurance premiums; |
| • | an impairment of our goodwill or intangible assets; |
| • | our ability to comply with all applicable export control laws and regulations of the United States and other countries and restrictions imposed by the Foreign Corrupt Practices Act; |
| • | the impact of regulations to address climate change; |
| • | risks associated with the funding of our pension plans, including actions by governmental authorities; |
| • | the impact of regulations related to conflict minerals; |
| • | our ability to acquire and protect our intellectual property rights and avoid claims of intellectual property infringement; |
| • | risks related to our substantial indebtedness; |
| • | failure of internal controls over financial reporting; |
| • | the ability of Carlyle and Madison Dearborn to control us; |
| • | other factors disclosed in this prospectus; and |
| • | other factors beyond our control. |
These cautionary statements should not be construed by you to be exhaustive and are made only as of the date of this prospectus. We undertake no obligation to update or revise any forward-looking statements, whether as a result of new information, future events or otherwise.
48
Table of Contents
We estimate the proceeds to us from this offering will be approximately $ million, based on an assumed public offering price of $ per share, which is the midpoint of the estimated offering price range set forth on the cover page of this prospectus, after deducting assumed underwriting discounts and commissions and other estimated offering expenses payable by us.
As of June 30, 2015, we had approximately $1,209 million of indebtedness outstanding on a consolidated basis (excluding $20.3 million of deferred financing fees and original issue discount), consisting of $200 million in aggregate principal amount of Notes and $1,009 million of Term Loans, other foreign indebtedness and capital leases. We intend to use $ million of the net proceeds from this offering to repay certain indebtedness and to pay related premiums, accrued and unpaid interest and to pay expenses related to this offering. To the extent that the public offering price is lower than $ per share, which is the midpoint of the estimated offering price range set forth on the cover page of this prospectus, and our cash proceeds are lower than we have estimated, or our offering expenses are greater than we have estimated, the amount of the indebtedness that we will repay will be reduced. To the extent that the public offering price is higher than $ per share, which is the midpoint of the estimated offering price range set forth on the cover page of this prospectus, and our cash proceeds are higher than we have estimated, or our offering expenses are less than we have estimated, the amount of the indebtedness that we will repay will be increased. We will not receive any net proceeds from the sale of common shares by the selling shareholders, including from any exercise by the underwriters of their option to purchase additional common shares.
Each $1.00 increase (decrease) in the assumed public offering price would increase (decrease) the net proceeds to us by approximately $ million, after deducting assumed underwriting discounts and commissions and other estimated offering expenses payable by us, assuming the number of common shares offered by us, as set forth on the cover page of this prospectus, remains the same. Each increase (decrease) of 1.0 million in the number of common shares offered by us would increase (decrease) the net proceeds to us by approximately $ million, after deducting assumed underwriting discounts and commissions and other estimated offering expenses payable by us, assuming the assumed public offering price of $ per share, which is the midpoint of the estimated offering price range set forth on the cover page of this prospectus. Any increase or decrease in the net proceeds would not change our intended use of proceeds.
49
Table of Contents
On December 2, 2012, we paid a dividend on the common stock of our previous owners in the amount of $14.2 million. Since that time, we have not paid any cash dividends and we do not intend to pay any cash dividends for the foreseeable future. We intend to retain earnings, if any, for the future operation and expansion of our business and the repayment of debt. Any determination to pay dividends in the future will be at the discretion of our Board of Directors and will depend upon our results of operations, cash requirements, financial condition, contractual restrictions, restrictions imposed by applicable laws and other factors that our Board of Directors may deem relevant. Specifically, we are subject to Bermuda legal constraints that may affect our ability to pay dividends on our common shares and make other payments. Under Bermuda law, a company may not declare or pay dividends if there are reasonable grounds for believing that: (i) the company is, or would after the payment be, unable to pay its liabilities as they become due or (ii) the realizable value of its assets would thereby be less than its liabilities. Our ability to pay dividends to holders of our common shares is also dependent upon our subsidiaries’ ability to make distributions to us, which is limited by the terms of the agreements governing the terms of their indebtedness. Additionally, the negative covenants in the agreements governing our indebtedness limit our ability to pay dividends and make distributions to our shareholders. For additional information on these limitations, see “Management’s Discussion and Analysis of Financial Condition and Results of Operations—Liquidity and Capital Resources.”
50
Table of Contents
The following table sets forth our consolidated cash and cash equivalents and capitalization as of June 30, 2015 (i) of Multi Packaging Solutions Global Holdings Limited and its subsidiaries on an actual basis and (ii) of Multi Packaging Solutions International Limited and its subsidiaries on an as adjusted basis giving effect to (a) the Reorg Transactions, (b) the completion of the common share split prior to the pricing of this offering as if it had occurred on June 30, 2015 and (c) this offering and the use of proceeds therefrom as set forth under the heading “Use of Proceeds.”
The information in this table should be read in conjunction with “Use of Proceeds,” “Selected Historical Financial Information,” and “Management’s Discussion and Analysis of Financial Condition and Results of Operations” and our financial statements and related notes thereto appearing elsewhere in this prospectus.
| As of June 30, 2015 | ||||||||
| Multi Packaging Solutions Global Holdings Limited actual |
Multi Packaging Solutions International Limited as adjusted |
|||||||
| (Dollars in thousands, except per share data) | ||||||||
| Cash and cash equivalents |
$ | 55,675 | $ | |||||
|
|
|
|
|
|||||
| Debt (net of discount)(1): |
||||||||
| Senior secured credit facilities, consisting of the following: |
||||||||
| Term Loans |
$ | 978,725 | $ | |||||
| Revolving Credit Facilities |
— | |||||||
| Notes(2) |
196,327 | |||||||
| Other foreign debt |
11,537 | |||||||
| Other financing |
1,800 | |||||||
|
|
|
|
|
|||||
| Total debt |
1,188,389 | |||||||
| Pre-IPO total Multi Packaging Solutions Global Holdings Limited shareholders’ equity: |
||||||||
| Contributed capital, par value £1.00 per share: 207,302,868 common shares authorized and outstanding, actual |
333,001 | — | ||||||
| Paid-in capital |
7,633 | — | ||||||
| Accumulated deficit |
(45,365) | — | ||||||
| Accumulated other comprehensive loss |
(13,287) | — | ||||||
|
|
|
|
|
|||||
| Total pre-IPO shareholders’ equity |
281,982 | — | ||||||
| Noncontrolling interests |
6,708 | — | ||||||
|
|
|
|
|
|||||
| Total pre-IPO shareholders’ equity |
288,690 | — | ||||||
|
|
|
|
|
|||||
| Post-IPO total Multi Packaging Solutions International Limited shareholders’ equity: |
||||||||
| Contributed capital, par value $1.00 per share: 10,000 common shares authorized and outstanding, actual; common shares authorized, common shares issued and common shares outstanding, as adjusted |
— | |||||||
| Paid-in capital |
— | |||||||
| Accumulated deficit |
— | |||||||
| Accumulated other comprehensive loss |
— | |||||||
|
|
|
|
|
|||||
| Total post-IPO shareholders’ equity |
— | |||||||
| Noncontrolling interests |
— | |||||||
|
|
|
|
|
|||||
| Total post-IPO shareholders’ equity |
— | |||||||
|
|
|
|
|
|||||
| Total capitalization |
$ | 1,477,079 | $ | |||||
|
|
|
|
|
|||||
51
Table of Contents
| (1) | Presented net of debt discount of $20.3 million. The senior secured credit facilities consist of (a) a $122.0 million Dollar Tranche A term loan maturing in August 2020 (the “Dollar Tranche A Term Loan”), (b) a $330.0 million Dollar Tranche B term loan maturing in August 2020 (the “Dollar Tranche B Term Loan”), (c) a $135.0 million Dollar Tranche C term loan maturing in September 2020 (the “Dollar Tranche C Term Loan”), (d) a £145.0 million Sterling term loan maturing in September 2020 (the “Sterling Term Loan”), (e) a £145.0 million Euro term loan maturing in September 2020 (the “Euro Term Loan” and, together with the Dollar Tranche A Term Loan, the Dollar Tranche B Term Loan , the Dollar Tranche C Term Loan, and the Sterling Term Loan, the “Term Loans”), (f) a $50.0 million U.S. dollar revolving credit facility maturing in August 2018 (the “Dollar Revolving Credit Facility”) and (g) a £50.0 million multi-currency revolving credit facility maturing in September 2019 (the “Multi-Currency Revolving Credit Facility” and, together with the Dollar Revolving Credit Facility, the “Revolving Credit Facilities”). As of June 30, 2015, we had $119.1 million (net of debt discount) of outstanding borrowings under the Dollar Tranche A Term Loan, $319.8 million (net of debt discount) of outstanding borrowings under the Dollar Tranche B Term Loan, $130.0 million (net of debt discount) of outstanding borrowings under the Dollar Tranche C Term Loan, $219.9 million (net of debt discount) of outstanding borrowings under the Sterling Term Loan, $189.8 million (net of debt discount) of outstanding borrowings under the Euro Term Loan and no outstanding borrowings under the Revolving Credit Facilities. As of June 30, 2015, we had approximately $49.7 million in additional borrowing capacity available under our Dollar Revolving Credit Facility, after giving effect to $0.3 million of outstanding letters of credit, and approximately £50 million in additional borrowing capacity available under our Multi-Currency Revolving Credit Facility, after giving effect to £0 of outstanding letters of credit. We expect to prepay approximately £16.5 million ($25.1 million) of our Sterling Term Loan using cash on hand prior to the closing of this offering. |
| (2) | Consists of $196.3 million (net of debt discount) in aggregate principal amount of 8.500% senior unsecured notes due 2021. |
The table set forth above is based on the number of common shares outstanding as of June 30, 2015. The table does not reflect common shares reserved for issuance under the 2015 Plan, which we plan to adopt in connection with this offering.
Additionally, the information presented above assumes:
| • | an initial public offering price of $ per share, which is the midpoint of the estimated offering price range set forth on the cover page of this prospectus; |
| • | no exercise of the option to purchase additional common shares by the underwriters; and |
| • | the adoption of our amended and restated bye-laws immediately prior to the closing of this offering. |
Each $1.00 increase (decrease) in the assumed public offering price of $ per share, which is the midpoint of the estimated offering price range set forth on the cover page of this prospectus, assuming the completion of the common share split, would increase (decrease) each of as adjusted paid-in capital, total shareholders’ equity and total capitalization by approximately $ million, $ million and $ million, respectively, assuming that the number of common shares offered by us, as set forth on the cover page of this prospectus, remains the same, and after deducting assumed underwriting discounts and commissions and other estimated offering expenses payable by us. We may also increase or decrease the number of common shares we are offering. Each increase of 1.0 million shares in the number of common shares offered by us at an assumed offering price of $ per share, which is the midpoint of the estimated offering price range set forth on the cover page of this prospectus, assuming the completion of the common share split, would increase each of our as adjusted paid-in capital, total shareholders’ equity and total capitalization by approximately $ million, $ million and $ million, respectively. Similarly, each decrease of 1.0 million shares in the number of common shares offered by us, at an assumed offering price of $ per share, which is the midpoint of the estimated offering price range set forth on the cover page of this prospectus, would decrease each of our as adjusted paid-in capital, total shareholders’ equity and total capitalization by approximately $ million, $ million and $ million, respectively. The as adjusted information discussed above is illustrative only and will be adjusted based on the actual public offering price and other terms of this offering determined at pricing.
52
Table of Contents
If you invest in our common shares, your interest will be diluted to the extent of the difference between the initial public offering price per share and the net tangible book deficit per share after this offering and the use of proceeds therefrom.
As of June 30, 2015, we had net tangible book deficit of approximately $608.8 million, or $ per share. Net tangible book deficit per share represents total tangible assets less total liabilities divided by the number of common shares outstanding. After giving effect to (i) the sale of common shares in this offering, based upon an assumed initial public offering price of $ per share, which is the midpoint of the estimated offering price range set forth on the cover page of this prospectus, after deducting estimated offering expenses payable by us and (ii) the use of proceeds therefrom as set forth under the heading “Use of Proceeds,” as if each had occurred on June 30, 2015, our as adjusted net tangible book deficit as of June 30, 2015 would have been approximately $ million, or $ per share. This represents an immediate decrease in net tangible book deficit of $ per share to existing shareholders and an immediate dilution of $ per share to new investors purchasing common shares in this offering. The following table illustrates this dilution on a per share basis:
| Per Share | ||||||||
| Assumed initial public offering price per share |
$ | |||||||
| Net tangible book deficit per share as of June 30, 2015 |
$ | |||||||
| Increase in net tangible book deficit per share attributable to this offering and use of proceeds therefrom |
||||||||
|
|
|
|||||||
| As adjusted net tangible book deficit per share after this offering |
||||||||
|
|
|
|||||||
| Dilution per share to new investors |
$ | |||||||
|
|
|
|||||||
Each $1.00 increase (decrease) in the assumed initial offering price would increase (decrease) our as adjusted net tangible book deficit after this offering by approximately $ million, or $ per share, and the dilution per share to new investors by $ per share, assuming the number of common shares offered by us, as set forth on the cover page of this prospectus, remains the same and after deducting assumed underwriting discounts and commissions and other estimated offering expenses payable by us.
An increase (decrease) of 1.0 million in the number of common shares offered by us would increase (decrease) our as adjusted net tangible book deficit after this offering by approximately $ million, or $ per share, and the dilution per share to new investors by $ , assuming the public offering price of $ per share, which is the midpoint of the estimated offering price range set forth on the cover page of this prospectus, remains the same and after deducting assumed underwriting discounts and commissions and other estimated offering expenses payable by us. To the extent that the public offering price is lower than $ per share, which is the midpoint of the estimated offering price range set forth on the cover page of this prospectus, and our cash proceeds are lower than we have estimated, or our offering expenses are greater than we have estimated, the amount of our indebtedness that we pay down will be reduced. To the extent that the public offering price is higher than $ per share, which is the midpoint of the estimated offering price range set forth on the cover page of this prospectus, and our cash proceeds are higher than we have estimated, or our offering expenses are less than we have estimated, the amount of our indebtedness that we pay down will be increased.
53
Table of Contents
The following table sets forth, as of June 30, 2015, the total number of common shares owned by existing shareholders, including the selling shareholders, and to be owned by new investors, the total consideration paid, and the average price per share paid by our existing shareholders and to be paid by new investors purchasing common shares in this offering. The calculation below is based on an assumed initial public offering price of $ per share, which is the midpoint of the estimated offering price range set forth on the cover page of this prospectus, before deducting the assumed underwriting discounts and commissions and other estimated offering expenses payable by us.
| Common Shares Purchased | Total Consideration | Average Price Per Common Share |
||||||||||||||||
| Number |
Percent | Amount | Percent | |||||||||||||||
| (in thousands, other than shares and percentages) | ||||||||||||||||||
| Existing shareholders |
% | $ | % | $ | ||||||||||||||
| New investors |
||||||||||||||||||
|
|
|
|
|
|
|
|
||||||||||||
| Total |
100 | % | $ | 100 | % | $ | ||||||||||||
|
|
|
|
|
|
|
|
||||||||||||
A $1.00 increase (decrease) in the assumed initial offering price would increase (decrease) total consideration paid by new investors, total consideration paid by all shareholders and average price per share paid by all shareholders by $ million, $ million and $ per share, respectively. An increase (decrease) of 1.0 million in the number of common shares offered by us would increase (decrease) total consideration paid by new investors, total consideration paid by all shareholders and average price per share paid by all shareholders by $ million, $ million and $ per share, respectively. An increase (decrease) of 1.0 million in the number of shares offered by the selling shareholders would increase (decrease) total consideration paid by new investors, total consideration paid by all shareholders and average price per share paid by all shareholders by $ million, $ million and $ per share, respectively.
If the underwriters’ option to purchase additional shares from the selling shareholders in this offering is exercised in full, the following will occur:
| • | the number of common shares held by existing shareholders after the completion of this offering will be , or approximately % of the total number of common shares outstanding after this offering; and |
| • | the number of common shares held by new investors in this offering after the completion of this offering will be , or approximately % of the total number of common shares outstanding after this offering. |
54
Table of Contents
SELECTED HISTORICAL FINANCIAL INFORMATION
The following table sets forth our historical audited and unaudited consolidated financial information for the periods and dates indicated.
The balance sheet data as of June 30, 2014 and 2015 and the statements of operations and cash flow data for the fiscal year ended June 30, 2013, the period from July 1, 2013 to August 14, 2013, the period from August 15, 2013 to June 30, 2014 and the fiscal year ended June 30, 2015 have been derived from the audited consolidated financial statements of MPS Holdings appearing elsewhere in this prospectus. The balance sheet data as of June 30, 2011, 2012 and 2013 and the statement of operations and cash flow data for the years ended June 30, 2010, 2011 and 2012 have been derived from the audited consolidated financial statements of MPS Holdings not included in this prospectus.
The statements of operations and cash flow data are presented for the Predecessor period, which relates to the period preceding the Madison Dearborn Transaction, and the Successor period, which relates the period succeeding the Madison Dearborn Transaction.
Historical results are not indicative of the results to be expected in the future. You should read the following data together with the more detailed information contained in “Management’s Discussion and Analysis of Financial Condition and Results of Operations” and our consolidated financial statements and the accompanying notes appearing elsewhere in this prospectus.
55
Table of Contents
| Twelve months ended June 30, 2014 |
||||||||||||||||||||||||||||||
| Predecessor | Successor | |||||||||||||||||||||||||||||
| For the fiscal years ended June 30, | Period from July 1, 2013 to August 14, 2013 |
Period from August 15, 2013 to June 30, 2014 |
Fiscal year ended June 30, 2015 |
|||||||||||||||||||||||||||
| (Dollars in thousands) |
2010 | 2011 | 2012 | 2013 | ||||||||||||||||||||||||||
| Net sales |
$ | 484,133 | $ | 514,695 | $ | 596,414 | $ | 579,401 | $ | 74,081 | $ | 814,213 | $ | 1,617,640 | ||||||||||||||||
| Cost of goods sold |
380,067 | 400,861 | 478,951 | 456,958 | 58,054 | 668,441 | 1,285,673 | |||||||||||||||||||||||
|
|
|
|
|
|
|
|
|
|
|
|
|
|
|
|||||||||||||||||
| Gross margin |
104,066 | 113,834 | 117,463 | 122,443 | 16,027 | 145,772 | 331,967 | |||||||||||||||||||||||
| Selling, general and administrative expenses |
||||||||||||||||||||||||||||||
| Selling, general and administrative |
77,975 | 77,938 | 82,513 | 76,260 | 9,729 | 135,212 | 247,360 | |||||||||||||||||||||||
| Management fees and expenses |
1,521 | 1,730 | 1,984 | 2,315 | 264 | — | — | |||||||||||||||||||||||
| Trade name impairment |
— | — | 7,705 | — | — | — | — | |||||||||||||||||||||||
| Transaction and other related expenses |
— | 8,642 | — | 3,080 | 28,370 | 38,844 | 13,630 | |||||||||||||||||||||||
|
|
|
|
|
|
|
|
|
|
|
|
|
|
|
|||||||||||||||||
| 79,496 | 88,310 | 92,202 | 81,655 | 38,363 | 174,056 | 260,990 | ||||||||||||||||||||||||
|
|
|
|
|
|
|
|
|
|
|
|
|
|
|
|||||||||||||||||
| Operating income (loss) |
24,570 | 25,524 | 25,261 | 40,788 | (22,336 | ) | (28,284 | ) | 70,977 | |||||||||||||||||||||
| Other income (expense) |
||||||||||||||||||||||||||||||
| Other income (expense), net |
257 | 1,775 | (375 | ) | 1,426 | 1,063 | 370 | 10,625 | ||||||||||||||||||||||
| Debt extinguishment charges |
— | — | — | (4,140 | ) | (14,042 | ) | — | (1,019 | ) | ||||||||||||||||||||
| Interest (expense) |
(15,902 | ) | (17,515 | ) | (19,490 | ) | (24,546 | ) | (3,991 | ) | (43,215 | ) | (75,437 | ) | ||||||||||||||||
|
|
|
|
|
|
|
|
|
|
|
|
|
|
|
|||||||||||||||||
| Total other expense, net |
(15,645 | ) | (15,740 | ) | (19,865 | ) | (27,260 | ) | (16,970 | ) | (42,845 | ) | (65,831 | ) | ||||||||||||||||
|
|
|
|
|
|
|
|
|
|
|
|
|
|
|
|||||||||||||||||
| Income (loss) before income taxes |
8,925 | 9,784 | 5,396 | 13,528 | (39,306 | ) | (71,129 | ) | 5,146 | |||||||||||||||||||||
| Income tax (benefit) expense |
4,248 | 6,589 | 1,260 | 4,195 | (15,621 | ) | (19,481 | ) | (1,880 | ) | ||||||||||||||||||||
|
|
|
|
|
|
|
|
|
|
|
|
|
|
|
|||||||||||||||||
| Net income |
4,677 | 3,195 | 4,136 | 9,333 | (23,685 | ) | (51,648 | ) | 7,026 | |||||||||||||||||||||
| Less: income attributable to noncontrolling interest |
— | — | — | — | — | 216 | 527 | |||||||||||||||||||||||
|
|
|
|
|
|
|
|
|
|
|
|
|
|
|
|||||||||||||||||
| Net income (loss) attributable to Company |
$ | 4,677 | $ | 3,195 | $ | 4,136 | $ | 9,333 | $ | (23,685 | ) | $ | (51,864 | ) | $ | 6,499 | ||||||||||||||
| Preferred stock dividends |
(21,781 | ) | (15,691 | ) | (18,696 | ) | (9,275 | ) | (25 | ) | — | $ | — | |||||||||||||||||
|
|
|
|
|
|
|
|
|
|
|
|
|
|
|
|||||||||||||||||
| Income available (loss attributable) to common shareholders |
$ | (17,104 | ) | $ | (12,496 | ) | $ | (14,560 | ) | $ | 58 | $ | (23,710 | ) | $ | (51,864 | ) | 6,499 | ||||||||||||
|
|
|
|
|
|
|
|
|
|
|
|
|
|
|
|||||||||||||||||
| Earnings (loss) per share: |
||||||||||||||||||||||||||||||
| Basic |
$ | (148.87 | ) | $ | (108.73 | ) | $ | (125.81 | ) | $ | .50 | $ | (203.74 | ) | $ | (.35 | ) | $ | .03 | |||||||||||
| Diluted |
$ | (148.87 | ) | $ | (108.73 | ) | $ | (125.81 | ) | $ | .49 | $ | (203.74 | ) | $ | (.35 | ) | $ | .03 | |||||||||||
| Weighted average shares outstanding: |
||||||||||||||||||||||||||||||
| Basic |
114,892 | 114,925 | 115,728 | 116,110 | 116,373 | 148,027,204 | 207,302,868 | |||||||||||||||||||||||
| Diluted |
114,892 | 114,925 | 115,728 | 119,073 | 116,373 | 148,027,204 | 207,302,868 | |||||||||||||||||||||||
| Predecessor | Successor | |||||||||||||||||||||
| As of June 30, | As of June 30, | |||||||||||||||||||||
| (Dollars in thousands) |
2011 | 2012 | 2013 | 2014 | 2015 | |||||||||||||||||
| Total assets |
$ | 385,061 | $ | 349,201 | $ | 347,505 | $ | 1,844,155 | $ | 1,882,125 | ||||||||||||
| Debt |
229,473 | 207,523 | 389,198 | 1,133,202 | 1,188,389 | |||||||||||||||||
| Redeemable preferred stock |
8,468 | 8,667 | — | — | — | |||||||||||||||||
| Cash dividends on common shares |
— | — | 14,162 | — | — | |||||||||||||||||
| Cash dividends per common share |
— | — | 54.65 | — | — | |||||||||||||||||
56
Table of Contents
MANAGEMENT’S DISCUSSION AND ANALYSIS OF FINANCIAL CONDITION
AND RESULTS OF OPERATIONS
The following discussion should be read in conjunction with our consolidated June 30 annual financial statements. The statements in the discussion and analysis regarding industry outlook, our expectations regarding the performance of our business and other forward-looking statements are subject to numerous known and unknown risks and uncertainties, including, but not limited to, the risks and uncertainties described in “Risk Factors” and “Forward-Looking Statements.” Our actual results may differ materially from those contained in or implied by any forward-looking statements. You should read the following discussion together with the sections entitled “Risk Factors,” “Prospectus Summary—Summary Historical Audited Consolidated and Unaudited Pro Forma Combined Financial Information,” “Selected Historical Financial Information,” the unaudited pro forma combined financial statements appearing elsewhere in this prospectus and historical audited consolidated financial statements, including the related notes, appearing elsewhere in this prospectus. All references to years, unless otherwise noted, refer to our fiscal years, which end on June 30. All dollar values in this section, unless otherwise noted, are denoted in millions. For purposes of this section, all references to “we,” “us,” “our,” “MPS” or the “Company” refer to Multi Packaging Solutions Global Holdings Limited and subsidiaries.
Overview
We print and manufacture high quality paperboard, paper and plastic packaging in the North American, European and Asian segments. Within each of these geographic segments, we sell products into the healthcare, consumer and multi-media end markets.
The healthcare market includes pharmaceutical, nutraceutical and healthcare related products. The consumer market includes cosmetics, personal care and toiletries, food, spirits, sporting goods, transaction and gift cards, confectionary, liquor and general consumer products. The multi-media market includes home video, software, music, video games and media-related special packaging product.
Products are manufactured in 59 facilities located in the United States, Europe, Canada, Mexico and China. We also have strategic alliances with companies in Europe and China who outsource certain products and production activities. In some cases, we procure non-paperboard, paper or plastic products to include in special packaging project deliverables for our customers. Products are generally cartons, labels, inserts or other paper or paperboard packaging products.
Cartons are generally paperboard based folding cartons. Labels are generally paper and pressure sensitive label stock printed products that are delivered in reel form or in a cut and stack form and can include basic labels for bottles and boxes, and extended content labels designed to deliver more information to the ultimate purchaser of our customer’s products. Inserts include fine paper folded inserts used in the delivery of detailed warnings, instructions and other information to the ultimate purchaser of our customer’s products. Other products include all remaining products. Often the project deliverables to a customer include all or a combination of these products.
Our strategic objectives are (i) continuing to enhance our position as a leading provider of packaging products to the segments we serve and can serve in North America, Europe and Asia; (ii) the expansion further into international markets to meet the global sourcing needs of our customers; and (iii) the identification of other areas in the packaging industry that can most benefit from our ability to deliver quality packaging products according to our customers’ needs, including the leveraging of its recent transactions via cross-selling both products and geographies. To achieve these objectives, we intend to continue expanding our printing, packaging and graphic arts capabilities, including the development and application of advanced manufacturing technologies and the establishment of manufacturing facilities in strategic international markets.
57
Table of Contents
Key Transactions
Certain key transactions have had a significant impact on the comparability of the information presented in this section. The timeline below shows our most recent transactions that impact comparability.
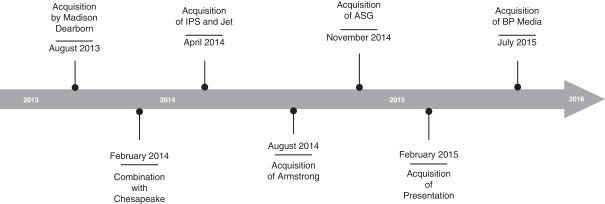
Acquisition of the Company by Madison Dearborn Partners, LLC
On August 15, 2013, IPC/Packaging LLC completed the sale of Multi Packaging Solutions, Inc. for approximately $647 million to Madison Dearborn. In connection with the transaction, all previously outstanding securities and debt were redeemed or repaid, and new credit facilities were established and the Notes were issued. The operations prior to August 15, 2013 are referred to as the “Predecessor” operations, and operations subsequent to August 15, 2013 are referred to as the “Successor” operations.
Combination with Chesapeake
On February 14, 2014, we completed the closing of the combination with Chesapeake. Chesapeake emerged as the new parent entity, and subsequently changed its name to Multi Packaging Solutions Global Holdings Limited. We are 50% owned by the former shareholders of MPS (Madison Dearborn) and 50% by the former shareholders of Chesapeake (Carlyle). The combination was accounted for as a reverse acquisition with Chesapeake as the legal acquiror and Mustang as the legal subsidiary but the accounting acquiror. Chesapeake had annual sales of approximately $852 million for the year ended December 31, 2013. Results for the Chesapeake business are included in our results for the fiscal year ended June 30, 2014 since February 14, 2014, the date of the acquisition.
Acquisition of Integrated Print Solutions and Jet Lithocolor
On April 4, 2014, we completed the acquisitions of 70% of Integrated Printing Solutions (“IPS”) and all of Jet Lithocolor (“Jet”) to create a comprehensive end-to-end solution for the credit, debit, gift, loyalty and insurance card markets. The acquisitions solidify our market position by adding a full complement of card production capabilities to our existing creative services, decorative technologies and sustainable solutions. These capabilities include laminated card production, imaging, affixing, direct mail and fulfillment. Furthermore, the acquisitions provide us with a fully integrated supply chain for cards, carriers, multi-packs and point-of-purchase displays in a range of materials, with turnkey resources for design, production and distribution for open and closed-loop card programs. IPS and Jet had annual sales of approximately $34 million and $61 million, respectively, for the twelve months ending immediately prior to the date of the acquisition.
58
Table of Contents
Acquisition of Armstrong
On July 8, 2014 we completed the acquisition of Armstrong Packaging (“Armstrong”), a United Kingdom-based producer of specialty rigid boxes. The acquisition of Armstrong expands our global platform for luxury packaging, gift sets, travel retail and commemorative editions. Armstrong’s product development and rigid box manufacturing complement our existing manufacturing, creative design, project management and global sourcing capabilities. Armstrong has annual sales of approximately $15 million for the twelve months ending immediately prior to the date of the acquisition.
Acquisition of ASG North American, Mexican and China Print and Packaging Operations
On November 21, 2014 we completed the acquisition of the North American and Asian print businesses of AGI Global Holdings Coöperatief U.A. and AGI Shorewood Group, US Holdings, LLC (collectively, “ASG”). The acquisition of ASG, a manufacturer of print and packaging in the United States, Canada, Mexico and China, expands our global network and customer base. ASG has annual sales of approximately $350 million for the twelve months ending immediately prior to the date of the acquisition.
Acquisition of Presentation Products
On February 28, 2015 we completed the acquisition of Presentation Products (“Presentation”). The acquisition of Presentation complements the acquisition of Armstrong (discussed above). Presentation is a rigid specialty box manufacturer located in the United Kingdom and has import and China sourcing offices located in Hong Kong, China. Presentation specializes in high end consumer packaging with an emphasis in the spirits market. Presentation has annual sales of approximately $42 million for the twelve months ending immediately prior to the date of the acquisition.
Acquisition Accounting
All of the transactions described above were accounted for as a purchase business combination. Accordingly, in all cases the assets and liabilities of the acquired or merged entities were recorded at fair value as of the respective closing dates and the results of operations of the entities are included in our results of operations from the date of closing.
Subsequent Events – Acquisition of BP Media
On July 1, 2015 we completed the acquisition of BP Media, Ltd. (“BluePrint”). The acquisition of BluePrint provides us with pre-press and digital services in the European market, facilitating the processes surrounding translation and interchangeability of print content for foreign locations. In addition, BluePrint provides us with an established sales presence in the media markets in Europe which will enable us to serve the European needs of global media releases. BluePrint has annual sales of approximately $23 million for the 12 months immediately prior to the date of acquisition. The initial purchase consideration was $5.2 million. Additional future payments up to $3.9 million may be paid based on operating results.
Subsequent Events – Plant Reorganization
In September 2015 we announced the closure of our facility in Melrose Park, Illinois. This facility will be combined with our other operations in Illinois. The Melrose Park closure is anticipated to be completed near the end of the calendar year. In connection with the closure, we will record restructuring expenses of approximately $2.7 million in the quarter ended September 30, 2015. We lease the underlying facility on a month-to-month basis.
59
Table of Contents
Trends
General Information
Our largest customers are generally large multinational entities, many of which are consolidating global packaging requirements under a smaller number of suppliers. We believe we are favorably situated for this transition due to our many facilities, global footprint, standardized equipment from plant to plant and our relative size to other packaging suppliers. The packaging marketplace is very fragmented, with no one vendor providing a significant portion of the packaging needs.
Net Sales Trends
Net sales are impacted by the macroeconomic performance of our geographic segments and the markets within these geographic segments. Packaging net sales tend to be strongest just before the underlying customer’s busy season, which for high-end branded products is generally strongest in our first and second fiscal quarters.
Healthcare net sales in each of our geographic segments are influenced by the severity of a particular region’s cold and flu seasons, as well as the development and acceptance of certain new products, and the stage of product, from the prescription-only stage to the private label or generic stage.
European consumer net sales of confectionary products are generally stronger in our second quarter due to the holiday season. North American and European consumer net sales of spirits are also generally stronger in our second quarter due to the holiday season. Asia consumer net sales of spirits are generally stronger in their holiday season, generally in our third fiscal quarter.
The net sales to the North American multi-media end market are influenced by the success of a particular year’s movie releases, which can generate special packaging needs for these customers. For example, movie releases were not as successful for the fiscal period ended June 30, 2015 as compared to the year ended June 30, 2014. Net sales of packaging in the North American video game market are generally influenced by the age of existing, and introduction of new, gaming platforms. Product launches, which cannot be predicted far in advance, have an impact on net sales, particularly with respect to special packaging needed for the holiday season. Overall, we expect our multi-media net sales to continue to decline as a percentage of our total net sales.
Multi-media sales for the North American market declined for the year ended June 30, 2014 when compared to the fiscal period ended June 30, 2013 by $19.5 million. Although North American multi-media sales increased for the fiscal period ended June 30, 2015 when compared to the year ended June 30, 2014 by $17.3 million, this increase was principally due to the inclusion of the sales from the acquired ASG operations in the fiscal period ended June 30, 2015. The acquired ASG operations were integrated immediately upon acquisition and, as a result, it is not possible to isolate the portion of revenues attributable to the ASG operations. However, had the ASG acquisition not occurred, multi-media sales would have declined for the fiscal period ended June 30, 2015. Multi-media sales for the European market declined for the year ended June 30, 2014 when compared to the fiscal period ended June 30, 2013 by $4.3 million. Multi-media sales for the European market declined for the fiscal period ended June 30, 2015 when compared to the year ended June 30, 2014 by $2.9 million. The ASG acquisition did not impact European multi-media sales.
Impact of Inflation and Pricing
We have not historically been and do not expect to be significantly impacted by inflation. Increases in payroll costs and any increases in raw material costs that we have encountered are generally able to be offset through lean manufacturing activities. We have consistently made annual investments in capital that deliver efficiencies and cost savings. The benefits of these efforts generally offset the margin impact of competitive pricing conditions in all of the markets we serve.
60
Table of Contents
We remain sensitive to price competitiveness in the markets that we serve and in the areas that are targeted for growth, and believe that the installation of state-of-the-art printing and manufacturing equipment as well as utilization of lean manufacturing (and related labor and production efficiencies) will enable us to compete effectively.
Operational Restructurings
We regularly evaluate our operating facilities in our geographic segments in order to determine how to allocate our resources, share best practices, ensure logistics that serve customers are appropriate and maximize our operating efficiencies. In connection with these evaluations, we have closed certain facilities in recent periods. For example, in April 2014, we announced the planned closure of our plants in Evansville, Indiana and in Fairfield, New Jersey. The Evansville plant closure was completed in September 2014, and the Fairfield plant closure was completed in December 2014. In connection with the closures, we recorded approximately $3.0 million in restructuring charges in the period ended June 30, 2014. We sold both of the related plant facilities in the period ended June 30, 2015 for proceeds of approximately $5.0 million with no significant gain or loss recorded in our income statement.
On November 1, 2013, we announced the closure of our plant in Terre Haute, Indiana. For the year ended June 30, 2014 we recorded approximately $4.7 million in restructuring charges, which includes approximately $2.8 million for severance and benefits and approximately $1.9 million for facility exit costs.
As discussed above, in September 2015 we announced the closure of our Melrose Park, Illinois facility.
Results of Operations
Fiscal Periods Ended August 14, 2013 and June 30, 2014 Compared to Fiscal Year Ended June 30, 2015
The table below presents our results of operations for the respective periods:
| Fiscal Year ended June 30, 2014 | ||||||||||||||
| Predecessor | Successor | |||||||||||||
| (Dollars in thousands) | Period from July 1, 2013 to August 14, 2013 |
Period from August 14, 2013 to June 30, 2014 |
Fiscal year ended June 30, 2015 |
|||||||||||
| Net Sales |
$ | 74,081 | $ | 814,213 | $ | 1,617,640 | ||||||||
| Cost of Goods Sold |
58,054 | 668,441 | 1,285,673 | |||||||||||
|
|
|
|
|
|
|
|||||||||
| Gross Margin |
16,027 | 145,772 | 331,967 | |||||||||||
|
|
|
|
|
|
|
|||||||||
| Selling, General and Administrative Expenses |
||||||||||||||
| Selling General and Admin |
9,729 | 135,212 | 247,360 | |||||||||||
| Management Fees |
264 | — | — | |||||||||||
| Transaction and other related expenses |
28,370 | 38,844 | 13,630 | |||||||||||
|
|
|
|
|
|
|
|||||||||
| 38,363 | 174,056 | 260,990 | ||||||||||||
|
|
|
|
|
|
|
|||||||||
| Operating income (loss) |
(22,336 | ) | (28,284 | ) | 70,977 | |||||||||
|
|
|
|
|
|
|
|||||||||
| Other income (expense) |
||||||||||||||
| Other income net |
1,063 | 370 | 10,625 | |||||||||||
| Debt extinguishment charges |
(14,042 | ) | — | (1,019 | ) | |||||||||
| Interest Expense |
(3,991 | ) | (43,215 | ) | (75,437 | ) | ||||||||
|
|
|
|
|
|
|
|||||||||
| Total other expense, net |
(16,970 | ) | (42,845 | ) | (65,831 | ) | ||||||||
|
|
|
|
|
|
|
|||||||||
| Income (loss) before income taxes |
(39,306 | ) | (71,129 | ) | 5,146 | |||||||||
| Income tax (benefit) expense |
(15,621 | ) | (19,481 | ) | (1,880 | ) | ||||||||
|
|
|
|
|
|
|
|||||||||
| Net income (loss) |
(23,685 | ) | (51,648 | ) | 7,026 | |||||||||
| Less: income attributable to non-controlling interest |
— | 216 | 527 | |||||||||||
|
|
|
|
|
|
|
|||||||||
| Net income (loss) attributable to Company |
$ | (23,685 | ) | $ | (51,864 | ) | $ | 6,499 | ||||||
|
|
|
|
|
|
|
|||||||||
61
Table of Contents
Net Sales
Our consolidated financial statements will not be directly comparable to the consolidated financial statements of the Predecessor due to the effects of the Madison Dearborn Transaction in August 2013. However, for purposes of discussion of the results of operations for net sales, we compared the net sales for the fiscal year ended June 30, 2015 to the combined results of the Predecessor from July 1, 2013 to August 14, 2013 and the Successor from August 15, 2013 to June 30, 2014. We believe the comparison to combined net sales assists readers in understanding and assessing the trends and significant changes in our net sales, provides a more meaningful method of comparison and does not impact the drivers of the financial changes between the relevant periods.
The increase in net sales for the fiscal year ended June 30, 2015 was $729.3 million, or 82.1%, when compared to the fiscal year ended June 30, 2014 (inclusive of both the Predecessor and Successor periods). The increase is due to the inclusion of a full year’s sales following the combination of Chesapeake, and the inclusion of sales from the acquired operations of ASG and other acquisitions. Sales related to the acquired operations increased sales by approximately $692.4 million. In addition, sales were negatively impacted by foreign exchange by approximately $(77.0) million.
We operate our business along the following operating segments, which are grouped based on the basis of geographic region: North America, Europe and Asia. Net sales by geographic segment, as further broken down by end market, are summarized as follows:
| Fiscal Year ended June 30, 2014 | ||||||||||||||
| Predecessor | Successor | |||||||||||||
| Net Sales by Geographic Segment (Dollars in thousands) |
Period from July 1, 2013 to August 14, 2013 |
Period from August 14, 2013 to June 30, 2014 |
Fiscal year ended June 30, 2015 |
|||||||||||
| North America |
||||||||||||||
| Healthcare |
$ | 20,837 | $ | 181,255 | $ | 277,832 | ||||||||
| Consumer |
14,071 | 158,627 | 306,758 | |||||||||||
| Multi-media |
23,820 | 112,149 | 153,298 | |||||||||||
|
|
|
|
|
|
|
|||||||||
| 58,728 | 452,031 | $ | 737,888 | |||||||||||
|
|
|
|
|
|
|
|||||||||
| Europe |
||||||||||||||
| Healthcare |
92 | 140,977 | 346,777 | |||||||||||
| Consumer |
12,023 | 209,268 | 469,136 | |||||||||||
| Multi-media |
3,238 | 4,151 | 4,478 | |||||||||||
|
|
|
|
|
|
|
|||||||||
| 15,353 | 354,396 | 820,391 | ||||||||||||
|
|
|
|
|
|
|
|||||||||
| Asia |
||||||||||||||
| Healthcare |
— | 7,786 | 19,373 | |||||||||||
| Consumer |
— | 0 | 39,988 | |||||||||||
|
|
|
|
|
|
|
|||||||||
| — | 7,786 | 59,361 | ||||||||||||
|
|
|
|
|
|
|
|||||||||
| $ | 74,081 | $ | 814,213 | $ | 1,617,640 | |||||||||
|
|
|
|
|
|
|
|||||||||
North America
The increase in North American net sales for the fiscal year ended June 30, 2015 was $227.1 million, or 44.5%, when compared to the combined fiscal year ended June 30, 2014 (inclusive of both the Predecessor and Successor periods). The increase in North American healthcare sales for the fiscal year ended June 30, 2015 was $75.7 million, or 37.5%, when compared to the combined fiscal year ended June 30, 2014 (inclusive of both the Predecessor and Successor periods). The increase in North American consumer net sales for the fiscal year ended June 30, 2015 was $134.1 million, or 77.6%, when compared to the combined fiscal year ended June 30, 2014
62
Table of Contents
(inclusive of both the Predecessor and Successor periods). The increase in North American media sales for the fiscal year ended June 30, 2015 was $17.3 million or 12.7%, when compared to the combined fiscal year ended June 30, 2014 (inclusive of both the Predecessor and Successor periods).
North American healthcare and consumer net sales primarily increased due to the inclusion of a full year of sales from the merger with Chesapeake, which included customers that sell (i) healthcare-related products and prescription drugs and (ii) consumer products such as confectionary, spirits and cosmetics. Consumer sales are also higher due to inclusion of a full year of operations of Jet and IPS, both of which serve the transaction card consumer market.
The acquisition of ASG in November 2014 increased consumer, healthcare and media sales due to that acquisition serving those markets. Multi-media sales went up principally due to that acquisition, but overall sales trends in multi-media are expected to continue to decline and absent the acquisition activity, would have declined. Multi-media sales are declining due to the change in delivery systems towards digital delivery via downloads or online and pay-per-view systems. Our sales are reflective of the overall trend in the multi-media end market.
Europe
The increase in Europe net sales for the fiscal year ended June 30, 2015 was $450.6 million, or 121.9%, when compared to the combined fiscal year ended June 30, 2014 (inclusive of both the Predecessor and Successor periods). Overall, the increase in net sales for Europe was due to the merger with Chesapeake.
The increase in Europe healthcare sales for the fiscal year ended June 30, 2015 was $205.7 million, or 145.8%, when compared to the combined fiscal year ended June 30, 2014 (inclusive of both the Predecessor and Successor periods). The increase in Europe consumer net sales for the fiscal year ended June 30, 2015 was $247.8 million, or 112.0%, when compared to the combined fiscal year ended June 30, 2014 (inclusive of both the Predecessor and Successor periods).
The increase in healthcare sales and consumer sales in Europe is principally due to the merger with Chesapeake and including a full year of its operations in the financial statements. The largest portion of the negative foreign exchange impact was in the consumer segment of the business. Without foreign exchange and the acquisitions, net sales for both markets would have increased slightly.
The decrease in Europe multi-media sales for the fiscal year ended June 30, 2015 was $2.9 million, or 39.4%, when compared to the combined fiscal year ended June 30, 2014 (inclusive of both the Predecessor and Successor periods). This multi-media decline in Europe is for the same reasons as described above for North America.
Asia
The increase in Asia net sales for the fiscal year ended June 30, 2015 was $51.6 million, or 661.5%, when compared to the combined fiscal year ended June 30, 2014 (inclusive of both the Predecessor and Successor periods). The merger with Chesapeake and the inclusion of a full year of operations had a positive impact on sales, but the largest impact was due to the acquisition of ASG in November 2014 and the inclusion of its sales for a portion of the year.
The increase in Asia healthcare sales for the fiscal year ended June 30, 2015 was $11.6 million, or 148.8%, when compared to the combined fiscal year ended June 30, 2014 (inclusive of both the Predecessor and Successor periods). The increase was due to the acquisitions described above.
63
Table of Contents
Cost of Sales/Gross Margin
| Fiscal Year ended June 30, 2014 | ||||||||||||||
| Predecessor | Successor | |||||||||||||
| (Dollars in thousands) | Period from July 1, 2013 to August 14, 2013 |
Period from August 14, 2013 to June 30, 2014 |
Fiscal year ended June 30, 2015 |
|||||||||||
| Net Sales |
$ | 74,081 | $ | 814,213 | $ | 1,617,640 | ||||||||
| Cost of Goods Sold |
58,054 | 668,441 | 1,285,673 | |||||||||||
|
|
|
|
|
|
|
|||||||||
| Gross Margin |
16,027 | 145,772 | 331,967 | |||||||||||
|
|
|
|
|
|
|
|||||||||
| Gross Margin % |
21.6 | % | 17.9 | % | 20.5 | % | ||||||||
|
|
|
|
|
|
|
|||||||||
The gross margin percentage for the fiscal year ended June 30, 2015 increased compared to the gross margin percentage for the Successor period ended June 30, 2014 principally due to the favorable impact of integration programs and synergies realized from the merger with Chesapeake for a full year, and the acquisition of ASG in November 2014. The gross margin for the fiscal year ended June 30, 2015 is lower than the gross margin for the Predecessor period ended August 14, 2013 principally due to the effect of lower gross margin of the ASG operations where integration programs and synergy programs had not yet had a full year of impact. In addition, the gross margin for the period ended June 30, 2015 was lower due to the increased depreciation and amortization as well as inventory step up in value that resulted from the acquisitions discussed above.
Selling, General and Administrative Expenses
Selling, general and administrative expenses as a percentage of net sales for the year ended June 30, 2015 was 15.3% as compared to 16.6% for the Successor period ended June 30, 2014. The reduction in this percentage is principally due to the benefit of reduced personnel costs associated with the integration of the acquired operations discussed above. Selling, general and administrative expenses for the Predecessor period ended August 14, 2013 was 13.1%. The increase in the percentage of selling, general and administrative expenses for the fiscal year ended June 30, 2015 when compared to the period ended August 14, 2013 was principally due to the amortization of intangible assets recorded in connection with the acquisitions described above.
There were no management fees paid in the Successor periods ended June 30, 2014 and fiscal year ended June 30, 2015 as the current sponsors do not charge a management fee.
Transaction expenses for the fiscal year ended June 30, 2015 are directly related to the acquisition and merger activity discussed above, and are comprised primarily of legal fees, diligence expenses and opening balance sheet fair valuation expenses of approximately $8.6 million and synergy achievement bonuses of approximately $5.0 million. Approximately half of these bonus payments were made in August 2015, and the remainder are scheduled to be paid in January 2016.
Other Income (Expense)
Other income (expense) is principally related to foreign currency transaction gains and losses.
The increase in foreign currency transaction gains in the fiscal year ended June 30, 2015 is due to fluctuations in foreign currency exchange rates.
The increase in interest expense in the fiscal year ended June 30, 2015 as compared to the period ended June 30, 2014 and the period ended August 14, 2013 was principally due to the increased debt associated with the acquisitions. We borrowed additional funds in November 2014 to complete the ASG transaction, and interest expense associated with this additional debt was partially offset by the repricing of our European debt facilities in
64
Table of Contents
December 2014. Included in interest expense in the fiscal year ended June 30, 2015 and the periods ended June 30, 2014 and August 14, 2013 are deferred finance fees and debt discount of approximately $4.6 million, $2.7 million and $0.3 million, respectively.
Income Taxes
Our effective income tax rate for the period from July 1, 2013 to August 14, 2013, the period from August 15, 2013 to June 30, 2014 and the year ended June 30, 2015 was 39.7%, 27.4% and 36.5%, respectively. For the period from July 1, 2013 to August 14, 2013 and the period from August 15, 2013 to June 30, 2014 the effective tax rate was principally impacted by permanent differences arising from transaction costs that were not deductible for tax purposes, as well as foreign tax rate differentials and losses in jurisdictions where no benefit is realized. For the year ended June 30, 2015 the effective tax rate was principally impacted by the recognition of previously unrecognized tax benefits due to the expirations of statute of limitations for certain foreign uncertain tax positions and a change in the state income tax rate from 3.5% to 2.0%.
Operating Income/Adjusted EBITDA
Our operating income (loss) and Adjusted EBITDA as presented in the tables below are principally impacted by (i) the period from August 15, 2013 to June 30, 2014 being shorter than the fiscal year ended June 30, 2015 by 1.5 months, (ii) the acquisition of ASG in November 2014, (iii) the inclusion of a full year of operations of Chesapeake in the June 30, 2015 results and (iv) the fiscal year ended June 30, 2015 results being negatively impacted by foreign exchange rates in the amount of $15.0 million.
| Fiscal Year ended June 30, 2014 | ||||||||||||||
| Predecessor | Successor | |||||||||||||
| (Dollars in thousands) | Period from July 1, 2013 to August 14, 2013 |
Period from August 15, 2013 to June 30, 2014 |
Fiscal year ended June 30, 2015 |
|||||||||||
| Operating Income (Loss) |
||||||||||||||
| North America |
$ | (24,524 | ) | $ | (37,181 | ) | $ | 18,317 | ||||||
| Europe |
2,188 | 8,711 | $ | 46,442 | ||||||||||
| Asia |
— | 186 | $ | 6,218 | ||||||||||
|
|
|
|
|
|
|
|||||||||
| $ | (22,336 | ) | $ | (28,284 | ) | $ | 70,977 | |||||||
|
|
|
|
|
|
|
|||||||||
| Adjusted EBITDA |
||||||||||||||
| North America |
$ | 7,390 | $ | 71,290 | $ | 97,001 | ||||||||
| Europe |
3,081 | 46,816 | 126,350 | |||||||||||
| Asia |
— | 684 | 7,611 | |||||||||||
|
|
|
|
|
|
|
|||||||||
| $ | 10,471 | $ | 118,790 | $ | 230,962 | |||||||||
|
|
|
|
|
|
|
|||||||||
North America
North American operating income (loss) was $(24.5) million, $(37.2) million and $18.3 million for the period from July 1, 2013 to August 14, 2013, the period from August 15, 2013 to June 30, 2014 and the fiscal year ended June 30, 2015, respectively.
North American Adjusted EBITDA was $7.4 million, $71.3 million and $97.0 million for the period from July 1, 2013 to August 14, 2013, the period from August 15, 2013 to June 30, 2014 and the fiscal year ended June 30, 2015, respectively.
North American operating income and Adjusted EBITDA increased for the period from August 15, 2013 to June 30, 2014, compared to the fiscal year ended June 30, 2015, principally due to (i) the period from August 15, 2013 to June 30, 2014 is shorter than the fiscal year ended June 30, 2015 by 1.5 months and (ii) the acquisition of
65
Table of Contents
ASG in November 2014 which has the majority of its operations in North America, offset by transaction costs associated with the acquisition of ASG. North American operating loss for the period from July 1, 2013 to August 14, 2013 was lower than the loss for the period August 14, 2013 to June 30, 2014 (and Adjusted EBITDA was higher) principally due to (i) the costs associated with the inclusion of the results of Chesapeake in the June 30, 2014 period, (ii) the transaction costs during the June 30, 2014 period related to the Chesapeake merger and other acquisitions discussed previously, as well as (iii) the amortization of step up adjustments from the fair valuation of assets and liabilities related to the acquisition accounting.
Europe
Europe operating income (loss) was $2.2 million, $8.7 million and $46.4 million for the period from July 1, 2013 to August 14, 2013, the period from August 15, 2013 to June 30, 2014 and the fiscal year ended June 30, 2015, respectively.
Europe Adjusted EBITDA was $3.1 million, $46.8 million and $126.4 million for the period from July 1, 2013 to August 14, 2013, the period from August 15, 2013 to June 30, 2014 and the fiscal year ended June 30, 2015, respectively.
Europe operating income and Adjusted EBITDA increased for the period from August 15, 2013 to June 30, 2014, compared to the fiscal year ended June 30, 2015, principally due to (i) the period from August 15, 2013 to June 30, 2014 is shorter than the fiscal year ended June 30, 2015 by 1.5 months and (ii) the inclusion of a full year of operations of Chesapeake in the June 30, 2015 results which had the majority of its operations in Europe, offset by transaction costs associated with the merger of Chesapeake. Europe operating income and Adjusted EBITDA for the period from July 1, 2013 to August 14, 2013 was higher than the operating income and Adjusted EBITDA for the period August 14, 2013 to June 30, 2014 principally due to (i) the inclusion of the results of Chesapeake in the June 30, 2014 period, (ii) the transaction costs during the June 30, 2014 period related to the Chesapeake merger and other acquisitions discussed previously, as well as (iii) the amortization of step up adjustments from the fair valuation of assets and liabilities related to the acquisition accounting.
Asia
Asia operating income (loss) was $0, $0.2 million and $6.2 million for the period from July 1, 2013 to August 14, 2013, the period from August 15, 2013 to June 30, 2014 and the fiscal year ended June 30, 2015, respectively.
Asia Adjusted EBITDA was $0, $0.7 million and $7.6 million for the period from July 1, 2013 to August 14, 2013, the period from August 15, 2013 to June 30, 2014 and the fiscal year ended June 30, 2015, respectively.
Asia operating income and Adjusted EBITDA increased for the period from August 15, 2013 to June 30, 2014, compared to the fiscal year ended June 30, 2015, principally due to (i) the period from August 15, 2013 to June 30, 2014 is shorter than the fiscal year ended June 30, 2015 by 1.5 months, and (ii) the inclusion of the results of the ASG acquisition which was acquired in November 2014 and had operations in China. Asia operating income and Adjusted EBITDA for the period from July 1, 2013 to August 14, 2013 was higher than the operating income and Adjusted EBITDA for the period August 14, 2013 to June 30, 2014 principally due to the (i) the inclusion of the results of Chesapeake in the June 30, 2014 period (the predecessor did not have operations in Asia.
66
Table of Contents
Fiscal Year Ended June 30, 2013 Compared to Fiscal Periods Ended August 14, 2013 and June 30, 2014
The table below presents our results of operations for the respective periods.
| Fiscal year ended June 30, 2014 | ||||||||||||||
| Predecessor | Successor | |||||||||||||
| (Dollars in thousands) | Fiscal year ended June 30, 2013 |
Period from July 1, 2013 to August 14, 2013 |
Period from August 15, 2013 to June 30, 2014 |
|||||||||||
| Net sales |
$ | 579,401 | $ | 74,081 | $ | 814,213 | ||||||||
| Cost of goods sold |
456,958 | 58,054 | 668,441 | |||||||||||
|
|
|
|
|
|
|
|||||||||
| Gross margin |
122,443 | 16,027 | 145,772 | |||||||||||
|
|
|
|
|
|
|
|||||||||
| Selling, general and administrative expenses |
||||||||||||||
| Selling, general and administrative expenses |
76,260 | 9,729 | 135,212 | |||||||||||
| Management fees and expenses |
2,315 | 264 | — | |||||||||||
| Transaction and other related expenses |
3,080 | 28,370 | 38,844 | |||||||||||
|
|
|
|
|
|
|
|||||||||
| 81,655 | 38,363 | 174,056 | ||||||||||||
|
|
|
|
|
|
|
|||||||||
| Operating income (loss) |
40,788 | (22,336 | ) | (28,284 | ) | |||||||||
|
|
|
|
|
|
|
|||||||||
| Other income (expense) |
||||||||||||||
| Other income (expense), net |
1,426 | 1,063 | 370 | |||||||||||
| Debt extinguishment charges |
(4,140 | ) | (14,042 | ) | — | |||||||||
| Interest expense |
(24,546 | ) | (3,991 | ) | (43,215 | ) | ||||||||
|
|
|
|
|
|
|
|||||||||
| Total other expense, net |
(27,260 | ) | (16,970 | ) | (42,845 | ) | ||||||||
|
|
|
|
|
|
|
|||||||||
| Income (loss) before income taxes |
13,528 | (39,306 | ) | (71,129 | ) | |||||||||
| Income tax (benefit) expense |
4,195 | (15,621 | ) | (19,481 | ) | |||||||||
|
|
|
|
|
|
|
|||||||||
| Net income (loss) |
9,333 | (23,685 | ) | (51,648 | ) | |||||||||
| Less: income attributable to noncontrolling interest |
— | — | 216 | |||||||||||
|
|
|
|
|
|
|
|||||||||
| Net income (loss) attributable to Company |
$ | 9,333 | $ | (23,685 | ) | $ | (51,864 | ) | ||||||
|
|
|
|
|
|
|
|||||||||
Net Sales
Our consolidated financial statements will not be directly comparable to the consolidated financial statements of the Predecessor due to the effects of the Madison Dearborn Transaction in August 2013. However, for purposes of discussion of the results of operations for net sales, we compared the net sales of the Predecessor for the fiscal year ended June 30, 2013 to the combined results, including the net sales for the Predecessor period from July 1, 2013 to August 14, 2013 and the Successor period from August 15, 2013 to June 30, 2014. We believe the comparison to combined net sales assists readers in understanding and assessing the trends and significant changes in our net sales, provides a more meaningful method of comparison and does not impact the drivers of the financial changes between the relevant periods.
The increase in net sales for the combined fiscal year ended June 30, 2014 (inclusive of both the Predecessor and Successor periods) was $308.9 million, or 53.3%, when compared to the fiscal year ended June 30, 2013. The increase is due to the previously described acquisitions, which increased net sales by $326.9 million.
67
Table of Contents
We operate our business along the following operating segments, which are grouped based on the basis of geographic region: North America, Europe and Asia. Although North America and Europe comprise substantially all of our current net sales, we have identified Asia as an operating segment given the expected growth in that region coupled with our recent acquisitions. Net sales by geographic segment, as further broken down by end market, is summarized as follows:
| Fiscal year ended June 30, 2014 | ||||||||||||||
| Predecessor | Successor | |||||||||||||
| Net Sales by Geographic Segment (Dollars in thousands) |
Fiscal year ended June 30, 2013 |
Period from July 1, 2013 to August 14, 2013 |
Period from August 15, 2013 to June 30, 2014 |
|||||||||||
| North America |
||||||||||||||
| Healthcare |
$ | 190,669 | $ | 20,837 | $ | 181,255 | ||||||||
| Consumer |
133,926 | 14,071 | 158,627 | |||||||||||
| Multi-media |
155,455 | 23,820 | 112,149 | |||||||||||
|
|
|
|
|
|
|
|||||||||
| 480,050 | 58,728 | 452,031 | ||||||||||||
| Europe |
||||||||||||||
| Healthcare |
731 | 92 | 140,977 | |||||||||||
| Consumer |
86,975 | 12,023 | 209,268 | |||||||||||
| Multi-media |
11,645 | 3,238 | 4,151 | |||||||||||
|
|
|
|
|
|
|
|||||||||
| 99,351 | 15,353 | 354,396 | ||||||||||||
| Asia |
||||||||||||||
| Healthcare |
— | — | 7,786 | |||||||||||
|
|
|
|
|
|
|
|||||||||
| Total |
$ | 579,401 | $ | 74,081 | $ | 814,213 | ||||||||
|
|
|
|
|
|
|
|||||||||
North America
The increase in North American net sales for the combined fiscal year ended June 30, 2014 (inclusive of both the Predecessor and Successor periods) was $30.7 million, or 6.4%, when compared to the fiscal year ended June 30, 2013. The increase is due to the acquisitions described above.
The increase in North American healthcare net sales for the combined fiscal year ended June 30, 2014 (inclusive of both the Predecessor and Successor periods) was $11.4 million, or 6.0%, when compared to the fiscal year ended June 30, 2013. The increase in North American consumer net sales for the combined fiscal year ended June 30, 2014 (inclusive of both the Predecessor and Successor periods) was $38.8 million, or 29.0%, when compared to the fiscal year ended June 30, 2013. North American healthcare and consumer net sales primarily increased due to our acquisition of Chesapeake, which included customers that sell (i) healthcare-related products and prescription drugs and (ii) consumer products such as confectionary, spirits and cosmetics. North American consumer net sales are also higher due to the acquisition of Jet and IPS, both of which serve the transaction card consumer market.
The decrease in North American multi-media net sales for the combined fiscal year ended June 30, 2014 (inclusive of both the Predecessor and Successor periods) was $19.5 million, or 12.5%, when compared to the fiscal year ended June 30, 2013. Our net sales in the multi-media end market are declining due to the change in delivery systems towards digital delivery via downloads or online and pay-per-view systems, and is reflective of the overall trend in multi-media end market.
68
Table of Contents
Europe
The increase in European net sales for the combined fiscal year ended June 30, 2014 (inclusive of both the Predecessor and Successor periods) was $270.4 million, or 272.2%, when compared to the fiscal year ended June 30, 2013. This is principally due to the acquisition of Chesapeake.
The increase in European healthcare net sales for the combined fiscal year ended June 30, 2014 (inclusive of both the Predecessor and Successor periods) was $140.3 million, a significant increase when compared to the fiscal year ended June 30, 2013. The increase in European consumer net sales for the combined fiscal year ended June 30, 2014 (inclusive of both the Predecessor and Successor periods) was $134.3 million, or 154.4%, when compared to the fiscal year ended June 30, 2013. European healthcare and consumer net sales primarily increased due to our acquisition of Chesapeake, which included customers that sell (i) healthcare-related products and prescription drugs and (ii) consumer products such as confectionary, spirits and cosmetics. The decrease in European multi-media net sales for the combined fiscal year ended June 30, 2014 (inclusive of both the Predecessor and Successor periods) was $4.3 million, or 36.5%, when compared to the fiscal year ended June 30, 2013. As discussed above, our sales in the multi-media end market are declining due to the change in delivery systems towards digital delivery via downloads or online and pay-per-view systems.
Asia
The increase in Asian net sales for the combined fiscal year ended June 30, 2014 (inclusive of both the Predecessor and Successor periods) was $7.8 million when compared to the fiscal year ended June 30, 2013. The increase was exclusively due to the healthcare end market in connection with recent acquisitions.
Cost of Sales/Gross Margin
| Fiscal year ended June 30, 2014 | ||||||||||||||
| Predecessor | Successor | |||||||||||||
| (Dollars in thousands) | Fiscal year ended June 30, 2013 |
Period from July 1, 2013 to August 14, 2013 |
Period from August 15, 2013 to June 30, 2014 |
|||||||||||
| Net Sales |
$ | 579,401 | $ | 74,081 | $ | 814,213 | ||||||||
| Cost of Sales |
456,958 | 58,054 | 668,441 | |||||||||||
|
|
|
|
|
|
|
|||||||||
| Gross Margin |
$ | 122,443 | $ | 16,027 | $ | 145,772 | ||||||||
|
|
|
|
|
|
|
|||||||||
| Gross Margin % |
21.1 | % | 21.6 | % | 17.9 | % | ||||||||
|
|
|
|
|
|
|
|||||||||
The gross margin percentage for the Predecessor period from July 1, 2013 to August 14, 2013 increased 50 basis points when compared to the gross margin percentage for the fiscal year end June 30, 2013. This is principally due to the favorable impact of capital investments and lean manufacturing programs. The gross margin percentage for the Successor period from August 15, 2013 to June 30, 2014 is lower than the gross margin percentage for the previous periods presented primarily due to the increased depreciation and amortization of the inventory step-up resulting from fair value adjustments in connection with the acquisitions discussed above.
Selling, General and Administrative Expenses
Selling, general and administrative expenses as a percentage of net sales for the Predecessor year ended June 30, 2013 of 13.2% is consistent with 13.1% for the Predecessor period from July 1, 2013 to August 14, 2013. Selling, general and administrative expenses as a percentage of net sales for the Successor period from August 15, 2013 to June 30, 2014 is 16.6%. The increase in the Successor period from August 15, 2013 to June 30, 2014 as compared to previous periods is primarily due to the amortization of intangible assets recorded in connection with the acquisitions.
69
Table of Contents
Management fees in the Predecessor periods presented are associated with fees paid for management services provided by the prior sponsor and related board expenses. There are no management fees in the Successor period, as the current sponsors do not charge a management fee.
Transaction expenses for the periods presented are directly related to the acquisition and merger activity discussed above, and comprise primarily of legal fees, diligence expenses and finder’s fees.
Other Income (Expense)
Other income (expense) is principally related to foreign currency transaction gains and losses.
The loss on debt extinguishment in the period from July 1, 2013 to August 14, 2013 is due to the write-off of financing costs due to the establishment of new debt facilities in connection with the Madison Dearborn Transaction.
The increase in interest expense in the Successor period from August 15, 2013 to June 30, 2014 is related to the increased debt associated with the acquisitions.
Income Taxes
Our effective income tax rate for the fiscal year ended June 30, 2013, the Predecessor period from July 1, 2013 to August 14, 2013 and the Successor period from August 15, 2013 to June 30, 2014 was 31.0%, 39.7% and 27.4%, respectively. The effective tax rate is principally impacted by permanent differences arising from transaction costs that are not deductible for tax purposes, as well as foreign tax rate differentials and losses in jurisdictions where no benefit is realized.
Operating Income/Adjusted EBITDA
| Fiscal Year ended June 30, 2014 |
||||||||||||
| Predecessor | Successor | |||||||||||
| (Dollars in thousands) | Fiscal year end June 30, 2013 |
Period from July 1, 2013 to August 14, 2013 |
Period from August 15, 2013 to June 30, 2014 |
|||||||||
| Operating Income (Loss) |
||||||||||||
| North America |
$ | 28,808 | $ | (24,524 | ) | $ | (37,181 | ) | ||||
| Europe |
11,980 | 2,188 | 8,711 | |||||||||
| Asia |
— | — | 186 | |||||||||
|
|
|
|
|
|
|
|||||||
| Total Operating Income (Loss) |
$ | 40,788 | $ | (22,336 | ) | $ | (28,284 | ) | ||||
|
|
|
|
|
|
|
|||||||
| Adjusted EBITDA |
||||||||||||
| North America |
$ | 67,761 | $ | 7,390 | $ | 71,290 | ||||||
| Europe |
18,914 | 3,081 | 46,816 | |||||||||
| Asia |
— | — | 684 | |||||||||
|
|
|
|
|
|
|
|||||||
| Total Adjusted EBITDA |
$ | 86,675 | $ | 10,471 | $ | 118,790 | ||||||
|
|
|
|
|
|
|
|||||||
North America
North American operating income (loss) was $28.8 million, $(24.5) million and $(37.2) million for the year ended June 30, 2013, the period from July 1, 2013 to August 14, 2013 and the period from August 15, 2013 to June 30, 2014, respectively. The decrease was due primarily to an increase in transaction-related expenses for the
70
Table of Contents
period from July 1, 2013 to August 14, 2013 and the period from August 15, 2013 to June 30, 2014 as compared to the year ended June 30, 2013 and the amortization of intangible assets recorded in connection with the acquisitions described above.
North American Adjusted EBITDA was $67.8 million, $7.4 million and $71.3 million for the year ended June 30, 2013, the period from July 1, 2013 to August 14, 2013 and the period from August 15, 2013 to June 30, 2014, respectively. The increase was due to the acquisitions described above.
Europe
European operating income was $12.0 million, $2.2 million and $8.7 million for the year ended June 30, 2013, the period from July 1, 2013 to August 14, 2013 and the period from August 15, 2013 to June 30, 2014, respectively. The decrease was due primarily to an increase in transaction-related expenses and the amortization of intangible assets recorded in connection with the acquisitions described above.
European Adjusted EBITDA was $18.9 million, $3.1 million and $46.8 million for the year ended June 30, 2013, the period from July 1, 2013 to August 14, 2013 and the period from August 15, 2013 to June 30, 2014, respectively. This increase was due primarily to the acquisitions described above.
Asia
Asian operating income was $0.2 million and Adjusted EBITDA was $0.7 million for the period from August 15, 2013 to June 30, 2014, which was primarily the result of the acquisition of ASG.
Liquidity and Capital Resources
Cash flow provided by (used in) operating activities, investing activities and financing activities is summarized in the following table:
| Fiscal year ended June 30, 2014 |
||||||||||||||||||
| Predecessor | Successor | |||||||||||||||||
| (Dollars in thousands) | Fiscal year ended June 30, 2013 |
Period from July 1, 2013 to August 14, 2013 |
Period from August 15, 2013 to June 30, 2014 |
Fiscal year ended June 30, 2015 |
||||||||||||||
| Cash flow provided by (used in) operating activities |
$ | 55,573 | $ | (964 | ) | $ | 19,930 | $ | 108,617 | |||||||||
| Cash flow provided by (used in) investing activities |
(21,414 | ) | (2,762 | ) | (154,208 | ) | (190,104 | ) | ||||||||||
| Cash flow provided by (used in) financing activities |
(22,347 | ) | (794 | ) | 145,068 | 109,828 | ||||||||||||
Cash Flow Provided by (Used in) Operating Activities
Cash flow provided by operating activities for the year ended June 30, 2013 was $55.6 million. This is principally due to net income from the period of $9.3 million and depreciation and amortization expenses of approximately $39.6 million, deferred income taxes of approximately $4.0 million and stock compensation of approximately $2.3 million. These amounts were offset by the non-cash gain on the exchange of Series C preferred shares of $3.2 million and by net investments made in working capital.
Cash flow used in operating activities for the period from July 1, 2013 to August 14, 2013 was $1.0 million. This is principally due to a net loss from the period of $23.7 million and a deferred tax benefit of $15.4 million, offset by depreciation and amortization expenses of approximately $4.1 million, a shareholder note forgiveness of $2.8 million, the loss on extinguishment of debt of $11.6 million and by net reductions in working capital.
71
Table of Contents
Cash flow provided by operating activities for the period from August 15, 2013 to June 30, 2014 was $19.9 million. This is principally due to a net loss for the period of $51.6 million and a deferred tax benefit of $24.6 million, offset by depreciation and amortization of $75.9 million and net reductions of working capital.
Cash flow provided by operating activities for the fiscal year ended June 30, 2015 was $108.6 million. This is principally due to net income of $7.0 million and depreciation and amortization expenses of $136.2 million, offset by net investments in working capital.
Cash Flow Provided by (Used in) Investing Activities
Cash flow used in investing activities for the year ended June 30, 2013 was $21.4 million. This is principally due to investments to property, plant and equipment of $22.4 million.
Cash flow used in investing activities for the period from July 1, 2013 to August 14, 2013 was $2.8 million. This is principally due to investments in property, plant and equipment of $2.7 million.
Cash flow used in investing activities for the period from August 15, 2013 to June 30, 2014 was $154.2 million. This is principally due to the acquisition of businesses described above of $116.3 million and investments in property, plant and equipment of $39.9 million.
Cash flow used in investing activities for the fiscal year ended June 30, 2015 was $190.1 million. This is principally due to the acquisition of businesses described above of $137.3 million and investments in property, plant and equipment of $59.5 million.
Cash Flow Provided by (Used in) Financing Activities
Cash flow used in financing activities for the year ended June 30, 2013 was $22.3 million. This is principally due to the net effect of financings in the period of $181.4 million, debt issuance costs of $13.3 million and common and preferred stock dividends and preferred stock redemptions totaling $190.6 million.
Cash flow used in financing activities for the period from July 1, 2013 to August 14, 2014 was $0.8 million. This is principally due to the payments under our debt agreements.
Cash flow provided by financing activities for the period from August 15, 2013 to June 30, 2014 was $145.1 million. This is principally due to the issuance of common stock and proceeds from borrowings to fund acquisitions, offset by payments of short- and long-term debt and debt issuance costs.
Cash flow provided by financing activities for the fiscal year ended June 30, 2015 was $109.8 million. This is principally due to the proceeds from borrowings to fund acquisitions, offset by payments of short- and long-term debt and debt issuance costs.
Cash and Working Capital
Cash and cash equivalents were $55.7 million at June 30, 2015 as compared to $27.5 million at June 30, 2014. Cash of $36.1 million and $21.1 million is held outside of the United States at June 30, 2015 and June 30, 2014, respectively. Working capital was $207.6 million as compared to $129.6 million as of the same dates, respectively. The current ratio was 1.7 to one as compared to 1.5 to one as of the same dates respectively. The increase in working capital is principally due to working capital acquired as part of the acquisitions described above.
Debt Agreements
Our liquidity requirements are significant due to the highly leveraged nature of our company as well as our working capital requirements. At June 30, 2015, there were no borrowings under the Multi-Currency Revolving
72
Table of Contents
Facility or the Dollar Revolving Facility with total availability under the Multi-Currency Revolving Facility of £50.0 million, and availability of $49.7 million under the Dollar Revolving Facility, after giving effect to $0.3 million of outstanding letters of credit, all of which may be borrowed by us without violating any covenants under the Restated Credit Agreement or the indenture governing the Notes. As of June 30, 2015, we had $1,188.4 million in outstanding indebtedness.
Senior Secured Credit Facilities
Prior to the merger with MPS, and Chesapeake’s acquisition by Carlyle, Chesapeake entered into a senior secured credit facility agreement (the “Original Credit Agreement”) with the lenders from time to time party thereto and Barclays Bank PLC as administrative agent and collateral agent. The Original Credit Agreement provided for (i) a tranche of term loans in Pounds Sterling to in an aggregate principal amount of £145.0 million (the “Initial Sterling Term Facility”), (ii) a tranche of term loans in Euros in an aggregate principal amount of €173.0 million (the “Initial Euro Term Facility”) and (iii) a multicurrency revolving line of credit in an aggregate principal amount of £50.0 million for the making of revolving loans and the issuance of letters of credit (the “Multicurrency Revolving Facility”).
In connection with the acquisition of Chesapeake by Carlyle, the Original Credit Agreement was amended by that certain First Amendment to Credit Agreement dated as of September 27, 2013 (the “First Amendment”; the Original Credit Agreement as so amended, the “First Amended Credit Agreement”), by and among the Original Borrowers, Holdings and Barclays Bank PLC in its capacity as administrative agent. The First Amendment fixed the exchange rate for Pounds Sterling to Euros under the Initial Euro Term Facility and made certain conforming changes.
In connection with the Merger transaction, the First Amended Credit Agreement was further amended and restated by that certain Second Amendment and Waiver to Credit Agreement and First Amendment to Security Agreement dated as of December 24, 2013 (the “Second Amendment”; the First Amended Credit Agreement as so amended and restated, the “Second Amended Credit Agreement”) by and among the original borrowers, the Company, Holdings, Multi Packaging Solutions, Inc., a corporation organized under the laws of Delaware (the “MPS U.S. Borrower”) and Mustang Parent Corp., a corporation organized under the laws of Delaware (the “MPS U.S. Parent Borrower” and together with the Original Borrowers and the MPS U.S. Borrower, each a “Borrower” and collectively, the “Borrowers”), the lenders party thereto, and Barclays Bank PLC in its capacities as administrative agent and collateral agent. The Second Amendment (i) joined the MPS U.S. Borrower and the MPS U.S. Parent Borrower as borrowers under the Second Amended Credit Agreement; (ii) provided for, in addition to the credit facilities provided under the First Amended Credit Agreement, (A) a tranche of term loans in dollars available to the MPS U.S. Parent Borrower, as borrower (and, at the option of the Borrowers, an additional co-borrower), in an aggregate principal amount of $122 million (the “Dollar Tranche A Term Facility”), (B) a tranche of term loans in dollars available to the MPS U.S. Borrower and the U.K. Borrower, as co-borrowers, in an aggregate principal amount of $280 million (the “Dollar Tranche B Term Facility”), and (C) a revolving credit facility in dollars available to the MPS U.S. Borrower and the U.K. Borrower, as co-borrowers, in a principal amount of $50 million (the “Dollar Revolving Credit Facility”); (iii) converted and increased the cash-capped component of the incremental facility from £35 million to $150 million and added additional incremental capacity in an amount equal to all voluntary prepayments of Term Loans (as defined in the Second Amended Credit Agreement) (other than in the case of a refinancing through the incurrence of new debt), repurchases thereof made through Dutch Auctions (as defined in the Second Amended Credit Agreement) or voluntary prepayments of Revolving Credit Loans and Revolving Commitment Increases (as each such term is defined in the Second Amended Credit Agreement), to the extent the applicable revolving commitments are permanently reduced by the amount of such payments and other than in the case of a refinancing through the incurrence of new debt; (iv) adjusted financial definitions, covenant baskets and thresholds to compensate for the joint business needs of the MPS U.S. Borrower and the MPS U.S. Parent Borrower; and (v) made certain conforming changes.
73
Table of Contents
The Second Amended Credit Agreement was further supplemented and amended by (i) that certain Incremental Joinder Agreement and Amendment dated as of April 4, 2014 (the “Incremental Amendment”) by and among the U.K. Borrower and the MPS U.S. Borrower, each as a Borrower under the Dollar Tranche B Term Facility, the other loan parties party thereto, the lenders party thereto, and Barclays Bank PLC in its capacities as administrative agent and collateral agent and (ii) that certain Third Amendment to Credit Agreement dated as of May 9, 2014 (the “Third Amendment”; the Second Amended Credit Agreement as so supplemented and amended by the Incremental Amendment and the Third Amendment, the “Third Amended Credit Agreement”) by and among the Borrowers, Holdings, the lenders party thereto, and Barclays Bank PLC in its capacities as administrative agent and collateral agent. The Incremental Amendment effected a Term Commitment Increase (as defined in the Third Amended Credit Agreement) of $50 million to the Dollar Tranche B Term Facility. The Third Amendment changed the fiscal year of the U.K. Borrower and its subsidiaries from a December 31st fiscal year-end to a June 30th fiscal year-end and made certain conforming changes related thereto.
The Third Amended Credit Agreement was further supplemented and amended by (i) that certain Second Incremental Joinder Agreement and Amendment dated as of November 21, 2014 (the “Second Incremental Amendment”) by and among the U.K. Borrower and the MPS U.S. Borrower, each as a borrower under the Dollar Tranche C Term Facility (as defined below), the loan parties party thereto, and Barclays Bank PLC in its capacities as sole arranger and sole bookrunner for the Dollar Tranche C Term Facility, initial lender under the Dollar Tranche C Term Facility, administrative agent, and collateral agent and (ii) that certain Fourth Amendment to Credit Agreement dated as of December 16, 2014 (the “Fourth Amendment” and the Third Amended Credit Agreement as so supplemented and amended by the Second Incremental Amendment and the Fourth Amendment, the “Fourth Amended Credit Agreement”) by and among the Original Borrowers, each as a Borrower under each of the Sterling Tranche B Term Facility and the Euro Tranche B Term Facility (each as defined below), the other loan parties party thereto, Credit Suisse AG, London Branch, as sole lead arranger and sole bookrunner for the Euro Tranche B Term Facility and the Sterling Tranche B Term Facility, and in its capacity as the Initial Additional Term Lender (as defined in the Fourth Amendment), and Barclays Bank PLC, as administrative agent and collateral agent. The Second Incremental Amendment (i) added a new term facility in the aggregate principal amount of $135 million (the “Dollar Tranche C Term Facility”) to the facilities governed by the Fourth Amended Credit Agreement on substantially the same terms as the Dollar Tranche A Term Facility and the Dollar Tranche B Term Facility; (ii) applied a 1.00% prepayment premium to any voluntary prepayment of Dollar Term Loans, refinancing of Dollar Term Loans or amendment of Dollar Term Loans on or prior to the six-month anniversary of the effective date of the Second Incremental Amendment, in each case in connection with or resulting in a Dollar Term Loan Repricing Event (as defined in the Fourth Amended Credit Agreement); and (iii) made certain conforming changes. The Fourth Amendment (i) refinanced the existing Initial Sterling Term Facility with a new tranche of term loans in Pounds Sterling (the “Sterling Tranche B Term Facility”); (ii) refinanced the existing Initial Euro Term Facility with a new tranche of term loans in Euros (the “Euro Tranche B Term Facility”); and (iii) made certain conforming changes.
Each of the Dollar A Term Facility, the Dollar B Term Facility and the Dollar C Term Facility bear interest equal to, at the applicable Borrower’s option, (i) (A) the greater of (x) LIBOR (as defined in the Fourth Amended Credit Agreement) and (y) 1.00% per annum plus (B) a margin of 3.25% per annum or (ii) (A) the Base Rate (as defined in the Fourth Amended Credit Agreement) plus (B) a margin of 2.25%. The Sterling Tranche B Term Facility bears interest at (i) (A) the greater of (x) LIBOR and (y) 1.00% per annum plus (B) a margin of 4.50% per annum. The Euro Tranche B Term Facility bears interest at (i) (A) the greater of (x) EURIBOR and (y) 1.00% per annum plus (B) a margin of 3.75% per annum.
The Multicurrency Revolving Facility bears interest equal to (i) (A) in the case of a Multicurrency Revolving Credit Loan (as defined in the Fourth Amended Credit Agreement) denominated in an Agreed Currency (as defined in the Fourth Amended Credit Agreement) other than Dollars, Pounds Sterling or Euros, LIBOR, or (B) in the case of a Multicurrency Revolving Credit Loan denominated in Dollars, Pounds Sterling or Euros, the greater of (x) LIBOR and (y) 1.00% per annum, plus (C) in either case, a margin equal to (x) if the First Lien Net Leverage Ratio as calculated on the most recent Compliance Certificate (as defined in the Fourth Amended
74
Table of Contents
Credit Agreement) is less than 3.50:1.00, 3.75% or (y) if the First Lien Net Leverage Ratio as calculated on the most recent Compliance Certificate is equal to or greater than 3.50:1.00, 4.00%. In the case of Multicurrency Revolving Credit Loans denominated in Dollars, the applicable Borrower may elect an interest rate equal to (i) the Base Rate plus (ii) a margin of 2.25%. We are also required to pay an unused commitment fee in Pounds Sterling at the rate of 40% of the applicable margin (as in effect from time to time) with respect to the Multicurrency Revolving Facility.
The Dollar Revolving Credit Facility bears interest equal to, at the applicable Borrower’s option, (i) (A) the greater of (x) LIBOR and (y) 1.00% per annum, plus (B) (i) if the First Lien Net Leverage Ratio as calculated on the most recent Compliance Certificate is equal to or less than 3.00:1.00, a margin of 3.00% or (ii) if the First Lien Net Leverage Ratio as calculated on the most recent Compliance Certificate is greater than 3.00:1.00, a margin of 3.25% or (ii) (A) the Base Rate plus (B) (i) if the First Lien Net Leverage Ratio as calculated on the most recent Compliance Certificate is equal to or less than 3.00:1.00, a margin of 2.00% or (ii) if the First Lien Net Leverage Ratio as calculated on the most recent Compliance Certificate is greater than 3.00:1.00, a margin of 2.25%. We are also required to pay an unused commitment fee in Dollars with respect to the Dollar Revolving Credit Facility of (i) if the First Lien Net Leverage Ratio as calculated on the most recent Compliance Certificate is less than 3.00:1.00, a rate of 0.375% or (ii) if the First Lien Net Leverage Ratio as calculated on the most recent Compliance Certificate is greater than or equal to 3.00:1.00, a rate of 0.500%.
The Fourth Amended Credit Agreement requires us to comply with certain affirmative and negative covenants, including a financial covenant which requires that, at the end of each fiscal quarter, for so long as the aggregate Revolving Credit Exposure (as defined in the Fourth Amended Credit Agreement) exceeds 25% of the Revolving Credit Commitments (as defined in the Fourth Amended Credit Agreement) (excluding any L/C Obligations to the extent Cash Collateralized (as each such term is defined in the Fourth Amended Credit Agreement)), the First Lien Net Leverage Ratio cannot exceed (A) 6.00:1.00 for the first three fiscal quarters of 2014; (B) 5.75:1.00 for the last fiscal quarter of 2014 and the first three fiscal quarters of 2015 and (C) 5.50:1.00 for the last fiscal quarter of 2015 and thereafter. As of June 30, 2014 and June 30, 2015, we were in compliance with all such covenants. All obligations under the Term Loans and Revolving Facility are guaranteed and collateralized by substantially all our tangible and intangible assets.
Costs of $5.6 million related to the issuance of the senior secured credit facilities are recorded within “Deferred financing costs, net” and are being amortized as interest expense over the life of the senior secured credit facilities. At June 30, 2015, the remaining unamortized balance of such costs was $4.3 million. Original issue discount of $22.1 million related to the senior secured credit facilities is recorded as a reduction of the principal amount of the borrowings and is amortized as interest expense over the life of the senior secured credit facilities. At June 30, 2015, the remaining unamortized original issue discount was $17.4 million.
Bonds Payable
On August 15, 2013, the MPS U.S. Borrower (the “Issuer”) issued $200.0 million in aggregate principal amount of 8.500% senior unsecured notes due 2021 and related guarantees thereof. The Notes bear interest at 8.500% payable semi-annually on February 15 and August 15. Costs of $0.3 million related to the issuance of the Notes are recorded as “Deferred financing costs, net” and are amortized as interest expense over the life of the Notes. At June 30, 2015, the remaining unamortized balance of such costs was $0.2 million. Original issue discount of $4.8 million related to the Notes is recorded as a reduction of the principal amount of the borrowings and is amortized as interest expense over the life of the Notes. At June 30, 2015, the remaining unamortized original issue discount was $3.7 million.
The Notes are guaranteed on a senior basis by certain of the Issuer’s affiliates. The indenture governing the Notes contains covenants that restrict the ability of the Issuer and certain affiliates of the Issuer to, among other things, incur additional debt, make certain payments including payment of dividends or repurchases of equity interest of the Issuer, make loans or acquisitions or capital contributions and certain investments, incur certain liens, sell assets, merge or consolidate or liquidate other entities and enter into transactions with affiliates.
75
Table of Contents
On or after August 15, 2016, we have the option to redeem all or part of the Notes at the redemption prices set forth below (expressed as percentages of principal amount) during the twelve-month period beginning on August 15 of each of the years indicated below:
| Year |
Percentage | |||
| 2016 |
106.375 | % | ||
| 2017 |
104.250 | % | ||
| 2018 |
102.125 | % | ||
| 2019 and thereafter |
100.000 | % | ||
Notwithstanding the foregoing, at any time and from time to time prior to August 15, 2016, we may at our option redeem in the aggregate up to 40% of the original aggregate principal amount of the Notes with the net cash proceeds of one or more Equity Offerings (as defined in the indenture governing the Notes), at a redemption price of 108.500% plus accrued and unpaid interest, if any, to the redemption date. Upon the occurrence of certain events constituting a change of control, holders of the Notes have the right to require us to repurchase all or any part of the Notes at a purchase price equal to 101% of the principal amount plus accrued and unpaid interest, if any, to the repurchase date.
The indebtedness evidenced by the Notes is senior unsecured indebtedness of the Issuer, is senior in right of payment to all future subordinated indebtedness of the Issuer and is equal in right of payment to all existing and future senior indebtedness of the Issuer. The Notes are effectively subordinated to any secured indebtedness of the Issuer (including indebtedness of the Issuer outstanding under the senior secured credit facilities) to the extent of the value of the assets securing such indebtedness.
Short-Term Foreign Borrowings
We finance the working capital needs of certain foreign operations using short-term borrowing arrangements in various currencies. At June 30, 2015, there were borrowings outstanding under these arrangements and additional borrowing capacity of $3.5 million and $6.7 million, respectively. The weighted average interest rate on these arrangements was 6.0% and 5.7%, at June 30, 2015 and June 30, 2014, respectively. The short-term foreign borrowing arrangements are secured by land and buildings with a carrying value totaling $12.5 million at June 30, 2015.
Foreign Debt
Our foreign debt bears interest at rates ranging from 2.15% to 5.35%, with varying maturities through 2021. At June 30, 2015 and June 30, 2014, the weighted-average interest rates on these foreign debt instruments were approximately 3.4% and 3.8%, respectively. The foreign debt instruments are generally issued in support of specific capital expenditures and are secured by the underlying value of these assets. The carrying value of these secured assets approximates $18.6 million at June 30, 2015.
The weighted average interest rate across all debt obligations at June 30, 2015 was 5.37%.
76
Table of Contents
Contractual Obligations
The following table summarizes our contractual obligations at June 30, 2015:
| (Dollars in thousands) | Total | Less than 1 year |
1-3 years | 3-5 years | More than 5 years |
|||||||||||||||
| Debt obligations—Term Loans(1) |
$ | 1,224,410 | $ | 56,207 | $ | 110,352 | $ | 108,485 | $ | 949,366 | ||||||||||
| Debt obligations—Notes(1) |
304,888 | 17,000 | 34,000 | 34,000 | 219,888 | |||||||||||||||
| Debt obligations—Other(2) |
11,689 | 7,046 | 3,196 | 1,347 | 100 | |||||||||||||||
| Debt obligations—Capital leases(1) |
2,277 | 1,214 | 1,052 | 11 | — | |||||||||||||||
| Pension Obligations |
19,795 | 10,789 | 7,876 | 1,130 | — | |||||||||||||||
| Multi-employer pension obligations |
11,448 | 918 | 1,836 | 1,836 | 6,858 | |||||||||||||||
| Operating lease obligations |
54,388 | 13,399 | 17,967 | 9,401 | 13,621 | |||||||||||||||
|
|
|
|
|
|
|
|
|
|
|
|||||||||||
| Total |
$ | 1,628,895 | $ | 106,573 | $ | 176,279 | $ | 156,210 | $ | 1,189,833 | ||||||||||
|
|
|
|
|
|
|
|
|
|
|
|||||||||||
(1) Includes principal and interest payments on our debt. Estimated future payments on outstanding debt obligations are based on interest rates as of June 30, 2015. Actual cash flows may differ significantly due to changes in underlying estimates.
(2) Consists of short-term foreign borrowings and foreign debt discussed above.
The table above does not give effect to the approximately $1.2 million payment related to German real estate transfer taxes that will be incurred in connection with the Reorg Transactions. See “Basis of Presentation and Other Information—Multi Packaging Solutions International Limited.”
Off-Balance Sheet Arrangements
In connection with the June 2011 purchase of CD Cartondruck AG (“Cartondruck”), we have a potential earnout obligation based on the future performance of Cartondruck. The earnout ranges from $0 to $3.5 million based on cumulative earnings before interest, taxes, depreciation and amortization (“EBITDA” as defined in the Cartondruck share purchase agreement) achieved over a five-year period. As of June 30, 2015 and June 30, 2014 and 2013, we concluded the earnout was not probable of achievement and, therefore, no amount has been recognized to date.
Significant Accounting Policies and Critical Accounting Estimates
Accounts Receivable and Allowance for Doubtful Accounts
Accounts receivable are presented net of an allowance for doubtful accounts of $2.9 million and $2.7 million as of June 30, 2015 and June 30, 2014, respectively. The allowance for doubtful accounts reduces receivables to amounts that are expected to be collected. In estimating the allowance, management considers factors such as current overall and industry-specific economic conditions, statutory requirements, historical and anticipated customer performance, historical experience with write-offs and the level of past-due amounts. Changes in these conditions may result in additional allowances. After all attempts to collect a receivable have failed, the receivable is written off against the allowance.
Inventories
Inventories are stated at the lower of cost or market value. Inventory costs include materials, labor and manufacturing overhead. Cost is determined by the first-in, first-out method. Obsolete inventory is identified based on an analysis of inventory for known obsolescence issues and a write-down or write-off is provided based on this analysis.
77
Table of Contents
Property, Plant and Equipment
Property, plant and equipment was adjusted to fair value on August 15, 2013, which represents a new cost basis. Expenditures for maintenance and repairs are charged to current operations; while major improvements that materially extend useful lives are capitalized. Depreciation is computed over the estimated useful lives of the assets using the straight-line method as follows:
| Buildings and improvements |
3-40 years | |
| Machinery and equipment |
3-13 years | |
| Furniture and fixtures |
3-7 years |
Depreciation expense was $78.0 million, $41.8 million and $2.8 million for the year ended June 30, 2015, the Successor period ended June 30, 2014 and the Predecessor period ended August 14, 2013, respectively.
Goodwill and Intangible Assets
Goodwill represents the cost of acquired businesses in excess of the fair value of the assets acquired and liabilities assumed of such businesses at the acquisition date. Goodwill is not amortized, but is subject to impairment tests. We review the carrying amounts of goodwill by reporting unit at least annually on April 1 (the annual assessment date), or more frequently when indicators of impairment are present, to determine if goodwill may be impaired. We may first assess qualitative factors to determine whether it is more likely than not that the fair value of goodwill is less than its carrying value. We would not be required to quantitatively determine the fair value of goodwill unless the we determine, based on the qualitative assessment, that it is more likely than not that its fair value is less than the carrying value.
If we determine that the fair value is less than the carrying value based on the qualitative assessment, a quantitative assessment based upon discounted cash flow and market approach analyses is performed to determine the estimated fair value of the reporting units. We include assumptions about expected future operating performance as part of a discounted cash flow analysis to estimate fair value. If the carrying values of goodwill is not recoverable, based on the discounted cash flow analysis, management performs the next step, which compares the fair value of the reporting unit to the carrying value of the tangible and intangible net assets of the reporting units. Goodwill is considered impaired if the recorded fair value of the tangible and intangible net assets exceeds the fair value of the reporting unit.
We did not recognize any impairment charges for goodwill during any of the periods presented, as our annual impairment testing indicated that all reporting unit goodwill fair values exceeded their respective carrying values.
Intangible assets have been acquired through various business acquisitions and include customer relationships, developed technology, licensing agreements, and a photo library. The intangible assets are initially valued at their acquisition date using either a discounted cash flow model or relief from royalty method. The relief of royalty method is used for developed technology and licensing agreement and assumes that if the acquired company did not own the intangible asset or intellectual property, it would be willing to pay a royalty for its use. The benefit of ownership of the intellectual property is valued as the relief from the royalty expense that would otherwise be incurred. Intangible assets are amortized on a straight-line basis, except for customer relationship intangibles that are amortized on an accelerated basis. Useful lives vary by asset type and are determined based on the period over which the intangible asset is expected to contribute directly or indirectly to the company’s future cash flows.
Impairment of Long-Lived Assets
We review our definite-lived long-lived assets for impairment whenever events or changes in circumstances indicate that carrying amount of the asset may not be recoverable. Such circumstances could include, but are not limited to (1) a significant decrease in the market value of an asset, (2) a significant adverse change in the extent
78
Table of Contents
or manner in which an asset is used, or (3) an accumulation of costs significantly in excess of the amount originally expected for the acquisition of an asset. We measure the carrying amount of the asset against the estimated undiscounted future cash flows associated with it. Should the carrying value of the asset being evaluated exceed the estimated undiscounted future cash flows , an impairment loss would be indicated, at which point recognition of the impairment would occur based on a determination of the asset’s fair value. There was no impairment with respect to our definite-lived long-lived assets for any periods presented.
Derivative Instruments
We use derivative instruments to manage our exposure to certain risks relating to its ongoing business operations. We have not elected hedge accounting for these derivative instruments, and accordingly are valued at fair value with unrealized gains or losses reported in earnings during the period of the change. No derivative instruments are entered into for speculative purposes.
One risk we manage using derivative instruments is interest rate risk. To manage interest rate exposure, we enter into hedge transactions (interest rate swaps) using derivative financial instruments. The objective of entering into interest rate swaps is to eliminate the variability of cash flows in the LIBOR interest payments associated with variable-rate loans over the life of the loans. As changes in interest rates affect the future cash flow of interest payments, the hedges provide a synthetic offset to interest rate movements.
We are also exposed to foreign-currency exchange-rate fluctuations in the normal course of business, primarily related to Pounds Sterling, Euros, Mexican Peso, Canadian Dollar and the Polish Zloty denominated assets and liabilities within its international subsidiaries whose functional currency is other than the U.S. dollar. We manage these fluctuations, in part, using non-deliverable forward foreign exchange contracts and foreign currency forward contracts, that are intended to offset changes in cash flow attributable to currency exchange movements. These contracts are intended primarily to economically address exposure merchandise inventory expenditures made by our international subsidiaries whose functional currency is other than the U.S. dollar.
Revenue Recognition
We produce packaging products, principally cartons, labels, inserts and rigid packaging for sale to manufacturers of branded and private label consumer goods, pharmaceutical, medical and multi-media products. Products are printed on board, paper or plastic substrates and converted via printing presses and oftentimes subsequently finished in a folding or gluing or other operation. We record revenue on the sales of products manufactured when title to the product transfers, which is generally at the time of shipment to the customer.
In all of the above cases, revenue is recorded only when (i) persuasive evidence of an arrangement exists, (ii) delivery has occurred, (iii) the fee is fixed and determinable and (iv) collectability of the sales is reasonably assured. Provisions for discounts and rebates to customers, estimated returns and allowances and other adjustments are provided for in the same period the related sales are recorded when they are determined to be probable and estimable.
Equity-Based Compensation
Mustang Investment Holdings L.P. (“Holdings”), a parent of the Successor, has an equity incentive plan for certain directors, officers and employees. The plan allows for the grant of profits interests and restricted capital interests in Holdings, an equity method investee entity, to certain directors, officers and employees. All the awards under the equity incentive plan are remeasured to their estimated fair value quarterly similar to liability awards as the awards are held in the equity interests of an equity method investee company. The profits interest awards include service- and performance-based awards, while the capital interest awards are all service-based. The profits interests and restricted capital interests granted under the plan are expected to remain outstanding following our contemplated initial public offering.
79
Table of Contents
We use the Black-Scholes option pricing model to measure the fair value of profits interest and restricted capital interest awards. We chose the Black-Scholes model based on our experience with the model and the determination that the model could be used to provide a reasonable estimate of the fair value of awards with terms such as those issued by us. Option-pricing models require estimates of a number of key valuation inputs including: fair value of the underlying common stock, expected volatility, expected dividend yield, expected term and risk-free interest rate. Certain of these inputs are subjective since the Company is privately-held and does not have objective historical or public market value information. The most subjective inputs are the expected term, expected volatility and determination of equity value. The expected term is determined using probability weighted expectations and expected volatility is determined using a selected group of guideline companies which are comparable to the Company.
We utilize and equally weigh three widely recognized valuation models to estimate the fair value of Holdings equity:
| • | Discounted Cash Flow Analysis (Income Model) — The discounted cash flow analysis is dependent on a number of significant management assumptions regarding the expected future financial results of us and Holdings as well as upon estimates of an appropriate cost of capital. |
| • | Guideline Public Companies (Market Model) — Multiples of historical and projected EBITDA determined based on guideline public companies are applied to estimate the fair value for the equity of Holdings. |
| • | Mergers and Acquisition (Market Model) — Multiples of historical equity value divided by last twelve months revenues, and equity value by last twelve months, EBITDA for mergers and acquisitions of companies in the same industry. |
As an input to the Black-Scholes model, and for valuation of the profits interest and restricted capital interest awards, we estimate the fair value of Holdings equity quarterly. After considering all of these estimates of fair value, we then determine a single estimated fair value of the equity of Holdings to be used in the Black-Scholes model to determine the fair value of the profit interest and restricted capital interest awards and equity-based compensation expense.
As of June 30, 2015, service- and performance-based equity awards were outstanding under the equity incentive plan. Service-based profits interests vest in equal installments on each of the first five anniversaries of August 15, 2013, and compensation expense is recorded ratably over the vesting period. Performance-based profit interests only result in compensation expense when it is probable that the performance condition will be achieved. No performance criteria are currently expected to be achieved, and as result we have not recognized any compensation expense related to the performance-based profits interests through June 30, 2015.
As of June 30, 2015, restricted capital interests were outstanding under the stock incentive plan. The restricted capital interests vest ratably in equal installments on each of the first five anniversaries of August 15, 2013 and compensation expense is recognized ratable over the vesting period.
In connection with Carlyle’s acquisition of Chesapeake, certain members of Chesapeake’s management were allowed to co-invest with Carlyle in an entity controlled by Carlyle that holds an investment in the Company. At the time of the grant, those members of management that invested alongside Carlyle received a specified number of ordinary shares, which were subject to a performance-based ratchet (the “Ratchet”). Pursuant to the Ratchet, members of management’s ownership percentage can increase based on Chesapeake completing an “Exit” that results in a specified return on invested capital (“MOIC”) and internal rate of return (“IRR”) for certain investors. An Exit is defined as the completion of a liquidating event, which includes the completion of an initial public offering (“IPO”). Since a liquidity event, including an IPO, is generally not probable until it occurs, no compensation cost has been recognized in the financial statements. Compensation cost would be recognized as of the date of the completion of our contemplated IPO, regardless of whether the specified MOIC and IRR thresholds have been achieved. The ordinary shares are expected to remain outstanding following our contemplated initial public offering.
80
Table of Contents
The assumptions used in estimating the fair value of equity-based payment awards represent management’s best estimates, but these estimates involve inherent uncertainties and the application of management judgment. As a result, if factors change and we use different assumptions, equity-based compensation expense could be different in the future.
Once our common stock becomes publicly traded, certain key valuation inputs to the Black-Scholes model, which is used to estimate the fair value of equity-based compensation, will be based on publicly available information. These key valuation inputs include the fair value of the common stock, and once there is a sufficient trading history, the volatility is expected to be derived from the historical trading activity of the common stock.
Refer to Note 20 “Equity-Based Compensation” to the audited consolidated financial statements of MPS Holdings included elsewhere in this prospectus for details regarding our equity-based compensation plan.
Income Taxes
We recognize income taxes in accordance with guidance established by U.S. GAAP, which requires an asset and liability approach for financial accounting and reporting for income taxes and establishes a minimum threshold for financial statement recognition of the benefit of tax positions, and requires certain expanded disclosures. The provision for income taxes is based upon income or loss after adjustment for those items that are not considered in the determination of taxable income.
Deferred income taxes represent the tax effects of differences between the financial reporting and tax bases of our assets and liabilities at the enacted tax rates in effect for the years in which the differences are expected to reverse. We evaluate the recoverability of deferred tax assets and establishes a valuation allowance when it is more likely than not that some portion or all of the deferred tax assets will not be realized.
Quantitative and Qualitative Disclosures About Market Risk
We are exposed to changes in interest rates and foreign currency exchange rates because we finance certain operations through fixed and variable rate debt instruments and denominate our transactions in a variety of foreign currencies. We are also exposed to changes in the prices of certain commodities that we use in production. Changes in these rates and commodity prices may have an impact on future cash flow and earnings.
We manage these risks through normal operating and financing activities and, when deemed appropriate, through the use of derivative financial instruments. We do not enter into financial instruments for trading or speculative purposes.
By using derivative instruments, we are subject to credit and market risk. The fair market value of the derivative instruments is determined by using valuation models whose inputs are derived using market observable inputs, including interest rate yield curves, and reflects the asset or liability position as of the end of each reporting period. When the fair value of a derivative contract is positive, the counterparty owes us, thus creating a receivable risk for us. We are exposed to counterparty credit risk in the event of non-performance by counterparties to our derivative agreements. We minimize counterparty credit (or repayment) risk by entering into transactions with major financial institutions of investment grade credit rating.
Our exposure to market risk is not hedged in a manner that completely eliminates the effects of changing market conditions on earnings or cash flow.
Interest Rate Risk
We are subject to interest rate market risk in connection with our borrowings. A one-eighth percent change in the applicable interest rate for borrowings under the senior secured credit facilities (assuming the Revolving Credit Facilities are undrawn and the LIBOR floor has been exceeded) would have an annual impact of approximately $1.2 million on cash interest expense considering the impact of our hedging positions currently in place.
81
Table of Contents
We selectively use derivative instruments to reduce market risk associated with changes in interest rates. The use of derivatives is intended for hedging purposes only and we do not enter into derivative instruments for speculative purposes. The Company maintains two amortizing rate swaps that mature in December 2017. The swaps are being used to hedge the exposure to changes in the market LIBOR or EURIBOR rates. One of the swaps had a notional amount of $182,322, whereby the Company pays a fixed rate of interest of 1.1649% and receives a variable rate based on LIBOR on the amortizing notional amount. The swap is being used to hedge the exposure to changes in market LIBOR rates. The other swap had a notional amount of $148,360, whereby the Company pays a fixed rate of interest of 1.0139% and receives a variable rate based on EURIBOR (Euro Interbank Offered Rate) on the amortizing notional amount. The swap is being used to hedge the exposure to changes in market EUROBOR rates.
Foreign Exchange Rates Risk
We are exposed to foreign currency risk by virtue of our international operations. Our exposure to foreign exchange relates to our European, Mexican, Canadian and Chinese facilities which have Pounds Sterling, Euro, Polish Zloty, Mexican Peso, Canadian Dollar and Chinese Yuan denominated assets and liabilities, and functional currencies. In the majority of our jurisdictions, we earn net sales and incur costs in the local currency of such jurisdiction; however they are not perfectly matched. Movements in exchange rates could cause our expenses to fluctuate, impacting our future profitability and cash flows. Our future business operations and opportunities, including the continued expansion of our business outside North America, may further increase the risk that cash flows resulting from these activities may be adversely affected by changes in currency exchange rates.
Our Sterling Term Loan and Euro Term Loan are denominated in Pounds Sterling and Euros, respectively. As a result, movements in the Pounds Sterling and Euro exchange rate in relation to the U.S. dollar could cause the amount of Sterling Term Loan and Euro Term Loan borrowings to fluctuate, impacting our future profitability and cash flows.
We translate our statements of operations into U.S. dollars at exchange rates for the periods presented. During the period ended June 30, 2014, exchange rate changes did not have a material impact when translating the financial statements. In the period ended June 30, 2015, net sales were negatively impacted by exchange rate changes by approximately $77.0 million.
A hypothetical change of 10% in average exchange rates used to translate Pounds Sterling, Euro, Polish Zloty, Mexican Peso, Canadian Dollar and Chinese Yuan to U.S. dollars would have impacted operating income by approximately $9.2 million for the twelve months ended June 30, 2015.
82
Table of Contents
Major End Markets
Consumer Products Packaging End Market
The consumer products end market includes personal care, spirits, cosmetics and confectionary products. Personal care makes up one of the largest product categories in the consumer packaging end market and has some of the most demanding requirements of any consumer packaging product category for unique, value-add packaging solutions. Based on management estimates, we estimate annual sales in the addressable market for our customers’ consumer products currently exceed $8 billion and expect annual sales in this end market will grow at an average of 2% annually through 2020, with forecasts varying by product category.
Consumer packaging, particularly for the personal care product category, is characterized by an image-driven market promoted by strong brand emphasis which drives a need for a wide range of packaging. Consumer packaging, such as folding cartons and labels, are a means of promoting brand identity to customers at the point-of-purchase. Large surface areas, high-impact graphics and innovative designs and finishes generate consumer interest, attract attention and create an affinity for companies’ brands and products in the eyes of the consumer. Representative premium products in the personal care product category include cosmetics, hair care products, skin creams, lotions and fragrances.
Trends driving growth of the consumer products packaging end market include:
| • | Shortened product life cycle—Focus on new product introductions with unique packaging designs that promote brand identity and on-shelf differentiation is driving growth. In order to achieve the first-mover advantage, personal care companies rely on suppliers able to rapidly design and commercialize these new, high quality packages. |
| • | Enhanced product design and brand promotion—Personal care companies have increasing demand for packaging suppliers who are able to offer new technologies and services to promote brand identity, premium positioning and shelf appeal. This is increasingly favoring suppliers with differentiated capabilities, such as finishing technologies for iridescent, holographic, textured and dimensional effects. |
| • | Positive demographic trends and increasing health and wellness awareness—The growing and aging population sensitive about preserving a youthful image is driving a positive shift in the consumption patterns of personal care products, including products used to reverse signs of aging, such as anti-wrinkle skin creams, lotions, serums and hair colorants. People are generally tending to take better care of themselves and are willing to pay more for products with perceived benefits. |
| • | Increasing premiumization—Individuals have greater capability to purchase higher end consumer products, particularly in developing regions such as Asia and Latin America. Sophisticated packaging solutions allow for better shelf visibility and brand positioning. The propensity to use secondary packaging, such as premium rigid boxes and labeling, is higher in premium type spirits and confections, as it represents one of the principal ways to command higher price points and differentiate products. |
| • | Demand for sustainable and intelligent packaging—Increasing consumer focus on environmental issues and recyclability of materials represents an opportunity for advanced high value-add producers to further strengthen market positions. Consumers are increasingly purchasing products that are sustainable and offer recyclable packaging and many companies have embraced this trend, moving towards eco-friendly packaging materials. |
83
Table of Contents
Healthcare Packaging End Market
Healthcare packaging is used in a wide variety of applications including over-the-counter and prescription pharmaceuticals, medical devices, nutritional and dietary supplements, vitamins and minerals. We estimate annual sales in the healthcare packaging end market currently exceed $8 billion, characterized by significant technical requirements, recession-resilient demand characteristics and strong growth opportunities. Print-based packaging products, such as cartons, labels and inserts for the healthcare market, are used to provide information to consumers as well as comply with regulations. Healthcare packaging has stringent quality specifications, prerequisite manufacturing standards and evolving regulatory requirements. Packaging supplier sites are regularly audited and certified. Switching costs are high given the high value of the end product and significant cost of disruption. In addition, manufacturers are increasingly demanding more comprehensive design services, reduced delivery times, more flexibility in order size and broader geographic coverage from their packaging suppliers. Further, product innovation plays a key role in the industry as pharmaceutical manufacturers increasingly incorporate authentication features into packaging to assist in the prevention of counterfeiting.
Based on management estimates, we estimate that annual sales in the secondary packaging market for pharmaceuticals will grow by approximately 6% annually from 2014 to 2019 in North America and Western Europe, reaching approximately $5 billion and $6 billion, respectively, in 2019. This in large part will be driven by an increase in the use of security labels (e.g., anti-counterfeiting). The growth in the secondary packaging market for pharmaceuticals in the United States and Europe is depicted below:
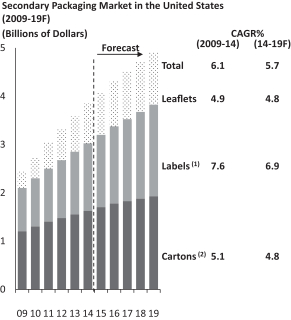
|
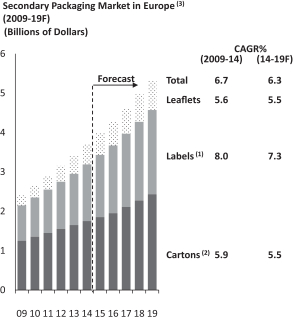
|
Source: Management estimates.
| (1) | Includes standard labels, specialty labels (leaflet labels) and security labels (track & trace). |
| (2) | Covers the following secondary carton packaging categories: folding cartons, secondary blister packaging and outer paperboard boxes. |
| (3) | Includes 31 countries and territories that include the members of the European Union and Switzerland. |
Trends driving growth of the healthcare packaging market include:
| • | Population demographics—Population growth, an increased focus on chronic diseases and the aging population have increased the market for pharmaceuticals as consumers require a growing number and diversity of prescription and over-the-counter medicines and nutritional supplements, including those that target age-related conditions and illnesses. |
84
Table of Contents
| • | Globalization and vendor rationalization—Regulatory pressures and increased product quality requirements have encouraged large multinational pharmaceutical and supplement manufacturers to focus their packaging spend on fewer suppliers that can provide consistent service and product quality on a global basis. We believe this trend favors scale players with the capability to support product launches across multiple products and geographies. We expect vendor rationalization to continue as customers seek to contain costs without sacrificing logistical flexibility and product quality. |
| • | Increasing consumer awareness regarding health and wellness—Manufacturers and marketers of nutritional and dietary supplements are continuously introducing and marketing new product offerings in order to appeal to growing consumer awareness regarding health and wellness and preventative medicine. |
| • | Growth in drug treatments and availability—The volume of pharmaceutical products available in the market has been expanding for both branded and generic drugs. The demand for generic drugs may accelerate as some branded pharmaceutical products become available in generic formulations after the expiration of patents. While our branded business is set to grow with the overall market, we also expect to benefit from the growth of generic pharmaceuticals. |
| • | Evolving regulatory standards and regulations—Regulatory standards to improve security and prevent drug counterfeiting as well as provide greater, more accessible disclosure to patients and healthcare providers create a dynamic regulatory environment that requires creative, value-added packaging solutions. For example, the blister packaging market is expected to benefit from the implementation of U.S. Food and Drug Administration regulations requiring all prescribed pharmaceuticals dispensed in hospitals and nursing homes to be packaged in unit dose formats with barcodes in order to reduce dispensing errors. Overall drug spend is also forecast to grow, given recent government legislation and regulation around the Patient Protection and Affordable Care Act. |
Multi-Media Packaging Market
Our multi-media end market net sales are focused on high quality specialty packaging, which often requires quick response, including; commemorative and special editions for home videos, recorded music, video games and software. We produce a full line of printed packaging products for leading multi-media companies including folding cartons, booklets, folders, inserts, cover sheets and slipcases, as well as highly customized, graphical and value-added packaging components. We are one of the largest producers of these products in the North American multi-media end market based on sales. We estimate the addressable market for our multi-media products to be approximately $0.3 billion of annual sales and expect this market will contract approximately 7% annually through 2020.
This market is characterized by:
| • | Digital substitution—We believe the combination of our talented sales executives with longstanding customer relationships and our product and operational excellence has allowed us to generate attractive margins and cash flow despite the decline in multi-media packaging demand. The increasing popularity of digital distribution will continue to erode the shipments of physical music, video game and home video units. See “Risk Factors—Risks Related to Our Business—The impact of electronic media and similar technological changes, including the substitution of physical products for digital content, may continue to adversely affect sales in the multi-media end market.” We believe that through our market-leading positions in the multi-media specialty packaging sector we will be able to continue to execute on profitable and opportunistic multi-media packaging business. Moreover, highly anticipated video game launches, such as Grand Theft Auto, and blockbuster movie releases, such as Furious 7, drive increased demand for gaming and home video, respectively, including higher value-add commemorative editions and box sets, and can generate above-average growth and profitability. |
85
Table of Contents
We are a leading, global provider of value-added specialty packaging solutions, based on sales, focused on high complexity products for the consumer, healthcare and multi-media markets. For the fiscal year ended June 30, 2015, approximately 47%, 47% and 6% of our acquisition adjusted pro forma net sales came from our North American, European and Asian operations, respectively, and approximately 87% of our acquisition adjusted pro forma global net sales were derived from our consumer and healthcare end markets. We believe that our core addressable consumer and healthcare end markets encompass attractive, resilient and growing packaging categories, and we believe we are a leader in these end markets across North America and Europe based on sales. Additionally, we believe we have a market-leading position in the multi-media specialty packaging sector based on sales, which accounts for 13% of our acquisition adjusted pro forma global net sales. We provide our customers with an extensive array of print-based specialty packaging solutions, including premium folding cartons, inserts, labels and rigid packaging across a variety of substrates and finishes, which are complemented by value-added services, including creative design, new product development and customized supply chain solutions. Based on management estimates, we believe the market opportunity across our primary addressable markets is currently in excess of $17 billion of annual sales.
We have long-term customer relationships driven by our global presence, breadth of products, value-added service offering, reputation for operational excellence, innovative packaging solutions and highly experienced management team. We serve a blue chip customer base, including some of the world’s largest companies and the leaders in our target end markets. Our global platform allows us to serve our customers, which include AstraZeneca, Coty, Diageo, Estée Lauder, GlaxoSmithKline, L’Oréal, Mondelēz International, Nestlé, Pernod Ricard, Pfizer and Sony, on both a local and global basis. Our relationships with our top 20 customers average 34 years with many of our customers operating under multi-year contracts. No one customer accounts for more than 5% of our acquisition adjusted pro forma net sales for the twelve-month period ended June 30, 2015. Servicing our customers requires us to meet stringent quality specifications, significant customer service standards and meaningful investment requirements. Our healthcare customers, for example, require exacting standards of manufacturing in order to meet their regulatory requirements, which include strict process controls, site certification, chain of custody product information and strict adherence to print requirements and print quality due to the nature of the use of the product by our customers’ end users. For our consumer customers, we are at the front end of their branding and marketing strategy, enhancing the visual impact at the shelf while also ensuring product integrity and regulatory compliance. We believe our advanced printing and finish effects and designs often help our customers position their products at the premium end of their addressable markets. In addition we provide value-added supply chain services such as VMI, specific carton-by-carton scan ability and data which enable the customer to track a product from manufacturer to end user.
We believe we are one of a few companies in the end markets we serve offering a full range of products across multiple geographies, allowing us to provide specialty packaging solutions for customers locally and globally, a capability our customers find valuable in presenting a consistent image of the underlying product. Our global manufacturing footprint consists of 59 manufacturing sites and nine sales offices across North America, Europe and Asia. Our strategically located facilities have enabled us to grow our business by leveraging our customer relationships across multiple geographies and products, and drive incremental growth through our ability to integrate and improve our customers’ supply chains. These solutions highlight our competitive difference and allow us to win new customers and strengthen our existing client relationships through cross-selling opportunities across our unique global platform, with further benefits to be realized from recent acquisitions. Additionally, our global manufacturing footprint is supported by our sales and design teams, which consist of a dedicated research and development group, more than 115 structural and graphic designers and over 230 sales personnel.
86
Table of Contents
Our History
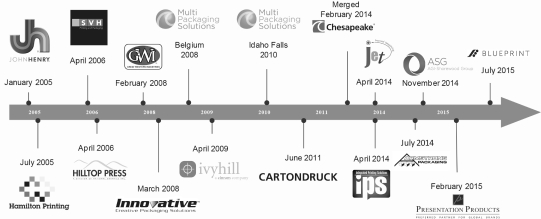
|
Since 2005, we have evolved from our initial U.S. platform of five facilities into a global specialty packaging leader, based on sales, in the consumer, healthcare and multi-media end markets. We have completed a total of 15 transactions within our addressable products and markets, with early acquisitions targeted at obtaining and building the necessary technology footprint to serve consumer and pharmaceutical companies. Later acquisitions focused on expanding that platform into complementary products and creating a global footprint capable of meeting all of our customers’ value-added packaging requirements. In 2014, we entered into a transformational merger with Chesapeake (February 2014), acquired ASG (November 2014) and completed five additional acquisitions, which expanded our global reach and diversified our product and end market profile. We have a successful track record of acquiring strategically relevant companies, establishing and realizing savings and synergy programs and integrating acquired operations and customers into our global platform. Through successful execution and integration of acquired businesses, we have expanded our geographic reach and product and service offering, which has enabled us to better serve our large multinational customers, as well as penetrate new regional and local customers in our key end markets. We have expanded the operating margins of companies we have acquired, achieving our synergy targets and leveraging our platform as evidenced by our accreting EBITDA margins subsequent to each acquisition. Specifically, we estimate that as of June 30, 2015 we have realized a total of approximately $28 million of synergies from the Chesapeake and ASG transactions, which is expected to result in an annualized run-rate as of the same date of approximately $36 million. We believe that these targeted savings and synergy programs will eventually achieve an annualized run-rate of approximately $40 million, although we cannot make any assurances that such an annualized run-rate will be achieved.
87
Table of Contents
The MPS and Chesapeake platforms are highly complementary. At the time of the merger between the two companies, MPS was predominantly focused on the personal care and generic pharmaceutical end markets within North America. Conversely, Chesapeake was focused on the branded pharmaceutical, confectionary and Scotch whisky end markets in Europe. The combination provides for significant cross-selling opportunities across our global platform.
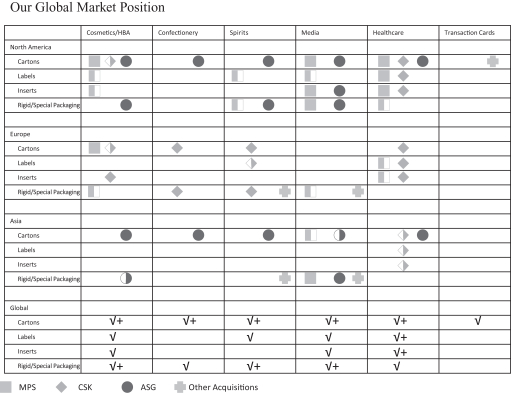
We have a consistent track record of delivering Adjusted EBITDA growth and Adjusted EBITDA margin expansion through a focus on attractive products and end markets, operational excellence and executing value accretive acquisitions. The chart below illustrates our growth in Adjusted EBITDA and related margin. The pro forma results below reflect the acquisitions we made through June 30, 2015 as if they occurred on July 1, 2013. The pro forma Adjusted EBITDA margin is lower than historical periods primarily due to the lower historical Adjusted EBITDA margin for the acquired ASG businesses and is reflective of the potential accretion opportunity available to us.
Adjusted EBITDA ($ in millions)
| Note: | Our fiscal year ends June 30th. See footnote 4 set forth in “Prospectus Summary—Summary Historical Audited Consolidated and Unaudited Pro Forma Combined Financial Information” for a reconciliation of Adjusted EBITDA to net income. |
88
Table of Contents
We have also consistently demonstrated our ability to generate strong cash flows driven by efficient investment of capital, working capital control and operational discipline throughout the Company. Our capital investment requirements have generally been in the range of 3.5 to 3.9% of net sales, achieving strong free cash flow conversion relative to our Adjusted EBITDA margin. Our free cash flow conversion (defined as Adjusted EBITDA less capital expenditures) has averaged over 70% over the last seven years.
Free Cash Flow Conversion
| Note: | Free cash flow is defined as Adjusted EBITDA less capital expenditures. Free cash flow conversion is defined as free cash flow divided by Adjusted EBITDA. See footnote 4 set forth in “Prospectus Summary—Summary Historical Audited Consolidated and Unaudited Pro Forma Combined Financial Information” for a reconciliation of Adjusted EBITDA to net income. Pro forma FY 2015 is calculated using acquisition adjusted pro forma Adjusted EBITDA. |
We have integrated the sales forces around key global account managers and are launching global sales initiatives around major end markets such as confectionary, spirits, cosmetics and fragrances to take advantage of our global presence. The ASG acquisition allowed us to expand our footprint into Mexico, Canada and China and broadened our personal care capability. With respect to costs and operations, we have largely centralized procurement and are in the process of realizing savings from optimizing purchase prices between the organizations as well as consolidating our purchase volumes. We continuously benchmark our sites and work to bring lower performing sites up to the level of higher performing ones. We are also realizing efficiencies from our ongoing investments in our equipment to improve run speeds, reduce changeover times and reduce manning.
We believe that we are a leader within our addressable market on the basis of revenue and believe that we have the ability to continue to grow organically, as well as pursue prudent value accretive acquisitions to augment our product portfolio and geographic presence to better serve new and existing customers. Further, we will continue to drive operational excellence through improving our productivity and asset utilization, optimizing our industrial footprint, and investing capital efficiently. For further information, see “Management’s Discussion and Analysis of Financial Condition and Results of Operations—Key Transactions.”
Our Products
We provide our customers a comprehensive suite of innovative specialty products and services, including premium folding cartons, inserts, labels and rigid packaging. Our packaging solutions utilize a wide variety of substrates (e.g., paper and paperboard, pressure sensitive labels, plastic, foil) and finishes (e.g., UV coatings, film lamination, stamping, embossing). We also employ an array of value-add decorative technologies to create iridescent, holographic, textured and dimensional effects to provide differentiated specialty packaging products to our customers. Our comprehensive solutions, which often include combination or bundled products, and a technologically advanced asset base allow us to win new customers and strengthen our existing client relationships through cross-selling opportunities across our unique global platform.
Premium Folding Cartons (Fiscal Year 2015 Acquisition Adjusted Pro Forma Net Sales of $1,138 million, or 62% of Total)
Premium folding cartons are widely used, versatile forms of secondary packaging that our customers utilize to attract consumer attention at the point-of-sale and provide critical product information to end users. Our folding carton offering is targeted at the premium end of the market, utilizes high quality inputs such as solid bleached
89
Table of Contents
sulfate, and is manufactured with various features and finishes, including lamination, embossing, foil stamping and windowing. Rigid packaging serves a functional purpose by providing protection to the product throughout the shipping, distribution and merchandising processes.
Our premium folding cartons offering plays an important role in our customers’ branding and marketing strategies through influencing purchase decisions at the point-of-sale by conveying an exceptional appearance, shelf presence and impact through the use of specialty graphics, a variety of printed finishes and other creative designs. Additionally, our premium folding cartons offering must adhere to stringent regulatory requirements by playing a key role in our customers’ product safety as well as ensuring product authenticity, accurate product information and product compliance to the end customer. Our premium folding carton customers oftentimes purchase associated labels and inserts. Leveraging cross-selling opportunities is a key strategic initiative of recent acquisitions that we have completed.
Inserts (Fiscal Year 2015 Acquisition Adjusted Pro Forma Net Sales of $260 million, or 14% of Total)
We provide inserts for all the end markets we serve, with the majority of our net sales in this category being to the healthcare end market. Inserts are of particular importance in the healthcare end market given stringent regulations to ensure the accuracy of product information, although they are also used in non-healthcare markets in which product literature is required to be presented to the end user. Inserts are included either inside a secondary package (e.g., folding carton) or affixed to the outside of a primary package (e.g., bottle). Numerous regulatory bodies, such as the U.S. Food and Drug Administration, the U.S. Department of Agriculture and various trade associations, require an increasing level of product information, including nutritional, performance and other related product disclosures. Providing this increasing amount of information requires larger and, in many instances, more complex inserts. Specific technical equipment is necessary to produce the folded leaflet, which requires significant upfront investment. Evolving regulations require that insert manufacturers stay abreast of new developments and maintain manufacturing equipment and process capabilities necessary to meet strict inspection and quality control standards. Product disclosure requirements change, oftentimes on short notice, due to regulatory oversight. This results in the need for quick reaction and turnaround of production. Oftentimes our ability to be an integral part of our customers’ information management systems allows us to monitor customer demand and limit their exposure to inventory obsolescence when product disclosure changes.
Labels (Fiscal Year 2015 Acquisition Adjusted Pro Forma Net Sales of $126 million, or 7% of Total)
Labels are one of the most visible and recognizable packaging components and are used in a wide variety of applications serving as the primary means of identifying products to consumers, while creating shelf appeal and brand recognition for products. Labels also function as a conduit for fulfilling regulatory requirements, communicating product-related information to consumers and contributing to product integrity and security. We supply a broad range of pressure sensitive labels, including single-panel, multi-panel, multi-ply and extended content labels, as well as cut and stack labels.
The majority of our net sales in this category are pressure sensitive labels sold primarily into the healthcare market which, like our inserts, are subject to stringent regulations to ensure the accuracy of product information. Additionally, we supply both pressure sensitive and cut and stack labels to the consumer products markets where decorative labels are utilized to differentiate products at the retail point-of-sale. We employ multiple print technologies with respect to labels, utilizing digital, flexographic and offset printing press technologies to serve our customers globally.
Rigid Packaging (Fiscal Year 2015 Acquisition Adjusted Pro Forma Net Sales of $97 million, or 5% of Total)
Rigid boxes are commonly used to present ultra-premium products and vary from rigid top load boxes for the high-end spirits market to specialized boxes for perfumes and other luxury products. We historically provided rigid box offerings, oftentimes described as top load box or set up boxes, via strategic outsource suppliers.
90
Table of Contents
Consistent with our acquisition strategy to acquire appropriate technologies, we completed two recent strategic acquisitions which added our own internal manufacturing capability for a premium rigid packaging product offering with the addition of customized/high-end rigid boxes. We have a growing presence in rigid packaging and believe this is a meaningful area for growth in the future.
Other Consumer Products Packaging (Fiscal Year 2015 Acquisition Adjusted Pro Forma Net Sales of $209 million, or 12% of Total)
We offer a number of additional printed packaging products, including transaction cards, point-of-purchase displays, brochures, product literature, marketing materials and grower tags and plant stakes for the horticultural market. These products are supplied to various niche markets that require print-based specialty packaging. Our transaction cards and card services offerings are of a particular focus. We provide our customers a comprehensive end-to-end solution for credit, debit, general prepaid reloadable, gift, loyalty, hospitality, insurance and other card-based programs. Our integrated supply chain for cards, carriers, multi-packs and point-of-purchase displays greatly simplifies the development and execution of card programs and drives competitive differentiation.
Value-Added Services
We provide a range of value-added services to our customers ranging from collaboration on the initial packaging concept to total management of the supply chain. We work closely with our customers to understand their specific requirements and thereby implement streamlined workflows starting from pre-press through to fulfillment. These valuable service capabilities complement our broad product offering and, when matched with our manufacturing operations, enable us to consistently deliver high quality products and superior service to our customers. Examples of such value-added services include creative design and new product development, for which we have a team of more than 115 structural designers and graphic designers across a number of key locations. We also provide our customers with customized supply chain solutions, including VMI programs. VMI solutions help customers manage production based on actual demand to reduce lead times, minimize inventory, eliminate waste and enhance supply chain security. Our ability to provide on-demand services for our customers via digital print technology has allowed us to reduce our lead times. Shorter lead times provide a distinct advantage in consumer and healthcare-facing industries where companies must move quickly to introduce new products and ramp-up supply in response to market trends and consumer demand. Shorter lead times also limit our customers’ exposure to inventory obsolescence. Our value-added services build entrenched partnerships with customers and allow us to become a more critical part of the supply chain by helping to improve workflow efficiencies and reduce our customers’ total cost of ownership for packaging materials.
| • | Digital Workflow: Ability to manage all of a customer’s digital assets for simplified management on a regional or global scale. These digital assets range from artwork and front-end solutions to tracking codes that account for individual items throughout the supply chain and activation codes that scan at retail. |
| • | Creative Services: Award-winning creative team with a reputation for innovation and quality, comprised of 25 structural designers and nine graphic designers who provide packaging engineering, 3-D renderings, product animation, prototyping and testing. |
| • | Pre-Press Services: Fully staffed, around-the-clock team to provide same day or next day service including full proofing capabilities, artwork enhancement and file correction. |
| • | Vendor Managed Inventory: Ability to manage production based on a customer’s actual demand provides numerous benefits, including shorter lead times, reduced physical inventory, waste reduction and increased supply chain security. |
| • | Late Stage Customization: Ability to leverage our flexible manufacturing capabilities by printing common graphics on long-run equipment and customizing products on-demand with printed labels or inserts using short-run digital equipment. A proprietary finishing system prints and applies labels and delivers finished cartons on an as needed basis. |
91
Table of Contents
| • | Co-Located Facilities: Onsite facilities management provides equipment and staffing for printing and packaging production physically located within a customer’s facility. On-demand packaging capabilities provide numerous customer benefits, including lower inventory levels, reduced obsolescence and cycle time reductions. |
| • | Brand Protection / E-Pedigree: We provide brand security through the application of various technologies, including magnetic inks, invisible bar codes and holographic cold foil, to help ensure the traceability and authenticity of our customers’ products. |
| • | Environmental Solutions: We have made substantial investments in sustainability and environmentally-friendly products, technologies and manufacturing processes to meet the environmental objectives of our customers. |
Our End Markets
Consumer (50% of Fiscal Year 2015 Acquisition Adjusted Pro Forma Net Sales)
We produce a full line of specialty print-based packaging products for a wide range of customers in the personal care, spirits, cosmetics and confectionary markets. We focus on the premium end of the market where high-impact graphics, and innovative designs and finishes attract attention and help brands drive “top-of-mind” positioning with consumers at the point-of-purchase. Our scale and financial resources have enabled us to build out a leading global design division which has been at the forefront of our product innovation capabilities. Multinational customers have also increasingly centralized their procurement functions seeking fewer, more strategic partners capable of meeting their consumer packaging needs and consistent marketing image across a range of products, services and geographies. We are well-positioned to benefit from this trend in vendor rationalization by leveraging our ability to deliver a broad range of local solutions while simultaneously providing global coverage to our multinational customers.
| Acquisition Adjusted Pro Forma Net Sales Within Consumer End Market | Net Sales to Consumer End Market | |
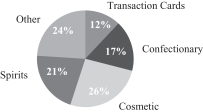
|
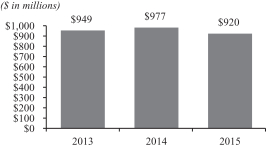
| |
Note: 2014 presented on a combined basis. 2015 presented on an acquisition adjusted pro forma basis. Fiscal years ended on June 30.
Growth in this market is driven by:
| • | Shortened product life cycle—Focus on new product introductions with unique packaging designs that promote brand identity and on-shelf differentiation in order to drive growth. In order to achieve the first-mover advantage, personal care companies rely on suppliers able to rapidly design and commercialize these new, high quality packages. |
| • | Enhanced product design and brand promotion—Personal care companies have increasing demand for packaging suppliers who are able to offer new technologies and services to promote brand identity, premium positioning and shelf appeal. This trend increasingly favors suppliers with differentiated capabilities, such as finishing technologies for iridescent, holographic, textured and dimensional effects. |
92
Table of Contents
| • | Positive demographic trends and increasing health and wellness awareness—The growing and aging population sensitive about preserving a youthful image is driving a positive shift in the consumption patterns of personal care products, including products used to reverse signs of aging, such as anti-wrinkle skin creams, lotions, serums and hair colorants. People are generally tending to take better care of themselves and are willing to pay more for products with perceived benefits. |
| • | Increasing disposable premiumization—Individuals have greater capability to purchase higher end consumer products, particularly in developing regions such as Asia and Latin America. Sophisticated packaging solutions allow for better shelf visibility and brand positioning. The propensity to use secondary packaging, such as premium rigid boxes and labeling, is higher in premium type spirits and confections, as it represents one of the principal ways to command higher price points and differentiate products. |
| • | Demand for sustainable and intelligent packaging—Increasing consumer focus on environmental issues and recyclability of materials represents an opportunity for advanced high value-add producers to further strengthen market positions. Consumers are increasingly purchasing products that are sustainable and offer recyclable packaging and many companies have embraced this trend, moving towards eco-friendly products. |
Healthcare (37% of Fiscal Year 2015 Acquisition Adjusted Pro Forma Net Sales)
Healthcare packaging is used in a wide variety of applications including OTC and prescription pharmaceuticals, medical devices, nutritional and dietary supplements, vitamins and minerals. We offer a full line of print-based packaging products serving the healthcare market, including folding cartons, inserts, labels, outserts and booklets. The healthcare packaging market is characterized by significant technical requirements, recession-resilient demand characteristics and numerous growth opportunities. Healthcare packaging has stringent quality specifications, prerequisite manufacturing standards and evolving regulatory requirements. Product innovation plays a key role in the industry as pharmaceutical manufacturers increasingly incorporate authentication features into packaging to assist in the prevention of counterfeiting. We have developed strong relationships with leading healthcare companies as a result of our high-quality products, expertise in print technologies including digital print technology, excellent customer service and customized supply solutions, and quick response and turnaround times. Through this approach, we believe we have established ourselves as an important supplier to the industry and see significant opportunity for future growth with new and existing customers.
| Acquisition Adjusted Pro Forma Net Sales Within Healthcare End Market | Net Sales to Healthcare End Market | |
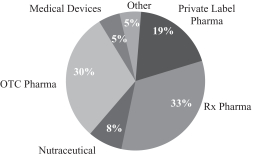
|
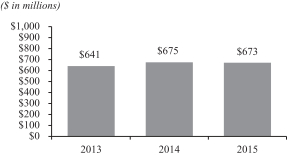
| |
Note: 2014 presented on a combined basis. 2015 presented on an acquisition adjusted pro forma basis. Fiscal years ended on June 30.
93
Table of Contents
Growth in this market is driven by:
| • | Population demographics—Population growth, an increased focus on chronic diseases and the aging population have increased the market for pharmaceuticals as consumers require a growing number and diversity of prescription and over-the-counter medicines and nutritional supplements, including those that target age-related conditions and illnesses. |
| • | Globalization and vendor rationalization—Regulatory pressures and increased product quality requirements have encouraged large multinational pharmaceutical and supplement manufacturers to focus their packaging spend on fewer suppliers that can provide consistent service and product quality on a global basis. We believe this trend favors scale players with the capability to support product launches across multiple products and geographies. We expect vendor rationalization to continue as customers seek to contain costs without sacrificing logistical flexibility and product quality. |
| • | Increasing consumer awareness regarding health and wellness—Manufacturers and marketers of nutritional and dietary supplements are continuously introducing and marketing new product offerings in order to appeal to growing consumer awareness regarding health and wellness and preventative medicine. |
| • | Growth in drug treatments and availability—The volume of pharmaceutical products available in the market has been expanding for both branded and generic drugs. The demand for generic drugs may accelerate as some branded pharmaceutical products become available in generic formulations after the expiration of patents. While our branded business is set to grow with the overall market, we also expect to benefit from the growth of generic pharmaceuticals. |
| • | Evolving regulatory standards and regulations—Regulatory standards to improve security and prevent drug counterfeiting as well as provide greater, more accessible disclosure to patients and healthcare providers create a dynamic regulatory environment that requires creative, value-added packaging solutions. For example, the blister packaging market is expected to benefit from the implementation of U.S. Food and Drug Administration regulations requiring all prescribed pharmaceuticals dispensed in hospitals and nursing homes to be packaged in unit dose formats with barcodes in order to reduce dispensing errors. Overall drug spend is also forecast to grow, given recent government legislation and regulation around the Patient Protection and Affordable Care Act. |
Multi-Media (13% of Fiscal Year 2015 Acquisition Adjusted Pro Forma Sales)
Our multi-media end market net sales is focused on high quality specialty packaging, which often requires quick response, including commemorative and special editions for home videos, recorded music, video games and software. We produce a full line of printed packaging products for leading multi-media companies including folding cartons, booklets, folders, inserts, cover sheets and slipcases, as well as highly customized, graphical and value-added packaging components. We are one of the largest producers of these products in the North American multi-media end market based on sales.
| Acquisition Adjusted Pro Forma Net Sales Within Multi-Media End Market | Net Sales to Multi-Media End Market | |
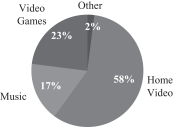
|
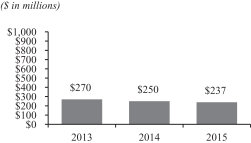
| |
Note: 2014 presented on a combined basis. 2015 presented on an acquisition adjusted pro forma basis. Fiscal years ended on June 30.
94
Table of Contents
This market is characterized by:
| • | Digital substitution—We believe the combination of our talented sales executives with longstanding customer relationships and our product and operational excellence has allowed us to generate attractive margins and cash flow despite the decline in multi-media packaging demand. The increasing popularity of digital distribution will continue to erode the shipments of physical music and video game and home video units. See “Risk Factors—Risks Related to Our Business—The impact of electronic media and similar technological changes, including the substitution of physical products for digital content, may continue to adversely affect sales in the multi-media end market.” We believe that through our market-leading positions in the multi-media specialty packaging sector we will be able to continue to execute on profitable and opportunistic multi-media packaging business. Moreover, highly anticipated video game launches, such as Grand Theft Auto, and blockbuster movie releases, such as Furious 7, drive increased demand for gaming and home video, respectively, including higher value-add commemorative editions and box sets, and can generate above average growth and profitability. |
Our Sales and Marketing
We believe we maintain a world class sales and marketing organization with an ability to grow sales with new and existing customers, as well as cross-sell our comprehensive product offerings. The ability to identify and successfully recruit talented sales and marketing executives has contributed to our ability to achieve accelerated growth rates. Each vertical is led by dedicated sales executives who, in collaboration with our executive team, are responsible for maintaining existing relationships and identifying and pursuing a target account list of potential new customers.
We have a proven ability to provide customized solutions that reduce our customers’ total cost for packaging materials. By seeking out customers who would benefit from value-added solutions, we have been able to consistently expand our customer base and maintain longstanding relationships without competing solely on the basis of price.
Our Customers
We have a broad and diversified customer base. We benefit from longstanding relationships with well-recognized customers in each of our core markets. Our relationships with our top 20 customers average 34 years with no single customer representing more than 5% of acquisition adjusted pro forma net of sales for the twelve-month period ended June 30, 2015 and our top ten customers accounting for less than 26% of acquisition adjusted pro forma net sales for the same time period.
Our management is highly focused on creating and maintaining strategic partnerships beyond standard transactional customer relationships. Our customer relationships are reinforced by our innovation, consistent high quality products, integrated service offerings, reliable on-time delivery and outstanding customer service.
Our customer relationships are further entrenched by customer audit specifications and regulatory approvals required for packaging suppliers as well as the inherent risk of switching suppliers. Products are typically complex and involve short-run production lengths, while contracts include multiple SKUs with color and design variability. While secondary packaging is a low proportion of end-product cost or price (in healthcare, for example, it is often less than 1% of end-product cost/price), the potential cost of disruption to a packaging line as a result of poor quality products or unstable supply can be significant. Consequentially, end customers are focused on quality and stability of supply.
95
Table of Contents
We maintain multi-year contracts with the majority of our customers with terms of three to four years on average. Consistent with industry practice, we do not typically receive volume commitments from customers, but often have a contractual right to a minimum percentage of a customer’s spend on identified products. We manage the majority of our raw material costs through a combination of market-based pricing and contracted escalators and de-escalators.
FY 2015 Top Customer Breakdown
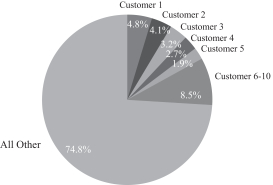
Our Facilities
We own or lease 59 manufacturing facilities and several dedicated sales and design offices in the United States and Europe. Our facility network is strategically located in close proximity to key customers.
| Location |
Activities |
Approximate Square Feet |
Owned or Leased | |||||||
| North America |
||||||||||
| Toronto, Canada |
Manufacturing plant | 145,000 | Owned | |||||||
| Aguascalientes, Mexico |
Manufacturing plant | 167,000 | Owned | |||||||
| Albuquerque, New Mexico, United States |
Manufacturing plant |
2,500 | In Customer Facility | |||||||
| Allegan, MI, United States |
Manufacturing plant | 38,000 | Leased | |||||||
| Carlstadt, NJ, United States |
Design center/Sales office | 44,000 | Leased | |||||||
| Chicago, IL, United States (2 facilities) |
Manufacturing plant | 149,000 | Leased | |||||||
| Dallas, TX, United States |
Manufacturing plant | 96,660 | Leased | |||||||
| Denver, CO, United States (2 facilities) |
Manufacturing plant | 56,000 | Leased | |||||||
| Glendale, CA, United States |
Design center/Sales office | 18,800 | Leased | |||||||
| Greensboro, NC, United States |
Manufacturing plant | 57,000 | Owned | |||||||
| Hendersonville, NC, United States |
Manufacturing plant | 180,000 | Owned | |||||||
| Hicksville, NY, United States |
Manufacturing plant |
76,800 | Leased | |||||||
| Holland, MI, United States |
Manufacturing plant |
9,000 | Leased | |||||||
| Holland, MI, United States |
Manufacturing plant | 66,000 | Owned | |||||||
| Idaho Falls, ID, United States |
Manufacturing plant | 11,200 | In Customer Facility | |||||||
| Indianapolis, IN, United States |
Manufacturing plant | 140,500 | Owned | |||||||
| Lansing, MI, United States |
Manufacturing plant | 350,500 | Owned | |||||||
96
Table of Contents
| Location |
Activities |
Approximate Square Feet |
Owned or Leased | |||||
| Lexington, NC, United States |
Manufacturing plant | 100,000 | Owned | |||||
| Los Angeles, CA, United States |
Design center/Sales office | 15,000 | Leased | |||||
| Louisville, KY, United States |
Manufacturing plant | 60,000 | Owned | |||||
| Louisville, KY, United States |
Manufacturing plant | 111,000 | Leased | |||||
| Melrose Park, IL, United States |
Manufacturing plant | 250,000 | Leased | |||||
| New York, NY, United States |
Executive office | 9,772 | Leased | |||||
| Raleigh, NC, United States |
Manufacturing plant | 75,000 | Leased | |||||
| San Angelo, TX, United States |
Manufacturing plant | 4,850 | In Customer Facility | |||||
| South Plainfield, NJ, United States |
Manufacturing plant | 100,000 | Leased | |||||
| Europe |
||||||||
| Courcelles, Belgium |
Manufacturing plant | 2,700 | In Customer Facility | |||||
| Bornem, Belgium |
Manufacturing plant | 99,000 | Owned | |||||
| Ghent, Belgium |
Manufacturing plant | 86,000 | Owned | |||||
| Angouleme, France |
Manufacturing plant | 88,000 | Owned | |||||
| Montargis, France |
Manufacturing plant | 48,000 | Leased | |||||
| St. Pierre, France |
Manufacturing plant | 92,000 | Owned | |||||
| Ussel, France |
Manufacturing plant | 43,000 | Owned | |||||
| Duren, Germany |
Manufacturing plant | 115,000 | Owned | |||||
| Obersulm, Germany |
Manufacturing plant | 214,000 | Owned | |||||
| Melle, Germany |
Manufacturing plant | 129,000 | Owned | |||||
| Stuttgart, Germany |
Manufacturing plant | 112,000 | Owned | |||||
| Dublin, Ireland |
Manufacturing plant | 27,000 | Leased | |||||
| Limerick, Ireland |
Manufacturing plant | 31,000 | Owned | |||||
| Westport, Ireland |
Manufacturing plant/Sales office | 80,000 | Owned | |||||
| Bialystok, Poland |
Manufacturing plant/Design center | 127,000 | Owned | |||||
| Tczew, Poland |
Manufacturing plant | 79,000 | Owned | |||||
| Oss, The Netherlands |
Manufacturing plant | 35,000 | Leased | |||||
| Arbroath, United Kingdom |
Manufacturing plant | 105,000 | Leased | |||||
| Arbroath, United Kingdom |
Manufacturing plant | 23,000 | Owned | |||||
| Belfast, United Kingdom |
Manufacturing plant | 125,000 | Owned | |||||
| Bourne, United Kingdom |
Manufacturing plant | 23,700 | Owned | |||||
| Bradford, United Kingdom |
Manufacturing plant | 83,000 | Owned | |||||
| Bristol, United Kingdom |
Manufacturing plant | 17,750 | Leased | |||||
| East Kilbride, United Kingdom |
Manufacturing plant/Design center | 223,000 | Owned | |||||
| Greenford, United Kingdom |
Manufacturing plant | 27,000 | Leased | |||||
| Hamilton, United Kingdom |
Manufacturing plant | 60,000 | Leased | |||||
| Hillington, United Kingdom |
Manufacturing plant | 22,000 | Leased | |||||
| Leicester, United Kingdom |
Manufacturing plant | 156,798 | Owned | |||||
| Newcastle, United Kingdom |
Manufacturing plant/Design center | 183,000 | Owned | |||||
| Nottingham, United Kingdom |
Manufacturing plant | 107,639 | Owned | |||||
| Portsmouth, United Kingdom |
Manufacturing plant | 155,000 | Owned | |||||
| Swadlincote, United Kingdom |
Logistics center | 93,730 | Owned | |||||
| Tewkesbury, United Kingdom |
Manufacturing plant | 66,000 | Leased | |||||
| Wrexham, United Kingdom |
Manufacturing plant/Sales office | 45,907 | Leased | |||||
| Asia |
||||||||
| Guangzhou, China |
Manufacturing plant/Design center | 174,000 | Owned | |||||
| Hong Kong, China |
Design center/Sales office | 2,586 | Leased | |||||
| Kunshan, China (2 facilities) |
Manufacturing plant/Sales office | 270,000 | Leased | |||||
We employ a largely integrated, enterprise-wide approach to management of our facilities and fundamental equipment, which enables us to redeploy plant assets and production processes to match customer and
97
Table of Contents
profitability objectives. At the same time, facility level specialization of our manufacturing footprint based on customer needs, substrate capabilities and technological offerings allows us to take advantage of enhanced profitability from efficiencies associated with running larger volumes of consistent products at specific locations. Acquired operations also benefit from this approach as business is optimized across the broader facility network incorporating a process of asset redeployment, facility rationalization and targeted capital investment.
Further, we have invested to ensure our facilities provide the scale, geographic coverage, operational flexibility and security of redundant capabilities that sophisticated customers require. Since our inception in 2005, we have pursued a capital investment program, which we believe has provided us with leading technological and operational capabilities and capacity for continued growth. We completed a capital investment program from fiscal year 2012 through fiscal year 2013 that expanded existing co-located facilities, expanded our Poland facility and consolidated two redundant facilities. As a result, our manufacturing platform is well positioned to support the ramp-up of production related to our new business pipeline and continued organic growth. We are able to deliver high quality products and services to our customers by way of the following:
| • | Security of Supply—The scale of our multi-site network allows customers to confidently source a large portion of their packaging requirements from us. |
| • | Fully-Accredited Sites—All our facilities are registered to ISO9000 standards or are cGMP compliant. Many sites conform to relevant market sector standards such as the Pharmaceutical Code of Practice (PS9000), BRC / IoP, HAACP, ISO14001 and 18001. |
| • | Sites Meet Stringent Customer Requirements—Customer audits are undertaken for supplier approval and quality certifications. These demanding audits are accompanied by continually evolving and increasingly stringent regulatory standards and requirements. |
Our Manufacturing
Our manufacturing footprint and dedicated sales force are strategically located in close proximity to our clients, which further enables our ability to manage customers in the region. Through continued capital investment and strategic acquisitions, we have become a leading print-based specialty packaging supplier offering a comprehensive range of technological capabilities to our customers. We have invested in state-of-the-art equipment and are a leader in the three principal specialty printing technologies:
| • | Offset Lithographic Printing—In “offset” printing, rollers apply ink and water to plates which are then transferred to a rubber cylinder that transfers the image onto the paper. The lithographic printing process delivers superior quality graphics and can accommodate a variety of specialty finishes, including foil stamping and embossing. Benefits to offset printing include consistent high image quality and usability on a wide range of printing surfaces. In this process, paper is cut down to sheets (either internally or by outside vendors) and then fed through the printing press. |
| • | Flexographic Printing—In “flexo” printing, inked rubber or plastic plates with a slightly raised image are rotated on a cylinder which transfers the image directly to the substrate. A versatile printing technology, flexography offers a unique blend of high quality graphics on a wide variety of substrates and supports flexible production requirements. In this process, the presses are web-fed or roll-fed, whereby a large roll of paper or paperboard is fed through the press. |
| • | Digital Printing—Digital printing is ideal for short production runs and on-demand printing. Product concepts and design alternatives can be produced quickly on virtually any substrate. This value-added solution helps customers reduce inventory levels and practically eliminate inventory obsolescence. |
We have also invested in finishing capabilities that utilize a variety of new technologies and equipment, including cutters, folders, gluers and other specialized equipment that we use to create the final product. Our footprint provides redundant and flexible capabilities that enable us to optimize facility loading to most effectively and efficiently service our customers’ needs.
98
Table of Contents
We believe we also have significant available capacity for continued growth by means of our considerable investments in plant infrastructure and information technology systems. Moreover, our core information technology systems are being progressively updated to provide increased functionality and control.
Further contributing to our success is our creative design and product development expertise. Our products are manufactured with various features and finishes, including lamination, stamping, embossing and foil stamping. In addition, we are able to use our extensive decorative technology capabilities to create iridescent, holographic, textured and dimensional effects to provide differentiated packaging to our customers.
While we have undergone a lot of changes, particularly around the perimeter of our business, we are only part of the way through our operational efficiency journey. Going forward, our key areas of operational focus include:
| • | Operational performance improvement—Significant savings could be realized if all sites can be brought up to the average group standard efficiency for key processes. Example areas of focus include machine performance improvements, material yield improvements and improved capacity utilization. For instance, we have yet to realize the full benefits of recent capital expenditures in new presses, which have reduced the number of presses required for the same output and led to lower raw material wastage and direct costs. |
| • | Additional plant optimization—Addressing underperforming plants with scope for further rationalization. Additionally, benefits from recently completed plant consolidations are still being realized. |
| • | Attractive capital projects—Achieving efficiencies from a number of recent capital expenditure projects. Additionally, there are numerous identified capital projects not yet implemented with attractive payback periods. |
| • | Procurement—The procurement function has evolved to a more centralized model globally but has largely focused on key, direct spend items and has yet to tackle its broader indirect purchase envelope which has historically been decentralized with a high number of suppliers to drive further savings. |
| • | Selling, general and administrative expenses improvement—There has been ongoing focus on reducing selling, general and administrative expenses, for example through further clustering of manufacturing sites, whereby facilities are integrated with common facility management teams as well as shared back office services, to drive cost efficiencies. |
Lean manufacturing
We established lean manufacturing principles and have subsequently implemented lean manufacturing across the entire Company, with seven full-time employees dedicated to the implementation of best practices across the Company through the use of lean manufacturing tools. This discipline includes utilizing value stream mapping to identify opportunities for process improvement. We have realized significant benefits from lean manufacturing initiatives including shorter make-ready times, improved production workflow, faster cycle times, expanded capacity and reduced waste. Lean manufacturing benefits are essential components of our ability to compete and deal with the impacts of employee salary increases and raw material price increases. We maintain one of the key principles of lean manufacturing, continuous operational improvement, at the center of our corporate philosophy. As a reflection of this, we have implemented lean manufacturing at all acquired companies and conduct weekly and monthly calls to share best practices across facilities. We rigorously evaluate our manufacturing footprint on an ongoing basis by measuring several key performance indicators, including downtime, make-ready time and run speed, to identify underperforming facilities and ensure that measures are taken to bring them up to our company-wide manufacturing efficiency standards.
Our Suppliers and Raw Materials
Our largest raw material expenses are related to our major product substrates, including paperboard, paper, sheeted plastic and label stock. We also purchase inks, varnishes, coatings, adhesives and corrugated boxes that
99
Table of Contents
are used in the manufacturing process. We have a centralized purchasing function that allows us to leverage our growing scale to achieve competitive material pricing. Further, we have consistently used our scale to lower input costs at acquired businesses.
We utilize a diversified and global sourcing model with the ability to procure each key substrate from a variety of sources. We price non-contractual business based on prevailing raw material costs, which we believe mitigates the impact of rising input prices. All primary materials are available from multiple suppliers and we have not experienced any material disruptions in our ability to procure key inputs. We have been able to effectively manage raw material costs since our founding, including during periods of rapidly escalating commodity prices, either through contractual pass-through mechanisms or transactional business.
Seasonality
Net sales in our geographical segment markets are somewhat seasonal, with consumer and multi-media market net sales higher in the first and second quarter of the fiscal year due to the need to satisfy holiday-related packaging needs of our customers. Healthcare net sales are generally higher as the cold and flu season approaches. Cash flow in our business is also seasonal, with sources of working capital generally provided in the second and fourth fiscal quarters, and investments in working capital in the first and third fiscal quarters.
Research and Development
We employ ten professionals in Europe and the United States to work on new technological developments and customer-focused solutions. The trademarked technologies employed by MPS were developed internally by MPS, and continue to be refined to provide more value-add to our customers. We also focus on the creation of compliance packaging for the healthcare industry, and we have successfully launched a number of products that are extensively used by our healthcare customers.
Intellectual Property and Licenses
Although our business is not dependent to any significant extent upon any single or related group of intellectual property, we have registered in the United States and in a number of foreign jurisdictions, as of June 30, 2015, approximately 100 trademarks, 115 patents and 36 registered designs. In addition, we have a book of approximately 400 copyrights. We do not believe our licenses to third-party intellectual property are significant to our business other than licenses to commercially available third-party software.
Our Employees
As of June 30, 2015, we employed approximately 8,900 people, of which approximately 3,400 are located in North America, 4,600 are located in Europe and the remainder are located in Asia. The majority of our workforce is non-union; however, we participate in multiple collective bargaining agreements with various unions, which provide specified benefits to certain union employees. Approximately 7% of our employees in North America and approximately 72% of our employees in Europe are members of a union or works council or otherwise covered by labor agreements. The collective bargaining contract agreements with our North American unions are set to expire at various dates between 2016 and 2017, at which time we expect to negotiate a renewal of the agreements.
Health, Safety and Environmental Matters and Governmental Regulation
Our business and facilities are subject to a wide range of federal, state, local and foreign general and industry-specific environmental, health and safety laws and regulations, including those relating to air emissions, wastewater discharges, management and disposal of regulated materials and site remediation. Certain of our operations require environmental permits or other approvals from governmental authorities, and certain of these
100
Table of Contents
permits and approvals are subject to expiration, denial, revocation or modification under various circumstances. We are also subject to frequent inspections and monitoring by government enforcement authorities. Compliance with these laws, regulations, permits and approvals is a significant factor in our business. We incur, from time to time, and may incur in the future, significant capital and operating expenditures to achieve and maintain compliance with applicable environmental laws, regulations, permits and approvals. Our failure to comply with applicable environmental laws and regulations or permit or approval requirements could result in substantial civil or criminal fines or penalties or enforcement actions, including regulatory or judicial orders enjoining or curtailing operations or requiring remedial or corrective measures, installation of pollution control equipment or other actions or costs, which could have a material adverse effect on our business, financial condition and operating results.
In addition, as an owner and operator of real estate, we may be responsible under environmental laws and regulations for the investigation, remediation and monitoring, as well as associated costs, expenses and third-party damages, including tort liability and natural resource damages, relating to past or present releases or threats of releases of regulated materials at, on, under or from our properties. Liability under these laws may be imposed without regard to whether we knew of or were responsible for, the presence of those materials on our property, may be joint and several, meaning that the entire liability may be imposed on each party without regard to contribution, and retroactive and may not be limited to the value of the property. In addition, we or others may discover new material environmental liabilities, including liabilities related to third-party owned properties that we or our predecessors formerly owned or operated, or at which we or our predecessors have disposed of, or arranged for the disposal of, certain materials.
We may be involved in administrative or judicial proceedings and inquiries in the future relating to such environmental matters, which could have a material adverse effect on our business, financial condition and operating results.
New environmental laws or regulations (or changes in existing laws or regulations or their enforcement) may be enacted that require significant expenditures by us. If the resulting expenses significantly exceed our expectations, our business, financial condition and operating results could be materially and adversely affected.
We are also subject to various federal, state, local, and foreign requirements concerning safety and health conditions at our manufacturing facilities. We may also be subject to material financial penalties or liabilities for non-compliance with those safety and health requirements, as well as potential business disruption, if any of our facilities or a portion of any facility is required to be temporarily closed as a result of any significant injury or any non-compliance with applicable requirements. Such financial penalties or liabilities or business disruptions could have a material adverse effect on our business, financial condition and operating results.
Our manufacturing facilities are run in compliance with the rules and requirements set forth by the U.S. Food and Drug Administration and the U.S. Occupational Safety and Health Administration. We believe that our manufacturing facilities are in compliance, in all material respects, with these laws and regulations.
We are committed to ensuring that safe operating practices are established, implemented and maintained throughout our organization. In addition, we have instituted active health and safety programs throughout our company.
Legal Proceedings
We are from time to time party to legal proceedings that arise in the ordinary course of business. We are not involved in any litigation other than that which has arisen in the ordinary course of business. We do not expect that any currently pending lawsuits will have a material effect on us. See “Risk Factors—Risks Related to Our Business—We are subject to litigation in the ordinary course of business, and uninsured judgments or a rise in insurance premiums may adversely impact our results of operations.”
101
Table of Contents
The following table provides information regarding our executive officers and our Board of Directors:
| Name |
Age | Position | ||||
| Marc Shore |
61 | Chief Executive Officer and Director Nominee (1) | ||||
| Dennis Kaltman |
50 | President | ||||
| Rick Smith |
46 | Executive Vice President | ||||
| William H. Hogan |
56 | Chief Financial Officer and Executive Vice President | ||||
| Zeina Bain |
38 | Director Nominee (1) | ||||
| George Bayly |
73 | Director Nominee (1) | ||||
| Richard H. Copans |
39 | Director Nominee (1) | ||||
| Eric Kump |
45 | Director | ||||
| Gary McGann |
65 | Director Nominee (1) | ||||
| Thomas S. Souleles |
47 | Director | ||||
| (1) | Each noted individual has agreed to become a director and it is expected that such individuals shall be appointed to the Board of Directors on or prior to the closing of this offering. |
Marc Shore, Chief Executive Officer and Director Nominee. Mr. Shore joined MPS in March 2005. Mr. Shore has 38 years of experience in the print-based specialty packaging industry. Prior to joining MPS, Mr. Shore was CEO of Shorewood Packaging, which grew under his direction from $72 million in sales to $680 million, becoming one of the largest independent packaging companies in North America at that time. Mr. Shore led Shorewood through a successful IPO in 1986 and for 14 years as a public company, before its sale to International Paper (“IP”). Following IP’s acquisition of Shorewood in 2000, Mr. Shore continued as President of the business and as a corporate officer of IP until 2004. Mr. Shore received his B.S. in business administration from Boston University. Our Board of Directors has concluded that Mr. Shore should serve as a director because of his leadership role with our company and his extensive experience in and knowledge of the packaging industry.
Dennis Kaltman, President and Director Nominee. Mr. Kaltman joined MPS in July 2005. Mr. Kaltman has more than 20 years of experience in the print-based specialty packaging industry. Prior to joining MPS, Mr. Kaltman served as Senior Vice President of IP’s Home Entertainment Packaging Division. Before joining IP, Mr. Kaltman was Senior Vice President of Shorewood Packaging from 1998 to 2000 and was Senior Vice President of Queens Group from 1990 to 1998. Queens Group was acquired by Shorewood Packaging in 1998. Mr. Kaltman and Mr. Shore have worked together for 17 years. Mr. Kaltman received his B.A. in political science from Northwestern University and his M.B.A. from Columbia University.
Rick Smith, Executive Vice President and Director Nominee. Rick Smith joined MPS in 2014 after the consummation of the Chesapeake Transaction. Mr. Smith has more than 20 years of experience in the print and packaging sector. Prior to joining MPS, Mr. Smith served as Chief Financial Officer for Chesapeake and had been with the company for 18 years. Mr. Smith received his ACMA from the University of Derby and his DMS from Nottingham Trent University.
William H. Hogan, Chief Financial Officer and Vice President. Mr. Hogan joined MPS in February 2006. Mr. Hogan has 30 years of experience in the print and packaging industry. Prior to joining MPS, Mr. Hogan spent one year with Computer Associates International as Senior Vice President of Finance. Before joining Computer Associates, Mr. Hogan served as Chief Financial Officer of IP Europe from 2001 to 2004. Before joining IP, Mr. Hogan served in various finance capacities at Shorewood from 1995 to 2000 and as Chief Financial Officer from 2000 to 2001. Prior to that, Mr. Hogan was a professional at Deloitte. Mr. Hogan has worked with Mr. Shore for more than 30 years, both at Deloitte and Shorewood, and with Mr. Kaltman for more than 10 years. Mr. Hogan is a Certified Public Accountant. Mr. Hogan received his B.S. in accounting from the State University of New York at Geneseo.
102
Table of Contents
Zeina Bain, Director Nominee. Ms. Bain is a Managing Director at Carlyle and she advises on European buyout opportunities. Prior to joining Carlyle in 2001, Ms. Bain was an associate at European Digital Capital, a technology venture capital fund, and she also previously worked as an investment banking analyst in the emerging markets group at Merrill Lynch. Ms. Bain received her B.A. in philosophy, politics and economics from Oxford University. Ms. Bain is an observer on the Board of Directors of Axalta Coating Systems Limited and formerly served on the boards of directors of AZ Electronic Materials, Britax Childcare, Firth Rixson and RAC Limited, among others. Our Board of Directors has concluded that Ms. Bain should serve as a director because she brings extensive experience regarding the management of public and private companies and has significant core business skills, including financial and strategic planning.
George Bayly, Director Nominee. Mr. Bayly currently serves as principal of Whitehall Investors, LLC, a consulting and venture capital firm, having served in that role since August 2008. Mr. Bayly served as Chairman and Chief Executive Officer of Altivity Packaging LLC, a maker of consumer packaging products and services, from September 2006 to March 2008. He also served as Co-Chairman of U.S. Can Corporation from 2003 to 2006 and Chief Executive Officer in 2005. In addition, from January 1991 to December 2002, Mr. Bayly served as Chairman, President and Chief Executive Officer of Ivex Packaging Corporation. From 1987 to 1991, Mr. Bayly served as Chairman, President and Chief Executive Officer of Olympic Packaging, Inc. Mr. Bayly also held various management positions with Packaging Corporation of America from 1973 to 1987. Prior to joining Packaging Corporation of America, Mr. Bayly served as a Lieutenant Commander in the United States Navy. Mr. Bayly currently serves on the Board of Directors of ACCO Brands Corporation and Treehouse Foods, Inc. and formerly served on the board of directors of Graphic Packaging Holding Co. Mr. Bayly holds a B.S. from Miami University and an M.B.A. from Northwestern University. Our Board of Directors has concluded that Mr. Bayly should serve as a director because of his experience as a former executive of numerous packaging companies and his extensive understanding of the operational, financial and strategic issues facing public and private companies.
Richard H. Copans, Director Nominee. Mr. Copans is a Managing Director at Madison Dearborn concentrating on investments in the basic industries sector. Prior to joining Madison Dearborn in 2005, Mr. Copans was an analyst with Thomas H. Lee Partners and Morgan Stanley & Co. Mr. Copans received his A.B. in economics from Duke University and his M.B.A. from Northwestern University’s J.L. Kellogg Graduate School of Management. Mr. Copans formerly served on the boards of directors of BWAY Holding Company, Schrader International and Yankee Candle Company, Inc. Our Board of Directors has concluded that Mr. Copans should serve as a director because he brings, among other things, extensive financial and management expertise and experience, extensive knowledge of and experience in the packaging industry and manufacturing sector and general business and financial acumen.
Eric Kump, Director. Mr. Kump became a director in June 2015. Mr. Kump is a Managing Director at Carlyle with responsibility for coverage of the U.K. market. Prior to joining Carlyle in 2010, Mr. Kump was a Managing Director and head of the London-based private equity team of Dubai International Capital (“DIC”). While at DIC, he was on the board of various investments including Alliance Medical, Almatis, Travelodge, Mauser Group and Merlin Entertainments Group. Prior to that, he was a Managing Director with Merrill Lynch Global Private Equity (“MLGPE”), where he was a member of the investment committee and a director of numerous portfolio companies. While at MLGPE, he focused on investments in a range of industries, including financial services, consumer, distribution, industrial and healthcare. Mr. Kump received his B.A. in finance and accounting from Pace University and his M.B.A. from Harvard Business School. Mr. Kump currently sits on the board of directors of Integrated Dental Holdings Limited. Our Board of Directors has concluded that Mr. Kump should serve as a director because he brings extensive experience regarding the management of public and private companies and has significant core business skills, including financial and strategic planning.
Gary McGann, Director Nominee. Mr. McGann was previously Chief Executive Officer of the Smurfit Kappa Group from 2002 until his retirement in 2015 and President and Chief Operations Officer of the Smurfit Group from 2000 to 2002. He joined the Smurfit Group in 1998 as Chief Financial Officer. He has held a number of
103
Table of Contents
senior positions in both the private and public sectors over the previous 20 years, including Chief Executive of Gilbeys of Ireland Group and Aer Lingus Group plc. He is Chairman of Paddy Power plc and Aon Ireland, a non-executive Director of the Smurfit Kappa Group, Green REIT plc and the Irish Business Employers Confederation, a former member of the European Round Table of Industrialists and Chairman of the Confederation of European Paper Industries. Mr. McGann obtained a B.A. from University College Dublin and holds a M.S. degree in Management Science. He is a Fellow of the Institute of Certified Accountants (FCCA) and an Honorary Fellow of the National College of Ireland. Our Board of Directors has concluded that Mr. McGann should serve as a director because of his experience in and knowledge of the packaging industry and his extensive understanding of the operational, financial and strategic issues facing public and private companies.
Thomas S. Souleles, Director. Mr. Souleles became a director in June 2015. Mr. Souleles is a Managing Director at Madison Dearborn concentrating on investments in the basic industries sector. Prior to joining Madison Dearborn in 1995, Mr. Souleles was with Wasserstein Perella & Co., Inc. Mr. Souleles received his A.B. in The Woodrow Wilson School of Public and International Affairs from Princeton University, his J.D. from Harvard Law School and his M.B.A. from the Harvard Graduate School of Business Administration. Mr. Souleles currently sits on the boards of directors of Packaging Corporation of America and Children’s Hospital of Chicago Medical Center, and on the board of trustees of the National Multiple Sclerosis Society, Greater Illinois Chapter. Our Board of Directors has concluded that Mr. Souleles should serve as a director because he brings, among other things, extensive financial and management expertise and experience, extensive knowledge of and experience in the packaging industry and basic industries sector and general business and financial acumen.
Controlled Company
For purposes of the rules of the stock exchange on which our common shares will be listed, we expect to be a “controlled company.” Controlled companies under those rules are companies of which more than 50% of the voting power for the election of directors is held by an individual, a group or another company. We expect that affiliates of Carlyle and Madison Dearborn will collectively continue to own more than 50% of the combined voting power of our common shares upon completion of this offering and will continue to have the right to designate a majority of the members of our Board of Directors for nomination for election and the voting power to elect such directors following this offering. Accordingly, we expect to be eligible to, and we intend to, take advantage of certain exemptions from corporate governance requirements provided in the rules of such stock exchange. Specifically, as a controlled company, we would not be required to have (i) a majority of independent directors, (ii) a nominating and corporate governance committee composed entirely of independent directors, (iii) a compensation committee composed entirely of independent directors or (iv) an annual performance evaluation of the nominating and corporate governance and compensation committees. Therefore, following this offering we will not have a majority of independent directors, our nominating and corporate governance and compensation committees will not consist entirely of independent directors and such committees will not be subject to annual performance evaluations; accordingly, you will not have the same protections afforded to shareholders of companies that are subject to all of the applicable stock exchange rules. The controlled company exemption does not modify the independence requirements for the audit committee, and we intend to comply with the requirements of the Sarbanes-Oxley Act and the stock exchange rules, which require that our audit committee be composed of at least three members, one of whom will be independent upon the listing of our common shares on the stock exchange, a majority of whom will be independent within 90 days of the date of this prospectus, and each of whom will be independent within one year of the date of this prospectus.
Board of Directors Composition
Our Board of Directors currently consists of two members and following this offering will consist of seven members. Mr. Shore will be our Chairman of the Board of Directors. The exact number of members on our Board of Directors may be modified from time to time by the Board of Directors and the Board of Directors may fill any vacancies subject to the terms of our shareholders’ agreement. Following this offering, our Board of
104
Table of Contents
Directors will be divided into three classes whose members serve three-year terms expiring in successive years. Directors hold office until their successors have been duly elected and qualified or until the earlier of their respective death, resignation or removal.
At each annual meeting of shareholders, the successors to the directors whose terms will then expire will be elected to serve from the time of election and qualification until the third annual meeting of shareholders following such election. Any additional directorships resulting from an increase in the number of directors will be distributed among the three classes so that, as nearly as possible, each class will consist of one-third of the directors.
We expect to enter into a shareholders’ agreement with affiliates of Carlyle and Madison Dearborn. Upon the effectiveness of this registration statement, pursuant to the shareholders’ agreement, affiliates of Carlyle and Madison Dearborn will each have the right to designate two of our seven directors. See “Certain Relationships and Related Party Transactions—Shareholders’ Agreement.”
When considering whether directors and nominees have the experience, qualifications, attributes or skills, taken as a whole, to enable the Board of Directors to satisfy its oversight responsibilities effectively in light of our business and structure, the Board of Directors focused primarily on each person’s background and experience as reflected in the information discussed in each of the directors’ individual biographies set forth immediately above. We believe that our directors provide an appropriate diversity of experience and skills relevant to the size and nature of our business.
Board of Directors Committees
Our Board of Directors directs the management of our business and affairs and conducts its business through its meetings and two standing committees: the audit committee and the compensation committee. Effective upon completion of this offering, we expect that our Board of Directors will also have a nominating and corporate governance committee. In addition, from time to time, other committees may be established under the direction of our Board of Directors when necessary or advisable to address specific issues.
Each of the audit committee and the compensation committee operates, and the nominating and corporate governance committee will operate, under a charter that has been or will be approved by our Board of Directors. A copy of each of the audit committee, compensation committee and nominating and corporate governance committee charters will be available on our website upon completion of this offering.
Audit Committee
Our audit committee, which following this offering will consist of Messrs. McGann (Chairman) and Bayly and Ms. Bain, is responsible for, among its other duties and responsibilities, assisting our Board of Directors in overseeing our accounting and financial reporting processes and other internal control processes, the audits and integrity of our financial statements, our compliance with legal and regulatory requirements, the qualifications and independence of our independent registered public accounting firm and the performance of our internal audit function and independent registered public accounting firm. Our audit committee is directly responsible for the appointment, compensation, retention and oversight of our independent registered public accounting firm.
Our Board of Directors has determined that Messrs. McGann and Bayly and Ms. Bain are each an “audit committee financial expert” as such term is defined under the applicable regulations of the SEC and have the requisite accounting or related financial management expertise and financial sophistication under the applicable rules and regulations of the stock exchange. Our Board of Directors has also determined that Messrs. McGann and Bayly are independent under Rule 10A-3 under the Securities Exchange Act of 1934, as amended (the “Exchange Act”), and the stock exchange standard, for purposes of the audit committee. Rule 10A-3 under the Exchange Act requires us to have (i) a majority of independent audit committee members within 90 days of the
105
Table of Contents
effectiveness of the registration statement of which this prospectus forms a part and (ii) all independent audit committee members (within the meaning of Rule 10A-3 under the Exchange Act and the stock exchange standard) within one year of the effectiveness of the registration statement of which this prospectus forms a part. We intend to comply with these independence requirements within the appropriate time periods. All members of our audit committee are able to read and understand fundamental financial statements, are familiar with finance and accounting practices and principles and are financially literate.
Compensation Committee
Our compensation committee, which following this offering will consist of Messrs. Kump (Chairman), Bayly and Souleles, is responsible for, among its other duties and responsibilities, reviewing and approving the compensation philosophy for our Chief Executive Officer, reviewing and approving all forms of compensation and benefits to be provided to our other executive officers and reviewing and overseeing the administration of our equity incentive plans.
Nominating and Corporate Governance Committee
Our nominating and corporate governance committee, which following this offering we expect will consist of Messrs. Copans (Chairman), Shore and McGann, is responsible for, among its other duties and responsibilities, identifying and recommending candidates to our Board of Directors for election to our Board of Directors, reviewing the composition of members of our Board of Directors and its committees, developing and recommending to the Board of Directors corporate governance guidelines that are applicable to us and overseeing our Board of Directors’ and its committees’ evaluations.
Code of Conduct and Business Ethics
We expect to adopt a Code of Conduct and Business Ethics that applies to all of our directors and employees, including our executive officers. A copy of the Code of Conduct and Business Ethics will be available on our website and will also be provided to any person without charge.
106
Table of Contents
EXECUTIVE AND DIRECTOR COMPENSATION
This section discusses the material components of the executive compensation program offered to our named executive officers identified below. For the fiscal year ended June 30, 2015, our named executive officers were:
| • | Marc Shore, Chief Executive Officer; |
| • | William Hogan, Executive Vice President & Chief Financial Officer; |
| • | Dennis Kaltman, President; and |
| • | Mike Cheetham, Former President – Europe. |
This discussion may contain forward-looking statements that are based on our current plans, considerations, expectations and determinations regarding future compensation programs. Actual compensation programs that we adopt following the closing of this offering may differ materially from the currently planned programs summarized in this discussion.
We are an “emerging growth company,” within the meaning of the JOBS Act, and have elected to comply with the reduced compensation disclosure requirements available to emerging growth companies under the JOBS Act.
2015 Summary Compensation Table
The following table sets forth information concerning the compensation of our named executive officers for the fiscal year ended June 30, 2015.
| Name and Principal Position |
Year | Salary ($) |
Stock Awards ($) |
Option Awards ($) |
Non-Equity Incentive Plan Compensation ($) |
All Other Compensation ($) |
Total ($) |
|||||||||||||||||||||
| Marc Shore |
2015 | 1,087,738 | 1,300,000 | (2) | 54,550 | 2,442,288 | ||||||||||||||||||||||
| Chief Executive Officer |
2014 | 1,066,410 | 2,730,000(1 | ) | 2,418,390(1 | ) | 600,000 | (2) | 4,804,751 | (4) | 11,619,551 | |||||||||||||||||
| William Hogan |
2015 | 370,005 | 810,000 | (2) | 11,301 | 1,191,306 | ||||||||||||||||||||||
| Executive Vice President & Chief Financial Officer |
2014 | 346,706 | 980,000(1 | ) | 868,140(1 | ) | 330,000 | (2) | 405,207 | (4) | 2,930,053 | |||||||||||||||||
| Dennis Kaltman |
2015 | 450,000 | 1,000,000 | (2) | 14,884 | 1,464,884 | ||||||||||||||||||||||
| President |
2014 | 420,250 | 1,575,000(1 | ) | 1,395,225(1 | ) | 400,000 | (2) | 413,329 | (4) | 4,203,804 | |||||||||||||||||
| Mike Cheetham |
2015 | 263,091 | 1,204,815 | 1,467,906 | ||||||||||||||||||||||||
| Former President – Europe (3) |
||||||||||||||||||||||||||||
| (1) | Amounts reflect the grant date fair value of the incentive units and restricted common units in Mustang Investment Holdings L.P. (“Mustang Holdings”) computed in accordance with Financial Accounting Standards Board (“FASB”) Accounting Standards Codification (“ASC”) Topic 718, rather than the amounts paid to or realized by the applicable named executive officer. The assumptions used in the valuation of such units are set forth in Note 20 to the audited consolidated financial statements of MPS Holdings appearing elsewhere in this prospectus. We believe that, despite the fact that the incentive units in Mustang Holdings do not require the payment of an exercise price, they are most similar economically to stock options, and as such, they are properly classified as “options” under the definition provided in Item 402(a)(6)(i) of Regulation S-K under the Securities Act as an instrument with an “option-like feature” and are thus reflected in the “Option Awards” column. |
107
Table of Contents
| (2) | Amounts set forth in this column with respect to the fiscal years ended June 30, 2015 and June 30, 2014, respectively, reflect annual cash bonus compensation earned with respect to fiscal years ended June 30, 2015 and June 30, 2014, respectively, and paid in fiscal years ended June 30, 2016 and June 30, 2015, respectively. |
| (3) | Amounts paid to Mr. Cheetham were paid in British pound sterling. Such payments were converted to U.S. dollars at a conversion rate of U.S. $1.5822 per 1.00 British pound sterling. |
| (4) | Amounts include change in control bonuses paid to Messrs. Shore, Hogan and Kaltman in connection with the consummation of the Madison Dearborn Transaction. Such change in control bonuses for Messrs. Shore, Hogan and Kaltman equaled $1,967,147, $396,151 and $399,883, respectively |
Narrative Disclosure to Summary Compensation Table
The primary elements of compensation for our named executive officers are base salaries, annual cash bonuses and long-term equity-based compensation awards. The named executive officers also participate in employee benefit plans and programs that we offer to our other full-time employees in similar geographic areas.
Base Salaries
Our named executive officers receive a base salary to compensate them for the satisfactory performance of services rendered to our company. The base salary payable to each named executive officer is intended to provide a fixed component of compensation reflecting the executive’s skill set, experience, role and responsibilities. Base salaries for our named executive officers have generally been set at levels deemed necessary to attract and retain individuals with superior talent. The base salary for Mr. Shore was originally established in his employment agreement, but was increased for the fiscal year ended June 30, 2015.
Annual Cash Bonuses
Our named executive officers have the opportunity to earn annual performance bonuses based on the achievement of short-term performance goals. In the fiscal year ended June 30, 2015, our named executive officers participated in our Manager Incentive Plan and were eligible for bonuses generally based on individual performance and EBITDA goals. In addition, our named executive officers were eligible to receive bonuses based on their performance in connection with the integration of the Mustang and CF2 businesses following the Merger. The actual amounts that our named executive officers received under our annual cash bonus program are set forth in the “Non-Equity Incentive Plan Compensation” column of the Summary Compensation Table above.
Equity Compensation
Our named executive officers did not receive any equity compensation awards in the fiscal year ended June 30, 2015. However, our named executive officers (other than Mr. Cheetham) do hold certain incentive units in Mustang Holdings. The incentive units were awarded in connection with the Merger and are expected to remain outstanding following this offering in accordance with their terms. The incentive units are intended to be “profits interests” and have a distribution threshold of $10 per incentive unit. Refer to the Outstanding Equity Awards as of June 30, 2015 table for a description of the vesting terms that apply to these incentive units.
In addition to the incentive units, the named executive officers, other than Mr. Cheetham, also hold common units in Mustang Holdings. The common units were originally shares of common stock in Mustang that were converted into common units in connection with the Merger. The original shares of common stock in Mustang were purchased by our named executive officers, other than Mr. Cheetham, using promissory notes in an aggregate principal amount of $5,285,000 and each of such named executive officers has currently pledged his units as collateral for his note. Each promissory note is due on August 14, 2019, subject to earlier payment in connection with (i) termination of employment, (ii) filing of a registration statement by Mustang (or any parent or subsidiary thereof), (iii) a change in control, (iv) applicable changes in law, (v) impermissible transfers and (vi) dividends and distributions. However, any payment obligation in connection with the filing of this registration statement has been waived. The promissory notes accrue interest semi-annually at a rate of 1.62%, which is payable on the due date of the notes. Mustang distributed
108
Table of Contents
these notes to Mustang Intermediate Investments S.à r.l. (“Mustang S.à r.l.”), effective as of the closing date of the Merger, and they are currently held by Mustang S.à r.l. The common units are expected to remain outstanding following this offering in accordance with their terms. Refer to the Outstanding Equity Awards as of June 30, 2015 table for a description of the vesting terms that apply to certain of these common units.
Mr. Cheetham received Class A Units in Chesapeake Holdings Ltd. in connection with the combination transaction between Chesapeake and Mustang. Subject to the terms of Mr. Cheetham’s separation agreement described below, certain of these Class A Units are expected to remain outstanding following this offering in accordance with their terms. Refer to the Outstanding Equity Awards as of June 30, 2015 table for a description of the restrictions that apply to the equity award held by Mr. Cheetham.
In connection with this offering, we intend to adopt the 2015 Plan to facilitate the grant of cash and equity-based incentives to our directors, employees (including our named executive officers) and consultants, and to enable our company to obtain and retain the services of these individuals, which we believe is essential to our long-term success. See the section titled “2015 Incentive Plan” below for additional information about the 2015 Plan.
Other Compensation
In addition to the compensation described above, we provided our named executive officers with certain additional perquisites and benefits. In particular, in 2015, we provided Mr. Shore with certain split dollar life insurance benefits at an aggregate cost of $40,000. Messrs. Shore, Kaltman and Hogan were also provided with certain automobile allowances and employer matching contributions under our qualified retirement plan. Further, Mr. Cheetham was provided with an employer pension contribution (including a retirement supplement) equal to $44,329 and an automobile allowance.
Outstanding Equity Awards at 2015 Fiscal Year-End
The following table summarizes the outstanding equity awards held by our named executive officers as of June 30, 2015.
| Option Awards (1) | Stock Awards (2) | |||||||||||||||||||||||||||||||||
| Name (a) |
Number of Securities Underlying Unexercised Options (#) Exercisable (b) |
Number of Securities Underlying Unexercised Options (#) Unexercisable (c) |
Equity Incentive Plan Awards: Number of Securities Underlying Unexercised Unearned Options (#) (d) |
Option Exercise Price ($) (e) |
Option Expiration Date (f) |
Number of Units That Have Not Vested (#) (g) |
Market Value of Units That Have Not Vested ($) (h) |
Equity Incentive Plan Awards: Number of Unearned Units That Have Not Vested (#) (i) |
Equity Incentive Plan Awards: Market or Payout Value of Unearned Units That Have Not Vested ($) (j) |
|||||||||||||||||||||||||
| Marc Shore |
218,400 | (3) | 234,000 | (4) | n/a | n/a | 218,400 | (5) | 4,368,000 | — | — | |||||||||||||||||||||||
| William Hogan |
78,400 | (3) | 84,000 | (4) | n/a | n/a | 78,400 | (5) | 1,568,000 | — | — | |||||||||||||||||||||||
| Dennis Kaltman |
126,000 | (3) | 135,000 | (4) | n/a | n/a | 126,000 | (5) | 2,520,000 | — | — | |||||||||||||||||||||||
| Mike Cheetham |
33,750 | (6) | 833,028 | (7) | — | — | ||||||||||||||||||||||||||||
| (1) | The awards reported in these columns reflect the incentive units in Mustang Holdings granted to our named executive officers. We believe that, despite the fact that the incentive units do not require the payment of an exercise price, they are most similar economically to stock options, and as such, they are properly classified as “options” under the definition provided in Item 402(a)(6)(i) of Regulation S-K under the Securities Act as an instrument with an “option-like feature.” |
| (2) | The awards reported in these columns reflect the restricted common units in Mustang Holdings granted to our named executive officers. |
| (3) | Represents the number of incentive units in Mustang Holdings subject to time-based vesting that are held by the applicable named executive officer. The remaining unvested incentive units for each such named executive officer will vest in four equal annual installments beginning August 15, 2015. The incentive units are intended to be “profits interests” and have a distribution threshold of $10 per incentive unit. |
109
Table of Contents
| (4) | Represents the number of incentive units in Mustang Holdings subject to return-based vesting that are held by the applicable named executive officer. Fifty percent (50%) of such units will vest upon the achievement by funds advised by Madison Dearborn of an internal rate of return of at least 15% on its units in Mustang Holdings. An additional 50% of such units will vest upon the achievement by such funds of an internal rate of return of at least 20% on its units in Mustang Holdings. The incentive units are intended to be “profits interests” and have a distribution threshold of $10 per incentive unit. |
| (5) | Represents the number of restricted common units in Mustang Holdings subject to time-based vesting that are held by the applicable named executive officer. The remaining unvested restricted common units for each such named executive officer will vest in four equal annual installments beginning August 15, 2015. |
| (6) | Represents the number of unvested Class A Units in Chesapeake Holdings Limited held by Mr. Cheetham. Such Class A Units are no longer subject to time- or performance-based vesting, but remain subject to repurchase by Chesapeake Holdings Limited at cost. |
| (7) | Market value is denominated in British pounds sterling. Such value was converted to U.S. dollars at a conversion rate of U.S. $1.5822 per 1.00 British pound sterling. |
CEO Employment Agreement
Multi Packaging Solutions, Inc., one of our subsidiaries, and CF2 have entered into an employment agreement with Marc Shore, our current Chief Executive Officer. The agreement was entered into in February 2014 and has an initial term through August 15, 2018. The agreement entitles Mr. Shore to an initial base salary of $1,066,410 and an annual bonus opportunity of $200,000 at target, with the actual amount determined by the board of directors of CF2 (the “Parent Board”) based on the achievement of certain performance objectives and a maximum annual bonus of $500,000. Mr. Shore’s employment agreement also entitles him to an automobile allowance of up to $2,000 per month. Mr. Shore’s base salary and bonus earned in respect of the fiscal year ended June 30, 2015 exceeded the amounts required under his employment agreement.
In the event that Mr. Shore is terminated by us without “cause” or resigns for “good reason” (as such terms are defined below), subject to his timely execution of a release of claims in our favor, Mr. Shore is entitled to receive a pro-rata bonus for the year of termination and his annual base salary through the first anniversary of the date of termination. In addition, if Mr. Shore elects COBRA continuation of health coverage, we must pay the premiums of such coverage on a monthly basis for a period of 12 months after his termination.
The employment agreement contains restrictive covenants pursuant to which Mr. Shore has agreed to refrain from competing with us for a period of one year after his termination of employment or soliciting our employees or consultants following his termination of employment for a period of two years thereafter.
For purposes of Mr. Shore’s employment agreement, “cause” generally means Mr. Shore’s (i) conviction of a misdemeanor involving dishonesty, disloyalty or moral turpitude, or of a felony, (ii) commission of any willful act or omission involving fraud or material dishonesty, (iii) use of illegal drugs, repetitive abuse of other drugs or repetitive excess consumption of alcohol interfering with Mr. Shore’s performance of his duties, (iv) gross negligence or willful misconduct in connection with Mr. Shore’s duties, provided that Mr. Shore does not cure such misconduct within 30 days following receipt of written notice from us, (v) continued failure, whether willful, intentional or negligent, to perform substantially his duties, provided that Mr. Shore does not cure such failure within 30 days following receipt of written notice from us, (vi) a material misrepresentation in respect to the representations and warranties made under the employment agreement, or a material breach of any covenant, obligation or provision of the employment agreement, provided that Mr. Shore does not cure such breach within 30 days following receipt of written notice from us or (vii) a failure or refusal to follow a lawful directive of the Parent Board after the Parent Board gives Mr. Shore notice and a reasonable opportunity to cure his performance.
For purposes of Mr. Shore’s employment agreement, “good reason” generally means the occurrence of any of the following, without his consent: (i) our failure to pay any compensation or provide any benefits to which he is entitled under his employment agreement, (ii) a change in his title to a lesser title or a reduction in his responsibilities to a level
110
Table of Contents
materially inconsistent with the titles he holds, (iii) CF2 failing to cause Mr. Shore to be elected to the Parent Board, (iv) CF2 changing Mr. Shore’s principal place of work to a location other than in New York City, Westchester County, New York, or Fairfield County, Connecticut or (v) a sale of all or substantially all of our or CF2’s equity securities and/or assets to International Paper Company; provided that Mr. Shore must deliver to us written notice of his resignation for good reason within 45 days of the occurrence of such event, we do not cure the good reason within 45 days of receiving such written notice and Mr. Shore subsequently resigns within 30 days thereafter.
Separation Agreement
Mr. Cheetham entered into a separation agreement in connection with his termination of employment. Pursuant to the separation agreement, Mr. Cheetham received the amounts set forth in the “All Other Compensation” column of the Summary Compensation Table above, which include (i) cash payments in an aggregate amount equal to $1,049,933 and (ii) the value of recognition of one additional year of service for purposes of the Company’s defined benefit scheme (equal to $98,096). In addition, pursuant to the separation agreement, Chesapeake Holdings Ltd. and CEP III Chase S.à.r.l. forfeited any right to repurchase the vested portion of Mr. Cheetham’s Class A Units in Chesapeake Holdings Ltd. The separation agreement included a customary release of claims and confidentiality restrictions.
2015 Incentive Plan
In connection with this offering, we intend to adopt the 2015 Plan, subject to approval by our shareholders, under which we may grant cash and equity-based incentive awards to eligible service providers in order to attract, motivate and retain the talent for which we compete. The material terms of the 2015 Plan, as it is currently contemplated, are summarized below. Our board of directors is still in the process of developing, approving and implementing the 2015 Plan and, accordingly, this summary is subject to change.
Eligibility and Administration. Our employees, consultants and directors, and employees, consultants and directors of our subsidiaries, will be eligible to receive awards under the 2015 Plan. Following our initial public offering, the 2015 Plan will be administered by our Board of Directors, which may delegate its duties and responsibilities to one or more committees of our directors and/or officers (collectively, the “plan administrator”), subject to certain limitations that may be imposed under the 2015 Plan, Section 16 of the Exchange Act, stock exchange rules and other laws, as applicable. The plan administrator will have the authority to make all determinations and interpretations under, prescribe all forms for use with, and adopt rules for the administration of, the 2015 Plan, subject to its express terms and conditions. The plan administrator will also set the terms and conditions of all awards under the 2015 Plan, including any vesting and vesting acceleration conditions.
Limitation on Awards and Shares Available. An aggregate of common shares will initially be available for issuance under awards granted pursuant to the 2015 Plan. Shares issued under the 2015 Plan may be authorized but unissued shares, shares purchased in the open market or treasury shares.
If an award under the 2015 Plan is forfeited, expires or is settled for cash, any shares subject to such award may, to the extent of such forfeiture, expiration or cash settlement, be used again for new grants under the 2015 Plan. Awards granted under the 2015 Plan upon the assumption of, or in substitution for, awards authorized or outstanding under, and future awards granted under the 2015 Plan in respect of shares reserved, but not yet granted under, a qualifying equity plan maintained by an entity with which we enter into a merger or similar corporate transaction will not reduce the shares available for grant under the 2015 Plan, but will count against the maximum number of shares that may be issued upon the exercise of incentive stock options. The maximum aggregate number of common shares with respect to one or more awards granted to any one person pursuant to the 2015 Plan during any fiscal year that are intended to be “performance based compensation” within the meaning of Section 162(m) of the Code and are denominated in common shares is 1,000,000 and the maximum amount of cash that may be paid to any one person during any fiscal year with respect to one or more awards
111
Table of Contents
payable in cash and not denominated in common shares is $5,000,000, provided that the foregoing limit (a) shall be multiplied by two with respect to awards denominated in shares and awards paid in cash to any person during the first fiscal year in which he or she commences employment and (b) shall not apply prior to the earliest of (i) the first material modification to the 2015 Plan, (ii) the issuance of all common shares reserved for issuance under the 2015 Plan, (iii) the first annual shareholders meeting after the close of the third calendar year following the calendar year of the initial public offering or (iv) such other date required by Section 162(m) of the Code. In addition, the maximum aggregate grant date fair value as determined in accordance with FASB ASC Topic 718 (or any successor thereto), of awards granted to any non-employee director for services as a director pursuant to the 2015 Plan during any fiscal year may not exceed $500,000 (or, in the fiscal year of any director’s initial service, $750,000). The plan administrator may, however, make exceptions to such limit on director compensation in extraordinary circumstances, subject to the limitations in the 2015 Plan.
Awards. The 2015 Plan provides for the grant of stock options, including incentive stock options (“ISOs”), and nonqualified stock options (“NSOs”), restricted stock, dividend equivalents, restricted stock units (“RSUs”), stock appreciation rights (“SARs”), and other stock or cash-based awards. No determination has been made as to the types or amounts of awards that will be granted to specific individuals pursuant to the 2015 Plan. Certain awards under the 2015 Plan may constitute or provide for a deferral of compensation, subject to Section 409A of the Code, which may impose additional requirements on the terms and conditions of such awards. All awards under the 2015 Plan will be set forth in award agreements, which will detail the terms and conditions of the awards, including any applicable vesting and payment terms and post-termination exercise limitations. Awards other than cash awards generally will be settled in our common shares, but the plan administrator may provide for cash settlement of any award. A brief description of each award type follows.
| • | Stock Options and SARs. Stock options provide for the purchase of our common shares in the future at an exercise price set on the grant date. ISOs, by contrast to NSOs, may provide tax deferral beyond exercise and favorable capital gains tax treatment to their holders if certain holding period and other requirements of the Code are satisfied. SARs entitle their holder, upon exercise, to receive from us an amount equal to the appreciation of the shares subject to the award between the grant date and the exercise date. The plan administrator will determine the number of shares covered by each option and SAR, the exercise price of each option and SAR and the conditions and limitations applicable to the exercise of each option and SAR. The exercise price of a stock option or SAR will not be less than 100% of the fair market value of the underlying share on the grant date (or 110% in the case of ISOs granted to certain significant stockholders), except with respect to certain substitute awards granted in connection with a corporate transaction. The term of a stock option or SAR may not be longer than ten years (or five years in the case of ISOs granted to certain significant stockholders). The maximum aggregate number of common shares with respect to one or more options or SARs that may be granted to any one person during any fiscal year of the Company will be . |
| • | Restricted Stock and RSUs. Restricted stock is an award of nontransferable common shares that remain forfeitable unless and until specified conditions are met, and which may be subject to a purchase price. RSUs are contractual promises to deliver our common shares in the future, which may also remain forfeitable unless and until specified conditions are met, and may be accompanied by the right to receive the equivalent value of dividends paid on our common shares prior to the delivery of the underlying shares. Delivery of the shares underlying RSUs may be deferred on a mandatory basis or at the election of the participant. Conditions applicable to restricted stock and RSUs may be based on continuing service, the attainment of performance goals and/or such other conditions as the plan administrator may determine. Dividends or dividend equivalents with respect to an award of restricted stock or RSUs, as applicable, with performance-based vesting shall either (i) not be paid or credited or (ii) be accumulated and subject to vesting to the same extent as the related restricted shares or RSUs. Payment of any such dividends or dividend equivalents shall be made as soon as administratively practicable following the time the applicable award vests and become non-forfeitable or such later time as may be set forth in an award agreement. |
112
Table of Contents
| • | Other Stock or Cash-Based Awards. Other stock or cash-based awards are awards of cash, fully vested common shares and other awards valued wholly or partially by referring to, or otherwise based on, our common shares or other property. Other stock or cash-based awards may be granted to participants and may also be available as a payment form in the settlement of other awards, as standalone payments and as payment in lieu of compensation to which a participant is otherwise entitled. The plan administrator will determine the terms and conditions of other stock or cash-based awards, which may include vesting conditions based on continued service, performance and/or other conditions. |
Performance Criteria. The plan administrator may select performance criteria for an award to establish performance goals for a performance period. Performance criteria under the 2015 Plan may include, but are not limited to, the following: net earnings or losses (either before or after one or more of interest, taxes, depreciation, amortization, and non-cash equity-based compensation expense); gross or net sales or revenue or sales or revenue growth; net income (either before or after taxes) or adjusted net income; profits (including but not limited to gross profits, net profits, profit growth, net operation profit or economic profit), profit return ratios or operating margin; budget or operating earnings (either before or after taxes or before or after allocation of corporate overhead and bonus); cash flow (including operating cash flow and free cash flow or cash flow return on capital); return on assets; return on capital or invested capital; cost of capital; return on shareholders’ equity; total shareholder return; return on sales; costs, reductions in costs and cost control measures; expenses; working capital; earnings or loss per share; adjusted earnings or loss per share; price per share or dividends per share (or appreciation in or maintenance of such price or dividends); regulatory achievements or compliance; implementation, completion or attainment of objectives relating to research, development, regulatory, commercial, or strategic milestones or developments; market share; economic value or economic value added models; division, group or corporate financial goals; customer satisfaction/growth; customer service; employee satisfaction; recruitment and maintenance of personnel; human resources management; supervision of litigation and other legal matters; strategic partnerships and transactions; financial ratios (including those measuring liquidity, activity, profitability or leverage); debt levels or reductions; sales-related goals; financing and other capital raising transactions; cash on hand; acquisition activity; investment sourcing activity; and marketing initiatives, any of which may be measured in absolute terms or as compared to any incremental increase or decrease. Such performance goals also may be based solely by reference to the company’s performance or the performance of a subsidiary, division, business segment or business unit of the company or a subsidiary, or based upon performance relative to performance of other companies or upon comparisons of any of the indicators of performance relative to performance of other companies. When determining performance goals, the plan administrator may provide for exclusion of the impact of an event or occurrence which the plan administrator determines should appropriately be excluded, including, without limitation, non-recurring charges or events, acquisitions or divestitures, changes in the corporate or capital structure, events unrelated to the business or outside of the control of management, foreign exchange considerations, and legal, regulatory, tax or accounting changes.
Certain Transactions. In connection with certain corporate transactions and events affecting our common shares, including a change in control, or change in any applicable laws or accounting principles, the plan administrator has broad discretion to take action under the 2015 Plan to prevent the dilution or enlargement of intended benefits, facilitate the transaction or event or give effect to the change in applicable laws or accounting principles. This includes canceling awards for cash or property, accelerating the vesting of awards, providing for the assumption or substitution of awards by a successor entity, adjusting the number and type of shares subject to outstanding awards and/or with respect to which awards may be granted under the 2015 Plan and replacing or terminating awards under the 2015 Plan. In addition, in the event of certain non-reciprocal transactions with our shareholders, the plan administrator will make equitable adjustments to the 2015 Plan and outstanding awards as it deems appropriate to reflect the transaction.
Claw-Back Provisions, Transferability and Participant Payments. The plan administrator may modify award terms, establish sub-plans and/or adjust other terms and conditions of awards, subject to the share limits described above. All awards will be subject to the provisions of any claw-back policy implemented by us to the
113
Table of Contents
extent set forth in such claw-back policy and/or in the applicable award agreement. With limited exceptions for estate planning, domestic relations orders, certain beneficiary designations and the laws of descent and distribution, awards under the 2015 Plan are generally non-transferable prior to vesting and are exercisable only by the participant. With regard to tax withholding, exercise price and purchase price obligations arising in connection with awards under the 2015 Plan, the plan administrator may, in its discretion, accept cash, wire transfer or check, shares of our common stock that meet specified conditions, a promissory note, a “market sell order” or such other consideration as it deems suitable or any combination of the foregoing.
Plan Amendment and Termination. Our Board of Directors may amend awards or amend or terminate the 2015 Plan at any time; however, no amendment, other than an amendment that increases the number of shares available under the 2015 Plan, may materially and adversely affect an award outstanding under the 2015 Plan without the consent of the affected participant and shareholder approval will be obtained for any amendment to the extent necessary to comply with applicable laws and stock exchange rules. Further, the plan administrator cannot, without the approval of our shareholders, (a) amend any outstanding stock option or SAR to reduce its exercise price per share, (b) cancel any outstanding stock option or SAR in exchange for cash or another award under the 2015 Plan when the exercise price per share of such stock option or SAR exceeds its fair market value or (c) otherwise reprice any option or SAR. The 2015 Plan will remain in effect until the tenth anniversary of its effective date, unless earlier terminated by our Board of Directors. No awards may be granted under the 2015 Plan after its termination.
Director Compensation
Directors who are our employees receive no additional compensation for their service on our Board of Directors or its committees. We have not historically, and in the fiscal year ended June 30, 2015 we did not, pay compensation to our directors.
114
Table of Contents
CERTAIN RELATIONSHIPS AND RELATED PARTY TRANSACTIONS
Our Board of Directors expects to adopt a written statement of policy, effective upon completion of this offering, for the evaluation of and the approval, disapproval and monitoring of transactions involving us and “related persons.” For the purposes of the policy, “related persons” will include our executive officers, directors and director nominees or their immediate family members, or shareholders owning five percent or more of our outstanding common shares and their immediate family members.
Consulting Services Agreement with Carlyle
Chesapeake Finance 1 Limited, which currently holds a 50% interest in the Company, and CIM Global, L.L.C., an affiliate of Carlyle, are parties to a consulting services agreement relating to the provision of certain financial and strategic advisory services and consulting services. We paid a one-time fee in the amount of $5.0 million upon consummation of the Merger for transactional advisory and other services.
Shareholders’ Agreement
Upon the effectiveness of this registration statement, we expect to enter into a shareholders’ agreement with affiliates of Carlyle and Madison Dearborn. Pursuant to the shareholders’ agreement, our Board of Directors will initially consist of seven members, with affiliates of Carlyle and Madison Dearborn each having the right to designate two members of our Board of Directors. Each of Carlyle and Madison Dearborn, together with their respective affiliates, will agree to vote their shares in favor of such designees.
In addition, we have granted affiliates of Carlyle and Madison Dearborn the right to cause us, in certain instances, at our expense, to file registration statements under the Securities Act covering resales of our common shares held by affiliates of Carlyle and Madison Dearborn or to piggyback on such registration statements in certain circumstances. These shares will represent approximately % of our common shares after this offering, or % if the underwriters exercise their option to purchase additional common shares in full. These common shares also may be sold under Rule 144 under the Securities Act, depending on their holding period and subject to restrictions in the case of shares held by persons deemed to be our affiliates. The shareholders’ agreement will also require us to indemnify certain of our shareholders and their affiliates in connection with any registrations of our securities.
Indemnification Agreements
Prior to the completion of this offering, we will enter into indemnification agreements with each of our directors and certain of our officers. These indemnification agreements provide those directors and officers with contractual rights to indemnification and expense advancement which are, in some cases, broader than the specific indemnification provisions contained under Bermuda law. We believe that these indemnification agreements are, in form and substance, substantially similar to those commonly entered into in transactions of like size and complexity sponsored by private equity firms.
Employment Agreements
See “Executive and Director Compensation—CEO Employment Agreement” for information regarding the employment agreement that we have entered into with our Chief Executive Officer.
Net sales to Portfolio Companies of Funds Affiliated with Carlyle or Madison Dearborn
We made net sales of packaging-related products in the amounts of approximately (i) $2.0 million for the year ended June 30, 2013, $1.9 million for the combined year ended June 30, 2014 and $0.9 million for the year ended June 30, 2015 to NBTY, Inc., a subsidiary of the Carlyle portfolio company, Alphabet Holding Company, Inc.;
115
Table of Contents
(ii) $0.4 million for each of the year ended June 30, 2013 and the combined year ended June 30, 2014 and $0.6 million for the year ended June 30, 2015 to CDW Corporation, a Madison Dearborn portfolio company; and (iii) $0.1 million for the combined year ended June 30, 2014 and $0.2 million for the year ended June 30, 2015 to Sage UK Limited, a subsidiary of the Madison Dearborn portfolio company, Sage Products Holdings, LLC. Additionally, we purchased services in the amount of approximately $0.1 million for each of the combined year ended June 30, 2014 and for the year ended June 30, 2015 from Duff & Phelps Corporation, a Carlyle portfolio company.
116
Table of Contents
PRINCIPAL AND SELLING SHAREHOLDERS
The following table sets forth information with respect to the beneficial ownership of our common shares as of , 2015, by:
| • | each person known to own beneficially more than 5% of our share capital; |
| • | each of our directors; |
| • | each of our named executive officers; |
| • | all of our directors and executive officers as a group; and |
| • | each of our other selling shareholders. |
The amounts and percentages of common shares beneficially owned are reported on the basis of SEC regulations governing the determination of beneficial ownership of securities. Under SEC rules, a person is deemed to be a “beneficial” owner of a security if that person has or shares voting power or investment power, which includes the power to dispose of or to direct the disposition of such security. A person is also deemed to be a beneficial owner of any securities of which that person has a right to acquire beneficial ownership within 60 days. Securities that can be so acquired are deemed to be outstanding for purposes of computing any other person’s percentage. Under these rules, more than one person may be deemed to be a beneficial owner of securities as to which such person has no economic interest.
The numbers listed below are based on common shares outstanding as of , 2015, after giving effect to the Reorg Transactions and the completion of the common share split as if such transactions occurred on that date. As of , 2015, certain affiliates of Carlyle and Madison Dearborn owned approximately % and %, respectively, of our common shares and are the only two holders of record.
Except as otherwise indicated in these footnotes, each of the beneficial owners listed has, to our knowledge, sole voting and investment power with respect to the issued share capital and the business address of each such beneficial owner is c/o Multi Packaging Solutions International Limited, 3150 E 52nd St., 28th Floor, New York, New York 10022.
|
Common Shares of Beneficially Owned Prior |
Common Shares to be Sold in this Offering |
Common Shares of Multi Packaging Solutions International Limited Beneficially Owned After the Offering |
||||||||||||||||||||||||||
|
Excluding Exercise of |
Including Exercise of Option to Purchase Additional Common Shares |
|||||||||||||||||||||||||||
| Name of Beneficial Owner |
Number | Percent | Number | Percent | Number | Percent | ||||||||||||||||||||||
| Principal Shareholders |
||||||||||||||||||||||||||||
| Investments funds affiliated with The Carlyle Group (1) |
||||||||||||||||||||||||||||
| Madison Dearborn (2) |
||||||||||||||||||||||||||||
| Executive Officers and Directors |
||||||||||||||||||||||||||||
| Marc Shore (3) |
— | — | — | — | — | — | — | |||||||||||||||||||||
| Dennis Kaltman (3) |
— | — | — | — | — | — | — | |||||||||||||||||||||
| William H. Hogan (3) |
— | — | — | — | — | — | — | |||||||||||||||||||||
| Rick Smith (4) |
||||||||||||||||||||||||||||
| Zeina Bain (1) |
— | — | — | — | — | — | — | |||||||||||||||||||||
| George Bayly |
— | — | — | — | — | — | — | |||||||||||||||||||||
| Richard H. Copans (2) |
— | — | — | — | — | — | — | |||||||||||||||||||||
| Eric Kump (1) |
— | — | — | — | — | — | — | |||||||||||||||||||||
| Gary McGann |
— | — | — | — | — | — | — | |||||||||||||||||||||
| Thomas S. Souleles (2) |
— | — | — | — | — | — | — | |||||||||||||||||||||
| All executive officers and directors as a group (10 persons) |
||||||||||||||||||||||||||||
117
Table of Contents
|
Common Shares of Beneficially Owned Prior |
Common Shares to be Sold in this Offering |
Common Shares of Multi Packaging Solutions International Limited Beneficially Owned After the Offering | ||||||||||||
|
Excluding Exercise of |
Including Exercise of Option to Purchase Additional Common Shares | |||||||||||||
| Name of Beneficial Owner |
Number | Percent | Number | Percent | Number | Percent | ||||||||
| Other Selling Shareholders |
||||||||||||||
| Chase Manco, L.P. (5) |
||||||||||||||
| Mark Wenham (6) |
||||||||||||||
| Timothy Whitfield (7) |
||||||||||||||
| Elizabeth Whitfield (8) |
||||||||||||||
| Mike Cheetham (9) |
||||||||||||||
| Jacqueline Cheetham (10) |
||||||||||||||
| Lindsay Smith (11) |
||||||||||||||
| All other selling shareholders |
||||||||||||||
| * | Denotes less than 1.0% of beneficial ownership. |
| (1) | Includes common shares held by CEP III Chase S.à r.l. (“CEP III”). Carlyle Group Management L.L.C. is the general partner of The Carlyle Group L.P., which is a publicly traded entity listed on NASDAQ. The Carlyle Group L.P. is the managing member of Carlyle Holdings II GP L.L.C., which is the general partner of Carlyle Holdings II L.P., which is the general partner of TC Group Cayman Investment Holdings, L.P., which is the general partner of TC Group Cayman Investment Holdings Sub L.P., which is the sole shareholder of CEP III Managing GP Holdings, Ltd., which is the general partner of CEP III Managing GP, L.P., which is the general partner of Carlyle Europe Partners III, L.P., which is the sole shareholder of CEP III Participations, S.à r.l., SICAR, which is the sole shareholder of CEP III. |
Voting and investment determinations with respect to the common shares held by the CEP III are made by an investment committee of CEP III Managing GP, L.P. comprised of Daniel D’Aniello, William Conway, David Rubenstein, Louis Gerstner, Allan Holt, Kewsong Lee and Thomas Mayrhofer. Each member of the investment committees disclaims beneficial ownership of such common shares.
The address for each of TC Group Cayman Investment Holdings, L.P. and TC Group Cayman Investment Holdings Sub L.P. is c/o Intertrust Corporate Services, 190 Elgin Avenue, George Town, Grand Cayman, KY1-9005, Cayman Islands. The address for CEP III and CEP III Participations, S.à r.l., SICAR is c/o The Carlyle Group, 2, avenue Charles de Gaulle, 4th floor, L -1653 Luxembourg, Luxembourg. The address of each of the other persons or entities named in this footnote is c/o The Carlyle Group, 1001 Pennsylvania Ave. NW, Suite 220 South, Washington, D.C. 20004-2505.
| (2) | Includes common shares held by Mustang Investment Holdings L.P. (“Mustang Holdings”). MDP Global Investors II Limited (“MDP Limited”) is the general partner of MDP VI Global GP, LP, which in turn is the general partner of each of MDCP VI-A Global Investments LP (“Global VI-A”), MDCP VI-C Global Investments LP (“Global VI-C”) and MDCP Executive VI-A Global Investments LP (“Global Executive VI-A”, together with Global VI-A and Global VI-C, the “MDP Global Funds”). MDP Limited is also the general partner of Mustang Holdings, and each of the MDP Global Funds, along with certain other persons, is a limited partner of Mustang Holdings. |
Voting and investment determinations by MDP Limited are made by a majority vote of the members of MDP Limited. Each member of MDP Limited disclaims beneficial ownership of such shares, except to the extent of its pecuniary interest therein.
The address for Mustang S.à r.l. is c/o Alter Domus Luxembourg S.à r.l., 5, rue Guillaume Kroll, L-1882 Luxembourg, Grand Duchy of Luxembourg. The address for Mustang Holdings, each of the MDP Global Funds, and MDP Limited is c/o Maples and Calder, PO Box 309, Ugland House, Grand Cayman, KY1-1104, Cayman Islands.
| (3) | Messrs. Shore, Kaltman and Hogan are investors in Mustang Holdings. None of the foregoing persons has direct or indirect voting or dispositive power with respect to our common shares held of record by Mustang Holdings. Messrs. Shore, Kaltman and Hogan will receive their respective pro rata share of the proceeds from the sale of common shares by Mustang Holdings in this offering based on their respective partnership unit interests in Mustang Holdings. |
118
Table of Contents
| (4) | Mr. Smith currently serves as our Executive Vice President. |
| (5) | Includes common shares held by Chase Manco, L.P. (“Manco LP”) and common shares held by CEP III Chase S.à r.l. (“CEP III Chase”). Carlyle Group Management L.L.C. is the general partner of The Carlyle Group L.P., which is a publicly traded entity listed on NASDAQ. The Carlyle Group L.P. is the managing member of Carlyle Holdings II GP L.L.C., which is the general partner of Carlyle Holdings II L.P., which is the general partner of TC Group Cayman Investment Holdings, L.P., which is the general partner of TC Group Cayman Investment Holdings Sub L.P., which is the sole shareholder of CEP III Managing GP Holdings, Ltd., which is the general partner of CEP III Managing GP, L.P., which is the general partner of Carlyle Europe Partners III, L.P., which is the sole shareholder of CEP III Participations, S.à r.l. SICAR, which is the sole shareholder of CEP III Chase, which is the sole shareholder of Chase Manco, G.P. Limited, which is the general partner of Manco LP. |
Voting and investment determinations with respect to the common shares held by Manco LP and CEP III Chase are made by an investment committee of CEP III Managing GP, L.P. comprised of Daniel D’Aniello, William Conway, David Rubenstein, Louis Gerstner, Allan Holt, Kewsong Lee and Thomas Mayrhofer. Each member of the investment committees disclaims beneficial ownership of such common shares. The economic interests in the limited partnership units of Manco LP are held by 41 of our employees and they will each receive their respective pro rata share of the proceeds from the sale of common shares by Manco LP in this offering based on their respective limited partnership unit interests in Manco LP.
The address for each of TC Group Cayman Investment Holdings, L.P. and TC Group Cayman Investment Holdings Sub L.P. is c/o Intertrust Corporate Services, 190 Elgin Avenue, George Town, Grand Cayman, KY1-9005, Cayman Islands. The address for CEP III Participations, S.à r.l. SICAR and CEP III Chase is c/o The Carlyle Group, 2, avenue Charles de Gaulle, 4th floor, L -1653 Luxembourg, Luxembourg. The address for each of Chase Manco, G.P. Limited and Manco LP is 1st and 2nd Floors, Elizabeth House, Les Ruettes Brayes, St. Peter Port, Guernsey GY1 1EW. The address of each of the other persons or entities named in this footnote is c/o The Carlyle Group, 1001 Pennsylvania Ave. NW, Suite 220 South, Washington, D.C. 20004-2505.
| (6) | Mr. Wenham currently serves as Executive Vice President – Healthcare Europe. |
| (7) | Mr. Whitfield currently serves as Senior Vice President – Consumer Branded Europe. |
| (8) | Mrs. Whitfield is married to Mr. Whitfield. |
| (9) | Mr. Cheetham previously served as President – Healthcare. |
| (10) | Mrs. Cheetham is married to Mr. Cheetham. |
| (11) | Mrs. Smith is married to Mr. Smith. |
119
Table of Contents
The following is a description of our share capital and the material provisions of our amended memorandum of association as anticipated to be in effect upon the closing of this offering, and other agreements to which we and our shareholders are parties. The following is only a summary and is qualified by applicable law and by the provisions of the amended memorandum of association and other agreements, copies of which are available as set forth under the caption entitled “Where You Can Find More Information.”
Issued capital
We are an exempted company incorporated under the laws of Bermuda. We are registered with the Registrar of Companies in Bermuda under registration number 50386. We were incorporated on June 19, 2015. Our registered office is located at Clarendon House, 2 Church Street, Hamilton HM 11, Bermuda.
The objects of our business are unrestricted, and the Company has the capacity of a natural person. We can therefore undertake activities without restriction on our capacity.
Since our incorporation, other than an increase in our authorized share capital to 1,000,000,000 shares, there have been no material changes to our share capital, mergers, amalgamations or consolidations of us or any of our subsidiaries, no material changes in the mode of conducting our business, no material changes in the types of products produced or services rendered. There have been no bankruptcy, receivership or similar proceedings with respect to us or our subsidiaries.
There have been no public takeover offers by third parties for our shares nor any public takeover offers by us for the shares of another company that have occurred during the last or current financial years.
We have applied for listing of our common shares on the NYSE under the symbol “MPSX.”
Initial settlement of our common shares will take place on the closing date of this offering through The Depository Trust Company (“DTC”) in accordance with its customary settlement procedures for equity securities registered through DTC’s book-entry transfer system. Each person beneficially owning common shares registered through DTC must rely on the procedures thereof and on institutions that have accounts therewith to exercise any rights of a holder of the common shares.
Share Capital
Immediately following the completion of this offering, our authorized share capital will consist of issued common shares, par value $1.00 per share, and undesignated shares, par value $1.00 per share that our Board of Directors is authorized to designate from time to time as common shares or as preference shares. Upon completion of this offering, there will be common shares issued and outstanding and no preference shares issued and outstanding. All of our issued and outstanding common shares prior to completion of this offering are and will be fully paid.
Pursuant to our amended and restated bye-laws, subject to the requirements of any stock exchange on which our shares will be listed and to any resolution of the shareholders to the contrary, our Board of Directors is authorized to issue any of our authorized but unissued shares. There are no limitations on the right of non-Bermudians or non-residents of Bermuda to hold or vote our shares.
Common Shares
Holders of common shares have no pre-emptive, redemption, conversion or sinking fund rights. Holders of common shares are entitled to one vote per share on all matters submitted to a vote of holders of common shares.
120
Table of Contents
Unless a different majority is required by law or by our amended and restated bye-laws, resolutions to be approved by holders of common shares require approval by a simple majority of votes cast at a meeting at which a quorum is present.
In the event of our liquidation, dissolution or winding up, the holders of common shares are entitled to share equally and ratably in our assets, if any, remaining after the payment of all of our debts and liabilities, subject to any liquidation preference on any issued and outstanding preference shares.
Preference Shares
Pursuant to Bermuda law and our amended and restated bye-laws, our Board of Directors may, by resolution, establish one or more series of preference shares having such number of shares, designations, dividend rates, relative voting rights, conversion or exchange rights, redemption rights, liquidation rights and other relative participation, optional or other special rights, qualifications, limitations or restrictions as may be fixed by the Board of Directors without any further shareholder approval. Such rights, preferences, powers and limitations, as may be established, could have the effect of discouraging an attempt to obtain control of the company.
Dividend Rights
Under Bermuda law, a company may not declare or pay dividends if there are reasonable grounds for believing that: (i) the company is, or would after the payment be, unable to pay its liabilities as they become due; or (ii) that the realizable value of its assets would thereby be less than its liabilities. Under our amended and restated bye-laws, each common share is entitled to dividends if, as and when dividends are declared by our Board of Directors, subject to any preferred dividend right of the holders of any preference shares.
Any cash dividends payable to holders of our common shares listed on the NYSE will be paid to American Stock Transfer & Trust Company, LLC, our paying agent in the United States for disbursement to those holders.
Variation of Rights
If at any time we have more than one class of shares, the rights attaching to any class, unless otherwise provided for by the terms of issue of the relevant class, may be varied either: (i) with the consent in writing of the holders of 75% of the issued shares of that class; or (ii) with the sanction of a resolution passed by a majority of the votes cast at a general meeting of the relevant class of shareholders at which a quorum consisting of at least two persons holding or representing one-third of the issued shares of the relevant class is present. Our amended and restated bye-laws specify that the creation or issue of shares ranking equally with existing shares will not, unless expressly provided by the terms of issue of existing shares, vary the rights attached to existing shares. In addition, the creation or issue of preference shares ranking prior to common shares will not be deemed to vary the rights attached to common shares or, subject to the terms of any other class or series of preference shares, to vary the rights attached to any other class or series of preference shares.
Transfer of Shares
Our Board of Directors may, in its absolute discretion and without assigning any reason, refuse to register the transfer of a share on the basis that it is not fully paid. Our Board of Directors may also refuse to recognize an instrument of transfer of a share unless it is accompanied by the relevant share certificate and such other evidence of the transferor’s right to make the transfer as our Board of Directors shall reasonably require. Subject to these restrictions, a holder of common shares may transfer the title to all or any of his common shares by completing a form of transfer in the form set out in our amended and restated bye-laws (or as near thereto as circumstances permit) or in such other common form as our Board of Directors may accept. The instrument of transfer must be signed by the transferor and transferee, although in the case of a fully paid share our Board of Directors may accept the instrument signed only by the transferor.
121
Table of Contents
Where our shares are listed or admitted to trading on any appointed stock exchange, such as the NYSE, they will be transferred in accordance with the rules and regulations of such exchange.
Meetings of Shareholders
Under Bermuda law, a company is required to convene at least one general meeting of shareholders each calendar year, which we refer to as the annual general meeting. However, the shareholders may by resolution waive this requirement, either for a specific year or period of time, or indefinitely. When the requirement has been so waived, any shareholder may, on notice to the company, terminate the waiver, in which case an annual general meeting must be called. We have chosen not to waive the convening of an annual general meeting.
Bermuda law provides that a special general meeting of shareholders may be called by the Board of Directors of a company and must be called upon the request of shareholders holding not less than 10% of the paid-up capital of the company carrying the right to vote at general meetings. Bermuda law also requires that shareholders be given at least five days’ advance notice of a general meeting, but the accidental omission to give notice to any person does not invalidate the proceedings at a meeting. Our amended and restated bye-laws provide that our Board of Directors may convene an annual general meeting and the chairman or a majority of our directors then in office may convene a special general meeting. Under our amended and restated bye-laws, at least 14 days’ notice of an annual general meeting or ten days’ notice of a special general meeting must be given to each shareholder entitled to vote at such meeting. This notice requirement is subject to the ability to hold such meetings on shorter notice if such notice is agreed: (i) in the case of an annual general meeting by all of the shareholders entitled to attend and vote at such meeting; or (ii) in the case of a special general meeting by a majority in number of the shareholders entitled to attend and vote at the meeting holding not less than 95% in nominal value of the shares entitled to vote at such meeting. Subject to the rules of the NYSE, the quorum required for a general meeting of shareholders is two or more persons present in person at the start of the meeting and representing in person or by proxy in excess of 50% of all issued and outstanding common shares.
Access to Books and Records and Dissemination of Information
Members of the general public have a right to inspect the public documents of a company available at the office of the Registrar of Companies in Bermuda. These documents include a company’s memorandum of association, including its objects and powers, and certain alterations to the memorandum of association. The shareholders have the additional right to inspect the bye-laws of the company, minutes of general meetings and the company’s audited financial statements, which must be presented in the annual general meeting. The register of members of a company is also open to inspection by shareholders and by members of the general public without charge. The register of members is required to be open for inspection for not less than two hours in any business day (subject to the ability of a company to close the register of members for not more than thirty days in a year). A company is required to maintain its share register in Bermuda but may, subject to the provisions of the Companies Act establish a branch register outside of Bermuda. A company is required to keep at its registered office a register of directors and officers that is open for inspection for not less than two hours in any business day by members of the public without charge. Bermuda law does not, however, provide a general right for shareholders to inspect or obtain copies of any other corporate records.
Election and Removal of Directors
Our amended and restated bye-laws provide that our Board of Directors shall consist of such number of directors as the Board of Directors may determine. After this offering, our Board of Directors will consist of seven directors. Our Board of Directors is divided into three classes that are, as nearly as possible, of equal size. Each class of directors is elected for a three-year term of office, but the terms are staggered so that the term of only one class of directors expires at each annual general meeting. The initial terms of the Class I, Class II and Class III directors will expire in 2016, 2017 and 2018, respectively. At each succeeding annual general meeting, successors to the class of directors whose term expires at the annual general meeting will be elected for a three-year term.
122
Table of Contents
A shareholder holding not less than % in nominal value of the common shares in issue may propose for election as a director someone who is not an existing director or is not proposed by our Board of Directors. Where a Director is to be elected at an annual general meeting, notice of any such proposal for election must be given not less than 90 days nor more than 120 days before the anniversary of the last annual general meeting prior to the giving of the notice or, in the event the annual general meeting is called for a date that is not less than 30 days before or after such anniversary the notice must be given not later than ten days following the earlier of the date on which notice of the annual general meeting was posted to shareholders or the date on which public disclosure of the date of the annual general meeting was made. Where a Director is to be elected at a special general meeting, that notice must be given not later than seven days following the earlier of the date on which notice of the special general meeting was posted to shareholders or the date on which public disclosure of the date of the special general meeting was made.
For so long as investment funds affiliated with Carlyle and Madison Dearborn own more than 50% of the common shares in issue, collectively, a director may be removed with or without cause by the shareholders, provided notice of the shareholders meeting convened to remove the director is given to the director. The notice must contain a statement of the intention to remove the director and a summary of the facts justifying the removal and must be served on the director not less than 14 days before the meeting. The director is entitled to attend the meeting and be heard on the motion for his removal.
Once investment funds affiliated with Carlyle and Madison Dearborn cease to own more than 50% of the common shares in issue, collectively, a director may be removed, only with cause, by the shareholders, provided notice of the shareholders meeting convened to remove the director is given to the director. The notice must contain a statement of the intention to remove the director and a summary of the facts justifying the removal and must be served on the director not less than 14 days before the meeting. The director is entitled to attend the meeting and be heard on the motion for his removal.
Proceedings of Board of Directors
Our amended and restated bye-laws provide that our business is to be managed and conducted by our Board of Directors. Bermuda law permits individual and corporate directors and there is no requirement in our bye-laws or Bermuda law that directors hold any of our shares. There is also no requirement in our amended and restated bye-laws or Bermuda law that our directors must retire at a certain age.
The compensation of our directors is determined by the Board of Directors, and there is no requirement that a specified number or percentage of “independent” directors must approve any such determination. Our directors may also be paid all travel, hotel and other reasonable out-of-pocket expenses properly incurred by them in connection with our business or their duties as directors.
A director who discloses a direct or indirect interest in any contract or arrangement with us as required by Bermuda law is not entitled to vote in respect of any such contract or arrangement in which he or she is interested unless the chairman of the relevant meeting of the Board of Directors determines that such director is not disqualified from voting.
Indemnification of Directors and Officers
Section 98 of the Companies Act provides generally that a Bermuda company may indemnify its directors, officers and auditors against any liability which by virtue of any rule of law would otherwise be imposed on them in respect of any negligence, default, breach of duty or breach of trust, except in cases where such liability arises from fraud or dishonesty of which such director, officer or auditor may be guilty in relation to the company. Section 98 further provides that a Bermuda company may indemnify its directors, officers and auditors against any liability incurred by them in defending any proceedings, whether civil or criminal, in which judgment is awarded in their favor or in which they are acquitted or granted relief by the Supreme Court of Bermuda pursuant to Section 281 of the Companies Act.
123
Table of Contents
Our amended and restated bye-laws provide that we shall indemnify our officers and directors in respect of their actions and omissions, except in respect of their fraud or dishonesty, and that we shall advance funds to our officers and directors for expenses incurred in their defense upon receipt of an undertaking to repay the funds if any allegation of fraud or dishonesty is proved. Our amended and restated bye-laws provide that the shareholders waive all claims or rights of action that they might have, individually or in right of the company, against any of the company’s directors or officers for any act or failure to act in the performance of such director’s or officer’s duties, except in respect of any fraud or dishonesty of such director or officer. Section 98A of the Companies Act permits us to purchase and maintain insurance for the benefit of any officer or director in respect of any loss or liability attaching to him in respect of any negligence, default, breach of duty or breach of trust, whether or not we may otherwise indemnify such officer or director. We have purchased and maintain a directors’ and officers’ liability policy for such purpose.
Amendment of Memorandum of Association and Bye-laws
Bermuda law provides that the memorandum of association of a company may be amended by a resolution passed at a general meeting of shareholders. Our amended and restated bye-laws provide that no bye-law shall be rescinded, altered or amended, and no new bye-law shall be made, unless it shall have been approved by a resolution of our Board of Directors and by a resolution of our shareholders including the affirmative vote of a majority of all votes entitled to be cast on the resolution.
Under Bermuda law, the holders of an aggregate of not less than 20% in par value of a company’s issued share capital or any class thereof have the right to apply to the Supreme Court of Bermuda for an annulment of any amendment of the memorandum of association adopted by shareholders at any general meeting, other than an amendment that alters or reduces a company’s share capital as provided in the Companies Act. Where such an application is made, the amendment becomes effective only to the extent that it is confirmed by the Supreme Court of Bermuda. An application for an annulment of an amendment of the memorandum of association must be made within 21 days after the date on which the resolution altering the company’s memorandum of association is passed and may be made on behalf of persons entitled to make the application by one or more of their number as they may appoint in writing for the purpose. No application may be made by shareholders voting in favor of the amendment.
Amalgamations and Mergers
The amalgamation or merger of a Bermuda company with another company or corporation (other than certain affiliated companies) requires the amalgamation or merger agreement to be approved by the company’s Board of Directors and by its shareholders. Unless the company’s bye-laws provide otherwise, the approval of 75% of the shareholders voting at such meeting is required to approve the amalgamation or merger agreement, and the quorum for such meeting must be two or more persons holding or representing more than one-third of the issued shares of the company.
Under Bermuda law, in the event of an amalgamation or merger of a Bermuda company with another company or corporation, a shareholder of the Bermuda company who did not vote in favor of the amalgamation or merger and who is not satisfied that fair value has been offered for such shareholder’s shares may, within one month of notice of the shareholders meeting, apply to the Supreme Court of Bermuda to appraise the fair value of those shares.
Shareholder Suits
Class actions and derivative actions are generally not available to shareholders under Bermuda law. The Bermuda courts, however, would ordinarily be expected to permit a shareholder to commence an action in the name of a company to remedy a wrong to the company where the act complained of is alleged to be beyond the corporate power of the company or illegal, or would result in the violation of the company’s memorandum of
124
Table of Contents
association or bye-laws. Furthermore, consideration would be given by a Bermuda court to acts that are alleged to constitute a fraud against the minority shareholders or, for instance, where an act requires the approval of a greater percentage of the company’s shareholders than that which actually approved it.
When the affairs of a company are being conducted in a manner that is oppressive or prejudicial to the interests of some part of the shareholders, one or more shareholders may apply to the Supreme Court of Bermuda, which may make such order as it sees fit, including an order regulating the conduct of the company’s affairs in the future or ordering the purchase of the shares of any shareholders by other shareholders or by the company.
Our amended and restated bye-laws contain a provision by virtue of which our shareholders waive any claim or right of action that they have, both individually and on our behalf, against any director or officer in relation to any action or failure to take action by such director or officer, except in respect of any fraud or dishonesty of such director or officer. We have been advised by the SEC that in the opinion of the SEC, the operation of this provision as a waiver of the right to sue for violations of federal securities laws would likely be unenforceable in U.S. courts.
Capitalization of Profits and Reserves
Pursuant to our amended and restated bye-laws, our Board of Directors may (i) capitalize any part of the amount of our share premium or other reserve accounts or any amount credited to our profit and loss account or otherwise available for distribution by applying such sum in paying up unissued shares to be allotted as fully paid bonus shares pro rata (except in connection with the conversion of shares) to the shareholders; or (ii) capitalize any sum standing to the credit of a reserve account or sums otherwise available for dividend or distribution by paying up in full, partly paid or nil paid shares of those shareholders who would have been entitled to such sums if they were distributed by way of dividend or distribution.
Registrar or Transfer Agent
A register of holders of the common shares is maintained by Codan Services Limited in Bermuda, and a branch register is maintained in the United States by American Stock Transfer & Trust Company, LLC, which serves as branch registrar and transfer agent.
Untraced Shareholders
Our amended and restated bye-laws provide that our Board of Directors may forfeit any dividend or other monies payable in respect of any shares that remain unclaimed for six years from the date when such monies became due for payment. In addition, we are entitled to cease sending dividend warrants and checks by post or otherwise to a shareholder if such instruments have been returned undelivered to, or left uncashed by, such shareholder on at least two consecutive occasions or, following one such occasion, reasonable enquires have failed to establish the shareholder’s new address. This entitlement ceases if the shareholder claims a dividend or cashes a dividend check or a warrant.
Certain Provisions of Bermuda Law
We have been designated by the BMA as a non-resident for Bermuda exchange control purposes. This designation allows us to engage in transactions in currencies other than the Bermuda dollar, and there are no restrictions on our ability to transfer funds (other than funds denominated in Bermuda dollars) in and out of Bermuda or to pay dividends to U.S. residents who are holders of our common shares.
The BMA has given its consent for the issue and free transferability of all of the common shares that are the subject of this offering to and between residents and non-residents of Bermuda for exchange control purposes, provided our shares remain listed on an appointed stock exchange, which includes the NYSE. Approvals or permissions given by the BMA do not constitute a guarantee by the BMA as to our performance or our
125
Table of Contents
creditworthiness. Accordingly, in giving such consent or permissions, neither the BMA nor the Registrar of Companies in Bermuda shall be liable for the financial soundness, performance or default of our business or for the correctness of any opinions or statements expressed in this prospectus. Certain issues and transfers of common shares involving persons deemed resident in Bermuda for exchange control purposes require the specific consent of the BMA.
In accordance with Bermuda law, share certificates are only issued in the names of companies, partnerships or individuals. In the case of a shareholder acting in a special capacity (for example as a trustee), certificates may, at the request of the shareholder, record the capacity in which the shareholder is acting. Notwithstanding such recording of any special capacity, we are not bound to investigate or see to the execution of any such trust.
126
Table of Contents
SHARES ELIGIBLE FOR FUTURE SALE
Prior to this offering, there has been no public market for our common shares, and no predictions can be made about the effect, if any, that market sales of common shares or the availability of such common shares for sale will have on the market price prevailing from time to time. Nevertheless, the actual sale of, or the perceived potential for the sale of, our common shares in the public market may have an adverse effect on the market price for our common shares and could impair our ability to raise capital through future sales of our securities. See “Risk Factors—Risks Related to this Offering and Ownership of our Common Shares—Future sales of our common shares in the public market could lower our share price, and any additional capital raised by us through the sale of equity or convertible debt securities may dilute your ownership in us and may adversely affect the market price of our common shares.” Upon the completion of this offering, we will have outstanding common shares. Of these shares, common shares will be freely transferable without restriction or further registration under the Securities Act by persons other than “affiliates,” as that term is defined in Rule 144 under the Securities Act. Generally, the balance of our outstanding common shares are “restricted securities” within the meaning of Rule 144 under the Securities Act, subject to the limitations and restrictions that are described below. Common shares purchased by our affiliates will be “restricted securities” under Rule 144. Restricted securities may be sold in the public market only if registered or if they qualify for an exemption from registration under Rules 144 or 701 promulgated under the Securities Act.
Lock-Up Agreements
In connection with this offering, we, our executive officers, directors and principal shareholders have agreed, subject to certain exceptions, not to sell or transfer any common shares or securities convertible into, exchangeable for, exercisable for, or repayable with common shares, for 180 days after the date of this prospectus without first obtaining the written consent of . See “Underwriting.”
Rule 144
In general, under Rule 144 as in effect on the date of this prospectus, beginning 90 days after the consummation of this offering, a person (or persons whose common shares are required to be aggregated) who is an affiliate and who has beneficially owned our common shares for at least six months is entitled to sell in any three-month period a number of shares that does not exceed the greater of:
| • | 1% of the number of shares then outstanding, which will equal approximately shares immediately after consummation of this offering; or |
| • | the average weekly trading volume in our shares on the stock exchange on which our common shares are listed during the four calendar weeks preceding the filing of a notice on Form 144 with respect to such a sale. |
Sales by our affiliates under Rule 144 are also subject to manner of sale provisions and notice requirements and to the availability of current public information about us. An “affiliate” is a person that directly, or indirectly through one or more intermediaries, controls or is controlled by, or is under common control with an issuer.
Under Rule 144, a person (or persons whose shares are aggregated) who is not deemed to have been an affiliate of ours at any time during the 90 days preceding a sale, and who has beneficially owned the shares proposed to be sold for at least six months (including the holding period of any prior owner other than an affiliate), would be entitled to sell those shares subject only to availability of current public information about us, and after beneficially owning such shares for at least 12 months (including the holding period of any prior owner other than an affiliate), would be entitled to sell an unlimited number of shares without restriction. To the extent that our affiliates sell their common shares, other than pursuant to Rule 144 or a registration statement, the purchaser’s holding period for the purpose of effecting a sale under Rule 144 commences on the date of transfer from the affiliate.
127
Table of Contents
Rule 701
In general, under Rule 701 as in effect on the date of this prospectus, any of our employees, directors, officers, consultants or advisors who purchased shares from us in reliance on Rule 701 in connection with a compensatory stock or option plan or other written agreement before the effective date of this offering, or who purchased shares from us after that date upon the exercise of options granted before that date, are eligible to resell such shares 90 days after the effective date of this offering in reliance upon Rule 144. If such person is not an affiliate, such sale may be made subject only to the manner of sale provisions of Rule 144. If such a person is an affiliate, such sale may be made under Rule 144 without compliance with the holding period requirement, but subject to the other Rule 144 restrictions described above.
S-8 Registration Statement
In conjunction with this offering, we expect to file a registration statement on Form S-8 under the Securities Act, which will register up to common shares available for issuance under our equity incentive plans. That registration statement will become effective upon filing, and common shares covered by such registration statement are eligible for sale in the public market immediately after the effective date of such registration statement, subject to Rule 144 volume limitations applicable to affiliates, vesting restrictions with us and the lock-up agreements described above.
Registration Rights
Pursuant to the shareholders’ agreement that we expect to enter into upon effectiveness of this registration statement, we will grant affiliates of Carlyle and Madison Dearborn the right to cause us, in certain instances, at our expense, to file registration statements under the Securities Act covering resales of our common shares held by affiliates of Carlyle and Madison Dearborn or to piggyback on registration statements in certain circumstances. See “Certain Relationships and Related Party Transactions.” These shares will represent approximately % of our common shares outstanding after this offering, or % if the underwriters exercise their option to purchase additional shares in full. These shares also may be sold under Rule 144 under the Securities Act, depending on their holding period and subject to restrictions in the case of shares held by persons deemed to be our affiliates. Our shareholders’ agreement will also require us to indemnify certain of our shareholders and their affiliates in connection with any registrations of our securities.
128
Table of Contents
BERMUDA COMPANY CONSIDERATIONS
Our corporate affairs are governed by our memorandum of association and bye-laws and by the corporate law of Bermuda. The provisions of the Companies Act, which applies to us, differ in certain material respects from laws generally applicable to U.S. companies incorporated in the State of Delaware and their stockholders. The following is a summary of significant differences between the Companies Act (including modifications adopted pursuant to our bye-laws) and Bermuda common law applicable to us and our shareholders and the provisions of the General Corporation Law of the State of Delaware applicable to U.S. companies organized under the laws of Delaware and their stockholders.
| Bermuda |
Delaware | |
| Shareholder meetings |
||
| • May be called by the board of directors and must be called upon the request of shareholders holding not less than 10% of the paid-up capital of the company carrying the right to vote at general meetings. |
• May be held at such time or place as designated in the certificate of incorporation or the bylaws, or if not so designated, as determined by the board of directors. | |
| • May be held in or outside Bermuda |
• May be held in or outside of Delaware. | |
| • Notice: |
• Notice: | |
| • Shareholders must be given at least five days’ advance notice of a general meeting, but the unintentional failure to give notice to any person does not invalidate the proceedings at a meeting. |
• Written notice shall be given not less than ten nor more than 60 days before the meeting. | |
| • Notice of general meetings must specify the place, the day and hour of the meeting and in the case of special general meetings, the general nature of the business to be considered. |
• Whenever stockholders are required to take any action at a meeting, a written notice of the meeting shall be given which shall state the place, if any, date and hour of the meeting, and the means of remote communication, if any. | |
| Shareholder’s voting rights |
||
| • Shareholders may act by written consent to elect directors. Shareholders may not act by written consent to remove a director or auditor. |
• With limited exceptions, stockholders may act by written consent to elect directors unless prohibited by the certificate of incorporation. | |
| • Generally, except as otherwise provided in the bye-laws, or the Companies Act, any action or resolution requiring approval of the shareholders may be passed by a simple majority of votes cast. Any person authorized to vote may authorize another person or persons to act for him or her by proxy. |
• Any person authorized to vote may authorize another person or persons to act for him or her by proxy. | |
| • The voting rights of shareholders are regulated by a company’s bye-laws and, in certain circumstances, by the Companies Act. The bye-laws may specify the number to constitute a quorum and if the bye-laws permit, a general meeting of the shareholders of a company may be held with only one individual present if the requirement for a quorum is satisfied. |
• For stock corporations, the certificate of incorporation or bylaws may specify the number to constitute a quorum, but in no event shall a quorum consist of less than one-third of shares entitled to vote at a meeting. In the absence of such specifications, a majority of shares entitled to vote shall constitute a quorum. | |
129
Table of Contents
| Bermuda |
Delaware | |
| • Our bye-laws provide that when a quorum is once present in general meeting it is not broken by the subsequent withdrawal of any shareholders. |
• When a quorum is once present to organize a meeting, it is not broken by the subsequent withdrawal of any stockholders. | |
| • The bye-laws may provide for cumulative voting, although our bye-laws do not. |
• The certificate of incorporation may provide for cumulative voting. | |
| • The amalgamation or merger of a Bermuda company with another company or corporation (other than certain affiliated companies) requires the amalgamation or merger agreement to be approved by the company’s board of directors and by its shareholders. Unless the company’s bye-laws provide otherwise, the approval of 75% of the shareholders voting at such meeting is required to approve the amalgamation or merger agreement, and the quorum for such meeting must be two or more persons holding or representing more than one-third of the issued shares of the company. |
• Any two or more corporations existing under the laws of the state may merge into a single corporation pursuant to a board resolution and upon the majority vote by stockholders of each constituent corporation at an annual or special meeting. | |
| • Every company may at any meeting of its board of directors sell, lease or exchange all or substantially all of its property and assets as its board of directors deems expedient and in the best interests of the company to do so when authorized by a resolution adopted by the holders of a majority of issued and outstanding shares of a company entitled to vote. |
• Every corporation may at any meeting of the board sell, lease or exchange all or substantially all of its property and assets as its board deems expedient and for the best interests of the corporation when so authorized by a resolution adopted by the holders of a majority of the outstanding stock of a corporation entitled to vote. | |
| • Any company that is the wholly owned subsidiary of a holding company, or one or more companies which are wholly owned subsidiaries of the same holding company, may amalgamate or merge without the vote or consent of shareholders provided that the approval of the board of directors is obtained and that a director or officer of each such company signs a statutory solvency declaration in respect of the relevant company. |
• Any corporation owning at least 90% of the outstanding shares of each class of another corporation may merge the other corporation into itself and assume all of its obligations without the vote or consent of stockholders; however, in case the parent corporation is not the surviving corporation, the proposed merger shall be approved by a majority of the outstanding stock of the parent corporation entitled to vote at a duly called stockholder meeting. | |
| • Any mortgage, charge or pledge of a company’s property and assets may be authorized without the consent of shareholders subject to any restrictions under the bye-laws. |
• Any mortgage or pledge of a corporation’s property and assets may be authorized without the vote or consent of stockholders, except to the extent that the certificate of incorporation otherwise provides. | |
| Directors |
||
| • The board of directors must consist of at least one director. |
• The board of directors must consist of at least one member. | |
130
Table of Contents
| Bermuda |
Delaware | |
| • The number of directors is fixed by the bye-laws, and any changes to such number must be approved by the board of directors and/or the shareholders in accordance with the company’s bye-laws. |
• Number of board members shall be fixed by the bylaws, unless the certificate of incorporation fixes the number of directors, in which case a change in the number shall be made only by amendment of the certificate of incorporation. | |
| • Removal: |
• Removal: | |
| • Under our bye-laws, as long as investment funds affiliated with Carlyle and Madison Dearborn hold a majority of the common shares in issue, any or all directors may be removed, with or without cause by the holders of a majority of the shares entitled to vote at a special meeting convened and held in accordance with the bye-laws for the purpose of such removal. Once investment funds affiliated with Carlyle and Madison Dearborn cease to own a majority of our common shares in issue, any or all directors may be removed only with cause by the holders of a majority of the shares entitled to vote at a special meeting convened and held in accordance with the bye-laws for the purpose of such removal. |
• Any or all of the directors may be removed, with or without cause, by the holders of a majority of the shares entitled to vote unless the certificate of incorporation otherwise provides.
• In the case of a classified board, stockholders may effect removal of any or all directors only for cause. | |
| Duties of directors |
||
| • The Companies Act authorizes the directors of a company, subject to its bye-laws, to exercise all powers of the company except those that are required by the Companies Act or the company’s bye-laws to be exercised by the shareholders of the company. Our bye-laws provide that our business is to be managed and conducted by our Board of Directors. At common law, members of a board of directors owe a fiduciary duty to the company to act in good faith in their dealings with or on behalf of the company and exercise their powers and fulfill the duties of their office honestly. This duty includes the following essential elements:
• a duty to act in good faith in the best interests of the company;
• a duty not to make a personal profit from opportunities that arise from the office of director;
• a duty to avoid conflicts of interest; and
• a duty to exercise powers for the purpose for which such powers were intended. |
• Under Delaware law, the business and affairs of a corporation are managed by or under the direction of its board of directors. In exercising their powers, directors are charged with a fiduciary duty of care to protect the interests of the corporation and a fiduciary duty of loyalty to act in the best interests of its stockholders. The duty of care requires that a director act in good faith, with the care that an ordinarily prudent person would exercise under similar circumstances. Under this duty, a director must inform himself of, and disclose to stockholders, all material information reasonably available regarding a significant transaction. The duty of loyalty requires that a director act in a manner he reasonably believes to be in the best interests of the corporation. He must not use his corporate position for personal gain or advantage. This duty prohibits self-dealing by a director and mandates that the best interests of the corporation and its stockholders take precedence over any interest possessed by a director, officer or controlling shareholder and not shared by the stockholders generally. | |
131
Table of Contents
| Bermuda |
Delaware | |
| • The Companies Act imposes a duty on directors and officers of a Bermuda company:
• to act honestly and in good faith with a view to the best interests of the company; and
• to exercise the care, diligence and skill that a reasonably prudent person would exercise in comparable circumstances.
• The Companies Act also imposes various duties on directors and officers of a company with respect to certain matters of management and administration of the company. Under Bermuda law, directors and officers generally owe fiduciary duties to the company itself, not to the company’s individual shareholders, creditors or any class thereof. Our shareholders may not have a direct cause of action against our directors. |
• In general, actions of a director are presumed to have been made on an informed basis, in good faith and in the honest belief that the action taken was in the best interests of the corporation. However, this presumption may be rebutted by evidence of a breach of one of the fiduciary duties. Should such evidence be presented concerning a transaction by a director, a director must prove the procedural fairness of the transaction, and that the transaction was of fair value to the corporation. | |
| Takeovers |
||
| • An acquiring party is generally able to acquire compulsorily the common shares of minority holders of a company in the following ways:
• By a procedure under the Companies Act known as a “scheme of arrangement.” A scheme of arrangement could be effected by obtaining the agreement of the company and of holders of common shares, representing in the aggregate a majority in number and at least 75% in value of the common shareholders present and voting at a court ordered meeting held to consider the scheme of arrangement. The scheme of arrangement must then be sanctioned by the Bermuda Supreme Court. If a scheme of arrangement receives all necessary agreements and sanctions, upon the filing of the court order with the Registrar of Companies in Bermuda, all holders of common shares could be compelled to sell their shares under the terms of the scheme of arrangement.
• By acquiring pursuant to a tender offer 90% of the shares or class of shares not already owned by, or by a nominee for, the acquiring party (the offeror), or any of its subsidiaries. If an offeror has, within four months after the making of an offer for all the shares or class of shares not owned by, or by a nominee for, the offeror, or any of its subsidiaries, obtained the |
• Delaware law provides that a parent corporation, by resolution of its board of directors and without any stockholder vote, may merge with any subsidiary of which it owns at least 90% of each class of its capital stock. Upon any such merger, and in the event the parent corporate does not own all of the stock of the subsidiary, dissenting stockholders of the subsidiary are entitled to certain appraisal rights.
• Delaware law also provides, subject to certain exceptions, that if a person acquires 15% of voting stock of a company, the person is an “interested stockholder” and may not engage in “business combinations” with the company for a period of three years from the time the person acquired 15% or more of voting stock. | |
132
Table of Contents
| Bermuda |
Delaware | |
| approval of the holders of 90% or more of all the shares to which the offer relates, the offeror may, at any time within two months beginning with the date on which the approval was obtained, by notice compulsorily acquire the shares of any nontendering shareholder on the same terms as the original offer unless the Supreme Court of Bermuda (on application made within a one-month period from the date of the offeror’s notice of its intention to acquire such shares) orders otherwise.
• Where the acquiring party or parties hold not less than 95% of the shares or a class of shares of the company, by acquiring, pursuant to a notice given to the remaining shareholders or class of shareholders, the shares of such remaining shareholders or class of shareholders. When this notice is given, the acquiring party is entitled and bound to acquire the shares of the remaining shareholders on the terms set out in the notice, unless a remaining shareholder, within one month of receiving such notice, applies to the Supreme Court of Bermuda for an appraisal of the value of their shares. This provision only applies where the acquiring party offers the same terms to all holders of shares whose shares are being acquired. |
||
| Dissenter’s rights of appraisal |
||
| • A dissenting shareholder (that did not vote in favor of the amalgamation or merger) of a Bermuda exempted company is entitled to be paid the fair value of his or her shares in an amalgamation or merger. |
• With limited exceptions, appraisal rights shall be available for the shares of any class or series of stock of a corporation in a merger or consolidation.
• The certificate of incorporation may provide that appraisal rights are available for shares as a result of an amendment to the certificate of incorporation, any merger or consolidation or the sale of all or substantially all of the assets. | |
| Dissolution |
||
| • Under Bermuda law, a solvent company may be wound up by way of a shareholders’ voluntary liquidation. Prior to the company entering liquidation, a majority of the directors shall each make a statutory declaration, which states that the directors have made a full enquiry into the affairs of the company and have formed the opinion that the company will be able to pay its debts within a |
• Under Delaware law, a corporation may voluntarily dissolve (i) if a majority of the board of directors adopts a resolution to that effect and the holders of a majority of the issued and outstanding shares entitled to vote thereon vote for such dissolution; or (ii) if all stockholders entitled to vote thereon consent in writing to such dissolution. | |
133
Table of Contents
| Bermuda |
Delaware | |
| period of 12 months of the commencement of the winding up and must file the statutory declaration with the Registrar of Companies in Bermuda. The general meeting will be convened primarily for the purposes of passing a resolution that the company be wound up voluntarily and appointing a liquidator. The winding up of the company is deemed to commence at the time of the passing of the resolution. |
||
| Shareholder’s derivative actions |
||
| • Class actions and derivative actions are generally not available to shareholders under Bermuda law. Bermuda courts, however, would ordinarily be expected to permit a shareholder to commence an action in the name of a company to remedy a wrong to the company where the act complained of is alleged to be beyond the corporate power of the company or illegal, or would result in the violation of the company’s memorandum of association or bye-laws. Furthermore, consideration would be given by a Bermuda court to acts that are alleged to constitute a fraud against the minority shareholders or, for instance, where an act requires the approval of a greater percentage of the company’s shareholders than that which actually approved it. |
• In any derivative suit instituted by a stockholder of a corporation, it shall be averred in the complaint that the plaintiff was a stockholder of the corporation at the time of the transaction of which he complains or that such stockholder’s stock thereafter devolved upon such stockholder by operation of law. | |
134
Table of Contents
MATERIAL UNITED STATES FEDERAL INCOME TAX CONSEQUENCES
The following discussion describes certain U.S. federal income tax consequences to U.S. Holders (as defined below) under present law of an investment in our common shares. This summary applies only to U.S. Holders that acquire common shares in exchange for cash in the offering pursuant to this prospectus, hold their common shares as capital assets within the meaning of Section 1221 of the Code and have the U.S. dollar as their functional currency. For purposes of this discussion the “Company,” “we,” “us” and “our” refers to Multi Packaging Solutions International Limited only and not its subsidiaries.
This discussion is based on the tax laws of the United States as in effect on the date of this prospectus, including the Code, and on U.S. Treasury regulations in effect or, in some cases, proposed, as of the date of this prospectus, as well as judicial and administrative interpretations thereof available on or before such date. All of the foregoing authorities are subject to change, and any such change could apply retroactively and could affect the U.S. federal income tax consequences described below. The statements in this prospectus are not binding on the U.S. Internal Revenue Service (the “IRS”) or any court, and thus we can provide no assurance that the U.S. federal income tax consequences discussed below will not be challenged by the IRS or will be sustained by a court if challenged by the IRS. Furthermore, this summary does not address any estate or gift tax consequences, any state, local or non-U.S. tax consequences, the potential application of the “Medicare contribution tax” on net investment income or any other tax consequences other than U.S. federal income tax consequences.
In addition, the following discussion does not describe all the tax consequences that may be relevant to any particular investor or to persons in special tax situations, such as:
| • | banks and certain other financial institutions; |
| • | regulated investment companies; |
| • | real estate investment trusts; |
| • | insurance companies; |
| • | broker-dealers; |
| • | traders that elect to mark to market; |
| • | tax-exempt entities; |
| • | persons liable for alternative minimum tax; |
| • | U.S. expatriates; |
| • | persons holding common shares as part of a straddle, hedging, constructive sale, conversion or integrated transaction; |
| • | persons that actually or constructively own 10% or more of our stock (by total combined voting power or value); |
| • | persons that are resident or ordinarily resident in or have a permanent establishment in a jurisdiction outside the United States; |
| • | persons who acquired common shares pursuant to the exercise of any employee share option or otherwise as compensation; or |
| • | persons holding common shares through partnerships or other pass-through entities. |
PROSPECTIVE PURCHASERS ARE URGED TO CONSULT THEIR TAX ADVISORS ABOUT THE APPLICATION OF THE U.S. FEDERAL TAX RULES TO THEIR PARTICULAR CIRCUMSTANCES AS WELL AS THE STATE, LOCAL AND NON-U.S. TAX CONSEQUENCES TO THEM OF THE PURCHASE, OWNERSHIP AND DISPOSITION OF COMMON SHARES.
135
Table of Contents
As used herein, the term “U.S. Holder” means a beneficial owner of our common shares that is, for U.S. federal income tax purposes:
| • | an individual who is a citizen or resident of the United States; |
| • | a corporation (or other entity treated as a corporation for U.S. federal income tax purposes) created or organized under the laws of the United States, any State or the District of Columbia; |
| • | an estate whose income is subject to U.S. federal income taxation regardless of its source; or |
| • | a trust that (1) is subject to the supervision of a court within the United States and the control of one or more U.S. persons or (2) has a valid election in effect under applicable U.S. Treasury regulations to be treated as a U.S. person. |
The tax treatment of a partner in an entity treated as a partnership for U.S. federal income tax purposes that holds our common shares generally will depend on such partner’s status and the activities of the partnership. A U.S. Holder that is a partner in such partnership should consult its tax advisor.
Dividends and Other Distributions on Our Common Shares
As discussed in the “Dividend Policy” section of this prospectus, we do not intend to pay any cash dividends for the foreseeable future. However, subject to the passive foreign investment company rules discussed below, the gross amount of any distributions made by us with respect to our common shares generally will be includible, as dividend income, in a U.S. Holder’s gross income in the year received, to the extent such distributions are paid out of our current or accumulated earnings and profits, as determined under U.S. federal income tax principles. Amounts, if any, not treated as dividend income will constitute a return of capital and will first be applied to reduce a U.S. Holder’s tax basis in its common shares, but not below zero, and then any excess will be treated as capital gain realized on a sale or other disposition of the common shares. If we do not maintain calculations of our earnings and profits under U.S. federal income tax principles, a U.S. Holder may be required to treat all distributions as dividends for these purposes. Dividends paid by us will not be eligible for the dividends-received deduction allowed to corporations in respect of dividends received from other U.S. corporations. Dividends received by non-corporate U.S. Holders may be “qualified dividend income,” which is taxed at the lower applicable capital gains rate, provided that (1) our common shares are readily tradable on an established securities market in the United States, (2) we are not a “passive foreign investment company” (as discussed below) for either the taxable year in which the dividend was paid or the preceding taxable year, (3) the U.S. Holder satisfies certain holding period requirements and (4) the U.S. Holder is not under an obligation to make related payments with respect to positions in substantially similar or related property. Under IRS authority, the common shares are considered for purposes of clause (1) above to be readily tradable on an established securities market in the United States if they are listed on the NYSE, which we expect our common shares to be. U.S. Holders should consult their own tax advisors regarding the availability of the lower rate for “qualified dividend income” with respect to any distributions paid with respect to our common shares.
The amount of any distribution paid in foreign currency will be equal to the U.S. dollar value of such currency, translated at the spot rate of exchange on the date such distribution is received, regardless of whether the payment is in fact converted into U.S. dollars at that time. Any further gain or loss on a subsequent conversion or other disposition of the currency for a different U.S. dollar amount will be U.S. source ordinary income or loss. The amount of any distribution of property other than cash will be the fair market value of such property on the date of distribution.
Dividends on our common shares generally will constitute foreign source income for foreign tax credit limitation purposes. If the dividends constitute qualified dividend income as discussed above, the amount of the dividend taken into account for purposes of calculating the foreign tax credit limitation will in general be limited to the gross amount of the dividend, multiplied by the reduced rate applicable to the qualified dividend income, divided by the highest rate of tax normally applicable to dividends. The limitation on foreign taxes eligible for the credit is calculated separately with respect to specific classes of income. For this purpose, dividends distributed by us
136
Table of Contents
with respect to our common shares will generally constitute “passive category income” but could, in the case of certain U.S. Holders, constitute “general category income.” The rules relating to the determination of the U.S. foreign tax credit are complex, and U.S. Holders should consult their tax advisors regarding the availability of a foreign tax credit in their particular circumstances and the possibility of claiming an itemized deduction (in lieu of the foreign tax credit) for foreign taxes paid.
Sale or Other Taxable Disposition of Our Common Shares
Subject to the passive foreign investment company rules discussed below, upon a sale or other taxable disposition of our common shares, a U.S. Holder will recognize capital gain or loss in an amount equal to the difference between the amount realized and the U.S. Holder’s adjusted tax basis in such common shares. Any such gain or loss generally will be treated as capital gain or loss and will be treated as long-term capital gain or loss if the U.S. Holder’s holding period in the common shares exceeds one year. Non-corporate U.S. Holders (including individuals) generally will be subject to U.S. federal income tax on long-term capital gain at preferential rates. The deductibility of capital losses is subject to significant limitations. Gain or loss, if any, realized by a U.S. Holder on the sale or other disposition of our common shares generally will be treated as U.S. source income or loss for U.S. foreign tax credit limitation purposes.
Passive Foreign Investment Company Rules
We would be classified as a passive foreign investment company (a “PFIC”) for any taxable year if either: (a) at least 75% of our gross income is “passive income” for purposes of the PFIC rules or (b) at least 50% of the value of our assets (determined on the basis of a quarterly average) produce or are held for the production of passive income. For this purpose, we will be treated as owning our proportionate share of the assets and earning our proportionate share of the income of any other corporation in which we own, directly or indirectly, 25% or more (by value) of the stock.
Based on the anticipated market price of our common shares in the offering pursuant to this prospectus, and the current and anticipated composition of our and our subsidiaries’ income, assets and operations, we do not expect to be treated as a PFIC for U.S. federal income tax purposes for the current taxable year or in the foreseeable future. This is a factual determination, however, that depends among other things on the composition of our and our subsidiaries’ income and assets, the fair market value of such assets and the market value of our stock, and thus the determination can only be made annually after the close of each taxable year. Therefore, there can be no assurance that we will not be classified as a PFIC for the current taxable year or for any future taxable year.
If we are considered a PFIC at any time that a U.S. Holder holds common shares, the U.S. Holder could be subject to materially adverse U.S. federal income tax consequences with respect to certain distributions on, and gain realized from a disposition of, our common shares. U.S. Holders should consult their own tax advisors about the potential application of the PFIC rules to an investment in our common shares.
Information Reporting and Backup Withholding
Distributions with respect to common shares and proceeds from the sale, exchange or redemption of our common shares may be subject to information reporting to the IRS and possible U.S. backup withholding. A U.S. Holder may be eligible for an exemption from backup withholding if the U.S. Holder furnishes a correct U.S. federal taxpayer identification number and makes any other required certification or who is otherwise exempt from backup withholding. U.S. Holders who are required to establish their exempt status may be required to provide such certification on IRS Form W-9. U.S. Holders should consult their tax advisors regarding the application of the U.S. information reporting and backup withholding rules.
Backup withholding is not an additional tax. Amounts withheld as backup withholding may be credited against a U.S. Holder’s U.S. federal income tax liability, and such a U.S. Holder may obtain a refund of any excess amounts withheld under the backup withholding rules by timely filing an appropriate claim for refund with the IRS and furnishing any required information.
137
Table of Contents
Additional Information Reporting Requirements
Certain U.S. Holders who are individuals may be required to file IRS Form 8938 or otherwise report information relating to an interest in our common shares, subject to certain exceptions (including an exception for common shares held in accounts maintained by certain U.S. financial institutions).
In addition, a U.S. Holder (including a U.S. tax-exempt entity) that transfers cash in exchange for equity of a newly created non-U.S. corporation may be required to file IRS Form 926 or a similar form if the transferred cash, when aggregated with all transfers made by such person (or any related person), exceeds USD 100,000.
Penalties can apply if U.S. Holders fail to satisfy such reporting requirements. U.S. Holders should consult their tax advisors regarding the applicability of these requirements to their acquisition and ownership of our common shares.
U.S. Foreign Account Tax Compliance Act (FATCA)
Certain provisions of the Code and Treasury regulations (commonly collectively referred to as “FATCA”) generally impose a 30% withholding tax regime with respect to certain “foreign passthru payments” made by a “foreign financial institution” (an “FFI”). Under current guidance, it is not clear whether we would be treated as an FFI for purposes of FATCA. If we were to be treated as an FFI, such withholding may be imposed on such payments to any other FFI (including an intermediary through which an investor may hold our common shares) that is not a “participating FFI” (as defined under FATCA) or any other investor who does not provide information sufficient to establish that the investor is not subject to withholding under FATCA, unless such other FFI or investor is otherwise exempt from FATCA. Under current guidance, the term “foreign passthru payment” is not defined, and it is therefore not clear whether or to what extent payments on the common shares would be considered foreign passthru payments. Withholding on foreign passthru payments would not be required with respect to payments made before the later of January 1, 2019 and the date of publication in the Federal Register of final regulations defining the term “foreign passthru payment.” The United States has entered into intergovernmental agreements between the United States and Bermuda and between the United States and the United Kingdom (the “IGAs”), which potentially modify the FATCA withholding regime described above with respect to us and our common shares. Prospective investors in our common shares should consult their tax advisors regarding the potential impact of FATCA, the IGAs and any non-U.S. legislation implementing FATCA on their potential investment in our common shares.
THE DISCUSSION ABOVE IS A GENERAL SUMMARY. IT DOES NOT COVER ALL TAX MATTERS THAT MAY BE IMPORTANT TO YOU. EACH PROSPECTIVE PURCHASER SHOULD CONSULT ITS OWN TAX ADVISOR ABOUT THE TAX CONSEQUENCES OF AN INVESTMENT IN OUR COMMON SHARES UNDER THE INVESTOR’S OWN CIRCUMSTANCES.
138
Table of Contents
Merrill Lynch, Pierce, Fenner & Smith Incorporated, Barclays Capital Inc. and Citigroup Global Markets Inc. are acting as representatives of each of the underwriters named below. Subject to the terms and conditions set forth in an underwriting agreement among us, the selling shareholders and the underwriters, we, together with the selling shareholders, have agreed to sell to the underwriters, and each of the underwriters has agreed, severally and not jointly, to purchase from us and the selling shareholders, the number of common shares set forth opposite its name below.
| Underwriter |
Number of Shares | |
| Merrill Lynch, Pierce, Fenner & Smith |
||
| Incorporated |
||
| Barclays Capital Inc. |
||
| Citigroup Global Markets Inc. |
||
| Credit Suisse Securities (USA) LLC | ||
| Goldman, Sachs & Co. | ||
| UBS Securities LLC | ||
| BMO Capital Markets Corp. | ||
| Robert W. Baird & Co. Incorporated | ||
|
| ||
| Total |
||
|
|
Subject to the terms and conditions set forth in the underwriting agreement, the underwriters have agreed, severally and not jointly, to purchase all of the shares sold under the underwriting agreement if any of these shares are purchased. If an underwriter defaults, the underwriting agreement provides that the purchase commitments of the nondefaulting underwriters may be increased or the underwriting agreement may be terminated.
We and the selling shareholders have agreed to indemnify the underwriters against certain liabilities, including liabilities under the Securities Act, or to contribute to payments the underwriters may be required to make in respect of those liabilities.
The underwriters are offering the shares, subject to prior sale, when, as and if issued to and accepted by them, subject to approval of legal matters by their counsel, including the validity of the shares, and other conditions contained in the underwriting agreement, such as the receipt by the underwriters of officer’s certificates and legal opinions. The underwriters reserve the right to withdraw, cancel or modify offers to the public and to reject orders in whole or in part.
Commissions and Discounts
The representatives have advised us and the selling shareholders that the underwriters propose initially to offer the shares to the public at the public offering price set forth on the cover page of this prospectus and to dealers at that price less a concession not in excess of $ per share. After the initial offering, the public offering price, concession or any other term of the offering may be changed.
139
Table of Contents
The following table shows the public offering price, underwriting discount and proceeds before expenses to us and the selling shareholders. The information assumes either no exercise or full exercise by the underwriters of their option to purchase additional shares.
| Per Share | Without Option | With Option | ||||||||||
| Public offering price |
$ | $ | $ | |||||||||
| Underwriting discount paid by us |
$ | $ | $ | |||||||||
| Proceeds, before expenses, to us |
$ | $ | $ | |||||||||
| Underwriting discount paid by the selling shareholders |
$ | $ | $ | |||||||||
| Proceeds, before expenses, to the selling shareholders |
$ | $ | $ | |||||||||
The expenses of the offering, including expenses by the selling shareholders, but not including the underwriting discount, are estimated at $ and are payable by us.
Option to Purchase Additional Shares
The selling shareholders have granted an option to the underwriters, exercisable for 30 days after the date of this prospectus, to purchase up to additional common shares at the public offering price, less the underwriting discount. If the underwriters exercise this option, each will be obligated, subject to conditions contained in the underwriting agreement, to purchase a number of additional common shares proportionate to that underwriter’s initial amount reflected in the above table.
Reserved Share Program
At our request, the underwriters have reserved for sale, at the initial public offering price, up to 5% of the common shares offered by this prospectus for sale to some of our directors, officers, employees, business associates and related persons. If these persons purchase reserved common shares it will reduce the number of common shares available for sale to the general public. Any reserved common shares that are not so purchased will be offered by the underwriters to the general public on the same terms as the other common shares offered by this prospectus.
No Sales of Similar Securities
We, our executive officers, directors and principal shareholders, including certain of the selling shareholders, have agreed, subject to certain exceptions, not to sell or transfer any common shares or securities convertible into, exchangeable for, exercisable for, or repayable with common shares, for 180 days after the date of this prospectus without first obtaining the written consent of the representatives. Specifically, we and these other persons have agreed, with certain limited exceptions, not to directly or indirectly
| • | offer, pledge, sell or contract to sell any common shares, |
| • | sell any option or contract to purchase any common shares, |
| • | purchase any option or contract to sell any common shares, |
| • | grant any option, right or warrant for the sale of any common shares, |
| • | lend or otherwise dispose of or transfer any common shares, |
| • | request or demand that we file a registration statement related to the common shares, or |
| • | enter into any swap or other agreement that transfers, in whole or in part, the economic consequence of ownership of any common shares whether any such swap or transaction is to be settled by delivery of shares or other securities, in cash or otherwise. |
140
Table of Contents
This lock-up provision applies to common shares and to securities convertible into or exchangeable or exercisable for or repayable with common shares. It also applies to common shares owned now or acquired later by the person executing the agreement or for which the person executing the agreement later acquires the power of disposition.
Requests for the consent of the representatives of the underwriters to the sale of common shares by us, our executive officers, directors or principal shareholders prior to the expiration of these lock-up agreements will be considered on a case-by-case basis by the representatives. When determining whether or not to grant their consent, the representatives may consider, among other factors, the reasons given by us or the relevant shareholder, as applicable, for requesting the consent, the number of common shares for which the consent is being requested and market conditions at such time.
New York Stock Exchange Listing
We expect the shares to be approved for listing on the NYSE under the symbol “MPSX”. In order to meet the requirements for listing on that exchange, the underwriters have undertaken to sell a minimum number of shares to a minimum number of beneficial owners as required by that exchange.
Before this offering, there has been no public market for our common shares. The initial public offering price will be determined through negotiations between us, the selling shareholders and the representatives. In addition to prevailing market conditions, the factors to be considered in determining the initial public offering price are:
| • | the valuation multiples of publicly traded companies that the representatives believe to be comparable to us; |
| • | our financial information; |
| • | the history of, and the prospects for, our company and the industry in which we compete; |
| • | an assessment of our management, its past and present operations, and the prospects for, and timing of, our future revenues; |
| • | the present state of our development; and |
| • | the above factors in relation to market values and various valuation measures of other companies engaged in activities similar to ours. |
An active trading market for the shares may not develop. It is also possible that after the offering the common shares will not trade in the public market at or above the initial public offering price.
The underwriters do not expect to sell more than 5% of the common shares in the aggregate to accounts over which they exercise discretionary authority.
Price Stabilization, Short Positions and Penalty Bids
Until the distribution of the shares is completed, SEC rules may limit underwriters and selling group members from bidding for and purchasing our common shares. However, the representatives may engage in transactions that stabilize the price of the common shares, such as bids or purchases to peg, fix or maintain that price.
In connection with the offering, the underwriters may purchase and sell our common shares in the open market. These transactions may include short sales, purchases on the open market to cover positions created by short sales and stabilizing transactions. Short sales involve the sale by the underwriters of a greater number of shares than they are required to purchase in the offering. “Covered” short sales are sales made in an amount not greater than the underwriters’ option to purchase additional shares described above. The underwriters may close out any covered short position by either exercising their option to purchase additional shares or purchasing shares in the open market. In determining the source of shares to close out the covered short position, the underwriters will
141
Table of Contents
consider, among other things, the price of shares available for purchase in the open market as compared to the price at which they may purchase shares through the option granted to them. “Naked” short sales are sales in excess of such option. The underwriters must close out any naked short position by purchasing shares in the open market. A naked short position is more likely to be created if the underwriters are concerned that there may be downward pressure on the price of our common shares in the open market after pricing that could adversely affect investors who purchase in the offering. Stabilizing transactions consist of various bids for or purchases of common shares made by the underwriters in the open market prior to the completion of the offering.
The underwriters may also impose a penalty bid. This occurs when a particular underwriter repays to the underwriters a portion of the underwriting discount received by it because the representatives have repurchased shares sold by or for the account of such underwriter in stabilizing or short covering transactions.
Similar to other purchase transactions, the underwriters’ purchases to cover the syndicate short sales may have the effect of raising or maintaining the market price of our common shares or preventing or retarding a decline in the market price of our common shares. As a result, the price of our common shares may be higher than the price that might otherwise exist in the open market. The underwriters may conduct these transactions on the NYSE, in the over-the-counter market or otherwise.
None of us, the selling shareholders or any of the underwriters make any representation or prediction as to the direction or magnitude of any effect that the transactions described above may have on the price of our common shares. In addition, none of us, the selling shareholders or any of the underwriters make any representation that the representatives will engage in these transactions or that these transactions, once commenced, will not be discontinued without notice.
Electronic Distribution
In connection with the offering, certain of the underwriters or securities dealers may distribute prospectuses by electronic means, such as e-mail. In addition, the representatives may facilitate Internet distribution for this offering to certain of their Internet subscription customers. The representatives may allocate a limited number of common shares for sale to their online brokerage customers. An electronic prospectus is available on Internet web sites maintained by the representatives. Other than the prospectus in electronic format, the information on the web sites of the representatives is not part of this prospectus.
Other Relationships
Affiliates of Merrill Lynch, Pierce, Fenner & Smith Incorporated, Barclays Capital Inc. and Citigroup Global Markets Inc. have made lending commitments under our Dollar Revolving Credit Facility and affiliates of Barclays Capital Inc. have made lending commitments under our Multi-Currency Revolving Credit Facility.
In addition, affiliates of Barclays Capital Inc. are lenders under our Dollar Tranche B Term Loan and our Dollar Tranche C Term Loan. As a result, affiliates of certain of the underwriters will be receiving a portion of the proceeds from this offering. Some of the underwriters and their affiliates have also engaged in, and may in the future engage in, investment banking and other commercial dealings in the ordinary course of business with us or our affiliates. They have received, or may in the future receive, customary fees and commissions for these transactions.
In addition, in the ordinary course of their business activities, the underwriters and their affiliates may make or hold a broad array of investments and actively trade debt and equity securities (or related derivative securities) and financial instruments (including bank loans) for their own account and for the accounts of their customers. Such investments and securities activities may involve securities and/or instruments of ours or our affiliates. The underwriters and their affiliates may also make investment recommendations and/or publish or express independent research views in respect of such securities or financial instruments and may hold, or recommend to clients that they acquire, long and/or short positions in such securities and instruments.
142
Table of Contents
Other than in the United States, no action has been taken by us, the selling shareholders or the underwriters that would permit a public offering of the securities offered by this prospectus in any jurisdiction where action for that purpose is required. The securities offered by this prospectus may not be offered or sold, directly or indirectly, nor may this prospectus or any other offering material or advertisements in connection with the offer and sale of any such securities be distributed or published in any jurisdiction, except under circumstances that will result in compliance with the applicable rules and regulations of that jurisdiction. Persons into whose possession this prospectus comes are advised to inform themselves about and to observe any restrictions relating to the offering and the distribution of this prospectus. This prospectus does not constitute an offer to sell or a solicitation of an offer to buy any securities offered by this prospectus in any jurisdiction in which such an offer or a solicitation is unlawful.
Notice to Prospective Investors in the European Economic Area
In relation to each Member State of the European Economic Area (each, a “Relevant Member State”), no offer of shares may be made to the public in that Relevant Member State other than:
| A. | to any legal entity which is a qualified investor as defined in the Prospectus Directive; |
| B. | to fewer than 100 or, if the Relevant Member State has implemented the relevant provision of the 2010 PD Amending Directive, 150, natural or legal persons (other than qualified investors as defined in the Prospectus Directive), as permitted under the Prospectus Directive, subject to obtaining the prior consent of the representatives; or |
| C. | in any other circumstances falling within Article 3(2) of the Prospectus Directive, provided that no such offer of shares shall require the Company or the representatives to publish a prospectus pursuant to Article 3 of the Prospectus Directive or supplement a prospectus pursuant to Article 16 of the Prospectus Directive. |
Each person in a Relevant Member State who initially acquires any shares or to whom any offer is made will be deemed to have represented, acknowledged and agreed that it is a “qualified investor” within the meaning of the law in that Relevant Member State implementing Article 2(1)(e) of the Prospectus Directive. In the case of any shares being offered to a financial intermediary as that term is used in Article 3(2) of the Prospectus Directive, each such financial intermediary will be deemed to have represented, acknowledged and agreed that the shares acquired by it in the offer have not been acquired on a non-discretionary basis on behalf of, nor have they been acquired with a view to their offer or resale to, persons in circumstances which may give rise to an offer of any shares to the public other than their offer or resale in a Relevant Member State to qualified investors as so defined or in circumstances in which the prior consent of the representatives has been obtained to each such proposed offer or resale.
The Company, the representatives and their affiliates will rely upon the truth and accuracy of the foregoing representations, acknowledgements and agreements.
This prospectus has been prepared on the basis that any offer of shares in any Relevant Member State will be made pursuant to an exemption under the Prospectus Directive from the requirement to publish a prospectus for offers of shares. Accordingly any person making or intending to make an offer in that Relevant Member State of shares which are the subject of the offering contemplated in this prospectus may only do so in circumstances in which no obligation arises for the Company or any of the underwriters to publish a prospectus pursuant to Article 3 of the Prospectus Directive in relation to such offer. Neither the Company nor the underwriters have authorized, nor do they authorize, the making of any offer of shares in circumstances in which an obligation arises for the Company or the underwriters to publish a prospectus for such offer.
For the purpose of the above provisions, the expression “an offer to the public” in relation to any shares in any Relevant Member State means the communication in any form and by any means of sufficient information on the terms of the offer and the shares to be offered so as to enable an investor to decide to purchase or subscribe the
143
Table of Contents
shares, as the same may be varied in the Relevant Member State by any measure implementing the Prospectus Directive in the Relevant Member State and the expression “Prospectus Directive” means Directive 2003/71/EC (including the 2010 PD Amending Directive, to the extent implemented in the Relevant Member States) and includes any relevant implementing measure in the Relevant Member State and the expression “2010 PD Amending Directive” means Directive 2010/73/EU.
Notice to Prospective Investors in the United Kingdom
In addition, in the United Kingdom, this document is being distributed only to, and is directed only at, and any offer subsequently made may only be directed at persons who are “qualified investors” (as defined in the Prospectus Directive) (i) who have professional experience in matters relating to investments falling within Article 19 (5) of the Financial Services and Markets Act 2000 (Financial Promotion) Order 2005, as amended (the “Order”) and/or (ii) who are high net worth companies (or persons to whom it may otherwise be lawfully communicated) falling within Article 49(2)(a) to (d) of the Order (all such persons together being referred to as “relevant persons”). This document must not be acted on or relied on in the United Kingdom by persons who are not relevant persons. In the United Kingdom, any investment or investment activity to which this document relates is only available to, and will be engaged in with, relevant persons.
Notice to Prospective Investors in Switzerland
The shares may not be publicly offered in Switzerland and will not be listed on the SIX Swiss Exchange (“SIX”) or on any other stock exchange or regulated trading facility in Switzerland. This document has been prepared without regard to the disclosure standards for issuance prospectuses under art. 652a or art. 1156 of the Swiss Code of Obligations or the disclosure standards for listing prospectuses under art. 27 ff. of the SIX Listing Rules or the listing rules of any other stock exchange or regulated trading facility in Switzerland. Neither this document nor any other offering or marketing material relating to the shares or the offering may be publicly distributed or otherwise made publicly available in Switzerland.
Neither this document nor any other offering or marketing material relating to the offering, the Company, the shares have been or will be filed with or approved by any Swiss regulatory authority. In particular, this document will not be filed with, and the offer of shares will not be supervised by, the Swiss Financial Market Supervisory Authority FINMA (FINMA), and the offer of shares has not been and will not be authorized under the Swiss Federal Act on Collective Investment Schemes (“CISA”). The investor protection afforded to acquirers of interests in collective investment schemes under the CISA does not extend to acquirers of shares.
Notice to Prospective Investors in the Dubai International Financial Centre
This prospectus relates to an Exempt Offer in accordance with the Offered Securities Rules of the Dubai Financial Services Authority (“DFSA”). This prospectus is intended for distribution only to persons of a type specified in the Offered Securities Rules of the DFSA. It must not be delivered to, or relied on by, any other person. The DFSA has no responsibility for reviewing or verifying any documents in connection with Exempt Offers. The DFSA has not approved this prospectus nor taken steps to verify the information set forth herein and has no responsibility for the prospectus. The shares to which this prospectus relates may be illiquid and/or subject to restrictions on their resale. Prospective purchasers of the shares offered should conduct their own due diligence on the shares. If you do not understand the contents of this prospectus you should consult an authorized financial advisor.
Notice to Prospective Investors in Australia
No placement document, prospectus, product disclosure statement or other disclosure document has been lodged with the Australian Securities and Investments Commission (“ASIC”), in relation to the offering. This prospectus does not constitute a prospectus, product disclosure statement or other disclosure document under the Corporations Act 2001 (the “Corporations Act”), and does not purport to include the information required for a prospectus, product disclosure statement or other disclosure document under the Corporations Act.
144
Table of Contents
Any offer in Australia of the shares may only be made to persons (the “Exempt Investors”) who are “sophisticated investors” (within the meaning of section 708(8) of the Corporations Act), “professional investors” (within the meaning of section 708(11) of the Corporations Act) or otherwise pursuant to one or more exemptions contained in section 708 of the Corporations Act so that it is lawful to offer the shares without disclosure to investors under Chapter 6D of the Corporations Act.
The shares applied for by Exempt Investors in Australia must not be offered for sale in Australia in the period of 12 months after the date of allotment under the offering, except in circumstances where disclosure to investors under Chapter 6D of the Corporations Act would not be required pursuant to an exemption under section 708 of the Corporations Act or otherwise or where the offer is pursuant to a disclosure document which complies with Chapter 6D of the Corporations Act. Any person acquiring shares must observe such Australian on-sale restrictions.
This prospectus contains general information only and does not take account of the investment objectives, financial situation or particular needs of any particular person. It does not contain any securities recommendations or financial product advice. Before making an investment decision, investors need to consider whether the information in this prospectus is appropriate to their needs, objectives and circumstances, and, if necessary, seek expert advice on those matters.
Notice to Prospective Investors in Hong Kong
The shares have not been offered or sold and will not be offered or sold in Hong Kong, by means of any document, other than (a) to “professional investors” as defined in the Securities and Futures Ordinance (Cap. 571) of Hong Kong and any rules made under that Ordinance; or (b) in other circumstances which do not result in the document being a “prospectus” as defined in the Companies Ordinance (Cap. 32) of Hong Kong or which do not constitute an offer to the public within the meaning of that Ordinance. No advertisement, invitation or document relating to the shares has been or may be issued or has been or may be in the possession of any person for the purposes of issue, whether in Hong Kong or elsewhere, which is directed at, or the contents of which are likely to be accessed or read by, the public of Hong Kong (except if permitted to do so under the securities laws of Hong Kong) other than with respect to shares which are or are intended to be disposed of only to persons outside Hong Kong or only to “professional investors” as defined in the Securities and Futures Ordinance and any rules made under that Ordinance.
Notice to Prospective Investors in Japan
The shares have not been and will not be registered under the Financial Instruments and Exchange Law of Japan (Law No. 25 of 1948, as amended) and, accordingly, will not be offered or sold, directly or indirectly, in Japan, or for the benefit of any Japanese Person or to others for re-offering or resale, directly or indirectly, in Japan or to any Japanese Person, except in compliance with all applicable laws, regulations and ministerial guidelines promulgated by relevant Japanese governmental or regulatory authorities in effect at the relevant time. For the purposes of this paragraph, “Japanese Person” shall mean any person resident in Japan, including any corporation or other entity organized under the laws of Japan.
Notice to Prospective Investors in Singapore
This prospectus has not been registered as a prospectus with the Monetary Authority of Singapore. Accordingly, this prospectus and any other document or material in connection with the offer or sale, or invitation for subscription or purchase, of the shares may not be circulated or distributed, nor may the shares be offered or sold, or be made the subject of an invitation for subscription or purchase, whether directly or indirectly, to persons in Singapore other than (i) to an institutional investor under Section 274 of the Securities and Futures Act, Chapter 289 of Singapore (the “SFA”), (ii) to a relevant person pursuant to Section 275(1), or any person pursuant to Section 275(1A), and in accordance with the conditions specified in Section 275, of the SFA, or (iii) otherwise pursuant to, and in accordance with the conditions of, any other applicable provision of the SFA.
145
Table of Contents
Where the shares are subscribed or purchased under Section 275 of the SFA by a relevant person which is:
| (a) | a corporation (which is not an accredited investor (as defined in Section 4A of the SFA)) the sole business of which is to hold investments and the entire share capital of which is owned by one or more individuals, each of whom is an accredited investor; or |
| (b) | a trust (where the trustee is not an accredited investor) whose sole purpose is to hold investments and each beneficiary of the trust is an individual who is an accredited investor, |
securities (as defined in Section 239(1) of the SFA) of that corporation or the beneficiaries’ rights and interest (howsoever described) in that trust shall not be transferred within six months after that corporation or that trust has acquired the shares pursuant to an offer made under Section 275 of the SFA except:
| (a) | to an institutional investor or to a relevant person defined in Section 275(2) of the SFA, or to any person arising from an offer referred to in Section 275(1A) or Section 276(4)(i)(B) of the SFA; |
| (b) | where no consideration is or will be given for the transfer; |
| (c) | where the transfer is by operation of law; |
| (d) | as specified in Section 276(7) of the SFA; or |
| (e) | as specified in Regulation 32 of the Securities and Futures (Offers of Investments) (Shares and Debentures) Regulations 2005 of Singapore. |
Notice to Prospective Investors in Canada
The shares may be sold only to purchasers purchasing, or deemed to be purchasing, as principal that are accredited investors, as defined in National Instrument 45-106 Prospectus Exemptions or subsection 73.3(1) of the Securities Act (Ontario), and are permitted clients, as defined in National Instrument 31-103 Registration Requirements, Exemptions and Ongoing Registrant Obligations. Any resale of the shares must be made in accordance with an exemption from, or in a transaction not subject to, the prospectus requirements of applicable securities laws.
Securities legislation in certain provinces or territories of Canada may provide a purchaser with remedies for rescission or damages if this prospectus (including any amendment thereto) contains a misrepresentation, provided that the remedies for rescission or damages are exercised by the purchaser within the time limit prescribed by the securities legislation of the purchaser’s province or territory. The purchaser should refer to any applicable provisions of the securities legislation of the purchaser’s province or territory for particulars of these rights or consult with a legal advisor.
Pursuant to section 3A.3 (or, in the case of securities issued or guaranteed by the government of a non-Canadian jurisdiction, section 3A.4) of National Instrument 33-105 Underwriting Conflicts (NI 33-105), the underwriters are not required to comply with the disclosure requirements of NI 33-105 regarding underwriter conflicts of interest in connection with this offering.
146
Table of Contents
The validity of the common shares being sold in this offering and certain other matters of Bermuda law will be passed upon for us by Conyers, Dill & Pearman Pte. Ltd., our special Bermuda counsel. Certain matters of U.S. federal and New York state law will be passed upon for us by Latham & Watkins LLP, Washington, District of Columbia, and for the underwriters by Ropes & Gray LLP, Boston, Massachusetts. Ropes & Gray LLP has represented, and from time to time represents, our company and certain of our affiliates other than us in matters unrelated to this offering.
The balance sheet of Multi Packaging Solutions International Limited as of June 30, 2015, and the consolidated financial statements and schedule of Multi Packaging Solutions Global Holdings Limited at June 30, 2015 and 2014, and for the year ended June 30, 2015 and the period from August 15, 2013 to June 30, 2014, and the Predecessor period from July 1, 2013 to August 14, 2013, and for the year ended June 30, 2013, appearing in this Prospectus have been audited by Ernst & Young LLP, independent registered public accounting firm, as set forth in their reports thereon appearing elsewhere herein, and are included in reliance upon such reports given on the authority of such firm as experts in accounting and auditing.
The consolidated financial statements of Multi Packaging Solutions Global Holdings Limited (formerly Chesapeake Finance 2 Limited) as of 29 December 2013 (Successor) and 30 December 2012 (Predecessor) and for the periods from 13 June 2013 (date of inception) to 29 December 2013 (Successor) and for the periods from 31 December 2012 through 29 September 2013 and 2 January 2012 through 30 December 2012 (Predecessor) included in this Prospectus have been audited by Deloitte LLP, independent auditors, as stated in their report appearing herein, which report expresses an unmodified opinion on the consolidated financial statements and includes an explanatory paragraph referring to the differences between accounting principles generally accepted in the United Kingdom and accounting principles generally accepted in the United States of America and are included in reliance upon the report of such firm given upon their authority as experts in accounting and auditing.
The carve-out financial statements of the US Folding Carton and Lithographic Printing Business of Atlas AGI Holdings LLC as of September 30, 2014 and for the nine-month period ended September 30, 2014, included in this Prospectus, have been so included in reliance on the report of PricewaterhouseCoopers LLP, independent accountants, given on the authority of said firm as experts in auditing and accounting.
The carve-out combined financial statements of the Non-European Folding Carton and Lithographic Printing Business of AGI Global Holdings Cooperatief U.A. as of 30 September 2014 and for the nine-month period ended 30 September 2014, included in this Prospectus, have been so included in the reliance on the report of PricewaterhouseCoopers LLP, independent accountants, given on the authority of said firm as experts in auditing and accounting.
WHERE YOU CAN FIND MORE INFORMATION
We have filed with the SEC a registration statement on Form S-1 pursuant to the Securities Act, covering the common shares being offered hereby. This prospectus, which constitutes part of the registration statement, does not contain all the information set forth in the registration statement. For further information about us and our common shares, we refer you to the registration statement and the exhibits and schedules filed as a part of the registration statement. Statements contained in this prospectus as to the contents of any contract or other document filed as an exhibit to the registration statement are not necessarily complete. If a contract or document has been filed as an exhibit to the registration statement, we refer you to the copy of the contract or document that has been filed.
147
Table of Contents
You may inspect a copy of the registration statement and the exhibits and schedules to the registration statement without charge at the Public Reference Room of the SEC at 100 F Street, NE, Washington, D.C. 20549. You may obtain information on the operation of the Public Reference Room by calling the SEC at 1-800-SEC-0330. You can receive copies of these documents upon payment of a duplicating fee by writing to the SEC. The SEC maintains a web site at www.sec.gov that contains reports, proxy and information statements and other information regarding registrants that file electronically with the SEC. You can also inspect our registration statement on this web site.
Upon completion of this offering, we will become subject to the information and reporting requirements of the Exchange Act pursuant to Section 13 thereof. Our filings with the SEC (other than those exhibits specifically incorporated by reference into the registration statement of which this prospectus forms a part) are not incorporated by reference into this prospectus.
We are a Bermuda exempted company. As a result, the rights of holders of our common shares are governed by Bermuda law and our memorandum of association and bye-laws. The rights of shareholders under Bermuda law may differ from the rights of shareholders of companies incorporated in other jurisdictions. A number of our directors and some of the named experts referred to in this prospectus are not residents of the United States, and a substantial portion of our assets are located outside the United States. As a result, it may be difficult for investors to effect service of process on those persons in the United States or to enforce in the United States judgments obtained in U.S. courts against us or those persons based on the civil liability provisions of the U.S. securities laws. It is doubtful whether courts in Bermuda will enforce judgments obtained in other jurisdictions, including the United States, against us or our directors or officers under the securities laws of those jurisdictions or entertain actions in Bermuda against us or our directors or officers under the securities laws of other jurisdictions. Our registered address in Bermuda is Clarendon House, 2 Church Street, Hamilton HM 11, Bermuda.
148
Table of Contents
| Page(s) | ||||
| F-3 | ||||
| F-4 | ||||
| Consolidated Balance Sheets as of June 30, 2015 and June 30, 2014 |
F-5 | |||
| F-7 | ||||
| F-8 | ||||
| F-11 | ||||
| F-12 | ||||
| F-56 | ||||
| F-57 | ||||
| F-59 | ||||
| F-61 | ||||
| F-62 | ||||
| Consolidated Balance Sheets as at 29 December 2013 (Successor) and 30 December 2012 (Predecessor) |
F-63 | |||
| F-64 | ||||
| F-65 | ||||
| F-118 | ||||
| F-119 | ||||
| F-120 | ||||
| Statement of Income for the nine months ended September 30, 2014 |
F-121 | |||
| Statement of Invested Capital for the nine months ended September 30, 2014 |
F-122 | |||
| Statement of Cash Flows for the nine months ended September 30, 2014 |
F-123 | |||
| F-124 | ||||
F-1
Table of Contents
F-2
Table of Contents
MULTI PACKAGING SOLUTIONS GLOBAL HOLDINGS LIMITED
AND SUBSIDIARIES
CONSOLIDATED FINANCIAL STATEMENTS
FOR THE YEAR ENDED JUNE 30, 2015, PERIOD FROM AUGUST 15,
2013 THROUGH JUNE 30, 2014 (SUCCESSOR); AND THE PERIOD FROM JULY 1, 2013
THROUGH AUGUST 14, 2013,
AND THE YEAR ENDED JUNE 30, 2013 (PREDECESSOR)
F-3
Table of Contents
REPORT OF INDEPENDENT REGISTERED PUBLIC ACCOUNTING FIRM
To the Board of Directors and Shareholders of
Multi Packaging Solutions Global Holdings Limited
We have audited the accompanying consolidated balance sheets of Multi Packaging Solutions Global Holdings Limited and subsidiaries as of June 30, 2015 and 2014 (Successor), and the related consolidated statements of operations and comprehensive income, shareholders’ equity (deficiency) and cash flows for the year ended June 30, 2015 (Successor), for the period from August 15, 2013 to June 30, 2014 (Successor), for the period from July 1, 2013 to August 14, 2013 (Predecessor), and for the year ended June 30, 2013 (Predecessor). Our audits also included the financial statement schedule included in the index as Schedule II. These financial statements and schedule are the responsibility of the Company’s management. Our responsibility is to express an opinion on these financial statements and schedule based on our audits.
We conducted our audits in accordance with the standards of the Public Company Accounting Oversight Board (United States). Those standards require that we plan and perform the audit to obtain reasonable assurance about whether the financial statements are free of material misstatement. We were not engaged to perform an audit of the Company’s internal control over financial reporting. Our audits included consideration of internal control over financial reporting as a basis for designing audit procedures that are appropriate in the circumstances, but not for the purpose of expressing an opinion on the effectiveness of the Company’s internal control over financial reporting. Accordingly, we express no such opinion. An audit also includes examining, on a test basis, evidence supporting the amounts and disclosures in the financial statements, assessing the accounting principles used and significant estimates made by management, and evaluating the overall financial statement presentation. We believe that our audits provide a reasonable basis for our opinion.
In our opinion, the financial statements referred to above present fairly, in all material respects, the consolidated financial position of Multi Packaging Solutions Global Holdings Limited and subsidiaries at June 30, 2015 and 2014 (Successor), and the consolidated results of their operations and their cash flows for the year ended June 30, 2015 and for the period from August 15, 2013 to June 30, 2014 (Successor) and the period from July 1, 2013 to August 14, 2013 (Predecessor), and for the year ended June 30, 2013 (Predecessor) in conformity with U.S. generally accepted accounting principles. Also, in our opinion, the related financial statement schedule, when considered in relation to the basic financial statements taken as a whole, presents fairly in all material respects the information set forth therein.
/s/ Ernst & Young, LLP
Detroit, Michigan
September 11, 2015
F-4
Table of Contents
MULTI PACKAGING SOLUTIONS GLOBAL HOLDINGS LIMITED
AND SUBSIDIARIES
CONSOLIDATED BALANCE SHEETS
(IN THOUSANDS, EXCEPT SHARE DATA)
ASSETS
| Successor | ||||||||
| June 30, 2015 | June 30, 2014 | |||||||
| Current assets |
||||||||
| Cash and cash equivalents |
$ | 55,675 | $ | 27,533 | ||||
| Accounts receivable, net |
240,110 | 181,089 | ||||||
| Inventories |
171,836 | 144,342 | ||||||
| Prepaid expenses and other current assets |
26,892 | 20,704 | ||||||
| Deferred income taxes |
8,454 | 24,801 | ||||||
|
|
|
|
|
|||||
| Total current assets |
502,967 | 398,469 | ||||||
|
|
|
|
|
|||||
| Property, plant and equipment |
||||||||
| Land |
58,316 | 58,489 | ||||||
| Buildings and improvements |
58,368 | 57,800 | ||||||
| Machinery and equipment |
373,639 | 351,134 | ||||||
| Furniture and fixtures |
13,056 | 14,484 | ||||||
| Construction in progress |
12,255 | 13,153 | ||||||
|
|
|
|
|
|||||
| Total |
515,634 | 495,060 | ||||||
| Less: accumulated depreciation |
(86,691 | ) | (41,594 | ) | ||||
|
|
|
|
|
|||||
| Property, plant and equipment, net |
428,943 | 453,466 | ||||||
|
|
|
|
|
|||||
| Other long-term assets |
||||||||
| Intangible assets, net |
419,733 | 483,943 | ||||||
| Goodwill |
474,901 | 490,738 | ||||||
| Deferred financing costs, net |
4,311 | 4,812 | ||||||
| Deferred income taxes |
14,568 | 1,473 | ||||||
| Other assets |
36,702 | 11,254 | ||||||
|
|
|
|
|
|||||
| Total assets |
$ | 1,882,125 | $ | 1,844,155 | ||||
|
|
|
|
|
|||||
F-5
Table of Contents
MULTI PACKAGING SOLUTIONS GLOBAL HOLDINGS LIMITED
AND SUBSIDIARIES
CONSOLIDATED BALANCE SHEETS (CONTINUED)
(IN THOUSANDS, EXCEPT SHARE DATA)
LIABILITIES AND SHAREHOLDERS’ EQUITY (DEFICIENCY)
| Successor | ||||||||
| June 30, 2015 | June 30, 2014 | |||||||
| Current liabilities |
||||||||
| Accounts payable |
$ | 176,431 | $ | 170,883 | ||||
| Payroll and benefits |
51,606 | 40,006 | ||||||
| Other current liabilities |
46,097 | 33,137 | ||||||
| Short-term foreign borrowings |
3,488 | 7,883 | ||||||
| Current portion of long-term debt |
11,740 | 12,650 | ||||||
| Income taxes payable |
6,022 | 4,269 | ||||||
|
|
|
|
|
|||||
| Total current liabilities |
295,384 | 268,828 | ||||||
| Long-term debt, less current portion |
1,173,161 | 1,112,669 | ||||||
| Deferred income taxes |
93,061 | 120,686 | ||||||
| Other long-term liabilities |
31,829 | 39,440 | ||||||
|
|
|
|
|
|||||
| Total liabilities |
1,593,435 | 1,541,623 | ||||||
|
|
|
|
|
|||||
| Commitments and Contingencies |
||||||||
| Shareholders’ equity (deficiency) |
||||||||
| Contributed capital, £1.00 par value, 207,302,868 shares authorized, issued and outstanding at June 30, 2015 and 2014 |
333,001 | 333,001 | ||||||
| Paid in capital |
7,633 | 2,474 | ||||||
| Accumulated deficit |
(45,365 | ) | (51,864 | ) | ||||
| Accumulated other comprehensive income (loss) |
(13,287 | ) | 12,891 | |||||
|
|
|
|
|
|||||
| Total Multi Packaging Solutions Global Holdings Limited shareholders’ equity |
281,982 | 296,502 | ||||||
| Noncontrolling interest |
6,708 | 6,030 | ||||||
|
|
|
|
|
|||||
| Total shareholders’ equity |
288,690 | 302,532 | ||||||
|
|
|
|
|
|||||
| Total liabilities and shareholders’ equity |
$ | 1,882,125 | $ | 1,844,155 | ||||
|
|
|
|
|
|||||
F-6
Table of Contents
MULTI PACKAGING SOLUTIONS GLOBAL HOLDINGS LIMITED
AND SUBSIDIARIES
CONSOLIDATED STATEMENTS OF OPERATIONS AND COMPREHENSIVE INCOME (LOSS)
(IN THOUSANDS, EXCEPT SHARE AND PER SHARE DATA)
| Successor | Predecessor | |||||||||||||||||
| For the year ended June 30, 2015 |
Period from August 15, 2013 through June 30, 2014 |
Period from July 1, 2013 through August 14, 2013 |
For the year ended June 30, 2013 |
|||||||||||||||
| Net sales |
$ | 1,617,640 | $ | 814,213 | $ | 74,081 | $ | 579,401 | ||||||||||
| Cost of goods sold |
1,285,673 | 668,441 | 58,054 | 456,958 | ||||||||||||||
|
|
|
|
|
|
|
|
|
|||||||||||
| Gross margin |
331,967 | 145,772 | 16,027 | 122,443 | ||||||||||||||
|
|
|
|
|
|
|
|
|
|||||||||||
| Selling, general and administrative expenses |
||||||||||||||||||
| Selling, general and administrative expenses |
247,360 | 135,212 | 9,729 | 76,260 | ||||||||||||||
| Management fees and expenses |
— | — | 264 | 2,315 | ||||||||||||||
| Transaction and other related expenses |
13,630 | 38,844 | 28,370 | 3,080 | ||||||||||||||
|
|
|
|
|
|
|
|
|
|||||||||||
| Total selling, general and administrative expenses |
260,990 | 174,056 | 38,363 | 81,655 | ||||||||||||||
|
|
|
|
|
|
|
|
|
|||||||||||
| Operating income (loss) |
70,977 | (28,284 | ) | (22,336 | ) | 40,788 | ||||||||||||
|
|
|
|
|
|
|
|
|
|||||||||||
| Other income (expense) |
||||||||||||||||||
| Other income, net |
10,625 | 370 | 1,063 | 1,426 | ||||||||||||||
| Debt extinguishment charges |
(1,019 | ) | — | (14,042 | ) | (4,140 | ) | |||||||||||
| Interest expense |
(75,437 | ) | (43,215 | ) | (3,991 | ) | (24,546 | ) | ||||||||||
|
|
|
|
|
|
|
|
|
|||||||||||
| Total other expense, net |
(65,831 | ) | (42,845 | ) | (16,970 | ) | (27,260 | ) | ||||||||||
|
|
|
|
|
|
|
|
|
|||||||||||
| Income (loss) before income taxes |
5,146 | (71,129 | ) | (39,306 | ) | 13,528 | ||||||||||||
| Income tax expense (benefit) |
(1,880 | ) | (19,481 | ) | (15,621 | ) | 4,195 | |||||||||||
|
|
|
|
|
|
|
|
|
|||||||||||
| Net income (loss) |
7,026 | (51,648 | ) | (23,685 | ) | 9,333 | ||||||||||||
| Less: net income attributable to noncontrolling interest |
527 | 216 | — | — | ||||||||||||||
|
|
|
|
|
|
|
|
|
|||||||||||
| Net income (loss) attributable to Multi Packaging Solutions Global Holdings Limited |
6,499 | (51,864 | ) | (23,685 | ) | 9,333 | ||||||||||||
| Preferred stock dividends |
— | — | (25 | ) | (9,275 | ) | ||||||||||||
|
|
|
|
|
|
|
|
|
|||||||||||
| Income available (loss attributable) to common shareholders |
$ | 6,499 | $ | (51,864 | ) | $ | (23,710 | ) | $ | 58 | ||||||||
|
|
|
|
|
|
|
|
|
|||||||||||
| Earnings (loss) per share |
||||||||||||||||||
| Basic |
$ | .03 | $ | (0.35 | ) | $ | (203.74 | ) | $ | 0.50 | ||||||||
|
|
|
|
|
|
|
|
|
|||||||||||
| Diluted |
$ | .03 | $ | (0.35 | ) | $ | (203.74 | ) | $ | 0.49 | ||||||||
|
|
|
|
|
|
|
|
|
|||||||||||
| Weighted-average number of common shares outstanding: |
||||||||||||||||||
| Basic |
207,302,868 | 148,027,204 | 116,373 | 116,110 | ||||||||||||||
|
|
|
|
|
|
|
|
|
|||||||||||
| Diluted |
207,302,868 | 148,027,204 | 116,373 | 119,073 | ||||||||||||||
|
|
|
|
|
|
|
|
|
|||||||||||
| Other comprehensive income (loss) |
||||||||||||||||||
| Cumulative foreign currency translation adjustment |
(38,813 | ) | 5,835 | 731 | 391 | |||||||||||||
| Adjustment on available-for-sale securities |
6 | 9 | 8 | 968 | ||||||||||||||
| Pension adjustments, net |
12,780 | 6,943 | — | — | ||||||||||||||
|
|
|
|
|
|
|
|
|
|||||||||||
| Total other comprehensive income (loss) |
(26,027 | ) | 12,787 | 739 | 1,359 | |||||||||||||
|
|
|
|
|
|
|
|
|
|||||||||||
| Comprehensive income (loss) |
(19,001 | ) | (38,861 | ) | (22,946 | ) | 10,692 | |||||||||||
| Less: comprehensive income attributable to non-controlling interests |
151 | 112 | — | — | ||||||||||||||
|
|
|
|
|
|
|
|
|
|||||||||||
| Comprehensive income attributable to Multi Packaging Solutions Global Holdings Limited |
$ | (19,152 | ) | $ | (38,973 | ) | $ | (22,946 | ) | $ | 10,692 | |||||||
|
|
|
|
|
|
|
|
|
|||||||||||
F-7
Table of Contents
MULTI PACKAGING SOLUTIONS GLOBAL HOLDINGS LIMITED
AND SUBSIDIARIES
CONSOLIDATED STATEMENTS OF SHAREHOLDERS’ EQUITY (DEFICIENCY)
(IN THOUSANDS, EXCEPT SHARE DATA)
| Predecessor | Series B Preferred |
Series C Preferred |
Common Stock | Accumulated dividends in arrears |
Paid-In Capital |
Equity secured receivables |
Accumulated (deficit) |
Accumulated other comprehensive income (loss) |
Noncontrolling interest |
Total shareholders’ equity (deficiency) |
||||||||||||||||||||||||||||||||||||||||||
| Shares | Amount | Shares | Amount | Shares | Amount | |||||||||||||||||||||||||||||||||||||||||||||||
| BALANCE, July 1, 2012 |
123,251 | $ | 1 | 7,750 | $ | — | 115,413 | $ | 1 | $ | 40,274 | $ | 25,250 | $ | (7,844 | ) | $ | (15,532 | ) | $ | (3,045 | ) | $ | — | $ | 39,105 | ||||||||||||||||||||||||||
| Stock issued |
— | — | — | — | 960 | — | — | 1,688 | — | — | — | — | 1,688 | |||||||||||||||||||||||||||||||||||||||
| Dividends accumulated |
— | — | — | — | — | — | 9,275 | (9,275 | ) | — | — | — | — | — | ||||||||||||||||||||||||||||||||||||||
| Contingent stock earned |
— | — | — | — | — | — | — | 427 | — | — | — | — | 427 | |||||||||||||||||||||||||||||||||||||||
| Net income |
— | — | — | — | — | — | — | — | — | 9,333 | — | 9,333 | ||||||||||||||||||||||||||||||||||||||||
| Series B preferred stock redemption |
(121,115 | ) | (1 | ) | — | — | — | — | — | (13,194 | ) | — | (107,920 | ) | — | — | (121,115 | ) | ||||||||||||||||||||||||||||||||||
| Series B preferred stock dividends paid |
— | — | — | — | — | — | (46,358 | ) | — | — | — | — | — | (46,358 | ) | |||||||||||||||||||||||||||||||||||||
| Common stock dividends paid |
— | — | — | — | — | — | — | — | — | (14,162 | ) | — | — | (14,162 | ) | |||||||||||||||||||||||||||||||||||||
| Series C shares exchanged (See Note 15) |
— | — | (7,750 | ) | — | — | — | (2,813 | ) | (4,937 | ) | 4,591 | — | — | — | (3,159 | ) | |||||||||||||||||||||||||||||||||||
| Interest on shareholder note receivable |
— | — | — | — | — | — | — | — | (548 | ) | — | — | — | (548 | ) | |||||||||||||||||||||||||||||||||||||
| Stock compensation expense |
— | — | — | — | — | — | — | 251 | — | — | — | — | 251 | |||||||||||||||||||||||||||||||||||||||
| Fair market value adjustment on an available-for-sale security, net of reclassification adjustment |
— | — | — | — | — | — | — | — | — | — | 968 | — | 968 | |||||||||||||||||||||||||||||||||||||||
| Foreign currency translation adjustment |
— | — | — | — | — | — | — | — | — | — | 391 | — | 391 | |||||||||||||||||||||||||||||||||||||||
|
|
|
|
|
|
|
|
|
|
|
|
|
|
|
|
|
|
|
|
|
|
|
|
|
|
|
|||||||||||||||||||||||||||
| BALANCE, June 30, 2013 |
2,136 | $ | — | — | $ | — | 116,373 | $ | 1 | $ | 378 | $ | 210 | $ | (3,801 | ) | $ | (128,281 | ) | $ | (1,686 | ) | $ | — | $ | (133,179 | ) | |||||||||||||||||||||||||
|
|
|
|
|
|
|
|
|
|
|
|
|
|
|
|
|
|
|
|
|
|
|
|
|
|
|
|||||||||||||||||||||||||||
F-8
Table of Contents
MULTI PACKAGING SOLUTIONS GLOBAL HOLDINGS LIMITED
AND SUBSIDIARIES
CONSOLIDATED STATEMENTS OF SHAREHOLDERS’ EQUITY (DEFICIENCY)
(IN THOUSANDS, EXCEPT SHARE DATA)
| Predecessor | Series B Preferred |
Common Stock | Accumulated dividends in arrears |
Paid-In Capital |
Equity secured receivables |
Accumulated (deficit) |
Accumulated other comprehensive income (loss) |
Noncontrolling interest |
Total shareholders’ equity (deficiency) |
|||||||||||||||||||||||||||||||||||
| Shares | Amount | Shares | Amount | |||||||||||||||||||||||||||||||||||||||||
| BALANCE, June 30, 2013 |
2,136 | $ | — | 116,373 | $ | 1 | $ | 378 | $ | 210 | $ | (3,801 | ) | $ | (128,281 | ) | $ | (1,686 | ) | $ | — | $ | (133,179 | ) | ||||||||||||||||||||
| Dividends accumulated |
— | — | — | — | 25 | (25 | ) | — | — | — | — | — | ||||||||||||||||||||||||||||||||
| Contingent stock earned |
— | — | — | — | — | 52 | — | — | — | — | 52 | |||||||||||||||||||||||||||||||||
| Net loss |
— | — | — | — | — | — | — | (23,685 | ) | — | (23,685 | ) | ||||||||||||||||||||||||||||||||
| Stock compensation expense |
— | — | — | — | — | 53 | — | — | — | — | 53 | |||||||||||||||||||||||||||||||||
| Contingent stock deposited in escrow |
(2,136 | ) | — | — | — | (403 | ) | (898 | ) | — | — | — | — | (1,301 | ) | |||||||||||||||||||||||||||||
| Settlement of shareholder notes |
— | — | — | — | — | — | 3,801 | — | — | — | 3,801 | |||||||||||||||||||||||||||||||||
| Fair market value adjustment on an available-for-sale security |
— | — | — | — | — | — | — | — | 8 | — | 8 | |||||||||||||||||||||||||||||||||
| Foreign currency translation adjustment |
— | — | — | — | — | — | — | — | 731 | — | 731 | |||||||||||||||||||||||||||||||||
|
|
|
|
|
|
|
|
|
|
|
|
|
|
|
|
|
|
|
|
|
|
|
|||||||||||||||||||||||
| BALANCE, August 14, 2013 |
— | $ | — | 116,373 | $ | 1 | $ | — | $ | (608 | ) | $ | — | $ | (151,966 | ) | $ | (947 | ) | $ | — | $ | (153,520 | ) | ||||||||||||||||||||
|
|
|
|
|
|
|
|
|
|
|
|
|
|
|
|
|
|
|
|
|
|
|
|||||||||||||||||||||||
F-9
Table of Contents
MULTI PACKAGING SOLUTIONS GLOBAL HOLDINGS LIMITED
AND SUBSIDIARIES
CONSOLIDATED STATEMENTS OF SHAREHOLDERS’ EQUITY (DEFICIENCY)
(IN THOUSANDS, EXCEPT SHARE DATA)
| Successor | Common Stock | Paid-In Capital |
Accumulated deficit |
Accumulated other comprehensive income (loss) |
Noncontrolling interest |
Total shareholders’ equity |
||||||||||||||||||||||
| Shares | Amount | |||||||||||||||||||||||||||
| BALANCE, August 15, 2013 |
— | $ | — | $ | — | $ | — | $ | — | $ | — | $ | — | |||||||||||||||
| Issuance of common stock |
103,651,434 | 160,660 | 675 | — | — | — | 161,335 | |||||||||||||||||||||
| Mustang shares converted upon reverse merger |
103,651,434 | 172,341 | — | — | — | — | 172,341 | |||||||||||||||||||||
| Acquisition of noncontrolling interest |
— | — | 736 | — | — | 5,918 | 6,654 | |||||||||||||||||||||
| Net loss |
— | — | — | (51,864 | ) | — | 216 | (51,648 | ) | |||||||||||||||||||
| Stock compensation expense |
— | — | 1,063 | — | — | — | 1,063 | |||||||||||||||||||||
| Fair market value adjustment on an available-for-sale security |
— | — | — | — | 9 | — | 9 | |||||||||||||||||||||
| Pension adjustment, net |
— | — | — | — | 6,963 | (20 | ) | 6,943 | ||||||||||||||||||||
| Foreign currency translation adjustment |
— | — | — | — | 5,919 | (84 | ) | 5,835 | ||||||||||||||||||||
|
|
|
|
|
|
|
|
|
|
|
|
|
|
|
|||||||||||||||
| BALANCE, June 30, 2014 |
207,302,868 | 333,001 | 2,474 | (51,864 | ) | 12,891 | 6,030 | 302,532 | ||||||||||||||||||||
| Net income |
— | — | — | 6,499 | — | 527 | 7,026 | |||||||||||||||||||||
| Stock compensation expense |
— | — | 5,159 | — | — | — | 5,159 | |||||||||||||||||||||
| Fair market value adjustment on an available-for-sale security |
— | — | — | — | 6 | — | 6 | |||||||||||||||||||||
| Pension adjustment, net |
— | — | — | — | 12,780 | — | 12,780 | |||||||||||||||||||||
| Foreign currency translation adjustment |
— | — | — | — | (38,964 | ) | 151 | (38,813 | ) | |||||||||||||||||||
|
|
|
|
|
|
|
|
|
|
|
|
|
|
|
|||||||||||||||
| BALANCE, June 30, 2015 |
207,302,868 | $ | 333,001 | $ | 7,633 | $ | (45,365 | ) | $ | (13,287 | ) | $ | 6,708 | $ | 288,690 | |||||||||||||
|
|
|
|
|
|
|
|
|
|
|
|
|
|
|
|||||||||||||||
F-10
Table of Contents
MULTI PACKAGING SOLUTIONS GLOBAL HOLDINGS LIMITED
AND SUBSIDIARIES
CONSOLIDATED STATEMENTS OF CASH FLOWS
(IN THOUSANDS)
| Successor | Predecessor | |||||||||||||||||
| For the year ended June 30, 2015 |
Period from August 15, 2013 to June 30, 2014 |
Period from July 1, 2013 to August 14, 2013 |
For the year ended June 30, 2013 |
|||||||||||||||
| Operating activities |
||||||||||||||||||
| Net income (loss) |
$ | 7,026 | $ | (51,648 | ) | $ | (23,685 | ) | $ | 9,333 | ||||||||
| Adjustments to reconcile net income (loss) to net cash and cash equivalents provided by (used in) operating activities: |
||||||||||||||||||
| Depreciation expense |
78,035 | 41,831 | 2,824 | 27,457 | ||||||||||||||
| Amortization expense |
58,121 | 34,036 | 1,233 | 12,109 | ||||||||||||||
| Deferred income taxes |
(9,477 | ) | (24,648 | ) | (15,377 | ) | 3,983 | |||||||||||
| Stock compensation |
5,159 | 1,063 | 109 | 2,317 | ||||||||||||||
| Equity in earnings of unconsolidated subsidiary |
(39 | ) | (225 | ) | (23 | ) | (599 | ) | ||||||||||
| Dividends received from unconsolidated subsidiary |
12 | 407 | 225 | 381 | ||||||||||||||
| Unrealized foreign currency (gain) loss |
(11,355 | ) | (381 | ) | — | — | ||||||||||||
| Interest on mandatorily redeemable preferred stock |
— | — | — | 290 | ||||||||||||||
| Gain on return of Series C preferred shares |
— | — | — | (3,159 | ) | |||||||||||||
| Shareholder note forgiveness |
— | — | 2,783 | — | ||||||||||||||
| Loss on extinguishment of debt |
1,019 | — | 11,642 | 4,140 | ||||||||||||||
| Gain on settlement of pension liability |
— | — | (676 | ) | — | |||||||||||||
| Impairment on investments |
— | 1,006 | — | 2,112 | ||||||||||||||
| Other |
4,104 | 2,263 | 1,806 | (1,313 | ) | |||||||||||||
| Change in assets and liabilities: |
||||||||||||||||||
| Accounts receivable |
13,615 | 9,427 | (12,810 | ) | (992 | ) | ||||||||||||
| Inventories |
3,021 | 7,509 | (1,985 | ) | 5,491 | |||||||||||||
| Prepaid expenses and other current assets |
1,137 | 2,390 | 516 | (365 | ) | |||||||||||||
| Other assets |
(10,246 | ) | (2,446 | ) | (129 | ) | 55 | |||||||||||
| Accounts payable |
(17,775 | ) | 21,110 | 8,534 | (2,162 | ) | ||||||||||||
| Payroll and benefits |
3,530 | (8,003 | ) | 1,749 | (1,996 | ) | ||||||||||||
| Other current liabilities |
(4,239 | ) | (16,556 | ) | 26,209 | 263 | ||||||||||||
| Income taxes payable |
2,653 | (2,248 | ) | (217 | ) | (1,772 | ) | |||||||||||
| Other long-term liabilities |
(15,684 | ) | 5,043 | (3,692 | ) | — | ||||||||||||
|
|
|
|
|
|
|
|
|
|||||||||||
| Net cash and cash equivalents provided by (used in) operating activities |
108,617 | 19,930 | (964 | ) | 55,573 | |||||||||||||
|
|
|
|
|
|
|
|
|
|||||||||||
| Investing activities |
||||||||||||||||||
| Additions to property, plant and equipment |
$ | (59,535 | ) | $ | (39,888 | ) | $ | (2,741 | ) | $ | (22,433 | ) | ||||||
| Additions to intangible assets |
(207 | ) | (209 | ) | (21 | ) | (118 | ) | ||||||||||
| Proceeds from sale of assets |
6,907 | 2,226 | — | 1,137 | ||||||||||||||
| Acquisitions of businesses, net of cash acquired |
(137,269 | ) | (116,337 | ) | — | — | ||||||||||||
|
|
|
|
|
|
|
|
|
|||||||||||
| Net cash and cash equivalents used in investing activities |
(190,104 | ) | (154,208 | ) | (2,762 | ) | (21,414 | ) | ||||||||||
|
|
|
|
|
|
|
|
|
|||||||||||
| Financing activities |
||||||||||||||||||
| Issuance of preferred and common stock |
$ | — | $ | 585 | $ | — | $ | 121 | ||||||||||
| Proceeds from issuance of long-term debt |
133,650 | 172,137 | — | 372,582 | ||||||||||||||
| Proceeds from short-term borrowings |
171,456 | 66,369 | — | 18,288 | ||||||||||||||
| Payments on short-term borrowings |
(174,442 | ) | (80,494 | ) | (295 | ) | (19,788 | ) | ||||||||||
| Payments on long-term debt |
(15,816 | ) | (6,555 | ) | (499 | ) | (189,698 | ) | ||||||||||
| Debt issuance costs |
(5,020 | ) | (6,974 | ) | — | (13,260 | ) | |||||||||||
| Common stock dividends |
— | — | — | (14,162 | ) | |||||||||||||
| Preferred stock cash dividends paid / redemption of shares |
— | — | — | (176,430 | ) | |||||||||||||
|
|
|
|
|
|
|
|
|
|||||||||||
| Net cash and cash equivalents provided by (used in) financing activities |
109,828 | 145,068 | (794 | ) | (22,347 | ) | ||||||||||||
|
|
|
|
|
|
|
|
|
|||||||||||
| Effect of exchange rate changes on cash and cash equivalents |
(199 | ) | 97 | 50 | (3 | ) | ||||||||||||
|
|
|
|
|
|
|
|
|
|||||||||||
| Increase (decrease) in cash and cash equivalents |
28,142 | 10,887 | (4,470 | ) | 11,809 | |||||||||||||
| Cash and cash equivalents—Beginning |
27,533 | 16,646 | 27,123 | 15,314 | ||||||||||||||
|
|
|
|
|
|
|
|
|
|||||||||||
| Cash and cash equivalents—Ending |
$ | 55,675 | $ | 27,533 | $ | 22,653 | $ | 27,123 | ||||||||||
|
|
|
|
|
|
|
|
|
|||||||||||
F-11
Table of Contents
The Company
“MPS”, the “Company”, and the “Successor” refer to Multi Packaging Solutions Global Holdings Limited. MPS is a leading, global provider of value-added packaging solutions to a diverse customer base across the healthcare, consumer, and multi-media end markets. MPS provides its customers with print-based specialty packaging, including premium-folding cartons, labels and inserts across a variety of substrates and finishes. The former Multi Packaging Solutions, Inc., and, as the context may require, its subsidiaries, are referred to herein as the “Predecessor”.
On August 15, 2013, the Predecessor and its primary shareholder, IPC/Packaging LLC (solely in its capacity as shareholder representative), entered into an Agreement and Plan of Merger to be purchased by Mustang Parent Corp. (“Mustang”), an entity controlled by funds advised by Madison Dearborn Partners, LLC (“MDP”) (the “Transaction”). Following completion of the Transaction, Mustang owned 100% of the outstanding equity of the Predecessor.
On February 14, 2014, MDP and the Carlyle Group (“Carlyle”) entered into a Combination Agreement, whereby MDP contributed 100% of the outstanding equity of Mustang to a subsidiary of Chesapeake Finance 2, Ltd. (“CF2”), in exchange for a 50% equity interest in CF2 (the “Merger”). The other 50% equity interest in CF2 is held by funds advised by Carlyle. CF2 emerged from the Merger as the new Parent entity, incorporated under the laws of England and Wales. Subsequent to the Merger, the name of CF2 was changed to Multi Packaging Solutions Global Holdings Limited. The Merger was accounted for as a reverse acquisition in accordance with Financial Accounting Standards Board (“FASB”), Accounting Standards Codification (“ASC”) 805, whereby MPS was the accounting acquirer. The equity of the Successor was adjusted to reflect the exchange of shares pursuant to the Combination Agreement.
Note 2—Summary of Significant Accounting Policies
Basis of Presentation
The accompanying consolidated financial statements have been prepared in conformity with accounting principles generally accepted in the United States of America (“GAAP”). The financial information set forth herein reflects: (a) the consolidated results of operations and cash flows of the Successor for the year ended June 30, 2015, the period from August 15, 2013 through June 30, 2014 and the Predecessor for the period from July 1, 2013 through August 14, 2013 and the fiscal year ended June 30, 2013 and (b) the financial position of the Successor as of June 30, 2015 and 2014.
Principles of Consolidation
The consolidated financial statements include the accounts of Multi Packaging Solutions Global Holdings Limited and its controlled subsidiaries (collectively, referred to as the “Company”). All material intercompany accounts and transactions have been eliminated in consolidation.
Use of Estimates
The preparation of the consolidated financial statements in conformity with GAAP requires management to make estimates and assumptions that affect the amounts reported in the consolidated financial statements and accompanying notes. Actual results could differ from those estimates.
Foreign Currency
The functional currencies of the Company’s foreign subsidiaries are the respective local currencies. Assets and liabilities of the Company’s foreign subsidiaries and affiliates are translated into U.S. dollars at the fiscal year-
F-12
Table of Contents
Note 2—Summary of Significant Accounting Policies (continued)
Foreign Currency (continued)
end exchange rates, and revenues and expenses are translated at average monthly exchange rates. Translation gains and losses are recorded as a component of accumulated other comprehensive (loss) income within the accompanying consolidated statements of shareholders’ equity (deficiency). Transaction gains and losses resulting from transactions entered into under contracts in a currency other than the subsidiary’s functional currency are accounted for on a transactional basis as a credit or charge to operations. The Company recognized foreign currency transaction gains (losses) in the amounts of $12,171, $777, $364 and $(220) for the year ended June 30, 2015, the period from August 15, 2013 through June 30, 2014, the period from July 1, 2013 through August 14, 2013, and for the fiscal year ended June 30, 2013, respectively, which is recorded in Other income (expense) in the accompanying consolidated statements of operations and comprehensive income (loss).
Cash and Cash Equivalents
The Company considers all short-term investments with a maturity of three months or less when purchased to be cash equivalents. The Company has restricted cash deposited in an escrow account relating to contingent consideration from the June 9, 2011 acquisition of CD Cartondruck AG. Restricted cash was $1,985 and $2,425 as of June 30, 2015 and June 30, 2014, and is included as a component of Other Assets on the consolidated balance sheet.
Accounts Receivable and Allowance for Doubtful Accounts
Accounts receivable are presented net of an allowance for doubtful accounts of $2,932 and $2,689 as of June 30, 2015 and 2014, respectively. The allowance for doubtful accounts reduces receivables to amounts that are expected to be collected. In estimating the allowance, management considers factors such as current overall and industry-specific economic conditions, statutory requirements, historical and anticipated customer performance, historical experience with write-offs and the level of past-due amounts. Changes in these conditions may result in additional allowances. After all attempts to collect a receivable have failed, the receivable is written off against the allowance.
Inventories
Inventories are stated at the lower of cost or market value. Inventory costs include materials, labor and manufacturing overhead. Cost is determined by the first-in, first-out method. Obsolete inventory is identified based on an analysis of inventory for known obsolescence issues and a write-down or write-off is provided based on this analysis.
Property, Plant and Equipment
Property, plant and equipment was adjusted to fair value on August 15, 2013, which represents a new cost basis. Expenditures for maintenance and repairs are charged to current operations, while major improvements that materially extend useful lives are capitalized. Depreciation is computed over the estimated useful lives of the assets using the straight-line method as follows:
| Buildings and improvements |
3-40 years | |
| Machinery and equipment |
3-13 years | |
| Furniture and fixtures |
3-7 years |
Depreciation expense was $78,035, $41,831, $2,824 and $27,457 for the year ended June 30, 2015, the period from August 15, 2013 through June 30, 2014, the period from July 1, 2013 through August 14, 2013, and for the year ended June 30, 2013, respectively.
F-13
Table of Contents
Note 2—Summary of Significant Accounting Policies (continued)
Deferred Financing Costs
Costs relating to obtaining debt financing are capitalized and amortized over the term of the related debt using effective interest method. Amortization of deferred financing costs charged to interest expense was $871, $478, $279 and $1,906 for the year ended June 30, 2015, the period from August 15, 2013 through June 30, 2014, the period from July 1, 2013 through August 14, 2013, and for the year ended June 30, 2013, respectively.
Goodwill and Intangible Assets
Goodwill represents the cost of acquired businesses in excess of the fair value of the assets acquired and liabilities assumed of such businesses at the acquisition date. Goodwill is not amortized, but is subject to impairment tests. The Company reviews the carrying amounts of goodwill by reporting unit at least annually on April 1 (the annual assessment date), or more frequently when indicators of impairment are present, to determine if goodwill may be impaired. The Company may first assess qualitative factors to determine whether it is more likely than not that the fair value of goodwill is less than its carrying value. The Company would not be required to quantitatively determine the fair value of goodwill unless the Company determines, based on the qualitative assessment, that it is more likely than not that its fair value is less than the carrying value.
If the Company determines that the fair value is less than the carrying value based on the qualitative assessment, a quantitative assessment based upon discounted cash flow and market approach analyses is performed to determine the estimated fair value of the reporting units. The Company includes assumptions about expected future operating performance as part of a discounted cash flow analysis to estimate fair value. If the carrying values of goodwill are not recoverable, based on the discounted cash flow analysis, management performs the next step, which compares the fair value of the reporting unit to the carrying value of the tangible and intangible net assets of the reporting units. Goodwill is considered impaired if the recorded fair value of the tangible and intangible net assets exceeds the fair value of the reporting unit.
The Company did not recognize any impairment charges for goodwill during any of the periods presented, as the Company’s annual impairment testing indicated that all reporting unit goodwill fair values exceeded their respective carrying values.
Intangible assets have been acquired through various business acquisitions and include customer relationships, developed technology, licensing agreements, and a photo library. The intangible assets are initially valued at their acquisition date using either a discounted cash flow model or relief from royalty method. The relief from royalty method is used for developed technology and licensing agreements and assumes that if the acquired company did not own the intangible asset or intellectual property, it would be willing to pay a royalty for its use. The benefit of ownership of the intellectual property is valued as the relief from the royalty expense that would otherwise be incurred. Intangible assets are amortized on a straight-line basis, except for customer relationship intangibles that are amortized on an accelerated basis. Useful lives vary by asset type and are determined based on the period over which the intangible asset is expected to contribute directly or indirectly to the Company’s future cash flows.
Impairment of Long-Lived Assets
The Company reviews its definite-lived long-lived assets for impairment whenever events or changes in circumstances indicate that carrying amount of the asset may not be recoverable. Such circumstances could include, but are not limited to (1) a significant decrease in the market value of an asset, (2) a significant adverse change in the extent or manner in which an asset is used, or (3) an accumulation of costs significantly in excess of the amount originally expected for the acquisition of an asset. The Company measures the carrying amount of the asset against the estimated undiscounted future cash flows associated with it. Should the carrying value of the asset being evaluated exceed the estimated undiscounted future cash flows, an impairment loss would be
F-14
Table of Contents
Note 2—Summary of Significant Accounting Policies (continued)
Impairment of Long-Lived Assets (continued)
indicated, at which point recognition of the impairment would occur based on a determination of the asset’s fair value. There was no impairment with respect to the Company’s definite-lived long-lived assets for any periods presented.
Investments in Unconsolidated Entities
Investments in unconsolidated entities over which the Company has significant influence are accounted for under the equity method of accounting, whereby the investment is carried at the cost of the acquisition, plus the Company’s equity in the undistributed earnings or losses. Investments in entities over which the Company does not have the ability to exert significant influence over the investees’ operating and financing activities are accounted for under the cost method of accounting. If there is objective evidence that indicates an equity or cost method investment is impaired, a loss is recognized. For the period from August 15, 2013 through June 30, 2014, the Company recorded an impairment loss of $1,006 related to an equity method investment (see Note 8). For the year ended June 30, 2013, the Company recorded an impairment loss of $1,000 related to its cost method investment (see Note 8). Unconsolidated entities were $0 and $50 as of June 30, 2015 and 2014, respectively, and are recorded in other assets on the Company’s consolidated balance sheets.
Available-For-Sale Securities
The Company determines the appropriate classification of its investments in debt and equity securities at the time of purchase and reevaluates such determinations at each balance sheet date. Securities not classified as held to maturity or as trading, are classified as available for sale, and are carried at fair market value, with the unrealized gains and losses, net of tax, included in the determination of comprehensive income. The Company reviews its holdings on a regular basis to determine if there has been an other-than-temporary decline in market value. If it is determined that an other-than-temporary decline exists in a marketable equity security, the Company writes down the investment to its fair market value and records the related write-down as an investment loss in its consolidated statement of operations and comprehensive income. For the year ended June 30, 2013, the Company recorded an impairment loss on its available-for-sale security of $1,112 (see Note 8). Available-for-sale securities were $253 and $238 as of June 30, 2015 and 2014, respectively, and are recorded in other assets on the Company’s consolidated balance sheets.
Derivative Instruments
The Company uses derivative instruments to manage its exposure to certain risks relating to its ongoing business operations. The Company has not elected hedge accounting for these derivative instruments, and accordingly are valued at fair value with unrealized gains or losses reported in earnings during the period of the change. No derivative instruments are entered into for speculative purposes.
One risk managed by the Company using derivative instruments is interest rate risk. To manage interest rate exposure, the Company enters into hedge transactions (interest rate swaps) using derivative financial instruments. The objective of entering into interest rate swaps is to eliminate the variability of cash flows in the London Interbank Offered Rate (“LIBOR”) interest payments associated with variable-rate loans over the life of the loans. As changes in interest rates affect the future cash flow of interest payments, the hedges provide a synthetic offset to interest rate movements.
The Company is also exposed to foreign-currency exchange-rate fluctuations in the normal course of business, primarily related to the Great Britain Pound Sterling, Euros and the Polish Zloty denominated liabilities within its international subsidiaries whose functional currency is other than the U.S. dollar. The Company manages these fluctuations, in part, using non-deliverable forward foreign exchange contracts and foreign currency forward
F-15
Table of Contents
Note 2—Summary of Significant Accounting Policies (continued)
Derivative Instruments (continued)
contracts, that are intended to offset changes in cash flow attributable to currency exchange movements. These contracts are intended primarily to economically address exposure related to merchandise inventory expenditures made by the Company’s international subsidiaries whose functional currency is other than the U.S. dollar.
For the year ended June 30, 2015 and the period from August 15, 2013 through June 30, 2014, the change in the fair value of interest rate swaps was $(1,918) and $391, respectively, which is recorded in other income (expense), net in the accompanying statements of operations and comprehensive income (loss). For the year ended June 30, 2015 and for the period from August 15, 2013 through June 30, 2014, the change in the fair value of the forward foreign-exchange contracts was $(124), and $157, which is recorded as selling, general and administrative expenses in the accompanying statement of operations and comprehensive income (loss). The Company had no derivative instruments in the other periods presented.
Fair Value Measurements
The fair value of a financial instrument is the amount that would be received in an asset sale or paid to transfer a liability in an orderly transaction between unaffiliated market participants. Assets and liabilities measured at fair value are categorized based on whether the inputs are observable in the market and the degree that the inputs are observable. The categorization of financial instruments within the valuation hierarchy is based on the lowest level of input that is significant to the fair value measurement. The hierarchy is prioritized into three levels with the highest priority given to Level 1, as these are the most transparent or reliable. The following fair value hierarchy is used in selecting inputs, with the highest priority given to Level 1, as these are the most transparent or reliable:
| • | Level 1—inputs to the valuation methodology are quoted prices (unadjusted) for identical assets or liabilities in active markets. |
| • | Level 2—inputs to the valuation methodology include quoted prices for similar assets and liabilities in active markets, and inputs that are observable for the asset or liability, either directly or indirectly, for substantially the full term of the financial instrument. |
| • | Level 3—inputs to the valuation methodology are unobservable and significant to the fair value measurement. |
The Company calculates the fair value of financial instruments and includes this additional information in the notes to the consolidated financial statements where the fair value is different from the book value of those financial instruments. When the fair value approximates book value, no additional disclosure is made.
Concentrations
Financial instruments that potentially subject the Company to concentrations of credit risk consist primarily of cash and cash equivalents and accounts receivable.
The Company places its cash and cash equivalents with high quality financial institutions and limits the amount of credit exposure with any one institution. At times, the Company’s cash may be uninsured or in deposit accounts that exceed the Federal Deposit Insurance Corporation insurance limits or comparable insurance in Europe.
Concentrations of credit risk with respect to accounts receivable are limited because a large number of geographically diverse customers make up the Company’s customer base, thus spreading the credit risk. The Company controls credit risk through credit approvals, credit limits, and monitoring procedures. The Company
F-16
Table of Contents
Note 2—Summary of Significant Accounting Policies (continued)
Concentrations (continued)
performs credit evaluations of its customers, but generally does not require collateral to support accounts receivable. At June 30, 2015 and June 30, 2014, no customers accounted for more than 10% of accounts receivable. For the year ended June 30, 2015 and the period from August 15, 2013 through June 30, 2014, no customers accounted for more than 10% of net sales. For the period from July 1, 2013 through August 14, 2013, one customer accounted for approximately 11% of net sales. During the year ended June 30, 2013, one customer accounted for approximately 12% of net sales.
Revenue Recognition
The Company produces packaging products, principally cartons, labels, inserts and rigid packaging for sale to manufacturers of branded and private label consumer goods, pharmaceutical, medical and multi-media products. Products are printed on board, paper or plastic substrates and converted via printing presses and oftentimes subsequently finished in a folding or gluing or other operation. The Company records revenue on the sales of products manufactured when title to the product transfers, which is generally at the time of shipment to the customer.
In all of the above cases, revenue is recorded only when (i) persuasive evidence of an arrangement exists, (ii) delivery has occurred, (iii) the fee is fixed and determinable and (iv) collectability of the sales is reasonably assured. Provisions for discounts and rebates to customers, estimated returns and allowances and other adjustments are provided for in the same period the related sales are recorded when they are determined to be probable and estimable.
Shipping and Handling Fees and Expenses
The Company records shipping and handling related fees charged to customers in net sales and records the related expenses in costs of goods sold in the consolidated statements of operations and comprehensive income (loss).
Advertising Costs
Advertising costs are expensed as incurred. Advertising costs for the year ended June 30, 2015, the period from August 15, 2013 through June 30, 2014, the period from July 1, 2013 through August 14, 2013, and for the year ended June 30, 2013 were approximately $828, $585, $28 and $122, respectively. Advertising costs are included in selling, general and administrative expenses in the accompanying consolidated statements of operations and comprehensive income (loss).
Equity-Based Compensation
The Company and its affiliates have sponsored an equity compensation plan and other equity-based compensation more fully described in Note 20. The Predecessor measured the cost of employee services received in exchange for equity-based compensation based upon the grant date fair value of the equity issued. The Successor measured the cost of employee services received in exchange for equity-based compensation based on the fair value of the equity award at the balance sheet date. The cost is recognized as compensation expense over the requisite service period, which is generally as the equity instruments vest.
Excess tax benefits realized from the exercise of equity-based awards are classified in cash flows from financing activities. The Predecessor has elected the “with and without approach” regarding ordering of windfall tax benefits to determine whether the windfall tax benefit actually reduces taxes payable in the current year. Under this approach, recognition of the deferred tax assets and related tax benefits associated with the excess tax benefits on equity-based compensation occurs when the related tax deduction reduces taxes payable.
F-17
Table of Contents
Note 2—Summary of Significant Accounting Policies (continued)
Income Taxes
The Company recognizes income taxes in accordance with guidance established by GAAP, which requires an asset and liability approach for financial accounting and reporting for income taxes and establishes a minimum threshold for financial statement recognition of the benefit of tax positions. The provision for income taxes is based upon income or loss after adjustment for those items that are not considered in the determination of taxable income.
Deferred income taxes represent the tax effects of differences between the financial reporting and tax bases of the Company’s assets and liabilities at the enacted tax rates in effect for the years in which the differences are expected to reverse. The Company evaluates the recoverability of deferred tax assets and establishes a valuation allowance when it is more likely than not that some portion or all of the deferred tax assets will not be realized.
Earnings (Loss) Per Share
Basic earnings (loss) per share are computed by dividing net income (loss) available to common shareholders by the weighted average number of common shares outstanding during the period. Diluted earnings per share is computed using the weighted average number of common shares and, if dilutive, potential common shares outstanding during the period. Potential common shares consist of the incremental common shares issuable upon the exercise of stock options (using the treasury stock method).
| Successor | Predecessor | |||||||||||||||||
| For the year ended June 30, 2015 |
Period from August 15, 2013 through June 30, 2014 |
Period from July 1, 2013 through August 14, 2013 |
For the year ended June 30, 2013 |
|||||||||||||||
| Numerator: |
||||||||||||||||||
| Net income (loss) available to common shareholders—basic and diluted |
$ | 6,499 | $ | (51,864 | ) | $ | (23,710 | ) | $ | 58 | ||||||||
|
|
|
|
|
|
|
|
|
|||||||||||
| Successor | Predecessor | |||||||||||||||||
| For the year ended June 30, 2015 |
Period from August 15, 2013 through June 30, 2014 |
Period from July 1, 2013 through August 14, 2013 |
For the year ended June 30, 2013 |
|||||||||||||||
| Denominator: |
||||||||||||||||||
| Weighted average number of common shares outstanding—basic |
207,302,868 | 148,027,204 | 116,373 | 116,110 | ||||||||||||||
| Effect of dilutive stock options |
— | — | — | 2,963 | ||||||||||||||
|
|
|
|
|
|
|
|
|
|||||||||||
| Weighted average number of common shares outstanding—diluted |
207,302,868 | 148,027,204 | 116,373 | 119,073 | ||||||||||||||
| Basic earnings (loss) per share |
$ | 0.03 | $ | (0.35 | ) | $ | (203.74 | ) | $ | 0.50 | ||||||||
|
|
|
|
|
|
|
|
|
|||||||||||
| Dilutive earnings (loss) per common share |
$ | 0.03 | $ | (0.35 | ) | $ | (203.74 | ) | $ | 0.49 | ||||||||
|
|
|
|
|
|
|
|
|
|||||||||||
Stock options and unvested restricted stock units in the amounts of 1,992,000 and 9,810 for the period from August 15, 2013 through June 30, 2014 and the period from July 1, 2013 through August 14, 2013, respectively, are excluded from the diluted earnings (loss) per common share as their inclusion would be anti-dilutive. There were no stock options in the Company’s stock for the year ended June 30, 2015.
F-18
Table of Contents
Note 2—Summary of Significant Accounting Policies (continued)
Recently Issued Accounting Pronouncements
In February 2013, the FASB issued Accounting Standards Update (“ASU”) 2013-02, Reporting of Amounts Reclassified out of Accumulated Other Comprehensive Income, which adds additional disclosure requirements for items reclassified out of accumulated other comprehensive income. This guidance was effective for private companies for financial periods beginning after December 15, 2013. ASU 2013-02 did not have a material effect on the Company’s consolidated financial position, results of operations or cash flows. In April 2014, FASB issued ASU 2014-08, Reporting Discontinued Operations and Disclosures of Disposals of Components of an Entity, which amends the requirements for reporting discontinued operations. This ASU requires the disposal of a component of an entity or a group of components of an entity to be reported in discontinued operations if the disposal represents a strategic shift that will have a major effect on the entity’s operations and financial results. This ASU also requires additional disclosures about discontinued operations and disclosures about the disposal of a significant component of an entity that does not qualify as a discontinued operation. This ASU is effective prospectively for reporting periods beginning after December 15, 2014, with early adoption permitted. The adoption of this ASU did not have a material impact on the Company’s consolidated financial position, results of operations or cash flows.
In May 2014, the FASB issued ASU No. 2014-09, Revenue from Contracts with Customers. This ASU supersedes the revenue recognition requirements in Accounting Standards Codification 605—Revenue Recognition and most industry-specific guidance throughout the Codification. The standard requires that an entity recognize revenue to depict the transfer of promised goods or services to customers in an amount that reflects the consideration to which the company expects to be entitled in exchange for those goods or services. On July 9, 2015, the FASB modified ASU 2014-09 to be effective for annual reporting periods beginning after December 15, 2017, including interim periods within that reporting period. As modified, the FASB permits the adoption of the new revenue standard early, but not before the annual periods beginning after December 31, 2016. A public organization would apply the new revenue standard to all interim reporting periods within the year of adoption. The Company is currently evaluating the impact of the adoption of this standard on its consolidated financial position and results of operations.
In June 2014, the FASB issued ASU No. 2014-12, Accounting for Share-Based Payments When the Terms of an Award Provide That a Performance Target Could Be Achieved after the Requisite Service Period. This ASU requires that a performance target that affects vesting, and that could be achieved after the requisite service period, be treated as a performance condition. As such, the performance target should not be reflected in estimating the grant date fair value of the award. This update further clarifies that compensation cost should be recognized in the period in which it becomes probable that the performance target will be achieved and should represent the compensation cost attributable to the period(s) for which the requisite service has already been rendered. The amendments in this ASU are effective for annual periods and interim periods within those annual periods beginning after December 15, 2015. Earlier adoption is permitted. The adoption of this standard is not expected to have a material impact on the Company’s consolidated financial position and results of operations.
In April 2015, the FASB issued ASU No. 2015-03, “Simplifying the Presentation of Debt Issuance Costs.” This standard amends existing guidance to require the presentation of debt issuance costs in the balance sheet as a deduction from the carrying amount of the related debt liability instead of a deferred charge. It is effective for annual reporting periods beginning after December 15, 2015, but early adoption is permitted. The Company is currently evaluating the impact of the adoption of this standard on its consolidated financial position and results of operations.
In July 2015, the FASB issued ASU No. 2015-11 “Inventory (Topic 330): Simplifying the Measurement of Inventory.” This standard requires entities to measure most inventory “at the lower of cost and net realizable value,” thereby simplifying the current guidance under which an entity must measure inventory at the lower of cost or market. The new standard will not apply to inventories that are measured by using either the last-in, first-
F-19
Table of Contents
Note 2—Summary of Significant Accounting Policies (continued)
Recently Issued Accounting Pronouncements (continued)
out (LIFO) method or the retail inventory method. The new standard will be effective for fiscal years beginning after December 15, 2016, and interim periods in fiscal years beginning after December 15, 2016. The Company is currently evaluating the impact of the adoption of this standard on its consolidated financial position and results of operations.
Note 3—Acquisitions
MDP Transaction
On August 15, 2013, the Predecessor and its primary shareholder, IPC/Packaging LLC (solely in its capacity as shareholder representative), entered into the Transaction under which the Predecessor was purchased by Mustang, an entity controlled by funds advised by MDP. Following completion of the Transaction, Mustang owned 100% of the outstanding equity of the Predecessor.
MDP acquired 100% of the stock of the Predecessor for an aggregate purchase price of approximately $646,749. The purchase price was allocated to the assets acquired and liabilities assumed based on their estimated fair values at the date of acquisition. The fair value estimates for the assets and liabilities assumed were based on estimates and analysis using widely recognized valuation models. The purchase price allocation included acquired intangible assets related to customer relationships and photo library. The excess of the purchase price over the fair value of net assets acquired was allocated to goodwill which is not deductible for income tax purposes.
The allocation of the purchase price to the fair value of assets acquired and liabilities assumed is as follows:
| Assets |
||||
| Cash and cash equivalents |
$ | 16,646 | ||
| Accounts receivable |
70,985 | |||
| Inventories |
51,668 | |||
| Prepaid expenses and other current assets |
5,878 | |||
| Deferred income taxes |
3,438 | |||
| Property, plant and equipment |
147,845 | |||
| Other assets |
4,588 | |||
| Intangible assets |
229,052 | |||
| Goodwill |
269,084 | |||
| Less: Liabilities |
||||
| Current liabilities |
(70,122 | ) | ||
| Deferred income taxes |
(73,678 | ) | ||
| Other long-term liabilities |
(8,635 | ) | ||
|
|
|
|||
| Purchase price |
$ | 646,749 | ||
|
|
|
|||
The consolidated statement of cash flows excludes certain non-cash activity of the Company on August 15, 2013 resulting from the Transaction. The following table reconciles the Predecessor’s ending cash at August 14, 2013 to the Successor’s beginning cash at August 15, 2013:
| Cash at August 14, 2013 (Predecessor): |
$ | 22,653 | ||
| Issuance of common stock |
160,750 | |||
| Issuance of long-term debt, net |
465,561 | |||
| Settlement of Predecessor debt |
(369,047 | ) | ||
| Settlement of Predecessor equity and option holders |
(244,240 | ) | ||
| Settlement of transaction and other fees |
(19,031 | ) | ||
|
|
|
|||
| Cash at August 15, 2013 (Successor) |
$ | 16,646 | ||
|
|
|
F-20
Table of Contents
Note 3—Acquisitions (continued)
Chesapeake/Multi Packaging Solutions Merger
On February 14, 2014, MDP and the Carlyle Group (“Carlyle”) entered into a Combination Agreement, whereby MDP contributed 100% of the outstanding equity of Mustang to a subsidiary of Chesapeake Finance 2, Ltd. (“CF2”), in exchange for a 50% equity interest in CF2. The other 50% equity interest in CF2 is held by funds advised by Carlyle. CF2 emerged from the Merger as the new Parent entity, incorporated under the laws of England and Wales. Subsequent to the Merger, the name of CF2 was changed to Multi Packaging Solutions Global Holdings Limited.
In accordance with the terms of the Merger Agreement, Chesapeake issued 103,651,434 shares of Chesapeake stock for all of the outstanding shares of MPS. Additionally, MPS paid Chesapeake an equalization payment of approximately $101,917. Chesapeake, an international manufacturer of consumer packaging, is a leading supplier of printed folding cartons, ridged cartons, tubes, booklets, leaflets and labels, as well as other specialist packaging to the pharmaceutical, healthcare, confectionery, spirits, agrichemical and food markets with annual sales of approximately $841,323. This Merger creates an extensive global network strategically positioned to service the healthcare, consumer, personal care, confectionery, premium drinks, and multi-media markets with manufacturing locations in the United States, Europe, and Asia. The merger was accounted for as a reverse acquisition in accordance with ASC 805, whereby MPS was the accounting acquirer. The equity of the Successor was adjusted to reflect the exchange of shares pursuant to the Merger Agreement.
The Company recorded Chesapeakes’s assets and liabilities based on their estimated fair values at the date of the Merger. The assets included intangible assets related to customer relationships and technology. The fair value estimates for the assets and liabilities assumed were based on estimates and analysis using widely recognized valuation models. The goodwill comprised of expected synergies from combining Chesapeake’s operations with that of the Company, reduction in future combined research and development expenses and overall overhead costs. The goodwill is not deductible for tax purposes.
The operations of the acquired Chesapeake business are included in the Company’s consolidated statements of operations and comprehensive income (loss) since February 14, 2014. For the period from August 15, 2013 through June 30, 2014, $306,928 is included in the consolidated net sales and $(11,345) in the consolidated net income (loss).
The allocation of the purchase price to the fair value of the assets and liabilities assumed is as follows:
| Assets |
||||
| Cash and cash equivalents |
$ | 35,175 | ||
| Accounts receivable |
107,246 | |||
| Inventories |
90,001 | |||
| Prepaid expenses and other current assets |
16,532 | |||
| Deferred income taxes |
10,730 | |||
| Property, plant and equipment |
290,528 | |||
| Other assets |
1,847 | |||
| Intangible assets |
261,748 | |||
| Goodwill |
201,632 | |||
| Less: Liabilities |
||||
| Current liabilities |
(168,259 | ) | ||
| Debt |
(487,781 | ) | ||
| Deferred income taxes |
(57,125 | ) | ||
| Other long-term liabilities |
(28,015 | ) | ||
|
|
|
|||
| Purchase price |
$ | 274,259 | ||
|
|
|
|||
F-21
Table of Contents
Note 3—Acquisitions (continued)
JLI Acquisition, Inc.
On April 4, 2014, the Company acquired 100% of the stock of JLI Acquisition, Inc. (“Jet”) for a purchase price of $36,294, comprised of cash consideration of $36,140 and contingent consideration of $154. The contingent consideration is based upon future performance of the acquired business, with a maximum potential payment of $500. The Company acquired Jet to create a comprehensive end-to-end solution for the credit, debit, gift, loyalty and insurance card markets.
The purchase price was allocated to the assets acquired and liabilities assumed based on their estimated fair values at the date of acquisition. The purchase price allocation included acquired intangible assets related to customer relationships, patented technology and licensing agreement. The fair value estimates for the assets and liabilities acquired were based on estimates and analysis using widely recognized valuation models. Adjustments may be made to the estimated fair values during the measurement period as the Company’s obtains additional information. Goodwill is comprised of expected synergies from combining Jet’s operations with that of the Company. The goodwill is not deductible for income tax purposes.
The operations of Jet are included in the Company’s consolidated statements of operations and comprehensive income (loss) since April 4, 2014. For the period from August 15, 2013 through June 30, 2014, $10,680 is included in the consolidated net sales and $155 is included in consolidated net income (loss).
The allocation of the purchase price to the fair value of the assets and liabilities assumed is as follows:
| Assets |
||||
| Cash and cash equivalents |
$ | 334 | ||
| Accounts receivable |
6,971 | |||
| Inventories |
6,486 | |||
| Prepaid expenses and other current assets |
317 | |||
| Deferred income taxes |
402 | |||
| Property, plant and equipment |
10,055 | |||
| Intangible assets |
12,630 | |||
| Goodwill |
11,609 | |||
| Less: Liabilities |
||||
| Current liabilities |
(6,682 | ) | ||
| Deferred income taxes |
(5,822 | ) | ||
| Other long-term liabilities |
(6 | ) | ||
|
|
|
|||
| Purchase price |
$ | 36,294 | ||
|
|
|
|||
Integrated Printing Solutions, LLC
On April 4, 2014, the Company acquired 70% of the outstanding Class A Common Units of Integrated Printing Solutions, LLC (“IPS”) for an aggregate purchase price of approximately $14,708 in cash. The Company acquired IPS to create a comprehensive end-to-end solution for the credit, debit, gift, loyalty and insurance card markets.
The purchase price was allocated to the assets acquired and liabilities assumed based on their estimated fair values at the date of acquisition, including a 30% non-controlling interest. The fair value estimates for the assets acquired, liabilities assumed, and the non-controlling interest for the acquisition were based on estimates and analysis using widely recognized valuation models. Adjustments may be made to the estimated fair values during the measurement period as the Company’s obtains additional information.
F-22
Table of Contents
Note 3—Acquisitions (continued)
Integrated Printing Solutions, LLC (continued)
The purchase price allocation included acquired intangible assets related to developed technology and customer relationships. Goodwill is comprised of expected synergies from combining IPS’s operations with that of the Company, reduction in future combined research and development expenses and overall overhead costs. The goodwill is not deductible for income tax purposes.
The operations of IPS are included in the Company’s consolidated statements of operations and comprehensive income (loss) since April 4, 2014. For the period from August 15, 2013 through June 30, 2014, $9,260 is included in consolidated net sales and $(200) is included in consolidated net income (loss).
The allocation of the purchase price to the fair value of the assets and liabilities assumed is as follows:
| Assets |
||||
| Cash and cash equivalents |
$ | 928 | ||
| Accounts receivable |
4,005 | |||
| Inventories |
1,788 | |||
| Prepaid expenses and other current assets |
292 | |||
| Property, plant and equipment |
6,906 | |||
| Intangible assets |
5,560 | |||
| Goodwill |
5,197 | |||
| Less: Liabilities |
||||
| Current liabilities |
(6,521 | ) | ||
| Other long-term liabilities |
(147 | ) | ||
| Non-controlling interest |
(3,300 | ) | ||
|
|
|
|||
| Purchase price |
$ | 14,708 | ||
|
|
|
|||
Armstrong Packaging Limited
On July 8, 2014, the Company acquired 100% of Armstrong Packaging Limited (“Armstrong”) for an aggregate purchase price of approximately $12,747 in cash. The Company acquired Armstrong to expand the Company’s global platform for luxury packaging, gift sets, travel retail, and commemorative editions. Armstrong’s product development and rigid box manufacturing complements the Company’s existing manufacturing, creative design, project management, and global sourcing capabilities.
The preliminary purchase price was allocated to the assets acquired and liabilities assumed based on their estimated fair values at the date of acquisition. The fair value estimates for the assets acquired and liabilities assumed for the acquisition were based on estimates and analysis using widely recognized valuation models. Adjustments may be made to the estimated fair values during the measurement period as the Company obtains additional information.
Goodwill is comprised of expected synergies from combining Armstrong’s operations with that of the Company, reduction in future combined research and development expenses and overall overhead costs. The goodwill is not deductible for income tax purposes.
The operations of Armstrong are included in the Company’s consolidated statements of operations and comprehensive income (loss) since July 8, 2014. For the year ended June 30, 2015, $14,456 is included in the consolidated net sales and $1,905 is included in consolidated net income (loss).
F-23
Table of Contents
Note 3—Acquisitions (continued)
Armstrong Packaging Limited (continued)
The preliminary allocation of the purchase price to the fair value and related tax effects of the assets and liabilities assumed pending finalization of, but not limited to, tangible and intangible assets is as follows:
| Assets |
||||
| Cash and cash equivalents |
$ | 3,866 | ||
| Accounts receivable |
2,986 | |||
| Inventories |
2,844 | |||
| Prepaid expenses and other current assets |
352 | |||
| Property, plant and equipment |
1,474 | |||
| Other long-term assets |
125 | |||
| Goodwill |
3,446 | |||
| Less: Liabilities |
||||
| Current liabilities |
(2,346 | ) | ||
|
|
|
|||
| Preliminary purchase price |
$ | 12,747 | ||
|
|
|
|||
Presentation Products Group
On February 28, 2015, the Company acquired 100% of the outstanding Class A Common Units of Presentation Products Group (“Presentation Products”) for an aggregate purchase price of approximately $15,615 in cash. The Company acquired Presentation Products to expand its manufacturing operations and sourcing expertise in rigid packaging.
The preliminary purchase price was allocated to the assets acquired and liabilities assumed based on their estimated fair values at the date of acquisition. The fair value estimates for the assets acquired and the liabilities assumed for the acquisition were based on estimates and analysis using widely recognized valuation models. Adjustments may be made to the estimated fair values during the measurement period as the Company obtains additional information.
The preliminary purchase price allocation included acquired intangible assets related to customer relationships. Goodwill is comprised of expected synergies from combining Presentation Products operations with that of the Company, reduction in future combined research and development expenses and overall overhead costs. The goodwill is not deductible for income tax purposes.
The operations of Presentation Products are included in the Company’s consolidated statements of operations and comprehensive income (loss) since February 28, 2015. For the year ended June 30, 2015, $12,529 is included in consolidated net sales and $250 is included in consolidated net income.
F-24
Table of Contents
Note 3—Acquisitions (continued)
Presentation Products Group (continued)
The preliminary allocation of the purchase price to the fair value and related tax effects of the assets and liabilities assumed pending finalization of, but not limited to, tangible and intangible assets is as follows:
| Assets |
||||
| Cash and cash equivalents |
$ | 1,621 | ||
| Accounts receivable |
7,355 | |||
| Inventories |
7,947 | |||
| Prepaid expenses and other current assets |
807 | |||
| Property, plant and equipment |
1,259 | |||
| Intangibles |
6,973 | |||
| Goodwill |
2,664 | |||
| Less: Liabilities |
||||
| Current liabilities |
(7,496 | ) | ||
| Other long-term liabilities |
(5,515 | ) | ||
|
|
|
|||
| Preliminary purchase price |
$ | 15,615 | ||
|
|
|
|||
AGI Shorewood
On November 21, 2014, the Company acquired the Non-European Folding Carton and Lithographic Printing Business of AGI Global Holdings Coöperatief U.A. and the US Folding Carton and Lithographic Printing Business of Atlas AGI Holdings LLC (collectively, “ASG”) for an aggregate purchase price of approximately $134,309 in cash. The Company acquired ASG to further expand the Company’s global network and customer base.
The preliminary purchase price was allocated to the assets acquired and liabilities assumed based on their estimated fair values at the date of acquisition. The fair value estimates for the assets acquired and liabilities assumed were based on estimates and analysis using widely recognized valuation methods. Adjustments may be made to the estimated fair values during the measurement period as the Company’s obtains additional information.
The preliminary purchase price allocation included acquired intangible assets related to developed technology and customer relationships. Goodwill is comprised of expected synergies from combining ASG’s operations with that of the Company, reduction in future combined research and development expenses and overall overhead costs. The goodwill is not deductible for income tax purposes.
The operations of ASG are included in the Company’s consolidated statements of operations and comprehensive income (loss) since November 21, 2014. For the year ended June 30, 2015, $173,936 is included in the consolidated net sales and $4,974 is recorded in consolidated net income.
F-25
Table of Contents
Note 3—Acquisitions (continued)
AGI Shorewood (continued)
The preliminary allocation of the purchase price to the fair value and related tax effects of the assets and liabilities assumed pending finalization of, but not limited to, tangible and intangible assets is as follows:
| Assets |
||||
| Cash and cash equivalents |
$ | 19,401 | ||
| Accounts receivable |
76,435 | |||
| Inventories |
33,312 | |||
| Prepaid expenses and other current assets |
6,795 | |||
| Deferred income taxes |
15,256 | |||
| Property, plant and equipment |
49,683 | |||
| Other long-term assets |
3,610 | |||
| Less: Liabilities |
||||
| Current liabilities |
(64,130 | ) | ||
| Other long-term liabilities |
(6,568 | ) | ||
|
|
|
|||
| Preliminary purchase price |
$ | 133,794 | ||
|
|
|
|||
Pro Forma Financial Information (Unaudited)
Unaudited pro forma net sales, net income (loss) and earnings (loss) per share data, calculated under the premise that the acquisitions of IPS, Jet, Chesapeake, Armstrong, Presentation Products and the MDP Transaction occurred at the beginning of the earliest period presented, are as follows:
| For the year ended June 30, 2015 |
For the year ended June 30, 2014 |
For the year ended June 30, 2013 |
||||||||||
| Net sales |
$ | 1,807,513 | $ | 1,902,429 | $ | 1,793,139 | ||||||
| Net income (loss) |
13,645 | (120,420 | ) | (51,954 | ) | |||||||
| Earnings (loss) per share |
||||||||||||
| Basic |
.07 | (.58 | ) | (447.00 | ) | |||||||
| Diluted |
.07 | (.58 | ) | (447.00 | ) | |||||||
| Weighted average shares outstanding |
||||||||||||
| Basic |
207,302,868 | 207,302,868 | 116,110 | |||||||||
| Diluted |
207,302,868 | 207,302,868 | 116,110 | |||||||||
CD Cartondruck AG
The Company has contingent consideration relating to the June 9, 2011 purchase of CD Cartondruck AG (“Cartondruck”), of $2,136 payable on June 9, 2016. The value of the contingent consideration is being recorded as future compensation expense on a straight-line basis over the period of a required employment agreement. Compensation expense of $427, $374, $53 and $427 for the year ended June 30, 2015, the period from August 15, 2013 through June 30, 2014, the period from July 1, 2013 through August 14, 2013, and the year ended June 30, 2013, respectively, is recorded in selling, general and administrative expenses in the consolidated statements of operations and comprehensive income (loss). The contingent consideration is subject to satisfaction of certain employment contingencies. The Company has a restricted cash balance in the amounts of $1,946 and $2,425 at June 30, 2015 and June 30, 2014, respectively, which is recorded in other assets on the accompanying consolidated balance sheets.
Additionally, with the purchase of Cartondruck, there could also be an additional payment (the “Earnout”), which is based on the future performance of the acquired company. The Earnout will be recorded as future compensation ratably over the period it becomes probable of achievement. The Earnout ranges from $0 to $3,475
F-26
Table of Contents
Note 3—Acquisitions (continued)
CD Cartondruck AG (continued)
based on cumulative earnings before interest, taxes, depreciation and amortization (“EBITDA” as defined in the Share Purchase Agreement) achieved over a five-year period. As of June 30, 2015 and 2014, the Company concluded the Earnout was not probable of achievement and, therefore, no amount has been recognized to date.
Transaction Expenses
Transaction expenses are summarized below for the year ended June 30, 2015, for the period from August 15, 2013 through June 30, 2014, the period from July 1, 2013 through August 14, 2013, and for the year ended June 30, 2013:
| Successor | Predecessor | |||||||||||||||||
| For the year ended June 30, 2015 |
Period from August 15, 2013 through June 30, 2014 |
Period from July 1, 2013 through August 14, 2013 |
For the year ended June 30, 2013 |
|||||||||||||||
| The Transaction |
$ | 579 | $ | 16,953 | $ | 28,354 | $ | — | ||||||||||
| The Merger |
5,138 | 18,889 | — | — | ||||||||||||||
| Jet |
428 | 549 | — | — | ||||||||||||||
| IPS |
69 | 566 | — | — | ||||||||||||||
| Armstrong |
202 | — | — | — | ||||||||||||||
| ASG |
4,861 | — | — | — | ||||||||||||||
| Presentation Products |
257 | — | — | — | ||||||||||||||
| Other transaction related expenses |
2,096 | 1,887 | 16 | 3,080 | ||||||||||||||
|
|
|
|
|
|
|
|
|
|||||||||||
| Transaction expenses |
$ | 13,630 | $ | 38,844 | $ | 28,370 | $ | 3,080 | ||||||||||
|
|
|
|
|
|
|
|
|
|||||||||||
Note 4—Inventories
Inventories consisted of the following:
| Successor | ||||||||
| June 30, 2015 |
June 30, 2014 |
|||||||
| Raw materials |
$ | 60,549 | $ | 39,290 | ||||
| Work in progress |
28,677 | 28,155 | ||||||
| Finished goods |
104,658 | 81,099 | ||||||
|
|
|
|
|
|||||
| Total inventories |
193,884 | 148,544 | ||||||
| Reserves |
(22,048 | ) | (4,202 | ) | ||||
|
|
|
|
|
|||||
| Inventories |
$ | 171,836 | $ | 144,342 | ||||
|
|
|
|
|
|||||
F-27
Table of Contents
Note 5—Intangible Assets
Intangible assets consisted of the following:
| Successor |
||||||||||||||||
| June 30, 2015 |
Gross Carrying Amount |
Accumulated Amortization |
Net | Estimated Useful Life (Years) |
||||||||||||
| Customer relationships |
$ | 479,778 | $ | (78,457 | ) | $ | 401,321 | 14 | ||||||||
| Developed technology |
19,907 | (5,508 | ) | 14,399 | 5 | |||||||||||
| Photo library |
1,259 | (403 | ) | 856 | 5 | |||||||||||
| Licensing agreements |
3,524 | (367 | ) | 3,157 | 4 | |||||||||||
|
|
|
|
|
|
|
|||||||||||
| Total |
$ | 504,468 | $ | (84,735 | ) | $ | 419,733 | |||||||||
|
|
|
|
|
|
|
|||||||||||
| Successor |
||||||||||||||||
| June 30, 2014 |
Gross Carrying Amount |
Accumulated Amortization |
Net | Estimated Useful Life (Years) |
||||||||||||
| Customer relationships |
$ | 491,851 | $ | (29,924 | ) | $ | 461,927 | 14 | ||||||||
| Developed technology |
21,522 | (1,653 | ) | 19,869 | 5 | |||||||||||
| Photo library |
1,052 | (169 | ) | 883 | 5 | |||||||||||
| Licensing agreements |
1,330 | (66 | ) | 1,264 | 4 | |||||||||||
|
|
|
|
|
|
|
|||||||||||
| Total |
$ | 515,755 | $ | (31,812 | ) | $ | 483,943 | |||||||||
|
|
|
|
|
|
|
|||||||||||
Estimated future amortization expense related to intangible assets at June 30, 2015 is as follows:
| For the Year Ending June 30, |
Amount | |||
| 2016 |
$ | 55,121 | ||
| 2017 |
53,956 | |||
| 2018 |
50,084 | |||
| 2019 |
42,270 | |||
| 2020 |
34,046 | |||
| Thereafter |
184,256 | |||
|
|
|
|||
| Future Amortization |
$ | 419,733 | ||
|
|
|
|||
Amortization expense for the year ended June 30, 2015, the period from August 15, 2013 through June 30, 2014, the period from July 1, 2013 through August 14, 2013, and the year ended June 30, 2013 was $53,668, $31,812, $958 and $12,109, respectively.
F-28
Table of Contents
Note 6—Goodwill
As a result of the Transaction, the carrying value of the Company’s goodwill as of August 15, 2013 was eliminated and new goodwill was recorded. The changes in the carrying value of goodwill by reportable segment are as follows:
| Predecessor |
North America | Europe | Asia | Total | ||||||||||||
| Balance at June 30, 2013 and August 14, 2013 |
$ | 63,289 | $ | — | $ | — | $ | 63,289 | ||||||||
| Successor |
||||||||||||||||
| Balance at August 15, 2013 |
$ | — | $ | — | $ | — | $ | — | ||||||||
| Purchase accounting adjustments (Note 3): |
||||||||||||||||
| Impact of the Transaction |
213,145 | 55,939 | — | 269,084 | ||||||||||||
| Impact of the Merger |
20,833 | 180,623 | 176 | 201,632 | ||||||||||||
| Acquisition of Jet |
11,609 | — | — | 11,609 | ||||||||||||
| Acquisition of IPS |
5,197 | — | — | 5,197 | ||||||||||||
| Impact of foreign exchange |
— | 3,216 | — | 3,216 | ||||||||||||
|
|
|
|
|
|
|
|
|
|||||||||
| Balance at June 30, 2014 |
250,784 | 239,778 | 176 | 490,738 | ||||||||||||
| Purchase accounting adjustments (Note 3): |
||||||||||||||||
| Acquisition of Armstrong |
— | 3,446 | — | 3,446 | ||||||||||||
| Acquisition of Presentation Products |
— | 1,998 | 666 | 2,664 | ||||||||||||
| Impact of foreign exchange and other |
— | (21,947 | ) | — | (21,947 | ) | ||||||||||
|
|
|
|
|
|
|
|
|
|||||||||
| Balance at June 30, 2015 |
$ | 250,784 | $ | 223,275 | $ | 842 | $ | 474,901 | ||||||||
|
|
|
|
|
|
|
|
|
|||||||||
Note 7—Fair Value of Financial Instruments
The following table sets forth the Company’s financial assets and liabilities carried at fair value on a recurring basis by level within the fair value hierarchy:
| Successor | ||||||||||||||||
| June 30, 2015 | ||||||||||||||||
| Level 1 | Level 2 | Level 3 | Total | |||||||||||||
| Assets: |
||||||||||||||||
| Cash and cash equivalents |
$ | 55,675 | $ | — | $ | — | $ | 55,675 | ||||||||
| Restricted cash |
1,985 | — | — | 1,985 | ||||||||||||
| Available for sale securities |
253 | — | — | 253 | ||||||||||||
| Foreign currency contracts |
— | 57 | — | 57 | ||||||||||||
| Liabilities: |
||||||||||||||||
| Interest rate swap |
— | (2,988 | ) | — | (2,988 | ) | ||||||||||
| Foreign currency swap |
— | (34 | ) | — | (34 | ) | ||||||||||
| Successor | ||||||||||||||||
| June 30, 2014 | ||||||||||||||||
| Level 1 | Level 2 | Level 3 | Total | |||||||||||||
| Assets: |
||||||||||||||||
| Cash and cash equivalents |
$ | 27,533 | $ | — | $ | — | $ | 27,533 | ||||||||
| Restricted cash |
2,425 | — | — | 2,425 | ||||||||||||
| Available-for-sale securities |
238 | — | — | 238 | ||||||||||||
| Interest rate swap |
— | 2,761 | — | 2,761 | ||||||||||||
| Foreign currency contracts |
— | 184 | — | 184 | ||||||||||||
| Liabilities: |
||||||||||||||||
| Interest rate swap |
— | (3,831 | ) | — | (3,831 | ) | ||||||||||
| Foreign currency forward contracts |
— | (38 | ) | — | (38 | ) | ||||||||||
F-29
Table of Contents
Note 7—Fair Value of Financial Instruments (continued)
Available-for-sale securities are reported at their estimated fair value based on quoted market prices from a recognized pricing service and are recorded in other assets in the consolidated balance sheets. The fair value of interest rate swap contracts are indicative values based on mid-market levels as of the close of business on the balance sheet date. The valuations are derived from the banks’ proprietary models based upon well-recognized financial principles and reasonable estimates about relevant future market conditions.
The Company maintains two amortizing interest rate swaps that mature in December 2017. The swaps are being used to hedge the exposure to changes in the market LIBOR or EURIBOR rates. At June 30, 2015, one of the swaps had a notional amount of $182,322, whereby the Company pays a fixed rate of interest of 1.1649% and receives a variable rate based on LIBOR on the amortizing notional amount. This swap had a fair value of $260 and is included in other long term liabilities on the consolidated balance sheet. The other swap had a notional amount of $148,360, whereby the Company pays a fixed rate of interest of 1.0139% and receives a variable rate based on EURIBOR (Euro Interbank Offered Rate) on the amortizing notional amount. This swap had a fair value of $2,728 and is included in other long term liabilities on the consolidated balance sheet.
Note 8—Other Income (Expense), net
Other income (expense), net is comprised of the following for the year ended June 30, 2015, the period from August 15, 2013 through June 30, 2014, the period from July 1, 2013 through August 14, 2013, and for the year ended June 30, 2013:
| Successor | Predecessor | |||||||||||||||||
| For the year ended June 30, 2015 |
Period from August 15, 2013 through June 30, 2014 |
Period from July 1, 2013 through August 14, 2013 |
For the year ended June 30, 2013 |
|||||||||||||||
| Equity in net earnings of unconsolidated entities |
$ | 138 | $ | 225 | $ | 23 | $ | 599 | ||||||||||
| Gain on retirement of Series C preferred stock (see Note 14) |
— | — | — | 3,159 | ||||||||||||||
| Foreign currency gains (losses) |
12,171 | 777 | 364 | (220 | ) | |||||||||||||
| Gain on settlement of multiemployer pension liability |
— | — | 676 | — | ||||||||||||||
| Impairment on investments |
— | (1,006 | ) | — | (2,112 | ) | ||||||||||||
| (Loss)/gain on derivatives |
(2,307 | ) | 391 | — | — | |||||||||||||
| Other income (loss) |
623 | (17 | ) | — | — | |||||||||||||
|
|
|
|
|
|
|
|
|
|||||||||||
| Other income, net |
$ | 10,625 | $ | 370 | $ | 1,063 | $ | 1,426 | ||||||||||
|
|
|
|
|
|
|
|
|
|||||||||||
During the year ended June 30, 2011, the Company invested $1,093 for a 50% ownership in a SR3 Solutions, LLC (“SR3”), a packaging brokerage business, which is accounted for using the equity method of accounting. The Company recorded its portion of the net earnings of SR3 for the period of August 15, 2013 through June 30, 2014, the period from July 1, 2013 through August 14, 2013, and the year ended June 30, 2013 in the amount of $225, $23, and $599, respectively. The Company received cash dividends from SR3 of $407, $225, and $381 for the period from August 15, 2013 through June 30, 2014, the period from July 1, 2013 through August 14, 2013, and for the year ended June 30, 2013, respectively. In June 2014 the two principals of SR3 informed the Company that they would not renew their employment agreements that were to expire in August 2014 and began discussions to dissolve the partnership. Due to the principals’ decision the Company determined the investment was fully impaired and has recorded an impairment loss of $1,006 for the period from August 15, 2013 through June 30, 2014.
The Company maintains an investment in IMO Entertainment LLC (“IMO”) with an original cost of $1,000 for a 5% ownership. The investment is accounted for using the cost method. IMO is a provider of online audio and video services offering a selection of television shows, music, movies, clips, eBooks, games, audiobooks, music
F-30
Table of Contents
Note 8—Other Income (Expense), net (continued)
videos, and other content. Due to IMO’s lack of resources and the inability of IMO to generate enough revenue to support costs, the Company determined the investment was fully impaired and has recorded an impairment loss of $1,000 for the year ended June 30, 2013.
The Company maintains an investment in Zoo Digital Group PLC (“Zoo”) with an original cost of $1,341 for a 9% ownership. Zoo is a provider of software and software-led services for the filmed entertainment and pharmaceutical markets. At June 30, 2015 and 2014, the fair market value of Zoo was $253 and $238, respectively. The investment is classified as an available-for-sale security. At June 30, 2013, management determined the decline in the fair value of Zoo was other than temporary, and recognized an impairment loss of $1,112.
Note 9—Accounts Receivable Securitization
The Company previously had an accounts receivable factoring arrangement to sell on a regular basis up to €12,000 ($15,608) of certain accounts receivable of its foreign subsidiary in Germany to a foreign financial institution at a discount rate of 0.21% and an interest surcharge of 1.90% on annual sales. At June 30, 2013, approximately €8,555 ($11,127) of accounts receivables were sold under this factoring arrangement. The Company was required to continue to service sold accounts receivable and maintain credit insurance, although title to the balances belonged with the financial institution, and no recourse or interests had been retained by the Company. These accounts receivable and the related funding are not included in the Company’s balance sheet. Proceeds received from the sale of the accounts receivables are included in cash flows from operating activities on the accompanying consolidated statements of cash flows. This factoring arrangement was terminated effective June 29, 2014.
Note 10—Indebtedness
Total borrowings outstanding at June 30, 2015 and 2014 are summarized as follows:
| Successor | ||||||||
| June 30, 2015 |
June 30, 2014 |
|||||||
| Short-term foreign borrowings |
$ | 3,488 | $ | 7,883 | ||||
| Term notes: |
||||||||
| Bonds Payable, due August 2021, net of discount |
196,327 | 195,727 | ||||||
| Dollar Tranche A Term Loan, due August 2020, net of discount |
119,109 | 120,002 | ||||||
| Dollar Tranche B Term Loans, due August 2020, net of discount |
319,822 | 320,734 | ||||||
| Dollar Tranche C Term Loans, due August 2020, net of discount |
130,030 | — | ||||||
| Sterling Term Loan, due September 2020, net of discount |
219,933 | 242,329 | ||||||
| Euro Term Loan, due September 2020, net of discount |
189,831 | 231,122 | ||||||
| Other borrowings: |
||||||||
| Foreign debt |
8,049 | 14,483 | ||||||
| Other financing |
1,800 | 922 | ||||||
|
|
|
|
|
|||||
| Total borrowings outstanding |
1,188,389 | 1,133,202 | ||||||
| Less: short-term foreign borrowings and current portion of long-term debt |
(15,228 | ) | (20,533 | ) | ||||
|
|
|
|
|
|||||
| Long-term debt, less current portion |
$ | 1,173,161 | $ | 1,112,669 | ||||
|
|
|
|
|
|||||
F-31
Table of Contents
Note 10—Indebtedness (continued)
Scheduled annual future maturities of debt are as follows:
| For the Year Ending June 30, |
||||
| 2016 |
$ | 15,228 | ||
| 2017 |
8,727 | |||
| 2018 |
7,564 | |||
| 2019 |
7,321 | |||
| 2020 |
6,579 | |||
| Thereafter |
1,142,970 | |||
|
|
|
|||
| Total |
$ | 1,188,389 | ||
|
|
|
|||
Short-Term Foreign Borrowings
The Company finances the working capital needs of certain foreign operations using short-term borrowing arrangements in various currencies. At June 30, 2015, there were borrowings outstanding under these arrangements and additional borrowing capacity of $3,488 and $6,685, respectively. At June 30, 2014, there were borrowings outstanding under these arrangements and additional borrowing capacity of $7,883 and $3,865, respectively. The weighted average interest rate on these arrangements was 6.0% and 5.7%, respectively, at June 30, 2015 and 2014. The short-term foreign borrowing arrangements are secured by land and buildings with a carrying value totaling $12,521 at June 30, 2015.
Bonds Payable
On August 15, 2013, the Company issued $200,000 principal amount of its 8.5% Bonds Payable due 2021 (the “Bonds Payable”) in a private placement offering without registration rights. Interest on the Bonds Payable is payable semiannually. The Bonds Payable are governed by a Base Indenture and a First Supplemental Indenture between the Company and Wells Fargo Bank N.A., as trustee (collectively the “2013 Indenture”). The Senior Notes are the Company’s unsecured and unsubordinated obligations, ranking equally in right of payment to all of the Company’s existing and future unsecured and unsubordinated indebtedness and are guaranteed on an unsubordinated, unsecured basis by certain of the Company’s subsidiaries. The Bonds are not entitled to mandatory redemption or sinking fund payments. The Company may redeem the Bonds in whole or in part at any time and from time to time for cash at the redemption prices described in the 2013 Indenture.
Credit Agreement
On February 14, 2014, the Company entered into an Amended and Restated Credit Agreement, as subsequently amended, (collectively, the “Credit Agreement”) with Barclays Bank PLC as Administrative Agent and certain other participating banks. The Credit Agreement provides for various borrowings under term notes and revolving credit facilities. The term notes provided under the Credit Agreement are as follows: $122,000 Dollar Tranche A Term Loan (the “Term Loan A”), $280,000 Dollar Tranche B Term Loan (the “Term Loan B”), £145,000 Sterling Term Loan (the “Sterling Loan”), and £145,000 Euro Term Loan (the “Euro Loan”) (collectively, the “Term Notes”). The revolving credit facilities provided under the Credit Agreement are as follows: $50,000 Dollar Revolving Credit Facility (the “US Dollar Revolver”) and £50,000 Multi Currency Revolving Credit Facility (the “Non-US Dollar Revolver”). On April 4, 2014 the Company borrowed an additional $50,000 under the B Term Loan, the proceeds were used to complete the Jet and IPS acquisitions (see Note 3). No amounts were outstanding under the US Dollar Revolver or the non-US Dollar Revolver at June 30, 2015 and 2014. Obligations under the Credit Agreement are guaranteed by substantially all of the Company’s assets.
The Term Loan A and Term Loan B bear interest equal to the greater of a) Barclay’s prime rate, b) 0.50% above the Federal Funds Rate or c) one month Euro Dollar rate plus 1.00% plus an applicable margin of 2.25%, or the
F-32
Table of Contents
Note 10—Indebtedness (continued)
Credit Agreement (continued)
LIBOR rate of 1.00% plus an applicable margin of 3.25%. The Sterling Loan bears interest equal to the greater of a) LIBOR rate or b) 1.00% plus an applicable margin of 5.0%. The Euro Loan bears interest equal to the greater of a) LIBOR rate or b) 1.00% plus an applicable margin of 4.5%.
The Company had no amounts outstanding and $135,000 in available aggregate borrowings under the US Dollar Revolver or the non-US Dollar Revolver at June 30, 2015. The US Dollar Revolver bears interest equal to the greater of a) Barclay’s prime rate, or b) 0.50% above the Federal Funds Rate plus an applicable margin of 2.25% or the LIBOR rate plus an applicable margin of 3.25%. The Company is also required to pay an unused commitment fee of 0.5%. The Non-US Dollar Revolver bears interest equal to LIBOR plus 4.0%. The Company is also required to pay an unused commitment fee of 1.6%. The Company is required to remain compliant with certain covenants under its various debt instruments, including a Total Net Leverage Ratio, as defined in the Credit Agreement. The Company was in compliance with all covenants under its various debt instruments as of June 30, 2015.
On November 21, 2014, the Company entered into a Second Incremental Joinder Agreement and Amendment with Barclays Bank PLC as Administrative Agent and certain other participating banks. This amended agreement provided the Company borrowings in the amount of $135,000 under a term loan Dollar Tranche C (“Term Loan C”). The proceeds were used to complete the ASG acquisition (see Note 3). Term Loan C bears interest equal to or the LIBOR rate of 1.00% plus an applicable margin of 3.25%.
On December 16, 2014, the Company entered into the Fourth Amendment to the Credit Agreement with Barclays Bank PLC as Administrative Agent and certain other participating banks. This amendment reduced the applicable margin on the Euro Loan to 1% plus an applicable margin of 3.75% and on the Sterling Loan to 1% plus an applicable margin of 4.5%.
Extinguishment of Debt
On August 15, 2013, the Company settled the remaining principal balance of its previous First and Second Lien Credit Agreements dated December 6, 2012 of $368,600, together with accrued interest and fees of $490. Upon completion of such payment, the First and Second Lien Credit Agreements were terminated in their entirety.
On December 16, 2014, the Company entered into the Fourth Amendment to the Credit Agreement, as discussed above, and recorded a loss on extinguishment of debt in the amount of $1,019 for the pro rata share of the deferred financing fees and original issue discount that was extinguished which is recorded in the accompanying statements of operations and comprehensive income (loss).
As result of these debt retirements, the Company recorded a loss on the extinguishment of debt as follows:
| Successor | Predecessor | |||||||||||||||||
| For the year ended June 30, 2015 |
For the period August 15, 2013 through June 30, 2014 |
For the period July 1, 2013 through August 14, 2013 |
For the year ended June 30, 2013 |
|||||||||||||||
| Prepayment fee |
$ | — | $ | — | $ | 2,400 | $ | — | ||||||||||
| Write-off of original issue discount |
690 | — | — | — | ||||||||||||||
| Write-off of deferred financing fees on debt |
329 | — | 11,642 | 4,140 | ||||||||||||||
|
|
|
|
|
|
|
|
|
|||||||||||
| Total loss on extinguishment of debt |
$ | 1,019 | $ | — | $ | 14,042 | $ | 4,140 | ||||||||||
|
|
|
|
|
|
|
|
|
|||||||||||
F-33
Table of Contents
Note 10—Indebtedness (continued)
Foreign Debt
The Company’s foreign debt bears interest at rates ranging from 2.15% to 5.35%, with varying maturities through 2021. At June 30, 2015 and 2014, the weighted-average interest rate on these foreign debt instruments was approximately 3.4% and 3.8%, respectively.
The foreign debt instruments are generally issued in support of specific capital expenditures and are secured by the underlying value of these assets. The carrying value of these secured assets approximates $18,615 at June 30, 2015.
Cash paid for interest was approximately $70,609, $41,456, $3,703 and $22,871 for the year ended June 30, 2015, the period from August 15, 2013 through June 30, 2014, the period from July 1, 2013 through August 14, 2013, and the year ended June 30, 2013, respectively.
During the year ended June 30, 2015, the period from August 15, 2013 through June 30, 2014, the period from July 1, 2013 through August 14, 2013 and for the year ended June 30, 2013, respectively, the Company amortized debt discount of $3,582, $2,189, $— and $—, respectively.
Note 11—Accumulated Other Comprehensive Income (Loss)
Comprehensive income (loss) represents net earnings and any revenue, expenses, gains and losses that, under U.S. GAAP, are excluded from net earnings and recognized directly as a component of stockholders’ equity.
The change in accumulated other comprehensive income (loss) during the year ended June 30, 2015, the period from August 15, 2013 through June 30, 2014, the period from July 1, 2013 through August 14, 2013 and for the year ended June 30, 2013 is as follows:
| Foreign Currency Translation Adjustments |
Available for Sale Securities |
Pension Adjustments |
Total | |||||||||||||
| Predecessor |
||||||||||||||||
| Balance as of July 1, 2012 |
$ | (2,077 | ) | $ | (968 | ) | $ | — | $ | (3,045 | ) | |||||
| Other comprehensive income (loss) before reclassifications (1) |
391 | (144 | ) | — | 247 | |||||||||||
| Amounts reclassified from other comprehensive income (loss) (2) |
— | 1,112 | — | 1,112 | ||||||||||||
|
|
|
|
|
|
|
|
|
|||||||||
| Balance as of June 30, 2013 |
$ | (1,686 | ) | $ | — | $ | — | $ | (1,686 | ) | ||||||
|
|
|
|
|
|
|
|
|
|||||||||
| Other comprehensive income (loss) before reclassifications (1) |
731 | 8 | — | 739 | ||||||||||||
|
|
|
|
|
|
|
|
|
|||||||||
| Balance as of August 14, 2013 |
$ | (955 | ) | $ | 8 | $ | — | $ | (947 | ) | ||||||
|
|
|
|
|
|
|
|
|
|||||||||
| Successor |
||||||||||||||||
| Balance as of August 15, 2013 |
$ | — | $ | — | $ | — | $ | — | ||||||||
| Other comprehensive income (loss) before reclassifications (1) |
5,919 | 9 | 6,963 | 12,891 | ||||||||||||
|
|
|
|
|
|
|
|
|
|||||||||
| Balance as of June 30, 2014 |
5,919 | 9 | 6,963 | 12,891 | ||||||||||||
| Other comprehensive income (loss) before reclassifications (1) |
(38,964 | ) | 6 | 12,780 | (26,178 | ) | ||||||||||
|
|
|
|
|
|
|
|
|
|||||||||
| Balance as of June 30, 2015 |
$ | (33,045 | ) | $ | 15 | $ | 19,743 | $ | (13,287 | ) | ||||||
|
|
|
|
|
|
|
|
|
|||||||||
| (1) | Other comprehensive income (loss) is reported net of taxes and noncontrolling interest. |
| (2) | Amounts reclassified are included in other income (expense), net. |
F-34
Table of Contents
Note 12—Income Taxes
The Company’s provision for income taxes consists of the following for the year ended June 30, 2015, the period from August 15, 2013 through June 30, 2014, the period from July 1, 2013 through August 14, 2013, and the year ended June 30, 2013:
| Successor | Predecessor | |||||||||||||||||
| For the year ended June 30, 2015 |
Period from August 15, 2013 through June 30, 2014 |
Period from July 1, 2013 through August 14, 2013 |
For the year ended June 30, 2013 |
|||||||||||||||
| Current: |
||||||||||||||||||
| State |
$ | 270 | $ | 127 | $ | (395 | ) | $ | 453 | |||||||||
| Federal |
— | 3 | — | 64 | ||||||||||||||
| Foreign |
7,327 | 4,504 | 375 | 2,437 | ||||||||||||||
|
|
|
|
|
|
|
|
|
|||||||||||
| Total current |
7,597 | 4,634 | (20 | ) | 2,954 | |||||||||||||
|
|
|
|
|
|
|
|
|
|||||||||||
| Deferred: |
||||||||||||||||||
| State |
(2,880 | ) | (2,043 | ) | (1,535 | ) | 173 | |||||||||||
| Federal |
(7,497 | ) | (17,850 | ) | (13,818 | ) | 1,707 | |||||||||||
| Foreign |
900 | (4,222 | ) | (248 | ) | (639 | ) | |||||||||||
|
|
|
|
|
|
|
|
|
|||||||||||
| Total deferred |
(9,477 | ) | (24,115 | ) | (15,601 | ) | 1,241 | |||||||||||
|
|
|
|
|
|
|
|
|
|||||||||||
| Income tax expense (benefit) |
$ | (1,880 | ) | $ | (19,481 | ) | $ | (15,621 | ) | $ | 4,195 | |||||||
|
|
|
|
|
|
|
|
|
|||||||||||
The geographic components of income (loss) before income taxes are as follows:
| Successor | Predecessor | |||||||||||||||||
| For the year ended June 30, 2015 |
Period from August 15, 2013 through June 30, 2014 |
Period from July 1, 2013 through August 14, 2013 |
For the year ended June 30, 2013 |
|||||||||||||||
| United States |
$ | (29,377 | ) | $ | (68,079 | ) | $ | (41,656 | ) | $ | 3,810 | |||||||
| Rest of World |
34,523 | (3,050 | ) | 2,350 | 9,718 | |||||||||||||
|
|
|
|
|
|
|
|
|
|||||||||||
| Income (loss) before income taxes |
$ | 5,146 | $ | (71,129 | ) | $ | (39,306 | ) | $ | 13,528 | ||||||||
|
|
|
|
|
|
|
|
|
|||||||||||
Income tax expense for the year ended June 30, 2015, the period from August 15, 2013 through June 30, 2014, the period from July 1, 2013 through August 14, 2013, and the year ended June 30, 2013:
| Successor | Predecessor | |||||||||||||||||
| For the year ended June 30, 2015 |
Period from August 15, 2013 through June 30, 2014 |
Period from July 1, 2013 through August 14, 2013 |
For the year ended June 30, 2013 |
|||||||||||||||
| Income tax expense at statutory rate |
$ | 1,801 | $ | (24,895 | ) | $ | (13,757 | ) | $ | 4,738 | ||||||||
| Non-deductible transaction costs |
608 | 3,907 | 1,467 | 101 | ||||||||||||||
| Foreign tax rate differentials |
(4,245 | ) | 723 | (455 | ) | (1,609 | ) | |||||||||||
| State taxes, net of federal benefit |
(2,880 | ) | (1,916 | ) | (2,461 | ) | 468 | |||||||||||
| Adjustment of uncertain tax positions and interest |
(1,253 | ) | — | — | — | |||||||||||||
| Permanent differences |
2,849 | 1,354 | 16 | 315 | ||||||||||||||
| Valuation allowance |
316 | 1,445 | — | — | ||||||||||||||
| Other |
924 | (99 | ) | (431 | ) | 182 | ||||||||||||
|
|
|
|
|
|
|
|
|
|||||||||||
| Income tax expense (benefit) |
$ | (1,880 | ) | $ | (19,481 | ) | $ | (15,621 | ) | $ | 4,195 | |||||||
|
|
|
|
|
|
|
|
|
|||||||||||
F-35
Table of Contents
Note 12—Income Taxes (continued)
Foreign rate differentials are attributable to lower foreign statutory tax rates in multiple jurisdictions outside of the United States and based on economic zone status and foreign government tax reduction approval.
Our effective tax rate for the year ended June 30, 2015, the period from August 15, 2013 through June 30, 2014, and the year ended June 30, 2013 was (36.5)%, 27.4% and 31.0%, respectively.
Included in the year ending June 30, 2015 is a benefit of $1,253 reflecting the recognition of previously unrecognized tax benefits due to the expirations of statute of limitations for certain foreign uncertain tax positions and a benefit of $2,880 related to a change in the state income tax rate from 3.5% to 2%.
For the period from August 15, 2013 through June 30, 2014 and the year ended June 20, 2013, our effective tax rate was lower than the U.S. federal statutory rate primarily due to earnings taxed at lower rates in foreign jurisdictions.
Deferred income taxes
The Company’s deferred tax assets and liabilities at June 30, 2015 and 2014 consist of the following:
| Successor | ||||||||
| June 30, 2015 | June 30, 2014 | |||||||
| Deferred tax assets: |
||||||||
| Inventories |
$ | 2,194 | $ | 1,414 | ||||
| Net operating loss and other carryforwards |
37,342 | 36,431 | ||||||
| Allowance for doubtful accounts |
894 | 401 | ||||||
| Stock based and other compensation |
1,502 | 2,509 | ||||||
| Post-retirement benefits |
6,125 | 14,670 | ||||||
| Interest |
— | 688 | ||||||
| Goodwill |
2,057 | — | ||||||
| Accrued expense and other |
9,306 | 7,634 | ||||||
|
|
|
|
|
|||||
| Gross deferred tax assets |
59,420 | 63,747 | ||||||
| Valuation allowance |
(10,050 | ) | (9,280 | ) | ||||
|
|
|
|
|
|||||
| Deferred income tax asset |
49,370 | 54,467 | ||||||
| Deferred income tax liabilities: |
||||||||
| Property and equipment |
(19,469 | ) | (29,792 | ) | ||||
| Goodwill |
— | (1,786 | ) | |||||
| Intangible assets |
(99,940 | ) | (117,301 | ) | ||||
|
|
|
|
|
|||||
| Deferred income tax liabilities |
(119,409 | ) | (148,879 | ) | ||||
|
|
|
|
|
|||||
| Net deferred tax liability |
$ | (70,039 | ) | $ | (94,412 | ) | ||
|
|
|
|
|
|||||
As of June 30, 2015, the Company has net operating loss carryforwards of approximately $104,939. U.S. Federal net operating loss carryforwards comprise approximately $68,699, which can be carried forward for 10-20 years. Foreign net operating loss carryforwards comprise approximately $36,239 of which $14,607 can be carried forward indefinitely, $6,180 can be carried forward for 6-10 years and $15,452 can be carried forward for 1-5 years.
The gross deferred income tax asset for these net operating losses is approximately $35,471 with recorded valuation allowances of approximately $10,050. Approximately $12,200 of the deferred tax asset is attributable to net operating losses in the US that are subject to limitations under Section 382 of the Internal Revenue Code for
F-36
Table of Contents
Note 12—Income Taxes (continued)
transactions resulting in ownership changes in the prior periods. A valuation allowance has not been recorded on these deferred tax assets as the limitations imposed by the US tax laws do not result in a change in judgment as to the realizability of such assets.
Cash paid (refunded) for income taxes was approximately $6,158, $6,207, $(19) and $1,862 for the year ended June 30, 2015, the period from August 15, 2013 through June 30, 2014, the period from July 1, 2013 through August 14, 2013, and the year ended June 30, 2013, respectively.
Uncertain Tax Positions
As of June 30, 2015, the total liability for uncertain tax benefits was $2,794, including accrued interest and penalties and net of related benefits. While the Company believes its tax estimates are reasonable and that it prepares its tax filings in accordance with applicable tax laws, the final determination with respect to any tax audit could be materially difference from our estimates or from our historical income tax provisions and accruals.
Unrecognized tax benefits represent the aggregate tax effect of differences between tax return positions and the amounts otherwise recognized in the Company’s consolidated financial statements and are reflected in “Other long-term liabilities” in the Consolidated Balance Sheet. A reconciliation of the beginning and ending amount of unrecognized tax benefits, including interest and penalties, is as follows:
| Successor | Predecessor | |||||||||||||||||
| For the year ended June 30, 2015 |
Period from August 15, 2013 through June 30, 2014 |
Period from July 1, 2013 through August 14, 2013 |
For the year ended June 30, 2013 |
|||||||||||||||
| At the beginning of the period |
$ | 1,601 | $ | 348 | $ | 348 | $ | 348 | ||||||||||
| Acquisitions |
2,636 | 1,253 | — | — | ||||||||||||||
| Accrued Interest and Penalty |
65 | — | — | — | ||||||||||||||
| Decreases for tax positions related to prior periods |
(255 | ) | — | — | — | |||||||||||||
| Decreases due to lapsed statutes of limitations |
(1,253 | ) | — | — | — | |||||||||||||
|
|
|
|
|
|
|
|
|
|||||||||||
| At the end of the period |
$ | 2,794 | $ | 1,601 | $ | 348 | $ | 348 | ||||||||||
|
|
|
|
|
|
|
|
|
|||||||||||
Included in the balance of unrecognized tax benefits as of June 30, 2015, June 30, 2014 and June 30, 2013 are $2,794, $1,601 and $348, respectively, of tax benefits that, if recognized, would affect the effective tax rate.
The unrecognized tax benefits accrual for the year ended June 30, 2015 consists of federal and foreign tax matters. It is unlikely that the Company’s total unrecognized tax benefits will decrease during the next year. The Company has elected to treat interest and penalties attributable to income taxes to the extent they arise, as a component of its income tax expense or benefit. For the period from August 15, 2013 through June 30, 2014, the period from July 1, 2013 to August 14, 2013, and for the year ended June 30, 2013, no interest or penalties were required to be recorded. During the year ended June 30, 2015, the Company recorded $65 of interest and penalties.
As part of the acquisition the Company received indemnification for all taxes payable and unrecognized tax positions incurred by ASG prior to the date of acquisition from the prior owners. As of June 30, 2015, the Company has an indemnification receivable balance of $2,007 due from the former owners of ASG.
The Company files tax returns in multiple jurisdictions and is subject to examination by tax authorities in these jurisdictions. Significant tax jurisdictions include the US, UK and Germany. Tax years from fiscal 2012 through 2015 remain open and subject to examination in the Company’s major taxing jurisdictions.
F-37
Table of Contents
Note 12—Income Taxes (continued)
As of June 30, 2015, the Company is under tax audit in Mexico for 2008 and in the United States for 2012-2014.
It is the intention of the Company to reinvest the earnings of its subsidiaries outside of the UK. At June 30, 2015, approximately $67.5 million of accumulated earnings were indefinitely reinvested. Determining the deferred tax liability for these undistributed foreign earnings is not practicable. A deferred tax liability may be required in the future if the Company’s business strategy changes and requires distributions of previously indefinitely reinvested earnings.
Note 13—Employee Benefit Plans
Defined Contribution Plans
The Company maintains various defined contribution benefit plans (the “Plans”). The Plans cover substantially all North America non-union employees and substantially all the European work force of the Company and include provisions for the Company to match a percentage of the employees’ contributions at a rate determined by the Board of Directors each year.
Contributions to the Plan were approximately $7,920, $3,927, $295 and $1,908 for the year ended June 30, 2015, the period from August 15, 2013 through June 30, 2014, the period from July 1, 2013 through August 14, 2013 and for the year ended June 30, 2013, respectively. Contributions are recorded in cost of goods sold and selling, general and administrative expenses in the consolidated statements of operations and comprehensive income (loss).
Defined Benefit Plans
The Company maintains a number of defined benefit pension plans for the benefit of its employees throughout the world, which vary depending on the conditions and practices in the countries concerned. The principal defined benefit pension plan is the Field Group Pension Plan in the United Kingdom. The assets of the plan are held in an external trustee-administered fund. The Company also operates two further defined benefit pension plans in the United Kingdom (known as the Chesapeake pension plan and the GCM pension plan), as well as a number of defined benefit arrangements in France and Germany. The defined benefit pension plans in the United Kingdom are funded while the French and German plans are mainly unfunded. The benefits are based on a fixed rate of pay per year depending on the department worked in and function of the participant. Charges to expense are based upon costs computed by an independent actuary.
F-38
Table of Contents
Note 13—Employee Benefit Plans (continued)
Defined Benefit Plans (continued)
The following table presents, for the fiscal years noted, a summary of the changes in the projected benefit obligation, plan assets and funded status of the Company’s pension plans:
| Successor | ||||||||
| June 30, 2015 | June 30, 2014 | |||||||
| Change in benefit obligation: |
||||||||
| Benefit obligation at beginning of year |
$ | 579,708 | $ | 3,494 | ||||
| Acquisitions |
— | 547,033 | ||||||
| Service cost |
3,676 | 1,331 | ||||||
| Interest cost |
22,891 | 9,165 | ||||||
| Curtailment gain |
— | (75 | ) | |||||
| Foreign exchange impact |
(42,855 | ) | 14,367 | |||||
| Actuarial loss |
39,891 | 9,684 | ||||||
| Employee contributions |
1,394 | 576 | ||||||
| Benefits paid |
(18,922 | ) | (5,867 | ) | ||||
|
|
|
|
|
|||||
| Benefit obligation at end of year |
$ | 585,783 | $ | 579,708 | ||||
|
|
|
|
|
|||||
| Change in plan assets: |
||||||||
| Fair value of plan assets at beginning of year |
$ | 557,271 | $ | — | ||||
| Acquisitions |
— | 515,221 | ||||||
| Actual return on plan assets |
81,813 | 28,026 | ||||||
| Foreign exchange impact |
(41,234 | ) | 13,557 | |||||
| Employer contributions |
14,447 | 5,758 | ||||||
| Employee contributions |
1,394 | 576 | ||||||
| Benefits paid |
(18,922 | ) | (5,867 | ) | ||||
|
|
|
|
|
|||||
| Fair value of plan assets at end of year |
$ | 594,769 | $ | 557,271 | ||||
|
|
|
|
|
|||||
| Overfunded/(underfunded) status at end of year |
$ | 8,986 | $ | (22,437 | ) | |||
|
|
|
|
|
|||||
| Components of the amounts recognized in the Consolidated Balance Sheet: |
||||||||
| Current liabilities |
$ | — | $ | (747 | ) | |||
| Non-current assets/(liabilities) |
8,986 | (21,690 | ) | |||||
|
|
|
|
|
|||||
| Total overfunded/(underfunded) status |
$ | 8,986 | $ | (22,437 | ) | |||
|
|
|
|
|
|||||
The accumulated benefit obligation totaled $562,230 and $560,900 as of June 30, 2015 and 2014, respectively.
The following table is a summary of the annual cost of the Company’s pension plans:
Components of Net Periodic Benefit Costs:
| Successor | Predecessor | |||||||||||||||||
| For the year ended June 30, 2015 |
Period from August 15, 2013 through June 30, 2014 |
Period from July 1, 2013 through August 14, 2013 |
For the year ended June 30, 2013 |
|||||||||||||||
| Service cost |
$ | 3,676 | $ | 1,331 | $ | — | $ | — | ||||||||||
| Interest cost |
22,891 | 9,127 | 38 | 221 | ||||||||||||||
| Expected return on plan assets |
(25,730 | ) | (9,905 | ) | — | — | ||||||||||||
| Curtailment gain |
— | (75 | ) | — | — | |||||||||||||
|
|
|
|
|
|
|
|
|
|||||||||||
| Net periodic benefit cost |
$ | 837 | $ | 478 | $ | 38 | $ | 221 | ||||||||||
|
|
|
|
|
|
|
|
|
|||||||||||
F-39
Table of Contents
Note 13—Employee Benefit Plans (continued)
Defined Benefit Plans (continued)
Other Changes in Plan Assets and Benefit Obligations Recognized in Other Comprehensive (Income):
| Successor | Predecessor | |||||||||||||||||
| For the year ended June 30, 2015 |
Period from August 15, 2013 through June 30, 2014 |
Period from July 1, 2013 through August 14, 2013 |
For the year ended June 30, 2013 |
|||||||||||||||
| Actuarial gain, net of tax |
$ | (12,758 | ) | $ | (6,861 | ) | $ | — | $ | — | ||||||||
| Effect of foreign exchange rates |
(22 | ) | (82 | ) | — | — | ||||||||||||
|
|
|
|
|
|
|
|
|
|||||||||||
| Total recognized in other comprehensive (income) |
$ | (12,780 | ) | $ | (6,943 | ) | $ | — | $ | — | ||||||||
|
|
|
|
|
|
|
|
|
|||||||||||
The weighted average assumptions used to determine benefit for the Company’s pension plans as follows:
| Successor | Predecessor | |||||||||||||
| 2015 | 2014 | 2013 | ||||||||||||
| Discount rate |
2.60%-4.30% | 2.60%-4.30% | 4.00% | |||||||||||
| Expected rate of return |
2.15%-5.05% | 2.50%-5.15% | n/a | |||||||||||
| Rate of compensation increase |
2.00%-3.90% | 2.00%-3.90% | 2.00% | |||||||||||
| Rate of price inflation |
1.80%-3.20% | 2.00%-3.30% | n/a | |||||||||||
The analysis of the plan assets fair value was as follows:
| Successor | ||||||||
| Description |
2015 | 2014 | ||||||
| Investment funds |
99.03 | % | 97.41 | % | ||||
| Debt securities |
0.02 | % | 0.07 | % | ||||
| Insurance contracts |
0.60 | % | 0.80 | % | ||||
| Cash and cash equivalents |
0.35 | % | 1.72 | % | ||||
The Company’s employs a dynamic de-risking investment strategy where target investments are updated quarterly to match the funding status of the plan. As the funding status increases there is a gradual de-risking of the plan assets. At June 30, 2015, the plan asset investments are comparative to the current investment strategy.
The expected return on assets assumptions are derived by considering market expectations of the long-term rates of return on the plan investments. The overall expected return assumption is a weighted average of the expected returns on each asset class in which the schemes invest, reflecting the plan asset allocations.
The long-term rates of return on equities and real estate are derived by considering current risk free rates of return with the addition of an appropriate future risk premium. The long-term rate of return from gilt yields, bonds and cash investments are set in line with market yields at the balance sheet date. The return assumption is a net rate after expenses.
F-40
Table of Contents
Note 13—Employee Benefit Plans (continued)
Defined Benefit Plans (continued)
The following are the major categories of assets measured at fair value on a recurring basis as of June 30, 2015 and 2014, using quoted prices in active markets for identical assets (Level 1); significant other observable inputs (Level 2); and significant unobservable inputs (Level 3):
| June 30, 2015 |
Level 1 | Level 2 | Level 3 | |||||||||||||
| Description |
Quoted Prices in Active Markets for Identical Assets |
Significant Other Observable Inputs |
Significant Observable Inputs |
Total at June 30, 2015 |
||||||||||||
| Investment funds |
$ | 1,307 | $ | 587,743 | $ | — | $ | 589,050 | ||||||||
| Debt securities |
113 | — | — | 113 | ||||||||||||
| Insurance contracts |
3,254 | 284 | — | 3,538 | ||||||||||||
| Cash and cash equivalents |
2,068 | — | — | 2,068 | ||||||||||||
|
|
|
|
|
|
|
|
|
|||||||||
| $ | 6,742 | $ | 588,027 | $ | — | $ | 594,769 | |||||||||
|
|
|
|
|
|
|
|
|
|||||||||
| June 30, 2014 |
Level 1 | Level 2 | Level 3 | |||||||||||||
| Description |
Quoted Prices in Active Markets for Identical Assets |
Significant Other Observable Inputs |
Significant Unobservable Inputs |
Total at June 30, 2014 |
||||||||||||
| Investment funds |
$ | — | $ | 542,779 | $ | — | $ | 542,779 | ||||||||
| Debt securities |
407 | — | — | 407 | ||||||||||||
| Insurance contracts |
— | 4,494 | — | 4,494 | ||||||||||||
| Cash and cash equivalents |
9,591 | — | — | 9,591 | ||||||||||||
|
|
|
|
|
|
|
|
|
|||||||||
| $ | 9,998 | $ | 547,273 | $ | — | $ | 557,271 | |||||||||
|
|
|
|
|
|
|
|
|
|||||||||
Benefit payments of the defined benefit pension plans are expected to be paid as follows:
| For the Year Ending June 30, |
Amount | |||
| 2016 |
$ | 17,448 | ||
| 2017 |
18,069 | |||
| 2018 |
18,427 | |||
| 2019 |
19,208 | |||
| 2020 |
19,499 | |||
| 2021-2025 |
105,868 | |||
|
|
|
|||
| $ | 198,519 | |||
|
|
|
|||
Expected Contributions
Based on estimates as of June 30, 2015, the Company expects to make contributions to the pension plan during the year ended June 30, 2016 of $13,600.
The estimated net loss, net transition asset (obligation) and prior service credit for the plan that will be amortized from accumulated other comprehensive income into net periodic pension cost over the next fiscal year are $0, $0 and $0, respectively.
F-41
Table of Contents
Note 13—Employee Benefit Plans (continued)
Other Post-Employment Obligations
Shorewood Packaging Corporation of Canada operates a post-retirement medical plan (the “Shorewood Medical Plan”), which is unfunded. The following table presents a summary of the changes in the projected benefit obligation, plan assets and funded status of the Shorewood Medical Plan which was assumed in the Company’s acquisition of AGI Shorewood as of June 30, 2015 and for the year ended June 30, 2015.
| Total | ||||
| Change in benefit obligation: |
||||
| Benefit obligation at beginning of period |
$ | — | ||
| Acquisition |
2,582 | |||
| Service cost |
44 | |||
| Interest cost |
62 | |||
| Benefits paid |
(2 | ) | ||
| Actuarial gain |
(419 | ) | ||
|
|
|
|||
| Benefit obligation at end of period |
$ | 2,267 | ||
|
|
|
|||
| Fair value of plan assets at end of period: |
$ | — | ||
|
|
|
|||
| Underfunded status at end of period |
$ | (2,267 | ) | |
|
|
|
|||
| Total | ||||
| Components of the amounts recognized in the Consolidated Balance Sheet |
||||
| Non-current assets |
$ | — | ||
| Current liabilities |
(61 | ) | ||
| Non-current liabilities |
(2,206 | ) | ||
|
|
|
|||
| Underfunded status at end of period |
$ | (2,267 | ) | |
|
|
|
|||
| Total | ||||
| Components of Net Periodic Benefit Cost |
||||
| Service cost |
$ | 44 | ||
| Interest cost |
62 | |||
| Expected return on plan assets |
— | |||
|
|
|
|||
| Net Periodic Benefit Cost |
$ | 106 | ||
|
|
|
|||
| Total | ||||
| Other Changes in Benefit Obligations Recognized in Other Comprehensive (Income): |
||||
| Actuarial gain, net of tax |
$ | 419 | ||
|
|
|
|||
| Total Recognized in Other Comprehensive (Income) |
$ | 419 | ||
|
|
|
|||
F-42
Table of Contents
Note 13—Employee Benefit Plans (continued)
Other Post-Employment Obligations (continued)
The weighted average assumptions used to determine the benefit obligation for the Shorewood Medical Plan are as follows:
| Discount rates: |
• | 3.9% for benefit cost determination | ||
| • | 4.0% for June 30, 2015 funded status | |||
| Health care cost trend rates: |
||||
| Hospital |
4.5% | |||
| Prescription drugs |
8.26% grading down to 4.5% after 2029 | |||
| Other medical |
4.5% | |||
| Mortality: |
Canadian Pensioner’s Mortality (“CPM”) 2014 Private Mortality Table with Projection Scale CPM-B |
The effects of a 1% change in health care cost trend rates on the benefit obligation at June 30, 2015 are as follows:
| • | One-percentage point increase | $138 or 6.1% | ||
| • | One-percentage point decrease | ($124) or (5.5%) |
Expected Contributions
Based on estimates as of June 30, 2015, the Company expects to make contributions to the Shorewood Medical Plan during the year ended June 30, 2016 of $61.
The estimated net gain, net transition asset (obligation) and prior service credit for the Shorewood Medical Plan that will be amortized from accumulated other comprehensive income into net periodic pension cost over the next fiscal year are $16, $0 and $0, respectively.
Note 14—Multiemployer Pension Plans
The Company contributed to multiemployer pension plans covering employees under collective bargaining agreements that were assumed as part of the acquisition of certain assets and assumption of certain liabilities of Ivy Hill Corporation (“Ivy Hill”) in April 2009.
The risks of participating in multiemployer plans are different from single-employer plans in the following aspects:
| • | Assets contributed to a multiemployer plan by one employer may be used to provide benefits to employees of other participating employers. |
| • | If a participating employer stops contributing to the plan, the unfunded obligations of the plan may be borne by the remaining participating employers. |
| • | If the Company chooses to stop participating in some of its multiemployer plans, it may be required to pay those plans an amount based on the underfunded status of the plan, referred to as a withdrawal liability. |
The Company’s participation in these plans is outlined in the table below. The contributions to these plans are recorded in selling, general and administrative expenses in the accompanying consolidated statements of operations and comprehensive income (loss).
F-43
Table of Contents
Note 14—Multiemployer Pension Plans (continued)
The Company contributed to the Graphic Communications Conference of the International Brotherhood of Teamsters National Pension Fund (the “GCC-IBT Fund”), the PACE Industry Union-Management Pension Fund (the “PACE Fund”), and the Graphic Arts Industry Joint Pension Trust (the “JPT Trust”). As discussed below, the Company triggered a complete withdrawal from each of these multiemployer plans. The “EIN/Pension Plan Number” column provides the Employer Identification Number (“EIN”). The Pension Protection Act (“PPA”) Zone Status is based on information the Company received from the plan and is certified by the plan’s actuary. Among other factors, plans in the red zone are generally less than 65 percent funded, plans in the yellow zone are less than 80 percent funded, and plans in the green zone are at least 80 percent funded. The FIP/RP Status Pending/Implemented column indicates plans for which a financial improvement plan (“FIP”) or a rehabilitation plan (“RP”) is either pending or has been implemented. The “Surcharge Imposed” column indicates whether the Company contribution rate included an amount in addition to the contribution rate specified in the applicable collective bargaining agreement, as imposed by a plan in “critical status,” in accordance with the requirements of the Code. There have been no significant changes affecting the comparability of contributions.
| Cash Contributions by the Company | ||||||||||||||||||||||||||||||
| PPA Zone Status |
Successor | Predecessor | ||||||||||||||||||||||||||||
| Plan |
EIN Number |
2014 | 2013 | FIP/RP Status |
For the year ended June 30, 2015 |
Period from August 15, 2013 through June 30, 2014 |
Period from July 1, 2013 through August 14, 2013 |
For the year ended June 30, 2013 |
Surcharge Imposed |
|||||||||||||||||||||
| GCC-IBT Fund |
52-6118568 | Red | Red | Implemented | $ | 99 | $ | 25 | $ | 16 | $ | 160 | Yes | |||||||||||||||||
| PACE Fund |
11-6166763 | Red | Red | Implemented | 197 | 60 | 34 | 266 | Yes | |||||||||||||||||||||
|
|
|
|
|
|
|
|
|
|
|
|||||||||||||||||||||
| Total |
$ | 296 | $ | 85 | $ | 50 | $ | 426 | ||||||||||||||||||||||
|
|
|
|
|
|
|
|
|
|||||||||||||||||||||||
The Company closed a manufacturing facility located in Terre Haute, Indiana in October 2013. The employees of this plant were participants in the GCC-IBT Fund and PACE Fund. In letters dated January 13, 2014 and April 29, 2014, the administrators of these funds notified the Company that it had triggered a complete withdrawal from the GCC-IBT Fund and PACE Fund, which was caused by the Company’s permanent cessation of contributions to the funds in December 2013. As a result, the Company is required to contribute its share of the respective plans’ unfunded benefit obligations as calculated by the funds’ actuaries.
The withdrawal liabilities were calculated using a method that was adopted by the trustees of the respective funds and approved by the Pension Benefit Guaranty Corporation (the “PBGC”) under the Employee Retirement Income Security Act of 1974, as amended (“ERISA).
Based upon this calculation, the Company was obligated to make 240 monthly payments of approximately $31, or approximately $378 per annum, to the GCC-IBT Fund beginning on March 31, 2014 and make 193 monthly payments of approximately $45, or approximately $539 per annum, to the PACE Fund beginning on June 1, 2014. At June 30, 2014, the Company recorded a long-term liability of $8,953, representing the present value of the remaining quarterly payments using the Company’s effective borrowing rate of 7.0%. The balance on this long-term liability was $8,640 at June 30, 2015.
The Company closed a manufacturing facility located in Louisville, Kentucky in 2012. The employees of this plant were participants in the JPT Trust from which the Company withdrew in June 2012, triggering a withdrawal liability. The withdrawal liability requires the Company to make payments of $424 per annum, to the JPT Trust. On August 12, 2013, the Company paid $3,722 to the JPT Trust in full settlement of the withdrawal liability. As a result of the payment, the Company recorded a gain of $676, which has been recorded in other income on the accompanying consolidated statements of operations and comprehensive income (loss) in the period from July 1, 2013 through August 14, 2013 (see Note 8).
F-44
Table of Contents
Note 15—Series C Shares
In connection with the acquisition of Ivy Hill, the Company was fully indemnified by the seller for the withdrawal liabilities related to the three multiemployer pension plans discussed in Note 13. The purchase price for Ivy Hill was paid, in part, through the delivery of 7,750 Series C Shares, valued at $7,750. The Series C Shares issued in connection with the Ivy Hill acquisition were held in an escrow arrangement to guarantee the payment of all indemnification obligations of the seller associated with any withdrawal liabilities resulting from the three multiemployer plans the Company assumed in connection with the acquisition. As a result of the indemnification, on June 30, 2012, the Company recorded $4,591 as due from the seller, which was recorded as an equity secured receivable in the consolidated statements of shareholders’ equity (deficiency). On April 26, 2013, the Company and the sellers of Ivy Hill entered into a Mutual Settlement and Release Agreement whereby the parties agreed to release the Series C Shares from escrow to the Company in satisfaction of the sellers’ indemnification obligations and to mutually release each other from any future claims. The Series C Shares were retired by the Company upon receipt. The Company recorded a gain of $3,159, which represents the excess of the $7,750 value of the Series C Shares over the $4,591 equity secured receivable due from the sellers. The gain has been recorded in other income on the accompanying consolidated statements of operations and comprehensive income (loss) (see Note 8).
As of April 26, 2013, the date of the settlement, the Series C Shares had accumulated unpaid dividends of approximately $2,813. However, pursuant to the terms of the Series C Shares, to the extent that the Series C Shares are transferred to MPS to satisfy the indemnification, then any dividends accrued with respect to the Series C Shares shall be disregarded and terminated in all respects as if the Series C Shares had never been issued and outstanding. Accordingly, the entire amount of the Series C Share dividends was reversed to paid-in-capital during the year ended June 30, 2013.
Note 16—Restructuring
During 2014, the Company announced its intention to reorganize its operations and cease operations in its Terre Haute, Indiana, Evansville, Indiana and Fairfield, New Jersey facilities. The reorganization will position the Company for further, profitable growth.
The following is a summary of the activity with respect to a reserve established by the Company in connection with the Restructuring Plan, by category of costs.
| Severance and employee related |
Costs associated with exit or disposal activities |
Total | ||||||||||
| Balance at August 15, 2013 |
$ | — | $ | — | $ | — | ||||||
| Restructuring costs |
4,797 | 2,855 | 7,652 | |||||||||
| Amounts paid |
(2,737 | ) | (605 | ) | (3,342 | ) | ||||||
|
|
|
|
|
|
|
|||||||
| Balance at June 30, 2014 |
2,060 | 2,250 | 4,310 | |||||||||
| Amounts paid |
(1,324 | ) | (1,474 | ) | (2,798 | ) | ||||||
| Adjustments (1) |
(480 | ) | — | (480 | ) | |||||||
|
|
|
|
|
|
|
|||||||
| Balance at June 30, 2015 |
$ | 256 | $ | 776 | $ | 1,032 | ||||||
|
|
|
|
|
|
|
|||||||
| (1) | All adjustments were changes in estimates whereby decreases were recorded to cost of goods sold in the accompanying consolidated statements of operations and comprehensive income (loss). |
These charges are recorded in cost of goods sold in the accompanying consolidated statements of operations and comprehensive income (loss) for the period from August 15, 2013 through June 30, 2014. Accrued restructuring costs are included in other current liabilities on the consolidated balance sheet.
F-45
Table of Contents
Note 17—Operating Leases
The Company has various operating leases for certain facilities and equipment. Future minimum rental payments at June 30, 2015 under non-cancelable operating leases with initial terms of one year or more for the next five years and thereafter are as follows:
| For the Year Ending June 30, |
Amount | |||
| 2016 |
$ | 13,399 | ||
| 2017 |
10,427 | |||
| 2018 |
7,540 | |||
| 2019 |
5,326 | |||
| 2020 |
4,075 | |||
| Thereafter |
13,621 | |||
|
|
|
|||
| Total |
$ | 54,388 | ||
|
|
|
|||
Rent expense under all operating leases were $14,504, $6,788, $519 and $4,413 for the year ended June 30, 2015, the period from August 15, 2013 through June 30, 2014, the period from July 1, 2013 through August 14, 2013 and the year ended June 30, 2013, respectively.
Note 18—Commitments And Contingencies
The Company participates in multiple collective bargaining agreements with various unions, which provide specified benefits to certain union employees. Approximately 7% of the Company’s employees in North America are unionized and approximately 72% of the Company’s employees in Europe are members of a union or works counsel or otherwise covered by labor agreements. The collective bargaining contract agreements with the various unions are set to expire at various dates between 2015 and 2017, at which time, the Company expects to negotiate a renewal of the agreements.
The Company is involved in various proceedings, legal actions and claims arising in the normal course of business. Such matters are subject to many uncertainties, and outcomes are not predictable with assurance. The Company records amounts for losses that are deemed to be probable and subject to reasonable estimate. The Company does not anticipate losses as a result of these proceedings that would materially affect the Company’s consolidated financial statements.
Note 19—Related Party Transactions
The Company previously maintained a management agreement with an affiliate of the Predecessor’s majority shareholder, which provided for quarterly payments equal to the greater of a fixed annual fee or a variable annual fee based upon the Company’s annual EBITDA. The management agreement was terminated on August 15, 2013 in connection with the Transaction (see Note 1).
Management fees and related expenses totaled $264 and $2,315 for the period from July 1, 2013 through August 14, 2013, and for the year ended June 30, 2013, respectively. The management agreement was terminated on August 15, 2013 in connection with the Transaction (see Note 1).
Also in connection with the Transaction, the Company paid fees of $3,500 and $4,000 to IPC and MDP, respectively. These amounts were recorded in transaction related expenses in the consolidated statement of operations and comprehensive income (loss) for the period from July 1, 2013 through August 14, 2013.
In connection with the Merger, the Company paid a fee of $5,000 to Carlyle. This amount was recorded in transaction related expenses in the consolidated statement of operations and comprehensive income (loss) for the period from August 15, 2013 through June 30, 2014 .
F-46
Table of Contents
Note 19—Related Party Transactions (continued)
On February 13, 2014 the Company loaned Lux Finco, a Carlyle owned entity, and Lux Newco, a MDP owned entity, each $1,677 to enable them to purchase 5.1% of the outstanding capital stock of CD Cartondruck GmbH, a MPS owned entity. The notes bear interest at a rate of 2.0%, compounded annually, and had a maturity date of February 14, 2015. The loan automatically renews for one year periods unless terminated through a written notice no less than four weeks prior to maturity. The $3,354 note receivable is recorded in other assets on the consolidated balance sheet as of June 30, 2015 and June 30, 2014.
Note 20—Stock Based Compensation
2006 Long-Term Option Plan
The 2006 Long-Term Stock Option Plan (the “2006 Plan”), which was approved by the Company’s Board of Directors, allowed the Company to grant options to purchase common stock to directors, officers and employees of the Company. In January 2013, the Board of Directors amended and increased the maximum number of options allowed to be issued under the 2006 Plan from 6,350 to 10,000.
There were no options granted for the period from July 1, 2013 through August 14, 2013. During the year ended June 30, 2013, the Company granted options to purchase 4,450 shares as follows:
| Number of Options Issued |
Exercise Price Per Share | |
| 3,600 |
$1,850 | |
| 850 |
$ 100 |
The 3,600 grant of options were subject to time vesting (“time vesting options”). Time vesting options are exercisable, in whole or in part, at twenty percent per year from either the date of grant or a later date, as per the respective option agreement. All time vesting options were to become exercisable within five years from the date of grant. The 850 options granted vest upon the occurrence of a sale of the Company, provided the participant is still employed by the Company, which represented a performance condition. Accordingly, no compensation expense related to these 850 options has been recorded for the period from July 1, 2013 through August 14, 2013 and for the year ended June 30, 2013. All options granted during the year ended June 30, 2013 had a maximum term of ten years and were to expire on January 31, 2023.
Due to a change in control of the Company on August 15, 2013 (Note 1), the stock options under the 2006 Plan immediately vested. The Company recognized compensation expense of $10,360 and $362 for the period from July 1, 2013 through August 14, 2013 and for the year ended June 30, 2013, respectively, which is recorded as selling, general and administrative in the accompanying consolidated statements of operations and comprehensive income (loss). The income tax benefit recognized in the consolidated statements of operations and comprehensive income (loss) for stock-based compensation arrangements was approximately $3,989 and $139 for the period from July 1, 2013 through August 14, 2013, and for the year ended June 30, 2013, respectively.
In accordance with certain preexisting provisions included in the terms of the 2006 Plan, all share-based awards outstanding at the time of the Transaction were settled.
All options granted from 2008 through 2010 under the 2006 Plan were time vesting options, and had a maximum term of ten years and were to expire on various dates through March 31, 2020.
The options issued prior to 2008 under the 2006 Plan had a maximum term of ten years and were to expire on June 28, 2016. Fifty percent of these options were time vesting options. The remaining fifty percent of the options were subject to vesting based upon the investor’s return (“Return Vest Options”). The Return Vest Options were to vest based on the investor realizing an internal rate of return, as defined in the option agreement.
F-47
Table of Contents
Note 20—Stock Based Compensation (continued)
2006 Long-Term Option Plan (continued)
There has been no vesting of Return Vest Options through August 15, 2013. In the event the investors of the Company, or the Company itself consummates a transaction for the sale of the Company, the participants of the 2006 Plan shall receive the same form and amount of consideration per share as all other holders of the same class or series of shares, which occurred on August 15, 2013.
In the event of a 2006 Plan participant termination, the Company has the right to repurchase the options or shares issued thereunder (“Call Option”). The purchase price for each option repurchased shall be the fair market value at the date the Call Option is exercised if the termination is not for cause pursuant to other terms of the option agreements. Included in compensation expense is additional compensation expense of $104 relating to the option repurchases for the year ended June 30, 2013.
2013 Equity Incentive Plan
The 2013 Equity Incentive Plan (the “2013 Plan”), which was approved by the Company’s Board of Directors on August 23, 2013, allowed the Company to grant options to purchase common stock to directors, officers and employees of the Company. During the period from August 15, 2013 through June 30, 2014, the Company issued 823,700 time-vested options and 649,800 performance based options. Time vesting options are exercisable, in whole or in part, at twenty percent per year from either the date of grant or a later date, as per the respective option agreement. All time vesting options were to become exercisable within five years from the date of grant and have a ten-year life. The performance based options vest based on the Company’s principal investor’s obtaining various thresholds of an internal rate of return as defined in the 2013 Plan. The time vested options and the performance-based options were cancelled on February 14, 2014 in connection with the Merger Agreement (see Note 1) and accordingly there was no stock compensation expense recorded for any periods presented.
Stock Options Valuation
For options issued under the 2013 Plan and the 2006 Plan, the Company calculated the estimated fair value of each option award on the date of grant using the Black–Scholes option valuation model that uses the assumptions noted in the table below. A nonpublic entity that is unable to estimate the expected volatility of the price of its underlying share may measure awards based on a “calculated value,” which substitutes the volatility of an appropriate index for the volatility of the entity’s own share price.
F-48
Table of Contents
Note 20—Stock Based Compensation (continued)
Stock Options Valuation (continued)
Currently, there is no active market for the Company’s common shares. Therefore, as a substitute for the Company’s volatility, the Company has elected to use the historical volatility of the Dow Jones U.S. Containers & Packaging Index, which is representative of the Company’s industry. The Company has used the historical closing values of that index to estimate volatility, which was calculated to be 28.01% and 27.30% over the expected life of the options for the period from August 15, 2013 through June 30, 2014 and for the year ended June 30, 2013, respectively. The Company uses historical data to estimate option exercises and employee terminations within the valuation model. The expected term of options granted is derived from the output of the option valuation model and represents the period of time that options granted are expected to be outstanding. The risk-free rate for periods within the contractual life of the option is based on the U.S. Treasury yield curve in effect at the time of grant.
| Successor | Predecessor | |||||||||||||||||
| For the year ended June 30, 2015 |
Period from August 15, 2013 through June 30, 2014 |
Period from July 1, 2013 through August 14, 2013 |
For the year ended June 30, 2013 |
|||||||||||||||
| Expected term (in years) |
N/A | 6.5 | N/A | 6.5 | ||||||||||||||
| Expected volatility |
N/A | 28.01 | % | N/A | 27.3 | % | ||||||||||||
| Risk-free rate |
N/A | 2.27 | % | N/A | 1.4 | % | ||||||||||||
| Expected dividends |
N/A | — | N/A | — | ||||||||||||||
Stock Option Activity
Stock option activity under the 2006 Plan is summarized as follows:
| Shares Subject to Option |
Weighted Average Exercise Price |
Weighted Average Remaining Contractual Life (Years) |
||||||||||
| Balance Outstanding at July 1, 2012 |
7,405 | $ | 258.91 | 4.7 | ||||||||
| Options granted pursuant to the 2006 Plan |
4,450 | 1,523.08 | 9.6 | |||||||||
| Options exercised |
(110 | ) | 332.56 | — | ||||||||
| Options expired/cancelled/repurchased |
(1,935 | ) | 108.81 | — | ||||||||
|
|
|
|
|
|
|
|||||||
| Balance Outstanding at June 30, 2013 |
9,810 | 866.28 | 6.8 | |||||||||
| Options expired/cancelled/repurchased |
(9,810 | ) | (866.28 | ) | — | |||||||
|
|
|
|
|
|
|
|||||||
| Balance Outstanding at August 15, 2013 |
— | $ | — | — | ||||||||
|
|
|
|
|
|
|
|||||||
A summary of the status of the Company’s unvested shares as of August 15, 2013, and changes during the period from July 1, 2013 through August 14, 2013 and the year ended June 30, 2013 is presented below:
| Shares Subject to Option |
Weighted Average Grant-Date Fair Value |
|||||||
| Balance Unvested at July 1, 2012 |
1,324 | $ | 197.77 | |||||
| Restricted shares granted pursuant to the 2006 Plan |
4,450 | 792.99 | ||||||
| Restricted shares vested |
(532 | ) | 196.93 | |||||
| Restricted shares expired/cancelled/repurchased |
(40 | ) | 192.87 | |||||
|
|
|
|
|
|||||
| Balance Unvested at June 30, 2013 |
5,202 | 704.39 | ||||||
| Restricted shares expired/cancelled/repurchased |
(5,202 | ) | (704.39 | ) | ||||
|
|
|
|
|
|||||
| Balance Unvested at August 15, 2013 |
— | $ | — | |||||
|
|
|
|
|
|||||
F-49
Table of Contents
Note 20—Stock Based Compensation (continued)
Stock Option Activity (continued)
As of August 15, 2013, there was no unrecognized compensation cost related to unvested share-based compensation arrangements granted under the 2006 Plan since all unvested options were cancelled during the period. The total fair value of shares vested for the year ended June 30, 2013 was $105.
Stock option activity under the 2013 Plan summarized as follows:
| Shares Subject to Option |
Weighted Average Exercise Price |
Weighted Average Remaining Contractual Life (Years) |
||||||||||
| Balance Outstanding at August 15, 2013 |
— | $ | — | — | ||||||||
| Options granted pursuant to the 2013 Plan |
1,473,500 | 10.00 | 10.0 | |||||||||
| Options expired/cancelled/repurchased |
(1,473,500 | ) | (10.00 | ) | (10.0 | ) | ||||||
|
|
|
|
|
|
|
|||||||
| Balance Outstanding at June 30, 2014 |
— | $ | — | — | ||||||||
|
|
|
|
|
|
|
|||||||
A summary of the status of the Company’s unvested shares as of June 30, 2014, and changes during the period from August 15, 2013 through June 30, 2014 is presented below:
| Shares Subject to Option |
Weighted Average Grant-Date Fair Value |
|||||||
| Balance Unvested at August 15, 2013 |
— | $ | — | |||||
| Restricted shares granted pursuant to the 2013 Plan |
1,473,500 | 3.33 | ||||||
| Restricted shares expired/cancelled/repurchased |
(1,473,500 | ) | (3.33 | ) | ||||
|
|
|
|
|
|||||
| Balance Unvested at June 30, 2014 |
— | $ | — | |||||
|
|
|
|
|
|||||
The weighted-average grant-date fair value of restricted shares granted during the period from August 15, 2013 through June 30, 2014 was $3.33.
Restricted Stock Units
The Company issued 528,500 restricted stock units (“RSU’s”) under the 2013 Plan, which was approved by the Company’s Board of Directors in August 2013. Time vesting RSU’s vest, in whole or in part, at twenty percent per year from either the date of grant or a later date, as per the respective RSU’s. All time vesting RSU’s were to vest within five years from the date of grant and has a ten-year life. The performance based RSUs vested based on the Company’s principal investors obtaining various thresholds of an internal rate of return as defined in the 2013 Plan. The time vested RSU’s and the performance based RSU’s were cancelled on February 14, 2014 in connection with the Merger Agreement (see Note 1) and accordingly no expense has been recorded during any of the periods presented.
RSU’s activity under the 2013 Plan summarized as follows:
| Shares Subject to RSU’s |
Weighted Average Exercise Price |
Weighted Average Remaining Contractual Life (Years) |
||||||||||
| Balance Outstanding at August 15, 2013 |
— | $ | — | — | ||||||||
| RSU’s granted pursuant to the 2013 Plan |
528,500 | 10.00 | 10.0 | |||||||||
| RSU’s expired/cancelled/repurchased |
(528,500 | ) | (10.00 | ) | (10.0 | ) | ||||||
|
|
|
|
|
|
|
|||||||
| Balance Outstanding at June 30, 2014 |
— | $ | — | — | ||||||||
|
|
|
|
|
|
|
|||||||
F-50
Table of Contents
Note 20—Stock Based Compensation (continued)
Performance Based Units
In connection with Carlyle’s acquisition of Chesapeake, certain members of Chesapeake’s management were allowed to co-invest with Carlyle in an entity controlled by Carlyle that holds an investment in the Company. At the time of the grant, those members of management that invested alongside Carlyle received a specified number of ordinary shares, which were subject to a performance-based ratchet (the “Ratchet”). Pursuant to the Ratchet, members of management’s ownership percentage can increase based on Chesapeake completing an “Exit” that results in a specified return on invested capital (“MOIC”) and internal rate of return (“IRR”) for certain investors. An Exit is defined as the completion of a liquidating event, which includes the completion of an initial public offering (“IPO”). Since a liquidity event, including an IPO, is generally not probable until it occurs, no compensation cost has been recognized in the financial statements.
2014 Equity Incentive Plan (Mustang Investment Holdings L.P.)
The 2014 Equity Incentive Plan (the “2014 Plan”) allows profits interests and restricted capital interests in Mustang Investment Holdings L.P. (“Holdings”) to be granted to directors, officers and employees of the Company. During the period from August 15, 2013 to June 30, 2014, Holdings issued 823,700 time-vesting profits interests and 649,800 performance-vesting profits interests and during the year ended June 30, 2015, Holdings issued 90,600 time-vesting profits interests and 60,400 performance-vesting profits interests. Time-vesting profits interests vest twenty percent per year on each of the first five anniversaries of August 15, 2013, as per the applicable award agreement. All performance-vesting profits interests vest based on Holdings’ principal investors obtaining various thresholds of an internal rate of return as defined in the 2014 Plan, which represents a performance condition. The performance condition is not probable of being achieved, and accordingly, no compensation expense related to the performance-vesting profits interests has been recorded.
In addition, during the period from August 15, 2013 through June 30, 2014, Holdings issued 528,500 restricted capital interests under the 2014 Plan. The restricted capital interests vest twenty percent per year on each of the first five anniversaries of August 15, 2013, as per the applicable award agreement.
The Company recognized compensation expense related to awards under the 2014 Plan as follows:
| Successor | ||||||||
| For the year ended June 30, 2015 |
Period from August 15, 2013 through June 30, 2014 |
|||||||
| Time vesting profit interests |
$ | 3,210 | $ | 618 | ||||
| Time vesting restricted capital interests |
1,949 | 445 | ||||||
|
|
|
|
|
|||||
| $ | 5,159 | $ | 1,063 | |||||
|
|
|
|
|
|||||
Since the profits interests issued under the 2014 Plan are for interests in Holdings, which is outside of the consolidated group, the value of the profits interests were marked to market at each of the Company’s reporting periods.
2014 Plan—Profits Interests Valuation
As an input to the Black-Scholes model, and for valuation of the profits interest and restricted capital interest awards, the Company estimates the fair value of Holdings equity quarterly. The Company relies on the results of a discounted cash flow analysis but also considers other widely recognized valuation models. The discounted cash flow analysis is dependent on a number of significant management assumptions regarding the expected future financial results of the Company and Holdings as well as upon estimates of an appropriate cost of capital.
F-51
Table of Contents
Note 20—Stock Based Compensation (continued)
2014 Plan—Profits Interests Valuation (continued)
A sensitivity analysis is performed in order to establish a narrow range of estimated fair values for the equity of Holdings. The market approach consists of identifying a set of guideline public companies. Multiples of historical and projected EBITDA determined based on the guideline companies are applied to Holdings EBITDA in order to establish a range of estimated fair value for the equity of Holdings. After considering all of these estimates of fair value, the Company then determines a single estimated fair value of the equity to be used in accounting for equity-based compensation.
For profits interests issued under the 2014 Plan the Company calculates the estimated fair value of each award on the date of grant using the Black–Scholes option valuation model that uses the assumptions noted in the table below and considers a lack of marketability discount. Currently, there is no active market for Holding’s equity. Therefore, as a substitute for Holding’s volatility, the Company has elected to use the historical volatility of various publically traded companies in the printing industry. The Company has used the historical volatilities of these entities to estimate volatility. The Company uses historical data to estimate employee terminations within the valuation model. The expected term of profits interests granted is derived from the output of the option valuation model and represents the period of time that profits interests granted are expected to be outstanding. The risk-free rate for periods within the life of the profits interests is based on the U.S. Treasury yield curve in effect at the time of grant.
| For the year ended June 30, 2015 |
Period from August 15, 2013 through June 30, 2014 |
|||||||
| Expected term (in years) |
4.52 | 6.5 | ||||||
| Expected volatility |
42 | % | 46.58 | % | ||||
| Risk-free rate |
1.48 | % | 2.13 | % | ||||
| Expected dividends |
— | — | ||||||
| Weighted average grant date fair-value |
$ | 7.88 | $ | 4.77 | ||||
|
|
|
|
|
|||||
| Weighted average fair-value at end of period of all profits interest issued under the 2014 Plan |
$ | 13.37 | $ | 4.77 | ||||
|
|
|
|
|
|||||
Total unrecognized compensation expense related to unvested profit interests at June 30, 2015 amounted to $6,826 and is expected to be recognized over a weighted average period of 3.5 years.
Profits interests activity under the 2014 Plan summarized as follows:
| Incentive Units Subject to Profits Interests |
Weighted Average Exercise Price (or Distribution Threshold) |
Weighted Average Remaining Life (Years) |
||||||||||
| Balance Outstanding at August 15, 2013 |
— | $ | — | — | ||||||||
| Profits interests granted pursuant to the 2014 Plan |
1,473,500 | 10.00 | 10.0 | |||||||||
| Profits interests expired/cancelled/repurchased |
(10,000 | ) | — | — | ||||||||
|
|
|
|
|
|
|
|||||||
| Balance Outstanding at June 30, 2014 |
1,463,500 | 10.00 | 9.2 | |||||||||
| Profits interests granted pursuant to the 2014 Plan |
151,000 | 20.00 | 10.0 | |||||||||
| Profits interests expired/cancelled/repurchased |
(10,000 | ) | — | — | ||||||||
|
|
|
|
|
|
|
|||||||
| Balance Outstanding June 30, 2015 |
1,604,500 | $ | 10.94 | 8.3 | ||||||||
|
|
|
|
|
|
|
|||||||
| Balance Vested at June 30, 2015 |
292,700 | 10.00 | 8.2 | |||||||||
F-52
Table of Contents
Note 20—Stock Based Compensation (continued)
2014 Plan—Restricted Capital Interests Valuation
For Restricted Capital Interests issued under the 2014 Plan the Company calculates the estimated fair value of each award using the Black-Scholes option valuation model that uses the assumptions noted in the table below and considers a lack of marketability discount. Currently, there is no active market for Holding’s equity. Therefore, as a substitute for Holding’s volatility, the Company has elected to use the historical volatility of various publically traded companies in the printing industry. The Company uses historical data to estimate employee terminations within the valuation model. The expected term of profits interests granted is derived from the output of the option valuation model and represents the period of time that profits interests granted are expected to be outstanding. The risk-free rate for periods within the life of the profits interests is based on the U.S. Treasury yield curve in effect at the time of grant.
| For the year ended June 30, 2015 |
Period from August 15, 2013 through June 30, 2014 |
|||||||
| Expected term (in years) |
4.52 | 6.5 | ||||||
| Expected volatility |
42 | % | 46.58 | % | ||||
| Risk-free rate |
1.48 | % | 2.13 | % | ||||
| Expected dividends |
— | — | ||||||
| Weighted average grant date fair-value |
$ | — | $ | 4.77 | ||||
|
|
|
|
|
|||||
| Weighted average fair-value at end of period of all Restricted Capital Interests issued under the 2014 Plan |
$ | 13.43 | $ | 4.77 | ||||
|
|
|
|
|
|||||
Restricted capital interests activity under the 2014 Plan is summarized as follows:
| Shares Subject to RSU’s |
Weighted Average Exercise Price |
Weighted Average Remaining Contractual Life (Years) |
||||||||||
| Balance Outstanding at August 15, 2013 |
— | $ | — | — | ||||||||
| Restricted capital interests granted pursuant to the 2014 Plan |
528,500 | 10.00 | 10.0 | |||||||||
|
|
|
|
|
|
|
|||||||
| Balance Outstanding at June 30, 2014 |
528,000 | 10.00 | 9.2 | |||||||||
|
|
|
|
|
|
|
|||||||
| Balance Outstanding at June 30, 2015 |
528,500 | $ | 10.00 | 8.3 | ||||||||
|
|
|
|
|
|
|
|||||||
There were no restricted capital interests expired, cancelled or repurchased during the periods presented.
Total unrecognized compensation expense related to unvested restricted capital interests at June 30, 2015 amounted to $3,994 and is expected to be recognized over a weighted average period of 3.5 years.
Note 21—Segments
The Company operates its business along three operating segments, which are grouped on the basis of geography: North America, Europe and Asia. The Company believes this method of segment reporting reflects both the way its business segments are managed and the way the performance of each segment is evaluated. The three segments consist of similar operating activities as each segment produces similar products.
The accounting policies of the segments are the same as those described in Note 2, Summary of Significant Accounting Policies, except that the disaggregated financial results for the segments have been prepared using a management approach, which is consistent with the basis and manner in which management internally disaggregates financial information for the purposes of assisting internal operating decisions. Generally, the Company evaluates performance based on stand-alone segment net income (loss) before income taxes, interest, depreciation, amortization, restructuring, transaction and other costs related to acquisitions (“Adjusted
F-53
Table of Contents
Note 21—Segments (continued)
EBITDA”) and accounts for inter-segment sales and transfers, which were not material, as if the sales or transfers were to third parties, at current market prices.
| Successor | Predecessor | |||||||||||||||||
| For the year ended June 30, 2015 |
Period from August 15, 2013 through June 30, 2014 |
Period from July 1, 2013 through August 14, 2013 |
For the year ended June 30, 2013 |
|||||||||||||||
| Net Sales |
||||||||||||||||||
| North America |
$ | 737,888 | $ | 452,031 | $ | 58,728 | $ | 480,050 | ||||||||||
| Europe |
820,391 | 354,396 | 15,353 | 99,351 | ||||||||||||||
| Asia |
59,361 | 7,786 | — | — | ||||||||||||||
|
|
|
|
|
|
|
|
|
|||||||||||
| Total Net Sales |
$ | 1,617,640 | $ | 814,213 | $ | 74,081 | $ | 579,401 | ||||||||||
|
|
|
|
|
|
|
|
|
|||||||||||
| Depreciation and Amortization |
||||||||||||||||||
| North America |
$ | 63,194 | $ | 46,924 | $ | 3,164 | $ | 32,751 | ||||||||||
| Europe |
69,548 | 28,461 | 893 | 6,815 | ||||||||||||||
| Asia |
3,414 | 482 | — | — | ||||||||||||||
|
|
|
|
|
|
|
|
|
|||||||||||
| Total Depreciation and Amortization |
$ | 136,156 | $ | 75,867 | $ | 4,057 | $ | 39,566 | ||||||||||
|
|
|
|
|
|
|
|
|
|||||||||||
| Operating Income (Loss) |
||||||||||||||||||
| North America |
$ | 18,317 | $ | (37,181 | ) | $ | (24,524 | ) | $ | 28,808 | ||||||||
| Europe |
46,442 | 8,711 | 2,188 | 11,980 | ||||||||||||||
| Asia |
6,218 | 186 | — | — | ||||||||||||||
|
|
|
|
|
|
|
|
|
|||||||||||
| Total Operating Income (Loss) |
$ | 70,977 | $ | (28,284 | ) | $ | (22,336 | ) | $ | 40,788 | ||||||||
|
|
|
|
|
|
|
|
|
|||||||||||
| Adjusted EBITDA (1) |
||||||||||||||||||
| North America |
$ | 97,001 | $ | 71,290 | $ | 7,390 | $ | 67,761 | ||||||||||
| Europe |
126,350 | 46,816 | 3,081 | 18,914 | ||||||||||||||
| Asia |
7,611 | 684 | — | — | ||||||||||||||
|
|
|
|
|
|
|
|
|
|||||||||||
| Total Adjusted EBITDA |
$ | 230,962 | $ | 118,790 | $ | 10,471 | $ | 86,675 | ||||||||||
|
|
|
|
|
|
|
|
|
|||||||||||
| Capital Expenditures |
||||||||||||||||||
| North America |
$ | 19,407 | $ | 12,540 | $ | 2,624 | $ | 14,152 | ||||||||||
| Europe |
38,189 | 27,218 | 117 | 8,281 | ||||||||||||||
| Asia |
1,939 | 130 | — | — | ||||||||||||||
|
|
|
|
|
|
|
|
|
|||||||||||
| Total Capital Expenditures |
$ | 59,535 | $ | 39,888 | $ | 2,741 | $ | 22,433 | ||||||||||
|
|
|
|
|
|
|
|
|
|||||||||||
| Successor | Predecessor | |||||||||||||
| June 30, 2015 |
June 30, 2014 |
June 30, 2013 |
||||||||||||
| Total Assets |
||||||||||||||
| North America |
$ | 915,601 | $ | 789,836 | $ | 271,624 | ||||||||
| Europe |
866,214 | 1,037,900 | 75,881 | |||||||||||
| Asia |
100,310 | 16,419 | — | |||||||||||
|
|
|
|
|
|
|
|||||||||
| Total Assets |
$ | 1,882,125 | $ | 1,844,155 | $ | 347,505 | ||||||||
|
|
|
|
|
|
|
|||||||||
F-54
Table of Contents
Note 21—Segments (continued)
The Company’s product offerings consist of print-based specialty packaging products across the consumer, health care and multi-media end markets. The Company produces similar products including labels, cartons, inserts and rigid packaging (the “Specific Products”) in all of the geographies it serves, and in all of the end markets it serves. These Specific Products represent one product line. The nature of a specific carton, label, insert or rigid package is similar from end market to end market and geography to geography. Oftentimes, the Specific Products sold to the customer are bundled, including both label and carton, or label, carton and insert or any combination thereof. Due to the nature of the manufacturing process, it is impracticable to identify the amount of any Specific Products. The following is a summary of net sales estimated by end markets for the respective fiscal years indicated.
| Successor | Predecessor | |||||||||||||||||
| For the year ended June 30, 2015 |
Period from August 15, 2013 through June 30, 2014 |
Period from July 1, 2013 through August 14, 2013 |
For the year ended June 30, 2013 |
|||||||||||||||
| Net Sales: |
||||||||||||||||||
| Consumer |
$ | 815,882 | $ | 367,895 | $ | 26,094 | $ | 220,901 | ||||||||||
| Health Care |
643,982 | 330,018 | 20,929 | 191,400 | ||||||||||||||
| Media |
157,776 | 116,300 | 27,058 | 167,100 | ||||||||||||||
|
|
|
|
|
|
|
|
|
|||||||||||
| $ | 1,617,640 | $ | 814,213 | $ | 74,081 | $ | 579,401 | |||||||||||
|
|
|
|
|
|
|
|
|
|||||||||||
| (1) |
| Successor | Predecessor | |||||||||||||||||
| (Dollars in thousands) | For the year ended June 30, 2015 |
Period from August 15, 2013 to June 30, 2014 |
Period from July 1, 2013 to August 14, 2013 |
For the year ended June 30, 2013 |
||||||||||||||
| Adjusted EBITDA |
$ | 230,962 | $ | 118,790 | $ | 10,471 | $ | 86,675 | ||||||||||
| Transaction costs |
(13,630 | ) | (38,844 | ) | (28,370 | ) | (3,080 | ) | ||||||||||
| Management fees |
— | — | (264 | ) | (2,315 | ) | ||||||||||||
| Stock based and deferred compensation |
(5,722 | ) | (1,534 | ) | (125 | ) | (2,578 | ) | ||||||||||
| Multiemployer plan exits |
— | (9,250 | ) | 676 | — | |||||||||||||
| Debt extinguishment costs |
(1,019 | ) | — | (14,042 | ) | (4,140 | ) | |||||||||||
| Purchase accounting adjustments |
(3,094 | ) | (10,836 | ) | — | — | ||||||||||||
| Severance costs |
(6,419 | ) | (2,385 | ) | (3 | ) | (736 | ) | ||||||||||
| Restructuring charge |
— | (7,652 | ) | — | — | |||||||||||||
| (Gain) loss on sale of fixed assets |
(584 | ) | (2,278 | ) | 96 | 853 | ||||||||||||
| Impairment charges |
— | (1,006 | ) | — | (2,112 | ) | ||||||||||||
| Foreign currency gains (loss) |
12,171 | 777 | 364 | (220 | ) | |||||||||||||
| Other adjustments to EBITDA |
(379 | ) | (490 | ) | (346 | ) | 2,387 | |||||||||||
|
|
|
|
|
|
|
|
|
|||||||||||
| EBITDA |
212,286 | 45,292 | (31,543 | ) | 74,734 | |||||||||||||
| Income tax expense (benefit) |
(1,880 | ) | (19,481 | ) | (15,621 | ) | 4,195 | |||||||||||
| Interest expense |
75,437 | 43,215 | 3,991 | 24,546 | ||||||||||||||
| Depreciation and amortization |
131,703 | 73,206 | 3,772 | 36,660 | ||||||||||||||
|
|
|
|
|
|
|
|
|
|||||||||||
| Net income (loss) |
$ | 7,026 | $ | (51,648 | ) | $ | (23,685 | ) | $ | 9,333 | ||||||||
|
|
|
|
|
|
|
|
|
|||||||||||
Note 22—Subsequent Event
On July 1, 2015, the Company completed the acquisition of BP Media, Ltd. (“BluePrint”). The acquisition of BluePrint provides the Company with pre-press and digital services in the European market, facilitating the processes surrounding translation and interchangeability of print content for foreign locations. In addition, BluePrint provides the Company with an established sales presence in the media markets in Europe, which will enable the Company to serve the European needs of global media releases. BluePrint had annual sales of approximately $23,000 for the 12 months immediately prior to the acquisition. The purchase price allocation is not material to the financial statements.
F-55
Table of Contents
SCHEDULE II—VALUATION AND QUALIFYING ACCOUNTS
For the year ended June 30, 2013 (Predecessor), for the period of July 1, 2013 through August 14, 2013 (Predecessor), for the period of August 15, 2013 through June 30, 2014 (Successor) and for the year ended June 30, 2015:
| (in thousands) |
Balance at beginning of period |
Additions charged (credited) to expenses |
Net (deductions) recoveries |
Other activity |
Balance at end of period |
|||||||||||||||
| Allowance for doubtful receivables |
||||||||||||||||||||
| Successor |
||||||||||||||||||||
| For the year ended June 30, 2015 |
$ | 2,689 | $ | 1,945 | $ | (1,489 | ) | $ | (213 | ) | $ | 2,932 | ||||||||
| For the period from August 15, 2013 through June 30, 2014 |
$ | 1,168 | $ | 1,834 | $ | (315 | ) | $ | 2 | $ | 2,689 | |||||||||
| Predecessor |
||||||||||||||||||||
| For the period from July 1, 2013 through August 14, 2013 |
$ | 1,054 | $ | 106 | — | $ | 8 | $ | 1,168 | |||||||||||
| For the year ended June 30, 2013 |
$ | 1,886 | $ | (319 | ) | $ | (513 | ) | — | $ | 1,054 | |||||||||
| Deferred tax valuation allowance |
||||||||||||||||||||
| Successor |
||||||||||||||||||||
| For the year ended June 30, 2015 |
$ | 9,280 | $ | 1,185 | $ | (1,429 | ) | $ | 1,014 | $ | 10,050 | |||||||||
| For the period from August 15, 2013 through June 30, 2014 |
$ | — | $ | 1,435 | $ | — | $ | 7,845 | (a) | $ | 9,280 | |||||||||
| Predecessor |
||||||||||||||||||||
| For the period from July 1, 2013 through August 14, 2013 |
— | — | — | — | — | |||||||||||||||
| For the year ended June 30, 2013 |
— | — | — | — | — | |||||||||||||||
| (a) | Includes the effect of acquisitions |
F-56
Table of Contents
MULTI PACKAGING SOLUTIONS GLOBAL HOLDINGS LIMITED (FORMERLY CHESAPEAKE FINANCE 2 LIMITED)
CONSOLIDATED FINANCIAL STATEMENTS
FOR THE PERIOD 13 JUNE 2013 (DATE OF INCEPTION) TO 29 DECEMBER 2013
(SUCCESSOR)
FOR THE PERIOD 31 DECEMBER 2012 TO 30 SEPTEMBER 2013 AND THE 52 WEEKS
ENDED 30 DECEMBER 2012 (PREDECESSOR)
F-57
Table of Contents
MULTI PACKAGING SOLUTIONS GLOBAL HOLDINGS LIMITED
CONTENTS
| F-59 | ||||
| F-61 | ||||
| F-62 | ||||
| F-63 | ||||
| F-64 | ||||
| F-65 | ||||
F-58
Table of Contents
To the Board of Directors of
Multi Packaging Solutions Global Holdings Limited
Nottingham, United Kingdom
We have audited the accompanying consolidated financial statements of Multi Packaging Solutions Global Holdings Limited and its subsidiaries (the “Company”), which comprise the consolidated balance sheets as at 29 December 2013 (Successor) and 30 December 2012 (Predecessor), and the related consolidated statements of profit and loss account, total recognised gains and losses, and cash flows for the period from 13 June 2013 (date of inception) through 29 December 2013 (Successor), for the period from 31 December 2012 through 29 September 2013 (Predecessor), and for the 52 weeks ended 30 December 2012 (Predecessor), and the related notes to the consolidated financial statements.
Management’s Responsibility for the Consolidated Financial Statements
Management is responsible for the preparation and fair presentation of these consolidated financial statements in accordance with accounting principles generally accepted in the United Kingdom; this includes the design, implementation, and maintenance of internal control relevant to the preparation and fair presentation of consolidated financial statements that are free from material misstatement, whether due to fraud or error.
Auditors’ Responsibility
Our responsibility is to express an opinion on these consolidated financial statements based on our audits. We conducted our audits in accordance with auditing standards generally accepted in the United States of America. Those standards require that we plan and perform the audit to obtain reasonable assurance about whether the consolidated financial statements are free from material misstatement.
An audit involves performing procedures to obtain audit evidence about the amounts and disclosures in the consolidated financial statements. The procedures selected depend on the auditor’s judgment, including the assessment of the risks of material misstatement of the consolidated financial statements, whether due to fraud or error. In making those risk assessments, the auditor considers internal control relevant to the Company’s preparation and fair presentation of the consolidated financial statements in order to design audit procedures that are appropriate in the circumstances, but not for the purpose of expressing an opinion on the effectiveness of the Company’s internal control. Accordingly, we express no such opinion. An audit also includes evaluating the appropriateness of accounting policies used and the reasonableness of significant accounting estimates made by management, as well as evaluating the overall presentation of the consolidated financial statements.
We believe that the audit evidence we have obtained is sufficient and appropriate to provide a basis for our audit opinion.
Opinion
In our opinion, the consolidated financial statements referred to above present fairly, in all material respects, the financial position of Multi Packaging Solutions Global Holdings Limited and its subsidiaries as at 29 December 2013 (Successor) and 31 December 2012 (Predecessor), and the results of their operations and their cash flows for the period from 13 June 2013 (date of inception) to 29 December 2013 (Successor), for the period from 31 December 2012 through 29 September 2013 (Predecessor), and for the 52 weeks ended 30 December 2012 (Predecessor), in accordance with accounting principles generally accepted in the United Kingdom.
F-59
Table of Contents
INDEPENDENT AUDITOR’S REPORT
Emphasis of Matter
Accounting principles generally accepted in the United Kingdom vary in certain significant respects from accounting principles generally accepted in the United States of America. Information relating to the nature and effect of such differences is presented in note 30 to the consolidated financial statements. Our opinion is not modified with respect to this matter.
/s/ Deloitte LLP
DELOITTE LLP
London
United Kingdom
18 June 2015
F-60
Table of Contents
MULTI PACKAGING SOLUTIONS GLOBAL HOLDINGS LIMITED
CONSOLIDATED PROFIT AND LOSS ACCOUNT
FOR THE PERIOD 13 JUNE 2013 (DATE OF INCEPTION) TO 29 DECEMBER 2013 (SUCCESSOR), AND
FOR THE 39 WEEKS ENDED 30 SEPTEMBER 2013 AND THE 52 WEEKS ENDED 30 DECEMBER 2012
(PREDECESSOR)
| Successor | Predecessor | |||||||||||||||||
| Note | 13 June 2013 to 29 December 2013 |
31 December 2012 to 30 September 2013 |
52 weeks ended 30 December 2012 |
|||||||||||||||
| £’000 | £’000 | £’000 | ||||||||||||||||
| Turnover: Group and share of joint venture |
132,029 | 433,529 | 551,274 | |||||||||||||||
| Less: Share of joint venture |
— | (7,260 | ) | (7,596 | ) | |||||||||||||
|
|
|
|
|
|
|
|||||||||||||
| Group turnover |
2 | 132,029 | 426,269 | 543,678 | ||||||||||||||
| Cost of sales |
(103,172 | ) | (326,983 | ) | (418,803 | ) | ||||||||||||
|
|
|
|
|
|
|
|||||||||||||
| Gross profit |
28,857 | 99,286 | 124,875 | |||||||||||||||
| Other operating expenses (net) |
3 | (31,602 | ) | (83,479 | ) | (66,342 | ) | |||||||||||
|
|
|
|
|
|
|
|||||||||||||
| Operating (loss) / profit |
(2,745 | ) | 15,807 | 58,533 | ||||||||||||||
| Share of joint venture’s operating profit |
— | 611 | 633 | |||||||||||||||
|
|
|
|
|
|
|
|||||||||||||
| (Loss) / profit on ordinary activities before finance charges |
(2,745 | ) | 16,418 | 59,166 | ||||||||||||||
| Finance charges (net) |
||||||||||||||||||
| Group |
4 | (4,901 | ) | (4,546 | ) | (8,885 | ) | |||||||||||
| Joint venture |
4 | — | (10 | ) | (8 | ) | ||||||||||||
|
|
|
|
|
|
|
|||||||||||||
| (Loss) / profit on ordinary activities before taxation |
5 | (7,646 | ) | 11,862 | 50,273 | |||||||||||||
| Tax on loss / profit on ordinary activities |
6 | (1,010 | ) | (6,258 | ) | (4,679 | ) | |||||||||||
|
|
|
|
|
|
|
|||||||||||||
| (Loss) / profit on ordinary activities after tax |
(8,656 | ) | 5,604 | 45,594 | ||||||||||||||
| Equity minority interests |
— | (147 | ) | (81 | ) | |||||||||||||
|
|
|
|
|
|
|
|||||||||||||
| (Loss) / profit for the financial period |
(8,656 | ) | 5,457 | 45,513 | ||||||||||||||
|
|
|
|
|
|
|
|||||||||||||
F-61
Table of Contents
MULTI PACKAGING SOLUTIONS GLOBAL HOLDINGS LIMITED
CONSOLIDATED STATEMENT OF TOTAL RECOGNISED GAINS AND LOSSES
FOR THE PERIOD 13 JUNE 2013 (DATE OF INCEPTION) TO 29 DECEMBER 2013 (SUCCESSOR), AND
FOR THE 39 WEEKS ENDED 30 SEPTEMBER 2013 AND THE 52 WEEKS ENDED 30 DECEMBER 2012
(PREDECESSOR)
| Successor | Predecessor | |||||||||||||||||
| Note | 13 June 2013 to 29 December 2013 |
31 December 2012 to 30 September 2013 |
52 weeks ended 30 December 2012 |
|||||||||||||||
| £’000 | £’000 | £’000 | ||||||||||||||||
| (Loss) / profit for the financial period |
||||||||||||||||||
| Group |
(8,656 | ) | 4,983 | 45,048 | ||||||||||||||
| Joint venture |
— | 474 | 465 | |||||||||||||||
|
|
|
|
|
|
|
|||||||||||||
| Currency translation differences on net foreign currency investments offset in reserves |
||||||||||||||||||
| Group |
(686 | ) | 5,116 | (4,272 | ) | |||||||||||||
| Joint venture |
— | 125 | (112 | ) | ||||||||||||||
|
|
|
|
|
|
|
|||||||||||||
| Actuarial losses relating to the pension schemes |
23 | (6,551 | ) | (7,455 | ) | (17,851 | ) | |||||||||||
| Credit for current tax attributable to actuarial loss |
1,157 | 6 | 2,866 | |||||||||||||||
|
|
|
|
|
|
|
|||||||||||||
| Total recognised gains and losses relating to the financial period |
(14,736 | ) | 3,249 | 26,144 | ||||||||||||||
|
|
|
|
|
|
|
|||||||||||||
F-62
Table of Contents
MULTI PACKAGING SOLUTIONS GLOBAL HOLDINGS LIMITED
CONSOLIDATED BALANCE SHEETS
AS AT 29 DECEMBER 2013 (SUCCESSOR) AND 30 DECEMBER 2012 (PREDECESSOR)
| Successor | Predecessor | |||||||||||||
| Note | 29 December 2013 |
30 December 2012 |
||||||||||||
| £’000 | £’000 | |||||||||||||
| Fixed assets |
||||||||||||||
| Negative goodwill |
7 | — | (63,124 | ) | ||||||||||
| Positive goodwill |
7 | 224,211 | 29,540 | |||||||||||
|
|
|
|
|
|||||||||||
| 224,211 | (33,584 | ) | ||||||||||||
| Other intangibles |
7 | 45 | 62 | |||||||||||
| Tangible assets |
8 | 180,032 | 180,251 | |||||||||||
| Investments in joint ventures |
9 | |||||||||||||
| Share of gross assets |
— | 6,251 | ||||||||||||
| Share of gross liabilities |
— | (756 | ) | |||||||||||
|
|
|
|
|
|||||||||||
| — | 5,495 | |||||||||||||
| Other investments |
9 | 91 | 99 | |||||||||||
|
|
|
|
|
|||||||||||
| 404,379 | 152,323 | |||||||||||||
|
|
|
|
|
|||||||||||
| Current assets |
||||||||||||||
| Stocks |
11 | 49,704 | 52,549 | |||||||||||
| Debtors |
12 | 85,827 | 91,410 | |||||||||||
| Cash at bank and in hand |
16,553 | 23,513 | ||||||||||||
|
|
|
|
|
|||||||||||
| 152,084 | 167,472 | |||||||||||||
| Creditors: Amounts falling due within one year |
13 | (113,652 | ) | (125,145 | ) | |||||||||
|
|
|
|
|
|||||||||||
| Net current assets |
38,432 | 42,327 | ||||||||||||
|
|
|
|
|
|||||||||||
| Total assets less current liabilities |
442,811 | 194,650 | ||||||||||||
| Creditors: Amounts falling due after more than one year |
14 | (277,212 | ) | (78,794 | ) | |||||||||
|
|
|
|
|
|||||||||||
| Net assets excluding pension liability |
165,599 | 115,856 | ||||||||||||
| Pension liability |
23 | (15,362 | ) | (33,669 | ) | |||||||||
|
|
|
|
|
|||||||||||
| Net assets including pension liability |
150,237 | 82,187 | ||||||||||||
|
|
|
|
|
|||||||||||
| Capital and reserves |
||||||||||||||
| Called-up share capital |
16 | 164,948 | 459 | |||||||||||
| Profit and loss account |
17 | (14,711 | ) | 80,549 | ||||||||||
| Other reserves |
17 | — | 31 | |||||||||||
|
|
|
|
|
|||||||||||
| Shareholders’ funds |
150,237 | 81,039 | ||||||||||||
| Minority interests |
— | 1,148 | ||||||||||||
|
|
|
|
|
|||||||||||
| Total Capital Employed |
150,237 | 82,187 | ||||||||||||
|
|
|
|
|
|||||||||||
The financial statements were approved by the board of Directors and authorised for issue on 18 June 15.
They were signed on its behalf by:
Director
/s/ Rick Smith
F-63
Table of Contents
MULTI PACKAGING SOLUTIONS GLOBAL HOLDINGS LIMITED
CONSOLIDATED CASHFLOW STATEMENT
FOR THE PERIOD 13 JUNE 2013 (DATE OF INCEPTION) TO 29 DECEMBER 2013 (SUCCESSOR), AND
FOR THE 39 WEEKS ENDED 30 SEPTEMBER 2013 AND THE 52 WEEKS ENDED 30 DECEMBER 2012
(PREDECESSOR)
| Successor | Predecessor | |||||||||||||||||
| Note | 13 June 2013 to 29 December 2013 |
31 December 2012 to 30 September 2013 |
52 weeks ended 30 December 2012 |
|||||||||||||||
| £’000 | £’000 | £’000 | ||||||||||||||||
| Net cash (outflow)/inflow from operating activities |
19 | (20,803 | ) | 42,630 | 45,963 | |||||||||||||
| Returns on investments and servicing of finance |
20 | (3,298 | ) | (6,113 | ) | (2,318 | ) | |||||||||||
| Taxation |
20 | (1,350 | ) | (2,179 | ) | (2,420 | ) | |||||||||||
| Capital expenditure and financial investment |
20 | (2,760 | ) | (21,192 | ) | (22,754 | ) | |||||||||||
| Acquisition and disposals |
20 | (354,340 | ) | (527 | ) | (3,625 | ) | |||||||||||
|
|
|
|
|
|
|
|||||||||||||
| Cash (outflow)/inflow before management of liquid resources and financing |
(382,551 | ) | 12,619 | 14,846 | ||||||||||||||
| Financing |
20 | 399,226 | (7,279 | ) | (440 | ) | ||||||||||||
|
|
|
|
|
|
|
|||||||||||||
| Increase in cash in the period |
21 | 16,675 | 5,340 | 14,406 | ||||||||||||||
| Opening cash balance |
— | 23,513 | 9,219 | |||||||||||||||
| Foreign exchange movements |
(122 | ) | 158 | (112 | ) | |||||||||||||
|
|
|
|
|
|
|
|||||||||||||
| Closing cash balance |
16,553 | 29,011 | 23,513 | |||||||||||||||
|
|
|
|
|
|
|
|||||||||||||
F-64
Table of Contents
MULTI PACKAGING SOLUTIONS GLOBAL HOLDINGS LIMITED
NOTES TO THE FINANCIAL STATEMENTS
FOR THE PERIOD 13 JUNE 2013 (DATE OF INCEPTION) TO 29 DECEMBER 2013 (SUCCESSOR), AND
FOR THE 39 WEEKS ENDED 30 SEPTEMBER 2013 AND THE 52 WEEKS ENDED 30 DECEMBER 2012 (PREDECESSOR)
1. Accounting policies
The principal accounting policies are summarised below. They have all been applied consistently throughout all the periods presented.
The Company
Successor
“MPS”, the “Company”, and the “Successor” refer to Multi Packaging Solutions Global Holdings Ltd., formerly Chesapeake Finance 2 Limited. MPS is a leading, global provider of value-added packaging solutions to a diverse customer base across the healthcare, consumer, and multi-media end markets. MPS provides its customers with print-based specialty packaging, including premium folding cartons, labels and inserts booklets, tubes, rigid boxes and other specialty packaging across a variety of substrates and finishes.
Although the Company was incorporated on 13 June 2013, it had no assets or liabilities (other than proceeds of the ordinary shares issued on incorporation) and no operations prior to the acquisition on 30 September 2013 of the paperboard operations of Chesapeake Holdings S.à r.l. The Successor financial statements present the period 13 June 2013 to 29 December 2013 which includes trading from the acquisition date of 30 September 2013. Prior to 30 September 2013 the Successor had no operations.
Predecessor
Since the Company had no operations at the time of the acquisition, Chesapeake Holdings S.à r.l. is considered to be the predecessor of the Company (the “Predecessor”).
The financial statements of the Predecessor include the operations of both the paperboard and plastics businesses for the periods presented. The paperboard business represented substantially all of the operations of the Predecessor.
The revenues of the former plastics operations of the Predecessor for the periods ended 30 September 2013 and 30 December 2012 which were not acquired by the Company amounted to £47,134,000 and £58,606,000 respectively.
Since the Company accounted for the acquisition of the paperboard operations of the Predecessor under the acquisition method, the Successor and Predecessor periods are not comparable due to the application of acquisition accounting and the fact that the Company did not acquire the plastics business of the Predecessor.
References in the consolidated financial statements to the Group refer to the Predecessor and its subsidiaries in the periods prior to the acquisition of the paperboard operations, and to the Company and its subsidiaries in the period subsequent to the acquisition.
F-65
Table of Contents
MULTI PACKAGING SOLUTIONS GLOBAL HOLDINGS LIMITED
NOTES TO THE FINANCIAL STATEMENTS
FOR THE PERIOD 13 JUNE 2013 (DATE OF INCEPTION) TO 29 DECEMBER 2013 (SUCCESSOR), AND
FOR THE 39 WEEKS ENDED 30 SEPTEMBER 2013 AND THE 52 WEEKS ENDED 30 DECEMBER 2012 (PREDECESSOR)
1. Accounting policies (continued)
Basis of accounting
Chesapeake Holdings S.à r.l. (the Predecessor) was authorised on 23 March 2010 by the Luxembourg Ministry of Justice to prepare its consolidated financial statements in accordance with accounting principles generally accepted in the United Kingdom (“UK GAAP”). The consolidated financial statements have been prepared under the historical cost convention.
The Successor is a UK incorporated company and also prepares its financial statements in accordance with UK GAAP.
Basis of consolidation
The financial statements consolidate the financial statements of the Company and its subsidiaries drawn up to the Sunday closest to 31 December each year. The majority of Group companies prepare financial statements to this date and therefore the consolidated financial statements are also prepared to the Sunday closest to 31 December each year.
The results of subsidiaries acquired or sold are consolidated for the periods from or to the date on which control passed. Acquisitions are accounted for under the acquisition method.
Going concern
The Group shows net assets on its balance sheet of £150,237,000 at 29 December 2013.
The Group incurred a £20,803,000 cash outflow from operating activities during the period ended 29 December 2013, and the Group’s cash balances at 29 December 2013 were £16,553,000. Of the £20,803,000 cash outflow, £34,249,000 relates to deficit reducing pension contributions and £17,346,000 relates to expenses in respect of the acquisition of the paperboard business.
The Group’s forecasts and projections, taking account of reasonably possible changes in trading performance, show that the Group will be able to operate within the level of its current facilities.
The directors and management of the Group seek to ensure that adequate liquidity is available to all members of the Group, through a combination of making internally generated funds available where needed and by arranging borrowing facilities to be available to the Group as needed.
After making enquiries, the directors have a reasonable expectation that the Group has adequate resources to continue in operational existence for the foreseeable future. Accordingly, they continue to adopt the going concern basis in preparing the financial statements.
Intangible assets—goodwill
Goodwill arising on the acquisition of subsidiary undertakings, representing any excess of the fair value of the consideration given over the fair value of the identifiable assets and liabilities acquired, is capitalised and written
F-66
Table of Contents
MULTI PACKAGING SOLUTIONS GLOBAL HOLDINGS LIMITED
NOTES TO THE FINANCIAL STATEMENTS
FOR THE PERIOD 13 JUNE 2013 (DATE OF INCEPTION) TO 29 DECEMBER 2013 (SUCCESSOR), AND
FOR THE 39 WEEKS ENDED 30 SEPTEMBER 2013 AND THE 52 WEEKS ENDED 30 DECEMBER 2012 (PREDECESSOR)
1. Accounting policies (continued)
Intangible assets—goodwill (continued)
off on a straight-line basis over its estimated useful economic life, which is presumed to be 5-7 years unless a more accurate estimate can be made. Provision is made for any impairment.
Negative goodwill is included in the balance sheet and is credited to the profit and loss account in the periods in which the acquired non-monetary assets are recovered through depreciation or sale. Negative goodwill in excess of the fair values of the non-monetary assets acquired is credited to the profit and loss account in the periods expected to benefit.
Intangible assets—research and development
Research expenditure is written off as incurred. Development expenditure is also written off, except where the Directors are satisfied as to the technical, commercial and financial viability of individual projects. In such cases, the identifiable expenditure is deferred and amortised over the period during which the Group is expected to benefit. This period is between three and five years. Provision is made for any impairment.
Tangible fixed assets
Tangible fixed assets are stated at cost, net of depreciation and any provision for impairment. Depreciation is provided on all tangible fixed assets, other than assets in the course of construction and freehold land, at rates calculated to write off the cost or valuation, less estimated residual value, of each asset on a straight-line basis over its expected useful life, as follows:
| Freehold buildings |
2 - 5% per annum | |
| Leasehold land and buildings |
term of lease | |
| Plant and machinery |
8 - 10% per annum |
Residual value is calculated on prices prevailing at the date of acquisition.
Investments
Fixed asset investments are shown at cost less provision for impairment. Current asset investments are stated at the lower of cost and net realisable value.
Joint Ventures
Investments in joint ventures are accounted for using the equity method. The consolidated profit and loss account includes the Group’s share of the joint venture’s profits less losses while the Group’s share of the net assets of the joint venture is shown in the consolidated balance sheet.
F-67
Table of Contents
MULTI PACKAGING SOLUTIONS GLOBAL HOLDINGS LIMITED
NOTES TO THE FINANCIAL STATEMENTS
FOR THE PERIOD 13 JUNE 2013 (DATE OF INCEPTION) TO 29 DECEMBER 2013 (SUCCESSOR), AND
FOR THE 39 WEEKS ENDED 30 SEPTEMBER 2013 AND THE 52 WEEKS ENDED 30 DECEMBER 2012 (PREDECESSOR)
1. Accounting policies (continued)
Stocks
Stocks are stated at the lower of cost and net realisable value. Cost includes materials, direct labour and an attributable proportion of manufacturing overheads based on normal levels of activity. Net realisable value is based on estimated selling price, less further costs expected to be incurred to completion and disposal. Provision is made for obsolete, slow-moving or defective items where appropriate.
Taxation
Current tax is provided at amounts expected to be paid (or recovered) using the tax rates and laws that have been enacted or substantively enacted by the balance sheet date.
Deferred tax is recognised in respect of all timing differences that have originated but not reversed at the balance sheet date where transactions or events that result in an obligation to pay more tax in the future or a right to pay less tax in the future have occurred at the balance sheet date. Timing differences are differences between the Group’s taxable profits and its results as stated in the financial statements that arise from the inclusion of gains and losses in tax assessments in periods different from those in which they are recognised in the financial statements.
A net deferred tax asset is regarded as recoverable and therefore recognised only to the extent that, on the basis of all available evidence, it can be regarded as more likely than not that there will be suitable taxable profits from which the future reversal of the underlying timing differences can be deducted.
Deferred tax is recognised in respect of the retained earnings of overseas subsidiaries and associates only to the extent that, at the balance sheet date, dividends have been accrued as receivable or a binding agreement to distribute past earnings in future has been entered into by the subsidiary or joint venture.
Deferred tax is measured at the average tax rates that are expected to apply in the periods in which the timing differences are expected to reverse based on tax rates and laws that have been enacted or substantively enacted by the balance sheet date. Deferred tax is measured on a non-discounted basis.
Turnover
Turnover is stated net of VAT and trade discounts. Turnover from the sale of goods is recognised when the goods are physically delivered to the customer. Turnover from the supply of services represents the value of services provided under contracts to the extent that there is a right to consideration and is recorded at the value of the consideration due. Where a contract has only been partially completed at the balance sheet date turnover represents the value of the service provided to date based on a proportion of the total contract value. Where payments are received from customers in advance of services provided, the amounts are recorded as Deferred Income and included as part of creditors due within one year.
F-68
Table of Contents
MULTI PACKAGING SOLUTIONS GLOBAL HOLDINGS LIMITED
NOTES TO THE FINANCIAL STATEMENTS
FOR THE PERIOD 13 JUNE 2013 (DATE OF INCEPTION) TO 29 DECEMBER 2013 (SUCCESSOR), AND
FOR THE 39 WEEKS ENDED 30 SEPTEMBER 2013 AND THE 52 WEEKS ENDED 30 DECEMBER 2012 (PREDECESSOR)
1. Accounting policies (continued)
Pension costs
For defined benefit schemes the amounts charged to operating profit are the current service costs and gains and losses on settlements and curtailments. They are included as part of staff costs. Past service costs are recognised immediately in the profit and loss account if the benefits have vested. If the benefits have not vested immediately, the costs are recognised over the period until vesting occurs. The interest cost and the expected return on assets are shown as a net amount of other finance costs or credits adjacent to interest. Actuarial gains and losses are recognised immediately in the statement of total recognised gains and losses.
Certain defined benefit schemes are funded, with the assets of the scheme held separately from those of the Group, in separate trustee administered funds. Pension scheme assets are measured at fair value and liabilities are measured on an actuarial basis using the projected unit method and discounted at a rate equivalent to the current rate of return on a high quality corporate bond of equivalent currency and term to the scheme liabilities. The actuarial valuations are obtained at least triennially and are updated at each balance sheet date. The resulting defined benefit asset or liability, net of the related deferred tax, is presented separately after other net assets on the face of the balance sheet.
For defined contribution schemes the amount charged to the profit and loss account in respect of pension costs and other post-retirement benefits is the contributions payable in the year. Differences between contributions payable in the year and contributions actually paid are shown as either accruals or prepayments in the balance sheet.
Foreign currency
Transactions in foreign currencies are recorded at the rate of exchange at the date of the transaction or, if hedged, at the forward contract rate. Monetary assets and liabilities denominated in foreign currencies at the balance sheet date are reported at the rates of exchange prevailing at that date or, if appropriate, at the forward contract rate.
The results of overseas operations are translated at the average rates of exchange during the period and their balance sheets at the rates ruling at the balance sheet date. Exchange differences arising on translation of the opening net assets and results of overseas operations and on foreign currency borrowings, to the extent that they hedge the Group’s investment in such operations, are reported in the statement of total recognised gains and losses. All other exchange differences are included in the profit and loss account.
Share based compensation
The group has applied the requirements of Financial Reporting Standard (“FRS”) 20, Share Based Payments. The group has issued equity-settled share-based payments to certain employees. Equity-settled share-based payments are measured at fair value (excluding the effect of non-market-based vesting conditions) at the date of grant. The fair value determined at the grant date of the equity-settled share-based payments is expensed on a straight-line basis over the vesting period, based on the company’s estimate of shares that will eventually vest and adjusted for the effect of non-market-based vesting conditions.
F-69
Table of Contents
MULTI PACKAGING SOLUTIONS GLOBAL HOLDINGS LIMITED
NOTES TO THE FINANCIAL STATEMENTS
FOR THE PERIOD 13 JUNE 2013 (DATE OF INCEPTION) TO 29 DECEMBER 2013 (SUCCESSOR), AND
FOR THE 39 WEEKS ENDED 30 SEPTEMBER 2013 AND THE 52 WEEKS ENDED 30 DECEMBER 2012 (PREDECESSOR)
1. Accounting policies (continued)
Equity instruments
Equity instruments issued by the Company are recorded at the proceeds received, net of direct issue costs.
Leases
Assets held under finance leases and other similar contracts, which confer rights and obligations similar to those attached to owned assets, are capitalised as tangible fixed assets and are depreciated over the shorter of the lease terms and their useful lives. The capital elements of future lease obligations are recorded as liabilities, while the interest elements are charged to the profit and loss account over the period of the leases to produce a constant rate of charge on the balance of capital repayments outstanding. Hire purchase transactions are dealt with similarly, except that assets are depreciated over their useful lives.
Rentals under operating leases are charged on a straight-line basis over the lease term, even if the payments are not made on such a basis. Benefits received and receivable as an incentive to sign an operating lease are similarly spread on a straight-line basis over the lease term, except where the period to the review date on which the rent is first expected to be adjusted to the prevailing market rate is shorter than the full lease term, in which case the shorter period is used.
Finance costs
Finance costs of financial liabilities are recognised in the profit and loss account over the term of such instruments at a constant rate on the carrying amount.
Finance costs which are directly attributable to the construction of tangible fixed assets are capitalised as part of the cost of those assets. The commencement of capitalisation begins when both finance costs and expenditures for the asset are being incurred and activities that are necessary to get the asset ready for use are in progress. Capitalisation ceases when substantially all the activities that are necessary to get the asset ready for use are complete.
Financial liabilities and equity
Financial liabilities and equity instruments are classified according to the substance of the contractual arrangements entered into. An equity instrument is any contract that evidences a residual interest in the assets of the Group after deducting all of its liabilities.
Bank borrowings
Interest-bearing bank loans and overdrafts are recorded at the proceeds received, net of direct issue costs. Finance charges, including premiums payable on settlement or redemption and direct issue costs, are accounted for on an accruals basis in the profit or loss account using the effective interest method and are added to the carrying amount of the instrument to the extent that they are not settled in the period in which they arise. Finance costs are recognised in the profit and loss account over the term of such instruments at a constant rate on the carrying amount.
F-70
Table of Contents
MULTI PACKAGING SOLUTIONS GLOBAL HOLDINGS LIMITED
NOTES TO THE FINANCIAL STATEMENTS
FOR THE PERIOD 13 JUNE 2013 (DATE OF INCEPTION) TO 29 DECEMBER 2013 (SUCCESSOR), AND
FOR THE 39 WEEKS ENDED 30 SEPTEMBER 2013 AND THE 52 WEEKS ENDED 30 DECEMBER 2012 (PREDECESSOR)
1. Accounting policies (continued)
Derivative financial instruments
The Group may use derivative financial instruments to reduce exposure to foreign exchange risk and interest rate movements. Such transactions are not recorded on the balance sheet. The Group does not hold or issue derivative financial instruments for speculative purposes.
Government grants
Government grants relating to tangible fixed assets are treated as deferred income and released to the profit and loss account over the expected useful lives of the assets concerned. Other grants are credited to the profit and loss account as the related expenditure is incurred.
Related party transactions
The company has taken advantage of the exemption under FRS 8, Related Party Disclosures, whereby wholly-owned subsidiaries are not required to disclose intra group transactions and balances.
2. Turnover and segmental reporting
Turnover represents the amounts derived from provision of goods and services which fall within the Group’s ordinary activities, stated net of value added tax. Turnover for the period by destination is analysed as follows:
| Successor | Predecessor | |||||||||||||
| 13 June 2013 to 29 December 2013 |
31 December 2012 to 30 September 2013 |
52 weeks ended 30 December 2012 |
||||||||||||
| £’000 | £’000 | £’000 | ||||||||||||
| Geographical segment |
||||||||||||||
| United Kingdom |
55,956 | 191,456 | 225,087 | |||||||||||
| Continental Europe and Republic of Ireland |
60,646 | 186,900 | 257,684 | |||||||||||
| United States of America |
12,212 | 39,537 | 47,461 | |||||||||||
| Rest of the World |
3,215 | 8,376 | 13,446 | |||||||||||
|
|
|
|
|
|
|
|||||||||
| 132,029 | 426,269 | 543,678 | ||||||||||||
|
|
|
|
|
|
|
|||||||||
In the opinion of the Directors the disclosure of further segmental information would be seriously prejudicial to the interests of the group and has therefore not been provided.
F-71
Table of Contents
MULTI PACKAGING SOLUTIONS GLOBAL HOLDINGS LIMITED
NOTES TO THE FINANCIAL STATEMENTS
FOR THE PERIOD 13 JUNE 2013 (DATE OF INCEPTION) TO 29 DECEMBER 2013 (SUCCESSOR), AND
FOR THE 39 WEEKS ENDED 30 SEPTEMBER 2013 AND THE 52 WEEKS ENDED 30 DECEMBER 2012 (PREDECESSOR)
3. Other operating expenses (net)
| Successor | Predecessor | |||||||||||||
| 13 June 2013 to 29 December 2013 |
31 December 2012 to 30 September 2013 |
52 weeks ended 30 December 2012 |
||||||||||||
| £’000 | £’000 | £’000 | ||||||||||||
| Distribution costs |
3,875 | 13,021 | 16,127 | |||||||||||
| Administrative expenses |
16,143 | 73,697 | 67,551 | |||||||||||
| Costs for closures and other restructuring activity |
754 | 6,428 | 4,260 | |||||||||||
| Foreign exchange (gains) / losses |
(553 | ) | 2,768 | (3,705 | ) | |||||||||
| Amortisation of goodwill / (negative goodwill) |
11,776 | (12,103 | ) | (16,073 | ) | |||||||||
| Amortisation of intangible fixed assets |
4 | 13 | 20 | |||||||||||
| Gain on sale of tangible fixed assets |
(126 | ) | (352 | ) | (1,207 | ) | ||||||||
| Impairment of tangible fixed assets |
— | 725 | 620 | |||||||||||
| Other operating income |
(271 | ) | (718 | ) | (1,251 | ) | ||||||||
|
|
|
|
|
|
|
|||||||||
| Other operating expenses (net) |
31,602 | 83,479 | 66,342 | |||||||||||
|
|
|
|
|
|
|
|||||||||
4. Finance charges (net)
| Successor | Predecessor | |||||||||||||
| 13 June 2013 to 29 December 2013 |
31 December 2012 to 30 September 2013 |
52 weeks ended 30 December 2012 |
||||||||||||
| £’000 | £’000 | £’000 | ||||||||||||
| Interest payable and similar charges |
5,145 | 4,231 | 7,060 | |||||||||||
| Less: Interest receivable and similar income |
(21 | ) | (76 | ) | (75 | ) | ||||||||
| Other finance (income) / charges |
(223 | ) | 401 | 1,908 | ||||||||||
|
|
|
|
|
|
|
|||||||||
| 4,901 | 4,556 | 8,893 | ||||||||||||
|
|
|
|
|
|
|
|||||||||
| Group |
4,901 | 4,546 | 8,885 | |||||||||||
| Joint ventures |
— | 10 | 8 | |||||||||||
|
|
|
|
|
|
|
|||||||||
| 4,901 | 4,556 | 8,893 | ||||||||||||
|
|
|
|
|
|
|
|||||||||
F-72
Table of Contents
MULTI PACKAGING SOLUTIONS GLOBAL HOLDINGS LIMITED
NOTES TO THE FINANCIAL STATEMENTS
FOR THE PERIOD 13 JUNE 2013 (DATE OF INCEPTION) TO 29 DECEMBER 2013 (SUCCESSOR), AND
FOR THE 39 WEEKS ENDED 30 SEPTEMBER 2013 AND THE 52 WEEKS ENDED 30 DECEMBER 2012 (PREDECESSOR)
4. Finance charges (net) (continued)
Interest payable and similar charges
| Successor | Predecessor | |||||||||||||
| 13 June 2013 to 29 December 2013 |
31 December 2012 to 30 September 2013 |
52 weeks ended 30 December 2012 |
||||||||||||
| £’000 | £’000 | £’000 | ||||||||||||
| Series 1 Preferred Equity Certificates |
— | 2,146 | 4,175 | |||||||||||
| Bank facilities |
4,705 | 912 | 1,230 | |||||||||||
| Amortisation of deferred debt costs |
434 | 33 | 166 | |||||||||||
| Finance leases |
6 | 1,130 | 1,481 | |||||||||||
|
|
|
|
|
|
|
|||||||||
| 5,145 | 4,221 | 7,052 | ||||||||||||
| Share of joint venture’s interest payable and similar charges |
— | 10 | 8 | |||||||||||
|
|
|
|
|
|
|
|||||||||
| 5,145 | 4,231 | 7,060 | ||||||||||||
|
|
|
|
|
|
|
|||||||||
Other finance charges / (income)
| Successor | Predecessor | |||||||||||||
| 13 June 2013 to 29 December 2013 |
31 December 2012 to 30 September 2013 |
52 weeks ended 30 December 2012 |
||||||||||||
| £’000 | £’000 | £’000 | ||||||||||||
| Interest cost on defined benefit schemes (see note 23) |
3,521 | 10,533 | 13,823 | |||||||||||
| Expected return on scheme assets (see note 23) |
(3,812 | ) | (10,241 | ) | (11,866 | ) | ||||||||
| Other finance charges / (income) |
68 | 109 | (49 | ) | ||||||||||
|
|
|
|
|
|
|
|||||||||
| (223 | ) | 401 | 1,908 | |||||||||||
|
|
|
|
|
|
|
|||||||||
F-73
Table of Contents
MULTI PACKAGING SOLUTIONS GLOBAL HOLDINGS LIMITED
NOTES TO THE FINANCIAL STATEMENTS
FOR THE PERIOD 13 JUNE 2013 (DATE OF INCEPTION) TO 29 DECEMBER 2013 (SUCCESSOR), AND
FOR THE 39 WEEKS ENDED 30 SEPTEMBER 2013 AND THE 52 WEEKS ENDED 30 DECEMBER 2012 (PREDECESSOR)
5. Loss / (profit) on ordinary activities before taxation
Loss / (profit) on ordinary activities before taxation is stated after charging/(crediting):
| Successor | Predecessor | |||||||||||||
| 13 June 2013 to 29 December 2013 |
31 December 2012 to 30 September 2013 |
52 weeks ended 30 December 2012 |
||||||||||||
| £’000 | £’000 | £’000 | ||||||||||||
| Research and development expenditure |
204 | 618 | 627 | |||||||||||
| Government grant amortisation |
— | (452 | ) | (415 | ) | |||||||||
| Operating lease rentals: |
||||||||||||||
| Plant and machinery |
251 | 946 | 1,121 | |||||||||||
| Other |
1,158 | 4,348 | 5,435 | |||||||||||
| Depreciation of tangible fixed assets |
||||||||||||||
| Owned |
7,039 | 15,633 | 19,448 | |||||||||||
| Held under finance leases |
69 | 363 | 653 | |||||||||||
|
|
|
|
|
|
|
|||||||||
6. Tax on (loss)/profit on ordinary activities
| Successor | Predecessor | |||||||||||||
| 13 June 2013 to 29 December 2013 |
31 December 2012 to 30 September 2013 |
52 weeks ended 30 December 2012 |
||||||||||||
| £’000 | £’000 | £’000 | ||||||||||||
| The tax charge comprises: |
||||||||||||||
| Current tax |
||||||||||||||
| UK Corporation tax |
(693 | ) | 2,191 | — | ||||||||||
| Non-UK tax |
1,140 | 2,607 | 2,566 | |||||||||||
|
|
|
|
|
|
|
|||||||||
| Current tax charge |
447 | 4,798 | 2,566 | |||||||||||
|
|
|
|
|
|
|
|||||||||
| Deferred tax |
||||||||||||||
| Origination and reversal of timing differences (see note 15) |
(5,082 | ) | 825 | 865 | ||||||||||
| Deferred tax in relation to pension funding under FRS 17 (see note 23) |
5,645 | 508 | 1,088 | |||||||||||
|
|
|
|
|
|
|
|||||||||
| Total deferred tax charge (see note 15) |
563 | 1,333 | 1,953 | |||||||||||
|
|
|
|
|
|
|
|||||||||
| Share of joint venture’s tax |
— | 127 | 160 | |||||||||||
|
|
|
|
|
|
|
|||||||||
| Total tax on (loss)/profit on ordinary activities |
1,010 | 6,258 | 4,679 | |||||||||||
|
|
|
|
|
|
|
|||||||||
F-74
Table of Contents
MULTI PACKAGING SOLUTIONS GLOBAL HOLDINGS LIMITED
NOTES TO THE FINANCIAL STATEMENTS
FOR THE PERIOD 13 JUNE 2013 (DATE OF INCEPTION) TO 29 DECEMBER 2013 (SUCCESSOR), AND
FOR THE 39 WEEKS ENDED 30 SEPTEMBER 2013 AND THE 52 WEEKS ENDED 30 DECEMBER 2012 (PREDECESSOR)
6. Tax on (loss)/profit on ordinary activities (continued)
In addition to the above amounts recorded in the profit and loss account, a current tax credit of £1,157,000 for the period ended 29 December 2013 (period ended 30 September 2013: £6,000; 52 weeks ended 30 December 2012: £2,866,000) was recorded in the statement of total recognised gains and losses in respect of pension funding under FRS 17, Retirement Benefits (“FRS 17”).
The difference between the total current tax shown above and the amount calculated by applying the standard rate of UK corporation tax to the loss before tax is as follows:
| Successor | Predecessor | |||||||||||||
| 13 June 2013 to 29 December 2013 |
31 December 2012 to 30 September 2013 |
52 weeks ended 30 December 2012 |
||||||||||||
| £’000 | £’000 | £’000 | ||||||||||||
| (Loss)/profit on ordinary activities before tax |
(7,646 | ) | 11,862 | 50,273 | ||||||||||
| Less: share of joint ventures’ profit before tax |
— | (601 | ) | (625 | ) | |||||||||
|
|
|
|
|
|
|
|||||||||
| Gross (loss)/profit on ordinary activities before tax |
(7,646 | ) | 11,261 | 49,648 | ||||||||||
|
|
|
|
|
|
|
|||||||||
| Tax on (loss) / profit on ordinary activities at standard UK corporation tax rate of 23.25% (Luxembourg tax rate of 2013: 28.8%; 2012: 28.8%) |
(1,778 | ) | 3,240 | 14,299 | ||||||||||
| Effects of: |
||||||||||||||
| Income not taxable net of expenses not deductible |
2,509 | 6,069 | (8,912 | ) | ||||||||||
| Depreciation in excess of capital allowances |
1,363 | (851 | ) | (3,264 | ) | |||||||||
| Higher/(lower) tax rates on overseas earnings |
170 | (790 | ) | (67 | ) | |||||||||
| Other timing differences |
(1,817 | ) | (2,870 | ) | 510 | |||||||||
|
|
|
|
|
|
|
|||||||||
| Current tax charge for period |
447 | 4,798 | 2,566 | |||||||||||
|
|
|
|
|
|
|
|||||||||
The Successor earns its profits primarily in the UK. The standard rate of corporation tax is 23.25%. The Predecessor is Luxembourg based and is taxed at an effective rate of 28.8% .
The Group’s planned level of capital investment is expected to remain at similar levels of investment. Capital allowances were in excess of depreciation in the predecessor periods. This position has reversed in the Successor period where capital allowances have not been claimed in full because of the availability of other reliefs.
A reduction in the standard rate of corporation tax from 24% to 23% was effective from 1 April 2013. Accordingly, the group’s profits for this financial period are taxed at an effective rate of 23.25%. Finance Act 2013 provides for a further reduction in the standard rate of tax from 23% to 21% effective from 1 April 2014 and to 20% effective from 1 April 2015. This change was substantively enacted on 2 July 2013. These reduced rates have been reflected in the calculation of deferred tax as they were substantively enacted at the balance sheet date.
F-75
Table of Contents
MULTI PACKAGING SOLUTIONS GLOBAL HOLDINGS LIMITED
NOTES TO THE FINANCIAL STATEMENTS
FOR THE PERIOD 13 JUNE 2013 (DATE OF INCEPTION) TO 29 DECEMBER 2013 (SUCCESSOR), AND
FOR THE 39 WEEKS ENDED 30 SEPTEMBER 2013 AND THE 52 WEEKS ENDED 30 DECEMBER 2012 (PREDECESSOR)
7. Intangible fixed assets
| Negative Goodwill |
Goodwill | Other Intangibles |
||||||||||
| £’000 | £’000 | £’000 | ||||||||||
| Cost (Predecessor) |
||||||||||||
| At 2 January 2012 |
(132,556 | ) | 33,992 | 66 | ||||||||
| Additions |
— | 1,632 | — | |||||||||
| Adjustment |
— | (623 | ) | — | ||||||||
| Foreign exchange |
— | (63 | ) | 14 | ||||||||
|
|
|
|
|
|
|
|||||||
| At 30 December 2012 |
(132,556 | ) | 34,938 | 80 | ||||||||
|
|
|
|
|
|
|
|||||||
| Amortisation (Predecessor) |
||||||||||||
| At 2 January 2012 |
50,496 | (2,535 | ) | (4 | ) | |||||||
| Credit / (charge) for the year |
18,936 | (2,863 | ) | (20 | ) | |||||||
| Foreign exchange |
— | — | 6 | |||||||||
|
|
|
|
|
|
|
|||||||
| At 30 December 2012 |
69,432 | (5,398 | ) | (18 | ) | |||||||
|
|
|
|
|
|
|
|||||||
| Net book value |
||||||||||||
| At 30 December 2012 (Predecessor) |
(63,124 | ) | 29,540 | 62 | ||||||||
| At 2 January 2012 (Predecessor) |
(82,060 | ) | 31,457 | 62 | ||||||||
|
|
|
|
|
|
|
|||||||
Negative Goodwill (Predecessor)
Negative goodwill arose on the acquisition of the business and trading assets of the former Chesapeake Corporation on 30 April 2009. It is being written back on a straight line basis over a period of 7 years, which is equal to the estimated average period over which the related non-monetary assets of the acquired business are being depreciated.
Positive Goodwill (Predecessor)
Positive goodwill arose in the 52 weeks ended 30 December 2012 on the acquisition of Pharmapost SAS on 30 April 2012. It is being amortised on a straight line basis over its estimated useful economic life of 7 years.
F-76
Table of Contents
MULTI PACKAGING SOLUTIONS GLOBAL HOLDINGS LIMITED
NOTES TO THE FINANCIAL STATEMENTS
FOR THE PERIOD 13 JUNE 2013 (DATE OF INCEPTION) TO 29 DECEMBER 2013 (SUCCESSOR), AND
FOR THE 39 WEEKS ENDED 30 SEPTEMBER 2013 AND THE 52 WEEKS ENDED 30 DECEMBER 2012 (PREDECESSOR)
7. Intangible fixed assets (continued)
Positive Goodwill (Successor)
| Goodwill | Other Intangibles | |||||||
| £’000 | £’000 | |||||||
| Cost (Successor) |
||||||||
| Acquisition of subsidiary undertaking (see note 10) |
235,987 | 49 | ||||||
|
|
|
|
|
|||||
| At 29 December 2013 |
235,987 | 49 | ||||||
|
|
|
|
|
|||||
| Amortisation (Successor) |
||||||||
| Charge for the period |
(11,776 | ) | (4 | ) | ||||
|
|
|
|
|
|||||
| At 29 December 2013 |
(11,776 | ) | (4 | ) | ||||
|
|
|
|
|
|||||
| Net book value |
||||||||
| At 29 December 2013 (Successor) |
224,211 | 45 | ||||||
|
|
|
|
|
|||||
Positive goodwill arose in the period 13 June 2013 to 29 December 2013 on the acquisition of the paperboard operations of the Chesapeake group on 30 September 2013. It is being amortised on a straight-line basis over its estimated useful economic life of 5 years.
8. Tangible fixed assets
| Land and buildings |
Plant and machinery |
Assets in the course of construction |
Total | |||||||||||||
| £’000 | £’000 | £’000 | £’000 | |||||||||||||
| Cost (Predecessor) |
||||||||||||||||
| At 2 January 2012 |
71,085 | 138,283 | 9,689 | 219,057 | ||||||||||||
| Additions |
490 | 18,736 | 12,789 | 32,015 | ||||||||||||
| Acquisition of subsidiary undertakings |
— | 1,937 | — | 1,937 | ||||||||||||
| Disposals |
(153 | ) | (5,174 | ) | (10 | ) | (5,337 | ) | ||||||||
| Transfers |
11 | 11,612 | (11,623 | ) | — | |||||||||||
| Exchange adjustment |
(727 | ) | (2,477 | ) | (96 | ) | (3,300 | ) | ||||||||
|
|
|
|
|
|
|
|
|
|||||||||
| At 30 December 2012 (Predecessor) |
70,706 | 162,917 | 10,749 | 244,372 | ||||||||||||
|
|
|
|
|
|
|
|
|
|||||||||
| Depreciation and impairment (Predecessor) |
||||||||||||||||
| At 2 January 2012 |
3,686 | 45,438 | — | 49,124 | ||||||||||||
| Charge for the period |
1,297 | 18,804 | — | 20,101 | ||||||||||||
| Disposals |
(125 | ) | (3,504 | ) | — | (3,629 | ) | |||||||||
| Impairments |
44 | 576 | — | 620 | ||||||||||||
| Exchange adjustment |
(141 | ) | (1,954 | ) | — | (2,095 | ) | |||||||||
|
|
|
|
|
|
|
|
|
|||||||||
| At 30 December 2012 (Predecessor) |
4,761 | 59,360 | — | 64,121 | ||||||||||||
|
|
|
|
|
|
|
|
|
|||||||||
| Net book value (Predecessor) |
||||||||||||||||
| At 30 December 2012 |
65,945 | 103,557 | 10,749 | 180,251 | ||||||||||||
|
|
|
|
|
|
|
|
|
|||||||||
| At 2 January 2012 |
67,399 | 92,845 | 9,689 | 169,933 | ||||||||||||
|
|
|
|
|
|
|
|
|
|||||||||
F-77
Table of Contents
MULTI PACKAGING SOLUTIONS GLOBAL HOLDINGS LIMITED
NOTES TO THE FINANCIAL STATEMENTS
FOR THE PERIOD 13 JUNE 2013 (DATE OF INCEPTION) TO 29 DECEMBER 2013 (SUCCESSOR), AND
FOR THE 39 WEEKS ENDED 30 SEPTEMBER 2013 AND THE 52 WEEKS ENDED 30 DECEMBER 2012 (PREDECESSOR)
8. Tangible fixed assets (continued)
| Land and buildings |
Plant and machinery |
Assets in the course of construction |
Total | |||||||||||||
| £’000 | £’000 | £’000 | £’000 | |||||||||||||
| Cost (Successor) |
||||||||||||||||
| Additions |
128 | 1,854 | 4,863 | 6,845 | ||||||||||||
| Acquisition of subsidiary undertakings (see note 10) |
49,294 | 128,744 | 3,460 | 181,498 | ||||||||||||
| Disposals |
— | (381 | ) | (30 | ) | (411 | ) | |||||||||
| Transfers |
193 | 1,367 | (1,560 | ) | — | |||||||||||
| Exchange adjustment |
(294 | ) | (549 | ) | (45 | ) | (888 | ) | ||||||||
|
|
|
|
|
|
|
|
|
|||||||||
| At 29 December 2013 |
49,321 | 131,035 | 6,688 | 187,044 | ||||||||||||
|
|
|
|
|
|
|
|
|
|||||||||
| Depreciation and impairment (Successor) |
||||||||||||||||
| Charge for the period |
456 | 6,652 | — | 7,108 | ||||||||||||
| Disposals |
— | (70 | ) | — | (70 | ) | ||||||||||
| Exchange adjustment |
(2 | ) | (24 | ) | — | (26 | ) | |||||||||
|
|
|
|
|
|
|
|
|
|||||||||
| At 29 December 2013 |
454 | 6,558 | — | 7,012 | ||||||||||||
|
|
|
|
|
|
|
|
|
|||||||||
| Net book value (Successor) |
||||||||||||||||
| At 29 December 2013 |
48,867 | 124,477 | 6,688 | 180,032 | ||||||||||||
|
|
|
|
|
|
|
|
|
|||||||||
Leased assets included above:
| Land and buildings |
Plant and machinery |
Assets in the course of construction |
Total | |||||||||||||
| £’000 | £’000 | £’000 | £’000 | |||||||||||||
| Net book value |
||||||||||||||||
| At 29 December 2013 |
198 | 2,533 | — | 2,731 | ||||||||||||
|
|
|
|
|
|
|
|
|
|||||||||
| At 30 December 2012 |
— | 4,519 | — | 4,519 | ||||||||||||
|
|
|
|
|
|
|
|
|
|||||||||
Predecessor
Freehold land and buildings in the UK with a total net book value at 30 December 2012 of £19,400,000 and plant and machinery in the UK with a net book value at 30 December 2012 of £46,800,000 have been pledged through a combination of fixed charges and general debentures to Lloyds TSB group as security for term loans given under the Asset Based Financing Agreement entered into on 5 October 2010. Certain of the above freehold land and buildings in the UK have also been pledged with a first priority up to an amount of £2,100,000 to the Boxmore Group Pension Scheme as security for the obligation of the Group to make good the deficit in the scheme.
Land and buildings includes £39,199,000 of freehold land which is not depreciated.
F-78
Table of Contents
MULTI PACKAGING SOLUTIONS GLOBAL HOLDINGS LIMITED
NOTES TO THE FINANCIAL STATEMENTS
FOR THE PERIOD 13 JUNE 2013 (DATE OF INCEPTION) TO 29 DECEMBER 2013 (SUCCESSOR), AND
FOR THE 39 WEEKS ENDED 30 SEPTEMBER 2013 AND THE 52 WEEKS ENDED 30 DECEMBER 2012 (PREDECESSOR)
8. Tangible fixed assets (continued)
Successor
Land and buildings includes £32,743,000 of freehold land which is not depreciated. No freehold land and buildings were pledged in the Successor period.
9. Fixed asset investments
| Successor | Predecessor | |||||||||
| 29 December 2013 |
30 December 2012 |
|||||||||
| £’000 | £’000 | |||||||||
| Investments in joint ventures |
— | 5,495 | ||||||||
| Other investments |
91 | 99 | ||||||||
|
|
|
|
|
|||||||
| 91 | 5,594 | |||||||||
|
|
|
|
|
|||||||
Other Investments
| Successor | Predecessor | |||||||||
| 29 December 2013 |
30 December 2012 |
|||||||||
| £’000 | £’000 | |||||||||
| Opening balance |
— | 2,496 | ||||||||
| Balance obtained through acquisition (see note 10) |
131 | — | ||||||||
| Revaluations |
(39 | ) | 39 | |||||||
| Transferred against FRS 17 pension liability |
— | (2,436 | ) | |||||||
| Exchange movement |
(1 | ) | — | |||||||
|
|
|
|
|
|||||||
| 91 | 99 | |||||||||
|
|
|
|
|
|||||||
These consist of trade investments that have been acquired and set aside to fund future liabilities under un-funded defined benefit pension obligations in Germany. The investments are not held in separate trustee-administered funds and so are not classed as pension assets.
Investments in subsidiary undertakings
On 30 September 2013 the Company acquired 100% of the share capital of Chesapeake U.S. Holdings Inc, Chesapeake German Holdings GMBH, Chesapeake Packaging BV, Chesapeake Packaging Asia Ltd., and Chesapeake UK Holdings Ltd. Chesapeake German Holdings GMBH in turn acquired Chesapeake Packaging GMBH and Chesapeake U.S. Holdings Inc in turn acquired Chesapeake U.S. Inc. Together with their subsidiary undertakings these companies represented the paperboard operations of the Chesapeake group.
F-79
Table of Contents
MULTI PACKAGING SOLUTIONS GLOBAL HOLDINGS LIMITED
NOTES TO THE FINANCIAL STATEMENTS
FOR THE PERIOD 13 JUNE 2013 (DATE OF INCEPTION) TO 29 DECEMBER 2013 (SUCCESSOR), AND
FOR THE 39 WEEKS ENDED 30 SEPTEMBER 2013 AND THE 52 WEEKS ENDED 30 DECEMBER 2012 (PREDECESSOR)
9. Fixed asset investments (continued)
Subsidiary Undertakings
The parent Company and the Group have investments in the following subsidiary undertakings, and other investments which principally affected the profits or net assets of the Group. To avoid a statement of excessive length, details of investments which are not significant have been omitted.
| Successor | Predecessor | |||||||||||||||
| Subsidiary Undertakings | Country of Incorporation |
Principal activity | Holding | % | 29 December 2013 |
30 September 2013 |
30 December 2012 | |||||||||
| Multi Packaging Solutions Acquisitions 2 Limited* (formerly Chesapeake Holdings Limited) |
United Kingdom | Holding Company | £1.00 Ord shares | 100 | ü | ü | ü | |||||||||
| Multi Packaging Solutions Acquisitions Limited (formerly Chesapeake UK Acquisitions Limited) |
United Kingdom | Holding Company | £1.00 Ord shares | 100 | ü | ü | ü | |||||||||
| Multi Packaging Solutions UK Limited (formerly Chesapeake Limited) |
United Kingdom | Packaging manufacturer |
£0.10 Ord shares £0.01 Irredeemable |
100 100 |
ü | ü | ü | |||||||||
| Multi Packaging Solutions NI Limited (formerly Chesapeake Packaging NI Limited) |
United Kingdom | Holding Company | £0.10 Ord shares | 100 | ü | ü | ü | |||||||||
| Multi Packaging Solutions GB Limited (formerly Chesapeake & Sons Limited) |
United Kingdom | Holding Company | £1.00 Ord shares | 100 | ü | ü | ü | |||||||||
| Multi Packaging Solutions Belfast Limited (formerly Chesapeake Belfast Limited) |
United Kingdom | Packaging manufacturer |
£0.01 Ord shares £1.00 Deferred Ord £1.00 Preference |
100 100 100 |
ü | ü | ü | |||||||||
| Multi Packaging Solutions Hillington Limited (formerly Chesapeake Hillington Limited) |
United Kingdom | Packaging manufacturer |
£0.50 Ord shares £0.50 1980 Pref |
100 100 |
ü | ü | ü | |||||||||
| Multi Packaging Solutions Bristol Limited (formerly Chesapeake Bristol Limited) |
United Kingdom | Packaging manufacturer |
£1.00 Ord shares | 100 | ü | ü | ü | |||||||||
| Multi Packaging Solutions Limerick Limited (formerly Chesapeake Pharmaceutical and Healthcare Packaging (Limerick) Limited) |
Republic of Ireland | Packaging manufacturer |
€1.27 Ord shares | 100 | ü | ü | ü | |||||||||
| Multi Packaging Solutions Dublin Limited (formerly Chesapeake Pharmaceutical and Healthcare Packaging (Dublin) Limited) |
Republic of Ireland | Packaging manufacturer |
€1.27 Ord shares | 100 | ü | ü | ü | |||||||||
F-80
Table of Contents
MULTI PACKAGING SOLUTIONS GLOBAL HOLDINGS LIMITED
NOTES TO THE FINANCIAL STATEMENTS
FOR THE PERIOD 13 JUNE 2013 (DATE OF INCEPTION) TO 29 DECEMBER 2013 (SUCCESSOR), AND
FOR THE 39 WEEKS ENDED 30 SEPTEMBER 2013 AND THE 52 WEEKS ENDED 30 DECEMBER 2012 (PREDECESSOR)
9. Fixed asset investments (continued)
Subsidiary Undertakings (continued)
| Successor | Predecessor | |||||||||||||||
| Subsidiary Undertakings | Country of Incorporation |
Principal activity | Holding | % | 29 December 2013 |
30 September 2013 |
30 December 2012 | |||||||||
| Multi Packaging Solutions Westport Limited (formerly Chesapeake Pharmaceutical and Healthcare Packaging (Westport) Limited |
Republic of Ireland | Packaging manufacturer |
€1.27 Ord shares | 100 | ü | ü | ü | |||||||||
| Multi Packaging Solutions Gent NV (formerly Chesapeake Gent NV) |
Belgium | Packaging manufacturer |
No Par Value shares | 100 | ü | ü | ü | |||||||||
| Multi Packaging Solutions Bornem NV (formerly Chesapeake Bornem NV) |
Belgium | Packaging manufacturer |
No Par Value shares | 100 | ü | ü | ü | |||||||||
| Multi Packaging Solutions France SA (formerly Chesapeake France SA) |
France | Holding Company | €15.25 shares | 100 | ü | ü | ü | |||||||||
| Multi Packaging Solutions SAS (formerly Chesapeake Pharmaceutical and Healthcare Packaging SAS) |
France | Packaging manufacturer |
€0.60 shares | 100 | ü | ü | ü | |||||||||
| Multi Packaging Solutions Montargis SAS (formerly Pharmapost SAS) |
France | Packaging manufacturer |
€2,301.98 shares | 100 | ü | ü | ü | |||||||||
| Multi Packaging Solutions Oss BV (formerly Chesapeake Oss BV) |
The Netherlands | Packaging manufacturer |
€45.38 Standard shares |
100 | ü | ü | ü | |||||||||
| Multi Packaging Solutions Netherlands BV (formerly Chesapeake Packaging BV)* |
The Netherlands | Holding Company | €1.00 shares | 100 | ü | ü | ü | |||||||||
| Multi Packaging Solutions Holdings 1 GmbH (formerly Chesapeake German Holdings GmbH)* |
Germany | Holding Company | €1.00 shares | 100 | ü | × | × | |||||||||
| Multi Packaging Solutions Holdings 2 GmbH (formerly Chesapeake Services GmbH)* |
Germany | Holding Company | €1.00 shares | 100 | ü | ü | ü | |||||||||
| Multi Packaging Solutions Stuttgart GmbH (formerly Chesapeake Stuttgart GmbH) |
Germany | Packaging manufacturer |
€1.00 shares | 100 | ü | ü | ü | |||||||||
| Multi Packaging Solutions Duren GmbH (formerly Chesapeake Duren GmbH) |
Germany | Packaging manufacturer |
€0.51 shares | 100 | ü | ü | ü | |||||||||
| Multi Packaging Solutions Melle GmbH (formerly Chesapeake Melle GmbH) |
Germany | Packaging manufacturer |
€0.51 shares | 100 | ü | ü | ü | |||||||||
| Multi Packaging Solutions NI GmbH (formerly Chesapeake Neu-Isenburg GmbH) |
Germany | Packaging manufacturer |
€0.51 shares | 100 | ü | ü | ü | |||||||||
F-81
Table of Contents
MULTI PACKAGING SOLUTIONS GLOBAL HOLDINGS LIMITED
NOTES TO THE FINANCIAL STATEMENTS
FOR THE PERIOD 13 JUNE 2013 (DATE OF INCEPTION) TO 29 DECEMBER 2013 (SUCCESSOR), AND
FOR THE 39 WEEKS ENDED 30 SEPTEMBER 2013 AND THE 52 WEEKS ENDED 30 DECEMBER 2012 (PREDECESSOR)
9. Fixed asset investments (continued)
Subsidiary Undertakings (continued)
| Successor | Predecessor | |||||||||||||||
| Subsidiary Undertakings | Country of Incorporation |
Principal activity | Holding | % | 29 December 2013 |
30 September 2013 |
30 December 2012 | |||||||||
| Multi Packaging Solutions Bialystok Sp. z o.o (formerly Chesapeake Polska Sp. z o.o) |
Poland | Packaging manufacturer |
PLN 1 Ord A shares | 100 | ü | ü | ü | |||||||||
| Multi Packaging Solutions Hong Kong Limited (formerly Chesapeake Packaging Asia Limited)* |
Hong Kong | Holding Company | HK$ 1 shares | 100 | ü | ü | × | |||||||||
| Multi Packaging Solutions (Kunshan) Co Limited (formerly Chesapeake Pharmaceutical & Healthcare Packaging (Kunshan) Company Limited) |
PR China | Packaging manufacturer |
Registered Capital | 100 | ü | ü | ü | |||||||||
| MPS/CSK Holdings, Inc (formerly Chesapeake US Holdings Inc)* |
USA | Holding Company | Common Stock | 100 | ü | ü | ü | |||||||||
| MPS/CSK US, Inc (formerly Chesapeake US Inc) |
USA | Holding Company | Common Stock | 100 | ü | ü | ü | |||||||||
| MPS HRL, LLC (formerly Chesapeake Pharmaceutical Packaging Company LLC) |
USA | Packaging manufacturer |
Common Stock | 100 | ü | ü | ü | |||||||||
| MPS Evansville, Inc (formerly Chesapeake Pharmaceutical Packaging Indiana Inc |
USA | Packaging manufacturer |
Common Stock | 100 | ü | ü | ü | |||||||||
| MPS Fairfield, Inc (formerly Chesapeake Pharmaceutical Packaging New Jersey Inc) |
USA | Packaging manufacturer |
Common Stock | 100 | ü | ü | ü | |||||||||
| Chesapeake Plastics Limited |
United Kingdom | Packaging manufacturer |
£1.00 Ord shares | 100 | × | ü | ü | |||||||||
| Boxmore Plastics Limited |
Republic of Ireland | Packaging manufacturer |
€1.27 Ord shares | 100 | × | ü | ü | |||||||||
| Chesapeake Plastics SAS |
France | Packaging manufacturer |
€15.25 shares | 100 | × | ü | ü | |||||||||
| Chesapeake Plastics Packaging (Kunshan) Company Limited |
PR China | Packaging manufacturer |
Registered Capital | 100 | × | ü | ü | |||||||||
| Chesapeake Plastics Kft |
Hungary | Packaging manufacturer |
Outstanding Capital | 51 | × | ü | ü | |||||||||
| CACS Netherlands Holdings BV (formerly Chesapeake Holdings BV) |
Netherlands | Holding Company | €1 shares | 100 | × | ü | ü | |||||||||
F-82
Table of Contents
MULTI PACKAGING SOLUTIONS GLOBAL HOLDINGS LIMITED
NOTES TO THE FINANCIAL STATEMENTS
FOR THE PERIOD 13 JUNE 2013 (DATE OF INCEPTION) TO 29 DECEMBER 2013 (SUCCESSOR), AND
FOR THE 39 WEEKS ENDED 30 SEPTEMBER 2013 AND THE 52 WEEKS ENDED 30 DECEMBER 2012 (PREDECESSOR)
9. Fixed asset investments (continued)
Subsidiary Undertakings (continued)
| Successor | Predecessor | |||||||||||||||
| Subsidiary Undertakings | Country of Incorporation |
Principal activity | Holding | % | 29 December 2013 |
30 September 2013 |
30 December 2012 | |||||||||
| Specialty Chemical Packaging Limited |
United Kingdom | Holding Company | £1 shares | 100 | × | ü | ü | |||||||||
| Chesapeake Asia Packaging Limited |
Hong Kong | Holding Company | HK$1 shares | 100 | × | ü | ü | |||||||||
| Joint Venture |
||||||||||||||||
| Jiangsu Rotam Boxmore Plastic Packaging Company Limited |
PR China | Packaging manufacturer |
Registered Capital | 50 | × | ü | ü | |||||||||
| Rotam Boxmore (Tianjin) Packaging Company Limited |
PR China | Packaging manufacturer |
Registered Capital | 50 | × | ü | × | |||||||||
| Rotam Boxore Packaging Company Limited |
British Virgin Islands | Holding Company | Registered Capital | 50 | × | ü | ü | |||||||||
| * | Held directly by Multi Packaging Solutions Global Holdings Limited |
F-83
Table of Contents
MULTI PACKAGING SOLUTIONS GLOBAL HOLDINGS LIMITED
NOTES TO THE FINANCIAL STATEMENTS
FOR THE PERIOD 13 JUNE 2013 (DATE OF INCEPTION) TO 29 DECEMBER 2013 (SUCCESSOR), AND
FOR THE 39 WEEKS ENDED 30 SEPTEMBER 2013 AND THE 52 WEEKS ENDED 30 DECEMBER 2012 (PREDECESSOR)
9. Fixed asset investments (continued)
Joint ventures
| Successor | Predecessor | |||||||||
| December 29, 2013 |
December 30, 2012 |
|||||||||
| £’000 | £’000 | |||||||||
| Share of net assets |
||||||||||
| Opening balance |
— | 5,141 | ||||||||
| Share of retained profit for the period |
— | 466 | ||||||||
| Foreign exchange |
— | (112 | ) | |||||||
|
|
|
|
|
|||||||
| — | 5,495 | |||||||||
|
|
|
|
|
|||||||
The following information is given in respect of the Group’s share of its joint ventures:
| Successor | Predecessor | |||||||||||||
| 13 June 2013 to 29 December 2013 |
31 December 2012 to 30 September 2013 |
52 weeks ended 30 December 2012 |
||||||||||||
| £’000 | £’000 | £’000 | ||||||||||||
| Turnover |
— | 7,260 | 7,596 | |||||||||||
|
|
|
|
|
|
|
|||||||||
| Profit before tax |
— | 601 | 625 | |||||||||||
|
|
|
|
|
|
|
|||||||||
| Taxation |
— | (127 | ) | (159 | ) | |||||||||
|
|
|
|
|
|
|
|||||||||
| Profit after tax |
— | 474 | 466 | |||||||||||
|
|
|
|
|
|
|
|||||||||
| Fixed assets |
— | 2,860 | 2,861 | |||||||||||
|
|
|
|
|
|
|
|||||||||
| Current assets |
— | 4,035 | 3,390 | |||||||||||
|
|
|
|
|
|
|
|||||||||
| Liabilities due within one year |
— | (785 | ) | (756 | ) | |||||||||
|
|
|
|
|
|
|
|||||||||
| Liabilities due after one year |
— | — | — | |||||||||||
|
|
|
|
|
|
|
|||||||||
10. Acquisition of subsidiary undertaking
Successor
On 30 September 2013 the Company acquired 100% of the share capital of Chesapeake US Holdings Inc, Chesapeake German Holdings GMBH, Chesapeake Packaging BV, Chesapeake Packaging Asia Ltd and Chesapeake UK Holdings Ltd. Chesapeake German Holdings GMBH in turn acquired Chesapeake Packaging GMBH and Chesapeake US Holdings Inc in turn acquired Chesapeake US Inc. Together with their subsidiary undertakings these companies represented the paperboard operations of the Chesapeake group.
F-84
Table of Contents
MULTI PACKAGING SOLUTIONS GLOBAL HOLDINGS LIMITED
NOTES TO THE FINANCIAL STATEMENTS
FOR THE PERIOD 13 JUNE 2013 (DATE OF INCEPTION) TO 29 DECEMBER 2013 (SUCCESSOR), AND
FOR THE 39 WEEKS ENDED 30 SEPTEMBER 2013 AND THE 52 WEEKS ENDED 30 DECEMBER 2012 (PREDECESSOR)
10. Acquisition of subsidiary undertaking (continued)
Successor (continued)
The table on the following page sets out the aggregate book values of the identifiable assets and liabilities acquired and their fair value to the Group:
| Book value | Fair value adjustments |
Fair value to Group |
||||||||||
| £’000 | £’000 | £’000 | ||||||||||
| Fixed assets |
||||||||||||
| Intangible assets |
49 | — | 49 | |||||||||
| Tangible fixed assets |
170,060 | 11,438 | 181,498 | |||||||||
| Other investments |
131 | — | 131 | |||||||||
| Current assets |
||||||||||||
| Stocks |
50,117 | — | 50,117 | |||||||||
| Trade debtors |
79,732 | — | 79,732 | |||||||||
| Deferred tax asset |
2,746 | (786 | ) | 1,960 | ||||||||
| Other debtors |
4,715 | (299 | ) | 4,416 | ||||||||
| Cash |
24,352 | — | 24,352 | |||||||||
|
|
|
|
|
|
|
|||||||
| Total assets |
331,902 | 10,353 | 342,255 | |||||||||
|
|
|
|
|
|
|
|||||||
| Creditors less than one year |
||||||||||||
| Bank loans and overdrafts |
(279 | ) | — | (279 | )* | |||||||
| Obligations under finance leases and hire purchase contracts |
(511 | ) | — | (511 | ) | |||||||
| Trade creditors |
(67,100 | ) | — | (67,100 | ) | |||||||
| Corporation tax |
(3,097 | ) | — | (3,097 | ) | |||||||
| Other taxation and social security |
(9,704 | ) | — | (9,704 | ) | |||||||
| Other creditors |
(9,171 | ) | — | (9,171 | ) | |||||||
| Deferred government grants |
(765 | ) | 765 | — | ||||||||
| Accruals and deferred income |
(23,059 | ) | 1,599 | (21,460 | ) | |||||||
| Creditors greater than one year |
||||||||||||
| Bank loans and overdrafts |
(43,903 | ) | — | (43,903 | )* | |||||||
| Obligations under finance leases and hire purchase contracts |
(225 | ) | — | (225 | ) | |||||||
| Deferred government grant |
(5,743 | ) | 5,743 | — | ||||||||
| Other creditors |
(602 | ) | — | (602 | ) | |||||||
| Deferred tax liability |
(3,042 | ) | — | (3,042 | ) | |||||||
| Provisions |
||||||||||||
| Pension liability |
(36,073 | ) | (1,725 | ) | (37,798 | ) | ||||||
|
|
|
|
|
|
|
|||||||
| Total liabilities |
(203,274 | ) | 6,382 | (196,892 | ) | |||||||
|
|
|
|
|
|
|
|||||||
| Net assets |
128,628 | 16,735 | 145,363 | |||||||||
|
|
|
|
|
|
|
|||||||
F-85
Table of Contents
MULTI PACKAGING SOLUTIONS GLOBAL HOLDINGS LIMITED
NOTES TO THE FINANCIAL STATEMENTS
FOR THE PERIOD 13 JUNE 2013 (DATE OF INCEPTION) TO 29 DECEMBER 2013 (SUCCESSOR), AND
FOR THE 39 WEEKS ENDED 30 SEPTEMBER 2013 AND THE 52 WEEKS ENDED 30 DECEMBER 2012 (PREDECESSOR)
10. Acquisition of subsidiary undertaking (continued)
Successor (continued)
| Book value | Fair value adjustments |
Fair value to Group |
||||||||||
| £’000 | £’000 | £’000 | ||||||||||
| Net assets |
128,628 | 16,735 | 145,363 | |||||||||
|
|
|
|
|
|
|
|||||||
| Goodwill |
235,987 | |||||||||||
|
|
|
|||||||||||
| 381,350 | ||||||||||||
|
|
|
|||||||||||
| Satisfied by |
||||||||||||
| Cash consideration |
364,004 | |||||||||||
| Deal expenses |
17,346 | |||||||||||
|
|
|
|||||||||||
| 381,350 | ||||||||||||
|
|
|
|||||||||||
| * | Bank loans included in net assets on acquisition above includes £43,299,000 relating to asset based lending and term loans with Lloyds Bank PLC which were repaid concurrent to completion of the acquisition. |
The fair value adjustment to the acquired pension liability and deferred tax assets reflects changes in the rate used to calculate deferred tax from 23% and 24% to 20% as this change in tax rate was substantively enacted by the acquisition date.
The fair value of the acquired tangible and intangible fixed assets was established by obtaining third party valuations for all major assets. Of the fair value adjustment of £11,438,000, £12,763,000 relates to land, (£10,096,000) relates to freehold buildings and £8,771,000 relates to plant and machinery.
Prebates, deferred rent incentives and deferred government grants at the balance sheet date where considered to have a fair value of £nil at the acquisition date. The resulting fair value adjustments made were £299,000, £6,508,000 and £1,599,000 respectively.
Net cash outflows in respect of the acquisition comprised cash consideration of £364,004,000 and deal expenses of £17,346,000.
Of the £381,350,000 acquisition costs, £290,000,000 was funded by new external borrowings taken out by the company and its subsidiaries at completion. The remaining funding was obtained from equity investors, being affiliates of the Carlyle Group and management, who invested in the company via its parent, Chesapeake Finance 1 Limited.
The Chesapeake paperboard operations formed part of the larger Chesapeake Holdings S.à r.l. group during the 52 weeks ended 30 December 2012 and for the period from 31 December 2012 to 30 September 2013 no separate profit and loss was prepared for the paperboard operations during these periods. The turnover and profit after tax for the 52 weeks ended 30 December 2012 for the Chesapeake Holdings S.à r.l. group were £543,678,000 and £45,513,000 respectively. Of the turnover of £543,678,000, £485,085,000 of revenues relates to the paperboard operations acquired. The turnover and profit after tax for the period between 31 December 2012 and 30 September 2013 for the Chesapeake Holdings S.à r.l. group were £426,268,000 and £3,648,000 respectively. Of the turnover of £426,269,000, £379,161,000 relates to the paperboard operations acquired.
F-86
Table of Contents
MULTI PACKAGING SOLUTIONS GLOBAL HOLDINGS LIMITED
NOTES TO THE FINANCIAL STATEMENTS
FOR THE PERIOD 13 JUNE 2013 (DATE OF INCEPTION) TO 29 DECEMBER 2013 (SUCCESSOR), AND
FOR THE 39 WEEKS ENDED 30 SEPTEMBER 2013 AND THE 52 WEEKS ENDED 30 DECEMBER 2012 (PREDECESSOR)
10. Acquisition of subsidiary undertaking (continued)
Predecessor
On 30 April 2012 the predecessor acquired 100 per cent of the issued share capital of Multi Packaging Solutions Montargis SAS (formerly known as Pharmapost SAS), a company incorporated in France, for a total consideration of cash of £3,829,000.
The table on the following page sets out the book values of the identifiable assets and liabilities acquired and their fair value to the Group:
| Book value | Fair value adjustments |
Fair value to Group |
||||||||||
| £’000 | £’000 | £’000 | ||||||||||
| Fixed assets |
||||||||||||
| Tangible fixed assets |
1,443 | 494 | 1,937 | |||||||||
| Current assets |
||||||||||||
| Stocks |
248 | — | 248 | |||||||||
| Debtors |
1,265 | — | 1,265 | |||||||||
| Cash |
361 | — | 361 | |||||||||
|
|
|
|
|
|
|
|||||||
| Total assets |
3,317 | 494 | 3,811 | |||||||||
|
|
|
|
|
|
|
|||||||
| Creditors less than one year |
||||||||||||
| Trade creditors |
(417 | ) | — | (417 | ) | |||||||
| Accruals |
(463 | ) | — | (463 | ) | |||||||
| Obligations under finance leases and hire purchase contracts |
(102 | ) | — | (102 | ) | |||||||
| Creditors greater than one year |
||||||||||||
| Obligations under finance leases and hire purchase contracts |
(346 | ) | — | (346 | ) | |||||||
| Provisions |
||||||||||||
| Pension liability |
(128 | ) | — | (128 | ) | |||||||
|
|
|
|
|
|
|
|||||||
| Total liabilities |
(1,456 | ) | — | (1,456 | ) | |||||||
|
|
|
|
|
|
|
|||||||
| Net assets |
1,861 | 494 | 2,355 | |||||||||
|
|
|
|
|
|||||||||
| Goodwill |
1,632 | |||||||||||
|
|
|
|||||||||||
| 3,987 | ||||||||||||
|
|
|
|||||||||||
| Satisfied by |
||||||||||||
| Cash consideration |
3,829 | |||||||||||
| Deal expenses |
158 | |||||||||||
|
|
|
|
|
|
|
|||||||
| 3,987 | ||||||||||||
|
|
|
|
|
|
|
|||||||
There were no adjustments for accounting policy realignment or other adjustments.
Plant and equipment were revalued from their historical net book values in the books of the acquired companies to their fair value.
F-87
Table of Contents
MULTI PACKAGING SOLUTIONS GLOBAL HOLDINGS LIMITED
NOTES TO THE FINANCIAL STATEMENTS
FOR THE PERIOD 13 JUNE 2013 (DATE OF INCEPTION) TO 29 DECEMBER 2013 (SUCCESSOR), AND
FOR THE 39 WEEKS ENDED 30 SEPTEMBER 2013 AND THE 52 WEEKS ENDED 30 DECEMBER 2012 (PREDECESSOR)
10. Acquisition of subsidiary undertaking (continued)
Predecessor (continued)
Net cash outflows in respect of the acquisition comprised cash consideration of £3,829,000 and deal expenses of £158,000.
Pharmapost SAS earned a profit before taxation of £185,000 in 2012, of which a £148,000 loss arose in the period from 1 January 2012 to 30 April 2012. The summarised consolidated profit and loss account for the period from 1 January 2012 to 30 April 2012 is as follows:
| £’000 | ||||
| Turnover |
1,824 | |||
| Cost of sales |
(1,036 | ) | ||
|
|
|
|||
| Gross profit |
788 | |||
| Other operating expenses (net) |
(935 | ) | ||
|
|
|
|||
| Operating loss |
(147 | ) | ||
| Finance charges (net) |
(1 | ) | ||
|
|
|
|||
| Loss on ordinary activities before taxation |
(148 | ) | ||
|
|
|
|||
11. Stocks
| Successor | Predecessor | |||||||||
| 29 December 2013 |
30 December 2012 |
|||||||||
| £’000 | £’000 | |||||||||
| Raw materials and consumables |
15,314 | 15,391 | ||||||||
| Work in progress |
8,946 | 7,788 | ||||||||
| Finished goods and goods for resale |
25,444 | 29,370 | ||||||||
|
|
|
|
|
|||||||
| 49,704 | 52,549 | |||||||||
|
|
|
|
|
|||||||
There is no material difference between the balance sheet value of stocks and their replacement cost.
F-88
Table of Contents
MULTI PACKAGING SOLUTIONS GLOBAL HOLDINGS LIMITED
NOTES TO THE FINANCIAL STATEMENTS
FOR THE PERIOD 13 JUNE 2013 (DATE OF INCEPTION) TO 29 DECEMBER 2013 (SUCCESSOR), AND
FOR THE 39 WEEKS ENDED 30 SEPTEMBER 2013 AND THE 52 WEEKS ENDED 30 DECEMBER 2012 (PREDECESSOR)
12. Debtors
| Successor | Predecessor | |||||||||
| 29 December 2013 |
30 December 2012 |
|||||||||
| £’000 | £’000 | |||||||||
| Amounts falling due within one year: |
||||||||||
| Trade debtors |
70,458 | 77,399 | ||||||||
| Amounts owed by joint ventures |
— | 41 | ||||||||
| VAT and other sales taxes |
659 | 1,225 | ||||||||
| Other debtors |
2,876 | 3,328 | ||||||||
| Prepayments and accrued income |
7,367 | 6,397 | ||||||||
|
|
|
|
|
|||||||
| 81,360 | 88,390 | |||||||||
|
|
|
|
|
|||||||
| Amounts falling due after more than one year: |
||||||||||
| Other debtors |
326 | 257 | ||||||||
| Deferred tax assets (see note 15) |
4,141 | 2,763 | ||||||||
|
|
|
|
|
|||||||
| 4,467 | 3,020 | |||||||||
|
|
|
|
|
|||||||
| Total |
85,827 | 91,410 | ||||||||
|
|
|
|
|
|||||||
13. Creditors—amounts falling due within one year
| Successor | Predecessor | |||||||||
| 29 December 2013 |
30 December 2012 |
|||||||||
| £’000 | £’000 | |||||||||
| Bank loans and overdrafts |
1,432 | 9,918 | ||||||||
| Obligations under finance leases and hire purchase contracts |
354 | 785 | ||||||||
| Trade creditors |
63,769 | 63,955 | ||||||||
| Corporation tax |
1,165 | 960 | ||||||||
| Other taxation and social security |
10,095 | 9,360 | ||||||||
| Other creditors |
9,722 | 10,798 | ||||||||
| Deferred government grants |
— | 670 | ||||||||
| Accruals and deferred income |
27,115 | 28,699 | ||||||||
|
|
|
|
|
|||||||
| 113,652 | 125,145 | |||||||||
|
|
|
|
|
|||||||
Bank loans and overdrafts as at 29 December 2013 consists of loan repayments due within one year of £3,168,000 less deferred debt costs to be amortised within one year of £1,736,000 (30 December 2012: £10,337,000 of loan repayments less deferred debt costs of £419,000).
Pursuant to the credit agreement the company and certain subsidiaries entered into security arrangements such as cross-guarantees, debentures and share pledges in favour of Barclays Bank PLC acting as administrative agent and Letter of Credit issuer, in support of the acquisition funding bank debt and revolving credit facility.
F-89
Table of Contents
MULTI PACKAGING SOLUTIONS GLOBAL HOLDINGS LIMITED
NOTES TO THE FINANCIAL STATEMENTS
FOR THE PERIOD 13 JUNE 2013 (DATE OF INCEPTION) TO 29 DECEMBER 2013 (SUCCESSOR), AND
FOR THE 39 WEEKS ENDED 30 SEPTEMBER 2013 AND THE 52 WEEKS ENDED 30 DECEMBER 2012 (PREDECESSOR)
14. Creditors—amounts falling due after more than one year
| Successor | Predecessor | |||||||||
| 29 December 2013 |
30 December 2012 |
|||||||||
| £’000 | £’000 | |||||||||
| Bank Loans |
276,407 | 28,824 | ||||||||
| Series I Preferred Equity Certificates (PECS) |
— | 37,534 | ||||||||
| Class A Convertible Preferred Equity Certificates (CPECs) |
— | 6,182 | ||||||||
| Obligations under finance leases and hire purchase contracts |
195 | 554 | ||||||||
| Other creditors |
18 | 614 | ||||||||
| Deferred government grant |
592 | 5,086 | ||||||||
|
|
|
|
|
|||||||
| 277,212 | 78,794 | |||||||||
|
|
|
|
|
|||||||
Bank loans as at 29 December 2013 consist of loan repayments due of £286,387,000 less deferred debt costs of £9,980,000 (30 December 2012: £29,471,000 of loan repayments due less deferred debt costs of £647,000).
Pursuant to the credit agreement the Successor company and certain subsidiaries entered into security arrangements such as cross-guarantees, debentures and share pledges in favour of Barclays Bank PLC acting as administrative agent and L/C issuer, in support of the acquisition funding bank debt and revolving credit facility.
F-90
Table of Contents
MULTI PACKAGING SOLUTIONS GLOBAL HOLDINGS LIMITED
NOTES TO THE FINANCIAL STATEMENTS
FOR THE PERIOD 13 JUNE 2013 (DATE OF INCEPTION) TO 29 DECEMBER 2013 (SUCCESSOR), AND
FOR THE 39 WEEKS ENDED 30 SEPTEMBER 2013 AND THE 52 WEEKS ENDED 30 DECEMBER 2012 (PREDECESSOR)
14. Creditors—amounts falling due after more than one year (continued)
Borrowings are repayable as follows:
| Successor | Predecessor | |||||||||
| 29 December 2013 |
30 December 2012 |
|||||||||
| £’000 | £’000 | |||||||||
| The Group |
||||||||||
| Bank loans |
||||||||||
| On demand or within one year |
1,432 | 9,918 | ||||||||
| Between two and five years |
5,002 | 28,824 | ||||||||
| After five years |
271,405 | — | ||||||||
|
|
|
|
|
|||||||
| 277,839 | 38,742 | |||||||||
|
|
|
|
|
|||||||
| PECs and CPECs |
||||||||||
| After five years |
— | 43,716 | ||||||||
|
|
|
|
|
|||||||
| 43,716 | ||||||||||
|
|
|
|
|
|||||||
| Finance leases |
||||||||||
| On demand or within one year |
354 | 785 | ||||||||
| Between two and five years |
195 | 554 | ||||||||
|
|
|
|
|
|||||||
| 549 | 1,339 | |||||||||
|
|
|
|
|
|||||||
| Total borrowings including finance leases |
||||||||||
| On demand or within one year |
1,786 | 10,703 | ||||||||
| Between two and five years |
5,197 | 29,378 | ||||||||
| After five years |
271,405 | 43,716 | ||||||||
|
|
|
|
|
|||||||
| 278,388 | 83,797 | |||||||||
|
|
|
|
|
|||||||
Deferred debt costs included in total borrowings are as follows:
| Successor | Predecessor | |||||||||
| 29 December 2013 |
30 December 2012 |
|||||||||
| £’000 | £’000 | |||||||||
| Opening balance |
— | 1,567 | ||||||||
| Additions |
12,150 | — | ||||||||
| Charge in profit and loss account |
(434 | ) | (501 | ) | ||||||
|
|
|
|
|
|||||||
| Deferred debt costs carried forward |
11,716 | 1,066 | ||||||||
|
|
|
|
|
|||||||
| Within one year |
1,736 | 419 | ||||||||
| Between two and five years |
6,944 | 647 | ||||||||
| After five years |
3,036 | — | ||||||||
|
|
|
|
|
|||||||
| 11,716 | 1,066 | |||||||||
|
|
|
|
|
|||||||
F-91
Table of Contents
MULTI PACKAGING SOLUTIONS GLOBAL HOLDINGS LIMITED
NOTES TO THE FINANCIAL STATEMENTS
FOR THE PERIOD 13 JUNE 2013 (DATE OF INCEPTION) TO 29 DECEMBER 2013 (SUCCESSOR), AND
FOR THE 39 WEEKS ENDED 30 SEPTEMBER 2013 AND THE 52 WEEKS ENDED 30 DECEMBER 2012 (PREDECESSOR)
14. Creditors—amounts falling due after more than one year (continued)
Successor
The Group used a £290,000,000 multi currency term loan facility for the original acquisition of the Chesapeake paperboard operations. Of this £290,000,000, an amount of £145,000,000 was borrowed in GBP and the equivalent of £145,000,000 was borrowed in Euros. The Group also had access to a £50,000,000, multi currency revolving credit facility which was undrawn at closing and undrawn at the balance sheet date. Under the credit agreement, the company and its subsidiaries have entered into certain security arrangements as outlined in note 25.
The term loans are repayable at a rate of 0.25% per quarter and the loans mature in September 2020 subject to the provisions in the credit agreement.
The interest on the GBP denominated term loans amounts to 5% above LIBOR per annum, with a LIBOR floor of 1%.
The interest on the EURO denominated term loans amounts to 4.5% above EURIBOR per annum with a EURIBOR floor of 1%.
The revolving credit facility attracts interest at up to 4% per annum above EURIBOR or LIBOR depending on the underlying currency of the draw down. The revolving credit facility expires in September 2019.
Subject to the provisions of the credit agreement the company incurs certain customary fees and expenses. The initial issue costs paid at inception are deferred and expensed over the duration of the facility.
Predecessor
The Bank Loans were entered into on 5 October 2010 and were advanced by Lloyds TSB Commercial Finance Limited and Lloyds TSB Bank plc (together Lloyds TSB). The facility is for up to 5 years, totals up to £75,000,000 and bears interest at variable rates linked to Interbank Borrowing Rates for each currency. The facility comprises three elements; a £10,155,000 term loan supported by property in the UK (the Property Loan), a £10,497,500 term loan supported by plant and machinery in the UK (the Equipment Loan) and the balance a multi-currency revolving credit facility supported by accounts receivable in the UK, Republic of Ireland, Germany, Belgium and France (the Receivables Facility). Of the Property Loan, 50% is being amortised over 5 years, with the remainder payable at the end of 5 years. The Equipment Loan is being amortised over 4 years. Lloyds reviewed and revalued the assets secured against the Property and Equipment Loans in December 2012 resulting in additional funding being made available. The Property and Equipment Loans were subsequently increased to £9,674,000 and £14,839,000 respectively, repayable over the same term as the original agreement. The Receivables Facility expires at the end of 5 years. In addition to the assets pledged as support for the loans, Lloyds TSB have the benefit of pledges over the share capital of the Group’s major trading subsidiaries and cross guarantees from most significant trading subsidiaries.
F-92
Table of Contents
MULTI PACKAGING SOLUTIONS GLOBAL HOLDINGS LIMITED
NOTES TO THE FINANCIAL STATEMENTS
FOR THE PERIOD 13 JUNE 2013 (DATE OF INCEPTION) TO 29 DECEMBER 2013 (SUCCESSOR), AND
FOR THE 39 WEEKS ENDED 30 SEPTEMBER 2013 AND THE 52 WEEKS ENDED 30 DECEMBER 2012 (PREDECESSOR)
14. Creditors—amounts falling due after more than one year (continued)
Predecessor (continued)
The PECs carry an entitlement to a yield of 8% per annum, payable if declared by the Board of Managers on each annual anniversary of their issue. If payment is not declared then the yield accrues and can be paid at any time if declared by the Board of Managers. The PECs shall remain outstanding until 2058 but may be redeemed earlier, at the Company’s sole discretion. The PECs shall be redeemed at their par value together with any accrued but unpaid annual yield. In respect of any payment rights the PECs rank pari passu with the CPECs, ahead of the Ordinary Share capital of the Company but are subordinate to all other present and future obligations of the company whether secured or unsecured. The PECs carry no voting rights.
The CPECs do not carry any entitlement to a yield, and carry no voting rights. The CPECs must be redeemed in 2058 if they have not been converted or redeemed before then. The holders of the CPECs may request conversion of their CPECs into A Ordinary shares at any time, and the conversion rate shall be one A Ordinary share for every CPEC. In the event of a request, the Company may decide, at its sole discretion, not to agree to conversion but instead to redeem the shares, at a price based on the fair market value at the time of the A Ordinary shares. In respect of any payment rights the CPECs rank pari passu with the PECs, ahead of the Ordinary Share capital of the Company but are subordinate to all other present and future obligations of the company whether secured or unsecured.
Deferred debt costs included in total borrowings are as follows:
| Successor | Predecessor | |||||||
| 29 December 2013 |
30 December 2012 |
|||||||
| £’000 | £’000 | |||||||
| Opening balance |
— | 1,567 | ||||||
| Additions |
10,944 | — | ||||||
| Charge in profit and loss account |
(392 | ) | (501 | ) | ||||
|
|
|
|
|
|||||
| Deferred debt costs carried forward |
10,552 | 1,066 | ||||||
|
|
|
|
|
|||||
| Within one year |
1,563 | 419 | ||||||
| Between two and five years |
6,254 | 647 | ||||||
| After five years |
2,735 | — | ||||||
|
|
|
|
|
|||||
| 10,552 | 1,066 | |||||||
|
|
|
|
|
|||||
F-93
Table of Contents
MULTI PACKAGING SOLUTIONS GLOBAL HOLDINGS LIMITED
NOTES TO THE FINANCIAL STATEMENTS
FOR THE PERIOD 13 JUNE 2013 (DATE OF INCEPTION) TO 29 DECEMBER 2013 (SUCCESSOR), AND
FOR THE 39 WEEKS ENDED 30 SEPTEMBER 2013 AND THE 52 WEEKS ENDED 30 DECEMBER 2012 (PREDECESSOR)
15. Deferred taxation
| Successor | Predecessor | |||||||
| 29 December 2013 |
30 December 2012 |
|||||||
| £’000 | £’000 | |||||||
| Net deferred tax asset / (liability) |
||||||||
| Opening balance |
— | 3,499 | ||||||
| Balance on acquisition |
(1,082 | ) | — | |||||
| Credit/(charge) in profit and loss account |
5,082 | (865 | ) | |||||
| Exchange difference |
141 | 129 | ||||||
|
|
|
|
|
|||||
| Deferred tax asset carried forward (see note 13) |
4,141 | 2,763 | ||||||
|
|
|
|
|
|||||
Deferred tax is provided as follows:
| Accelerated capital allowances |
(2,601 | ) | (1,154 | ) | ||||
| Other timing differences |
(143 | ) | 214 | |||||
| Tax losses available |
6,885 | 3,703 | ||||||
|
|
|
|
|
|||||
| Provision for deferred tax |
4,141 | 2,763 | ||||||
|
|
|
|
|
Deferred tax in respect of the Group’s defined benefit pension scheme is disclosed in note 23.
The deferred tax asset has been recognised on the basis that the directors are of the opinion, based on recent forecast trading, that it can be regarded as more likely than not that there will be suitable taxable profits from which the future reversal can be deducted.
The Group has unrecognised tax losses carried forward which would otherwise produce a deferred tax asset of £5,765,000 (30 September 2013: £5,765,000, 30 December 2012: £7,163,000). These losses are expected to remain unutilised and therefore unrecognised for the foreseeable future.
16. Called-up share capital
| Successor | Predecessor | |||||||
| 29 December 2013 |
30 December 2012 |
|||||||
| £’000 | £’000 | |||||||
| Allotted, called-up and fully-paid |
||||||||
| 164,948,144 Ordinary shares of £1 each |
164,948 | — | ||||||
|
|
|
|
|
|||||
| 53,958 A Ordinary shares of €1 each |
— | 44 | ||||||
|
|
|
|
|
|||||
| 498,102 B Ordinary shares of €1 each |
— | 408 | ||||||
|
|
|
|
|
|||||
| 8,235 C Ordinary shares of €1 each |
— | 7 | ||||||
|
|
|
|
|
|||||
F-94
Table of Contents
MULTI PACKAGING SOLUTIONS GLOBAL HOLDINGS LIMITED
NOTES TO THE FINANCIAL STATEMENTS
FOR THE PERIOD 13 JUNE 2013 (DATE OF INCEPTION) TO 29 DECEMBER 2013 (SUCCESSOR), AND
FOR THE 39 WEEKS ENDED 30 SEPTEMBER 2013 AND THE 52 WEEKS ENDED 30 DECEMBER 2012 (PREDECESSOR)
16. Called-up share capital (continued)
Successor
On incorporation 1 Ordinary share of £1 was issued at par. On 30 September 2013, 164,948,143 Ordinary shares of £1 each were issued at par.
Predecessor
Subsequent to the period end, 164,948,144 Ordinary shares of £1 each were issued at par in relation to the merger with the Multi Packaging Solutions group (see note 29).
The Company has a call option over the C shares which may be exercised in the event that the holder ceases employment with the company. The exercise price of the option is dependent upon the nature of the holder’s cessation of employment with the Company and may be either the issue price or fair value. In the event of a sale of substantially all of the business, the holder of the C Shares is entitled to receive, in consideration for their shares, an amount equal to 100 times the distribution on each A share.
17. Reserves
| Successor | Predecessor | |||||||||||
| 29 December 2013 |
30 September 2013 |
30 December 2012 |
||||||||||
| £’000 | £’000 | £’000 | ||||||||||
| Profit and loss account |
||||||||||||
| Opening balance |
— | 80,549 | 54,467 | |||||||||
| (Loss)/profit for the financial period |
(8,656 | ) | 5,457 | 45,513 | ||||||||
| Credit to equity for equity settled share-based payments |
25 | — | — | |||||||||
| Currency translation difference on net foreign currency investments offset in reserves |
(686 | ) | 5,241 | (4,384 | ) | |||||||
| Net charge relating to pension scheme |
(5,394 | ) | (7,449 | ) | (14,985 | ) | ||||||
| Purchase of own shares |
— | — | (31 | ) | ||||||||
| Advanced payment for repurchase of C Shares |
— | (26,582 | ) | — | ||||||||
| Transfer |
— | — | (31 | ) | ||||||||
|
|
|
|
|
|
|
|||||||
| (14,711 | ) | 57,216 | 80,549 | |||||||||
|
|
|
|
|
|
|
|||||||
| Successor | Predecessor | |||||||||||
| 29 December 2013 |
30 September 2013 |
30 December 2012 |
||||||||||
| £’000 | £’000 | £’000 | ||||||||||
| Reserve for own shares |
||||||||||||
| Opening balance |
— | 31 | — | |||||||||
| Transfer |
— | — | 31 | |||||||||
|
|
|
|
|
|
|
|||||||
| — | 31 | 31 | ||||||||||
|
|
|
|
|
|
|
|||||||
F-95
Table of Contents
MULTI PACKAGING SOLUTIONS GLOBAL HOLDINGS LIMITED
NOTES TO THE FINANCIAL STATEMENTS
FOR THE PERIOD 13 JUNE 2013 (DATE OF INCEPTION) TO 29 DECEMBER 2013 (SUCCESSOR), AND
FOR THE 39 WEEKS ENDED 30 SEPTEMBER 2013 AND THE 52 WEEKS ENDED 30 DECEMBER 2012 (PREDECESSOR)
17. Reserves (continued)
Under the terms of the C Share Executive Security Holders Agreement, the Company is obligated to repurchase the C Shares in the event of a Company Sale. A liability of £26,582,000 has been recorded to reflect amounts which are payable to the C shareholders following the sale of the paperboard business. Further distributions will become payable to C Shareholders when the Company’s residual activities are successfully disposed of.
18. Reconciliation of movements in shareholders’ funds
| Successor | Predecessor | |||||||||||
| 29 December 2013 |
30 September 2013 |
30 December 2012 |
||||||||||
| £’000 | £’000 | £’000 | ||||||||||
| Opening funds |
— | 81,039 | 54,937 | |||||||||
| (Loss)/profit for the financial period |
(8,656 | ) | 5,457 | 45,513 | ||||||||
| Credit to equity for equity settled share-based payments |
25 | — | — | |||||||||
| Purchase of own shares |
— | — | (31 | ) | ||||||||
| Dividends declared |
— | (583 | ) | — | ||||||||
| Other recognised gains and losses relating to the period (net) |
(6,080 | ) | (1,625 | ) | (19,369 | ) | ||||||
|
|
|
|
|
|
|
|||||||
| (14,711 | ) | 84,288 | 81,050 | |||||||||
| Shares issued |
164,948 | — | — | |||||||||
| Foreign exchange |
— | 13 | (11 | ) | ||||||||
|
|
|
|
|
|
|
|||||||
| Closing shareholders’ funds |
150,237 | 84,301 | 81,039 | |||||||||
|
|
|
|
|
|
|
|||||||
19. Reconciliation of operating (loss)/profit to operating cash flows
| Successor | Predecessor | |||||||||||
| 13 June 2013 to 29 December 2013 |
31 December 2012 to 30 September 2013 |
52 weeks ended 30 December 2012 |
||||||||||
| £’000 | £’000 | £’000 | ||||||||||
| Operating (loss)/profit |
(2,745 | ) | 15,807 | 58,533 | ||||||||
| Depreciation and amortisation |
18,889 | 3,896 | 4,048 | |||||||||
| Impairment of fixed assets |
— | 725 | 620 | |||||||||
| Profit on sale of fixed assets |
(126 | ) | (352 | ) | (1,207 | ) | ||||||
| Decrease/(increase) in stocks |
413 | (3,338 | ) | 3,800 | ||||||||
| Decrease/(increase) in debtors |
5,928 | (5,171 | ) | (5,957 | ) | |||||||
| (Decrease)/increase in creditors |
(7,935 | ) | 28,454 | (2,832 | ) | |||||||
| Adjustment for pension funding |
(34,249 | ) | (2,685 | ) | (6,499 | ) | ||||||
| Government grant amortisation |
— | (452 | ) | (415 | ) | |||||||
| Foreign exchange |
(1,003 | ) | 5,746 | (4,128 | ) | |||||||
| Share based compensation |
25 | — | — | |||||||||
|
|
|
|
|
|
|
|||||||
| Net cash (outflow)/inflow from operating activities |
(20,803 | ) | 42,630 | 45,963 | ||||||||
|
|
|
|
|
|
|
|||||||
F-96
Table of Contents
MULTI PACKAGING SOLUTIONS GLOBAL HOLDINGS LIMITED
NOTES TO THE FINANCIAL STATEMENTS
FOR THE PERIOD 13 JUNE 2013 (DATE OF INCEPTION) TO 29 DECEMBER 2013 (SUCCESSOR), AND
FOR THE 39 WEEKS ENDED 30 SEPTEMBER 2013 AND THE 52 WEEKS ENDED 30 DECEMBER 2012 (PREDECESSOR)
20. Analysis of cash flows
| Successor | Predecessor | |||||||||||
| 13 June 2013 to 29 December 2013 |
31 December 2012 to 30 September 2013 |
52 weeks ended 30 December 2012 |
||||||||||
| £’000 | £’000 | £’000 | ||||||||||
| Returns on investments and servicing of finance |
||||||||||||
| Interest received |
21 | 76 | 75 | |||||||||
| Interest paid |
(3,313 | ) | (6,156 | ) | (2,227 | ) | ||||||
| Interest element of finance lease rentals |
(6 | ) | (33 | ) | (166 | ) | ||||||
|
|
|
|
|
|
|
|||||||
| Net cash outflow |
(3,298 | ) | (6,113 | ) | (2,318 | ) | ||||||
|
|
|
|
|
|
|
|||||||
| Taxation |
||||||||||||
| Tax paid |
(1,350 | ) | (2,179 | ) | (2,420 | ) | ||||||
|
|
|
|
|
|
|
|||||||
| Net cash outflow |
(1,350 | ) | (2,179 | ) | (2,420 | ) | ||||||
|
|
|
|
|
|
|
|||||||
| Capital expenditure and financial investment |
||||||||||||
| Purchase of tangible fixed assets |
(3,829 | ) | (23,578 | ) | (27,935 | ) | ||||||
| Sale of tangible fixed assets |
467 | 511 | 2,915 | |||||||||
| Government grants |
602 | 1,875 | 2,266 | |||||||||
|
|
|
|
|
|
|
|||||||
| Net cash outflow |
(2,760 | ) | (21,192 | ) | (22,754 | ) | ||||||
|
|
|
|
|
|
|
|||||||
| Acquisitions and disposals |
||||||||||||
| Purchase of subsidiary undertaking, net of cash acquired |
(354,340 | ) | — | (3,625 | ) | |||||||
| Investment in joint venture |
— | (527 | ) | — | ||||||||
|
|
|
|
|
|
|
|||||||
| Net cash outflow |
(354,340 | ) | (527 | ) | (3,625 | ) | ||||||
|
|
|
|
|
|
|
|||||||
| Financing |
||||||||||||
| Issue of ordinary share capital |
164,948 | — | — | |||||||||
| Purchase of own ordinary share capital |
— | (581 | ) | (31 | ) | |||||||
| Bank loans drawn |
277,850 | 9,481 | 2,100 | |||||||||
| Repayment of bank loans |
(43,384 | ) | (15,566 | ) | — | |||||||
| Capital element of finance lease rental payments |
(188 | ) | (613 | ) | (2,509 | ) | ||||||
|
|
|
|
|
|
|
|||||||
| Net cash inflow/(outflow) |
399,226 | (7,279 | ) | (440 | ) | |||||||
|
|
|
|
|
|
|
|||||||
The £277,850,000 (30 September 2013: £9,481.000; 2012: £2,100,000) bank loans drawn represents a drawdown of funds of £290,000,000 (30 September 2013: £9,481,000; 2012: £2,100,000) less £12,150,000 (30 September 2013: £nil; 2012: £nil) in deferred debt costs.
Subsidiary undertakings acquired in the period contributed the following to the Group’s net cash flows: £21,912,000 (52 weeks ended 30 December 2012: £142,000 cash inflow) cash outflow to net operating cash flows, £971,000 (52 weeks ended 30 December 2012: £1,000 cash outflow) cash inflow to net returns on
F-97
Table of Contents
MULTI PACKAGING SOLUTIONS GLOBAL HOLDINGS LIMITED
NOTES TO THE FINANCIAL STATEMENTS
FOR THE PERIOD 13 JUNE 2013 (DATE OF INCEPTION) TO 29 DECEMBER 2013 (SUCCESSOR), AND
FOR THE 39 WEEKS ENDED 30 SEPTEMBER 2013 AND THE 52 WEEKS ENDED 30 DECEMBER 2012 (PREDECESSOR)
20. Analysis of cash flows (continued)
investment and servicing of finance, £1,350,000 (52 weeks ended 30 December 2012: £nil) cash flows to taxation payments, £2,760,000 (52 weeks ended 30 December 2012: £32,000) cash outflows to capital expenditure and £15,985,000 (52 weeks ended 30 December 2012: £56,000) cash outflows to financing.
21. Analysis and reconciliation of net debt
| Cash flow | Other non-cash changes |
Exchange movement |
29 December 2013 |
|||||||||||||
| £’000 | £’000 | £’000 | £’000 | |||||||||||||
| Cash in hand, at bank |
16,675 | — | (122 | ) | 16,553 | |||||||||||
|
|
|
|||||||||||||||
| 16,675 | ||||||||||||||||
|
|
|
|||||||||||||||
| Debt due after 1 year |
(233,751 | ) | (43,903 | ) | 1,247 | (276,407 | ) | |||||||||
| Debt due within 1 year |
(715 | ) | (713 | ) | (4 | ) | (1,432 | ) | ||||||||
| Finance leases |
188 | (736 | ) | (1 | ) | (549 | ) | |||||||||
|
|
|
|||||||||||||||
| (234,278 | ) | |||||||||||||||
|
|
|
|
|
|
|
|
|
|||||||||
| Net debt |
(217,603 | ) | (45,352 | ) | 1,120 | (261,835 | ) | |||||||||
|
|
|
|
|
|
|
|
|
|||||||||
| Successor | Predecessor | |||||||||||
| 13 June 2013 to 29 December 2013 |
31 December 2012 to 30 September 2013 |
52 weeks ended 30 December 2012 |
||||||||||
| £’000 | £’000 | £’000 | ||||||||||
| Increase in cash in the period |
16,675 | 5,340 | 14,406 | |||||||||
| Cash (inflow)/outflow from debt and lease financing |
(234,278 | ) | 6,698 | 409 | ||||||||
|
|
|
|
|
|
|
|||||||
| Change in net debt resulting from cash flows |
(217,603 | ) | 12,038 | 14,815 | ||||||||
| Loans and finance leases acquired with subsidiary |
(44,918 | ) | — | (448 | ) | |||||||
| Amortisation of debt costs |
(434 | ) | (1,066 | ) | (501 | ) | ||||||
| Translation difference |
1,120 | (1,678 | ) | 866 | ||||||||
|
|
|
|
|
|
|
|||||||
| Movement in net debt in period |
(261,835 | ) | 9,294 | 14,732 | ||||||||
| Net debt—Opening balance |
— | (60,284 | ) | (75,016 | ) | |||||||
|
|
|
|
|
|
|
|||||||
| (261,835 | ) | (50,990 | ) | (60,284 | ) | |||||||
|
|
|
|
|
|
|
|||||||
F-98
Table of Contents
MULTI PACKAGING SOLUTIONS GLOBAL HOLDINGS LIMITED
NOTES TO THE FINANCIAL STATEMENTS
FOR THE PERIOD 13 JUNE 2013 (DATE OF INCEPTION) TO 29 DECEMBER 2013 (SUCCESSOR), AND
FOR THE 39 WEEKS ENDED 30 SEPTEMBER 2013 AND THE 52 WEEKS ENDED 30 DECEMBER 2012 (PREDECESSOR)
22. Financial commitments
Capital commitments
Capital commitments are as follows:
| Successor | Predecessor | |||||||||||
| 29 December 2013 |
30 September 2013 |
30 December 2012 |
||||||||||
| £’000 | £’000 | £’000 | ||||||||||
| The Group |
||||||||||||
| Contracted for but not provided for |
5,555 | 14,291 | 11,368 | |||||||||
|
|
|
|
|
|
|
|||||||
| 5,555 | 14,291 | 11,368 | ||||||||||
|
|
|
|
|
|
|
|||||||
Operating lease commitments
Annual commitments of the group under non-cancellable operating leases are as follows:
Predecessor
| 30 September 2013 | 30 December 2012 | |||||||||||||||
| Land and buildings |
Other | Land and buildings |
Other | |||||||||||||
| £’000 | £’000 | £’000 | £’000 | |||||||||||||
| Expiry date |
||||||||||||||||
| - Within one year |
64 | 91 | 353 | 205 | ||||||||||||
| - Between two and five years |
2,275 | 673 | 1,616 | 866 | ||||||||||||
| - After five years |
1,594 | 150 | 2,364 | 88 | ||||||||||||
|
|
|
|
|
|
|
|
|
|||||||||
| 3,933 | 914 | 4,333 | 1,159 | |||||||||||||
|
|
|
|
|
|
|
|
|
|||||||||
Leases of land and buildings are typically subject to rent reviews at specified intervals and provide for the lessee to pay all insurance, maintenance and repair costs.
Successor
| 29 December 2013 | ||||||||
| Land and buildings |
Other | |||||||
| £’000 | £’000 | |||||||
| Expiry date |
||||||||
| - Within one year |
950 | 237 | ||||||
| - Between two and five years |
1,718 | 957 | ||||||
| - After five years |
1,586 | 413 | ||||||
|
|
|
|
|
|||||
| 4,254 | 1,607 | |||||||
|
|
|
|
|
|||||
F-99
Table of Contents
MULTI PACKAGING SOLUTIONS GLOBAL HOLDINGS LIMITED
NOTES TO THE FINANCIAL STATEMENTS
FOR THE PERIOD 13 JUNE 2013 (DATE OF INCEPTION) TO 29 DECEMBER 2013 (SUCCESSOR), AND
FOR THE 39 WEEKS ENDED 30 SEPTEMBER 2013 AND THE 52 WEEKS ENDED 30 DECEMBER 2012 (PREDECESSOR)
23. Retirement benefit schemes
Background
At 29 December 2013, the Group operated a number of defined benefit and defined contribution pension schemes for the benefit of its employees throughout the world, which vary depending on the conditions and practices in the countries concerned. The expense for defined contribution schemes is the amount of employer contributions paid into each scheme over the reporting period.
The principal defined benefit pension scheme of the Group is the Field Group Pension Plan in the United Kingdom. The assets of the scheme are held in an external trustee-administered fund. The Group also operates two further defined benefit plans in the UK, as well as a number of defined benefit arrangements in France, Germany and Ireland, which are included in these disclosures in accordance with FRS17. The schemes in the UK and Ireland are funded. The schemes in France and Germany are both funded and unfunded.
Valuations of the schemes are carried out at least every three years. The most recent actuarial valuation of the Field Group Pension Plan was prepared as at 13 June 2011. The present value of the defined benefit obligation, the related current service cost and past service cost was measured using the projected unit credit method.
During the period, it was decided to close the Irish defined benefit schemes. This closure was completed in January 2014. The amount paid out on closure of the scheme was inline with the provision recorded in the balance sheet as at 29 December 2013.
During the periods, the group made additional contributions to the defined benefit schemes of £6,067,000 and £26,300,000 (30 September 2013 : £nil and £nil; 2012: £nil and £nil) to cover the Section 75 cost related to the carve out of the plastics operations of the Chesapeake group (which remained under previous ownership) and to reduce the pension deficit respectively.
Defined contribution
| Successor | Predecessor | |||||||||||
| 29 December 2013 |
30 September 2013 |
30 December 2012 |
||||||||||
| £’000 | £’000 | £’000 | ||||||||||
| Contributions payable by the Group in the period |
566 | 1,835 | 2,344 | |||||||||
| Contributions payable to the fund at the period end and included in creditors |
244 | 141 | 98 | |||||||||
|
|
|
|
|
|
|
|||||||
F-100
Table of Contents
MULTI PACKAGING SOLUTIONS GLOBAL HOLDINGS LIMITED
NOTES TO THE FINANCIAL STATEMENTS
FOR THE PERIOD 13 JUNE 2013 (DATE OF INCEPTION) TO 29 DECEMBER 2013 (SUCCESSOR), AND
FOR THE 39 WEEKS ENDED 30 SEPTEMBER 2013 AND THE 52 WEEKS ENDED 30 DECEMBER 2012 (PREDECESSOR)
23. Retirement benefit schemes (continued)
Defined benefit schemes
The principal actuarial assumptions used for estimating the Group’s defined benefit obligations are set out below:
| Successor | Predecessor | |||||||||||
| 29 December 2013 |
30 September 2013 |
30 December 2012 |
||||||||||
| Weighted average actuarial assumptions used: |
||||||||||||
| Discount rate |
4.47 | % | 4.37 | % | 4.37 | % | ||||||
| Rate of compensation increase |
2.93 | % | 2.68 | % | 2.67 | % | ||||||
| Rate of price inflation |
3.06 | % | 2.87 | % | 2.65 | % | ||||||
| Rate of pension increases |
2.74 | % | 2.47 | % | 2.44 | % | ||||||
|
|
|
|
|
|
|
|||||||
Mortality assumptions:
Mortality assumptions used are consistent with those recommended by the individual scheme actuaries and are based on published mortality tables, adjusted to reflect the characteristics of the scheme membership where appropriate. The largest scheme in the Group is the Field Group Pension Plan in the UK and the tables used for this scheme indicate assumed life expectancies on retirement at age 65 are:
| Successor | Predecessor | |||||||||||
| 29 December 2013 |
30 September 2013 |
30 December 2012 |
||||||||||
| Years | Years | Years | ||||||||||
| Member age 65 years (current life expectancy): |
||||||||||||
| Males |
22.1 | 22.1 | 21.7 | |||||||||
| Females |
24.5 | 24.5 | 24.4 | |||||||||
| Member age 40 years (life expectancy at age 65): |
||||||||||||
| Males |
24.3 | 24.3 | 24.1 | |||||||||
| Females |
26.9 | 26.9 | 26.7 | |||||||||
|
|
|
|
|
|
|
|||||||
Amounts recognised in the profit and loss account in respect of the defined benefit schemes are as follows:
| Successor | Predecessor | |||||||||||||
| 29 December 2013 |
30 September 2013 |
30 December 2012 |
||||||||||||
| £’000 | £’000 | £’000 | ||||||||||||
| Current service cost |
414 | 2,064 | 2,182 | |||||||||||
| Interest cost |
3,521 | 10,533 | 13,823 | |||||||||||
| Expected return on scheme assets |
(3,812 | ) | (10,241 | ) | (11,866 | ) | ||||||||
| Past service costs |
32 | 2 | (80 | ) | ||||||||||
| Plan curtailment |
(65 | ) | — | (487 | ) | |||||||||
|
|
|
|
|
|
|
|||||||||
| 90 | 2,358 | 3,572 | ||||||||||||
|
|
|
|
|
|
|
|||||||||
F-101
Table of Contents
MULTI PACKAGING SOLUTIONS GLOBAL HOLDINGS LIMITED
NOTES TO THE FINANCIAL STATEMENTS
FOR THE PERIOD 13 JUNE 2013 (DATE OF INCEPTION) TO 29 DECEMBER 2013 (SUCCESSOR), AND
FOR THE 39 WEEKS ENDED 30 SEPTEMBER 2013 AND THE 52 WEEKS ENDED 30 DECEMBER 2012 (PREDECESSOR)
23. Retirement benefit schemes (continued)
Mortality assumptions (continued):
Of the current and past service cost for the period, £235,000 (30 September 2013: £773,000; 2012: £854,000) has been included in cost of sales and £179,000 (30 September 2013: £1,293,000; 2012: £1,248,000) has been included in administrative expenses. Interest cost less expected return on scheme assets of £291,000 (30 September 2013: £292,000; 2012: £1,957,000) net has been included as components of Finance Charges. Plan curtailment costs of £65,000 (30 September 2013: £nil; 2012: £487,000) have been included as a component of administrative expenses. Actuarial gains and losses have been reported in the statement of total recognised gains and losses.
The actual return on scheme assets was £2,108,000 (30 September 2013: £10,764; December 2012: £19,872,000).
The actuarial gains and losses recognised in the statement of total recognised gains and losses includes a charge of £766,000 (30 September 2013 credit of: £911,000; December 2012 credit of: £559,000) relating to the asset ceiling applied to cap the pension asset being offset against the pension liability.
The cumulative amount of actuarial gains and losses recognised in the statement of total recognised gains and losses since the adoption of FRS 17 is losses of £6,551,000 (excluding deferred tax) (30 September 2013: £7,455,000; December 2012: £17,851,000).
The amount included in the balance sheet arising from the Group’s obligations in respect of its defined benefit retirement benefit schemes is as follows:
| Successor | Predecessor | |||||||||||||
| 29 December 2013 |
30 September 2013 |
30 December 2012 |
||||||||||||
| £’000 | £’000 | £’000 | ||||||||||||
| Present value of wholly or partly funded obligations |
(330,792 | ) | (338,457 | ) | (323,194 | ) | ||||||||
| Fair value of scheme assets |
312,915 | 290,510 | 281,258 | |||||||||||
|
|
|
|
|
|
|
|||||||||
| Deficit in scheme |
(17,877 | ) | (47,947 | ) | (41,936 | ) | ||||||||
| Present value of wholly unfunded obligations |
(761 | ) | (1,520 | ) | (1,389 | ) | ||||||||
| Effect of asset limit |
(766 | ) | 33 | (911 | ) | |||||||||
| Deferred tax |
4,042 | 9,972 | 10,567 | |||||||||||
|
|
|
|
|
|
|
|||||||||
| Liability recognised in the balance sheet |
(15,362 | ) | (39,462 | ) | (33,669 | ) | ||||||||
|
|
|
|
|
|
|
|||||||||
F-102
Table of Contents
MULTI PACKAGING SOLUTIONS GLOBAL HOLDINGS LIMITED
NOTES TO THE FINANCIAL STATEMENTS
FOR THE PERIOD 13 JUNE 2013 (DATE OF INCEPTION) TO 29 DECEMBER 2013 (SUCCESSOR), AND
FOR THE 39 WEEKS ENDED 30 SEPTEMBER 2013 AND THE 52 WEEKS ENDED 30 DECEMBER 2012 (PREDECESSOR)
23. Retirement benefit schemes (continued)
Mortality assumptions (continued):
Movements in the present value of defined benefit obligations were as follows:
| Successor | Predecessor | |||||||||||||
| 29 December 2013 |
30 September 2013 |
30 December 2012 |
||||||||||||
| £’000 | £’000 | £’000 | ||||||||||||
| Benefit obligation at the beginning of the period |
— | 324,583 | 290,994 | |||||||||||
| Upon acquisition |
326,116 | — | — | |||||||||||
| Current service cost |
414 | 2,064 | 2,182 | |||||||||||
| Interest cost |
3,521 | 10,533 | 13,823 | |||||||||||
| Contributions from scheme members |
258 | 797 | 1,253 | |||||||||||
| Actuarial losses |
4,083 | 8,889 | 27,128 | |||||||||||
| Exchange difference |
(22 | ) | 211 | (382 | ) | |||||||||
| Benefits paid from scheme/company |
(2,538 | ) | (7,308 | ) | (10,153 | ) | ||||||||
| Plan amendment |
(1 | ) | 35 | (80 | ) | |||||||||
| Plan curtailment |
(65 | ) | — | (487 | ) | |||||||||
| Business combination |
(179 | ) | 179 | 316 | ||||||||||
| Others |
(34 | ) | (6 | ) | (11 | ) | ||||||||
|
|
|
|
|
|
|
|||||||||
| Benefit obligation at end of the period |
331,553 | 339,977 | 324,583 | |||||||||||
| Present value of wholly unfunded obligations |
(761 | ) | (1,520 | ) | (1,389 | ) | ||||||||
|
|
|
|
|
|
|
|||||||||
| Present value of wholly or partly funded obligations |
330,792 | 338,457 | 323,194 | |||||||||||
|
|
|
|
|
|
|
|||||||||
F-103
Table of Contents
MULTI PACKAGING SOLUTIONS GLOBAL HOLDINGS LIMITED
NOTES TO THE FINANCIAL STATEMENTS
FOR THE PERIOD 13 JUNE 2013 (DATE OF INCEPTION) TO 29 DECEMBER 2013 (SUCCESSOR), AND
FOR THE 39 WEEKS ENDED 30 SEPTEMBER 2013 AND THE 52 WEEKS ENDED 30 DECEMBER 2012 (PREDECESSOR)
23. Retirement benefit schemes (continued)
Mortality assumptions (continued):
Movements in the fair value of scheme assets were as follows:
| Successor | Predecessor | |||||||||||||
| 29 December 2013 |
30 September 2013 |
30 December 2012 |
||||||||||||
| £’000 | £’000 | £’000 | ||||||||||||
| Fair value of scheme assets at the beginning of the period |
— | 281,258 | 259,117 | |||||||||||
| Upon acquisition |
278,632 | — | — | |||||||||||
| Expected return on scheme assets |
3,812 | 10,241 | 11,866 | |||||||||||
| Actuarial gains (losses) on scheme assets |
(1,702 | ) | 523 | 8,718 | ||||||||||
| Exchange difference |
— | 75 | (256 | ) | ||||||||||
| One-off contributions from the sponsoring companies |
32,367 | — | — | |||||||||||
| Normal contributions from the sponsoring companies |
2,085 | 4,930 | 8,114 | |||||||||||
| Contributions from scheme members |
258 | 797 | 1,253 | |||||||||||
| Benefits paid |
(2,538 | ) | (7,308 | ) | (10,153 | ) | ||||||||
| Premiums paid |
(13 | ) | (6 | ) | (11 | ) | ||||||||
| Expenses paid |
(21 | ) | — | — | ||||||||||
| Business combination |
— | — | 187 | |||||||||||
| Transfer |
— | — | 2,423 | |||||||||||
| Adjustments |
35 | — | — | |||||||||||
|
|
|
|
|
|
|
|||||||||
| Fair value of scheme assets at end of the period |
312,915 | 290,510 | 281,258 | |||||||||||
|
|
|
|
|
|
|
|||||||||
The analysis of the scheme assets and the expected rate of return at the balance sheet date were as follows:
| Successor | Predecessor | |||||||||||||||||||||||||
| 29 December 2013 | 30 September 2013 | 30 December 2012 | ||||||||||||||||||||||||
| Expected return % |
Fair value of assets % |
Expected return % |
Fair value of assets % |
Expected return % |
Fair value of assets % |
|||||||||||||||||||||
| Equity Securities |
7.10 | 44.22 | 6.58 | 53.76 | 6.53 | 54.60 | ||||||||||||||||||||
| Bond Securities |
3.95 | 54.11 | 3.67 | 45.43 | 3.38 | 44.58 | ||||||||||||||||||||
| Real Estate |
5.39 | 0.12 | 5.27 | 0.22 | 0.35 | 0.20 | ||||||||||||||||||||
| Other assets |
0.37 | 1.55 | 2.21 | 0.59 | 0.14 | 0.62 | ||||||||||||||||||||
|
|
|
|
|
|
|
|
|
|
|
|
|
|||||||||||||||
| 5.29 | 100.00 | 5.23 | 100.00 | 5.12 | 100.00 | |||||||||||||||||||||
|
|
|
|
|
|
|
|
|
|
|
|
|
|||||||||||||||
The schemes have no direct investments in the Group’s equity securities or in property currently used by the Group.
The expected return on assets assumptions are derived by considering market expectations of the long term rates of return on the scheme investments. The overall expected return assumption is a weighted average of the
F-104
Table of Contents
MULTI PACKAGING SOLUTIONS GLOBAL HOLDINGS LIMITED
NOTES TO THE FINANCIAL STATEMENTS
FOR THE PERIOD 13 JUNE 2013 (DATE OF INCEPTION) TO 29 DECEMBER 2013 (SUCCESSOR), AND
FOR THE 39 WEEKS ENDED 30 SEPTEMBER 2013 AND THE 52 WEEKS ENDED 30 DECEMBER 2012 (PREDECESSOR)
23. Retirement benefit schemes (continued)
Mortality assumptions (continued):
expected returns on each asset class in which the schemes invest, reflecting the scheme asset allocations. The long term rates of return on equities and real estate are derived by considering current risk free rates of return with the addition of an appropriate future risk premium. The long term rate of return from gilt yields, bonds and cash investments are set in line with market yields at the balance sheet date. The return assumption is a net rate after expenses.
The history of experience gains and losses is set out below:
| Successor | Predecessor | |||||||||||||||||||||||||
| 29 December 2013 |
30 September 2013 |
30 December 2012 |
1 January 2012 |
2 January 2011 |
3 January 2010 |
|||||||||||||||||||||
| £’000 | £’000 | £’000 | £’000 | £’000 | £’000 | |||||||||||||||||||||
| Defined benefit obligations |
(331,553 | ) | (339,977 | ) | (324,583 | ) | (290,994 | ) | (268,354 | ) | (255,673 | ) | ||||||||||||||
| Fair value of plan assets |
312,915 | 290,510 | 281,258 | 259,117 | 247,800 | 216,957 | ||||||||||||||||||||
|
|
|
|
|
|
|
|
|
|
|
|
|
|||||||||||||||
| Deficit |
(18,638 | ) | (49,467 | ) | (43,325 | ) | (31,877 | ) | (20,554 | ) | (38,716 | ) | ||||||||||||||
| Difference between expected and actual return on plan assets: |
||||||||||||||||||||||||||
| Amount |
1,704 | (523 | ) | (8,006 | ) | 166 | (15,007 | ) | (29,259 | ) | ||||||||||||||||
| Percentage of plan assets |
0.5 | % | 0.2 | % | 2.0 | % | 0 | % | (6.0 | )% | (13.0 | )% | ||||||||||||||
| Experience gains on plan liabilities: |
||||||||||||||||||||||||||
| Amount |
808 | (716 | ) | 1,820 | 76 | 647 | 2,267 | |||||||||||||||||||
| Percentage of present value of plan liabilities |
0.2 | % | 0.2 | % | 1.0 | % | 0 | % | 0 | % | 1.0 | % | ||||||||||||||
The group expects to pay £9,445,000 in contributions to defined benefit pension plans in the next 12 months. This consists of £6,296,000 in recovery plan payments and £3,149,000 in ongoing contributions.
F-105
Table of Contents
MULTI PACKAGING SOLUTIONS GLOBAL HOLDINGS LIMITED
NOTES TO THE FINANCIAL STATEMENTS
FOR THE PERIOD 13 JUNE 2013 (DATE OF INCEPTION) TO 29 DECEMBER 2013 (SUCCESSOR), AND
FOR THE 39 WEEKS ENDED 30 SEPTEMBER 2013 AND THE 52 WEEKS ENDED 30 DECEMBER 2012 (PREDECESSOR)
24. Derivatives
The fair value of derivatives which are not recorded in the financial statements is as follows:
| Principal | Fair Value | |||||
| £’000 | ||||||
| 29 December 2013 (successor) |
||||||
| Interest rate swap 1 |
See below | 1,565 | ||||
| Interest rate swap 2 |
See below | (905 | ) | |||
| Foreign currency option contracts |
Sell EUR/Buy GBP €16,650,000 | (123 | ) | |||
| Foreign currency option contracts |
Sell EUR/Buy PLN €4,930,000 | 14 | ||||
| Foreign currency forward contracts |
Buy EUR/Sell USD €3,575,815 | 138 | ||||
| Foreign currency forward contracts |
Buy EUR/Sell GBP €8,000,000 | (6 | ) | |||
| 30 December 2012 (predecessor) |
||||||
| Foreign currency forward contracts |
Sell USD 1,100,000 | (1 | ) | |||
| Foreign currency forward contracts |
Buy USD 1,010,000 | 6 | ||||
| Foreign currency forward contracts |
Sell PLN 1,200,000 | (2 | ) | |||
| Foreign currency forward contracts |
Buy PLN 1,700,000 | 1 | ||||
| Foreign currency option contracts |
Buy EUR 3,600,000 | 87 | ||||
| Foreign currency option contracts |
Buy GBP 17,904,000 | 316 | ||||
| Foreign currency option contracts |
Sell GBP 20,784,000 | (372 | ) | |||
| Foreign currency spot contracts |
Sell EUR 300,000 | (1 | ) | |||
At 29 December 2013 the Group had two interest rate swaps in place. Interest rate swap 1 is an amortising swap, with a notional amount at 29 December 2013 of £116,000,000, whereby the Group pays a fixed rate of interest of 1.1649% and receives a variable rate based on LIBOR on the amortising notional amount. The swap is being used to hedge the exposure to changes in market LIBOR rates. The secured loan and interest rate swap have the same critical terms.
Interest rate swap 2 is an amortising swap, with a notional amount at 29 December 2013 of €133,724,800, whereby the Group pays a fixed rate of interest of 1.0139% and receives a variable rate based on EURIBOR on the amortising notional amount. The swap is being used to hedge the exposure to changes in market EURIBOR rates. The secured loan and interest rate swap have the same critical terms.
The Group uses the derivatives to hedge its exposures to changes in foreign currency exchange rates and to manage its exposure to interest rate movements on its bank borrowings. The fair values are based on market values of equivalent instruments at the balance sheet date.
25. Contingent liabilities
Pursuant to the credit agreement the company and certain subsidiaries entered into security arrangements such as cross-guarantees, debentures and share pledges in favour of Barclays Bank PLC, acting as administrative agent and L/C issuer, in support of the acquisition funding bank debt and revolving credit facility.
F-106
Table of Contents
MULTI PACKAGING SOLUTIONS GLOBAL HOLDINGS LIMITED
NOTES TO THE FINANCIAL STATEMENTS
FOR THE PERIOD 13 JUNE 2013 (DATE OF INCEPTION) TO 29 DECEMBER 2013 (SUCCESSOR), AND
FOR THE 39 WEEKS ENDED 30 SEPTEMBER 2013 AND THE 52 WEEKS ENDED 30 DECEMBER 2012 (PREDECESSOR)
25. Contingent liabilities (continued)
The group is subject to various claims and actions in the ordinary course of business, some of which are covered by insurance. Whilst the outcome of these claims and actions cannot be predicted with certainty the company believes that the aggregate expected outcomes of all these claims and actions would not have a material effect on the Group’s financial position or result for the period.
One of the subsidiaries of the Group is subject to a continuing guarantee in respect of certain lease obligations of IPACKCHEM Limited (formerly Chesapeake Plastics Limited), a former subsidiary of Chesapeake Limited, in relation to premises at Crewe. There is also an indemnity obtained from the sellers of the paperboard group, in respect of this guarantee.
26. Related party transactions
Successor
The Carlyle Group, as majority shareholder of the Chesapeake group, charged a total amount of £110,000 to the Group for management services and an amount of £4,000,000 in respect of the acquisition of the Group.
Predecessor
The Group is party to Professional Services Agreements with Irving Place Capital Management LP (“IPC”) and Oaktree Capital Management LP (“OCM”), under which each of the parties provides strategic, corporate planning and other business advisory and business monitoring services to the Group. These agreements expired on 30 September 2013 with respect to the paperboard operations sold. In the period to 30 September 2013 the cost to the Group of these professional services was £725,000 (year to 30 December 2012: £923,000) and £713,000 (year to 30 December 2012: £985,000) respectively for IPC and OCM, of which £889,000 (year to 30 December 2012: £1,011,000) and £1,249,000 (year to 30 December 2012: £458,000) was invoiced in the year by IPC and OCM respectively. At 30 September 2013 no amounts were outstanding (30 December 2012: £164,000 and £526,000) on the balance sheet towards IPC and OCM respectively.
Details of the Group’s financing arrangements provided by IPC and OCM are provided in Note 14. During the year the group paid £nil in interest and principal repayments to IPC and OCM under these arrangements, and these loans remained with the sellers of the paperboard business.
27. Controlling party
As at the balance sheet date the immediate parent undertaking is Chesapeake Finance 1 Limited (formerly known as Chase Midco 1 Limited). The ultimate parent company and controlling party is Chesapeake Holdings Limited, which is the largest group to consolidate these financial statements. Copies of the accounts of Chesapeake Holdings Limited may be obtained from the corporate administration office, c/o Chesapeake Limited, Millennium Way West, Phoenix centre, Nottingham, Nottinghamshire, NG8 6AW.
F-107
Table of Contents
MULTI PACKAGING SOLUTIONS GLOBAL HOLDINGS LIMITED
NOTES TO THE FINANCIAL STATEMENTS
FOR THE PERIOD 13 JUNE 2013 (DATE OF INCEPTION) TO 29 DECEMBER 2013 (SUCCESSOR), AND
FOR THE 39 WEEKS ENDED 30 SEPTEMBER 2013 AND THE 52 WEEKS ENDED 30 DECEMBER 2012 (PREDECESSOR)
28. Share based payments
Certain members of the Successor company’s management were allowed to co-invest with the majority shareholders in Multi Packaging Solutions Global Holdings Limited. They could either directly or indirectly purchase A shares at a value equal to the value paid by the majority shareholders for the other share classes. Although the initial purchase price was equal to the price paid by the other investors the shares could attract a higher payout (Ratchet) if certain performance criteria are met (subject to the provisions in the articles of association of Chesapeake Holdings Limited) and if there is a liquidity event. The valuation analysis performed in order to determine the charge to the profit and loss account takes into account estimating the enterprise value at Exit under the guideline public company method of the market approach, discounting the future proceeds from the Ratchet at a required return computed for the A Shares Ratchet and accounting for the variability in management’s forecasted financial results using a Monte Carlo simulation.
29. Subsequent events
On 19 November 2013, the Carlyle Group (as majority shareholder of the Company) and Madison Dearborn Partners, LLC (as majority shareholder of the Multi Packaging Solutions group) announced that they had entered into a definitive agreement to merge the Company and Multi Packaging Solutions Inc ., a complimentary business of similar size to the Company, subject to regulatory compliance. This transaction completed on February 14, 2014 and creates a leading global provider of print-based specialty packaging. The transaction was accounted for as a reverse acquisition by Multi Packaging Solutions of Chesapeake. As part of the acquisition the company also refinanced certain of its debt facilities.
On 4 April 2014, the Group, through one of its subsidiaries, acquired 70% of the share capital of Integrated Printing Solutions, Inc. and 100% of the share capital of Jet Lithocolor, Inc. to create a comprehensive end-to-end solution for the credit, debit, gift, loyalty, and insurance card markets.
In April 2014 the Group also announced its intention to reorganise its US operations and anticipates that (subject to the completion of legal, financial and other closure procedures) it will cease operations at its Evansville, Indiana and Fairfield, New Jersey facilities. This reorganisation is a consequence of the merger with Multi Packaging Solutions and will position the Group for further, profitable growth.
On 8 July 2014, the Group acquired the entire share capital of Armstrong Packaging Ltd, a speciality rigid box packaging company based in Arbroath, Scotland. Then on 28 February 2015 the Group acquired 100% of the share capital of Presentation Products Group ltd. also based in Arbroath, Scotland with subsidiaries in Hong Kong and China. Both acquisitions expand the Group’s global platform for luxury packaging, gift sets, travel retail, and commemorative editions. Armstrong’s product development and rigid box manufacturing perfectly complement the Company’s existing manufacturing, creative design, project management, and global sourcing capabilities.
On 21 November 2014 the Group acquired 100% of the North American and Asian operations of ASG as well as a subsidiary leasing company and certain holding companies in Europe. The transaction excludes the European manufacturing operations of ASG which will remain independent from Multi Packaging Solutions. The acquisition of ASG, a highly respected manufacturer of print and packaging in the United States, Canada, Mexico and China, will further expand the group’s global network and customer base.
F-108
Table of Contents
MULTI PACKAGING SOLUTIONS GLOBAL HOLDINGS LIMITED
NOTES TO THE FINANCIAL STATEMENTS
FOR THE PERIOD 13 JUNE 2013 (DATE OF INCEPTION) TO 29 DECEMBER 2013 (SUCCESSOR), AND
FOR THE 39 WEEKS ENDED 30 SEPTEMBER 2013 AND THE 52 WEEKS ENDED 30 DECEMBER 2012 (PREDECESSOR)
30. Summary of differences between accounting principles generally accepted in the United Kingdom and the United States of America
The consolidated financial statements are prepared in accordance with UK GAAP, which differ in certain respects from accounting principles generally accepted in the United States of America (“US GAAP”). Differences which have a significant effect on the consolidated (loss) / profit, shareholders’ funds and the financial position of the Group are set out below.
Effect on net loss / profit of differences between UK and US GAAP
| Successor | Predecessor | |||||||||||||||||
| 13 June 2013 to 29 December 2013 |
31 December 2012 to 30 September 2013 |
52 weeks ended 30 December 2012 |
||||||||||||||||
| £’000 | £’000 | £’000 | ||||||||||||||||
| Net (loss) / profit in accordance with UK GAAP |
(8,656 | ) | 5,457 | 45,513 | ||||||||||||||
| US GAAP adjustments: |
||||||||||||||||||
| Business combinations |
(a | ) | ||||||||||||||||
| Transaction expenses |
(ai | ) | (17,346 | ) | — | (158 | ) | |||||||||||
| Inventory step up |
(aii | ) | (3,114 | ) | — | (32 | ) | |||||||||||
| Amortisation of goodwill |
(aiii | ) | 11,776 | (12,103 | ) | (16,073 | ) | |||||||||||
| Amortisation of intangible fixed assets |
(aiv | ) | (3,687 | ) | (1,544 | ) | (2,041 | ) | ||||||||||
| Contingent consideration |
(av | ) | — | — | 625 | |||||||||||||
| Short term employee benefits—compensated absences |
(b | ) | ||||||||||||||||
| Cost of goods sold |
196 | (210 | ) | 36 | ||||||||||||||
| Administrative costs |
167 | (152 | ) | (4 | ) | |||||||||||||
| Derivatives and hedging activities |
(c | ) | 973 | (257 | ) | 439 | ||||||||||||
| Leases |
(d | ) | — | (64 | ) | (86 | ) | |||||||||||
| Share compensation costs |
(e | ) | 26 | — | — | |||||||||||||
| Revenue recognition |
(f | ) | — | |||||||||||||||
| Sales |
132 | (263 | ) | 52 | ||||||||||||||
| Cost of goods sold |
(138 | ) | 217 | (190 | ) | |||||||||||||
| Pensions |
(g | ) | (631 | ) | (779 | ) | (593 | ) | ||||||||||
| Minority interest |
(h | ) | — | 147 | 81 | |||||||||||||
| Interest payable |
(i | ) | — | (4,885 | ) | (12,122 | ) | |||||||||||
| Taxation |
(j | ) | ||||||||||||||||
| Taxation GAAP differences |
(ji | ) | (123 | ) | (1,809 | ) | (630 | ) | ||||||||||
| Tax effect of US GAAP adjustments |
(jii | ) | 1,224 | 896 | 598 | |||||||||||||
|
|
|
|
|
|
|
|||||||||||||
| Net (loss)/profit in accordance with US GAAP |
(19,201 | ) | (15,349 | ) | 15,415 | |||||||||||||
|
|
|
|
|
|
|
|||||||||||||
F-109
Table of Contents
MULTI PACKAGING SOLUTIONS GLOBAL HOLDINGS LIMITED
NOTES TO THE FINANCIAL STATEMENTS
FOR THE PERIOD 13 JUNE 2013 (DATE OF INCEPTION) TO 29 DECEMBER 2013 (SUCCESSOR), AND
FOR THE 39 WEEKS ENDED 30 SEPTEMBER 2013 AND THE 52 WEEKS ENDED 30 DECEMBER 2012 (PREDECESSOR)
30. Summary of differences between accounting principles generally accepted in the United Kingdom and the United States of America (continued)
Cumulative effect on shareholders’ equity of differences between UK and US GAAP:
| Successor | Predecessor | |||||||||||||||||
| 13 June 2013 to 29 December 2013 |
31 December 2012 to 30 September 2013 |
52 weeks ended 30 December 2012 |
||||||||||||||||
| £’000 | £’000 | £’000 | ||||||||||||||||
| Shareholders’ funds in accordance with UK GAAP |
150,237 | 57,719 | 81,039 | |||||||||||||||
| US GAAP adjustments: |
||||||||||||||||||
| Business combinations |
||||||||||||||||||
| Adjustment of positive and negative goodwill |
(ai | ) | (131,471 | ) | 45,350 | 57,008 | ||||||||||||
| Adjustment of intangible fixed assets |
(aiv | ) | 153,712 | 9,009 | 10,554 | |||||||||||||
| Short term employee benefits—compensated absences |
(b | ) | (544 | ) | (909 | ) | (547 | ) | ||||||||||
| Derivatives and hedging activities |
(c | ) | ||||||||||||||||
| Other debtors due after one year |
1,565 | — | — | |||||||||||||||
| Other creditors due after one year |
(905 | ) | — | — | ||||||||||||||
| Other creditors due within one year |
(302 | ) | (616 | ) | (432 | ) | ||||||||||||
| Prepayments |
326 | 325 | 397 | |||||||||||||||
| Leases |
(d | ) | — | (425 | ) | (360 | ) | |||||||||||
| Revenue recognition |
(f | ) | ||||||||||||||||
| Inventory |
1,390 | 1,528 | 1,311 | |||||||||||||||
| Trade receivables |
(1,791 | ) | (1,923 | ) | (1,660 | ) | ||||||||||||
| Pensions |
(g | ) | 766 | 130 | 944 | |||||||||||||
| Interest payable |
(i | ) | — | (275,017 | ) | (270,132 | ) | |||||||||||
| Tax effect of US GAAP adjustments |
(j | ) | ||||||||||||||||
| Taxation GAAP differences |
(ji | ) | (1,861 | ) | (3,783 | ) | (3,783 | ) | ||||||||||
| Tax effect of US GAAP adjustments |
(jii | ) | (30,841 | ) | (2,156 | ) | (3,062 | ) | ||||||||||
| Minority interest |
(h | ) | — | 1,295 | 1,148 | |||||||||||||
|
|
|
|
|
|
|
|||||||||||||
| Shareholders’ funds in accordance with US GAAP |
140,281 | (169,473 | ) | (127,575 | ) | |||||||||||||
|
|
|
|
|
|
|
|||||||||||||
F-110
Table of Contents
MULTI PACKAGING SOLUTIONS GLOBAL HOLDINGS LIMITED
NOTES TO THE FINANCIAL STATEMENTS
FOR THE PERIOD 13 JUNE 2013 (DATE OF INCEPTION) TO 29 DECEMBER 2013 (SUCCESSOR), AND
FOR THE 39 WEEKS ENDED 30 SEPTEMBER 2013 AND THE 52 WEEKS ENDED 30 DECEMBER 2012 (PREDECESSOR)
30. Summary of differences between accounting principles generally accepted in the United Kingdom and the United States of America (continued)
Reconciliation of shareholders’ funds under US GAAP:
| Successor | Predecessor | |||||||||||||
| 29 December 2013 |
30 September 2013 |
30 December 2012 |
||||||||||||
| £’000 | £’000 | £’000 | ||||||||||||
| Opening balance |
— | (127,575 | ) | (124,456 | ) | |||||||||
| Shares issued |
164,948 | — | — | |||||||||||
| Net (loss)/profit |
(19,201 | ) | (15,349 | ) | 15,415 | |||||||||
| Actuarial loss relating to pension plans |
(4,257 | ) | (5,668 | ) | (14,305 | ) | ||||||||
| Foreign currency translation adjustment |
(1,209 | ) | 5,701 | (4,198 | ) | |||||||||
| Advanced payment for repurchase of C Shares |
— | (26,582 | ) | — | ||||||||||
| Purchased share capital |
— | — | (31 | ) | ||||||||||
|
|
|
|
|
|
|
|||||||||
| Closing balance |
140,281 | (169,473 | ) | (127,575 | ) | |||||||||
|
|
|
|
|
|
|
|||||||||
(a) Business combinations
Under UK GAAP the acquiring entity allocates consideration for the transaction to the assets acquired and liabilities assumed based on their estimated fair values at the date of acquisition with the difference treated as goodwill. The Group accounts for these business combinations on a consistent basis under US GAAP with the following exceptions:
| i. | Transaction expenses |
Under UK GAAP, transaction expenses are capitalised as part of acquisition consideration. Under US GAAP these expenses are recognised in the income statement as an administrative expense in the period in which the acquisition occurred.
| ii. | Inventory step up |
Under US GAAP, manufactured inventory is recorded at estimated selling price less any future disposal costs and a reasonable profit margin and an adjustment has been recorded to step up the inventory carrying value this amount. Under UK GAAP acquired inventory is recorded at the lower of replacement costs and net realisable value. The adjustment for US GAAP is recorded against cost of goods sold and amortised over the stock turn period.
| iii. | Amortisation of goodwill |
Recognition of goodwill
Under UK GAAP, both positive and negative goodwill arising on acquisitions is capitalised and amortised over its estimated useful life.
F-111
Table of Contents
MULTI PACKAGING SOLUTIONS GLOBAL HOLDINGS LIMITED
NOTES TO THE FINANCIAL STATEMENTS
FOR THE PERIOD 13 JUNE 2013 (DATE OF INCEPTION) TO 29 DECEMBER 2013 (SUCCESSOR), AND
FOR THE 39 WEEKS ENDED 30 SEPTEMBER 2013 AND THE 52 WEEKS ENDED 30 DECEMBER 2012 (PREDECESSOR)
30. Summary of differences between accounting principles generally accepted in the United Kingdom and the United States of America (continued)
Negative goodwill was created upon the original acquisition of the Predecessor in 2009 and recorded on the balance sheet. Negative goodwill in excess of the fair values of the non-monetary assets acquired is then credited to the profit and loss account in the periods expected to benefit. Under US GAAP negative goodwill arising from a bargain purchase in excess of fair values allocated to the non-monetary assets is immediately credited to the income statement on the acquisition date.
Under US GAAP, positive goodwill is not amortised but is tested at least annually for impairment or whenever an event occurs or circumstances change that would reduce the fair value of a reporting unit to a value below its carrying value.
The goodwill test for impairment consists of a two-step process that begins with an estimation of the fair value of a reporting unit. The first step is a screen for potential impairment and if there is an implied impairment, the second step measures the amount of impairment, if any, by comparing the implied fair value of goodwill with the carrying value of the goodwill. The evaluation of impairment of existing goodwill at the Successor and Predecessor period ends indicated no impairment under US GAAP at that time.
Currency denomination
Under UK GAAP, goodwill arising on an acquisition is typically denominated in the currency of the acquirer, which in the case of the acquisitions to date was Sterling.
Under US GAAP, goodwill and intangible fixed assets are recorded in the functional currency of the operations to which they relate. The amounts are retranslated at each balance sheet date with the foreign exchange gain or loss being recorded directly within other comprehensive income.
| iv. | Amortisation of intangible fixed assets |
Under UK GAAP, the Group recognises intangible assets separately in a business combination only when they can be disposed of separately without disposing of the business and their value can be measured reliably on initial measurement. Under US GAAP, the Group recognises acquired intangible assets separately from goodwill if (i) they arise from contracted or other legal rights even if the assets are not transferable or separable from the acquired entity or from other rights and obligations or (ii) they are capable of being separated or divided from the acquired entity and sold, transferred, licensed, rented or exchanged.
The Group has recognised intangible assets relating to customer relationships and technology and intellectual property. These are being amortised over their respective estimated useful economic lives.
| v. | Contingent consideration |
Under UK GAAP, the fair value of the consideration includes an estimate of amounts which are deferred or contingent upon the future revenues of the acquired entity. Any reassessment of the deferred or contingent
F-112
Table of Contents
MULTI PACKAGING SOLUTIONS GLOBAL HOLDINGS LIMITED
NOTES TO THE FINANCIAL STATEMENTS
FOR THE PERIOD 13 JUNE 2013 (DATE OF INCEPTION) TO 29 DECEMBER 2013 (SUCCESSOR), AND
FOR THE 39 WEEKS ENDED 30 SEPTEMBER 2013 AND THE 52 WEEKS ENDED 30 DECEMBER 2012 (PREDECESSOR)
30. Summary of differences between accounting principles generally accepted in the United Kingdom and the United States of America (continued)
consideration is adjusted against the goodwill balance in future periods. Under US GAAP the consideration is recorded at fair value and classified as a liability or equity depending on the nature of the underlying instrument. Any reassessment for considerations classified as a liability is expensed in the period in which the event occurred.
(b) Short term employee benefits—compensated absences
Under UK GAAP there is no specific requirement to accrue for earned but unused holiday entitlement, and management records a provision based on the laws of the jurisdiction in which the business is located. Under US GAAP there is a requirement to provide for the liability arising from accrued but unused holiday entitlement.
(c) Derivatives and hedging activities
Under UK GAAP, the Group does not recognise derivatives at fair value on the balance sheet. Interest differentials on derivative instruments are charged to the profit and loss account as interest costs in the period in which they are realised. Foreign currency gains and losses realised on forward currency contracts are recognised in the period in which they occur. Monetary assets and liabilities denominated in foreign currencies that are hedged by a foreign currency derivative are translated using the contract rate in the hedging derivative.
Under US GAAP hedge accounting is permitted only when, inter alia, the hedging relationship is documented formally. Derivatives that are not designated in a hedging relationship are recognised at fair value with gains and losses recognised in the profit and loss account. Since the Group had not formally documented its hedging relationship in accordance with US GAAP an adjustment is made to record the fair value of derivatives on the balance sheet with the movement in fair value recorded in the income statement each period.
US GAAP also requires all monetary assets and liabilities to be translated at the spot rate. The forward contract is separately recorded on the balance sheet as a derivative asset or liability at fair value.
(d) Leases
The Group has in the past entered into rent arrangements for facilities whereby it received a rent free period and or a lease incentive payment. Under UK GAAP these lease incentives are expensed over the related rental period to the first break clause in the contract. Under US GAAP the incentive expensed over the full term of the lease.
(e) Share compensation costs
The costs recognised in relation to the share based payment awards included in the UK GAAP financial statements has been reversed under US GAAP accounting regulations as the vesting of the awards is contingent upon the occurrence of a liquidity event.
F-113
Table of Contents
MULTI PACKAGING SOLUTIONS GLOBAL HOLDINGS LIMITED
NOTES TO THE FINANCIAL STATEMENTS
FOR THE PERIOD 13 JUNE 2013 (DATE OF INCEPTION) TO 29 DECEMBER 2013 (SUCCESSOR), AND
FOR THE 39 WEEKS ENDED 30 SEPTEMBER 2013 AND THE 52 WEEKS ENDED 30 DECEMBER 2012 (PREDECESSOR)
30. Summary of differences between accounting principles generally accepted in the United Kingdom and the United States of America (continued)
(f) Revenue recognition
US GAAP contains more detailed requirements to be met in order to recognise revenue under a bill and hold arrangement compared with UK GAAP. Whilst the Company’s bill and hold arrangements are recognised as revenue under UK GAAP, these arrangements do not meet all of the criteria for revenue recognition under US GAAP as they do not contain fixed delivery schedules and the Company retains insurance risk over the goods until delivery. As such revenue relating to bill and hold arrangements is deferred under US GAAP until the goods have been delivered.
(g) Pensions
The main differences in the treatment of the pensions between UK GAAP and US GAAP which affect the Group are:
| i. | Under UK GAAP past service credits are fully recognised in the income statement during the period in which they occurred. Under US GAAP, the effects of these plan amendments are written off over the expected future working lifetime of the participants |
| ii. | Under UK GAAP, actuarial losses or gains are recognised immediately through the statement of total recognised gains and losses during the year of occurrence. Under US GAAP, these are recognised in other comprehensive income and then amortised through the income statement over the expected remaining service period of members following the corridor approach, which allows the Company to defer amortization of actuarial losses or gains through the income statement which are lower than the greater of 10% of the fair value of the scheme’s assets or the projected benefit obligation at the start of the period. |
| iii. | Under UK GAAP an asset ceiling has been applied to cap the pension asset being offset against the pension liability. This limitation is not required under US GAAP. |
Also, under UK GAAP the group has recorded the deferred tax asset relating the pension liability as a deduction to the liability recorded on the balance sheet. Under US GAAP the pension liability has to be shown gross of any related deferred tax. The liabilities at each balance sheet date were as follows: £43,292,000 at 30 December 2012, £49,304,000 at 30 September 2013 and £18,638,000 at 29 December 2013.
(h) Minority interest
Under UK GAAP, minority interest is deducted in determining the loss for the period. Under US GAAP, minority interests (called non-controlling interests) are not deducted in arriving at net loss for the period. Instead the net loss for the period is allocated between the non-controlling interests and the parent company shareholders.
(i) Interest payable—CPECs
Under UK GAAP the convertible preferred equity certificates (CPECs) are considered a debt instrument in line with Luxemburg law. Under US GAAP they are also considered a debt item. The CPECs do not attract interest
F-114
Table of Contents
MULTI PACKAGING SOLUTIONS GLOBAL HOLDINGS LIMITED
NOTES TO THE FINANCIAL STATEMENTS
FOR THE PERIOD 13 JUNE 2013 (DATE OF INCEPTION) TO 29 DECEMBER 2013 (SUCCESSOR), AND
FOR THE 39 WEEKS ENDED 30 SEPTEMBER 2013 AND THE 52 WEEKS ENDED 30 DECEMBER 2012 (PREDECESSOR)
30. Summary of differences between accounting principles generally accepted in the United Kingdom and the United States of America (continued)
under UK GAAP, but are ultimately convertible into A ordinary shares and also contain an option for the Company to redeem the CPECs at the greater of (a) the fair value the underlying shares that the CPECs convert to and (b) the principal plus unpaid and accrued interest.
Under US GAAP the CPECs are recorded at fair value at the inception date. Since the holders of the CPECs control the Company the redemption feature is considered to be a put option at the option of the CPEC holders. Since the redemption feature is at the greater of fair value of the underlying shares and par value the conversion option is effectively net cash settled and therefore is accounted for an embedded derivative at fair value through profit and loss. Changes in the fair value of the conversion option are recorded as a finance charge within the income statement.
(j) Taxation
| i. | Taxation GAAP differences |
Under US GAAP, deferred taxation is provided for all temporary differences (differences between the carrying value of assets and liabilities and their corresponding tax bases) on a full liability basis. In contrast, certain of these items, such as non-qualifying industrial building allowances, are treated as permanent differences under UK GAAP.
For UK GAAP, adjustments to deferred tax balances initially recorded within the Statement of Total Recognised Gains and Losses resulting from changes in statutory tax rates were reflected back through this category of income. Under US GAAP, these deferred tax adjustments are required to be recognised through the income statement tax expense. This resulted in an increase to tax expense for US GAAP purposes, which would be offset by a decrease to Other Comprehensive Income.
Under UK GAAP, deferred tax assets are recognised only to the extent that, on the basis of all available evidence, it is considered that there will be sufficient future profits from which the reversal of the timing losses can be deducted. There is a general acceptance that an entity would look out between 1-3 years when considering future profitability to evaluate the probability of realising the assets. Under US GAAP, there is no accepted cap on the look-out period when the company has a history of profitability.
Under UK GAAP, deferred tax assets and liabilities are off-set across different tax jurisdictions and the net amount is presented with debtors, if a net asset, or with provision for liabilities, if a net liability. Under US GAAP, deferred taxes are classified in the balance sheet according to the classification of the balance sheet item to which they relate. Therefore deferred tax liabilities related to intangible assets are reclassified as long term liabilities. Deferred tax assets and liabilities are only off-set to the extent that they are short term or long term and are in the same tax jurisdiction.
| ii. | Tax effect of other GAAP differences |
In most cases, the UK GAAP differences described above generate a difference between the book and tax base of the relevant asset or liability. As a result, deferred taxes on such temporary differences are recognised under US GAAP at the tax rate applicable to the jurisdiction associated with the underlying activity and based on when
F-115
Table of Contents
MULTI PACKAGING SOLUTIONS GLOBAL HOLDINGS LIMITED
NOTES TO THE FINANCIAL STATEMENTS
FOR THE PERIOD 13 JUNE 2013 (DATE OF INCEPTION) TO 29 DECEMBER 2013 (SUCCESSOR), AND
FOR THE 39 WEEKS ENDED 30 SEPTEMBER 2013 AND THE 52 WEEKS ENDED 30 DECEMBER 2012 (PREDECESSOR)
30. Summary of differences between accounting principles generally accepted in the United Kingdom and the United States of America (continued)
the temporary difference is expected to be settled. Notable exceptions to this are for US GAAP differences for transaction expenses, contingent consideration adjustments, and adjustments to positive and negative goodwill. These adjustments relate to items that are permanently non-deductible for tax purposes, or meet specific exclusion requirements under both standards.
Under US GAAP, additional deferred tax liabilities are recognised for the adjustments to identifiable intangible assets recorded as part of the purchase accounting for the Group’s acquisitions with a corresponding adjustment to increase goodwill.
Explanation of UK GAAP—US GAAP differences not quantified
Under UK GAAP, the Group’s financial statements include a cash flow statement which presents substantially the same information as that required under US GAAP, however US GAAP only requires presentation of cash flows from operating, investing, and financing activities. Set out below, is a summary consolidated statement of cash flows presented using the captions under US GAAP:
| Successor | Predecessor | |||||||||||||
| 13 June 2013 to 29 December 2013 |
31 December 2012 to 30 September 2013 |
52 weeks ended 30 December 2012 |
||||||||||||
| £’000 | £’000 | £’000 | ||||||||||||
| Net cash provided by operating activities |
(42,797 | ) | 34,338 | 41,067 | ||||||||||
| Net cash used in investing activities |
(339,754 | ) | (21,719 | ) | (26,221 | ) | ||||||||
| Net cash used in financing activities |
399,226 | (7,279 | ) | (440 | ) | |||||||||
|
|
|
|
|
|
|
|||||||||
| Net increase/(decrease) in cash and cash equivalents |
16,675 | 5,340 | 14,406 | |||||||||||
| Cash and cash equivalents at the start of the period |
— | 23,513 | 9,219 | |||||||||||
| Foreign exchange |
(122 | ) | 158 | (112 | ) | |||||||||
|
|
|
|
|
|
|
|||||||||
| Cash and cash equivalents at the end of the period |
16,553 | 29,011 | 23,513 | |||||||||||
|
|
|
|
|
|
|
|||||||||
Classification differences between UK GAAP and US GAAP
In addition to the differences between UK GAAP and US GAAP related to the recognition and measurement of transactions by the Group, there are also a number of differences in the manner in which items are classified in the consolidated profit and loss account and consolidated balance sheet. These classification differences have no impact on net less / profit or shareholders’ funds.
Under UK GAAP, the balance sheets are presented in ascending order of liquidity, whereas under US GAAP assets are presented in descending order of liquidity. Also under UK GAAP, the balance sheet is analysed between net assets and shareholders’ funds. Under US GAAP, the analysis is between total assets and total liabilities plus shareholders’ equity. Certain items which are disclosed in the notes under UK GAAP would be disclosed on the face of the balance sheet under US GAAP.
F-116
Table of Contents
Carve-out Financial Statements of the US
Folding Carton and Lithographic Printing
Business of Atlas AGI Holdings LLC
As of September 30, 2014 and the Nine Month Period Ended September 30, 2014
Table of Contents
US FOLDING CARTON AND LITHOGRAPHIC PRINTING BUSINESS OF ATLAS AGI HOLDINGS LLC AUDITED CARVE-OUT FINANCIAL STATEMENTS
INDEX
| F-119 | ||||
| F-120 | ||||
| F-121 | ||||
| F-122 | ||||
| F-123 | ||||
| F-124 | ||||
F-118
Table of Contents
US FOLDING CARTON AND LITHOGRAPHIC PRINTING BUSINESS OF ATLAS AGI HOLDINGS LLC AUDITED CARVE-OUT FINANCIAL STATEMENTS
INDEPENDENT AUDITORS’ REPORT

To the Board of Managers and
Member of Atlas AGI Holdings LLC:
We have audited the accompanying financial statements of the US Folding Carton and Lithographic Printing Business of Atlas AGI Holdings LLC, which comprise the balance sheet as of September 30, 2014, and the related statements of income, of invested capital, and of cash flows for the period from January 1, 2014 to September 30, 2014.
Management’s Responsibility for the Financial Statements
Management is responsible for the preparation and fair presentation of the financial statements in accordance with accounting principles generally accepted in the United States of America; this includes the design, implementation, and maintenance of internal control relevant to the preparation and fair presentation of financial statements that are free from material misstatement, whether due to fraud or error.
Auditor’s Responsibility
Our responsibility is to express an opinion on the financial statements based on our audits. We conducted our audits in accordance with auditing standards generally accepted in the United States of America. Those standards require that we plan and perform the audit to obtain reasonable assurance about whether the financial statements are free from material misstatement.
An audit involves performing procedures to obtain audit evidence about the amounts and disclosures in the financial statements. The procedures selected depend on our judgment, including the assessment of the risks of material misstatement of the financial statements, whether due to fraud or error. In making those risk assessments, we consider internal control relevant to the Company’s preparation and fair presentation of the financial statements in order to design audit procedures that are appropriate in the circumstances, but not for the purpose of expressing an opinion on the effectiveness of the Company’s internal control. Accordingly, we express no such opinion. An audit also includes evaluating the appropriateness of accounting policies used and the reasonableness of significant accounting estimates made by management, as well as evaluating the overall presentation of the financial statements. We believe that the audit evidence we have obtained is sufficient and appropriate to provide a basis for our audit opinion.
Opinion
In our opinion, the financial statements referred to above present fairly, in all material respects, the financial position of the US Folding Carton and Lithographic Printing Business of Atlas AGI Holdings LLC as of September 30, 2014, and the related statements of income, of invested capital, and of cash flows for the period from January 1, 2014 to September 30, 2014 in accordance with accounting principles generally accepted in the United States of America.
Emphasis of a Matter
As discussed in Note 2 and Note 12 to the financial statements, amounts recorded for allocations of certain administrative and support services expenses of the US Folding Carton and Lithographic Printing Business are not necessarily representative of the amounts that would have been reflected in the financial statements had the US Folding Carton and Lithographic Printing Business operated as a separate, stand-alone entity. Our opinion is not modified with respect to this matter.
/s/ PricewaterhouseCoopers LLP
Chicago, Illinois
November 14, 2014
F-119
Table of Contents
US FOLDING CARTON AND LITHOGRAPHIC PRINTING BUSINESS OF ATLAS AGI HOLDINGS LLC AUDITED CARVE-OUT FINANCIAL STATEMENTS
BALANCE SHEET
(Amounts in Thousands)
| September 30, 2014 | ||||
| Current Assets: |
||||
| Cash |
$ | 1,206 | ||
| Accounts receivable, net |
45,870 | |||
| Inventories |
18,601 | |||
| Prepaid expenses and other current assets |
2,298 | |||
|
|
|
|||
| Total Current Assets |
67,975 | |||
| Non-Current Assets: |
||||
| Property, plant and equipment, net |
11,604 | |||
| Intangibles, net |
440 | |||
| Assets held for sale |
1,568 | |||
| Other assets |
1,966 | |||
|
|
|
|||
| Total Non-Current Assets |
15,578 | |||
|
|
|
|||
| Total Assets |
$ | 83,553 | ||
|
|
|
|||
| Current Liabilities: |
||||
| Accounts payable |
$ | 14,165 | ||
| Payables to related entities |
2,196 | |||
| Revolving line of credit |
40,461 | |||
| Accrued payroll and benefits |
5,906 | |||
| Accrued expenses |
10,353 | |||
|
|
|
|||
| Total Current Liabilities |
73,081 | |||
| Non-Current Liabilities: |
||||
| Deferred income taxes |
19 | |||
| Other long term liabilities |
1,366 | |||
|
|
|
|||
| Total Non-Current Liabilities |
1,385 | |||
| Commitments and Contingencies (Note 10) |
— | |||
|
|
|
|||
| Total Invested Capital |
9,087 | |||
|
|
|
|||
| Total Liabilities and Invested Capital |
$ | 83,553 | ||
|
|
|
|||
The accompanying notes are an integral part of these carve-out financial statements.
F-120
Table of Contents
US FOLDING CARTON AND LITHOGRAPHIC PRINTING BUSINESS OF ATLAS AGI HOLDINGS LLC AUDITED CARVE-OUT FINANCIAL STATEMENTS
INCOME STATEMENT
(Amounts in Thousands)
| Nine Month Period Ended September 30, 2014 |
||||
| Revenues, net |
$ | 148,626 | ||
| Cost of goods sold |
129,422 | |||
|
|
|
|||
| Gross profit |
19,204 | |||
| Operating Costs: |
||||
| Selling, general and administrative |
21,112 | |||
| Transaction and restructuring costs |
4,654 | |||
|
|
|
|||
| Total Operating Costs |
25,766 | |||
|
|
|
|||
| Operating loss |
(6,562 | ) | ||
| Interest and Other (Income) Expense |
||||
| Interest expense, net |
1,271 | |||
| Other (income) expense, net |
(746 | ) | ||
|
|
|
|||
| Total Interest and Other (Income) Expense |
525 | |||
|
|
|
|||
| Loss before income taxes |
(7,087 | ) | ||
| Income tax expense |
9 | |||
|
|
|
|||
| Net Loss |
$ | (7,096 | ) | |
|
|
|
|||
The accompanying notes are an integral part of these carve-out financial statements.
F-121
Table of Contents
US FOLDING CARTON AND LITHOGRAPHIC PRINTING BUSINESS OF ATLAS AGI HOLDINGS LLC AUDITED CARVE-OUT FINANCIAL STATEMENTS
STATEMENT OF INVESTED CAPITAL
(Amounts in Thousands)
| Invested Capital—December 31, 2013 |
$ | 21,343 | ||
| Net distribution to parent |
(5,160 | ) | ||
| Net loss |
(7,096 | ) | ||
|
|
|
|||
| Invested Capital—September 30, 2014 |
$ | 9,087 | ||
|
|
|
The accompanying notes are an integral part of these carve-out financial statements.
F-122
Table of Contents
US FOLDING CARTON AND LITHOGRAPHIC PRINTING BUSINESS OF ATLAS AGI HOLDINGS LLC AUDITED CARVE-OUT FINANCIAL STATEMENTS
STATEMENT OF CASH FLOWS
(Amounts in Thousands)
| Nine Month Period Ended September 30, 2014 |
||||
| Cash Flows From Operating Activities: |
||||
| Adjustments to reconcile net loss to net cash from operating activities: |
||||
| Net loss |
$ | (7,096 | ) | |
| Depreciation and amortization |
2,092 | |||
| Amortization of deferred financing fees |
334 | |||
| Gain on sale of property, plant and equipment |
(1,498 | ) | ||
| Changes in operating assets and liabilities: |
||||
| Accounts receivable, net |
(18,548 | ) | ||
| Inventories |
(398 | ) | ||
| Prepaid expenses and other current assets |
2,813 | |||
| Accounts payable and accrued expenses |
19,830 | |||
| Other |
345 | |||
|
|
|
|||
| Net Cash Used in Operating Activities |
(2,126 | ) | ||
|
|
|
|||
| Cash Flows From Investing Activities: |
||||
| Purchase of property, plant and equipment |
(2,098 | ) | ||
| Proceeds from sale of property, plant and equipment |
3,825 | |||
|
|
|
|||
| Net Cash Provided by Investing Activities |
1,727 | |||
|
|
|
|||
| Cash Flows From Financing Activities: |
||||
| Net contribution to parent |
(5,160 | ) | ||
| Proceeds from revolver borrowings |
204,408 | |||
| Repayments of revolver borrowings |
(199,617 | ) | ||
|
|
|
|||
| Net Cash Used in Financing Activities |
(369 | ) | ||
|
|
|
|||
| Net Decrease in Cash and Cash Equivalents |
(768 | ) | ||
| Cash—Beginning |
1,974 | |||
|
|
|
|||
| Cash—Ending |
$ | 1,206 | ||
|
|
|
|||
| Supplemental Disclosures |
||||
| Cash paid for interest |
$ | 942 | ||
| Cash paid for income taxes |
$ | 287 | ||
| Non-cash accrual for purchase of construction in progress |
$ | 202 | ||
The accompanying notes are an integral part of these carve-out financial statements.
F-123
Table of Contents
US FOLDING CARTON AND LITHOGRAPHIC PRINTING BUSINESS OF ATLAS AGI HOLDINGS
LLC AUDITED CARVE-OUT FINANCIAL STATEMENTS
NOTES TO CARVE-OUT FINANCIAL STATEMENTS
NOTE 1—Background and Organization and Nature of Business
Atlas AGI Holdings LLC (“Parent”) was formed on September 8, 2010 (“inception”) as a limited liability company pursuant to the Delaware Limited Company Act. The Parent remained dormant until it was funded by Atlas AGI Topco LLC (“TopCo”), the sole equity member of the Parent.
The Parent, through its wholly owned subsidiaries AGI Holdings LLC, AGI North America LLC, AGI Polymatrix Holdings LLC, and AGI Polymatrix LLC, purchased the AGI media and entertainment packaging businesses from MeadWestvaco Corporation (“MeadWestvaco”) on September 30, 2010. On December 31, 2011, the Parent, through its newly formed wholly-owned subsidiary, Shorewood Packaging Holdings LLC, purchased the United States (“US”) paper and paperboard packaging operations of Shorewood Packaging Corporation (“Shorewood”) from the International Paper Company (“International Paper”). Shorewood was immediately converted to a limited liability company. On January 1, 2014, the Parent merged AGI North America LLC into Shorewood Packaging LLC (the surviving entity following the conversion of Shorewood Packaging Corporation into a limited liability company as described in the preceding sentence) and AGI Holdings LLC into Shorewood Packaging Holdings LLC. On January 15, 2014, Shorewood Packaging LLC changed its name to AGI-Shorewood Group US LLC.
The Parent and its wholly-owned subsidiaries specialize in innovative printing and packaging solutions for consumer and personal care products, technology and telecommunications, Blu-ray discs, DVDs, music, and video games.
NOTE 2—Basis of Presentation and Principles of Consolidation
The accompanying carve-out financial statements present the financial position, results of operations, invested capital, and cash flows of the US Folding Carton and Lithographic Printing Business. During the nine month period ended September 30, 2014, the activities of the US Folding Carton and Lithographic Printing Business included certain assets, liabilities, and operations of AGI North America LLC, AGI Holdings LLC, Shorewood Packaging LLC, Shorewood Packaging Holdings LLC, and AGI-Shorewood Group US LLC (f/k/a Shorewood Packaging LLC). All intercompany balances and transactions have been eliminated in consolidation.
The Company has provided nine month financial information in lieu of twelve month information to satisfy the SEC reporting requirements.
These carve-out financial statements were extracted from the Parent’s consolidated financial statements as of September 30, 2014 and for the nine month period ended September 30, 2014. The assets, liabilities, and results of operations of the Parent’s Danville, Virginia, Elizabethtown, Kentucky, and Pittsfield, Massachusetts operations and have been excluded from these financial statements.
The US Folding Carton and Lithographic Printing Business and the Parent’s other businesses had access to the Parent’s debt facilities for liquidity to support their operations during the periods presented in the accompanying carve-out financial statements. The US Folding Carton and Lithographic Printing Business, which had been generating net cash outflows, had a need for liquidity to finance its operations which was principally obtained via borrowings on the Parent’s debt facilities and reductions in the working capital of the US Folding Carton and Lithographic Printing Business while the Parent’s other businesses had cash flows which would not have resulted in the need to be supported by the Parent’s debt facilities. Accordingly, the accompanying carve-out financial
F-124
Table of Contents
US FOLDING CARTON AND LITHOGRAPHIC PRINTING BUSINESS OF ATLAS AGI HOLDINGS
LLC AUDITED CARVE-OUT FINANCIAL STATEMENTS
NOTES TO CARVE-OUT FINANCIAL STATEMENTS
statements of the US Folding Carton and Lithographic Printing Business include all of the Parent’s debt facilities which existed during the periods presented which management determined were all related to the activities of the US Folding Carton and Lithographic Printing Business.
These carve-out financial statements are prepared in accordance with accounting principles generally accepted in the US and reflect assumptions and allocations made by management to depict the US Folding Carton and Lithographic Printing Business on a basis that management believes is reasonable. As a result, the accompanying carve-out financial statements included herein may not necessarily be indicative of the US Folding Carton and Lithographic Printing Business’s financial position, results of operations or cash flows had the US Folding Carton and Lithographic Printing Business operated as a stand-alone entity during the periods presented.
The carve-out financial statements of the US Folding Carton and Lithographic Printing Business include all sales, costs, assets and liabilities directly attributable to the US Folding Carton and Lithographic Printing Business. The Parent had an allocation agreement with the AGI Global Holdings Coöperatief U.A., Coöp (“Coöp”) which allowed the Parent to allocate certain costs and expenses which mutually benefited the US Folding Carton and Lithographic Printing Business, the Parent’s other businesses not included in these carved-out financial statements, and the Coöp to each of those businesses. See Note 12 for amounts charged to the Parent’s other businesses not included in these carve-out financial statements and amounts charged to the Coöp. Management believes the allocation of these costs was made using assumptions and methodologies which were reasonable. However, such allocations may result in a level of actual expense that may not be indicative of the actual level of expense that would have been incurred by the US Folding Carton and Lithographic Printing Business if it had operated as a stand-alone entity during the period presented.
NOTE 3—Summary of Significant Accounting Policies
Use of Estimates
The preparation of the carve-out financial statements in conformity with accounting principles generally accepted in the US requires management to make estimates and assumptions that affect the amounts reported in the carve-out financial statements and accompanying notes. Significant judgments and estimates relate to assessing the impairment of long lived assets, working capital reserves and accruals, capitalized inventory variances, and the allocation of costs to the US Folding Carton and Lithographic Printing Business, the Parent’s other businesses, and the Coöp. Actual results could differ from those estimates.
Cash
Cash and cash equivalents consist of cash and highly liquid short-term investments with original maturities of three months or less.
Accounts Receivable
Accounts receivable principally consists of receivables from the sale of packaging. The US Folding Carton and Lithographic Printing Business evaluates the collectability of its receivables and records the amount that it reasonably believes will be collected. Amounts determined to be a collection risk are immediately reserved against the gross receivable balance with the offset recorded to bad debt expense. The allowance for doubtful accounts as of September 30, 2014, was $285.
F-125
Table of Contents
US FOLDING CARTON AND LITHOGRAPHIC PRINTING BUSINESS OF ATLAS AGI HOLDINGS
LLC AUDITED CARVE-OUT FINANCIAL STATEMENTS
NOTES TO CARVE-OUT FINANCIAL STATEMENTS
Inventories
Inventories are recorded at the lower of cost or market using the first-in, first-out (“FIFO”) cost method and include all costs directly associated with manufacturing products, including materials, labor and manufacturing overhead. The estimated market value is based on assumptions for future demand and related pricing. If market value is determined by management to be lower than carrying value, a reduction in the carrying value of inventory is recorded with the offset recorded to cost of goods sold in the period.
Revenue Recognition
The US Folding Carton and Lithographic Printing Business recognizes revenue as title to the products are transferred to customers, generally upon product shipment based on shipping terms when persuasive evidence of an arrangement exists and the selling price is fixed or determinable and collection is reasonably assured. Shipping and handling billings to customers are included in net revenues, with related costs recognized in cost of goods sold. Certain customers are offered rebates based on total volumes. Rebates are included in net revenues.
Long-lived Assets
Property, plant and equipment includes buildings and manufacturing equipment which are stated at cost, and depreciated over their estimated useful lives (2 to 25 years) using the straight-line method. Leasehold improvements are amortized over the lease term or, if shorter, the useful lives of the improvements. Maintenance, minor replacements and repairs are charged to expense as incurred. When property, plant, and equipment are retired or sold, the net carrying amount is eliminated with any gain or loss on disposal classified within other income (expense) excluding disposals associated with restructuring activities.
Intangible assets, which include customer relationships and trade names, were recorded at fair value on their acquisition date and are amortized on a straight-line basis over their estimated useful lives, ranging from 6 to 15 years.
Impairment of Long-Lived Assets
Finite-lived intangibles and other long-lived assets are reviewed for impairment whenever events or changes in circumstances indicate that the carrying amount of any long-lived asset may not be fully recoverable. In the event that facts and circumstances indicate that the carrying amount of any long-lived assets may be impaired, an evaluation of recoverability is performed. If an evaluation were required, the estimated future undiscounted cash flows associated with the asset (or group of assets) would be compared to the assets’ (or group of assets’) carrying amount to determine if a write-down to fair value is required. Any impairment loss would adjust the carrying value to the assets’ fair value.
During the year ended December 31, 2013, the US Folding Carton and Lithographic Printing Business recorded a $1,732 charge related to the closure of its Indianapolis, Indiana facility. The planned closure was publically announced in January 2014. The subsequent sale of assets of the Indianapolis, Indiana facility resulted in additional income of $1,290 being recognized during the nine month period ended September 30, 2014. The remaining assets of the Indianapolis, Indiana facility which are expected to be disposed through sale are reflected as assets held for sale in the accompanying carve-out balance sheet at September 30, 2014 at an estimated fair value of $1,568, net of estimated disposal costs, which is comprised primarily of equipment, land, and building.
F-126
Table of Contents
US FOLDING CARTON AND LITHOGRAPHIC PRINTING BUSINESS OF ATLAS AGI HOLDINGS
LLC AUDITED CARVE-OUT FINANCIAL STATEMENTS
NOTES TO CARVE-OUT FINANCIAL STATEMENTS
Deferred Financing Fees
Deferred financing fees include debt discounts and issuance costs which consist of amounts paid to lenders and third parties, respectively, in connection with obtaining debt financing. These costs are capitalized and amortized utilizing the effective interest method, over the term of the respective debt instruments to interest expense. On the accompanying carve-out balance sheets, the debt issuance costs are classified in other assets and the debt discounts are classified as a reduction to long-term borrowings. Amortization expense for deferred financing fees for the nine month period ended September 30, 2014 was $334. As of September 30, 2014 the gross carrying amount of deferred financial fees was $2,161 and the total accumulated amortization was $1,048.
Fair Value of Financial Instruments
The fair values of the US Folding Carton and Lithographic Printing Business’s financial instruments reflect the amounts that would be received to sell an asset or paid to transfer a liability in an orderly transaction between market participants at the measurement date (exit price). The fair value estimates presented in this report are based on information available to the US Folding Carton and Lithographic Printing Business as of September 30, 2014.
The US Folding Carton and Lithographic Printing Business has implemented the authoritative guidance for fair value measurements for all financial assets and liabilities and for non-financial assets and liabilities measured at fair value on a recurring basis. The guidance defines fair value as the price that would be received to sell an asset or paid to transfer a liability in the principal or most advantageous market in an orderly transaction between market participants at the measurement date. It also establishes a three level hierarchy that prioritizes the inputs used to measure fair value. The three levels of the hierarchy are defined as follows:
Level 1—Inputs are unadjusted quoted prices in active markets for identical assets or liabilities that the US Folding Carton and Lithographic Printing Business has the ability to access at the measurement date.
Level 2—Observable inputs other than quoted prices included in Level 1, including quoted prices for similar assets or liabilities in active markets, quoted prices for identical assets or liabilities in inactive markets, inputs other than quoted prices that are observable for the asset or liability and inputs derived principally from or corroborated by observable market data.
Level 3—Unobservable inputs reflecting the US Folding Carton and Lithographic Printing Business’s own assumptions about the inputs that market participants would use in pricing the asset or liability based on the best information available.
The US Folding Carton and Lithographic Printing Business’s financial instruments include cash, trade receivables, trade payables and long-term debt. The carrying amounts of cash, trade receivables and trade payables approximate fair value because of the short maturity of these instruments. The Parent’s debt obligations are not actively traded, and as a result no published fair value is available. The Parent estimated the fair value of long-term debt (Level 2) to be consistent with the aggregated carrying values at September 30, 2014 based on a sensitivity analysis for the interest rates using Level 2 inputs.
Income Taxes
Income tax obligations in the accompanying financial statements of the US Folding Carton and Lithographic Printing Business have been prepared on a separate-return basis as if the operations of the US Folding Carton and
F-127
Table of Contents
US FOLDING CARTON AND LITHOGRAPHIC PRINTING BUSINESS OF ATLAS AGI HOLDINGS
LLC AUDITED CARVE-OUT FINANCIAL STATEMENTS
NOTES TO CARVE-OUT FINANCIAL STATEMENTS
Lithographic Printing Business had been a stand-alone entity, on the same basis of presentation as the Parent had applied, during all periods presented. The Parent is a limited liability company (“LLC”) and is treated as a partnership for US federal and state income tax purposes. As a partnership for income tax purposes, the entity is not taxed and members of the Parent are taxed on the Parent’s flow through income or loss. Accordingly, the Parent and the US Folding Carton and Lithographic Printing Business do not record a provision for US federal income taxes.
In certain states, LLCs are considered taxable entities for state income tax purposes. The US Folding Carton and Lithographic Printing Business operates in two such states—Tennessee and Kentucky—which results in the US Folding Carton and Lithographic Printing Business recognizing state income tax obligations for its activities in these states. The amount of income taxes the Parent and the US Folding Carton and Lithographic Printing Business pays is subject to ongoing audits by income taxing authorities. The periods subject to examination for the Parent’s various state income tax returns are 2011 through 2013.
The US Folding Carton and Lithographic Printing Business evaluates uncertain income tax positions to determine if it is “more likely than not” that they would be sustained upon examination. The US Folding Carton and Lithographic Printing Business will record a liability for uncertain tax positions when such uncertainties fail to meet the “more likely than not” threshold and includes management’s assessment of relevant risk and the facts and circumstances existing at that time. The US Folding Carton and Lithographic Printing Business recognizes interest and penalties, if any, related to unrecognized tax benefits as well as tax-related interest and penalties as a component of income tax expense.
Income taxes are accounted for using the asset and liability method that requires the recognition of deferred tax assets and liabilities based on the difference between the financial statement and tax basis of assets and liabilities using enacted tax rates in effect in the years in which the differences are expected to reverse. Valuation allowances are provided if based upon the weight of available evidence, it is more likely than not that some or all of the deferred tax assets will not be realized.
NOTE 4—Inventories
The following table presents the components of inventories as of September 30, 2014:
| September 30, 2014 | ||||
| Raw materials |
$ | 8,278 | ||
| Work-in-process |
3,124 | |||
| Finished goods |
7,199 | |||
|
|
|
|||
| Inventories |
$ | 18,601 | ||
|
|
|
|||
F-128
Table of Contents
US FOLDING CARTON AND LITHOGRAPHIC PRINTING BUSINESS OF ATLAS AGI HOLDINGS
LLC AUDITED CARVE-OUT FINANCIAL STATEMENTS
NOTES TO CARVE-OUT FINANCIAL STATEMENTS
NOTE 5—Property, Plant and Equipment
The following table presents the components of property, plant and equipment as of September 30, 2014:
| September 30, 2014 | Useful Life (Years) | |||||||
| Land |
$ | 1,540 | n/a | |||||
| Building |
2,164 | Up to 25 | ||||||
| Leasehold improvements |
891 | Up to 10 | ||||||
| Furniture and fixtures |
388 | 3 to 5 | ||||||
| Machinery and equipment |
11,343 | 2 to 12 | ||||||
| Computers and software |
783 | 2 to 5 | ||||||
|
|
|
|||||||
| 17,109 | ||||||||
| Less: accumulated depreciation |
(6,489 | ) | ||||||
|
|
|
|||||||
| 10,620 | ||||||||
| Construction in-progress |
984 | |||||||
|
|
|
|||||||
| Property, Plant and Equipment, Net |
$ | 11,604 | ||||||
|
|
|
|||||||
Depreciation expense totaled $1,990 for the nine month period ended September 30, 2014.
NOTE 6—Intangible Assets
The following table presents intangible assets as of September 30, 2014:
| September 30, 2014 |
Useful Life | |||||||
| Existing customer relationships |
$ | 500 | 15 years | |||||
| Trade names |
220 | 6 years | ||||||
|
|
|
|||||||
| 720 | ||||||||
| Less: accumulated depreciation |
(280 | ) | ||||||
|
|
|
|||||||
| Intangible Assets, Net |
$ | 440 | ||||||
|
|
|
|||||||
Amortization expense totaled $52 for the nine month period ended September 30, 2014. Amortization expense for intangible assets is expected to be $18 for the remainder of 2014 and $70, $61, $33, $33, and $33 for the following five years. Thereafter, amortization expense for intangibles is expected to be $192.
NOTE 7—Above and Below Market Leases
In connection with the Shorewood acquisition, the US Folding Carton and Lithographic Printing Business recognized an asset of $335 for certain below market leases. The asset is included in other assets on the carve-out balance sheet and is amortized using the straight-line method as an increase to expense over the remaining term of the leases assumed which expire at various dates through 2016. Amortization for the nine month period ended September 30, 2014 was $50.
F-129
Table of Contents
US FOLDING CARTON AND LITHOGRAPHIC PRINTING BUSINESS OF ATLAS AGI HOLDINGS
LLC AUDITED CARVE-OUT FINANCIAL STATEMENTS
NOTES TO CARVE-OUT FINANCIAL STATEMENTS
NOTE 8—Accrued Expenses, Insurance Reserves, Customer Incentives, and Warranty Reserves
Accrued Expenses
Certain expenses which are incurred, but not yet paid are estimated and accrued at each balance sheet date. The following table presents these accruals which are included in accrued expenses on the carve-out balance sheets as of September 30, 2014:
| September 30, 2014 | ||||
| Ink and other materials |
$ | 1,584 | ||
| Customer rebates |
1,551 | |||
| Real estate taxes |
1,365 | |||
| Workers’ compensation and health insurance |
923 | |||
| Freight |
908 | |||
| Warranty reserve |
607 | |||
| Restructuring reserve |
543 | |||
| Corporate card program |
513 | |||
| Audit fees |
407 | |||
| All other |
1,952 | |||
|
|
|
|||
| Total |
$ | 10,353 | ||
|
|
|
|||
Insurance Reserves
The Parent and its wholly-owned subsidiaries are self-insured for its workers’ compensation insurance program for all employees on its payroll up to certain retention limits. The costs of this workers’ compensation insurance program are recorded in the period incurred. The accompanying carve-out financial statements also reflect an accrued liability for the estimated claims to be paid in future periods which occurred prior to the balance sheet dates related to activities of employees of the of the US Folding Carton and Lithographic Printing Business. As of September 30, 2014, the estimated liability for such claims is $489.
The Parent and its wholly-owned subsidiaries are also self-insured for certain healthcare programs offered to its employees. During the nine month period ended September 30, 2014, the Parent and its wholly-owned subsidiaries are liable for medical claims up to $300 per eligible employee annually. The costs of these healthcare programs are recorded in the period incurred. The accompanying carve-out financial statements also reflect an accrued liability for the estimated liability arising from incurred, but not reported, claims for employees of the US Folding Carton and Lithographic Printing Business at September 30, 2014 of $434.
Customer Incentives
The US Folding Carton and Lithographic Printing Business enters into incentive arrangements with customers in the ordinary course of business. Payments under these arrangements are capitalized and amortized over the life of the arrangement if the arrangement permits recovery upon termination and it is probable the customer will make purchases from the US Folding Carton and Lithographic Printing Business in excess of the up-front consideration paid to the customer, if not, payments are immediately recognized as expense in the current period. Any obligations under the arrangements for future payments are recognized if the US Folding Carton and Lithographic Printing Business believes achievement of the milestone necessary to trigger the payment was probable at any time during the duration of the arrangement. At September 30, 2014, the US Folding Carton and
F-130
Table of Contents
US FOLDING CARTON AND LITHOGRAPHIC PRINTING BUSINESS OF ATLAS AGI HOLDINGS
LLC AUDITED CARVE-OUT FINANCIAL STATEMENTS
NOTES TO CARVE-OUT FINANCIAL STATEMENTS
Lithographic Printing Business recognized other assets of $682, and liabilities of $0, related to these arrangements. During the nine month period ended September 30, 2014, the US Folding Carton and Lithographic Printing Business recognized $884, as an offset to revenue related to these arrangements.
Warranty Reserves
Estimated warranty costs are accrued at the time of shipment based on historical warranty claims experience. The following represents a reconciliation of changes in the warranty reserve:
| Nine Month Period Ended September 30, 2014 |
||||
| Warranty Reserve—Beginning |
$ | 509 | ||
| Warranty claims settled |
(1,821 | ) | ||
| Provision for warranty |
1,920 | |||
|
|
|
|||
| Warranty Reserve—Ending |
$ | 608 | ||
|
|
|
|||
NOTE 9—Notes Payable and Long-Term Debt
Throughout all periods, the US Folding Carton and Lithographic Printing Business had a need for liquidity to finance its operations while the Parent’s other businesses had cash flows which would not have resulted in the need to be supported by the Parent’s debt facilities. Accordingly, the Parent’s debt facilities which existed during the periods presented all related to the activities of the US Folding Carton and Lithographic Printing Business.
Notes payable and long-term debt, related to the US Folding Carton and Lithographic Printing Business, consisted of the following as of September 30, 2014:
| September 30, 2014 | ||||
| Revolving line of credit |
$ | 40,461 | ||
| Less: Current maturities |
(40,461 | ) | ||
|
|
|
|||
| Total Long-Term Debt |
$ | — | ||
|
|
|
|||
Revolving Line of Credit
On March 27, 2012, acting through its agent, Wells Fargo Capital Finance, LLC, the Parent executed a senior secured credit facility (“Credit Facility”) with various lenders to borrow up to $70,000 utilizing a $60,000 revolving credit facility and a $10,000 machinery and equipment sub-line secured by the assets of the Parent. On July 17, 2013, the sublimit on the borrowing base was increased to $17,500 and the interest rates were lowered. The Credit Facility carries a variable interest rate based on LIBOR or prime plus a margin of .75% to 2.75% based on excess availability on the revolving credit facility and the machinery and equipment sub-line. An unused revolver fee, based on average monthly usage, equal to 0.375% to 0.50% of the unused portion of the Credit Facility is payable monthly in arrears. Per the Credit Agreement, the Fixed Charge Coverage Ratio, measured on a month-end basis, is required to be at least 1.10:1.00 on any date on which either (a) Excess Availability is less than $8,000 or (b) Excess Availability has been less than $10,000 for three consecutive business days. During the nine month period ended September 30, 2014, availability was in excess of the levels required to trigger the application of the financial covenant. As of September 30, 2014, remaining availability on
F-131
Table of Contents
US FOLDING CARTON AND LITHOGRAPHIC PRINTING BUSINESS OF ATLAS AGI HOLDINGS
LLC AUDITED CARVE-OUT FINANCIAL STATEMENTS
NOTES TO CARVE-OUT FINANCIAL STATEMENTS
the Credit Facility was $15,322. On September 9, 2014, the lender provided a waiver which granted a grace period until December 8, 2014 for the Parent to settle a lien made by State of Illinois. Subsequent to September 30, 2014, the Company reached a settlement with the State of Illinois and the amount was paid in full and the lien was released. The Parent has the ability to lock in borrowings for fixed amounts, term and rate under LIBOR contracts. As of September 30, 2014, the interest rate on outstanding 30-day LIBOR contracts ranged from 2.407% to 2.907%, and the interest rate on prime borrowings ranged from 4.50% to 5.00% as of September 30, 2014. The weighted average interest rate on outstanding borrowings under the Credit Agreement was 3.07% as of September 30, 2014. Also as of September 30, 2014, there were outstanding letters of credit in the amount of $714, which reduced the amount of availability under the revolver. The revolver has an expiration date of March 27, 2017.
Substantially all assets of the Parent are placed as collateral under the Credit Facility. With the exception of required daily operating balances, all funds are swept daily against the Credit Facility. In addition, the credit facility contains a subjective acceleration clause. As a result, these borrowings are classified as current on the carve-out financial statements.
NOTE 10—Commitments and Contingencies
The US Folding Carton and Lithographic Printing Business leases a variety of assets for use in its operations. Leases for offices and manufacturing facilities generally contain options which allow the US Folding Carton and Lithographic Printing Business to extend lease terms. Minimum rental payments under operating leases that have non-cancelable terms in excess of twelve (12) months, as of September 30, 2014, are as follows:
| September 30, 2014 | ||||
| Remainder of 2014 |
$ | 2,043 | ||
| 2015 |
3,220 | |||
| 2016 |
1,607 | |||
| 2017 |
946 | |||
| 2018 |
891 | |||
| Thereafter |
3,912 | |||
|
|
|
|||
| Total |
$ | 12,619 | ||
|
|
|
|||
On April 1, 2014, the US Folding Carton and Lithographic Printing Business resolved certain contingencies related to a prior transaction which resulted in proceeds and a gain of approximately $1,000 being recognized as other income during the nine month period ended September 30, 2014.
NOTE 11—Invested Capital
The net assets of the US Folding Carton and Lithographic Printing Business are represented by the net investment in the business made by its parent, Atlas AGI Holdings LLC which is presented as total invested capital in the accompanying carve-out statement of invested capital. Total invested capital comprises share capital, additional paid-in capital, and retained earnings (losses) of the US Folding Carton and Lithographic Printing Business.
Net contributions by the Parent to the US Folding Carton and Lithographic Printing Business during the reporting period are included in the accompanying carve-out statement of invested capital. All significant intercompany transactions between the US Folding Carton and Lithographic Printing Business, the Parent, and the Parent’s
F-132
Table of Contents
US FOLDING CARTON AND LITHOGRAPHIC PRINTING BUSINESS OF ATLAS AGI HOLDINGS
LLC AUDITED CARVE-OUT FINANCIAL STATEMENTS
NOTES TO CARVE-OUT FINANCIAL STATEMENTS
other businesses, have been included in these financial statements and are considered to be effectively settled for cash at the time the transaction is recorded. The total net effect of the settlement of these intercompany transactions is reflected as a financing activity in the accompanying carve-out statement of cash flows.
NOTE 12—Related Party Transactions
Management Services Agreement
On September 30, 2010, the Parent entered into a management services agreement (“MSA”) with Atlas Holdings LLC, an affiliate of TopCo, the Parent’s sole equity member. Under the MSA, the Parent and its wholly-owned subsidiaries were provided with various administrative and management services in exchange for an annual fee commencing November 1, 2010. The MSA’s initial term ends on September 30, 2015 with automatic five year renewal terms commencing thereafter. Either party can terminate the management services agreement upon delivering one year written notice and subject to certain terms and conditions. During the nine month period ended September 30, 2014, the US Folding Carton and Lithographic Printing Business expensed and paid $375 related to the MSA.
Distributions
The Parent generally pays distributions to its members in an amount sufficient for them to fund their tax obligations related to taxable income distributed to them. Tax distributions to members are included in net contributions to (distributions from) the Parent in the statement of invested capital for the nine month period ended September 30, 2014.
Product Sales
The US Folding Carton and Lithographic Printing Business sells products to parties under the common ownership of TopCo. During the nine month period ended September 30, 2014, the US Folding Carton and Lithographic Printing Business sold $1,504, to parties under common ownership of TopCo.
Machinery and Equipment Sales
The US Folding Carton and Lithographic Printing Business sold machinery and equipment to parties under the common ownership of TopCo for proceeds $2,231 which resulted in a gain on sale of $1,230 being recognized within other income during the nine month period ended September 30, 2014. This machinery and equipment had been in use at the US Folding Carton and Lithographic Printing Business’s Indianapolis, Indiana facility which ceased substantially all operations in May 2014.
Cost Allocations
On January 1, 2012, the Parent entered into an allocation agreement with the Coöp, an affiliate of TopCo. Under the allocation agreement, certain costs and expenses which mutually benefited the US Folding Carton and Lithographic Printing Business, the Parent’s remaining businesses, and the Coöp, were allocated amongst the parties. During the nine month period ended September 30, 2014, the US parent incurred information technology, executive operations and human resources management, administrative, marketing, insurance, purchasing, finance, accounting and legal costs, comprised of the costs of salaries and benefits, professional and other third-party costs, that mutually benefited the US folding carton and lithographic printing business operations, the
F-133
Table of Contents
US FOLDING CARTON AND LITHOGRAPHIC PRINTING BUSINESS OF ATLAS AGI HOLDINGS
LLC AUDITED CARVE-OUT FINANCIAL STATEMENTS
NOTES TO CARVE-OUT FINANCIAL STATEMENTS
operations of the Parent’s other businesses, and the operations of the Coöp. In the accompanying carve-out financial statements, a portion of these mutually beneficial costs have been allocated to the Parent’s other businesses, and a portion of the remaining mutually beneficial costs have been allocated from the US Folding Carton and Lithographic Printing Business to the Coöp based on direct usage or benefit where identifiable, with the remainder allocated on the basis of revenues, headcount, or other measures.
| Nine Month Period Ended September 30, 2014 |
||||
| Total mutually beneficial costs |
$ | 19,509 | ||
| Less: Allocations made to Coöp |
(6,155 | ) | ||
| Allocations made to Parent’s other businesses |
(941 | ) | ||
|
|
|
|||
| Mutually Beneficial Costs Attributed to the US Folding Carton and Lithographic Printing Business |
$ | 12,413 | ||
|
|
|
|||
The allocation of these mutually beneficial costs to the Coöp was classified as a reduction of selling, general and administrative expenses in the accompanying carve-out financial statements. The allocation agreement expires after fifteen (15) years or upon a change of control of Topco or Coöp. The amounts that would have been or will be incurred by the US Folding Carton and Lithographic Printing Business for these activities on a stand-alone basis could differ from the residual amounts recognized by the US Folding Carton and Lithographic Printing Business following the allocation of a portion of these costs to the Coöp and the Parent’s other businesses.
As a result of all the related party transactions referred to above occurring during the nine month period ended September 30, 2014 there was a payable due to related parties of $2,069.
NOTE 13—Restructuring Costs
Following the acquisitions of the AGI media and entertainment packaging businesses from MeadWestvaco and paper and paperboard packaging operations in the US of Shorewood, the US Folding Carton and Lithographic Printing Business engaged in a series of restructuring activities intended to reduce costs and become more competitive in the marketplace. During the nine month period ended September 30, 2014, the US Folding Carton and Lithographic Printing Business incurred the following restructuring costs:
| Nine Month Period Ended September 20, 2014 | ||||||||||||||||
| Melrose Park, Illinois Facility |
Indianapolis, Indiana Facility |
Other Programs |
Total | |||||||||||||
| Severance the termination benefits |
$ | (135 | ) | $ | 1,794 | $ | 683 | $ | 2,342 | |||||||
| Asset impairment charges |
— | (1,290 | ) | — | (1,290 | ) | ||||||||||
| Other exit and restructuring costs |
— | 3,535 | 67 | 3,602 | ||||||||||||
|
|
|
|
|
|
|
|
|
|||||||||
| Total |
$ | (135 | ) | $ | 4,039 | $ | 750 | $ | 4,654 | |||||||
|
|
|
|
|
|
|
|
|
|||||||||
F-134
Table of Contents
US FOLDING CARTON AND LITHOGRAPHIC PRINTING BUSINESS OF ATLAS AGI HOLDINGS
LLC AUDITED CARVE-OUT FINANCIAL STATEMENTS
NOTES TO CARVE-OUT FINANCIAL STATEMENTS
A description of each of the significant restructuring programs conducted by the Company during the nine month period ended September 30, 2014 follows.
Melrose Park, Illinois facility
The US Folding Carton and Lithographic Printing Business has conducted a series of targeted restructurings at its Melrose Park, Illinois facility since its acquisition in order to optimize its manufacturing capabilities at the facility and across other facilities in the US Folding Carton and Lithographic Printing Business. Total restructuring costs incurred by the Company to conduct these restructuring programs were $2,774, of which ($135) was recorded during the nine month period ended September 30, 2014. The Company will continue to optimize its manufacturing capabilities at the facility and across other facilities in the US Folding Carton and Lithographic Printing Business in future periods which may result in future restructurings at this facility the costs of which cannot be estimated.
Indianapolis, Indiana facility closure
The US Folding Carton and Lithographic Printing Business has conducted a series of targeted restructurings at its facility in Indianapolis, Indiana since its acquisition. These targeted restructurings were part of its strategy to optimize its manufacturing capabilities across the US Folding Carton and Lithographic Printing Business.
On January 15, 2014, the US folding carton and lithographic printing business publically announced it would close its facility in Indianapolis, Indiana and all operations at the facility were ceased by September 2014. Total restructuring costs incurred to conduct the restructuring and closure of its facility in Indianapolis, Indiana were $7,008, of which $4,039 was incurred during the nine month period ended September 30, 2014. The Company has estimated it will incur and has accrued as of September 30, 2014 an additional $62 to finalize the closure of the facility which is expected to be finalized by December 2015.
Other restructuring programs
In addition to the restructuring efforts ongoing at the manufacturing facilities described above, the US Folding Carton and Lithographic Printing Business has been conducting terminations of various executive, selling, general, and administrative personnel during the nine month period ended September 30, 2014. Total restructuring costs incurred to conduct the restructuring of its various executive, selling, general, and administrative functions was $3,575, of which $750 was incurred during the nine month period ended September 30, 2014. The Company has estimated it will incur and has accrued as of September 30, 2014 an additional $481 for other restructuring programs currently in process.
The following table shows movements in the liability for restructuring costs recognized by the US Folding Carton and Lithographic Printing Business during the nine month period ended September 30, 2014
| September 30, 2014 | ||||
| Balance—December 31, 2013 |
$ | 427 | ||
| Restructuring expenses incurred and charged to expense |
4,789 | |||
| Amounts paid or settled |
(4,538 | ) | ||
| Adjustments to previously recognized amounts |
(135 | ) | ||
|
|
|
|||
| Balance—September 30, 2014 |
$ | 543 | ||
|
|
|
|||
F-135
Table of Contents
US FOLDING CARTON AND LITHOGRAPHIC PRINTING BUSINESS OF ATLAS AGI HOLDINGS
LLC AUDITED CARVE-OUT FINANCIAL STATEMENTS
NOTES TO CARVE-OUT FINANCIAL STATEMENTS
NOTE 14—Concentrations
Sales by the US Folding Carton and Lithographic Printing Business to its top four unaffiliated customers were approximately 8%, 7%, 6%, and 6% of its net revenues during the nine month period ended September 30, 2014. Accounts receivable from its top four unaffiliated customers represented approximately 5%, 7%, 9%, and 7% of its accounts receivable at September 30, 2014. In addition, there are several customers that relate to a supply arrangement entered into during the 2014 fiscal period with a third party that collectively account for 10% of aggregate revenues and 17% of accounts receivable during the nine month period ended and as of September 30, 2014, respectively.
NOTE 15—Employee Benefit Plans
The Parent sponsors a defined contribution retirement plan for its employees and those of its wholly-owned subsidiaries, which allows participants to make contributions by salary reduction pursuant to Section 401(k) of the Internal Revenue Code. Employees of the US Folding Carton and Lithographic Printing Business are eligible to participate in the plan sponsored by the Parent. The plan sponsored by the Parent matches employee contributions at 100% of employee contributions for the first 3% of total salary and 60% of employee contributions on the subsequent 3%. For the nine month period ended September 30, 2014, the Parent paid $1,086, in matching contributions to employees of the US Folding Carton and Lithographic Printing Business.
As a means to align management’s incentives with those of the investors of the Parent, the Parent has adopted an annual Short Term Incentive Plan (“STIP program”) and Long Term Incentive Plan (“LTIP program”) for certain managers and key employees.
Short Term Incentive Plan
The STIP program allocates a portion of the annual Economic Value that is generated by the Parent and its wholly-owned subsidiaries to compensate certain managers and key employees. Economic Value is defined by the STIP program to be earnings before interest, taxes and depreciation and amortization (“EBITDA”), less capital spending, less a charge for capital employed in the business. EBITDA is adjusted from time-to-time to eliminate the effects of one-time or non-operational income or charges.
The amount of expense related to the STIP program recognized in the accompanying carve-out financial statements, related to participants in the STIP program of the US Folding Carton and Lithographic Printing Business, for the nine month period ended September 30, 2014 was ($10), and the related liability at September 30, 2014 was $38.
Long Term Incentive Plan
Once the initial amount of capital invested in the Parent is returned to its member, the LTIP program allocates a portion of the distributable earnings to the Parent’s member to certain managers and key employees as cash compensation. The amount of expense related to the LTIP program recognized in the accompanying carve-out financial statements, related to participants in the LTIP program of the US Folding Carton and Lithographic Printing Business, for the nine month period ended September 30, 2014 was ($32), and the related liability at September 30, 2014 was $0.
F-136
Table of Contents
US FOLDING CARTON AND LITHOGRAPHIC PRINTING BUSINESS OF ATLAS AGI HOLDINGS
LLC AUDITED CARVE-OUT FINANCIAL STATEMENTS
NOTES TO CARVE-OUT FINANCIAL STATEMENTS
NOTE 16—New Accounting Pronouncements
On April 10, 2014, the Financial Accounting Standards Board (“FASB”) issued Accounting Standards Update No. 2014-08 (“ASU-2014-08”), Reporting Discontinued Operations and Disclosures of Disposals of Components of an Entity, which changes the criteria for determining which disposals can be presented as discontinued operations and modifies related disclosure requirements. Under the new guidance, a discontinued operation is defined as a disposal of a component or group of components that is disposed of or is classified as held for sale and represents a strategic shift that has (or will have) a major effect on an entity’s operations and financial results, a business that upon acquisition qualifies as held for sale will also be a discontinued operation, and activities are no longer precluded from being presented as a discontinued operation if (i) there are operations and cash flows of the component that have not been eliminated from the reporting entity’s ongoing operations, or (ii) there is significant continuing involvement with a component after its disposal. ASU 2014-08 also introduces several new disclosures, including, but not limited to, a requirement to present in the statement of cash flows or disclose in a note either (i) total operating and investing cash flows for discontinued operations, or (ii) depreciation, amortization, capital expenditures, and significant operating and investing noncash items related to discontinued operations, additional disclosures when an entity retains significant continuing involvement with a discontinued operation after its disposal, including the amount of cash flows to and from a discontinued operation, and for disposals of individually significant components that do not qualify as discontinued operations, a disclosure of pre-tax earnings of the disposed component. ASU 2014-08 requires an entity to reclassify the assets and liabilities of a discontinued operation that are classified as held for sale or disposed of in the current period for the comparative periods presented in the statement of financial position
The guidance in ASU 2014-08 applies prospectively to new disposals and new classifications of disposal groups as held for sale after the effective date and is required to be adopted by public business entities in annual periods beginning on or after December 15, 2014, and interim periods within those annual periods. It is effective for all other entities, including non-public entities, in annual periods beginning on or after December 15, 2015, and interim periods beginning on or after December 15, 2015, with early adoption permitted.
In May 2014, the FASB issued ASU No. 2014-09, Revenue from Contracts with Customers (Topic 606)(“ASU 2014-09”). ASU 2014-09 is a new comprehensive standard for revenue recognition that is based on the core principle that revenue be recognized in a manner that depicts the transfer of goods or services to customers in an amount that reflects the consideration to which the entity expects to be entitled in exchange for those goods or services. Under the new standard, a good or service is transferred to the customer when (or as) the customer obtains control of the good or service, which differs from the risk and rewards approach under current guidance. The new standard provides guidance for transactions that were not previously addressed comprehensively, including service revenue and contract modifications, eliminates industry-specific revenue recognition guidance, including that for software, and requires enhanced disclosures about revenue. ASU 2014-09 affects any entity that either enters into contracts with customers to transfer goods or services or enters into contracts to transfer nonfinancial assets outside of the entity’s ordinary activities except for certain contracts within the scope of other standards (such as leases). Areas of potential change include, but are not limited to, units of accounting, the determination of the transaction price, the allocation of the transaction price to multiple goods and services, transfer of control, software licenses, and capitalization of contract costs.
In August 2014 the FASB issued Accounting Standards Update No. 2014-15, Presentations of Financial Statements—Going Concern (Subtopic 205-40): Disclosure of Uncertainties about an Entity’s Ability to Continue as a Going Concern, which is intended to define Management’s responsibility to evaluate whether
F-137
Table of Contents
US FOLDING CARTON AND LITHOGRAPHIC PRINTING BUSINESS OF ATLAS AGI HOLDINGS
LLC AUDITED CARVE-OUT FINANCIAL STATEMENTS
NOTES TO CARVE-OUT FINANCIAL STATEMENTS
there is substantial doubt about an organization’s ability to continue as a going concern and to provide related footnote disclosures as well as increasing consistency in the timing and content of footnote disclosures when the organization identifies conditions or events that raise substantial doubt. The amendments in the update are effective for the annual period ending after December 15, 2016, and for annual periods and interim periods thereafter. Early application is permitted.
Implementation of these recent accounting pronouncements is not expected to have a material effect on the US Folding Carton and Lithographic Printing Business’s carve-out financial statements.
NOTE 17—Subsequent Events
Subsequent to September 30, 2014, the Parent, AGI Global I B.V. and AGI-Shorewood Group US Holdings, LLC entered into a definitive agreement on November 2, 2014 for the sale of the Non-European and US Folding Carton and Lithographic Printing Business to Multi Packaging Solutions (“MPS”). These financial statements have been prepared and are being presented as of the close of business on September 30, 2014 prior to the expected acquisition by MPS upon the closing of the transaction.
F-138
Table of Contents
Financial Statements of the Non-European Folding
Carton and Lithographic Printing Business
of AGI Global Holdings Coöperatief U.A.
For the Nine Month Period Ended 30 September 2014
Table of Contents
NON-EUROPEAN FOLDING CARTON AND LITHOGRAPHIC PRINTING BUSINESS
AGI GLOBAL HOLDINGS COÖPERATIEF U.A.
Contents
| Page | ||||
| F-141 | ||||
| F-143 | ||||
| F-144 | ||||
| F-145 | ||||
| Carve-out combined statement of changes in parent’s net investment in the business |
F-146 | |||
| F-147 | ||||
| F-148 | ||||
Table of Contents
NON-EUROPEAN FOLDING CARTON AND LITHOGRAPHIC PRINTING BUSINESS
AGI GLOBAL HOLDINGS COÖPERATIEF U.A.
Independent Auditors’ Report on Carve-Out Combined Financial statements
To the directors and stockholders of AGI Global Holdings Coöperatief U.A.
We have audited the accompanying carve-out combined financial statements of the Non-European Folding Carton and Lithographic Printing Business of AGI Global Holdings Coöperatief U.A. (together “the Business”), a component of AGI Global Holdings Coöperatief U.A. as described in Note 1 Background and basis of preparation, which comprise the carve-out combined statement of financial position as at 30 September 2014 and the carve-out combined income statement, statement of comprehensive income, statement of changes in parent’s net investment in the business and statement of cash flows for the nine month period ended 30 September 2014.
Management’s Responsibility for the carve-out combined financial statements
Management is responsible for the preparation and fair presentation of the carve-out combined financial statements in accordance with International Financial Reporting Standards as issued by the International Accounting Standards Board (“IFRS”); this includes the design, implementation, and maintenance of internal control relevant to the preparation and fair presentation of the carve-out combined financial statements that are free from material misstatement, whether due to fraud or error.
Auditor’s Responsibility
Our responsibility is to express an opinion on the carve-out combined financial statements based on our audit. We conducted our audit in accordance with auditing standards generally accepted in the United States of America. Those standards require that we plan and perform the audit to obtain reasonable assurance about whether the carve-out combined financial statements are free from material misstatement.
An audit involves performing procedures to obtain audit evidence about the amounts and disclosures in the carve-out combined financial statements. The procedures selected depend on our judgment, including the assessment of the risks of material misstatement of the carve-out combined financial statements, whether due to fraud or error. In making those risk assessments, we consider internal control relevant to the Business’ preparation and fair presentation of the carve-out combined financial statements in order to design audit procedures that are appropriate in the circumstances, but not for the purpose of expressing an opinion on the effectiveness of the Business’ internal control. Accordingly, we express no such opinion. An audit also includes evaluating the appropriateness of accounting policies used and the reasonableness of significant accounting estimates made by management, as well as evaluating the overall presentation of the carve-out combined financial statements. We believe that the audit evidence we have obtained is sufficient and appropriate to provide a basis for our audit opinion.
Opinion
International Financial Reporting Standards as issued by the International Accounting Standards Board requires that financial statements be presented with comparative financial information. These carve-out combined financial statements have been prepared solely for the purpose of meeting the requirements of Rule 3-05 of Regulation S-X. Accordingly no comparative financial information is presented.
F-141
Table of Contents
NON-EUROPEAN FOLDING CARTON AND LITHOGRAPHIC PRINTING BUSINESS
AGI GLOBAL HOLDINGS COÖPERATIEF U.A.
In our opinion, except for the omission of comparative financial information as discussed in the preceding paragraph, the carve-out combined financial statements referred to above present fairly, in all material respects, the financial position of the Business as at 30 September 2014 and the results of its operations and its cash flows for the nine month period ending 30 September 2014 in accordance with IFRS.
International Financial Reporting Standards as adopted by the International Accounting Standards Board vary in certain respects from accounting principles generally accepted in the United States of America. The application of the latter would have affected the determination of profit for the nine months ended 30 September 2014 and the determination of parent’s net investment at 30 September 2014 to the extent summarised in Note 24 to the carve-out combined financial statements.
/s/ PricewaterhouseCoopers
PricewaterhouseCoopers LLP
Chartered Accountants
Southampton, United Kingdom
13 November 2014
F-142
Table of Contents
NON-EUROPEAN FOLDING CARTON AND LITHOGRAPHIC PRINTING BUSINESS
AGI GLOBAL HOLDINGS COÖPERATIEF U.A.
CARVE-OUT COMBINED STATEMENT OF FINANCIAL POSITION
As at 30 September 2014
| Note | As at 30 September 2014 |
|||||||
| €’000 | ||||||||
| Assets |
||||||||
| Non-current assets |
||||||||
| Property, plant and equipment |
6 | 29,735 | ||||||
| Intangible assets |
7 | 4,062 | ||||||
| Deferred income tax assets |
13 | 9,224 | ||||||
| Trade and other receivables |
8 | 474 | ||||||
| Total non-current assets |
43,495 | |||||||
| Current assets |
||||||||
| Inventories |
9 | 16,356 | ||||||
| Trade and other receivables |
8 | 45,120 | ||||||
| Income tax receivables |
1,543 | |||||||
| Cash and cash equivalents |
10 | 19,856 | ||||||
| 82,875 | ||||||||
| Assets of disposal group classified as held for sale |
23 | 3,845 | ||||||
| Total current assets |
86,720 | |||||||
| Total assets |
130,215 | |||||||
| Liabilities |
||||||||
| Non-current liabilities |
||||||||
| Related party borrowings |
22 | 21,414 | ||||||
| Other borrowings |
12 | 517 | ||||||
| Deferred income tax liabilities |
13 | 2,505 | ||||||
| Trade and other payables |
11 | 72 | ||||||
| Retirement benefit obligations |
19 | 3,614 | ||||||
| Total non-current liabilities |
28,122 | |||||||
| Current liabilities |
||||||||
| Trade and other payables |
11 | 43,648 | ||||||
| Current income tax liabilities |
381 | |||||||
| Other borrowings |
12 | 892 | ||||||
| Provisions for other liabilities and charges |
14 | — | ||||||
| 44,921 | ||||||||
| Liabilities of disposal group classified as held for sale |
24 | 1,032 | ||||||
| Total current liabilities |
45,953 | |||||||
| Total liabilities |
74,075 | |||||||
| Parent’s net investment in the business |
||||||||
| Parent’s net investment in the business |
56,140 | |||||||
| Total liabilities and parent’s net investment in the business |
130,215 | |||||||
The accompanying notes are an integral part of these carved-out combined financial statements.
F-143
Table of Contents
NON-EUROPEAN FOLDING CARTON AND LITHOGRAPHIC PRINTING BUSINESS
AGI GLOBAL HOLDINGS COÖPERATIEF U.A.
CARVE-OUT COMBINED INCOME STATEMENT
For the nine month period ended 30 September 2014
| Note | Period ended 30 September 2014 |
|||||||
| €’000 | ||||||||
| Continuing operations |
||||||||
| Revenue |
91,009 | |||||||
| Raw materials |
(45,720 | ) | ||||||
| Changes in inventories of finished goods and work in progress |
9 | (99 | ) | |||||
| Employee benefit expense |
15 | (22,395 | ) | |||||
| Depreciation, impairment and amortisation |
6, 7 | (2,163 | ) | |||||
| Other operating expenses |
(16,825 | ) | ||||||
| Other income |
5, 22 | 203 | ||||||
| Operating profit |
4,010 | |||||||
| Finance income |
17 | 119 | ||||||
| Finance costs |
17 | (733 | ) | |||||
| Finance costs—net |
17 | (614 | ) | |||||
| Profit before income tax |
3,396 | |||||||
| Tax expense |
18 | (1,104 | ) | |||||
| Profit for the period from continuing operations |
2,292 | |||||||
| Loss for the period from discontinued operations, net of tax |
23 | (2,232 | ) | |||||
| Profit for the period attributable to owners of the parent |
60 | |||||||
The accompanying notes are an integral part of these carved-out combined financial statements.
F-144
Table of Contents
NON-EUROPEAN FOLDING CARTON AND LITHOGRAPHIC PRINTING BUSINESS
AGI GLOBAL HOLDINGS COÖPERATIEF U.A.
CARVE-OUT COMBINED STATEMENT OF COMPREHENSIVE INCOME
For the nine month period ended 30 September 2014
| Note | Period ended 30 September 2014 |
|||||||
| €’000 | ||||||||
| Profit for the period |
60 | |||||||
| Other comprehensive income |
||||||||
| Items that will not be reclassified to profit and loss |
||||||||
| Re-measurements of the net defined benefit liability |
(234 | ) | ||||||
|
|
|
|||||||
| (234 | ) | |||||||
| Items that may be subsequently reclassified to profit or loss |
||||||||
| Currency translation differences |
1,230 | |||||||
|
|
|
|||||||
| 1,230 | ||||||||
| Other comprehensive income for the period |
996 | |||||||
| Total comprehensive income for the period attributable to owners of the parent |
1,056 | |||||||
| Total comprehensive income / (loss) attributable to owners of the parent arises from: |
||||||||
| continuing operations |
3,288 | |||||||
| discontinued operations |
23 | (2,232 | ) | |||||
|
|
|
|||||||
| 1,056 | ||||||||
The accompanying notes are an integral part of these carved-out combined financial statements.
F-145
Table of Contents
NON-EUROPEAN FOLDING CARTON AND LITHOGRAPHIC PRINTING BUSINESS
AGI GLOBAL HOLDINGS COÖPERATIEF U.A.
CARVE-OUT COMBINED STATEMENT OF CHANGES IN PARENT’S NET INVESTMENT IN THE BUSINESS
For the nine month period ended 30 September 2014
| Currency translation differences |
Invested capital |
Total | Non controlling interest |
Total parent’s net investment |
||||||||||||||||||
| Notes | €’000 | €’000 | €’000 | €’000 | €’000 | |||||||||||||||||
| Balance at 31 December 2013 |
(4,407 | ) | 45,872 | 41,465 | — | 41,465 | ||||||||||||||||
| Profit for the period |
— | 60 | 60 | — | 60 | |||||||||||||||||
| Other comprehensive income / (loss) |
||||||||||||||||||||||
| Currency translation differences |
1,230 | — | 1,230 | — | 1,230 | |||||||||||||||||
| Re-measurements of defined benefit liability |
— | (234 | ) | (234 | ) | — | (234 | ) | ||||||||||||||
| Total other comprehensive income |
1,230 | (234 | ) | 996 | — | 996 | ||||||||||||||||
| Total comprehensive income / (loss) for the period |
1,230 | (174 | ) | 1,056 | — | 1,056 | ||||||||||||||||
| Transactions with owners |
||||||||||||||||||||||
| Net contribution from parent |
— | 17,675 | 17,675 | — | 17,675 | |||||||||||||||||
| Dividends paid |
— | (4,056 | ) | (4,056 | ) | — | (4,056 | ) | ||||||||||||||
| Total transactions with owners |
— | 13,619 | 13,619 | — | 13,619 | |||||||||||||||||
| Balance at 30 September 2014 |
(3,177 | ) | 59,317 | 56,140 | — | 56,140 | ||||||||||||||||
The accompanying notes are an integral part of these carved-out combined financial statements.
F-146
Table of Contents
NON-EUROPEAN FOLDING CARTON AND LITHOGRAPHIC PRINTING BUSINESS
AGI GLOBAL HOLDINGS COÖPERATIEF U.A.
CARVE-OUT COMBINED STATEMENT OF CASH FLOWS
For the nine month period ended 30 September 2014
| Note | Period ended 30 September 2014 |
|||||||
| €’000 | ||||||||
| Cash flows from operating activities |
||||||||
| Cash used from operations |
20 | (9,947 | ) | |||||
| Interest paid |
17 | (17 | ) | |||||
| Income tax paid |
(1,006 | ) | ||||||
| Net cash used from operating activities |
(10,970 | ) | ||||||
| Cash flows from investing activities |
||||||||
| Purchases of property, plant and equipment |
6 | (10,026 | ) | |||||
| Sale of property, plant and equipment |
145 | |||||||
| Interest received |
17 | 119 | ||||||
| Net cash used in investing activities |
(9,762 | ) | ||||||
| Cash flows from financing activities |
||||||||
| Proceeds from short term borrowings |
12 | 7 | ||||||
| Repayment of other borrowings |
12 | (760 | ) | |||||
| Net contributions from parent |
17,675 | |||||||
| Dividend paid |
(4,056 | ) | ||||||
| Net cash generated in financing activities |
12,866 | |||||||
| Net decrease in cash and cash equivalents |
(7,866 | ) | ||||||
| Cash and cash equivalents at beginning of period / year |
10 | 26,462 | ||||||
| Exchange gain on cash |
1,260 | |||||||
| Cash and cash equivalents at end of period |
10 | 19,856 | ||||||
The accompanying notes are an integral part of these carved-out combined financial statements.
F-147
Table of Contents
NON-EUROPEAN FOLDING CARTON AND LITHOGRAPHIC PRINTING BUSINESS
AGI GLOBAL HOLDINGS COÖPERATIEF U.A.
NOTES TO THE CARVE-OUT COMBINED STATEMENTS
For the nine month period ended 30 September 2014
1. Background and basis of preparation
1.1 Background
AGI Global Holdings Coöperatief U.A. (“Parent”) was formed on 30 September 2010. The parent was funded by the sole equity member, Atlas AGI Holdings (Cayman) LP, an affiliate of Atlas Holdings LLC, when it purchased the European and Australian AGI media and entertainment printing and packaging business from MeadWestvaco Corporation (“MeadWestvaco”) on 30 September 2010.
The parent and its wholly-owned subsidiaries specialise in printing and packaging solutions for consumer and personal care products, technology and telecommunications, Blu-ray discs, DVDs, music and video games. In addition the parent manufactures plastic cases for the European market in the home entertainment business sector.
During 2011, the parent entered into an agreement with International Paper Company to acquire its shareholdings in the business and assets of the international entities of its Shorewood packaging division. This acquisition closed on 1 January 2012 and was funded by the transfer of members’ capital from the parent’s controlling party to International Paper Company. As a result, from 1 January 2012, the ownership of the parent changed whereby 40% of the company became owned by International Paper Investments (Luxembourg) S.à.r.l., a wholly owned subsidiary of International Paper Company. The parent’s ultimate controlling party, Atlas AGI Holdings (Cayman) LP, was unchanged and retained a 60% ownership interest. As a result, the Shorewood packaging division was acquired by the parent by the way of a capital contribution from the parent’s controlling party.
This financial period consists of the period 1 January 2014 to 30 September 2014.
1.2 Basis of preparation
The business has historically operated as part of the parent and not as a separate stand-alone entity. The carve-out combined financial statements of the business have been prepared on a “carve-out” basis from the consolidated financial statements of the parent, to represent the financial position and performance of the business as if the business had existed on a stand-alone basis for the period 30 September 2014. The carve-out combined income statement, the carve-out combined statement of comprehensive income, the carve-out combined statement of changes in parent’s net investment in the business and the carve-out combined statement of cash flows for the period 30 September 2014 and statement of financial position at 30 September 2014 are presented on the same basis.
This carve-out combined statement of financial position is being “carved-out” of the parent’s consolidated financial statement as at 30 September 2014.
These carve-out combined financial statements of the Company have been prepared to be included in a registration statement with the SEC. Under SEC requirements only one year of financial statements of the Company is required, and accordingly a comparative period has not been presented. Additionally, the company has provided 9 month information in lieu of 12 month information to satisfy SEC reporting requirements.
During 2014, the parent’s management determined that the Canadian operation in Smith Falls would be transferred out of the carve-out combination at net book value to be held by a different subsidiary of the parent
F-148
Table of Contents
NON-EUROPEAN FOLDING CARTON AND LITHOGRAPHIC PRINTING BUSINESS
AGI GLOBAL HOLDINGS COÖPERATIEF U.A.
NOTES TO THE CARVE-OUT COMBINED STATEMENTS
For the nine month period ended 30 September 2014
within 12 months of 30 September 2014. The Smith Falls assets and liabilities have been shown as held for sale at 30 September 2014 and its results have been recorded as discontinued operations in accordance with IFRS 5 ‘Non-current assets held for sale and discontinued operations’.
Throughout the period presented in the accompanying carve-out combined financial statements, the parent had an allocation agreement with Atlas AGI Topco LLC, a related party of AGI Global Holdings Coöperatief U.A. which allowed Atlas AGI Topco LLC to allocate certain costs and expenses which mutually benefited the parent’s and Atlas AGI Topco LLC’s businesses including the Non-European Folding Carton and Lithographic Printing Business. See related parties note 22 for the amounts charged.
Current and deferred taxation has been separately calculated in each jurisdiction of the business operations and then presented on a combined basis and that position of the current and deferred taxation related to the business is included in these financial statements. Deferred tax adjustments have been made on consolidation as necessary.
The carve-out combined financial statements of the business are presented in Euros (€), and have been prepared on a historical cost basis, and on a going concern basis.
The carve-out combined financial statements have been prepared in conformity with International Financial Reporting Standards (“IFRS”) as issued by the IASB, except for the omission of comparative financial information as discussed above, by aggregating financial information from the components of the business described in Note 1.1 and include the assets, liabilities, revenues and expenses that management has determined are specifically attributable to the business, and allocations of direct and indirect costs and expenses related to the operations of the business. The business adopted IFRS for the first time as at 1 January 2012.
The business has not previously prepared or reported any carve-out combined financial information in accordance with any other generally accepted accounting principles (‘GAAP’). Consequently, it is not possible to provide IFRS 1 reconciliations between financial information prepared under any previous GAAP and the financial information prepared in accordance with IFRS included in this carve-out combined financial information, as required by IFRS 1 on transition to IFRS.
2. Summary of significant accounting policies
The principal accounting policies applied in the preparation of these carve-out combined financial statements are set out below. These policies have been applied consistently throughout the period presented, unless otherwise stated.
2.1 New standards and amendments:
Accounting standards not yet effective:
Certain new standards and amendments to existing standards have been published that are mandatory for future accounting periods. Those which the parent has not adopted early and effective date (periods beginning) are as follows:
| • | IFRS 9, Financial instruments—1 January 2018; and |
| • | IFRS 15, Revenue from contracts with customers—1 January 2017. |
F-149
Table of Contents
NON-EUROPEAN FOLDING CARTON AND LITHOGRAPHIC PRINTING BUSINESS
AGI GLOBAL HOLDINGS COÖPERATIEF U.A.
NOTES TO THE CARVE-OUT COMBINED STATEMENTS
For the nine month period ended 30 September 2014
The business is currently assessing the impact of these policies, though they are not expected to have any material impact on the business.
2.2 Consolidation
(a) Subsidiaries
Subsidiaries are all entities (including structured entities) over which the business has control. The group controls an entity when the business is exposed to, or has rights to, variable returns from its involvement with the entity and has the ability to affect those returns through its power over the entity.
Subsidiaries are fully consolidated from the date on which control is transferred to the business. They are deconsolidated from the date that control ceases.
The business applies the acquisition method to account for business combinations. The consideration transferred for the acquisition of a subsidiary is the fair value of the assets transferred, the liabilities incurred to the former owners of the acquiree and the equity interests issued by the business. The consideration transferred includes the fair value of any asset or liability resulting from a contingent consideration arrangement. Identifiable assets acquired and liabilities and contingent liabilities assumed in a business combination are measured initially at their fair values at the acquisition date. The business recognizes any non-controlling interest in the acquiree on an acquisition-by-acquisition basis, either at fair value or at the non-controlling interest’s proportionate share of the recognized amounts of acquiree’s identifiable net assets.
Acquisition-related costs are expensed as incurred.
If the business combination is achieved in stages, the acquisition date fair value of the acquirer’s previously held equity interest in the acquiree is re-measured to fair value at the acquisition date through the carve-out combined income statement.
Goodwill is initially measured as the excess of the aggregate of the consideration transferred over the fair value of the net identifiable assets acquired and liabilities assumed. If the consideration is lower than the fair value of the net assets of the subsidiary acquired, the difference is recognized in the carve-out income statements as a gain from a bargain purchase.
Inter-company transactions, balances, income and expenses on transactions between companies in the business are eliminated on consolidation. Profits and losses resulting from inter-company transactions that are recognized in assets are also eliminated. Accounting policies of subsidiaries have been changed where necessary to ensure consistency with the policies adopted by the business.
Identifiable net assets of subsidiaries contributed to the parent by its controlling party are measured at fair value on the date when control is transferred to the parent.
F-150
Table of Contents
NON-EUROPEAN FOLDING CARTON AND LITHOGRAPHIC PRINTING BUSINESS
AGI GLOBAL HOLDINGS COÖPERATIEF U.A.
NOTES TO THE CARVE-OUT COMBINED STATEMENTS
For the nine month period ended 30 September 2014
(b) Changes in ownership interests in subsidiaries without change of control
Transactions with non-controlling interests that do not result in loss of control are accounted for as equity transactions—that is, as transactions with the owners in their capacity as owners. The difference between fair value of any consideration paid and the relevant share acquired of the carrying value of net assets of the subsidiary is recorded within the carve-out combined statement of changes in the parent’s net investment in the Business. Gains or losses on disposals to non-controlling interests are also recorded within the carve-out combined statement of changes in the parent’s net investment in the Business.
2.3 Foreign currency translation
(a) Functional and presentation currency
Items included in the carve-out combined financial statements of each of the business entities are measured using the currency of the primary economic environment in which the entity operates (‘the functional currency’). The carve-out combined financial statements are presented in ‘Euro’s’ (“€”), which is the presentation currency.
(b) Transactions and balances
Foreign currency transactions are translated into the functional currency using the exchange rates prevailing at the dates of the transactions or valuation where items are re-measured. Foreign exchange gains and losses resulting from the settlement of such transactions and from the translation at year-end exchange rates of monetary assets and liabilities denominated in foreign currencies are recognized in the carve-out combined income statement. Foreign exchange gains and losses are presented in the carve-out combined income statement within ‘other operating expenses’.
Translation differences on non-monetary financial assets and liabilities such as equities held at fair value through profit or loss are recognized in profit or loss as part of the fair value gain or loss.
(c) Consolidation
The results and financial position of all entities in the business (none of which has the currency of a hyper-inflationary economy) that have a functional currency different from the presentation currency are translated into the presentation currency as follows:
| (a) | Assets and liabilities are translated at the closing rate at the date of the statement of financial position. |
| (b) | Income and expenses are translated at the average exchange rate (unless this average is not a reasonable approximation of the cumulative effect of the rates prevailing on the transaction dates, in which case income and expenses are translated at the rate on the dates of the transactions). |
| (c) | All resulting exchange differences are recognized in the carve-out combined statement of comprehensive income. |
On consolidation, exchange differences arising from the translation of the net investment in foreign operations, and of borrowings and other currency instruments designated as hedges of such investments, are taken to the carve-out combined statement of comprehensive income.
F-151
Table of Contents
NON-EUROPEAN FOLDING CARTON AND LITHOGRAPHIC PRINTING BUSINESS
AGI GLOBAL HOLDINGS COÖPERATIEF U.A.
NOTES TO THE CARVE-OUT COMBINED STATEMENTS
For the nine month period ended 30 September 2014
2.4 Criteria for non-current and current
Assets and liabilities are carried as non-current items if their settlement is not expected in accordance with the contracted terms to occur within 12 months of the end of the financial period. Assets and liabilities that are expected to be settled within 12 months of the end of the financial period will be classified as current items.
2.5 Property, plant and equipment
Land and buildings comprise mainly factories and offices. Land and buildings are shown at cost, less subsequent depreciation for buildings. All other property, plant and equipment is stated at historical cost less depreciation. Historical cost includes expenditures that are directly attributable to the acquisition of the items. Where applicable, fair value at acquisition is used instead as the business’ measure of historical cost.
Subsequent costs are included in the asset’s carrying amount or recognized as a separate asset, as appropriate, only when it is probable that future economic benefits associated with the item will flow to the business and the cost of the item can be measured reliably. The carrying amount of the replaced part is de-recognized. All other repairs and maintenance are charged to the income statement during the financial period in which they are incurred.
Land is not depreciated. Depreciation on other assets is calculated using the straight-line method to amortize their cost or revalued amounts to their residual values over their estimated useful lives, as follows:
| • Buildings |
25-40 years | |
| • Machinery |
3-15 years | |
| • Vehicles |
3-6 years | |
| • Furniture, fixtures and equipment |
5-10 years | |
The assets’ residual values and useful lives are reviewed, and adjusted if appropriate, at the end of each reporting period.
An asset’s carrying amount is written down immediately to its recoverable amount if the asset’s carrying amount is greater than its estimated recoverable amount.
Gains and losses on disposals are determined by comparing the proceeds with the carrying amount and are recognized within ‘other operating expense’ in the carve-out combined income statement.
2.6 Intangible assets
(a) Contractual customer relationships
Contractual customer relationships acquired in a business combination are recognized at fair value at the acquisition date. The contractual customer relationships have a finite useful life and are carried at cost less accumulated amortization. Amortization is calculated using the straight-line method over the expected life of the customer relationship, which is five years.
F-152
Table of Contents
NON-EUROPEAN FOLDING CARTON AND LITHOGRAPHIC PRINTING BUSINESS
AGI GLOBAL HOLDINGS COÖPERATIEF U.A.
NOTES TO THE CARVE-OUT COMBINED STATEMENTS
For the nine month period ended 30 September 2014
(b) Computer software
Costs associated with maintaining computer software programs are recognized as an expense as incurred. Development costs that are directly attributable to the design and testing of identifiable and unique software products controlled by the business are recognized as intangible assets when the following criteria are met:
| • | it is technically feasible to complete the software product so that it will be available for use; |
| • | management intends to complete the software product and use or sell it; |
| • | there is an ability to use or sell the software product; |
| • | the usefulness of the intangible asset can be demonstrated; |
| • | adequate technical, financial and other resources to complete the development and to use or sell the software product are available; and |
| • | the expenditure attributable to the software product during its development can be reliably measured. |
Directly attributable costs that are capitalized as part of the software product include the software development employee costs and an appropriate portion of relevant overheads.
Other development expenditures that do not meet these criteria are recognized as an expense as incurred. Development costs previously recognized as an expense are not recognized as an asset in a subsequent period.
(c) Fair value of leases / land use rights
Fair value of leases / land use rights, otherwise known as favorable operating lease rights relative to market terms, acquired in a business combination are recognized at fair value at the acquisition date. These favorable operating lease rights are carried at fair market value less accumulated amortization. Amortization is calculated using the straight-line method over the expected life of the lease, which varies from six to twenty six years.
2.7 Impairment of non-financial assets
Assets that are subject to amortization are reviewed for impairment whenever events or changes in circumstances indicate that the carrying amount may not be recoverable. An impairment loss is recognized for the amount by which the asset’s carrying amount exceeds its recoverable amount. The recoverable amount is the higher of an asset’s fair value less costs to sell and value in use. For the purposes of assessing impairment, assets are grouped at the lowest levels for which there are separately identifiable cash flows (operating segment level). Non-financial assets other than goodwill that suffered an impairment are reviewed for possible reversal of the impairment at each reporting date.
2.8 Non-current assets (or disposal groups) held for sale
Non-current assets (or disposal groups) are classified as assets held for sale when their carrying amount is to be recovered principally through a sale transaction and a sale is considered highly probable. They are stated at the lower of carrying amount and fair value less costs to sell.
F-153
Table of Contents
NON-EUROPEAN FOLDING CARTON AND LITHOGRAPHIC PRINTING BUSINESS
AGI GLOBAL HOLDINGS COÖPERATIEF U.A.
NOTES TO THE CARVE-OUT COMBINED STATEMENTS
For the nine month period ended 30 September 2014
2.9 Financial assets
The business classifies its financial assets in the following categories: at fair value through profit or loss and loans and receivables. The classification depends on the purpose for which the financial assets were acquired. Management determines the classification of its financial assets at initial recognition.
(a) Financial assets at fair value through profit or loss
Financial assets at fair value through profit or loss are financial assets held for trading. A financial asset is classified in this category if acquired principally for the purpose of selling in the short-term. Derivatives are also categorized as held for trading unless they are designated as hedges. Assets in this category are classified as current assets.
(b) Loans and receivables
Loans and receivables are non-derivative financial assets with fixed or determinable payments that are not quoted in an active market. They are included in current assets, except for maturities greater than 12 months after the end of the reporting period which are classified as non-current assets. Loans and receivables comprise trade and other receivables in the statement of financial position.
2.10 Inventories
Inventories are stated at the lower of cost or net realizable value. Cost is determined using the first-in, first-out (FIFO) method. The cost of finished goods and work-in-progress comprises design costs, raw materials, direct labor, other direct costs and related production overheads (based on normal operating capacity). It excludes borrowing costs. Net realizable value is the estimated selling price in the ordinary course of business, less applicable variable selling expenses.
Spare parts and servicing equipment are carried in the carve-out combined financial statements as inventory with recognition as an expense taking place as and when such parts/equipment are used in the business.
2.11 Trade receivables
Trade receivables are amounts due from customers for goods sold or services performed in the ordinary course of business. If collection is expected in one year or less (or in the normal operating cycle of the business if longer), they are classified as current assets. If not, they are presented as noncurrent assets.
Trade receivables are recognized initially at fair value, less provision for impairment if appropriate.
2.12 Cash and cash equivalents
Cash and cash equivalents includes cash in hand, deposits held at call with banks, other short-term highly liquid investments with original maturities of three months or less, and bank overdrafts. Invoice discounting facilities are shown within borrowings in current liabilities on the carve-out combined statements of financial position.
F-154
Table of Contents
NON-EUROPEAN FOLDING CARTON AND LITHOGRAPHIC PRINTING BUSINESS
AGI GLOBAL HOLDINGS COÖPERATIEF U.A.
NOTES TO THE CARVE-OUT COMBINED STATEMENTS
For the nine month period ended 30 September 2014
2.13 Trade payables
Trade payables are obligations to pay for goods or services that have been acquired in the ordinary course of business from suppliers. Accounts payable are classified as current liabilities if payment is due within one year or less (or in the normal operating cycle of the business if longer). If not, they are presented as non-current liabilities.
2.14 Borrowings
Borrowings comprise amounts borrowed from third parties and related parties, and are recognized initially at fair value, net of issue costs incurred. Borrowings are subsequently carried at amortized cost; any difference between the proceeds (net of issue costs) and the redemption value is recognized in the carve-out combined income statement over the period of the borrowings using the effective interest method.
Fees paid on the establishment of loan facilities are recognized as issue costs of the loan to the extent that it is probable that some or all of the facility will be drawn down.
2.15 Current and deferred income tax
The tax expense for the period comprises current and deferred tax. Tax is recognized in the business’s carve-out combined income statement, except to the extent that it relates to items recognized directly in the carve-out combined statements of comprehensive income or changes in parent’s net investment in the business. In this case the tax is also recognized in other comprehensive income or directly in the carve-out combined statement of changes in parent’s net investment in the business, respectively.
The current income tax charge is calculated on the basis of the tax laws enacted or substantively enacted at the statement of financial position date in the countries where the business subsidiaries operate and generate taxable income. Management periodically evaluates positions taken in tax returns with respect to situations in which applicable tax regulation is subject to interpretation. It establishes provisions where appropriate on the basis of amounts expected to be paid to the tax authorities.
Deferred income tax is recognized, using the liability method, on temporary differences arising between the tax bases of assets and liabilities and their carrying amounts in the carve-out combined financial statements. However, the deferred income tax is not accounted for if it arises from initial recognition of an asset or liability in a transaction other than a business combination that at the time of the transaction affects neither accounting nor taxable profit nor loss. Deferred income tax is determined using tax rates (and laws) that have been enacted or substantively enacted by the statements of financial position date and are expected to apply when the related deferred income tax asset is realized or the deferred income tax liability is settled.
Deferred income tax assets are recognized only to the extent that management believes it is probable that future taxable profit will be available against which the temporary differences can be utilized.
Deferred income tax is provided on temporary differences arising on investments in subsidiaries, except where the timing of the reversal of the temporary difference is controlled by the business and it is probable that the temporary difference will not reverse in the foreseeable future.
F-155
Table of Contents
NON-EUROPEAN FOLDING CARTON AND LITHOGRAPHIC PRINTING BUSINESS
AGI GLOBAL HOLDINGS COÖPERATIEF U.A.
NOTES TO THE CARVE-OUT COMBINED STATEMENTS
For the nine month period ended 30 September 2014
Deferred income tax assets and liabilities are offset when there is a legally enforceable right to offset current tax assets against current tax liabilities and when the deferred income tax assets and liabilities relate to income taxes levied by the same taxation authority on either the taxable entity or different taxable entities where there is an intention to settle the balances on a net basis.
2.16 Employee benefits
(a) Pension obligations
Companies in the business operate various defined contribution pension schemes. The schemes are generally funded through payments to insurance companies or publicly administered pension plans. A defined contribution plan is a pension plan under which the business pays fixed contributions into a separate entity.
For defined contribution plans, the business pays contributions to publicly or privately administered pension insurance plans on a mandatory, contractual or voluntary basis. The business has no further payment obligations once the contributions have been paid. The contributions are recognized as employee benefit expense when they are due. Prepaid contributions are recognized as an asset to the extent that a cash refund or a reduction in the future payments is available.
(b) Termination benefits
Certain termination benefits are payable when employment is terminated by the business before the normal retirement date, or whenever an employee accepts voluntary redundancy in exchange for these benefits. The business recognizes termination benefits when it is demonstrably committed to either: terminating the employment of current employees according to a detailed formal plan without possibility of withdrawal; or providing termination benefits as a result of an offer made to encourage voluntary redundancy.
(c) Bonus plans
The business recognizes a liability and an expense for bonuses and profit-sharing, based on a formula that takes into consideration the profit attributable to the parent’s shareholders after certain adjustments. The business recognizes a provision where contractually obliged or where there is a past practice that has created a constructive obligation.
(d) Other post-employment obligations
Some companies in the business provide post-retirement healthcare benefits to their retirees. The entitlement to these benefits is usually conditional on the employee remaining in service up to retirement age and the completion of a minimum service period. The expected costs of these benefits are accrued over the period of employment using the same accounting methodology as used for defined benefit pension plans. Actuarial gains and losses arising from experience adjustments and changes in actuarial assumptions are charged or credited to the carve-out combined statement of comprehensive income in the period in which they arise. These obligations are valued annually by independent qualified actuaries.
F-156
Table of Contents
NON-EUROPEAN FOLDING CARTON AND LITHOGRAPHIC PRINTING BUSINESS
AGI GLOBAL HOLDINGS COÖPERATIEF U.A.
NOTES TO THE CARVE-OUT COMBINED STATEMENTS
For the nine month period ended 30 September 2014
2.17 Provisions
Provisions for environmental restoration, restructuring costs and legal claims are recognized when: the business has a present legal or constructive obligation as a result of past events; it is probable that an outflow of resources will be required to settle the obligation; and the amount has been reliably estimated. Restructuring provisions comprise lease termination penalties and employee termination payments. Provisions are not recognized for future operating losses.
Where there are a number of similar obligations, the likelihood that an outflow will be required in settlement is determined by considering the class of obligations as a whole. A provision is recognized even if the likelihood of an outflow with respect to any one item included in the same class of obligations may be small.
Provisions are measured at the present value of the expenditures expected to be required to settle the obligation using a pre-tax rate that reflects current market assessments of the time value of money and the risks specific to the obligation. The increase in the provision due to passage of time is recognized as interest expense.
2.18 Revenue recognition
Revenue comprises the fair value of the consideration received or receivable for the sale of goods and services in the ordinary course of the business activities. Revenue is shown net of value-added tax, returns, rebates and discounts and after eliminating sales within the business.
The business recognizes revenue when the amount of revenue can be reliably measured, it is probable that future economic benefits will flow to the entity and when specific criteria have been met for each of the business activities as described below. The business bases its estimates on historical results, taking into consideration the type of customer, the type of transaction and the specifics of each arrangement.
Sales of goods
The business manufactures and sells a range of printed products. Sales of goods are recognized when an entity in the business has delivered products to the customer, and there is no unfulfilled obligation that could affect the customer’s acceptance of the products. Delivery does not occur until the products have been shipped to the specified location, the risks of obsolescence and loss have been transferred to the customer, and either the customer has accepted the products in accordance with the sales contract, the acceptance provisions have lapsed, or the business has objective evidence that all criteria for acceptance have been satisfied.
The products are often sold with volume discounts; customers have a right to return faulty products. Sales are recorded based on the price specified in the sales contracts, net of the estimated volume discounts and returns at the time of sale. Accumulated experience is used to estimate and provide for the discounts and returns. The volume discounts are assessed based on anticipated annual purchases. No element of financing is deemed present as the sales are made with average credit terms approximating 45 days, which is consistent with market practice.
F-157
Table of Contents
NON-EUROPEAN FOLDING CARTON AND LITHOGRAPHIC PRINTING BUSINESS
AGI GLOBAL HOLDINGS COÖPERATIEF U.A.
NOTES TO THE CARVE-OUT COMBINED STATEMENTS
For the nine month period ended 30 September 2014
2.19 Leases
Leases in which a significant portion of the risks and rewards of ownership are retained by the lessor are classified as operating leases. Payments made under operating leases (net of any incentives received from the lessor) are charged to the carve-out combined income statement on a straight-line basis over the period of the lease.
The business leases certain property, plant and equipment. Leases of property, plant and equipment where the business has substantially all the risks and rewards of ownership are classified as finance leases. Finance leases are capitalized at the lease’s commencement at the lower of the fair value of the leased property and the present value of the minimum lease payments.
Each lease payment is allocated between the liability and finance charges. The corresponding rental obligations, net of finance charges, are included in other long-term payables. The interest element of the finance cost is charged to the income statement over the lease period so as to produce a constant periodic rate of interest on the remaining balance of the liability for each period. The property, plant and equipment acquired under finance leases is depreciated over the shorter of the useful life of the asset and the lease term.
2.20 Parent’s net investment in the business
Parent’s net investment in the business is comprised of capital stock, capital contributions and retained earnings. Capital stock is stated at cost.
Net contributions by the Parent to the non-European Folding Carton and Lithographic Printing Business during the reporting period are included in the accompanying carve-out statement of changes in Parent’s net investment in the business. These transactions arise through intercompany activities between the non-European Folding Carton and Lithographic Printing Business, the Parent and the Parent’s other businesses. The net contributions by the Parent are reflected as a financing activity in the accompanying carve-out combined statement of cash flows.
Comprehensive income consists of profit or loss for the period and items required by specific provision of IFRS to be reflected in other comprehensive income and they do not constitute contribution, reductions or distribution of capital stock, such as re-measurements of employee benefits.
2.21 Capital management
The business’s primary capital management objective is to provide optimum support to its business operations so as to ensure their effectiveness, efficiency and profitability, creating value for the parent as a result.
3. Financial risk management
The business activities expose it to a variety of financial risks: market risk (including currency risk, fair value interest rate risk, cash flow interest rate risk and price risk), credit risk and liquidity risk. The business overall risk management program focuses on the unpredictability of financial markets and seeks to minimize potential adverse effects on the business financial performance.
F-158
Table of Contents
NON-EUROPEAN FOLDING CARTON AND LITHOGRAPHIC PRINTING BUSINESS
AGI GLOBAL HOLDINGS COÖPERATIEF U.A.
NOTES TO THE CARVE-OUT COMBINED STATEMENTS
For the nine month period ended 30 September 2014
Risk management is carried out by the management of the parent and local finance functions with approval by the board of directors.
(a) Market risk
(i) Foreign exchange risk
The business operates internationally and is exposed to foreign exchange transaction risk arising from various currency exposures, primarily with respect to the Canadian dollar, Mexican Peso, Chinese renminbi and British pound. Foreign exchange risk arises from future commercial transactions, recognized assets and liabilities and net investments in foreign operations.
Management has set up a policy to require companies in the business to manage any significant foreign exchange risk against their functional currency. To manage their foreign exchange risk arising from future commercial transactions and recognized assets and liabilities, entities in the business use forward contracts where there is significant risk. Foreign exchange risk arises when future commercial transactions or recognized assets or liabilities are denominated in a currency that is not the entity’s functional currency.
No actions are taken to mitigate foreign exchange translation risk related to net investments in foreign operations. Exposure to Chinese renminbi, Canadian dollar, Mexican peso and British pound is present.
No cash flow hedging was applied for the forward contracts held as transactions are not material.
(ii) Price risk
Prices of key raw materials (paper and board) are affected by a wide range of global factors which are beyond the control of the business. The fluctuations in such prices may have favourable or unfavourable impacts on the business. Where possible, the business passes the effects of any price changes on to its customers. Raw material prices are regularly monitored by the business.
(iii) Cash flow and fair value interest rate risk
The business interest rate risk arises from short and long-term borrowings. Borrowings issued at variable rates expose the business to cash flow interest rate risk which is partially offset by cash held at variable rates. Borrowings issued at fixed rates expose the business to fair value interest rate risk. The level of risk on borrowings during the period was not considered significant. This is monitored closely.
(b) Credit risk
Credit risk is managed on a combined basis. Credit risk arises from cash and cash equivalents, as well as credit exposures to customers, including outstanding receivables and committed transactions. Credit control assesses the credit quality of the customer, taking into account its financial position, past experience and other factors. Individual risk limits are set based on internal or external ratings in accordance with limits set by the board. The
F-159
Table of Contents
NON-EUROPEAN FOLDING CARTON AND LITHOGRAPHIC PRINTING BUSINESS
AGI GLOBAL HOLDINGS COÖPERATIEF U.A.
NOTES TO THE CARVE-OUT COMBINED STATEMENTS
For the nine month period ended 30 September 2014
utilization of credit limits is regularly monitored. For cash and cash equivalents, credit risk is managed by ensuring that at an operating level at each entity cash balances are minimized, subject to any regulatory currency control restrictions that may be in place.
(c) Liquidity risk
Cash flow forecasting is performed in the operating entities of the business and aggregated by the business group finance management. The business group finance management monitors rolling forecasts of the business liquidity requirements to ensure it has sufficient cash to meet operational needs while maintaining sufficient headroom on its undrawn committed invoice discounting facilities at all times so that the business does not breach borrowing limits or covenants (where applicable) on any of its borrowing facilities. Such forecasting takes into consideration the business debt financing plans, covenant compliance, compliance with internal statements of financial position ratio targets and, if applicable, external regulatory or legal requirements—for example, currency restrictions.
The table below analyses the business non-derivative financial liabilities into relevant maturity groupings based on the remaining period at the statement of financial position date to the contractual maturity date. The amounts disclosed in the table are the contractual undiscounted cash flows.
| At 30 September 2014 | Less than one year |
Between one and two years |
Between two and five years |
Over five years | ||||||||||||
| €’000 | €’000 | €’000 | €’000 | |||||||||||||
| Related party borrowings |
— | — | 25,683 | — | ||||||||||||
| Other borrowings |
928 | 538 | — | — | ||||||||||||
| Trade and other payables |
43,648 | 72 | — | — | ||||||||||||
4. Critical accounting estimates and judgements
The business makes estimates and assumptions concerning the future. The resulting accounting estimates will, by definition, seldom equal the corresponding actual results. The estimates and assumptions that have a significant risk of causing a material adjustment to the carrying amounts of assets and liabilities within the next financial year are addressed below. For more details about how the items referred to are shown in the carve-out combined financial statements, please see the notes to the financial statements. When forming these judgments and making the estimates referred to, use was also made of the opinions and advice of external experts in the relevant area.
(a) Income taxes
The business is subject to income taxes in numerous jurisdictions. Significant judgment is required in determining the worldwide provision for income taxes. There are many transactions and calculations for which the ultimate tax determination is uncertain. The business recognizes liabilities for anticipated tax audit issues based on estimates of whether additional taxes will be due. Where the final tax outcome of these matters is different from the amounts that were initially recorded, such differences will impact the current and deferred income tax assets and liabilities in the period in which such determination is made.
F-160
Table of Contents
NON-EUROPEAN FOLDING CARTON AND LITHOGRAPHIC PRINTING BUSINESS
AGI GLOBAL HOLDINGS COÖPERATIEF U.A.
NOTES TO THE CARVE-OUT COMBINED STATEMENTS
For the nine month period ended 30 September 2014
(b) Valuation of intangible assets
The business has value in intangible assets as disclosed in note 7. In estimating a valuation, discounted future cash flows are frequently used, which necessarily involve a forecast of expected future revenues and costs. Where more relevant the direct cost of creating the intangible is used. The impairment period chosen to amortize these intangibles is also based on future expectations. When determining the level of any impairments, management uses judgments to determine the likely future net cash flows generated by the assets and expected future growth and relevant discount factors to use.
(c) Property, plant and equipment
The accounting policy is shown in note 2.5. Where any uncertainty is present, an external valuer is used to assess such things as expected useful lives and valuations for impairment reviews and for ascertaining fair values.
5. Operating Segments
The Executive Management team of the carve-out business comprises the Chairman, Chief Financial Officer and the Executive Officers of the business, who together comprise the chief operating decision maker ‘CODM’. The information provided to them relates to the ‘Folding Carton and Lithographic Printing Business’, analyzed across two geographic areas; Americas and Asia.
The CODM consider performance based on revenue and on a measure of adjusted EBITDA, which is a measurement which excludes discontinued operations and the effects of non-recurring expenditure from the operating segment.
5.1 Adjusted EBITDA by region, reconciled to operating profit
| Period ended 30 September 2014 |
||||
| €’000 | ||||
| Americas |
201 | |||
| Asia |
6,616 | |||
| Other |
(12 | ) | ||
| Adjusted EBITDA |
6,805 | |||
| Reconciliation adjustments; |
||||
| Depreciation, impairment and amortisation and (loss) on disposal of property, plant and equipment |
(2,319 | ) | ||
| Foreign currency gain |
353 | |||
| Restructuring costs; headcount and facilities |
(850 | ) | ||
| Other non-cash or non-recurring items |
21 | |||
| Operating Profit |
4,010 | |||
F-161
Table of Contents
NON-EUROPEAN FOLDING CARTON AND LITHOGRAPHIC PRINTING BUSINESS
AGI GLOBAL HOLDINGS COÖPERATIEF U.A.
NOTES TO THE CARVE-OUT COMBINED STATEMENTS
For the nine month period ended 30 September 2014
5.2 Information about geographic areas:
(i) Total revenue by country of origin:
| Period ended 30 September 2014 |
||||
| €’000 | ||||
| Americas |
||||
| Canada |
34,220 | |||
| Mexico |
11,352 | |||
| 45,572 | ||||
| Asia |
||||
| China |
45,437 | |||
| Total revenue |
91,009 | |||
(ii) Total revenue by country of destination:
| Period ended 30 September 2014 |
||||
| €’000 | ||||
| USA |
41,025 | |||
| China |
22,762 | |||
| Mexico |
11,603 | |||
| Canada |
7,457 | |||
| Other countries |
8,162 | |||
| Total revenue |
91,009 | |||
(ii) Non-current assets by country:
| As at 30 September 2014 |
U.K. | Canada | Mexico | China | Total | |||||||||||||||
| €’000 | €’000 | €’000 | €’000 | €’000 | ||||||||||||||||
| Property, plant and equipment |
5,757 | 7,743 | 4,829 | 11,406 | 29,735 | |||||||||||||||
| Intangibles |
— | 946 | 250 | 2,866 | 4,062 | |||||||||||||||
| Trade receivables |
— | — | — | 474 | 474 | |||||||||||||||
| Total non-current assets |
5,757 | 8,689 | 5,079 | 14,746 | 34,271 | |||||||||||||||
During 2013, a Chinese subsidiary within the carve-out established a new U.K. company, ASG Leasing Limited, incorporated in the United Kingdom. The principle activity of the company is to provide capital equipment to entities within the Parent group via operating leases. Operations commenced in 2014. The revenue from subsidiaries of the parent not included within the business is recognized as Other Income in the carve-out combined income statements.
5.3 Information about major customers
Within the combined carve-out group none of the customers exceed 10% of revenue. Therefore the carve-out group does not have reliance on any individual customer.
F-162
Table of Contents
NON-EUROPEAN FOLDING CARTON AND LITHOGRAPHIC PRINTING BUSINESS
AGI GLOBAL HOLDINGS COÖPERATIEF U.A.
NOTES TO THE CARVE-OUT COMBINED STATEMENTS
For the nine month period ended 30 September 2014
6. Property plant and equipment
| Land and buildings €’000 |
Machinery, equipment and fittings €’000 |
Total €’000 |
||||||||||
| At 31 December 2013 |
||||||||||||
| Cost or valuation |
8,777 | 15,460 | 24,237 | |||||||||
| Accumulated depreciation |
(466 | ) | (2,318 | ) | (2,784 | ) | ||||||
|
|
|
|
|
|
|
|||||||
| Net book amount |
8,311 | 13,142 | 21,453 | |||||||||
|
|
|
|
|
|
|
|||||||
| Period ended 30 September 2014 |
||||||||||||
| Opening net book amount |
8,311 | 13,142 | 21,453 | |||||||||
| Additions |
137 | 9,889 | 10,026 | |||||||||
| Disposals |
— | (301 | ) | (301 | ) | |||||||
| Exchange differences |
490 | 1,208 | 1,698 | |||||||||
| Transfer to assets held for sale |
(735 | ) | (1,015 | ) | (1,750 | ) | ||||||
| Depreciation charge |
(173 | ) | (1,218 | ) | (1,391 | ) | ||||||
|
|
|
|
|
|
|
|||||||
| Closing net book amount |
8,030 | 21,705 | 29,735 | |||||||||
|
|
|
|
|
|
|
|||||||
| At 30 September 2014 |
||||||||||||
| Cost or valuation |
9,090 | 27,563 | 36,653 | |||||||||
| Accumulated depreciation |
(1,060 | ) | (5,858 | ) | (6,918 | ) | ||||||
|
|
|
|
|
|
|
|||||||
| Net book amount |
8,030 | 21,705 | 29,735 | |||||||||
|
|
|
|
|
|
|
|||||||
7. Intangible assets
| Fair value of leases/land use rights €’000 |
Contractual customer relationships €’000 |
Software develop- ment costs €’000 |
Total €’000 |
|||||||||||||
| At 31 December 2013 |
||||||||||||||||
| Cost or valuation |
2,532 | 5,778 | 248 | 8,558 | ||||||||||||
| Accumulated amortization and impairment |
(603 | ) | (3,059 | ) | (88 | ) | (3,750 | ) | ||||||||
|
|
|
|
|
|
|
|
|
|||||||||
| Net book amount |
1,929 | 2,719 | 160 | 4,808 | ||||||||||||
|
|
|
|
|
|
|
|
|
|||||||||
| Period ended 30 September 2014 |
||||||||||||||||
| Opening net book amount |
1,929 | 2,719 | 160 | 4,808 | ||||||||||||
| Exchange differences |
136 | — | 12 | 148 | ||||||||||||
| Amortization charge |
(57 | ) | (649 | ) | (66 | ) | (772 | ) | ||||||||
| Transfer assets out for held for sale |
— | (122 | ) | — | (122 | ) | ||||||||||
|
|
|
|
|
|
|
|
|
|||||||||
| Closing net book amount |
2,008 | 1,948 | 106 | 4,062 | ||||||||||||
|
|
|
|
|
|
|
|
|
|||||||||
| At 30 September 2014 |
||||||||||||||||
| Cost or valuation |
2,712 | 4,418 | 268 | 7,398 | ||||||||||||
| Accumulated amortization and impairment |
(704 | ) | (2,470 | ) | (162 | ) | (3,336 | ) | ||||||||
|
|
|
|
|
|
|
|
|
|||||||||
| Net book amount |
2,008 | 1,948 | 106 | 4,062 | ||||||||||||
|
|
|
|
|
|
|
|
|
|||||||||
F-163
Table of Contents
NON-EUROPEAN FOLDING CARTON AND LITHOGRAPHIC PRINTING BUSINESS
AGI GLOBAL HOLDINGS COÖPERATIEF U.A.
NOTES TO THE CARVE-OUT COMBINED STATEMENTS
For the nine month period ended 30 September 2014
Intangibles are amortized over their expected useful lives, being five years for contractual customer relationships, three years for software development costs and the length of the lease or land rights for the fair value of leases and land use rights, being six to twenty years.
8. Trade and other receivables
| Note | 30 September 2014 |
|||||||
| €’000 | ||||||||
| Trade receivables |
27,335 | |||||||
| Less: provision for impairment of trade receivables |
(52 | ) | ||||||
| Trade receivables—net |
27,283 | |||||||
| Prepayments |
855 | |||||||
| Other receivables |
4,826 | |||||||
| Amounts due from related parties |
22 | 8,529 | ||||||
| Amounts due from subsidiaries of the parent not included within the business |
22 | 4,101 | ||||||
| 45,594 | ||||||||
| Non-current trade and other receivables |
474 | |||||||
| Current portion |
45,120 | |||||||
There is not a material difference between the fair value and book value of trade and other receivables.
As at 30 September 2014, trade receivables of €2,918,000 were past due but not impaired. The credit quality of these relate to a number of customers where there is no recent history of default and the majority fall under the “AAA” or the “AA” credit rating (Moody ratings). The aging analysis of these trade receivables is as follows:
| 30 September 2014 | ||||
| €’000 | ||||
| Up to three months |
2,537 | |||
| Three to six months |
309 | |||
| Six to twelve months |
25 | |||
| Over twelve months |
47 | |||
| 2,918 | ||||
The amount of the provision as at 30 September 2014 was €52,000. The individually impaired receivables mainly relate to customers which are in unexpected difficult economic situations. It was assessed that a portion of the receivables is not expected to be recovered. The aging of these receivables is as follows:
| 30 September 2014 | ||||
| €’000 | ||||
| Up to three months |
0 | |||
| Three to six months |
5 | |||
| Six to twelve months |
45 | |||
| Over twelve months |
2 | |||
| 52 | ||||
F-164
Table of Contents
NON-EUROPEAN FOLDING CARTON AND LITHOGRAPHIC PRINTING BUSINESS
AGI GLOBAL HOLDINGS COÖPERATIEF U.A.
NOTES TO THE CARVE-OUT COMBINED STATEMENTS
For the nine month period ended 30 September 2014
The carrying amounts of the business trade and other receivables are denominated in the following currencies:
| 30 September 2014 | ||||
| €’000 | ||||
| British pound |
30 | |||
| US dollar |
24,711 | |||
| Chinese renminbi |
11,163 | |||
| Mexican peso |
5,429 | |||
| Canadian dollar |
3,344 | |||
| Other currencies |
917 | |||
| 45,594 | ||||
Movements on the business provision for impairment of trade receivables are as follows:
| 30 September 2014 | ||||
| €’000 | ||||
| At 1 January |
130 | |||
| Provision for receivables impairment |
54 | |||
| Receivables written off during the period as uncollectible |
(28 | ) | ||
| Unused amounts reversed |
(104 | ) | ||
| At 30 September |
52 | |||
The creation and release of provision for impaired receivables have been included in ‘other operating expenses’ in the carve-out combined income statement.
The other classes within trade and other receivables do not contain impaired assets.
9. Inventories
| 30 September 2014 | ||||
| €’000 | ||||
| Raw materials |
6,444 | |||
| Work in-progress |
2,905 | |||
| Finished goods |
6,242 | |||
| Spare parts |
765 | |||
| Total inventories |
16,356 | |||
10. Cash and cash equivalents
| 30 September 2014 | ||||
| €’000 | ||||
| Cash and cash equivalents |
17,123 | |||
| Short-term bank deposits |
2,733 | |||
| Total cash and cash equivalents |
19,856 | |||
F-165
Table of Contents
NON-EUROPEAN FOLDING CARTON AND LITHOGRAPHIC PRINTING BUSINESS
AGI GLOBAL HOLDINGS COÖPERATIEF U.A.
NOTES TO THE CARVE-OUT COMBINED STATEMENTS
For the nine month period ended 30 September 2014
The cash and cash equivalent balances are maintained in the following currencies:
| 30 September 2014 | ||||
| €’000 | ||||
| US dollar |
6,312 | |||
| Chinese renminbi |
9,382 | |||
| Mexican peso |
804 | |||
| Canadian dollar |
1,732 | |||
| Euro |
1,596 | |||
| British pound |
30 | |||
| Total cash and cash equivalents |
19,856 | |||
The cash and cash equivalent balances are located in the following countries;
| 30 September 2014 | ||||
| €’000 | ||||
| Canada |
3,271 | |||
| China |
14,020 | |||
| Mexico |
890 | |||
| The Netherlands |
49 | |||
| United Kingdom |
1,626 | |||
| Total cash and cash equivalents |
19,856 | |||
Substantially all of the cash and cash equivalents are held in banks with credit rating (Moody ratings) of AA or above and where such ratings are not available, with banks of substantial scale and reputation in their local markets. The credit quality of cash financial assets has been considered in the preparation of these financial statements and no adjustments have been required.
11. Trade and other payables
| Note | 30 September 2014 | |||||||
| €’000 | ||||||||
| Trade payables |
17,604 | |||||||
| Amounts due to related parties |
22 | 7,506 | ||||||
| Amounts due to subsidiaries of the parent not included within the business |
22 | 4,349 | ||||||
| Social security and other taxes |
1,718 | |||||||
| Accrued expenses and other payables |
12,543 | |||||||
| 43,720 | ||||||||
| Non-current accrued expenses and other payables |
72 | |||||||
| Current portion |
43,648 | |||||||
The amounts owed to related parties are unsecured. The balance of amounts due to related parties are non-interest bearing.
F-166
Table of Contents
NON-EUROPEAN FOLDING CARTON AND LITHOGRAPHIC PRINTING BUSINESS
AGI GLOBAL HOLDINGS COÖPERATIEF U.A.
NOTES TO THE CARVE-OUT COMBINED STATEMENTS
For the nine month period ended 30 September 2014
12. Other borrowings
| 30 September 2014 | ||||
| €’000 | ||||
| Non-current |
||||
| Finance lease |
517 | |||
| Total non-current |
517 | |||
| Current |
||||
| Invoice discount facility |
7 | |||
| Finance lease |
885 | |||
| Total current debt |
892 | |||
| Total other borrowings |
1,409 | |||
The fair value of current and non-current borrowings equals their carrying amount, as the impact of discounting is not significant.
Invoice discounting facility
Shorewood Packaging Corporation of Canada is a participating member of the parent’s invoice discounting facility. The company joined the arrangement in March 2014. The facility is secured on certain trade receivables and inventory of a group of subsidiary companies of the parent. The borrowings are repayable in 16 months’ time and have variable interest rates; for Canadian Dollar borrowing CDOR + 3.0% and US Dollar borrowing LIBOR + 3.0%.
The parent and almost all other country divisions of the parent, including the carve-out entities, guarantee the entire arrangement.
The banking arrangements require the parent to meet certain minimum borrowing availability limits based upon eligible receivable and inventory balances. If these levels fall below the minimum level, certain covenant tests are required. This did not occur in the period. The covenants relate to minimum levels of EBITDA, maximum levels of capital expenditure and a minimum fixed charge ratio.
At 30 September 2014 there was €7,000 of invoice discounting facility utilized in respect to Shorewood Packaging Corporation of Canada, and €1,876,000 in total of the parent’s facility utilized.
The Business has the following undrawn borrowing facilities under the discounting facility:
| 30 September 2014 | ||||
| €’000 | ||||
| Expiring beyond one year |
9,864 | |||
F-167
Table of Contents
NON-EUROPEAN FOLDING CARTON AND LITHOGRAPHIC PRINTING BUSINESS
AGI GLOBAL HOLDINGS COÖPERATIEF U.A.
NOTES TO THE CARVE-OUT COMBINED STATEMENTS
For the nine month period ended 30 September 2014
Finance Leases
Future minimum payments under finance leases are as follows:
| 30 September 2014 | ||||
| €’000 | ||||
| Finance leases which expire |
885 | |||
| No later than one year |
517 | |||
| Later than one year and no later than five years |
1,402 | |||
The impact of discounting on the finance lease future minimum lease payments is not material.
13. Deferred tax
The analysis of deferred tax assets and deferred tax liabilities is as follows:
| September 30, 2014 | ||||
| €’000 | ||||
| Deferred tax assets: |
||||
| Deferred tax asset to be recovered after more than 12 months |
7,271 | |||
| Deferred tax asset to be recovered within 12 months |
1,953 | |||
| Total deferred tax assets |
9,224 | |||
| Deferred tax liabilities: |
||||
| Deferred tax liability after more than 12 months |
(2,505 | ) | ||
| Deferred tax liability within 12 months |
— | |||
| Total deferred tax liabilities |
(2,505 | ) | ||
| Deferred tax assets (net) |
6,719 | |||
| The gross movement on the deferred income tax account is as follows: |
||||
| At 1 January |
6,407 | |||
| Exchange differences |
620 | |||
| Income statement charge to income tax expense |
(249 | ) | ||
| Transfer to assets held for sale |
(59 | ) | ||
| At 30 September |
6,719 | |||
| Deferred tax assets |
Retirement benefit obligations |
Property, plant and equipment temporary differences |
Tax losses |
Other provisions |
Total | |||||||||||||||
| €’000 | €’000 | €’000 | €’000 | €’000 | ||||||||||||||||
| At 31 December 2013 |
837 | 5,461 | 452 | 2,227 | 8,977 | |||||||||||||||
| Credited / (charged) to income statement |
52 | (584 | ) | 627 | (426 | ) | (331 | ) | ||||||||||||
| Transfer to assets held for sale |
— | (89 | ) | — | — | (89 | ) | |||||||||||||
| Exchange differences |
36 | 358 | 121 | 152 | 667 | |||||||||||||||
| At 30 September 2014 |
925 | 5,146 | 1,200 | 1,953 | 9,224 | |||||||||||||||
F-168
Table of Contents
NON-EUROPEAN FOLDING CARTON AND LITHOGRAPHIC PRINTING BUSINESS
AGI GLOBAL HOLDINGS COÖPERATIEF U.A.
NOTES TO THE CARVE-OUT COMBINED STATEMENTS
For the nine month period ended 30 September 2014
| Deferred tax liabilities |
Property, plant and equipment temporary differences |
Customer relationships |
Other | Total | ||||||||||||
| €’000 | €’000 | €’000 | €’000 | |||||||||||||
| At 31 December 2013 |
508 | 699 | 1,363 | 2,570 | ||||||||||||
| Credited / (charged) to income statement |
127 | (166 | ) | (43 | ) | (82 | ) | |||||||||
| Transfer to assets held for sale |
— | (30 | ) | — | (30 | ) | ||||||||||
| Exchange differences |
47 | — | — | 47 | ||||||||||||
| At 30 September 2014 |
682 | 503 | 1,320 | 2,505 | ||||||||||||
Deferred income tax assets are recognized for tax loss carry-forwards to the extent that the realization of the related tax benefit through future taxable profits is probable. The group did not recognize deferred income tax assets of €1,131,000 in respect of losses amounting to €4,526,000 that can be carried forward against future taxable income, and deferred income tax assets of €383,000 in respect of tax depreciation.
Deferred income tax liabilities of €1,320,000 have been recognized for the withholding tax and other taxes that would be payable on the unremitted earnings of certain subsidiaries.
14. Provisions for other liabilities and charges
| Movement | ||||
| €’000 | ||||
| At 31 December 2013 |
483 | |||
| Provisions utilized in the year |
(483 | ) | ||
| At 30 September 2014 |
— | |||
During 2013 AGI Shorewood de Mexico S. de R.L. C.V. announced a facilities restructuring amounting to €483,000 which has been fully utilised in 2014.
All provisions relate to restructuring provisions.
15. Employee benefit expense
| Period ended 30 September 2014 |
||||
| €’000 | ||||
| Wages and salaries, including restructuring costs, other termination benefits |
21,227 | |||
| Social security costs |
2,184 | |||
| Pension costs—defined contribution plans |
346 | |||
| Other wage and salary costs and post-retirement benefits |
1,840 | |||
| 25,597 | ||||
| Less; employee benefit expense of discontinued operations |
(3,202 | ) | ||
| 22,395 | ||||
F-169
Table of Contents
NON-EUROPEAN FOLDING CARTON AND LITHOGRAPHIC PRINTING BUSINESS
AGI GLOBAL HOLDINGS COÖPERATIEF U.A.
NOTES TO THE CARVE-OUT COMBINED STATEMENTS
For the nine month period ended 30 September 2014
16. Average number of people employed
| Period ended 30 September 2014 |
||||
| €’000 | ||||
| Average number of employees |
996 | |||
| Less: average number of employees of discontinued operations |
(41 | ) | ||
| 955 | ||||
17. Finance income and costs
| Period ended 30 September 2014 |
||||
| €’000 | ||||
| Interest expense |
||||
| Bank borrowings |
17 | |||
| Related party borrowings |
597 | |||
| Post-retirement benefits |
119 | |||
| Finance costs |
733 | |||
| Interest income on short-term bank deposits |
(119 | ) | ||
| Finance income |
(119 | ) | ||
| Net finance expense |
614 | |||
18. Income tax expense
| Period ended 30 September 2014 |
||||
| €’000 | ||||
| Current tax: |
||||
| Current tax on profits for the period |
1,049 | |||
| Adjustments for prior period |
(194 | ) | ||
| Total current tax |
855 | |||
| Deferred tax: |
||||
| Origination and reversal of temporary differences |
(710 | ) | ||
| Deferred tax (credit)/charge for future repatriation of unremitted earnings |
(22 | ) | ||
| Adjustments related to prior periods |
981 | |||
| Total deferred tax |
249 | |||
| Income tax expense |
1,104 | |||
F-170
Table of Contents
NON-EUROPEAN FOLDING CARTON AND LITHOGRAPHIC PRINTING BUSINESS
AGI GLOBAL HOLDINGS COÖPERATIEF U.A.
NOTES TO THE CARVE-OUT COMBINED STATEMENTS
For the nine month period ended 30 September 2014
The tax on the group’s profit before tax differs from the theoretical amount that would arise using the weighted average tax rate applicable to profits of the combined entities as follows:
| Period ended 30 September 2014 |
||||
| €’000 | ||||
| Profit before income tax |
||||
| Tax calculated at weighted average of domestic tax rates applicable to profits in the respective countries |
353 | |||
| Tax effects of: |
||||
| Income not subject to tax |
(791 | ) | ||
| Expenses not deductible for tax purposes |
501 | |||
| Tax losses for which no deferred income tax asset was recognized |
119 | |||
| Recognition of previously unrecognized tax losses |
(1 | ) | ||
| Deferred tax (credit) for future repatriation of unremitted earnings |
(22 | ) | ||
| Irrecoverable withholding tax and other charges |
158 | |||
| Adjustment in respect of prior years |
787 | |||
| Tax charge |
1,104 | |||
The statutory tax rates for the period in the Netherlands, UK, China, Canada and Mexico were 25%, 21.5%, 25%, 25% and 30%. The weighted average applicable tax rate for the period was 10.4%.
19. Post-retirement benefits
A subsidiary of the business, Shorewood Packaging Corporation of Canada Limited operates a post-retirement medical plan which is unfunded. Net periodic cost for the plan for the period ended 30 September 2014 is as follows:
| Period ended 30 September 2014 |
||||
| €’000 | ||||
| Service cost |
28 | |||
| Past service credit |
— | |||
| Interest cost |
119 | |||
| Cost / (credit) included in the income statement |
147 | |||
| Re-measurements (recognized in other comprehensive income) |
234 | |||
| Total cost recognized in statement of comprehensive income |
381 | |||
The defined benefit cost for the fiscal period ending 30 September 2014 includes a credit due to special events (curtailment) of €nil in relation to past service costs.
F-171
Table of Contents
NON-EUROPEAN FOLDING CARTON AND LITHOGRAPHIC PRINTING BUSINESS
AGI GLOBAL HOLDINGS COÖPERATIEF U.A.
NOTES TO THE CARVE-OUT COMBINED STATEMENTS
For the nine month period ended 30 September 2014
As at 30 September 2014, the movement in the defined benefit obligation and the fair value of plan assets over the period is as follows:
| Change in benefit obligation |
30 September 2014 |
|||
| €’000 | ||||
| At 1 January |
3,348 | |||
| Service cost |
28 | |||
| Past service cost |
— | |||
| Interest expense |
119 | |||
| Benefits paid |
(138 | ) | ||
| Effect of changes in demographic assumptions |
(72 | ) | ||
| Effect of changes in financial assumptions |
303 | |||
| Effect of experience adjustment |
— | |||
| Reclassification of liabilities to assets held for sale |
(120 | ) | ||
| Exchange rate changes |
146 | |||
| At 30 September 2014 |
3,614 | |||
| Change in plan assets |
30 September 2014 |
|||
| €’000 | ||||
| At 1 January |
— | |||
| Employer direct benefit payment |
138 | |||
| Benefit payment from employer |
(138 | ) | ||
| At 30 September 2014 |
— | |||
The amounts recognized in the carve-out combined statement of comprehensive income are determined as follows:
| 30 September 2014 |
||||
| €’000 | ||||
| Present value of unfunded obligations |
3,614 | |||
| Fair value of plan assets |
— | |||
| Deficit of unfunded plans |
3,614 | |||
| Effect of asset ceiling/onerous liability |
— | |||
| Liability in the carve-out combined statements of financial position |
3,614 | |||
Assumptions were selected based on the movements of key economic indicators in the region.
Weighted-average assumptions used to determine benefit obligations are as follows:
| Period ended 30 September 2014 |
||||
| €’000 | ||||
| Discount rate |
4.0 | % | ||
F-172
Table of Contents
NON-EUROPEAN FOLDING CARTON AND LITHOGRAPHIC PRINTING BUSINESS
AGI GLOBAL HOLDINGS COÖPERATIEF U.A.
NOTES TO THE CARVE-OUT COMBINED STATEMENTS
For the nine month period ended 30 September 2014
Weighted-average assumptions used to determine net periodic benefit cost for the period ended 30 September 2014 are as follows:
| Period ended 30 September 2014 |
||||
| €’000 | ||||
| Discount rate |
4.8 | % | ||
At 30 September 2014 the expected employer contributions for the next fiscal year is €196,000. The estimated future benefit payments are as follows:
| 30 September 2014 |
||||
| €’000 | ||||
| Year 1 |
196 | |||
| Year 2 |
211 | |||
| Year 3 |
225 | |||
| Year 4 |
247 | |||
| Year 5 |
274 | |||
| Next 5 Years |
1,978 | |||
20. Cash (used) / generated from operations
| Period ended 30 September 2014 |
||||
| €’000 | ||||
| Profit / (loss) before income tax including discontinued operations |
379 | |||
| Adjustments for: |
||||
| Depreciation |
1,583 | |||
| Amortization |
803 | |||
| Loss on disposal of fixed assets |
156 | |||
| Post retirement benefits |
386 | |||
| Provision for restructuring cost |
(404 | ) | ||
| Finance costs—net |
495 | |||
| Foreign exchange (gains) on operating activities |
(1,082 | ) | ||
| Changes in working capital (excluding the effects of exchange differences on consolidation): |
||||
| Inventories |
(1,324 | ) | ||
| Trade and other receivables |
(7,834 | ) | ||
| Trade and other payables |
(3,105 | ) | ||
| Cash (used) / from operations |
(9,947 | ) | ||
F-173
Table of Contents
NON-EUROPEAN FOLDING CARTON AND LITHOGRAPHIC PRINTING BUSINESS
AGI GLOBAL HOLDINGS COÖPERATIEF U.A.
NOTES TO THE CARVE-OUT COMBINED STATEMENTS
For the nine month period ended 30 September 2014
21. Commitments under operating leases
The business leases various offices and warehouses under non-cancellable operating lease agreements. The lease terms are between five and ten years, and the majority of lease agreements are renewable at the end of the lease period at market rate.
The business also leases various plant and machinery under non-cancellable operating lease agreements.
The future aggregate minimum lease payments under non-cancellable operating leases are as follows:
| Period ended 30 September 2014 |
||||
| €’000 | ||||
| Operating leases which expire: |
||||
| No later than one year |
655 | |||
| Later than one year and no later than five years |
3,282 | |||
| Later than five years |
120 | |||
| 4,057 | ||||
The amount charged to the income statement in respect of operating lease charges for the period ended 30 September 2014 was €1,231,000.
22. Related parties
The following transactions were carried out with related parties:
(a) Sales of goods and services
| Period ended 30 September 2014 |
||||
| €’000 | ||||
| Sales of goods |
||||
| Atlas AGI Holdings LLC |
8,621 | |||
| International Paper Company |
168 | |||
|
|
|
|||
| 8,789 | ||||
F-174
Table of Contents
NON-EUROPEAN FOLDING CARTON AND LITHOGRAPHIC PRINTING BUSINESS
AGI GLOBAL HOLDINGS COÖPERATIEF U.A.
NOTES TO THE CARVE-OUT COMBINED STATEMENTS
For the nine month period ended 30 September 2014
(b) Purchases of goods and services
| Period ended 30 September 2014 |
||||
| €’000 | ||||
| Purchases of goods: |
||||
| International Paper Company |
9,575 | |||
| Atlas AGI Holdings LLC |
1,109 | |||
|
|
|
|||
| 10,684 | ||||
| Purchases of services: |
||||
| Subsidiaries of parent not included within the business |
179 | |||
| Atlas AGI Holdings LLC |
6,927 | |||
| Intertrust (Netherlands) B.V. |
20 | |||
|
|
|
|||
| 7,126 | ||||
(c) Other Income
| Period ended 30 September 2014 |
||||
| €’000 | ||||
| Other Income |
||||
| Subsidiaries of the parent not included within the business |
203 | |||
Other Income relates to revenue generated from the leasing operation started in 2014.
(d) Period end balances arising from sales / purchases of goods / services
| 30 September 2014 |
||||
| €’000 | ||||
| Receivables: |
||||
| Amounts due from subsidiaries of the parent not included within the business |
4,101 | |||
| Amounts due from related parties: |
||||
| Atlas AGI Holdings LLC |
8,529 | |||
|
|
|
|||
| Total other related party receivable balances |
8,529 | |||
| Payables: |
||||
| Amounts due to subsidiaries of the parent not included within the business |
4,349 | |||
| Amounts due to related parties: |
||||
| Atlas AGI Holdings LLC |
4,975 | |||
| International Paper Company |
2,516 | |||
| Intertrust (Netherlands) B.V. |
15 | |||
|
|
|
|||
| Total other related party payable balances |
7,506 | |||
F-175
Table of Contents
NON-EUROPEAN FOLDING CARTON AND LITHOGRAPHIC PRINTING BUSINESS
AGI GLOBAL HOLDINGS COÖPERATIEF U.A.
NOTES TO THE CARVE-OUT COMBINED STATEMENTS
For the nine month period ended 30 September 2014
(e) Related party borrowing
From International Paper Investments (Luxembourg) S.à.r.l.
| Movement | ||||
| €’000 | ||||
| Subordinated loans from related party |
||||
| At 31 December 2013 |
19,146 | |||
| Interest paid during year |
— | |||
| Interest charged during year |
597 | |||
| Foreign exchange movement |
1,671 | |||
|
|
|
|||
| At 30 September 2014 |
21,414 | |||
This loan is not repayable until April 2019. Interest will accrue daily and compound quarterly at a rate of 4% per annum.
(f) Key management compensation
Key management of the parent includes the compensation paid to the members of the Executive Management team. On 1 April 2014 the position of Chairman was created with the previous position of Chief Executive Officer being eliminated. With this structure change, an increased level of autonomy was given to each of the regions making up the Parent; Europe, Americas and Asia. Prior to 1 April 2014, key management included the Chief Executive Officer and Chief Financial Officer only, and did not include the newly created positions of Chairman and Executive Officers. The compensation paid or payable for certain Executive Management team members for employee services is allocated via the allocation agreement between the Parent and Atlas AGI Holdings LLC. The total amount included for key management compensation within the carved-out business is shown below:
| Period ended 30 September 2014 |
||||
| €’000 | ||||
| Salaries and other short-term employee benefits |
325 | |||
| Post-employment benefits |
5 | |||
|
|
|
|||
| 330 | ||||
F-176
Table of Contents
NON-EUROPEAN FOLDING CARTON AND LITHOGRAPHIC PRINTING BUSINESS
AGI GLOBAL HOLDINGS COÖPERATIEF U.A.
NOTES TO THE CARVE-OUT COMBINED STATEMENTS
For the nine month period ended 30 September 2014
23. Assets held for sale
During 2014, the Parent’s management determined that the Canadian operation in Smith Falls would be transferred out of the carve-out combination to be held by a different subsidiary of the Parent within 12 months of 30 September 2014. The analysis below shows the income statement for this operation over the period.
Discontinued operations income statement
| Period ended 30 September 2014 |
||||
| €’000 | ||||
| Revenue |
2,974 | |||
| Raw materials |
(1,852 | ) | ||
| Employee benefit expense |
(3,202 | ) | ||
| Depreciation and amortisation |
(223 | ) | ||
| Other operating expense |
(714 | ) | ||
| Total expenses and other income |
(5,991 | ) | ||
| Operating loss before tax |
(3,017 | ) | ||
| Tax credit |
785 | |||
| Loss after tax of discontinued operations |
(2,232 | ) | ||
The major assets and liabilities of the Smith Falls operation classified as held for sale at 30 September 2014 were as follows:
| 30 September 2014 |
||||
| €’000 | ||||
| Assets of disposal group classified as held for sale |
||||
| Property, plant and equipment |
1,619 | |||
| Intangible assets |
92 | |||
| Inventories |
711 | |||
| Trade and other receivables |
1,356 | |||
| Deferred tax assets |
67 | |||
| Total assets |
3,845 | |||
| Liabilities of disposal group classified as held for sale |
||||
| Trade and other payables |
119 | |||
| Accrued expenses and other liabilities |
691 | |||
| Deferred tax liabilities |
23 | |||
| Retirement benefit obligations |
120 | |||
| Provisions |
79 | |||
| Total liabilities |
1,032 | |||
F-177
Table of Contents
NON-EUROPEAN FOLDING CARTON AND LITHOGRAPHIC PRINTING BUSINESS
AGI GLOBAL HOLDINGS COÖPERATIEF U.A.
NOTES TO THE CARVE-OUT COMBINED STATEMENTS
For the nine month period ended 30 September 2014
The cash flows of the Smith Falls operation were as follows:
| Period ended 30 September 2014 |
||||
| €’000 | ||||
| Operating cash flows |
(3,925 | ) | ||
| Investing cash flows |
— | |||
| Financing cash flows |
3,925 | |||
| Total cash flows |
— | |||
24. Reconciliation between IFRS and US generally accepted accounting principles for the nine month period ended 30 September 2014
Accounting principles
The carve-out combined financial statements of the Non-European Folding Carton and Lithographic Printing Business of AGI Global Holdings Coöperatief U.A. have been prepared in accordance with IFRS which differs from US GAAP in certain respects. The application of the latter pursuant to Item 18 of Form 20-F would have affected the determination of profit for the nine months ended 30 September 2014 and the determination of parent’s net investment at 30 September 2014 is set out in the tables below:
1. Adjustments to net profit
| Period ended 30 September 2014 |
||||||||
| Note | €’000 | |||||||
| Profit for the period in accordance with IFRS |
60 | |||||||
| US GAAP adjustments: |
||||||||
| Capitalised software |
(a | ) | 54 | |||||
| Post Retirement Benefit |
(b | ) | 103 | |||||
| Tax impact of above differences |
(34 | ) | ||||||
| Profit for the period in accordance with US GAAP |
183 | |||||||
2 Adjustments to Parent’s Net Investment in the Business
| 30 September 2014 |
||||||||
| Notes | €’000 | |||||||
| Parent’s Net Investment in the Business in accordance with IFRS |
56,140 | |||||||
| US GAAP adjustments: |
||||||||
| Capitalised software |
(a | ) | (106 | ) | ||||
| Tax impact of above difference |
16 | |||||||
| Parent’s Net Investment in the Business in accordance with US GAAP |
56,050 | |||||||
F-178
Table of Contents
NON-EUROPEAN FOLDING CARTON AND LITHOGRAPHIC PRINTING BUSINESS
AGI GLOBAL HOLDINGS COÖPERATIEF U.A.
NOTES TO THE CARVE-OUT COMBINED STATEMENTS
For the nine month period ended 30 September 2014
| a) | Amortisation on Computer Software |
IFRS permits the capitalisation of internally developed software expenditure if specific criteria are met. However US GAAP does not permit such expenditure to be capitalised and instead it should be expensed as and when it occurs. The amounts to be reversed in the income statement for amortisation charged is €54,000 in 2014.
| b) | Post Retirement Benefit Scheme |
Under US GAAP, certain costs relating to prior periods and actuarial gains are recognised in the income statement over a period of years, rather than taken to other comprehensive income (OCI) within reserves immediately as they are under IFRS. The adjustment of €103,000 for the period ended 30 September 2014 relates to the impact on the income statement of the reversal of such amounts in OCI within reserves in equity. In addition, the impact above includes the creation of the accumulated other comprehensive loss (AOCI) reserve within parent’s net investment in the business and the net change each year in this balance. As there are no differences between US GAAP and IFRS in the parent’s net investment in the business, there is no adjustment required to be made in the statement of financial position.
3 Intangible Assets
The estimated aggregate amortization expense for each of the next five years, and thereafter, is as follows:
| Fiscal Year |
€’000 | |||
| Remainder of 2014 |
257 | |||
| 2015 |
1,026 | |||
| 2016 |
943 | |||
| 2017 |
77 | |||
| 2018 |
77 | |||
| Thereafter |
1,682 | |||
4. Deferred Taxes
The analysis of deferred tax assets and deferred tax liabilities as presented in accordance with IFRS would be presented according to US GAAP disclosure requirements as follows:
| 30 September 2014 | ||||
| €’000 | ||||
| Deferred tax assets: |
||||
| Deferred tax asset to be recovered after more than 12 months |
8,785 | |||
| Deferred tax asset to be recovered within 12 months |
1,953 | |||
| Total deferred tax assets |
10,738 | |||
| Deferred tax liabilities: |
||||
| Deferred tax liability to be recovered after more than 12 months |
(2,505 | ) | ||
| Deferred tax liability to be recovered within 12 months |
— | |||
| Total deferred tax liabilities |
(2,505 | ) | ||
| Valuation allowance |
(1,514 | ) | ||
| Deferred tax assets (net) |
6,719 | |||
F-179
Table of Contents
NON-EUROPEAN FOLDING CARTON AND LITHOGRAPHIC PRINTING BUSINESS
AGI GLOBAL HOLDINGS COÖPERATIEF U.A.
NOTES TO THE CARVE-OUT COMBINED STATEMENTS
For the nine month period ended 30 September 2014
5. Fair Value of Financial Instruments
The Non-European Folding Carton and Lithographic Printing Business’s financial instruments include cash, trade receivables, trade payables and long term debt. The carrying amounts of cash, trade receivables and trade payables approximate fair value because of the short maturity of these instruments. The Parent’s debt obligations are not actively traded, and as a result no published fair value is available. The Parent estimated the fair value of long-term debt (Level 2) to be consistent with the aggregated carrying values at 30 September 2014.
6 Cash flow statement for the nine month period ended 30 September 2014
The carve-out combined cash flow statement has been prepared under IFRS and presents substantially the same information as required under US GAAP. There are certain differences with regard to classification of items within the cash flow statement namely interest received. The following table presents cash flows as classified under US GAAP.
| Period ended 30 September 2014 |
||||
| €’000 | ||||
| Net cash provided by operating activities |
(10,851 | ) | ||
| Net cash used in investing activities |
(9,881 | ) | ||
| Net cash used in financing activities |
12,866 | |||
| Net (decrease) in cash and cash equivalents |
(7,866 | ) | ||
| Exchange rate movements |
1,260 | |||
| Cash and cash equivalents at beginning of period |
26,462 | |||
| Cash and cash equivalents at end of period |
19,856 | |||
New accounting pronouncements under US GAAP
On 10 April 2014, the Financial Accounting Standards Board (“FASB”) issued Accounting Standards Update No. 2014-08 (“ASU-2014-08”), Reporting Discontinued Operations and Disclosures of Disposals of Components of an Entity, which changes the criteria for determining which disposals can be presented as discontinued operations and modifies related disclosure requirements. Under the new guidance, a discontinued operation is defined as a disposal of a component or group of components that is disposed of or is classified as held for sale and represents a strategic shift that has (or will have) a major effect on an entity’s operations and financial results, a business that upon acquisition qualifies as held for sale will also be a discontinued operation, and activities are no longer precluded from being presented as a discontinued operation if (i) there are operations and cash flows of the component that have not been eliminated from the reporting entity’s ongoing operations, or (ii) there is significant continuing involvement with a component after its disposal. ASU 2014-08 also introduces several new disclosures, including, but not limited to, a requirement to present in the statement of cash flows or disclose in a note either (i) total operating and investing cash flows for discontinued operations, or (ii) depreciation, amortisation, capital expenditures, and significant operating and investing noncash items related to discontinued operations, additional disclosures when an entity retains significant continuing involvement with a discontinued operation after its disposal, including the amount of cash flows to and from a discontinued operation, and for disposals of individually significant components that do not qualify as discontinued operations,
F-180
Table of Contents
NON-EUROPEAN FOLDING CARTON AND LITHOGRAPHIC PRINTING BUSINESS
AGI GLOBAL HOLDINGS COÖPERATIEF U.A.
NOTES TO THE CARVE-OUT COMBINED STATEMENTS
For the nine month period ended 30 September 2014
a disclosure of pre-tax earnings of the disposed component. ASU 2014-08 also requires an entity to reclassify the assets and liabilities of a discontinued operation that is classified as held for sale or disposed of in the current period for the comparative periods presented in the statement of financial position.
The guidance in ASU 2014-08 applies prospectively to new disposals and new classifications of disposal groups as held for sale after the effective date and is required to be adopted by public business entities in annual periods beginning on or after 15 December 2014, and interim periods within those annual periods. It is effective for all other entities, including non-public entities, in annual periods beginning on or after 15 December 2015, and interim periods beginning on or after 15 December 2015, with early adoption permitted.
In May 2014, the FASB issued ASU No. 2014-09, Revenue from Contracts with Customers (Topic 606)(“ASU 2014-09”). ASU 2014-09 is a new comprehensive standard for revenue recognition that is based on the core principle that revenue be recognized in a manner that depicts the transfer of goods or services to customers in an amount that reflects the consideration to which the entity expects to be entitled in exchange for those goods or services. Under the new standard, a good or service is transferred to the customer when (or as) the customer obtains control of the good or service, which differs from the risk and rewards approach under current guidance. The new standard provides guidance for transactions that were not previously addressed comprehensively, including service revenue and contract modifications, eliminates industry-specific revenue recognition guidance, including that for software, and requires enhanced disclosures about revenue. ASU 2014-09 affects any entity that either enters into contracts with customers to transfer goods or services or enters into contracts to transfer nonfinancial assets outside of the entity’s ordinary activities except for certain contracts within the scope of other standards (such as leases). Areas of potential change include, but are not limited to, units of accounting, the determination of the transaction price, the allocation of the transaction price to multiple goods and services, transfer of control, software licenses, and capitalization of contract costs. The Business is evaluating the effect this ASU will have on its financial statements.
In August 2014, the Financial Accounting Standards Board (“FASB”) issued Accounting Standards Update No. 2014-15, Presentation of Financial Statements—Going Concern (Subtopic 205-40): Disclosure of Uncertainties about an Entity’s Ability to Continue as a Going Concern, which is intended to define management’s responsibility to evaluate whether there is substantial doubt about an organization’s ability to continue as a going concern and to provide related footnote disclosures as well as increasing consistency in the timing and content of footnote disclosures when the organization identifies conditions or events that raise substantial doubt . The amendments in this Update are effective for the annual period ending after 15 December 2016, and for annual periods and interim periods thereafter. Early application is permitted.
Implementation of these recent accounting pronouncements are not expected to have a material effect on the Non-European Folding Carton and Lithographic Printing Business’s special purpose carve-out financial statements.
25. Subsequent events
Subsequent to 30 September 2014 the Parent, AGI Global I B.V. and AGI-Shorewood Group US Holdings, LLC entered into a definitive agreement on 2 November 2014 for the sale of the Non-European and US Folding Carton and Lithographic Printing Business to Multi Packaging Solutions (“MPS”). These financial statements have been prepared and are being presented as at the close of business on 30 September 2014 prior to the expected acquisition by MPS upon the closing of the transaction.
F-181
Table of Contents
MULTI PACKAGING SOLUTIONS INTERNATIONAL LIMITED
| F-183 | ||||
| Financial Statement |
||||
| F-184 | ||||
| F-185 | ||||
F-182
Table of Contents
REPORT OF INDEPENDENT REGISTERED PUBLIC ACCOUNTING FIRM
To the Board of Directors and Shareholders of
Multi Packaging Solutions International Limited:
We have audited the accompanying balance sheet of Multi Packaging Solutions International Limited (the “Company”) as of June 30, 2015. This balance sheet is the responsibility of the Company’s management. Our responsibility is to express an opinion on this balance sheet based on our audit.
We conducted our audit in accordance with the standards of the Public Company Accounting Oversight Board (United States). Those standards require that we plan and perform the audit to obtain reasonable assurance about whether the balance sheet is free of material misstatement. We were not engaged to perform an audit of the Company’s internal control over financial reporting. Our audit included consideration of internal control over financial reporting as a basis for designing audit procedures that are appropriate in the circumstances, but not for the purpose of expressing an opinion on the effectiveness of the Company’s internal control over financial reporting. Accordingly, we express no such opinion. An audit also includes examining, on a test basis, evidence supporting the amounts and disclosures in the balance sheet, assessing the accounting principles used and significant estimates made by management, and evaluating the overall balance sheet presentation. We believe that our audit of the balance sheet provides a reasonable basis for our opinion.
In our opinion, the balance sheet referred to above presents fairly, in all material respects, the financial position of Multi Packaging Solution International Limited at June 30, 2015, in conformity with U.S. generally accepted accounting principles.
/s/ Ernst & Young, LLP
Detroit, Michigan
September 11, 2015
F-183
Table of Contents
MULTI PACKAGING SOLUTIONS INTERNATIONAL LIMITED
BALANCE SHEET
| June 30, 2015 | ||||
| Assets |
||||
| Cash |
$ | 10,000 | ||
|
|
|
|||
| Total Assets |
$ | 10,000 | ||
|
|
|
|||
| Shareholders’ Equity |
||||
| Common shares, $1.00 par value per share, 10,000 shares authorized, 2 shares issued and outstanding |
$ | 2 | ||
| Additional paid-in capital |
9,998 | |||
|
|
|
|||
| Total Shareholders’ Equity |
$ | 10,000 | ||
|
|
|
|||
See accompanying note to the balance sheet.
F-184
Table of Contents
In connection with this offering, Multi Packaging Solutions International Limited, a Bermuda exempted company incorporated under the laws of Bermuda, was formed on June 19, 2015. Multi Packaging Solutions International Limited has nominal assets and no liabilities and has conducted no operations. Immediately prior to the closing of this offering, it will acquire all of the outstanding equity interests of Multi Packaging Solutions Global Holdings Limited from its existing equity holders in exchange for common shares and, as a result, Multi Packaging Solutions Global Holdings Limited will become a wholly-owned subsidiary of Multi Packaging Solutions International Limited.
Other than the initial capitalization of Multi Packaging Solutions International Limited, no other business has been transacted.
SUBSEQUENT EVENTS
Multi Packaging Solutions International Limited has evaluated all events that occurred subsequent to June 30, 2015 through September 11, 2015 (the date the balance sheet was available to be issued).
F-185
Table of Contents
MULTI PACKAGING SOLUTIONS INTERNATIONAL LIMITED AND SUBSIDIARIES INTRODUCTION TO UNAUDITED PRO FORMA CONDENSED COMBINED STATEMENTS OF OPERATIONS
The following tables set forth the unaudited pro forma condensed combined statements of operations for the year ended June 30, 2015, which have been prepared to illustrate the effects of the following acquisitions (collectively, the “Acquisitions”) as if they had occurred on July 1, 2014:
| • | the acquisition of, the Non-European Folding Carton and Lithographic Printing Business of AGI Global Holdings Coöperatief U.A. and the U.S. Folding Carton and Lithographic Printing Business of Atlas AGI Holdings LLC (collectively, “ASG”) on November 21, 2014, and |
| • | Armstrong Packaging Limited (“Armstrong”) acquired July 8, 2014, and |
| • | Presentation Products Group (Presentation Products”) acquired on February 28, 2015. |
The pro forma adjustments and the assumptions underlying the pro forma adjustments are described in the accompanying notes, which should be read in conjunction with the unaudited pro forma condensed combined statements of operations.
The unaudited pro forma adjustments are based on available information and certain assumptions that we believe are reasonable under the circumstances. The unaudited pro forma combined financial data is presented for informational purposes only. The unaudited pro forma combined financial data does not purport to represent what our results of operations would have been had the Acquisitions occurred on the date indicated, nor does it purport to project our results of operations for any future period. The unaudited pro forma combined financial data should be read in conjunction with the information included under the headings “Management’s Discussion and Analysis of Financial Condition and Results of Operations—Key Transactions,” “Summary—Summary Historical Audited Consolidated and Unaudited Pro Forma Combined Financial Data” and “Management’s Discussion and Analysis of Financial Condition and Results of Operations” and the consolidated financial statements and related notes appearing elsewhere in this prospectus.
The unaudited pro forma condensed combined statements of operations data give effect to adjustments that are (i) directly attributable to the Acquisitions, (ii) factually supportable, and (iii) expected to have a continuing impact or are recurring. The Acquisitions have been accounted for using the acquisition method of accounting.
The historical statements of operations information of MPS have been prepared in accordance with generally accepted accounting principles in the United States of America (“US GAAP”) and derived from the audited financial statements of the MPS Successor for the year ended June 30, 2015, appearing elsewhere in this prospectus.
The historical statement of operations information of ASG was obtained from the unaudited financial information and reflects adjustments from International Financial Accounting Standards to US GAAP as well as currency conversion from Euros to US Dollars for the international entity only and have been converted from a December 31 reporting period to a fiscal year commencing July 1 on the basis of management’s adjustments utilizing books and records.
The historical statements of operations information of Presentation Products was obtained from the unaudited financial information which reflects adjustments from UK GAAP to US GAAP. Presentation Products was converted from a fiscal year ending February 28, to a fiscal year commencing July 1.
The unaudited pro forma combined financial information presented for the Acquisitions is based on preliminary estimates, available information and assumptions and will be revised as additional information becomes available. The actual adjustments to our consolidated financial statements will depend on a number of factors. Therefore, the actual adjustments will differ from the pro forma adjustments and the difference may be material. The unaudited pro forma combined financial information also does not project or forecast the Company’s consolidated results of operations for any future period. Additionally, the unaudited pro forma combined financial information does not reflect the use of proceeds from the offering.
F-186
Table of Contents
MULTI PACKAGING SOLUTIONS INTERNATIONAL LIMITED AND SUBSIDIARIES
UNAUDITED PRO FORMA CONDENSED
COMBINED STATEMENT OF OPERATIONS
FOR THE YEAR ENDED JUNE 30, 2015
(in thousands, except per share data)
| MPS | ASG – for the period July 1, 2014 – November 21, 2014 |
Presentation Products for the period July 1, 2014 – February 28, 2015 |
Pro Forma Adjustments |
Notes | Total Pro Forma |
|||||||||||||||||||
| Net sales |
$ | 1,617,640 | $ | 161,354 | $ | 28,519 | $ | — | $ | 1,807,513 | ||||||||||||||
| Cost of goods sold |
1,285,673 | 137,601 | 23,764 | 749 | a | 1,447,787 | ||||||||||||||||||
|
|
|
|
|
|
|
|
|
|
|
|||||||||||||||
| Gross margin |
331,967 | 23,753 | 4,755 | (749 | ) | 359,726 | ||||||||||||||||||
| Selling, general and administrative expenses: |
||||||||||||||||||||||||
| Selling, general and administrative |
247,360 | 21,534 | 1,901 | 578 | b | 271,373 | ||||||||||||||||||
| Management fees and expenses |
— | 236 | — | — | 236 | |||||||||||||||||||
| Transaction related expenses |
13,630 | 106 | — | (11,533 | ) | c | 2,203 | |||||||||||||||||
|
|
|
|
|
|
|
|
|
|
|
|||||||||||||||
| Total selling, general and administrative expenses |
260,990 | 21,786 | 2,854 | (10,955 | ) | 273,812 | ||||||||||||||||||
|
|
|
|
|
|
|
|
|
|
|
|||||||||||||||
| Operating income |
70,977 | 1,877 | 2,349 | 10,206 | 85,914 | |||||||||||||||||||
| Other income (expense) |
||||||||||||||||||||||||
| Other income |
10,625 | 3,973 | 14 | — | 14,612 | |||||||||||||||||||
| Debt extinguishment charges |
(1,019 | ) | — | — | — | (1,019 | ) | |||||||||||||||||
| Interest expense |
(75,437 | ) | (525 | ) | (146 | ) | (1,828 | ) | d | 77,936 | ||||||||||||||
|
|
|
|
|
|
|
|
|
|
|
|||||||||||||||
| Total other expense, net |
(65,831 | ) | 3,448 | (132 | ) | (1,828 | ) | 64,343 | ||||||||||||||||
|
|
|
|
|
|
|
|
|
|
|
|||||||||||||||
| Income before income taxes |
5,146 | 5,325 | 2,722 | 8,378 | 21,571 | |||||||||||||||||||
| Income tax benefit (expense) |
1,880 | (788 | ) | (855 | ) | (7,636 | ) | e | (7,399 | ) | ||||||||||||||
|
|
|
|
|
|
|
|
|
|
|
|||||||||||||||
| Net income |
$ | 7,026 | $ | 4,537 | $ | 1,867 | $ | 742 | $ | 14,172 | ||||||||||||||
|
|
|
|
|
|
|
|
|
|
|
|||||||||||||||
| Earnings Per Common Share |
||||||||||||||||||||||||
| Basic |
$ | 0.07 | ||||||||||||||||||||||
|
|
|
|||||||||||||||||||||||
| Diluted |
$ | 0.07 | ||||||||||||||||||||||
|
|
|
|||||||||||||||||||||||
| Weighted Average Common Shares Outstanding |
||||||||||||||||||||||||
| Basic |
207,302,868 | |||||||||||||||||||||||
|
|
|
|||||||||||||||||||||||
| Diluted |
207,302,868 | |||||||||||||||||||||||
|
|
|
|||||||||||||||||||||||
F-187
Table of Contents
MULTI PACKAGING SOLUTIONS INTERNATIONAL LIMITED AND SUBSIDIARIES
NOTES TO UNAUDITED PRO FORMA CONDENSED COMBINED FINANCIAL STATEMENTS FOR THE YEAR ENDED JUNE 30, 2015
(in thousands)
| (a) | Cost of goods sold adjustments – Depreciation expense |
| Adjustment | ||||
| Presentation Products |
$ | 46 | ||
| ASG |
703 | |||
|
|
|
|||
| Total |
$ | 749 | ||
|
|
|
|||
To record additional depreciation on fixed asset step-up.
| (b) | Selling, general and administrative expenses |
| Adjustment | ||||
| Presentation Products |
$ | 578 | ||
|
|
|
|||
| Total |
$ | 578 | ||
|
|
|
|||
To record depreciation and amortization expense on fair value adjustments on fixed assets and intangible asset step-ups.
| (c) | Transaction costs |
| Adjustment | ||||
| MPS |
$ | 579 | ||
| Chesapeake—Predecessor |
5,138 | |||
| Jet |
428 | |||
| IPS |
69 | |||
| Presentation Products |
257 | |||
| Armstrong |
202 | |||
| ASG |
4,860 | |||
|
|
|
|||
| Total |
$ | 11,533 | ||
|
|
|
|||
To eliminate transaction costs paid by MPS directly attributable to the Acquisitions.
| (d) | Interest expense |
| Adjustment | ||||
| ASG |
$ | 1,828 | ||
|
|
|
|||
| Total |
$ | 1,828 | ||
|
|
|
|||
To record the incremental interest expense related to debt directly attributable to the Acquisitions.
F-188
Table of Contents
MULTI PACKAGING SOLUTIONS INTERNATIONAL LIMITED AND SUBSIDIARIES
NOTES TO UNAUDITED PRO FORMA CONDENSED COMBINED FINANCIAL STATEMENTS FOR THE YEAR ENDED JUNE 30, 2015—(Continued)
(in thousands)
| (e) | Income taxes at effective rate |
| Adjustment | ||||
| MPS |
$ | (7,636 | ) | |
|
|
|
|||
| Total |
$ | (7,636 | ) | |
|
|
|
|||
To record the income tax impact of the pro forma adjustments and to adjust the tax rate to 34.3%, the historical effective rate of MPS.
F-189
Table of Contents
Through and including , 2015 (the 25th day after the date of this prospectus), all dealers effecting transactions in these securities, whether or not participating in this offering, may be required to deliver a prospectus. This is in addition to the dealers’ obligation to deliver a prospectus when acting as underwriters and with respect to their unsold allotments or subscriptions.
Shares

Multi Packaging Solutions International Limited
Common Shares
PROSPECTUS
| BofA Merrill Lynch | Barclays |
Citigroup
| Credit Suisse | Goldman, Sachs & Co. | UBS Investment Bank |
| Baird | BMO Capital Markets |
, 2015
Table of Contents
PART II
INFORMATION NOT REQUIRED IN PROSPECTUS
Item 13. Other Expenses of Issuance and Distribution.
The actual and estimated expenses in connection with this offering, all of which will be borne by us, are as follows:
| SEC Registration Fee |
$ | 11,600 | ||
| FINRA Filing Fee |
15,500 | |||
| Printing and Engraving Expense |
* | |||
| Legal Fees |
* | |||
| Accounting Fees |
* | |||
| Blue Sky Fees |
* | |||
| Stock Exchange Listing Fees |
* | |||
| Transfer Agent Fee |
* | |||
| Miscellaneous |
* | |||
|
|
|
|||
| Total |
$ | * | ||
|
|
|
| * | To be filed by amendment. |
Item 14. Indemnification of Directors and Officers.
Section 98 of the Companies Act provides generally that a Bermuda company may indemnify its directors, officers and auditors against any liability which by virtue of any rule of law would otherwise be imposed on them in respect of any negligence, default, breach of duty or breach of trust, except in cases where such liability arises from fraud or dishonesty of which such director, officer or auditor may be guilty in relation to the company. Section 98 further provides that a Bermuda company may indemnify its directors, officers and auditors against any liability incurred by them in defending any proceedings, whether civil or criminal, in which judgment is awarded in their favor or in which they are acquitted or granted relief by the Supreme Court of Bermuda pursuant to section 281 of the Companies Act.
We have adopted provisions in our bye-laws that provide that we shall indemnify our officers and directors in respect of their actions and omissions, except in respect of their fraud or dishonesty. Our bye-laws provide that the shareholders waive all claims or rights of action that they might have, individually or in right of the company, against any of the company’s directors or officers for any act or failure to act in the performance of such director’s or officer’s duties, except in respect of any fraud or dishonesty of such director or officer. Section 98A of the Companies Act permits us to purchase and maintain insurance for the benefit of any officer or director in respect of any loss or liability attaching to him in respect of any negligence, default, breach of duty or breach of trust, whether or not we may otherwise indemnify such officer or director. We have purchased and maintain a directors’ and officers’ liability policy for such a purpose.
In the underwriting agreement, the underwriters will agree to indemnify, under certain conditions, the registrant, members of the registrant’s Board of Directors, officers and persons who control the registrant within the meaning of the Securities Act, against certain liabilities. See “Item 17. Undertakings” for a description of the Commission’s position regarding such indemnification provisions.
Item 15. Recent Sales of Unregistered Securities.
None.
II-1
Table of Contents
Item 16. Exhibits and Financial Statement Schedules.
(a) Exhibits
A list of exhibits required to be filed under this item is set forth on the Exhibit Index of this registration statement and is incorporated in this Item 16(a) by reference.
(b) Financial Statement Schedules
Schedule I
Parent Company only Financial Statements required to be filed under this item are set forth in Item 8 of this registration statement and is incorporated in this Item 16(b) by reference.
Item 17. Undertakings.
The undersigned registrant hereby undertakes to provide to the underwriters at the closing specified in the underwriting agreement certificates in such denominations and registered in such names as required by the underwriters to permit prompt delivery to each purchaser.
Insofar as indemnification for liabilities arising under the Securities Act may be permitted to our directors, officers, and controlling persons pursuant to the foregoing provisions, or otherwise, we have been advised that in the opinion of the SEC such indemnification is against public policy as expressed in the Securities Act and is, therefore, unenforceable. In the event that a claim for indemnification against such liabilities (other than the payment by us of expenses incurred or paid by a director, officer, or controlling person of us in the successful defense of any action, suit, or proceeding) is asserted by such director, officer, or controlling person in connection with the securities being registered, we will, unless in the opinion of counsel the matter has been settled by controlling precedent, submit to a court of appropriate jurisdiction the question whether such indemnification by us is against public policy as expressed in the Securities Act and will be governed by the final adjudication of such issue.
We hereby undertake that:
| (i) | for purposes of determining any liability under the Securities Act, the information omitted from the form of prospectus filed as part of this registration statement in reliance upon Rule 430A and contained in a form of prospectus filed by the registrant pursuant to Rule 424(b)(1) or (4) or 497(h) under the Securities Act shall be deemed to be part of this registration statement as of the time it was declared effective. |
| (ii) | for purposes of determining any liability under the Securities Act, each post-effective amendment that contains a form of prospectus shall be deemed to be a new registration statement relating to the securities offered therein, and the offering of such securities at that time shall be deemed to be the initial bona fide offering thereof. |
II-2
Table of Contents
SIGNATURES
Pursuant to the requirements of the Securities Act of 1933 the registrant has duly caused this registration statement to be signed on its behalf by the undersigned, thereunto duly authorized, in the city of New York, state of New York, on September 30, 2015.
| Multi Packaging Solutions International Limited | ||
| By: | /s/ Marc Shore | |
| Marc Shore Chief Executive Officer | ||
Pursuant to the requirements of the Securities Act of 1933, this registration statement has been signed by the following persons in the capacities and as of the dates indicated.
| Signature |
Title |
Date | ||
| /s/ Marc Shore Marc Shore |
Chairman of the Board and Chief Executive Officer (Principal Executive Officer) | September 30, 2015 | ||
| /s/ William H. Hogan William H. Hogan |
Executive Vice President, Chief Financial Officer and Authorized Representative in the United States (Principal Financial Officer and Principal Accounting Officer) |
September 30, 2015 | ||
| * Eric Kump |
Director | September 30, 2015 | ||
| * Thomas S. Souleles |
Director | September 30, 2015 | ||
| *By: | /s/ William H. Hogan | |||
| Name: | William H. Hogan | |||
| Title: | Executive Vice President, Chief Financial Officer | |||
II-3
Table of Contents
EXHIBIT INDEX
| EXHIBIT NO. |
DESCRIPTION OF EXHIBIT | |
| 1.1* | Form of Underwriting Agreement | |
| 3.1* | Form of Amended Memorandum of Association of Multi Packaging Solutions International Limited | |
| 3.2* | Form of Amended and Restated Bye-laws of Multi Packaging Solutions International Limited | |
| 4.1** | Indenture governing the 8.500% Senior Notes due 2021, dated August 15, 2013 (the “Indenture”), among Multi Packaging Solutions, Inc. (successor by merger to Mustang Merger Corp.) as Issuer, and Wells Fargo Bank, National Association, as Trustee | |
| 4.2** | Form of 8.500% Senior Note due 2021 (included in Exhibit 4.1) | |
| 4.3** | Second Supplemental Indenture to the Indenture, dated as of December 12, 2013, by and among Multi Packaging Solutions, Inc. (successor by merger to Mustang Merger Corp.), the Guarantors party thereto and Wells Fargo Bank, National Association, as Trustee | |
| 4.4* | Specimen Common Share Certificate | |
| 5.1 | Form of Opinion of Conyers Dill & Pearman Pte. Ltd. | |
| 10.1** | Second Amendment and Waiver to the Credit Agreement and First Amendment to the Security Agreement, dated as of December 24, 2013, by and among Chesapeake/MPS Merger Limited (f/k/a Chesapeake Services Limited, f/k/a Chase BidCo Limited), Chesapeake US Holdings Inc. (f/k/a Chase US Holdco Inc.), Chesapeake Finance 2 Limited (f/k/a Chase MidCo 2 Limited), each Lender party thereto, Barclays Bank PLC as Administrative Agent, Collateral Agent, initial Dollar Tranche A Lender and initial Dollar Tranche B Lender, and the Lenders under the Dollar Revolving Credit Facility party thereto | |
| 10.2 | Second Amended and Restated Employment Agreement between Marc Shore, Multi Packaging Solutions, Inc. and Chesapeake Finance 2 Limited, dated February 14, 2014 | |
| 10.3 | Employment Agreement between Rick Smith and Chesapeake Limited, dated September 30, 2014 | |
| 10.4 | Letter Agreement between Rick Smith and Multi Packaging Solutions UK Limited, executed December 11, 2014 | |
| 10.5 | Letter Agreement between Rick Smith and Multi Packaging Solutions UK Limited, dated November 25, 2014 | |
| 10.6* | 2014/2015 Manager Incentive Plan | |
| 10.7* | 2015 Incentive Award Plan | |
| 10.8 | Separation Agreement between Mike Cheetham, Multi Packaging Solutions UK Limited, Chesapeake Holdings Limited and CEP III Chase S.à r.l., dated October 8, 2014 | |
| 21.1** | List of Subsidiaries of Multi Packaging Solutions International Limited | |
| 23.1 | Consent of Conyers Dill & Pearman Pte. Ltd. (included in Exhibit 5.1) | |
| 23.2 | Consent of Ernst & Young LLP | |
| 23.3 | Consent of Deloitte LLP | |
| 23.4 | Consent of PricewaterhouseCoopers LLP | |
| 23.5 | Consent of PricewaterhouseCoopers LLP | |
| 23.6** | Consent of Director Nominee (Zeina Bain) | |
II-4
Table of Contents
| EXHIBIT NO. |
DESCRIPTION OF EXHIBIT | |
| 23.7** | Consent of Director Nominee (Richard H. Copans) | |
| 23.8 | Consent of Director Nominee (George Bayly) | |
| 23.9 | Consent of Director Nominee (Gary McGann) | |
| 24.1** | Powers of Attorney (included in the signature pages to this registration statement) | |
| * | To be filed by amendment. |
| ** | Previously filed. |
II-5