Attached files
| file | filename |
|---|---|
| 8-K - FORM 8-K - InfuSystem Holdings, Inc | d14280d8k.htm |
 CORPORATE PRESENTATION
SEPTEMBER 2015
(NYSE MKT: INFU)
Exhibit 99.1 |
 Safe Harbor Statement
2 INNOVATION | TEAMWORK | INTEGRITY | FOCUS | PEOPLE FIRST
Certain statements contained in this presentation are forward-looking
statements and are based on future expectations, plans and
prospects for the business and operations of InfuSystem Holdings,
Inc. (“InfuSystem” or “the Company”) that
involve a number of risks and uncertainties. In connection with the “safe harbor” provisions of the Private Securities Litigation Reform Act of 1995, the Company is identifying certain factors
that could cause actual results to materially differ from those indicated by
these forward-looking statements. Those factors, risks and
uncertainties include, but are not limited to: potential changes in overall healthcare reimbursement, including CMS competitive bidding; sequestration; concentration of customers; increased
focus on early detection of cancer; competitive treatments; dependency on
Medicare Supplier Number; availability of chemotherapy drugs;
global financial conditions; changes and enforcement of state and federal laws; dependency on suppliers; risks associated with acquisitions and joint ventures, including integration risks;
US Healthcare Reform; relationships with healthcare professionals and
organizations; technological changes related to infusion therapy;
dependency on websites and intellectual property; dependency on key personnel; dependency on banking relationships; risks associated with our common stock, as well as any litigation to
which the Company may be subject from time to time; and other risk factors as
discussed in the Company’s annual report on Form 10-K
for the year ended December 31, 2014 and in subsequent filings made by the Company from time to time with the Securities and Exchange Commission (the “SEC”), which can be obtained
via the SEC’s Edgar website or by contacting the Company or the SEC.
Forward-looking statements in this presentation are made as
of September 29, 2015, and, unless required by law, the Company disclaims any duty to supplement, update or revise such statements, whether as a result of subsequent developments, changed
expectations or otherwise. The Company regularly posts important
information to the investors section of its website.
|
 InfuSystem provides infusion pumps and related products and services for patients in the home, oncology clinics, ambulatory surgery centers, and other
health care sites.
• Improving access to quality medical equipment required by clinicians • Delivering products and processes that drive down the cost of infusion care
• Promoting patient care and safety, optimizing clinical outcomes About InfuSystem ® (NYSE MKT: INFU) 3 INNOVATION | TEAMWORK | INTEGRITY | FOCUS | PEOPLE FIRST
|
 Investment Highlights
4 INNOVATION | TEAMWORK | INTEGRITY | FOCUS | PEOPLE FIRST
• InfuSystem is a dominant provider in the at-home oncology infusion pump market • 30%+ market share • Business generates substantial annual cash flow • $16.1 M AEBITDA in 2014 • $8.5 M of Free Cash Flow* • Substantial barriers to entry for potential new market entrants • Pump fleet / Insurance contracts / EMR • 11 of the last 12 quarters have been profitable • New management team took over 3 years ago • Strong gross margins, consistently above 70% • Industry leading EMR connectivity to hospitals and clinics • Significantly Reduced Cost of Capital $39.0 $47.2 $54.6 $58.8 $62.3 $66.5 $0 $10 $20 $30 $40 $50 $60 $70 FY2009 FY2010 FY2011 FY2012 FY2013 FY2014 Revenue $10.3 $13.1 $16.0 $16.1 $0 $2 $4 $6 $8 $10 $12 $14 $16 $18 FY2011 FY2012 FY2013 FY2014 Adjusted EBITDA* 2014 does NOT add-back the following charges: G&A expense on IT and Pain
Management initiatives of $0.7M, a write-off of pumps $0.4M, severance of
$0.2M *See appendix for Reg G tables. Free Cash Flow =
“Adjusted EBITDA” less “Replacement Cost of
Retired Pumps” less “Scheduled Debt Payments of Principal” less
“Interest on Debt” |
 InfuSystem: Leading Provider of Oncology
Infusion Pumps 5 INNOVATION | TEAMWORK | INTEGRITY | FOCUS | PEOPLE FIRST
Four Revenue Streams to Drive Cash Flows
(FY 2014) *As of June 30, 2015 72% 13% 12% 3% Rental: Patient-Based (TPP) Rental: Hospital & Home Care Based (DP) Sales: Product Sales Rental: Service and Repair Core Business: Leading provider to Patients, Hospitals and Infusion Clinics in North America • InfuSystem enables oncology patients the comforts of at-home treatment • Permits hospitals and clinics access to INFU’s large inventory without a capital equipment purchase, while improving patient outcomes and driving down healthcare costs. • INFU generates consistent recurring rental revenue Key differentiators / Competitive Advantages • Largest inventory & fleet of infusion pumps: ~60,000* • ~300 payor contracts / ~1,600 cancer therapy sites* • World-class ISO service centers • Significant barriers to entry for new participants Growth Drivers • Pain Management expansion • Innovative EMR connectivity “InfuConnect” with hospitals and clinics • Expanded portfolio - infusion related disposable sales |
 Dominant Player in Our Niche
6 INNOVATION | TEAMWORK | INTEGRITY | FOCUS | PEOPLE FIRST
• InfuSystem pumps permit oncology patients to receive treatment in the comfort of their home. • 24/7 on-call oncology nurses • InfuSystem is the market leader with more than ~1,600* hospitals and oncology practice sites served in North America. • 13 of the 20 top leading cancer institutions • Total home infusion market is $10 billion. • Oncology market treatable via continuous infusion is estimated to exceed $200 million annually. • Cancer rates growing (NIH) • In 2015 1.7M new cases of cancer in U.S. • 39.6% of men & women will be diagnosed with cancer during their lifetimes • U.S. cancer care could reach $156 billion in 2020 • At-home treatment substantially drives down healthcare costs as mandated by ACA. Ambulatory Continuous Infusion Opportunity** (Oncology) *As of June 30, 2015 **Management estimates 30% 15% 25% 20% 5% 1% 4% InfuSystem OIS Home Care Ownership Disposable InfusAID Other |
 Management Executing On
Value-Creation Strategy
7 INNOVATION | TEAMWORK | INTEGRITY | FOCUS | PEOPLE FIRST
New management team focused on “Value-
Creation Strategy” through series of strategic
initiatives Four unique business models to capture increasing share of market opportunity and benefit from changing payor mix Accretive acquisition to expand market share “Land Grab” Expanding into adjacent addressable markets to drive growth Investments into next generation systems and technologies to increase customer retention Improving product utilization to increase return on investment Effective cash utilization through decreased borrowing rates 18.8% 22.3% 25.6% 24.2% 15% 17% 19% 21% 23% 25% 27% FY2011 FY2012 FY2013 FY2014* Adjusted EBITDA Margins 2014 does NOT add-back the following charges: G&A expense on IT and Pain
Management initiatives of $0.7M, a write-off of pumps $0.4M, severance of
$0.2M |
 Value-Creation Strategy
8 INNOVATION | TEAMWORK | INTEGRITY | FOCUS | PEOPLE FIRST
FOUR REVENUE STREAMS DRIVING
CASH FLOWS |
 Four Revenue Streams to Drive Cash Flows
9 INNOVATION | TEAMWORK | INTEGRITY | FOCUS | PEOPLE FIRST
Patient-Based
Rental (TPP) 72% of 2014 Sales • A hospital/clinic provides an INFU pump to a patient to be utilized for at-home therapy • InfuSystem bills patients insurance company for payment Hospital-Home Care Based Rental (Direct) 13% of 2014 Sales • A hospital/clinic rents an INFU pump on a short term basis or clients choose to always rent • INFU bills hospital/ clinic a flat rental rate Service & Repair 3% of 2014 Sales • InfuSystem will service and repair pumps for OEMs, other secondary market infusion pump companies, and hospitals/clinics Rental Revenue 88% of 2014 Sales Product Sales 12% of 2014 Sales • InfuSystem will refurbish pumps for sale to hospitals/clinics • Customer has option to sell back pre-owned pumps • Ability to sell new pumps • Disposables for new and used pumps |
 $7.8 $5.4 $6.3 $7.8 $6.9 $0 $1 $2 $3 $4 $5 $6 $7 $8 $9 FY2011 FY2012 FY2013 FY2014 TTM as of 6/30/15 Revenue Growth - Rental and Sales 10 INNOVATION | TEAMWORK | INTEGRITY | FOCUS | PEOPLE FIRST
Product Sales $42.7 $48.2 $49.5 $52.9 $55.2 $4.1 $5.3 $6.5 $5.8 $4.6 $46.8 $53.5 $56.0 $58.7 $59.8 $20 $25 $30 $35 $40 $45 $50 $55 $60 $65 FY2011 FY2012 FY2013 FY2014 TTM as of 6/30/15 Net Collected Rental Revenue Bad Debt Rental Revenues (Gross to Net Collected) |
 Net Collected Revenue
11 INNOVATION | TEAMWORK | INTEGRITY | FOCUS | PEOPLE FIRST
Bad Debt as a Percent of Rental Revenue
As new healthcare laws have been enacted, the focus on
net collected revenue becomes increasingly important as
a direct result of focus on contractual insurance changes
Company's increased focus on collecting patient billings
• In-Network agreements • Improved billing protocol • High diversification of providers and payors • No single healthcare provider represents more than 7% of Patient-Based Revenue (TPP) 30% 1% 19% 41% 9% Medicare Medicaid BCBS Commercial Patient Patient-Based Rental Payor Mix (FY2014 Cash Collections) 14.6% 12.3% 9.7% 12.4% 12.2% 14.2% 9.7% 8.7% 6.6% 7.9% 7.3% 0% 2% 4% 6% 8% 10% 12% 14% 16% Q4 Q1 Q2 Q3 Q4 Q1 Q2 Q3 Q4 Q1 Q2 2012 2013 2014 2015 |
 Strong Customer “Stickiness” Leads to High
Revenue Predictability
12 INNOVATION | TEAMWORK | INTEGRITY | FOCUS | PEOPLE FIRST
• Strong value placed on hospital/clinic contracts and relationships due to strong “reorder/recurring” revenue component • InfuSystem provides patient-based pump rentals through ~1,600* hospitals/clinics covered by more than ~300* in-network payor contracts • Customer count has declined through market consolidation, with INFU on the winning side • Oncology clinics/hospitals that account for 98.7% of patient-based pump rentals in 2013 also rented a pump in 2014 • Average customer tenure (weighted by number of pump rentals in 2014) is 9.2 years Percent of Pump Rentals by Oncology Clinics that Reordered in 2014 vs 2013 Growth in Oncology Customers and In-Network Payor Contracts *As of June 30, 2015 98.7% 1.3% % of Continuing Customers Lost Customers 1,400 1,600 1,800 1,500 230 245 260 270 0 400 800 1,200 1,600 2,000 2,400 FY2011 FY2012 FY2013 FY2014 Oncology Clinics/Hospitals Contracts |
 Value-Creation Takeaway
13 INNOVATION | TEAMWORK | INTEGRITY | FOCUS | PEOPLE FIRST
STRATEGIC ACQUISITIONS TO
STRENGTHEN MARKET SHARE IN
CORE ONCOLOGY BUSINESS |
 Strategic Acquisition to Increase Market Share
14 INNOVATION | TEAMWORK | INTEGRITY | FOCUS | PEOPLE FIRST
InfuSystem has the largest inventory of home
infusion pumps for the oncology market in the U.S.
• In April 2015, the company acquired Ciscura Holding Company, Inc., based in Alpharetta, Georgia • Acquired inventory of approximately 1,800 infusion pumps • Expand market share with additional 106 new infusion clinics relationships for InfuSystem primarily throughout the Southeast • Offer InfuConnect (EMR) solutions and product portfolio: pole mounted infusion pumps and disposables, catheter care kits and chemo safety products (USP 800) • Open new Southeast Service Center • Enables same day service for equipment and supplies to much of the Southeast region “The right pump, the right place, and the right time. Working and patient ready.” |
 Kansas City Service Center Madison Heights Service Center Future Northeast Service Center (est. 2016) Atlanta Service Center (2015) Los Angeles Area Service Center Houston Service Center (2014) Toronto Canada Service Center Faster Turnaround Times and Improved Utilization 15 INNOVATION | TEAMWORK | INTEGRITY | FOCUS | PEOPLE FIRST
InfuSystem Service Centers • Reduced cost of air shipments • Improved utilization of pump fleet • Increased market share of “Same-Day” rental market • ISO 9001 Certification and CHAP accredited quality • Annual pump recertification • Maintenance & Warranty • Ability to service smart pumps • Hub and Spoke Model |
 Value-Creation Takeaway
16 INNOVATION | TEAMWORK | INTEGRITY | FOCUS | PEOPLE FIRST
EXPANDING INTO ADJACENT
ADDRESSABLE MARKETS TO
DRIVE GROWTH |
 Expansion into At-Home Pain Management
Infusion Pump Market
17 INNOVATION | TEAMWORK | INTEGRITY | FOCUS | PEOPLE FIRST
$10 BILLION Pain relieving effects of a peripheral nerve block can be extended by using a continuous peripheral nerve block catheter, local anesthetic & an electronic infusion pump • Growing therapy in an estimated $700 million market • 5.7 million orthopedic surgeries annually • 50% are projected to be Continuous Peripheral Nerve Block Candidates • Pain most common reason Americans access the health care system • Leading cause of disability • Major contributor to health care costs. • Per National Center for Health Statistics (2006), approximately 76.2 million, 1 in every 4 Americans suffered from pain that last longer than 24 hours |
 Value-Creation Takeaway
18 INNOVATION | TEAMWORK | INTEGRITY | FOCUS | PEOPLE FIRST
INVESTMENTS INTO NEXT GENERATION
SYSTEMS AND TECHNOLOGIES TO
INCREASE CUSTOMER RETENTION |
 InfuConnect: Enhancing Customer Retention and
Future Growth Driver (EMR)
19 INNOVATION | TEAMWORK | INTEGRITY | FOCUS | PEOPLE FIRST
EMR Integration – Simple as 1-2-3 • Industry-Leading True- Paperless Solution • More accurate / More efficient • Smart Data Listener & Extractor • Save up to 20 minutes per patient • Clinics can do more with the time they have Ambulatory Infusion Made Easy • On Any Device, Auto loaded • Fastest Implementation • Manage Patients • Monitor Inventory • Sign Orders • Order Supplies • Patient Education and more… |
 InfuConnect: Life Cycle Management
20 INNOVATION | TEAMWORK | INTEGRITY | FOCUS | PEOPLE FIRST
State of the Art Asset
Tracking and Management
• Track Assets in Real Time • Improve Recovery Rates • Extend Asset Life • Track From Any Device Fleet Management Made Easy • Order Additional Pumps • Schedule Service & Repair • Access Recertification Docs • Online, Anytime |
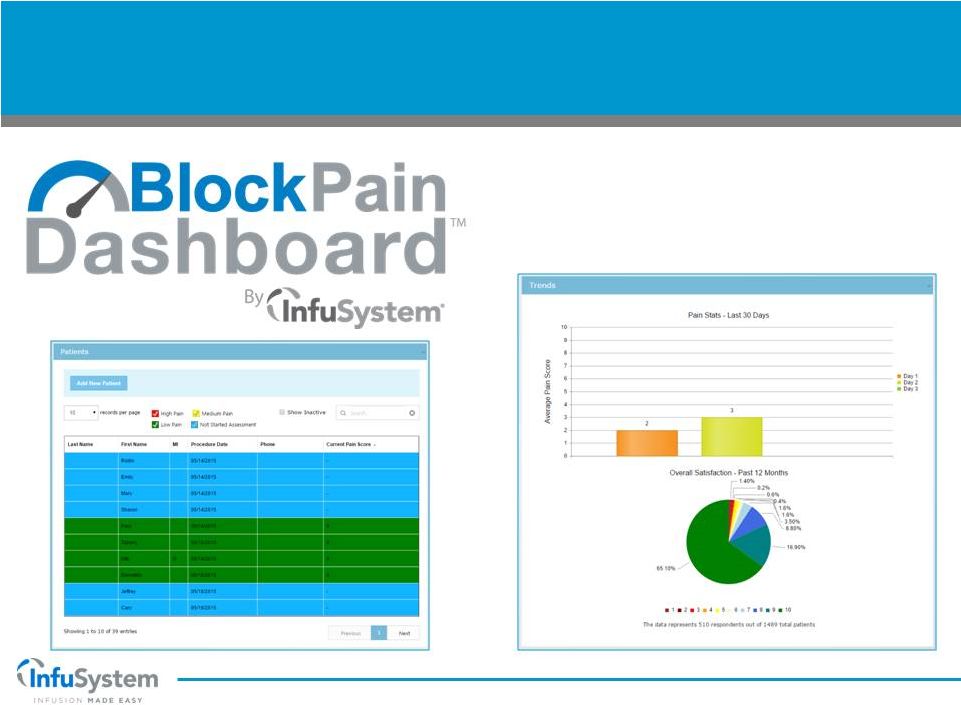 Pain Management and Reporting
21 INNOVATION | TEAMWORK | INTEGRITY | FOCUS | PEOPLE FIRST
Real-Time Pain Score Reporting
• Supporting High Patient Satisfaction • Online, Anytime |
 Value-Creation Takeaway
22 INNOVATION | TEAMWORK | INTEGRITY | FOCUS | PEOPLE FIRST
FINANCIAL OVERVIEW |
 Total Revenue: Total vs Net Collected
23 INNOVATION | TEAMWORK | INTEGRITY | FOCUS | PEOPLE FIRST
$35.0 $42.7 $50.5 $53.5 $55.8 $60.7 $62.2 $4.0 $4.5 $4.1 $5.3 $6.5 $5.8 $4.6 $39.0 $47.2 $54.6 $58.8 $62.3 $66.5 $66.8 $20 $30 $40 $50 $60 $70 FY2009 FY2010 FY2011 FY2012 FY2013 FY2014 TTM as of 6/30/2015 Net Collected Revenue Bad Debt Total Revenues (Gross to Net Collected) |
 Strong Gross and Adjusted EBITDA Margins
24 INNOVATION | TEAMWORK | INTEGRITY | FOCUS | PEOPLE FIRST
Gross Margins *2014 does NOT add-back the following charges: G&A expense on IT
and Pain Management initiatives of $0.7M, a write-off of pumps
$0.4M, severance of $0.2M
64.7% 72.9% 70.1% 71.2% 70.8% 60% 65% 70% 75% FY2011 FY2012 FY2013 FY2014 TTM as of 6/30/15 18.8% 22.3% 25.6% 24.2% 24.8% 15% 20% 25% 30% FY2011 FY2012 FY2013 FY2014* TTM as of 6/30/15 Adjusted EBITDA Margins See Appendix for Reg G Reconciliation |
 Free Cash Flow and Adjusted EBITDA
25 INNOVATION | TEAMWORK | INTEGRITY | FOCUS | PEOPLE FIRST
Free Cash Flow*
See Appendix for Reg G Reconciliation $10.3 $13.1 $16.0 $16.1 $16.5 $8 $9 $10 $11 $12 $13 $14 $15 $16 $17 FY2011 FY2012 FY2013 FY2014* TTM as of 6/30/15 Adjusted EBITDA See Appendix for Reg G Reconciliation *Free Cash Flow = “Adjusted EBITDA” less
“Replacement Cost of Retired Pumps” less “Scheduled Debt Payments of Principal” less “Interest on Debt” *2014 does NOT add-back the following charges: G&A expense on IT
and Pain Management initiatives of $0.7M, a write-off of pumps
$0.4M, severance of $0.2M
$0.6 $8.9 $8.5 $0 $1 $2 $3 $4 $5 $6 $7 $8 $9 $10 FY2011 FY2012 FY2013 FY2014 |
 Net Income and Diluted EPS
26 Net Income Earnings Per Share Fully Diluted Basis *Q1 & Q2 2015 = Normalized EPS-see Appendix for Reg G Reconciliation *TTM as of 6/30/15 = Normalized Net Income - see Appendix for Reg G Reconciliation ($1.5) $1.7 $3.4 $3.6 ($6) ($5) ($4) ($3) ($2) ($1) $0 $1 $2 $3 $4 $5 FY2011 FY2012 FY2013 FY2014 TTM as of 6/30/15* ($45) ($45.4) ($0.04) ($0.04) $0.00 $0.01 $0.00 $0.00 $0.03 $0.04 $0.03 $0.04 $0.04 $0.05 $0.03 $0.05 ($0.05) ($0.04) ($0.03) ($0.02) ($0.01) $0.00 $0.01 $0.02 $0.03 $0.04 $0.05 $0.06 INNOVATION | TEAMWORK | INTEGRITY | FOCUS | PEOPLE FIRST
|
 Increased Borrowing Facility to Expand Future
Pump Inventory 27 INNOVATION | TEAMWORK | INTEGRITY | FOCUS | PEOPLE FIRST
$5.7 $6.6 $6.4 $7.0 $11.9 $10.7 $0 $2 $4 $6 $8 $10 $12 $14 FY2011 FY2012 FY2013 FY2014 Q115 Q215 • History of strong Free Cash Flows providing added borrowing capacity to expand growth of
pump inventory • Reduced cost of capital on new credit facility allows for increased Return on Invested Capital
• Current rate of less than 3.0% vs 18% in 2012, 9.5% in 2013, 7.75% in 2014
• New facility signed with Chase in March 2015 Unrestricted Liquidity* Medical Equipment in Service (at cost) $29.1 $31.3 $26.7 $25.5 $33.6 $34.8 $15 $20 $25 $30 $35 $40 FY2011FY2012 FY2013FY2014 Q115 Q215 Total Debt *Cash and Equivalents + Undrawn Revolver $31.0 $34.2 $37.2 $43.1 $45.8 $47.2 $25 $30 $35 $40 $45 $50 FY2011 FY2012 FY2013 FY2014 Q115 Q215 |
 New $45 Million Credit Facility
28 INNOVATION | TEAMWORK | INTEGRITY | FOCUS | PEOPLE FIRST
$45 million credit facility signed with JPMorgan Chase in March 2015
• Term is five years • $10 million revolver – undrawn at close • $27 million Term Loan A – fully drawn at close • $8 million Term Loan B – undrawn at close • Expansion capital (including acquisition of Ciscura) • InfuSystem has borrowed on this loan to fund the acquisition of Ciscura and associated integration costs Interest rate drops from 7.75% to 3.0% • $1 million in cash interest savings potential • Interest expense in Q2 2015 of $387k down from Q2 2014 of $776k Repayment • Term Loan A is repaid $965K quarterly • Term Loan B is repaid quarterly as a percent of the drawn ranging from 3.75% to 4.475% Favorable covenants and terms • Leverage ratio maximum increased from 2.0x to 3.0x (decreases over the term) • Fixed charge ratio minimum decreased from 1.75x to 1.25x |
 Significant Barriers to Entry
29 INNOVATION | TEAMWORK | INTEGRITY | FOCUS | PEOPLE FIRST
Established, long standing relationship with oncology
practices • More than ~1,600 facilities* • Growing Third Party Payor contracts • ~300 insurance contracts* • 98.7% retention of customer business Large fleet of ambulatory infusion pumps – ~60,000 pumps • Generate revenue - Rental or sale • Quicker response time - 24/7 • Replacement value ~ $90 million Geographic coverage U.S. and Canada • 5 Regional Service Centers – ISO 9001 • Same day or next day delivery of pumps • Pump repair and service capabilities Economies of Scale • EMR Connectivity • Predictable reimbursements • Purchasing power • Management of pump fleet National presence with Affordable Care Organizations (ACOs) • Physicians, Outpatient oncology practices, hospitals, outpatient surgery centers,
homecare practices, patient rehabilitation centers
*As of June 30, 2015 |
 Why Invest in InfuSystem?
30 INNOVATION | TEAMWORK | INTEGRITY | FOCUS | PEOPLE FIRST
Leading Operator in Core Business – Oncology Infusion • Dominate player in oncology infusion market • Large fleet of ambulatory pumps for Rental or Sale • Expanding Market Share • Aging Population and Cancer Growth Solid Financial Performance • Strong Cash Flows and Solid Gross Margin Profile • Solid Growth in Net Collected Rental Revenue • Improving Net Income • Significantly Reduced Cost of Capital • 2015 Guidance - Double Digit Growth in Net Collected Revenue Growth Drivers - Pain Management and InfuConnect (EMR) Solutions • Peripheral Nerve Block and Smart Pump Growth • True paperless: improved work flow and billing efficiencies New Management with Highly Focused Initiatives to Drive Value • Increase EMR connectivity “InfuConnect” / Expand into new markets / Reduced cost of capital /
Expand into new therapies, products and services
Gregg O. Lehman, Ph.D. Appointed Chairman of the Board
• Elected by the board of directors in May 2015 |
   Questions? Russell Microcap® Index (NYSE MKT: INFU) IR Contact Info: Joe Dorame, Managing Partner Lytham Partners, LLC 602-889-9700 dorame@lythampartners.com |
 InfuSystem—Infusion Made Easy
32 INNOVATION | TEAMWORK | INTEGRITY | FOCUS | PEOPLE FIRST
APPENDIX |
 Company Snapshot
33 INNOVATION | TEAMWORK | INTEGRITY | FOCUS | PEOPLE FIRST
InfuSystem Holdings, Inc. InfuSystem Holdings, Inc. Summary Trading Statistics* Summary Trading Statistics* Commentary Commentary Financial Summary ($ in millions) Financial Summary ($ in millions) • Headquarters: Madison Heights, MI • Founded: 1998 • Specialization: Healthcare / Medical Instruments & Supplies • Management: Eric Steen, President & CEO / Jon Foster, CFO / Jan Skonieczny, COO / Mike McReynolds, CIO / Sean Schembri, EVP GC • Est. Number of Employees: 200 • LTM Revenue: $66.8M • LTM AEBITDA: $16.5M • EV / LTM AEBITDA: 5.97x • Stock Price: $2.88* • 52-Wk Range: $2.22-$4.50 • Market Cap: $64.61M • Enterprise Value: $98.60M • EV / LTM AEBITDA: 5.97x • P / LTM Adj. Earnings: 13.1x • InfuSystem provides infusion pumps and related products and services for patients in: • Patient’s home, • Oncology clinics • Ambulatory surgery centers • Other health care sites • 6 Regional Service Centers serves all of North America • Profitable growth • Oncology and orthopedic surgery • Increased electronic connectivity • New products and services • Strategic geographic expansion 6/15 *As of 8/21/2015 $39.0 $47.2 $54.6 $58.8 $62.3 $66.5 19% 22% 26% 24% 0% 5% 10% 15% 20% 25% 30% $0 $10 $20 $30 $40 $50 $60 $70 FY2009 FY2010 FY2011 FY2012 FY2013 FY2014 0 200,000 400,000 600,000 800,000 1,000,000 1,200,000 $0.00 $1.00 $2.00 $3.00 $4.00 $5.00 6/12 9/12 12/12 3/13 6/13 9/13 12/13 3/14 6/14 9/14 12/14 3/15 Share Price Volume |
 InfuSystem Niche – Extension of Clinic to Home 34 INNOVATION | TEAMWORK | INTEGRITY | FOCUS | PEOPLE FIRST
Ambulatory Home Infusion
Ambulatory Home Infusion
• 25-year old business model in DME billing • At home, at work, at play, all while receiving the drug • High satisfaction scores • 24/7 on-call oncology nurses • Proven outcomes with continuous home infusion • Oncology, Post Surgical Pain, Special Disease States Patient-Based Rental TPP Payor Contracts Patient-Based Rental TPP Payor Contracts • Bills patient insurance • 300+ Commercial and Government Payor Contracts • Commercial Payors reimburse more therapies than CMS • Awarded contracts in all 9 MSAs (1 of 4 National Vendors) • Average Round 1 Recompete cuts of ~21% for our category, per CMS ($250,000 per yr beginning in January 2014, see CMS Competitive Bidding Summary slide in Appendix) |
 Hospital-Home Care Based Direct Payor
Business Model 35 INNOVATION | TEAMWORK | INTEGRITY | FOCUS | PEOPLE FIRST
• Infusion pumps • Enteral pumps • InfuSystem’s Hospital-Home Care Based (DP) business is focused primarily on the sale, rental, financing and
accompanying service of movable medical equipment to hospitals and alternate
care sites who pay InfuSystem directly –
no third-party reimbursement
• Founded in 1998 and currently headquartered in Lenexa, KS • InfuSystem services – ISO 9001 - and repairs movable medical equipment • Leading provider to alternate site healthcare facilities and hospitals in the United States and Canada
• Home infusion providers, long-term care, physician clinics, research facilities, etc.
• Transacts directly with healthcare providers – no third-party reimbursement revenue Service & Repair Products InfuSystem sells, rents and finances a wide variety of new and used large volume and ambulatory pumps InfuSystem services and repairs both its own fleet of pumps and many types of other movable medical equipment • Syringe pumps • Ambulatory pumps • Large volume pumps • Ambulatory pumps • Fluid collection • Medical equipment |
 Hospital-Home Care Based Direct Payor
Offerings 36 INNOVATION | TEAMWORK | INTEGRITY | FOCUS | PEOPLE FIRST
• InfuSystem offers new pumps from top brands • Broker-dealer trading desk • In addition, over 70 models and versions of pre-owned pumps are offered • Pre-owned pumps are re-built and certified by in-house biomedical technicians to be patient ready • Warranty offered on pre-owned pumps • A variety of financing options to fit customers’ operating, budgeting and financing parameters • Nationwide, industry-leading ISO 9001 service programs • Launching 7 th location - Northeast service center Pre-Owned & New Pumps from Top Manufacturers Pre-Owned & New Pumps from Top Manufacturers Full Spectrum of Ownership Options for Customers Full Spectrum of Ownership Options for Customers Sales Sales Rental Rental Asset Management Asset Management • Renting new or pre-owned equipment • Rent pumps by the day, week or month to match swings in patient count • Free shipping on all rentals • Industry leader in sales of pre-owned equipment, creating significant savings • Competitive pricing on new equipment • Option to sell back pre-owned pumps • Leasing plans offered • ISO 9001 Service offered • Service plans offered • Local service expansion • 6 existing; 1 planned • Coordinate with Patient-Based • Loaner pumps available Leading Provider of New and Pre-Owned Pumps Leading Provider of New and Pre-Owned Pumps |
 Medical Equipment Service & Repair
37 INNOVATION | TEAMWORK | INTEGRITY | FOCUS | PEOPLE FIRST
• In addition to supporting and repairing InfuSystem’s in-house fleet, the Company certifies, recalibrates, repairs and services a variety of infusion pumps • Pumps require scheduled maintenance and calibration in accordance with manufacturer’s specifications and regulatory guidelines • Service and repair capabilities on high demand services reaching end of life that are no longer supported by manufacturers • ISO certification and an established quality system strengthens relationships with major customers • Provides InfuSystem an opportunity to establish a business relationship with customers that acquired pumps through other sources • Continuing and increased need for compliance with current as well as anticipated regulations • 28 highly qualified service technicians • 5 major manufacturer relationships: • 6 service centers, located in Michigan, Kansas, California, Texas, Georgia and Toronto, Canada |
 Competitive Bidding Overview
38 INNOVATION | TEAMWORK | INTEGRITY | FOCUS | PEOPLE FIRST
• InfuSystem was not involved in Round 1 nor Round 2 of Competitive Bidding • CMS completed a Recompete of Round 1 competitive bidding in late 2013 which covered 9 Metropolitan Statistical Areas (MSAs) and with the results taking effect January 1, 2014 • CMS published a Final Rule in the Federal Register on November 6, 2014 that describes the methodology for reimbursement cuts for items/services provided to patients outside of MSAs subject to competitive bidding • The Company estimates this Rule will impact revenues by $2-3 million annually beginning in 2016 Competitive Bidding Overview InfuSystem’s Response to Competitive Bidding • InfuSystem has actively prepared the Company for potential regulatory changes and reimbursement changes • During the 2013 Round 1 Recompete, InfuSystem was awarded contracts in ALL of the 9 MSAs with average cuts of ~21% for our category (per CMS). • 1 of only 4 National Vendors to receive contracts in all 9 markets in our category • InfuSystem has pursued contract negotiations with commercial payors and has been successful in receiving positive rate adjustments which will help offset any CMS cuts • “Competitive environment will vary in accordance with the level of cuts by CMS” CMS Competitive Bidding Timetable CMS began the pre-bidding supplier awareness program CMS announced bidding schedule, start bidder education and begin a bidder registration period Bid window opens Current Round 1 bid contracts expire CMS announces Round 1 Recompete bid results – INFU impact $250K annually Bid window closes Implementation of Round 1 bid contracts and prices Spring 2012 08/16/12 10/15/12 12/14/12 10/1/13 12/31/13 01/01/14 11/06/14 04/21/15 FY2016 12/31/16 CMS announces bidding schedule for next bidding round– External Infusion pumps EXCLUDED CMS published the Final Rule in the Federal Register – INFU impact $2-3 million annually beginning 2016 Final Rule cuts begin to take effect Contracts from Round 1 Recompete expire |
 39 INNOVATION | TEAMWORK | INTEGRITY | FOCUS | PEOPLE FIRST
• Management’s strategy is to increase enterprise value (EV) and lower leverage via a combination of profitable growth and repayment of debt • Management believes high historic leverage have depressed INFU valuation multiples due to market-perceived risk of debt overhang • Favorable reaction to increase in AEBITDA and decreasing leverage can already be seen by movement along trend line • Note that Q2-15 shows full debt impact of Ciscura acquisition but only one+ month of contribution. Source: Stock price - Yahoo on closest date to quarter close. AEBITDA is TTM. Size of bubble represents EV 73.0% 76.0% 44.0% 53.0% 0% 10% 20% 30% 40% 50% 60% 70% 80% 90% 100% 3X 4X 5X 6X 7X 8X 9X 10X Enterprise Value / AEBITDA Q1-13 Stock Price = $1.69 EV = $66.1M AEBITDA = $15.0M Q1-14 Stock Price = $2.77 EV = $89.5M AEBITDA = $15.6M Q2-15 Stock Price = $2.88 EV = $100.3M AEBITDA = $16.5 Q1-12 Stock Price = $1.96 EV = $71.5M AEBITDA = 14.0M Impact of Debt & Leverage on Valuation Multiple |
 40 INNOVATION | TEAMWORK | INTEGRITY | FOCUS | PEOPLE FIRST
April 2015 -
Acquires Ciscura
for $5.4M Leverage: Total Debt to Book Equity US$ millions $29.13 $31.27 $26.73 $25.48 $34.78 $0.80 $2.33 $1.14 $0.52 $0.79 73% 78% 63% 55% 73% 0% 15% 30% 45% 60% 75% 90% $0 $10 $20 $30 $40 $50 2011 2012 2013 2014 6 Months Ended 06/30/15 Fiscal Year Total Debt Cash Debt to Equity Ratio |
 Non-GAAP Reconciliation:
Annual Net Income to Adjusted EBITDA
41 INNOVATION | TEAMWORK | INTEGRITY | FOCUS | PEOPLE FIRST
Unaudited, in US$ thousands
FY2011 FY2012 FY2013 FY2014 Net Income (45,443) (1,489) 1,669 3,356 plus Interest 2,193 3,340 3,497 3,134 plus Tax (23,134) (663) 1,031 2,853 plus Depreciation 6,386 5,668 5,415 3,626 plus Amortization 2,662 2,734 2,618 2,516 EBITDA (57,336) 9,590 14,230 15,485 plus Impairment Charges 67,592 - plus Loss (Gain) on Derivatives - plus Concerned Shareholders 2,220 - plus Extinguishment of Debt 671 - plus Stock Based Compensation 1,120 576 plus Strategic Alternatives & Transition 645 604 - Adjusted EBITDA 10,256 13,126 15,954 16,061 |
 Non-GAAP Reconciliation:
TTM Net Income to Adjusted EBITDA by Quarter
42 INNOVATION | TEAMWORK | INTEGRITY | FOCUS | PEOPLE FIRST
Unaudited, in US$ thousands
3Q 2014 4Q 2014 1Q 2015 2Q 2015 Trailing 12 Months Net Income 852 1,036 (415) 783 2,256 plus Interest Expense 752 779 672 387 2,590 plus Income Tax Expense 842 946 (285) 147 1,650 plus Depreciation 938 1,031 1,103 1,229 4,301 plus Amortization 622 640 631 713 2,606 EBITDA 4,006 4,432 1,706 3,259 13,403 plus Impairment Charges plus Loss (Gain) on Derivatives plus Concerned Shareholders plus Extinguishment of Debt 1,599 - 1,599 plus Stock Based Compensation 145 159 287 330 921 plus Strategic Alternatives & Transition 255 351 606 Adjusted EBITDA 4,151 4,591 3,847 3,940 16,529 |
 Non-GAAP Reconciliation:
Annual Net Income to Free Cash Flow*
43 INNOVATION | TEAMWORK | INTEGRITY | FOCUS | PEOPLE FIRST
Unaudited, in US$ thousands
FY2011 FY2012 FY2013 FY2014 Net Income (45,443) (1,489) 1,669 3,356 plus Interest 2,193 3,340 3,497 3,134 plus Tax (23,134) (663) 1,031 2,853 plus Depreciation 6,386 5,668 5,415 3,626 plus Amortization 2,662 2,734 2,618 2,516 EBITDA (57,336) 9,590 14,230 15,485 plus Impairment Charges 67,592 - plus Loss (Gain) on Derivatives - plus Concerned Shareholders 2,220 - plus Extinguishment of Debt 671 - plus Stock Based Compensation 1,120 576 plus Strategic Alternatives & Transition 645 604 - Adjusted EBITDA 10,256 13,126 15,954 16,061 less Replacement Cost of Retired Pumps** (1,803) (512) (447) (1,055) less Scheduled Debt Payments of Principal (5,953) (9,631) (3,771) (3,860) less Interest on Debt (1,934) (3,112) (2,881) (2,662) Free Cash Flow 566 (129) 8,855 8,484 *It is important to note that in looking at our cash flow statement that replacement pump purchases are often done in large
lots which result in wide variances in free cash flow quarter to quarter. For
this reason, we focus on annual free cash flow. ** Management
estimate based on pumps retired and an assumed average replacement cost per period |
 Non-GAAP Reconciliation: TTM Operating Income to
Normalized Net Income and EPS by Quarter
44 INNOVATION | TEAMWORK | INTEGRITY | FOCUS | PEOPLE FIRST
Unaudited, in US$ thousands except per share values
3Q 2014 4Q 2014 1Q 2015 2Q 2015 Trailing 12 Months Operating Income $2,443 $2,774 $1,552 $1,317 8,086 Adjustments: Integration Costs – Ciscura 0 0 255 351 606 Interest Expense (752) (779) (672) (387) (2,590) Other income 3 (13) (19) 0 (29) Income before income taxes – adjusted $1,694 $1,982 $1,116 $1,281 6,073 Other income 842 946 454 205 2,447 NORMALIZED NET INCOME $852 $1,036 $662 $1,076 $3,626 Normalized Net income per share: Basic $0.04 $0.05 $0.03 $0.05 $0.16 Diluted $0.04 $0.05 $0.03 $0.05 $0.16 Weighted average shares outstanding: Basic 22,203 22,291 22,309 22,381 22,296 Diluted 22,511 22,825 22,309 22,825 22,618 |
 Detailed Historical P&L
45 INNOVATION | TEAMWORK | INTEGRITY | FOCUS | PEOPLE FIRST
(000's) 12/31/09 12/31/10 12/31/11 12/31/12 12/31/13 12/31/14 Net revenues: Rentals 38,606 $ 43,384 $ 46,795 $ 53,471 $ 55,962 $ 58,718 $ Product sales 358 3,845 7,842 5,357 6,318 7,769 Net revenues: 38,964 47,229 54,637 58,828 62,280 66,487 Cost of Revenues: Product, service and supply costs 6,200 7,730 9,128 9,165 11,274 12,165 Pump depreciation and loss on disposal 4,127 5,954 10,154 6,752 7,327 6,968 Gross Profit 28,637 33,545 35,355 42,911 43,679 47,354 Provision for doubtful accounts 4,006 4,515 4,099 5,251 6,534 5,774 Amortization of intangibles 1,827 2,259 2,662 2,734 2,618 2,516 Asset impairment charges 0 0 67,592 0 0 0 Selling and marketing
5,258 7,087 9,371 9,864 9,658 9,745 General and administrative 12,218 20,622 17,987 23,062 18,973 19,988 Operating income profit/(loss) 5,328 (938) (66,356) 2,000 5,896 9,331 Total other gain/(loss) (3,577) (2,285) (2,221) (4,152) (3,196) (3,121) Profit/(loss) before income taxes 1,751 (3,223) (68,577) (2,152) 2,700 6,210 Income tax benefit/(expense) (977) 1,371 23,134 663 (1,031) (2,853) Net income/(loss) 774 $
(1,852) $ (45,443) $ (1,489) $ 1,669 $ 3,357 $ EBITDA 11,199 $ 7,745 $ (57,336) $ 9,590 $ 14,230 $ 15,486 $ EBITDA (ex. Impairment charges) 11,199 $ 7,745 $ 10,256 $ 9,590 $ 14,230 $ 15,486 $ Adjusted EBITDA N/A N/A 10,256 $ 13,126 $ 15,954 $ 16,062 $ |
 Detailed Historical Balance Sheet
46 INNOVATION | TEAMWORK | INTEGRITY | FOCUS | PEOPLE FIRST
|