Attached files
| file | filename |
|---|---|
| 8-K - FORM 8-K - MICROSOFT CORP | d29775d8k.htm |
| Exhibit 99.1
|

Exhibit 99.1
Microsoft Reporting Segments
Frank Brod
Chris Suh
September 29, 2015
|
|
During this call, we may make forward-looking statements, which are predictions, projections, or other statements about future events. These statements are based on current expectations and assumptions that are subject to risks and uncertainties. Actual results could materially differ because of factors discussed in today’s conference call, and in the risk factors section of our Form 10-K, Forms 10-Q, and other reports and filings with the Securities and Exchange Commission. We do not undertake any duty to update any forward-looking statement.
|
|

Agenda
New segments overview
Segment mapping
Supplemental financial information
What to expect in October
Q&A
|
|
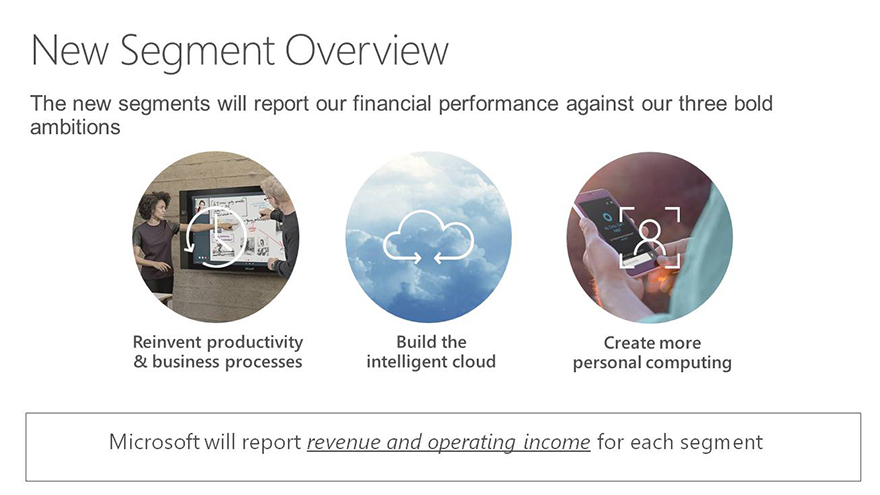
New Segment Overview
The new segments will report our financial performance against our three bold ambitions
Reinvent productivity & business processes
Build the intelligent cloud
Create more personal computing
Microsoft will report revenue and operating income for each segment
|
|
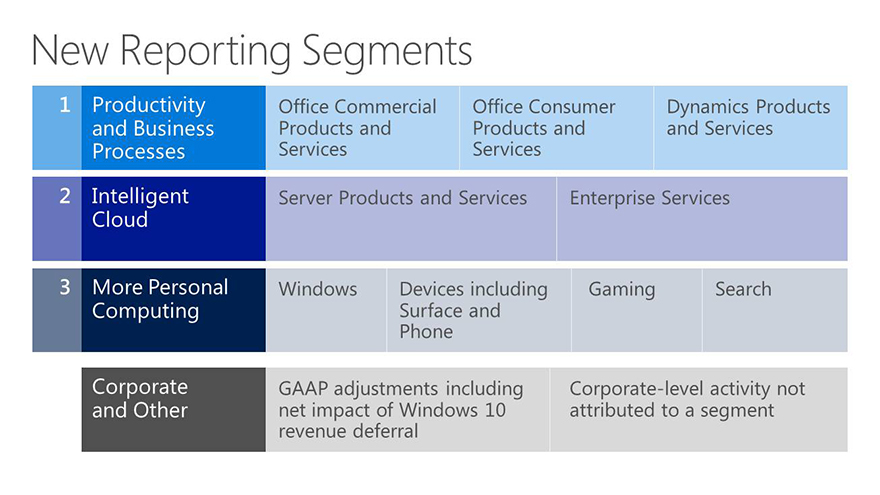
New Reporting Segments
1 Productivity and Business Processes
Office Commercial Products and Services
Office Consumer Products and Services
Dynamics Products and Services
2 Intelligent Cloud
Server Products and Services
Enterprise Services
3 More Personal Computing
Windows
Devices including Surface and Phone
Gaming
Search
Corporate and Other
GAAP adjustments including net impact of Windows 10 revenue deferral
Corporate-level activity not attributed to a segment
|
|
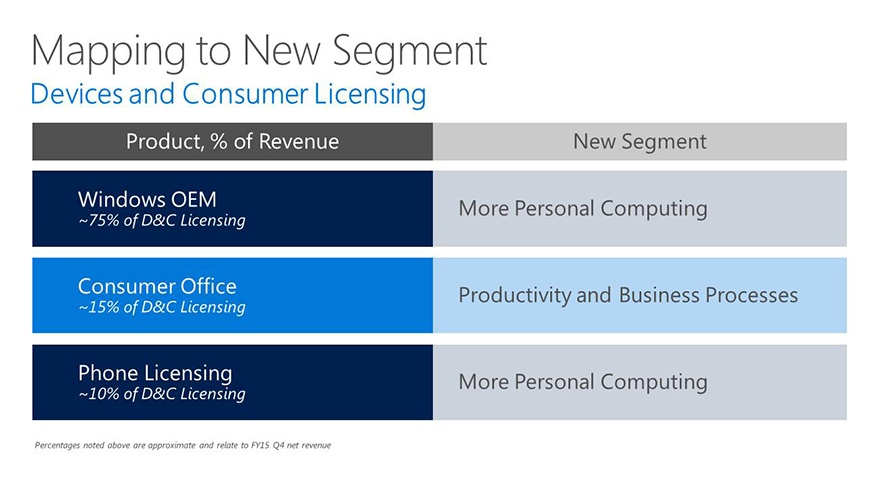
Mapping to New Segment
Devices and Consumer Licensing
Product, % of Revenue
Windows OEM
~75% of D&C Licensing
Consumer Office
~15% of D&C Licensing
Phone Licensing
~10% of D&C Licensing
New Segment
More Personal Computing
Productivity and Business Processes
More Personal Computing
Percentages noted above are approximate and relate to FY15 Q4 net revenue
|
|
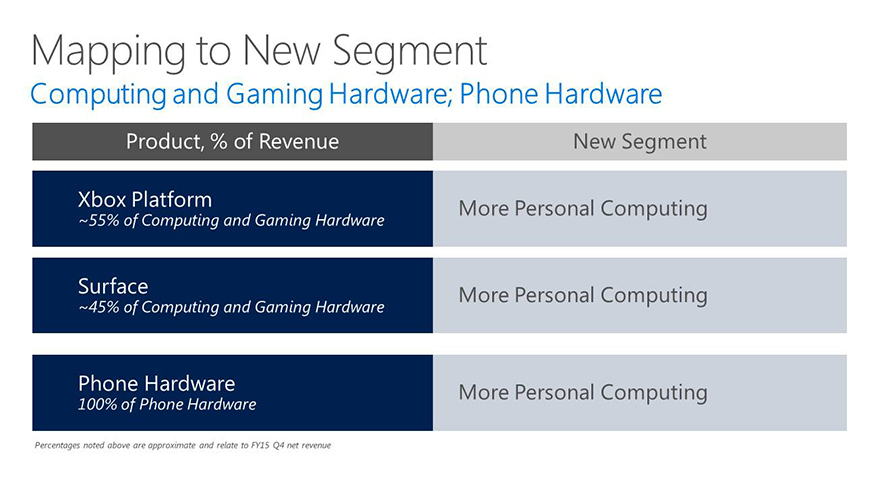
Mapping to New Segment
Computing and Gaming Hardware; Phone Hardware
Product, % of Revenue
Xbox Platform
~55% of Computing and Gaming Hardware
Surface
~45% of Computing and Gaming Hardware
Phone Hardware
100% of Phone Hardware
New Segment
More Personal Computing
More Personal Computing
More Personal Computing
Percentages noted above are approximate and relate to FY15 Q4 net revenue
|
|
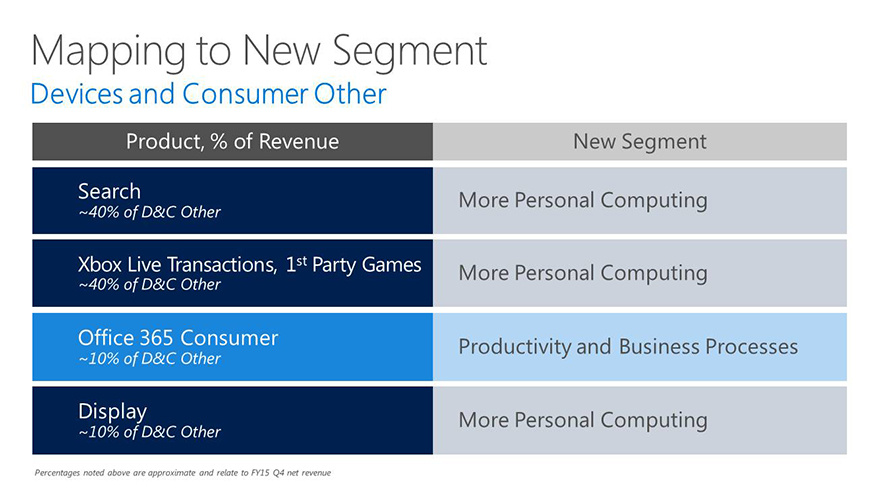
Mapping to New Segment
Devices and Consumer Other
Product, % of Revenue
Search
~40% of D&C Other
Xbox Live Transactions, 1st Party Games
~40% of D&C Other
Office 365 Consumer
~10% of D&C Other
Display
~10% of D&C Other
New Segment
More Personal Computing
More Personal Computing
Productivity and Business Processes
More Personal Computing
Percentages noted above are approximate and relate to FY15 Q4 net revenue
|
|
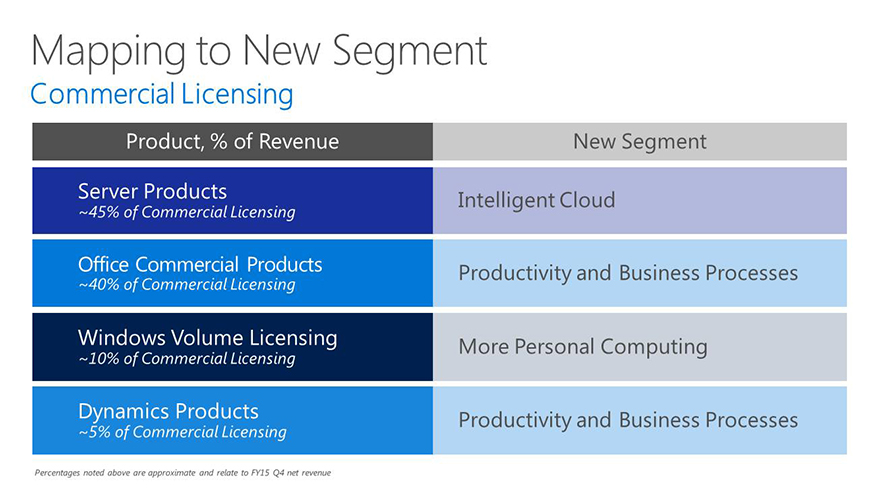
Mapping to New Segment
Commercial Licensing
Product, % of Revenue
Server Products
~45% of Commercial Licensing
Office Commercial Products
~40% of Commercial Licensing
Windows Volume Licensing
~10% of Commercial Licensing
Dynamics Products
~5% of Commercial Licensing
New Segment
Intelligent Cloud
Productivity and Business Processes
More Personal Computing
Productivity and Business Processes
Percentages noted above are approximate and relate to FY15 Q4 net revenue
|
|
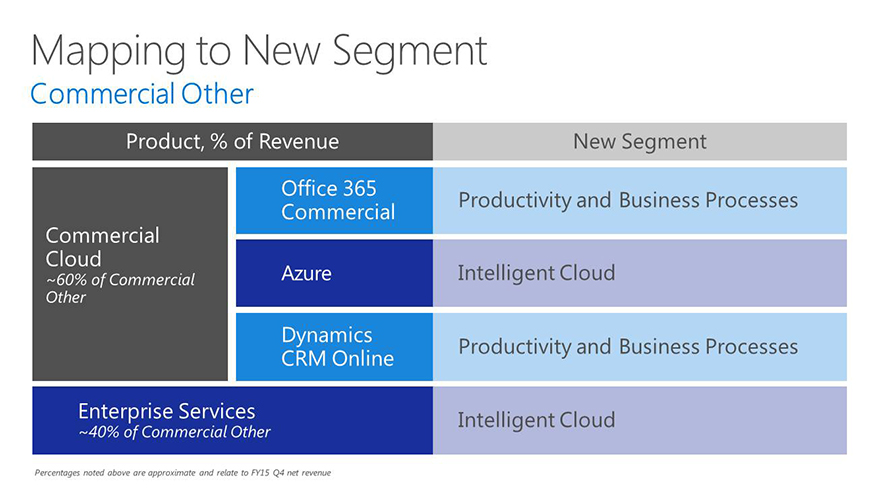
Mapping to New Segment
Commercial Other
Product, % of Revenue
Commercial Cloud
~60% of Commercial Other
Office 365
Commercial
Azure
Dynamics
CRM Online
Enterprise Services
~40% of Commercial Other
New Segment
Productivity and Business Processes
Intelligent Cloud
Productivity and Business Processes
Intelligent Cloud
Percentages noted above are approximate and relate to FY15 Q4 net revenue
|
|
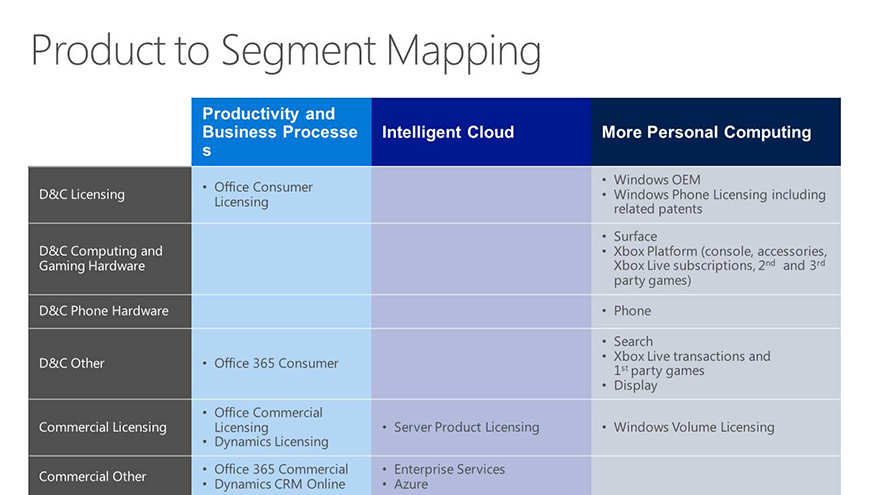
Product to Segment Mapping
Productivity and Business Processes Intelligent Cloud More Personal Computing
D&C Licensing Office Consumer Licensing Windows OEM
Windows Phone Licensing including related patents
D&C Computing and Gaming Hardware Surface
Xbox Platform (console, accessories, Xbox Live subscriptions, 2nd and 3rd party games)
D&C Phone Hardware Phone
D&C Other Office 365 Consumer Search
Xbox Live transactions and 1st party games
Display
Commercial Licensing Office Commercial Licensing
Dynamics Licensing Server Product Licensing Windows Volume Licensing
Commercial Other Office 365 Commercial
Dynamics CRM Online Enterprise Services
Azure
|
|
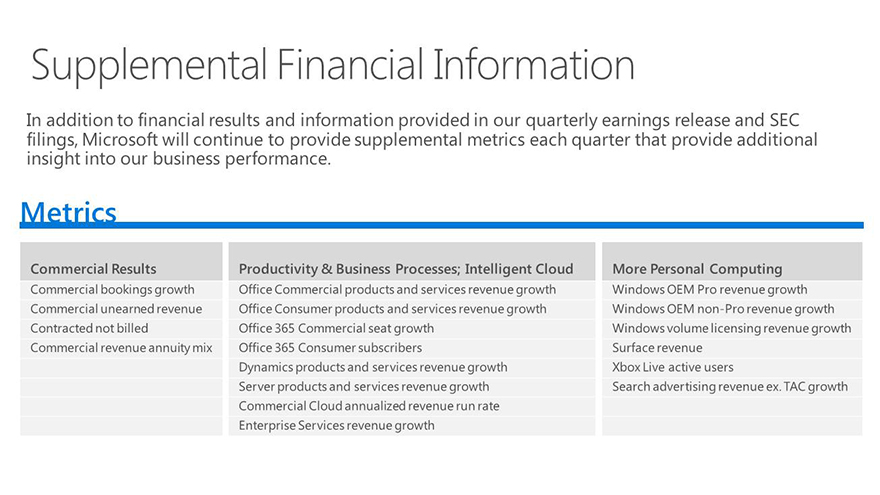
Supplemental Financial Information
In addition to financial results and information provided in our quarterly earnings release and SEC filings, Microsoft will continue to provide supplemental metrics each quarter that provide additional insight into our business performance.
Metrics
Commercial Results
Commercial bookings growth
Commercial unearned revenue
Contracted not billed
Commercial revenue annuity mix
Productivity & Business Processes; Intelligent Cloud
Office Commercial products and services revenue growth
Office Consumer products and services revenue growth
Office 365 Commercial seat growth
Office 365 Consumer subscribers
Dynamics products and services revenue growth
Server products and services revenue growth
Commercial Cloud annualized revenue run rate
Enterprise Services revenue growth
More Personal Computing
Windows OEM Pro revenue growth
Windows OEM non-Pro revenue growth
Windows volume licensing revenue growth
Surface revenue
Xbox Live active users
Search advertising revenue ex. TAC growth
|
|
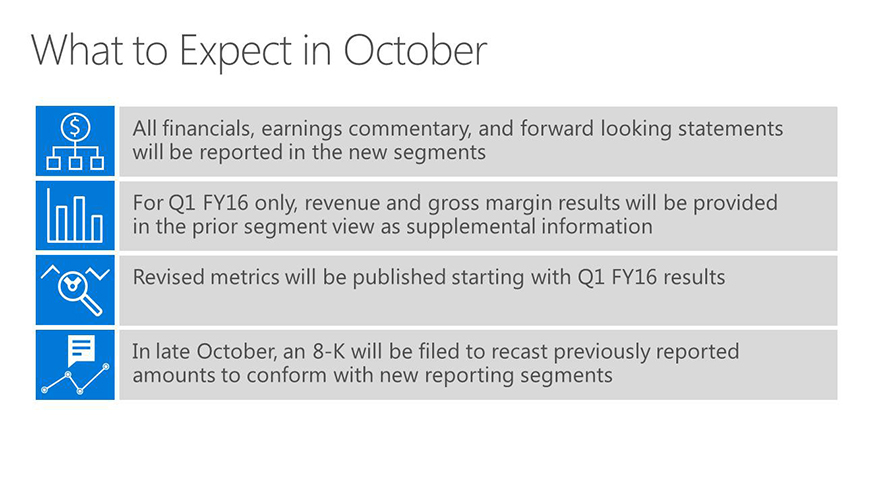
What to Expect in October
All financials, earnings commentary, and forward looking statements will be reported in the new segments
For Q1 FY16 only, revenue and gross margin results will be provided in the prior segment view as supplemental information
Revised metrics will be published starting with Q1 FY16 results
In late October, an 8-K will be filed to recast previously reported amounts to conform with new reporting segments
|
|

Appendix
|
|
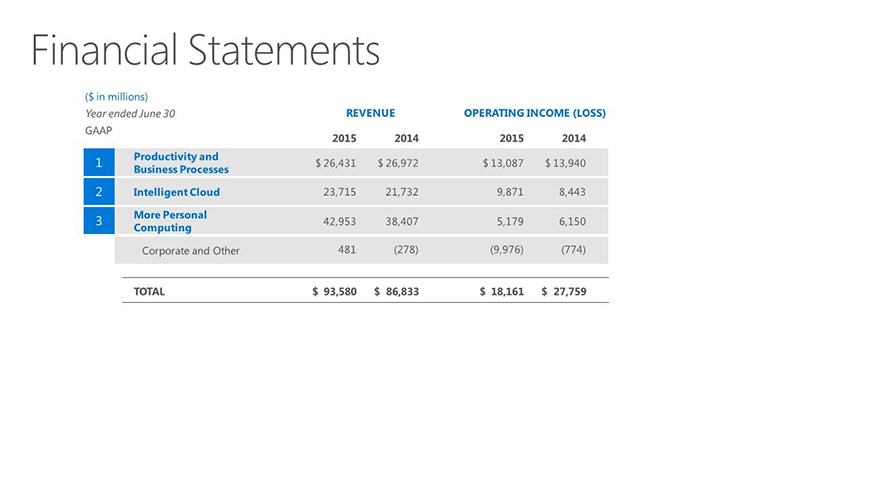
Financial Statements
($ in millions)
Year ended June 30
GAAP 2015 2014
1Productivity and Business Processes $ 26,431 $ 26,972
2 Intelligent Cloud 23,715 21,732
3 More Personal Computing 42,953 38,407
Corporate and Other 481 (278)
REVENUE
$ 93,580 $ 86,833
OPERATING INCOME (LOSS) 2015 2014
$ 13,087 $ 13,940
9,871 8,443
5,179 6,150
(9,976) (774)
$ 18,161 $ 27,759
TOTAL
|
|
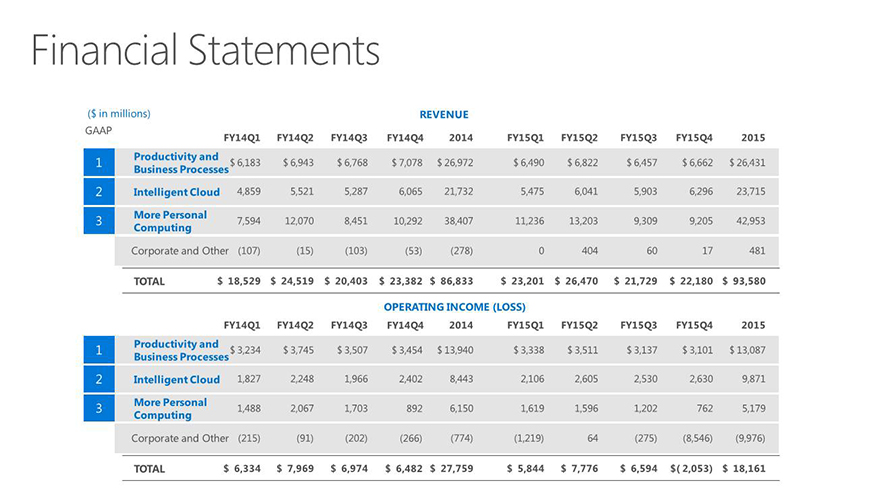
Financial Statements
($ in millions) REVENUE
FY14Q1 FY14Q2 FY14Q3 FY14Q4 2014 FY15Q1 FY15Q2 FY15Q3 FY15Q4 2015
1 Productivity and Business Processes $6,183 $ 6,943 $ 6,768 $ 7,078 $ 26,972 $ 6,490 $ 6,822 $ 6,457 $ 6,662 $ 26,431
2 Intelligent Cloud 4,859 5,521 5,287 6,065 21,732 5,475 6,041 5,903 6,296 23,715
3 More Personal Computing 7,594 12,070 8,451 10,292 38,407 11,236 13,203 9,309 9,205 42,953
Corporate and Other (107) (15) (103) (53) (278) 0 404 60 17 481
TOTAL $ 18,529 $ 24,519 $ 20,403 $ 23,382 $ 86,833 $ 23,201 $ 26,470 $ 21,729 $ 22,180 $ 93,580
OPERATING INCOME (LOSS)
FY14Q1 FY14Q2 FY14Q3 FY14Q4 2014 FY15Q1 FY15Q2 FY15Q3 FY15Q4 2015
1 Productivity and Business Processes $3,234 $ 3,745 $ 3,507 $ 3,454 $ 13,940 $ 3,338 $ 3,511 $ 3,137 $ 3,101 $ 13,087
2 Intelligent Cloud 1,827 2,248 1,966 2,402 8,443 2,106 2,605 2,530 2,630 9,871
3 More Personal Computing 1,488 2,067 1,703 892 6,150 1,619 1,596 1,202 762 5,179
Corporate and Other (215) (91) (202) (266) (774) (1,219) 64 (275) (8,546) (9,976)
TOTAL
$ 6,334 $ 7,969 $ 6,974 $ 6,482 $ 27,759 $ 5,844 $ 7,776 $ 6,594 $(2,053) $ 18,161
|
|
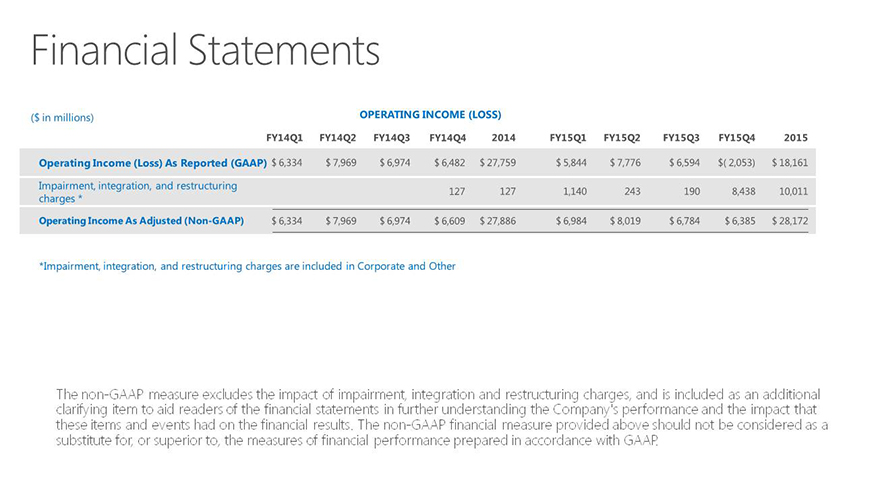
Financial Statements
($ in millions) OPERATING INCOME (LOSS)
FY14Q1 FY14Q2 FY14Q3 FY14Q4 2014 FY15Q1 FY15Q2 FY15Q3 FY15Q4 2015
Operating Income (Loss) As Reported (GAAP) $ 6,334 $ 7,969 $ 6,974 $ 6,482 $ 27,759 $ 5,844 $ 7,776 $ 6,594 $(2,053) $ 18,161
Impairment, integration, and restructuring charges * 127 127 1,140 243 190 8,438 10,011
Operating Income As Adjusted (Non-GAAP) $ 6,334 $ 7,969 $ 6,974 $ 6,609 $ 27,886 $ 6,984 $ 8,019 $ 6,784 $ 6,385 $ 28,172
* Impairment, integration, and restructuring charges are included in Corporate and Other
The non-GAAP measure excludes the impact of impairment, integration and restructuring charges, and is included as an additional clarifying item to aid readers of the financial statements in further understanding the Company’s performance and the impact that these items and events had on the financial results. The non-GAAP financial measure provided above should not be considered as a substitute for, or superior to, the measures of financial performance prepared in accordance with GAAP.