Attached files
| file | filename |
|---|---|
| 8-K - FORM 8-K - COMMONWEALTH EDISON Co | d26890d8k.htm |
| Exhibit 99.1
|
Wolfe Research Power and Gas Leaders Conference
September 29, 2015
Joe Nigro
Executive Vice President, Exelon CEO, Constellation
|
|
Cautionary Statements Regarding Forward-Looking Information
This report contains certain forward-looking statements within the meaning of the Private Securities Litigation Reform Act of 1995, that are subject to risks and uncertainties. The factors that could cause actual results to differ materially from the forward-looking statements made by Exelon include those factors discussed herein, as well as the items discussed in (1) Exelon’s 2014 Annual Report on Form 10-K in (a) ITEM 1A. Risk Factors, (b) ITEM 7.
Management’s Discussion and Analysis of Financial Condition and Results of Operations and (c) ITEM 8. Financial Statements and Supplementary Data: Note 22; (2) Exelon’s Second Quarter 2015 Quarterly Report on Form 10-Q in (a) Part II, Other Information, ITEM 1A. Risk Factors; (b) Part 1, Financial Information, ITEM 2. Management’s Discussion and Analysis of Financial Condition and Results of Operations and (c) Part I, Financial Information, ITEM 1. Financial Statements: Note 19; and (3) other factors discussed in filings with the SEC by Exelon and Generation. Readers are cautioned not to place undue reliance on these forward-looking statements, which apply only as of the date of this report. Exelon does not undertake any obligation to publicly release any revision to its forward-looking statements to reflect events or circumstances after the date of this report.
1 Wolfe Conference
|
|
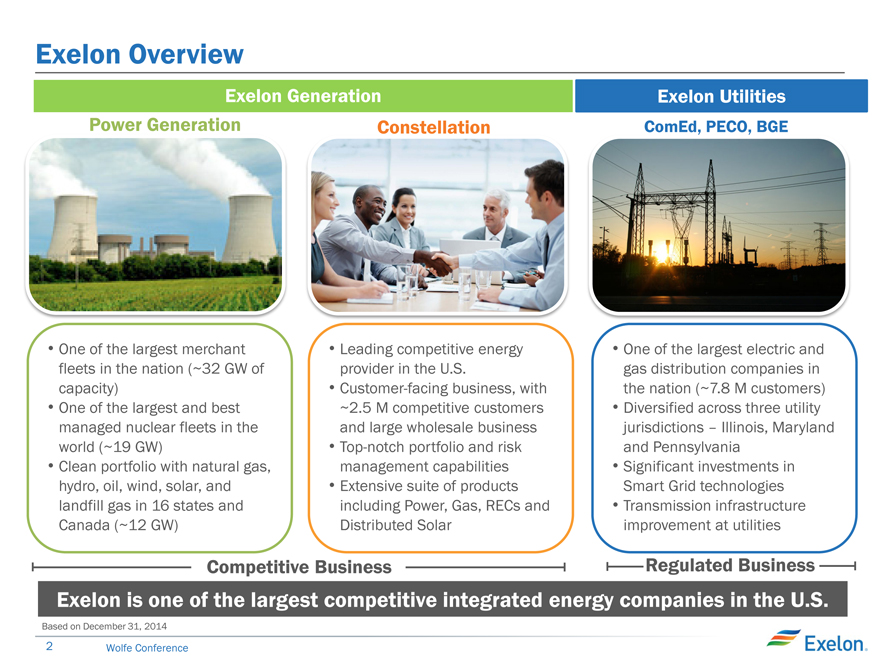
Exelon Overview
Exelon Generation
Power Generation Constellation
One of theGenerationlargest merchant LeadingRetail competitive & Wholesale energy
fleets in the nation (~32 GW of provider in the U.S.
capacity) • Customer-facing business, with
One of the largest and best ~2.5 M competitive customers
managed nuclear fleets in the and large wholesale business
world (~19 GW) • Top-notch portfolio and risk
Clean portfolio with natural gas, management capabilities
hydro, oil, wind, solar, and • Extensive suite of products
landfill gas in 16 states and including Power, Gas, RECs and
Canada (~12 GW) Distributed Solar
Exelon Utilities
ComEd, PECO, BGE
One of the largest electric and gas distribution companies in the nation (~7.8 M customers)
DiversifiedEacross three utility jurisdictionsx – Illinois, Maryland
e and Pennsylvania l Significanto investments in Smart Grid n technologies
Transmission infrastructure improvement at utilities
Competitive Business
Regulated Business
Exelon is one of the largest competitive integrated energy companies in the U.S.
Based on December 31, 2014
2 Wolfe Conference
|
|
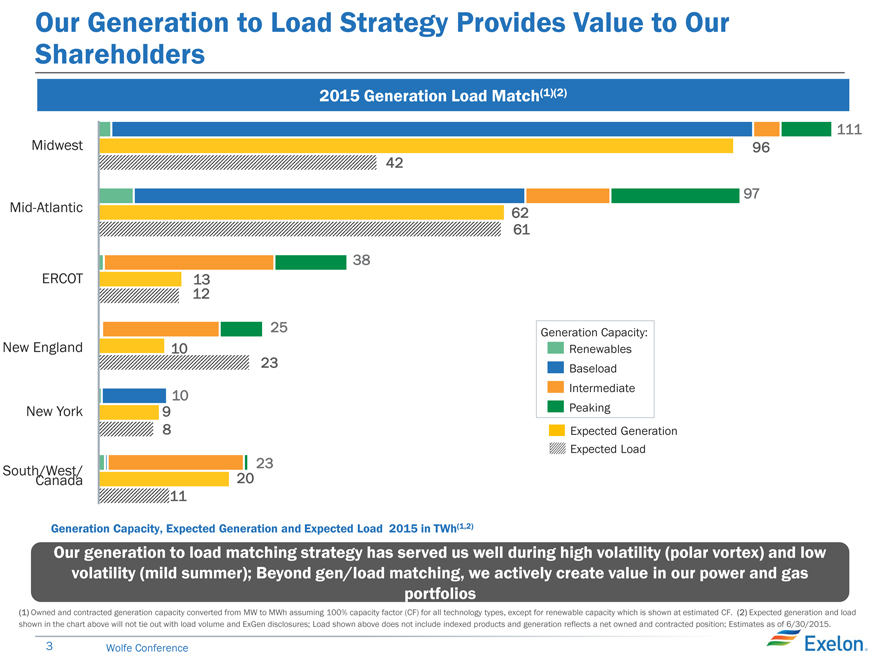
Our Generation to Load Strategy Provides Value to Our Shareholders
2015 Generation Load Match(1)(2)
111
Midwest 96
42
97
Mid-Atlantic 62
61
38
ERCOT 13
12
25 Generation Capacity:
New England 10 Renewables
23 Baseload
10 Intermediate
New York 9 Peaking
8 Expected Generation
Expected Load
South/West/ 23
Canada 20
11
Generation Capacity, Expected Generation and Expected Load 2015 in TWh(1,2)
Our generation to load matching strategy has served us well during high volatility (polar vortex) and low volatility (mild summer); Beyond gen/load matching, we actively create value in our power and gas portfolios
(1) Owned and contracted generation capacity converted from MW to MWh assuming 100% capacity factor (CF) for all technology types, except for renewable capacity which is shown at estimated CF. (2) Expected generation and load shown in the chart above will not tie out with load volume and ExGen disclosures; Load shown above does not include indexed products and generation reflects a net owned and contracted position; Estimates as of 6/30/2015.
3 Wolfe Conference
|
|
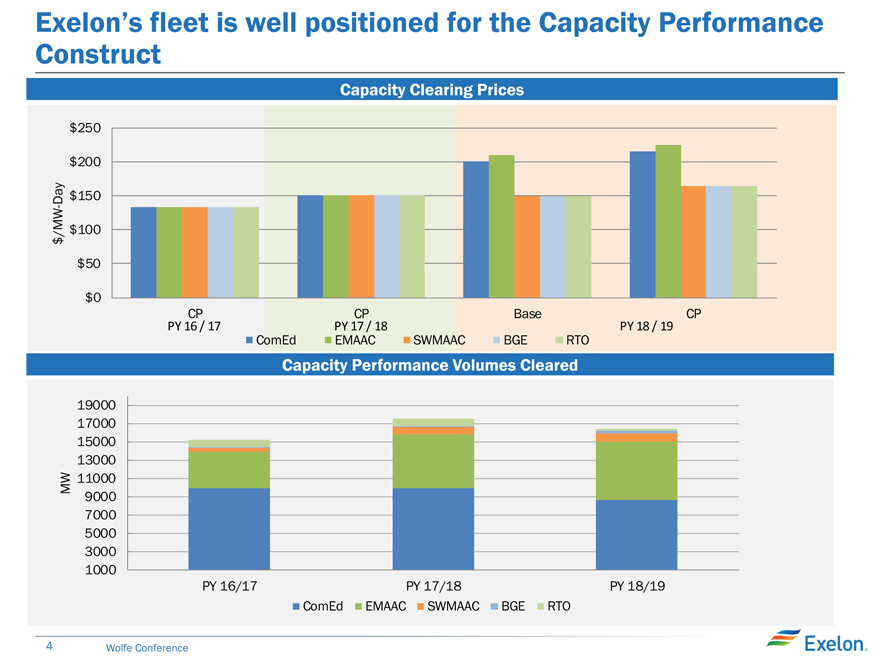
Exelon’s fleet is well positioned for the Capacity Performance Construct
Capacity Clearing Prices
$250
$200
Day $150
-
/MW $100
$
$50
$0
CP CP Base CP
PY 16 / 17 PY 17 / 18 PY 18 / 19
ComEd EMAAC SWMAAC BGE RTO
Capacity Performance Volumes Cleared
19000
17000
15000
13000
MW 11000
9000
7000
5000
3000
1000
PY 16/17 PY 17/18 PY 18/19 ComEd EMAAC SWMAAC BGE RTO
4 Wolfe Conference
|
|
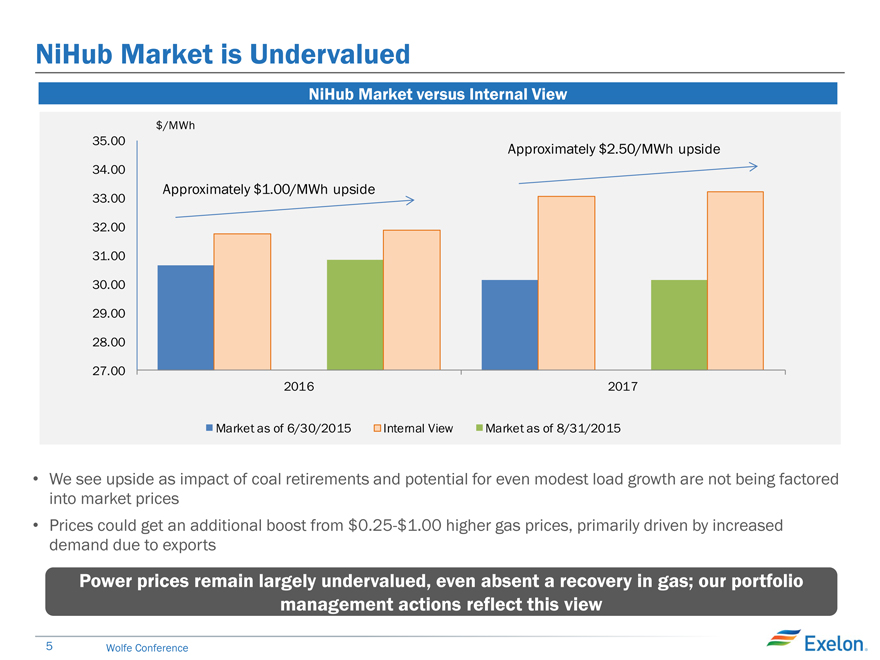
NiHub Market is Undervalued
NiHub Market versus Internal View
$/MWh
35.00 Approximately $2.50/MWh upside
34.00
33.00 Approximately $1.00/MWh upside
32.00
31.00
30.00
29.00
28.00
27.00
2016 2017
Market as of 6/30/2015 Internal View Market as of 8/31/2015
We see upside as impact of coal retirements and potential for even modest load growth are not being factored into market prices
Prices could get an additional boost from $0.25-$1.00 higher gas prices, primarily driven by increased demand due to exports
Power prices remain largely undervalued, even absent a recovery in gas; our portfolio management actions reflect this view
5 Wolfe Conference