Attached files
| file | filename |
|---|---|
| EX-1.1 - EX-1.1 - Allegiance Bancshares, Inc. | d917185dex11.htm |
| EX-5.1 - EX-5.1 - Allegiance Bancshares, Inc. | d917185dex51.htm |
| EX-23.2 - EX-23.2 - Allegiance Bancshares, Inc. | d917185dex232.htm |
| EX-10.4 - EX-10.4 - Allegiance Bancshares, Inc. | d917185dex104.htm |
| EX-23.1 - EX-23.1 - Allegiance Bancshares, Inc. | d917185dex231.htm |
| EX-23.3 - EX-23.3 - Allegiance Bancshares, Inc. | d917185dex233.htm |
Table of Contents
As filed with the Securities and Exchange Commission on September 28, 2015
Registration No. 333-206536
UNITED STATES
SECURITIES AND EXCHANGE COMMISSION
WASHINGTON, D.C. 20549
Amendment No. 1
to
FORM S-1
REGISTRATION STATEMENT
UNDER
THE SECURITIES ACT OF 1933
Allegiance Bancshares, Inc.
(Exact Name of Registrant as Specified in Its Charter)
| Texas | 6022 | 26-0589597 | ||
| (State or Other Jurisdiction of Incorporation or Organization) |
(Primary Standard Industrial Classification No.) |
(I.R.S. Employer Identification No.) |
8847 West Sam Houston Parkway N., Suite 200
Houston, Texas 77040
(281) 894-3200
(Address, Including Zip Code, of Registrant’s Principal Executive Offices)
George Martinez, Chairman and Chief Executive Officer
Steven F. Retzloff, President
Allegiance Bancshares, Inc.
8847 West Sam Houston Parkway N., Suite 200
Houston, Texas 77040
(281) 894-3200
(Name, Address and Telephone Number, Including Area Code, of Agent For Service)
Copies to:
| William S. Anderson Jason M. Jean Bracewell & Giuliani LLP 711 Louisiana, Suite 2300 Houston, Texas 77002 (713) 223-2300 (713) 437-5370 (facsimile) |
Aaron M. Kaslow Kilpatrick Townsend & Stockton LLP 607 14th Street, NW, Suite 900 Washington, D.C. 20005 (202) 508-5800 (202) 508-5858 (facsimile) |
Approximate date of commencement of proposed sale to the public: As soon as practicable after the effective date of this Registration Statement.
If any of the securities being registered on this Form are to be offered on a delayed or continuous basis pursuant to Rule 415 under the Securities Act of 1933, check the following box. ¨
If this Form is filed to register additional securities for an offering pursuant to Rule 462(b) under the Securities Act, check the following box and list the Securities Act registration statement number of the earlier effective registration statement for the same offering. ¨
If this Form is a post-effective amendment filed pursuant to Rule 462(c) under the Securities Act, check the following box and list the Securities Act registration statement number of the earlier effective registration statement for the same offering. ¨
If this Form is a post-effective amendment filed pursuant to Rule 462(d) under the Securities Act, check the following box and list the Securities Act registration statement number of the earlier effective registration statement for the same offering. ¨
Indicate by check mark whether the registrant is a large accelerated filer, an accelerated filer, a non-accelerated filer, or a smaller reporting company. See the definitions of “large accelerated filer,” “accelerated filer” and “smaller reporting company” in Rule 12b-2 under the Exchange Act. (check one)
| Large accelerated filer | ¨ | Accelerated filer | ¨ | |||
| Non-accelerated filer | x | Smaller reporting company | ¨ |
CALCULATION OF REGISTRATION FEE
|
| ||||||||
| Title of Each Class of Securities To Be Registered |
Amount to be Registered(1) |
Proposed Maximum Offering Price Per Share(2) |
Proposed Maximum Aggregate Offering Price(1)(2)(3) |
Amount Of Registration Fee | ||||
| Common Stock, $1.00 par value per share |
2,990,000 | $24.00 | $71,760,000 | $1,366.51(4) | ||||
|
| ||||||||
|
| ||||||||
| (1) | Includes 390,000 shares subject to the underwriters’ option to purchase additional shares. |
| (2) | Estimated solely for the purpose of calculating the registration fee pursuant to Rule 457(o) under the Securities Act of 1933, as amended. |
| (3) | Includes the offering price of an additional 390,000 shares of common stock that the underwriters have the option to purchase. |
| (4) | $6,972.00 was previously paid in connection with the initial filing of this Registration Statement. |
The Registrant hereby amends this Registration Statement on such date or dates as may be necessary to delay its effective date until the Registrant shall file an amendment which specifically states that this Registration Statement shall thereafter become effective in accordance with Section 8(a) of the Securities Act of 1933 or until this Registration Statement shall become effective on such date as the Securities and Exchange Commission, acting pursuant to said Section 8(a), may determine.
Table of Contents
The information in this preliminary prospectus is not complete and may be changed. We may not sell these securities until the registration statement filed with the Securities and Exchange Commission is effective. This preliminary prospectus is not an offer to sell these securities and it is not soliciting an offer to buy these securities in any state where the offer or sale is not permitted.
Subject to Completion, Dated September 28, 2015
PROSPECTUS
2,600,000 Shares

COMMON STOCK
This is the initial public offering of shares of common stock of Allegiance Bancshares, Inc., the holding company for Allegiance Bank, a Texas banking association headquartered in Houston, Texas.
We are offering 2,600,000 shares of our common stock. No public market currently exists for our common stock. We have applied to list our common stock on the NASDAQ Global Market under the symbol “ABTX.”
We anticipate that the initial public offering price per share of our common stock will be between $22.00 and $24.00.
We are an “emerging growth company” as defined in the Jumpstart Our Business Startups Act of 2012 and are subject to reduced public company disclosure standards.
Investing in our common stock involves risks. See “Risk Factors” beginning on page 16 of this prospectus to read about factors you should consider before investing in our common stock.
| Per share |
Total | |||||||
| Initial public offering price of our common stock |
$ | $ | ||||||
| Underwriting discounts and commissions |
||||||||
| Proceeds, before expenses, to us(1) |
||||||||
| (1) | See “Underwriting” for additional information regarding the underwriting discounts and commissions and certain expenses payable to the underwriters by us. |
We have granted the underwriters the option to purchase up to an additional 390,000 shares of our common stock from us within 30 days of the date of this prospectus on the same terms and conditions set forth above.
Neither the Securities and Exchange Commission, any state securities commission, the Federal Deposit Insurance Corporation, the Board of Governors of the Federal Reserve System, the Texas Department of Banking nor any other regulatory authority has approved or disapproved of these securities or passed upon the accuracy or adequacy of this prospectus. Any representation to the contrary is a criminal offense.
These securities are not deposits, savings accounts or other obligations of any bank or savings association and are not insured or guaranteed by the Federal Deposit Insurance Corporation or any other governmental agency.
The underwriters expect to deliver the shares to purchasers on or about , 2015, subject to customary closing conditions.
| Baird | Stephens Inc. | |
| Keefe, Bruyette & Woods | Sandler O’Neill + Partners, L.P. | |
| A Stifel Company | ||
The date of this prospectus is , 2015
Table of Contents
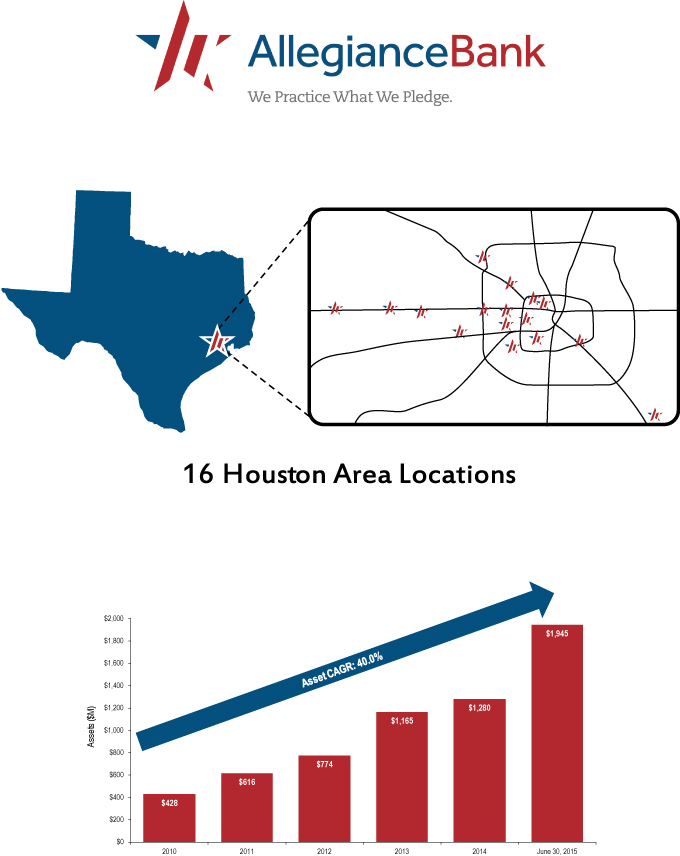
Table of Contents
| 1 | ||||
| 16 | ||||
| 39 | ||||
| 41 | ||||
| 42 | ||||
| 44 | ||||
| 46 | ||||
| 47 | ||||
| Management’s Discussion and Analysis of Financial Condition and Results of Operations |
60 | |||
| 96 | ||||
| 99 | ||||
| 113 | ||||
| 121 | ||||
| 127 | ||||
| 129 | ||||
| 130 | ||||
| 134 | ||||
| Material U.S. Federal Income Tax Considerations for Non-U.S. Holders |
136 | |||
| 139 | ||||
| 143 | ||||
| 143 | ||||
| 143 | ||||
| F-1 | ||||
About this Prospectus
You should rely only on the information contained in this prospectus and any free writing prospectus prepared by us or on our behalf to which we have referred you. We and the underwriters have not authorized anyone to provide you with additional or different information other than the information contained in this prospectus. If anyone provides you with additional, different or inconsistent information, you should not rely on it. We and the underwriters take no responsibility for, and can provide no assurance as to the reliability of, any other information that others may give you. This prospectus is an offer to sell only the shares offered hereby, and only under circumstances and in jurisdictions where it is lawful to do so. We are not making an offer of these securities in any state, country or other jurisdiction where the offer is not permitted. You should not assume that the information in this prospectus or any free writing prospectus is accurate as of any date other than the date of the applicable document regardless of its time of delivery or the time of any sales of our common stock. Our business, financial condition, results of operations and cash flows may have changed since the date of the applicable document.
i
Table of Contents
Market Data
This prospectus includes industry and trade association data, forecasts and information that is based, in part, upon data, forecasts and information obtained from independent trade associations, industry publications and surveys, government agencies and other information available to us, which information may be specific to particular markets or geographic locations. Industry publications and surveys and forecasts generally state that the information contained therein has been obtained from sources believed to be reliable. Although we believe these sources are reliable, we have not independently verified the information. Statements as to our market position are based on market data currently available to us. While we are not aware of any misstatements regarding our industry data presented herein, our estimates involve risks and uncertainties and are subject to change based on various factors, including those discussed under the heading “Risk Factors” in this prospectus. Similarly, we believe our internal research is reliable, even though such research has not been verified by any independent sources.
Implications of Being an Emerging Growth Company
As a company with less than $1.0 billion in revenue during our last fiscal year, we qualify as an “emerging growth company” as defined in the Jumpstart Our Business Startups Act of 2012, or the “JOBS Act.” We will continue to be an emerging growth company until the earliest to occur of: (1) the last day of the fiscal year following the fifth anniversary of this offering; (2) the last day of the fiscal year in which we have more than $1.0 billion in annual revenues; (3) the date on which we are deemed to be a “large accelerated filer” under the Securities Exchange Act of 1934, as amended, or the “Exchange Act;” or (4) the date on which we have, during the previous three-year period, issued more than $1.0 billion in non-convertible debt securities. Until we cease to be an emerging growth company, we may take advantage of specified reduced reporting and other regulatory requirements generally unavailable to other public companies. Those provisions allow us to present only two years of audited financial statements in an initial public offering registration statement, discuss only our results of operations for two years in related Management’s Discussions and Analyses and provide less than five years of selected financial data in an initial public offering registration statement; not to provide an auditor attestation of our internal control over financial reporting; to choose not to comply with any new requirements adopted by the Public Company Accounting Oversight Board, or the “PCAOB,” requiring mandatory audit firm rotation or a supplement to the auditor’s report providing additional information about the audit and our audited financial statements; to provide reduced disclosure regarding our executive compensation arrangements pursuant to the rules applicable to smaller reporting companies, which means we do not have to include a compensation discussion and analysis and certain other disclosure regarding our executive compensation; and not to seek a non-binding advisory vote on executive compensation or golden parachute arrangements. We may choose to take advantage of some or all of these reduced reporting and other regulatory requirements. We have elected in this prospectus to take advantage of scaled disclosure relating to the presentation of financial information and the reduced disclosure requirements relating to executive compensation arrangements.
The JOBS Act also permits an “emerging growth company” to take advantage of an extended transition period to comply with new or revised accounting standards applicable to public companies. However, we have “opted out” of the extended transition period and will comply with new or revised accounting standards to the same extent that compliance is required for non-emerging growth companies. This decision to opt out of the extended transition period under the JOBS Act is irrevocable.
ii
Table of Contents
This summary highlights selected information contained elsewhere in this prospectus and does not contain all of the information that you should consider in making your investment decision. You should read the following summary together with the entire prospectus, including the more detailed information regarding us, the common stock being sold in this offering and our consolidated financial statements and the related notes included elsewhere in this prospectus. You should carefully consider, among other things, the matters discussed in the section entitled “Risk Factors” in this prospectus before deciding to invest in our common stock. Some of the statements in this prospectus constitute forward-looking statements. See “Forward-Looking Statements.”
Except where the context otherwise requires or where otherwise indicated, in this prospectus the terms “we,” “us,” “our,” “ Company” and “our business” refer to Allegiance Bancshares, Inc. and our wholly-owned banking subsidiary, Allegiance Bank, a Texas banking association, and the terms “Allegiance Bank” or the “Bank” refer to Allegiance Bank. In this prospectus, we refer to the Houston-The Woodlands-Sugar Land metropolitan statistical area as the “Houston metropolitan area.”
Overview
We are a Texas corporation and a registered bank holding company headquartered in Houston, Texas. Through our wholly-owned subsidiary, Allegiance Bank, we provide a diversified range of commercial banking services primarily to Houston metropolitan area-based small to medium-sized businesses and individual customers. We believe the size, growth and increasing economic diversity of the Houston metropolitan area, when combined with our super-community banking strategy, provides us with excellent opportunities for long-term, sustainable growth. Our super-community banking strategy, which we describe in more detail below, is designed to foster strong customer relationships while benefitting from a platform and scale that is competitive with larger local and regional banks. We believe this strategy presents a significant market advantage when serving small to medium-sized business customers and enables us to attract talented bankers.
We currently operate 16 full-service banking locations in the Houston metropolitan area and two full-service banking locations in Central Texas. We have experienced significant growth since we began banking operations in 2007, through both organic growth, including de novo branching, and two whole-bank acquisitions. Most recently, on January 1, 2015, we completed the acquisition of Farmers & Merchants Bancshares, Inc. (“F&M Bancshares”) and its subsidiary bank, Enterprise Bank (“Enterprise Bank”). As of June 30, 2015, we had total assets of $1.95 billion, total loans of $1.56 billion, total deposits of $1.63 billion and total stockholders’ equity of $201.8 million.
Our History and Growth
We commenced banking operations as Allegiance Bank in October 2007. We are led by our co-founder, Chairman and Chief Executive Officer, George Martinez, and co-founder and President, Steven F. Retzloff, who founded Allegiance Bank on the premise that a significant opportunity existed for a bank employing their super-community banking strategy in the Houston metropolitan area. Mr. Martinez is an experienced banker who previously co-founded and led Houston-based Sterling Bancshares, Inc. (“Sterling Bancshares”), a multi-billion dollar in assets publicly traded bank holding company acquired by Comerica Bank in 2011. Mr. Martinez led Sterling Bancshares from its inception in 1980 to 2001 serving as its Chief Executive Officer, and continued as Chairman of the Board until 2004. Mr. Retzloff served on the board of directors of Sterling Bancshares from 1987 to 2006, including as Chairman of the Board from 1990 to 1992 and 2004 to 2005. Messrs. Martinez and Retzloff oversee an experienced senior management team, many of whom they worked with at Sterling Bancshares, including Ramon A. Vitulli, III, the President of Allegiance Bank, and Daryl D. Bohls, the Chief Credit Officer of Allegiance Bank.
1
Table of Contents
Since we began operations in 2007, we have expanded our footprint to 18 branch locations and developed a strong lending team of approximately 60 lenders. We experienced strong growth from our formation and achieved profitability beginning in 2010, our third full year of operations. From December 31, 2007 to June 30, 2015, our book value per common share has increased from $9.62 to $19.37 per share, and our tangible book value per common share has increased from $9.62 to $14.79 per share.
As part of our continued growth, we intend to continue to expand our market position through organic growth, including the establishment of de novo branch locations and select acquisitions of other financial institutions. The following table summarizes, with preacquisition historical balances, our two acquisitions to date, both of which were Houston-based banks:
| Institution Acquired |
Date Completed | Acquired Assets |
Acquired Loans |
Acquired Deposits |
Number of Branches |
|||||||||||||
| (Dollars in millions) | ||||||||||||||||||
| Independence Bank, N.A. |
November 13, 2013 | $ | 222.1 | $ | 132.4 | $ | 199.4 | 3 | ||||||||||
| F&M Bancshares |
January 1, 2015 | $ | 569.7 | $ | 410.2 | $ | 488.9 | 9 | * | |||||||||
| * | Promptly following the closing, we consolidated two of the F&M Bancshares branches with two of our existing branches. In addition to the consolidation, we intend to sell two former F&M Bancshares branches and their related assets located in Central Texas if we can agree on terms satisfactory to us. We are actively marketing these two branches and expect to sell them in the next twelve months. We currently do not have a definitive agreement to sell these two branches. |
The following illustrates the impact of each of these acquisitions on our overall growth:
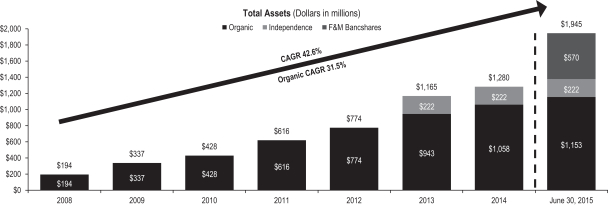
Note: For illustrative purposes, the assets acquired in the 2013 Independence acquisition and the F&M Bancshares acquisition are assumed to have stayed the same since each acquisition, respectively. The Company was formed on April 30, 2008 to serve as the holding company of the Bank.
2
Table of Contents
Our Strategy
Our objective is to grow and strengthen our community banking franchise by deploying our super-community banking strategy and pursuing select strategic acquisitions in the Houston metropolitan area. We are positioning the Bank to be a leading provider of personalized commercial banking services by emphasizing the strength and capabilities of local bank office management and providing superior customer service. We have made the strategic decision to focus on the Houston metropolitan area because of our deep roots and experience operating through a variety of economic cycles in this large and vibrant market.
Super-community banking strategy. We focus on establishing personal relationships with customers through superior service, which we provide through responsive decision-making and empowering personnel to respond quickly to customers’ needs. We focus on lending to and banking with small to medium-sized businesses, for which we believe loans can be priced on terms that are more attractive to us than we would achieve by lending to larger businesses. We operate full-service decentralized branches and employ lenders with strong underwriting credentials who we authorize to make loan and underwriting decisions at the branch level up to prescribed limits. We support our branch operations with a centralized credit approval process for larger credit relationships, loan operations, information technology, core data processing, accounting, finance, treasury and treasury management support, deposit operations and executive/board oversight. Our strategy emphasizes community involvement by our directors, officers and employees, which further allows us to be responsive in developing products and services. This approach produces clear competitive advantages by delivering an extraordinary customer experience and fostering a culture dedicated to achieving both superior external and internal service levels.
We plan to continue to emphasize our super-community banking strategy to organically grow our presence in the Houston metropolitan area through:
| • | increasing the productivity of our existing bankers, as measured by loans, deposits and fee income per banker, while enhancing profitability by leveraging our existing operating platform; |
| • | focusing on individualized and local decision-making, allowing us to provide customers with rapid decisions on loan requests, which we believe allows us to effectively compete with larger financial institutions; |
| • | identifying and hiring additional seasoned bankers in our existing and target markets in the Houston metropolitan area who will thrive under our super-community banking model, and opening additional branches where we are able to attract seasoned bankers; and |
| • | developing new products designed to serve an increasingly diversified Houston economy, while preserving our strong risk management culture. |
Select strategic acquisitions. We intend to complement our strong organic growth by continuing to pursue a disciplined acquisition strategy within the Houston metropolitan area. Our focus is on like-minded community banks with similar lending strategies. We believe that our management’s experience in assessing, executing and integrating target institutions will allow us to capitalize on acquisition opportunities.
Our Strengths
We believe that we are well positioned to execute our super-community banking strategy as a result of the following competitive strengths:
| • | Experienced senior management team. Our senior management team has a demonstrated track record of managing profitable organic growth, successfully executing and integrating acquisitions, improving operating efficiencies, maintaining a strong risk management culture and implementing a community-and service-focused approach to banking. Many of our senior management executives, lenders and |
3
Table of Contents
| employees served with Messrs. Martinez and Retzloff at Sterling Bancshares, overseeing its strong and profitable growth, which included numerous acquisitions. Our board of directors has many years of combined experience in serving as directors and/or officers of financial institutions. Our directors have a wide array of business experience and, as residents of our primary market area, participate in and support community activities, which is a significant asset to our business development efforts and enables our directors to be responsive to the needs of our customers. The interests of our executive officers and directors are aligned with our shareholders through meaningful ownership in us, with beneficial ownership by our executive officers and directors amounting to approximately 15.7% of our common stock as of August 3, 2015. |
| • | Scalable banking and operational platform designed to foster and accommodate significant growth. Utilizing the significant prior experience of our management team and employees, we believe that we have built a capable and knowledgeable staff; and we have made significant investments in the technology and systems necessary to build a scalable corporate infrastructure with the capacity to support continued growth. We believe that our strong capital and asset quality position will allow us to grow and that our scalable operating platform will allow us to manage that growth effectively, resulting in greater efficiency and enhanced profitability. For the six months ended June 30, 2015, our efficiency ratio was 67.0%. Excluding merger related expenses of $867 thousand in the first quarter of 2015 and $72 thousand in the second quarter of 2015 related to the F&M Bancshares acquisition, our efficiency ratio was 64.7% for the six months ended June 30, 2015. |
| • | Community-focused, full service relationships. We believe that our super-community banking strategy facilitates strong relationships with our customers. We actively solicit the deposit business of our consumer and commercial loan customers and seek to further leverage these relationships by cross-selling our products and services. We are able to achieve favorable loan yields and deposit rates that result in strong levels of net interest margin, which for the six months ended June 30, 2015 was 4.76% on a tax-equivalent basis and 4.49% without acquisition accounting adjustments. |
| • | Loans—By focusing on what we believe is an underserved segment of the market and providing rapid decisions on loan requests, we have been able to obtain favorable loan rates. Our average yield on loans was 5.77% for the six months ended June 30, 2015. |
| • | Deposits—Our emphasis on establishing a full service relationship with our customers has provided us with a significant supply of core deposits, including noninterest-bearing deposits. Noninterest-bearing deposits represented 34.2% of total deposits as of June 30, 2015. Low cost core deposits are an important driver of our profitability, as our average cost of deposits was 0.43% for the six months ended June 30, 2015. |
| • | Focus on seasoned lenders. Our team of seasoned lenders has been a significant component of our organic growth. Our officer compensation structure, which includes equity grants, profit sharing and various incentive programs, motivates our lenders to increase the size of their loan and deposit portfolios and generate fee income while maintaining strong credit quality. We believe that our officer compensation programs attract talented lenders to us. |
| • | Disciplined underwriting and credit administration. Our management, lending officers and credit administration team emphasize a strong risk management culture supported by comprehensive policies and procedures for credit underwriting, funding and administration that we believe has enabled us to maintain sound asset quality. Our underwriting methodology emphasizes analysis of global cash flow coverage, loan to collateral value, and obtaining personal guaranties in all but a few well-secured cases. Our tiered underwriting structure includes progressive levels of individual loan authority, concurrence authority and senior loan committee approval. We intend to continue to emphasize and adhere to these procedures and controls, which we believe have helped to minimize our level of loan charge-offs. Our average annual net charge-offs to average loans for 2012 through 2014 was 0.11%. |
4
Table of Contents
| • | Diversified loan portfolio. Our focus on loans to small to medium-sized businesses results in a more diversified portfolio of relatively smaller loan relationships, thus reducing the risk that results from dependence on larger lending relationships. As of June 30, 2015, our average funded loan size was approximately $260 thousand. We do not lend directly to oil and gas exploration and production companies and roughly 2.5% of our total loan portfolio is to customers in the oilfield services industry. Although we operate in the Houston metropolitan area, we believe that our lack of direct lending to oil and gas exploration and production companies and reserve-based lending will reduce the effect to our business in the event of a prolonged period of lower oil and gas prices. |
Our Market Area
Our primary market is the Houston metropolitan area, which has consistently been one of the most attractive metropolitan markets in the United States over the last 10 years in terms of both demographic and economic growth. The Houston metropolitan area has demonstrated strong population and employment trends, and an economy supported by a diverse range of businesses.
Population Size and Growth Center. The Houston metropolitan area is the fifth most populous metropolitan area in the United States with 6.2 million people as of 2014 according to U.S. Census Bureau. The population of the Houston metropolitan area is projected to grow by 7.72% from 2015 to 2020, compared to 6.70% for the state of Texas and 3.52% for the United States, according to SNL Financial.
Leading Employment Growth. Since 2007, the Houston metropolitan area has grown nonagricultural employment 14.5%, well above the national average of 2.7% according to the BLS. In 2014 alone, the Houston metropolitan area added 120,600 jobs, outpacing national job growth in every measured sector according to the BLS. The Greater Houston Partnership or “GHP” reports that the Houston metropolitan area was also the first major metropolitan market to recover from the recession that began in late 2008 and has regained 381.6% of jobs lost since the trough, the highest of the 20 most populous metropolitan statistical areas. In addition, Houston’s unemployment rate has been resilient over the past few months. At the end of November 2014, when the price of West Texas Intermediate Crude (“WTI”) was approximately $60 a barrel, Houston unemployment was 4.5%, the eighth lowest for major metropolitan areas in the United States, and compared favorably to the national rate of 5.8%. At the end of June 2015, when the price of WTI was approximately $60 a barrel, unemployment was stable at 4.5% below the national average of 5.3% giving Houston the 11th lowest unemployment rate among major metropolitan areas in the United States.
Robust Small Business Environment. Small businesses are a key driver of the Houston metropolitan area economy. According to the Houston Business Journal, there were 120,183 small businesses operating in Houston as of April 2014. Of these businesses, 119,005 were businesses with fewer than 100 employees, the ninth most nationwide. Houston also has the fourth most entrepreneurs per 100,000 people of any city in the country and consistently ranks as one of the top metropolitan areas for entrepreneurs according to Forbes. The GHP indicates that in 2013, the Houston metropolitan area had the fastest growing economy of the nation’s 50 most populous metropolitan areas.
Economic Diversity. The Houston metropolitan area has a robust and increasingly diversified economy outside of the energy sector. According to the GHP, no single industry contributes more than 21% of gross area product in the Houston metropolitan area, with seven industries contributing at least 5%. In 2014, the largest number of new jobs came from the health care/education and construction sectors, which added 23,100 and 14,900 jobs, respectively, according to the BLS. The health care industry has been a long-term growth engine for the Houston metropolitan area, which is home to 80 hospitals, including the world’s largest medical complex, the Texas
5
Table of Contents
Medical Center. Colliers International reports that more than 7.2 million patients visit the Texas Medical Center annually, with an estimated regional annual economic impact of $15 billion. Construction experienced the fastest annual rate of job growth of any sector in 2014 of just under 20% according to the GHP. The GHP also indicates that the city of Houston issued $8.7 billion in construction permits in 2014, a 41% increase from 2013, and absorbed 5.5 million square feet of office space. Additionally, 17,600 multifamily units were delivered in Houston in 2014 with another 20,000 expected in 2015 according to the CBRE Group, and 2.4 million square feet of retail were delivered in 2014 with another 3.7 million square feet in 2015 according to the GHP, via Wulfe & Co. The following charts depict Houston’s gross area product and employment by industry segment as of summer 2014 and July 2015, respectively:
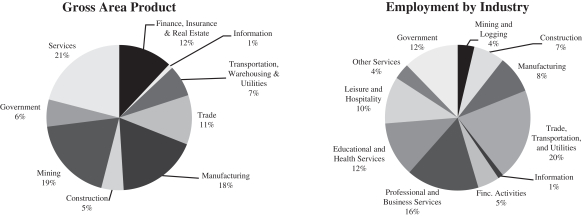
Source: GHP, via The Perryman Group and the BLS.
Houston’s increasingly diverse economy is important, particularly during times of lower oil and gas prices. Oil prices have been volatile in recent months, punctuated by a dramatic and rapid decline in prices for WTI Crude from nearly $105 per barrel in June 2014 to $53 per barrel at the end of 2014, a nearly 50% decline in six months. Despite a modest decline in oil prices through July 2015, we cannot predict whether prices have stabilized and whether or when prices will increase. Because the decline in oil and gas prices is still relatively recent, it is unclear how and to what degree such decline, or any prolonged period of lower oil and gas prices will impact Houston’s economy. Greater economic diversity and lower dependence on the energy sector in the future should mitigate the effect of oil price volatility on the Houston economy.
Country’s Largest Exporter. The Port of Houston was the nation’s largest export market, handling $353 billion of trade in 2014 according to the GHP. According to the GHP, the Port of Houston supports more than one million jobs and generates more than $56.5 billion in personal income, $17.9 billion in business revenue, and $4.5 billion of state and local taxes. According to Port of Houston Authority, the Port Authority has handled nearly 14 million tons of cargo between January 1 and July 28, 2015, up 20% for the year, while import steel was up more than 26% for the year through April. In 2011, the last year data is available from the Department of Commerce, 11,940 companies exported from Houston. Of those 11,940 companies, 11,068 were small or medium-sized exporters with fewer than 500 employees according to the Department of Commerce. The imminent completion of the Panama Canal expansion is expected to further increase activity at the Port of Houston.
6
Table of Contents
Our Challenges
Our ability to implement our super-community banking strategy and the success of our business is subject to numerous risks and uncertainties. You should carefully consider all of the information set forth in this prospectus and, in particular, the information under the heading “Risk Factors,” prior to making an investment in our common stock. These risks include, among others, the following:
| • | Our business concentration in Texas, and specifically in the Houston metropolitan area, exposes us to risks and may magnify the consequences of any local or regional downturn affecting Houston, including the most recent decline in oil and gas prices; |
| • | Our ability to implement our growth strategy and maintain historical earnings trends, through generation of new loans and deposits within acceptable risk and expense tolerances as well as identification of acquisition candidates that will be accretive to our financial condition and results of operations; |
| • | We depend on our management team to implement our business strategy and we could be harmed by the loss of their services; |
| • | We focus on decision-making authority at the branch and market level, and our business, financial condition, results of operations and prospects could be negatively affected if our local teams do not follow our internal policies or are negligent in their decision-making; and |
| • | Many of our customers are small to medium-sized businesses that may have fewer resources to weather adverse market conditions, which may impact their ability to repay loans and in turn have an adverse effect on our results of operations and financial condition. |
Our Corporate Information
Our principal executive offices are located at 8847 West Sam Houston Parkway N., Suite 200, Houston, Texas 77040, and our telephone number is (281) 894-3200. Our website is www.allegiancebank.com. The information contained on or accessible from our website does not constitute a part of this prospectus and is not incorporated by reference herein.
Third Quarter 2015 Update
We expect to report net income in the range of $4.0 million to $4.3 million and net income attributable to common stockholders in the range of $3.8 million to $4.1 million for the three months ended September 30, 2015 as compared to net income of $3.9 million and net income attributable to common stockholders of $3.6 million for the three months ended June 30, 2015. The expected increase in net income is primarily attributable to growth in outstanding loan balances, a corresponding increase in net interest income and efficiencies achieved through our continued integration of F&M Bancshares. For the period from June 30, 2015 to September 15, 2015, average loans increased $92.7 million to $1.57 billion from $1.48 billion for the three months ended June 30, 2015.
We expect to report diluted earnings per share in the range of $0.40 to $0.43 for the three months ended September 30, 2015. We expect to report tangible book value per common share in the range of $15.34 to $15.37 as of September 30, 2015.
We have provided a range, rather than a specific amount, for certain of the preliminary results described above primarily because our financial closing procedures for the three months ending September 30, 2015 are not yet complete. We expect to complete our closing procedures with respect to the three months ending September 30, 2015 after the completion of this offering. These closing procedures could result in material changes to our preliminary estimates indicated above. The foregoing estimates constitute forward-looking statements and are subject to risks and uncertainties, including those described under “Risk Factors” in this prospectus. Accordingly, our final results for the three month period ending September 30, 2015 may not be consistent with the foregoing estimates. See “Risk Factors—Risks Related to Our Business” and “Forward-Looking Statements.”
7
Table of Contents
The Offering
| Common stock we are offering |
2,600,000 shares (2,990,000 shares if the underwriters exercise their option to purchase additional shares in full). | |
| Common stock to be outstanding after this offering |
12,423,025 shares (12,813,025 shares if the underwriters exercise their option to purchase additional shares in full). | |
| Use of proceeds |
We estimate that the net proceeds to us from the sale of common stock in the offering will be approximately $54.4 million, after deducting the estimated underwriting discounts and commissions and estimated offering expenses payable by us, based on an assumed initial public offering price of $23.00 per share, which is the midpoint of the estimated initial public offering price range set forth on the cover page of this prospectus. If the underwriters exercise their option to purchase additional shares in full, the net proceeds to us will be approximately $62.7 million. We intend to use the net proceeds to us from this offering, in part, to repay $28.1 million of outstanding indebtedness under a revolving credit facility, plus accrued and unpaid interest. We intend to use any remaining net proceeds from this offering to support our continued growth, including organic growth and potential future acquisitions, and for general corporate purposes. We have no current plans, arrangements or understandings to make any acquisitions. See “Use of Proceeds.” | |
| Dividend policy |
We have not declared or paid any dividends on our common stock. We currently intend to retain all of our future earnings, if any, for use in our business and do not anticipate paying any cash dividends on our common stock in the foreseeable future. See “Dividend Policy.” | |
| Rank |
Our common stock is subordinate to junior subordinated debentures (and related TruPS) with an aggregate original principal (and liquidation) amount of $11.3 million with respect to the payment of dividends and the distribution of assets upon liquidation, which we assumed in connection with our acquisition of F&M Bancshares on January 1, 2015. In addition, our common stock is subordinate to balances outstanding under our revolving credit facility and any debt that we may issue in the future and may be subordinate to any series of preferred stock that we may issue in the future. | |
8
Table of Contents
| Directed share program |
At our request, the underwriters have reserved up to 5% of the common stock being offered by this prospectus, for sale, at the initial public offering price, to our directors, officers, employees and certain other persons who have expressed an interest in purchasing our common stock in this offering. The number of shares available for sale to the general public in this offering will be reduced to the extent these persons purchase the reserved shares. Any reserved shares not so purchased will be offered by the underwriters to the general public on the same terms as the other shares. | |
| Risk factors |
See “Risk Factors” for a discussion of factors you should carefully consider before deciding to invest in our common stock. | |
| Stock exchange symbol |
We have applied to list our common stock on the NASDAQ Global Market under the symbol “ABTX.” | |
Except as otherwise indicated, all of the information in this prospectus:
| • | assumes no exercise of the underwriters’ option to purchase up to 390,000 additional shares of common stock from us; |
| • | excludes approximately 895,992 shares of common stock issuable upon exercise of outstanding stock options at a weighted average exercise price of $17.05 per share (452,042 shares of which are currently exercisable) as of June 30, 2015; |
| • | excludes 445,564 shares of our common stock reserved for issuance in connection with restricted stock awards and stock options available for issuance under our Amended and Restated Equity Plan as of June 30, 2015; and |
| • | assumes an initial offering price of $23.00 per share, which is the midpoint of the estimated initial public offering price range set forth on the cover page of this prospectus. |
9
Table of Contents
SELECTED HISTORICAL CONSOLIDATED FINANCIAL DATA
The following table sets forth our selected historical consolidated financial data for the periods and as of the dates indicated. You should read this information together with “Management’s Discussion and Analysis of Financial Condition and Results of Operations” and our audited consolidated financial statements and the related notes included elsewhere in this prospectus. The selected historical consolidated financial data as of and for the years ended December 31, 2014 and 2013 are derived from our audited consolidated financial statements, which are included elsewhere in this prospectus. The selected historical consolidated financial data as of and for the years ended December 31, 2012, 2011 and 2010 (except as otherwise noted below) are derived from our audited consolidated financial statements not included in this prospectus. The selected historical consolidated financial data as of and for the six months ended June 30, 2015 and 2014 have been derived from our unaudited historical consolidated financial statements, which are included elsewhere in this prospectus. Our historical results shown below and elsewhere in this prospectus are not necessarily indicative of our future performance.
| As of and for the Six Months Ended June 30, |
As of and for the Years Ended December 31, | ||||||||||||||||||||||||||||||||||
| 2015 | 2014 | 2014 | 2013 | 2012 | 2011 | 2010 | |||||||||||||||||||||||||||||
| (Dollars in thousands, except share and per share data) | |||||||||||||||||||||||||||||||||||
| Selected Period End Balance Sheet Data: |
|||||||||||||||||||||||||||||||||||
| Cash and cash equivalents |
$ | 138,685 | $ | 156,950 | $ | 167,540 | $ | 213,076 | $ | 151,691 | $ | 119,962 | $ | 81,861 | |||||||||||||||||||||
| Available for sale securities |
151,662 | 90,273 | 84,962 | 87,007 | 36,927 | 23,437 | 12,991 | ||||||||||||||||||||||||||||
| Loans held for sale |
25,629 | — | — | — | — | — | — | ||||||||||||||||||||||||||||
| Loans held for investment |
1,536,028 | 933,134 | 1,002,054 | 836,694 | 576,589 | 462,862 | 321,720 | ||||||||||||||||||||||||||||
| Allowance for loan losses |
10,312 | 7,462 | 8,246 | 6,655 | 6,539 | 5,543 | 4,026 | ||||||||||||||||||||||||||||
| Goodwill and intangible assets, net |
45,034 | 13,050 | 12,891 | 13,044 | — | — | — | ||||||||||||||||||||||||||||
| Total assets |
1,945,156 | 1,205,632 | 1,280,008 | 1,164,759 | 774,308 | 616,467 | 428,445 | ||||||||||||||||||||||||||||
| Noninterest-bearing deposits |
556,502 | 341,648 | 373,795 | 325,410 | 216,577 | 146,420 | 77,150 | ||||||||||||||||||||||||||||
| Interest-bearing deposits |
1,068,822 | 734,907 | 759,889 | 719,921 | 487,499 | 416,377 | 305,519 | ||||||||||||||||||||||||||||
| Total deposits |
1,625,324 | 1,076,555 | 1,133,684 | 1,045,331 | 704,076 | 562,797 | 382,669 | ||||||||||||||||||||||||||||
| Total stockholders’ equity |
201,830 | 116,071 | 131,778 | 109,736 | 68,085 | 52,907 | 45,392 | ||||||||||||||||||||||||||||
| Total common stockholders’ equity |
190,280 | 116,071 | 131,778 | 109,736 | 68,085 | 52,907 | 45,392 | ||||||||||||||||||||||||||||
| Selected Income Statement Data: |
|||||||||||||||||||||||||||||||||||
| Net interest income |
$ | 38,504 | $ | 22,101 | $ | 46,834 | $ | 33,891 | $ | 29,126 | $ | 21,198 | $ | 15,380 | |||||||||||||||||||||
| Provision for loan losses |
2,103 | 900 | 2,150 | 240 | 2,337 | 2,454 | 1,692 | ||||||||||||||||||||||||||||
| Net interest income after provision for loan losses |
36,401 | 21,201 | 44,684 | 33,651 | 26,789 | 18,744 | 13,688 | ||||||||||||||||||||||||||||
| Noninterest income |
1,813 | 1,321 | 2,607 | 1,639 | 1,193 | 843 | 610 | ||||||||||||||||||||||||||||
| Noninterest expense |
27,008 | 15,269 | 33,458 | 24,598 | 20,927 | 16,391 | 12,403 | ||||||||||||||||||||||||||||
| Net income before income taxes |
11,206 | 7,253 | 13,833 | 10,692 | 7,055 | 3,196 | 1,895 | ||||||||||||||||||||||||||||
| Net income |
7,354 | 4,684 | 9,005 | 6,839 | 4,555 | 2,995 | 2,013 | ||||||||||||||||||||||||||||
| Net income attributable to common stockholders |
6,968 | 4,684 | 9,005 | 6,839 | 4,555 | 2,995 | 2,013 | ||||||||||||||||||||||||||||
| Selected Per Share Data: |
|||||||||||||||||||||||||||||||||||
| Earnings per common share, basic |
$ | 0.71 | $ | 0.67 | $ | 1.29 | $ | 1.25 | $ | 0.92 | $ | 0.69 | $ | 0.48 | |||||||||||||||||||||
| Earnings per common share, diluted |
0.70 | 0.66 | 1.26 | 1.22 | 0.90 | 0.68 | 0.48 | ||||||||||||||||||||||||||||
| Book value per common share |
19.37 | 16.64 | 17.62 | 15.78 | 13.14 | 11.61 | 10.47 | ||||||||||||||||||||||||||||
| Tangible book value per common share(1) |
14.79 | 14.77 | 15.90 | 13.91 | 13.14 | 11.61 | 10.47 | ||||||||||||||||||||||||||||
| Weighted average common shares outstanding, basic |
9,823,630 | 6,969,261 | 6,978,025 | 5,449,700 | 4,931,401 | 4,344,607 | 4,182,343 | ||||||||||||||||||||||||||||
| Weighted average common shares outstanding, diluted |
10,001,099 | 7,122,942 | 7,142,377 | 5,621,042 | 5,050,603 | 4,407,983 | 4,214,585 | ||||||||||||||||||||||||||||
| Shares outstanding at end of period |
9,822,950 | 6,976,059 | 7,477,309 | 6,953,125 | 5,182,734 | 4,557,992 | 4,333,782 | ||||||||||||||||||||||||||||
10
Table of Contents
| As of and for the Six Months Ended June 30, |
As of and for the Years Ended December 31, | ||||||||||||||||||||||||||||||||||
| 2015 | 2014 | 2014 | 2013 | 2012 | 2011 | 2010 | |||||||||||||||||||||||||||||
| (Dollars in thousands, except share and per share data) | |||||||||||||||||||||||||||||||||||
| Selected Performance Metrics: |
|||||||||||||||||||||||||||||||||||
| Return on average assets(2)(5)(7) |
0.80 | % | 0.82 | % | 0.75 | % | 0.78 | % | 0.65 | % | 0.60 | % | 0.53 | % | |||||||||||||||||||||
| Return on average common equity(2)(5)(7) |
7.47 | % | 8.30 | % | 7.73 | % | 9.02 | % | 7.38 | % | 6.30 | % | 4.76 | % | |||||||||||||||||||||
| Return on average tangible common equity(1)(2)(5)(7) |
9.83 | % | 9.38 | % | 8.70 | % | 9.22 | % | 7.38 | % | 6.30 | % | 4.76 | % | |||||||||||||||||||||
| Tax equivalent net interest margin(3)(5) |
4.76 | % | 4.26 | % | 4.32 | % | 4.19 | % | 4.44 | % | 4.33 | % | 4.24 | % | |||||||||||||||||||||
| Efficiency ratio(4) |
66.99 | % | 65.19 | % | 67.67 | % | 69.23 | % | 69.02 | % | 74.36 | % | 77.57 | % | |||||||||||||||||||||
| Loans to deposits ratio |
96.08 | % | 86.68 | % | 88.39 | % | 80.04 | % | 81.89 | % | 82.24 | % | 84.07 | % | |||||||||||||||||||||
| Noninterest expense to average assets(2)(5)(7) |
2.95 | % | 2.67 | % | 2.80 | % | 2.82 | % | 2.99 | % | 3.26 | % | 3.30 | % | |||||||||||||||||||||
| Selected Credit Quality Ratios: |
|||||||||||||||||||||||||||||||||||
| Nonperforming assets to total assets |
0.32 | % | 0.28 | % | 0.25 | % | 0.25 | % | 0.82 | % | 0.30 | % | 1.08 | % | |||||||||||||||||||||
| Nonperforming loans to total loans |
0.37 | % | 0.36 | % | 0.32 | % | 0.31 | % | 0.94 | % | 0.02 | % | 0.59 | % | |||||||||||||||||||||
| Allowance for loan losses to nonperforming loans |
180.22 | % | 224.42 | % | 258.98 | % | 258.75 | % | 121.00 | % | 7,918.57 | % | 211.34 | % | |||||||||||||||||||||
| Allowance for loan losses to total loans |
0.66 | % | 0.80 | % | 0.82 | % | 0.80 | % | 1.13 | % | 1.20 | % | 1.25 | % | |||||||||||||||||||||
| Provision for loan losses to average loans(7) |
0.29 | % | 0.21 | % | 0.23 | % | 0.04 | % | 0.44 | % | 0.65 | % | 0.59 | % | |||||||||||||||||||||
| Net charge-offs to average loans(5)(7) |
0.01 | % | 0.02 | % | 0.06 | % | 0.02 | % | 0.25 | % | 0.25 | % | 0.29 | % | |||||||||||||||||||||
| Capital Ratios: |
|||||||||||||||||||||||||||||||||||
| Common equity Tier 1 capital ratio |
8.68 | % | N/A | N/A | N/A | N/A | N/A | N/A | |||||||||||||||||||||||||||
| Leverage capital ratio(6) |
9.34 | % | 8.92 | % | 9.55 | % | 9.61 | % | 8.09 | % | 8.71 | % | 10.75 | % | |||||||||||||||||||||
| Tier 1 risk-based capital ratio(6) |
9.88 | % | 10.86 | % | 11.96 | % | 11.60 | % | 11.04 | % | 11.39 | % | 13.74 | % | |||||||||||||||||||||
| Total risk-based capital ratio(6) |
10.48 | % | 11.65 | % | 12.80 | % | 12.39 | % | 12.19 | % | 12.61 | % | 14.94 | % | |||||||||||||||||||||
| Tangible common equity to tangible assets(1) |
7.64 | % | 8.64 | % | 9.38 | % | 8.40 | % | 8.79 | % | 8.58 | % | 10.59 | % | |||||||||||||||||||||
| Average common stockholders’ equity to average total assets(2)(5) |
10.20 | % | 9.88 | % | 9.76 | % | 8.69 | % | 8.84 | % | 9.46 | % | 11.24 | % | |||||||||||||||||||||
| (1) | For information on how we calculate tangible stockholders’ equity and other non-GAAP financial measures and a reconciliation to their most directly comparable GAAP financial measures, see “Management’s Discussion and Analysis of Financial Condition and Results of Operations—GAAP Reconciliation and Management’s Explanation of Non-GAAP Financial Measures.” |
| (2) | Except as otherwise indicated in this footnote, we calculate our average assets and average common equity for a period by dividing the sum of our total assets or total common stockholders’ equity, as the case may be, as of the close of business on each day in the relevant period, by the number of days in the period. We have calculated our return on average assets by dividing net income for that period by our average assets. We calculated our return on average common equity for a period by dividing net income attributable to common stockholders for that period by our average common equity and average tangible common equity, as the case may be, for that period. |
| (3) | Net interest margin represents net interest income divided by average interest-earning assets. |
| (4) | Efficiency ratio represents noninterest expense divided by the sum of net interest income plus noninterest income, excluding net gains and losses on the sale of assets and securities. Additionally, taxes and provision for loan losses are not part of this calculation. |
| (5) | As a result of system conversions, we are unable to calculate daily average balances for 2012, 2011 or 2010. For these periods, average loans, securities, deposits in other financial institutions, assets and equity are calculated by averaging the ending balance of the prior month and the ending balance of the current month and multiplying the average by the number of days in the current month. The twelve resulting products were then added together and the resulting sum is divided by the number of days in the year. |
| (6) | Total assets as of December 31, 2012, 2011 and 2010 were less than $1 billion. As a result of our asset size during 2012, 2011 and 2010, we did not file consolidated regulatory reports during these periods. The capital ratios for these years represent the ratios for Allegiance Bank only. |
| (7) | Interim periods annualized. |
11
Table of Contents
The selected historical consolidated financial data for dates indicated and have been derived from our unaudited historical consolidated financial statements. The comparability of our consolidated results of operations and our consolidated financial condition presented herein is significantly affected by our acquisition of F&M Bancshares in January 2015. Our consolidated results of operations for the three months ended March 31, 2015 show the effect of the acquisition. Our consolidated results of operations for the three months ended June 30, 2015 fully reflect the impact of the acquisition. As a result, the average balances, average income and average expenses for the three months ended March 31, 2015 reflect a partial, but not full, effect of the changes to our assets, liabilities and operations resulting from the acquisition. Additionally, our historical results may not be indicative of our future performance.
| Three Months Ended | ||||||||
| June 30, 2015 | March 31, 2015 | |||||||
| (Dollars in thousands, except share and per share data) |
||||||||
| Selected Period End Balance Sheet Data: |
||||||||
| Cash and cash equivalents |
$ | 138,685 | $ | 252,558 | ||||
| Available for sale securities |
151,662 | 96,910 | ||||||
| Loans held for sale |
25,629 | 33,409 | ||||||
| Loans held for investment |
1,536,028 | 1,411,323 | ||||||
| Allowance for loan losses |
10,312 | 8,940 | ||||||
| Goodwill and intangible assets, net |
45,034 | 45,241 | ||||||
| Total assets |
1,945,156 | 1,884,886 | ||||||
| Noninterest-bearing deposits |
556,502 | 554,624 | ||||||
| Interest-bearing deposits |
1,068,822 | 1,089,095 | ||||||
| Total deposits |
1,625,324 | 1,643,719 | ||||||
| Total stockholders’ equity |
201,830 | 199,024 | ||||||
| Total common stockholders’ equity |
190,280 | 187,474 | ||||||
| Selected Income Statement Data: |
||||||||
| Net interest income |
$ | 19,734 | $ | 18,770 | ||||
| Provision for loan losses |
1,420 | 683 | ||||||
| Net interest income after provision for loan losses |
18,314 | 18,087 | ||||||
| Noninterest income |
947 | 866 | ||||||
| Noninterest expense |
13,422 | 13,586 | ||||||
| Net income before income taxes |
5,839 | 5,367 | ||||||
| Net income |
3,883 | 3,471 | ||||||
| Net income attributable to common stockholders |
3,623 | 3,345 | ||||||
| Selected Per Share Data: |
||||||||
| Earnings per common share, basic |
$ | 0.37 | $ | 0.34 | ||||
| Earnings per common share, diluted |
0.36 | 0.33 | ||||||
| Book value per common share |
19.37 | 19.08 | ||||||
| Tangible book value per common share(1) |
14.79 | 14.48 | ||||||
| Weighted average common shares outstanding, basic |
9,824,537 | 9,822,714 | ||||||
| Weighted average common shares outstanding, diluted |
10,003,664 | 9,998,507 | ||||||
| Shares outstanding at end of period |
9,822,950 | 9,824,116 | ||||||
12
Table of Contents
| Three Months Ended | ||||||||
| June 30, 2015 | March 31, 2015 | |||||||
| (Dollars in thousands, except share and per share data) |
||||||||
| Selected Performance Metrics: |
||||||||
| Return on average assets(2)(5) |
0.84 | % | 0.77 | % | ||||
| Return on average common equity(2)(5) |
8.20 | % | 7.56 | % | ||||
| Return on average tangible common equity(1)(2)(5) |
10.04 | % | 9.62 | % | ||||
| Tax equivalent net interest margin(3)(5) |
4.79 | % | 4.72 | % | ||||
| Efficiency ratio(4) |
64.90 | % | 69.19 | % | ||||
| Loans to deposits ratio |
96.08 | % | 87.89 | % | ||||
| Noninterest expense to average assets(2)(5) |
2.90 | % | 3.00 | % | ||||
| Selected Credit Quality Ratios: |
||||||||
| Nonperforming assets to total assets |
0.32 | % | 0.36 | % | ||||
| Nonperforming loans to total loans |
0.37 | % | 0.47 | % | ||||
| Allowance for loan losses to nonperforming loans |
180.22 | % | 130.47 | % | ||||
| Allowance for loan losses to total loans |
0.66 | % | 0.62 | % | ||||
| Provision for loan losses to average loans(5) |
0.39 | % | 0.20 | % | ||||
| Net charge-offs to average loans(5) |
0.01 | % | 0.00 | % | ||||
| Capital Ratios: |
||||||||
| Common equity Tier 1 capital ratio |
8.68 | % | 8.98 | % | ||||
| Leverage capital ratio |
9.34 | % | 9.22 | % | ||||
| Tier 1 risk-based capital ratio |
9.88 | % | 10.25 | % | ||||
| Total risk-based capital ratio |
10.48 | % | 10.80 | % | ||||
| Tangible common equity to tangible assets(1) |
7.64 | % | 7.73 | % | ||||
| Average common stockholders’ equity to average assets(2) |
10.24 | % | 10.78 | % | ||||
| (1) | For information on how we calculate tangible stockholders’ equity and other non-GAAP financial measures and a reconciliation to their most directly comparable GAAP financial measures, see “Management’s Discussion and Analysis of Financial Condition and Results of Operations—GAAP Reconciliation and Management’s Explanation of Non-GAAP Financial Measures.” |
| (2) | Except as otherwise indicated in this footnote, we calculate our average assets and average common equity for a period by dividing the sum of our total assets or total common stockholders’ equity, as the case may be, as of the close of business on each day in the relevant period, by the number of days in the period. We have calculated our return on average assets and return on average common equity for a period by dividing net income for that period by our average assets and average common equity, as the case may be, for that period. |
| (3) | Net interest margin represents net interest income divided by average interest-earning assets. |
| (4) | Efficiency ratio represents noninterest expense divided by the sum of net interest income plus noninterest income, excluding net gains and losses on the sale of assets and securities. Additionally, taxes and provision for loan losses are not part of this calculation. |
| (5) | Interim periods annualized. |
13
Table of Contents
UNAUDITED SUMMARY PRO FORMA COMBINED FINANCIAL DATA
The following unaudited summary pro forma combined financial data combines data from the historical consolidated financial statements of the Company and the historical consolidated financial statements of F&M Bancshares, giving effect to the merger of the two institutions.
The following unaudited summary pro forma combined statement of income data for the year ended December 31, 2014 combines data from the historical consolidated statement of income of the Company for the year ended December 31, 2014 and the historical consolidated statement of income of F&M Bancshares for the year ended December 31, 2014, giving effect to the merger as if it had been consummated on January 1, 2014. See “Unaudited Selected Pro Forma Combined Financial Data” beginning on page 95 for information regarding the actual results of the Company and F&M Bancshares, the adjustments thereto and the pro forma results of the combined company for the year ended December 31, 2014.
The following unaudited summary pro forma combined financial data give effect to the merger using the acquisition method of accounting for business combinations as required by accounting principles generally accepted in the United States of America.
The following unaudited summary pro forma combined financial data should be read in conjunction with the audited consolidated financial statements and the notes thereto of each of the Company and F&M Bancshares contained elsewhere in this prospectus.
The following unaudited summary pro forma combined financial data are provided for informational purposes only and are not necessarily indicative of the actual results that might have been achieved for the periods indicated, nor are they necessarily indicative of the future results of the combined company. The unaudited summary pro forma combined financial data are based on estimates and assumptions which are noted on page 97.
In connection with the integration of F&M Bancshares into the Company, the Company has incurred and will incur costs associated with systems implementation, severance and other costs related to exit or disposal activities. The following unaudited summary pro forma combined financial data do not reflect these transaction costs or cost savings expected to be realized from the elimination of certain expenses and from synergies expected to be created or the costs to achieve such cost savings or synergies. Transaction costs not yet incurred or cost savings not yet realized will be recorded when incurred, are non-recurring and are thus not reflected in the calculations of pro forma income.
| For the Year Ended December 31, 2014 | |||||
| (Dollars in thousands, except share and per share data) | |||||
| Summary pro forma combined income statement data: |
|||||
| Interest income |
$ | 79,939 | |||
| Interest expense |
8,275 | ||||
|
|
|
||||
| Net interest income |
71,664 | ||||
| Provision for loan losses |
2,150 | ||||
|
|
|
||||
| Net interest income after provision for loan losses |
69,514 | ||||
| Noninterest income |
3,965 | ||||
| Noninterest expenses |
48,965 | ||||
|
|
|
||||
| Net income before income tax |
24,514 | ||||
| Income tax expense |
8,466 | ||||
|
|
|
||||
| Net income |
$ | 16,048 | |||
|
|
|
||||
| Preferred stock dividends |
(1,049 | ) | |||
|
|
|
||||
| Net income attributable to common stockholders |
$ | 14,999 | |||
|
|
|
||||
14
Table of Contents
| For the Year Ended December 31, 2014 | |||||
| (Dollars in thousands, except share and per share data) | |||||
| Summary pro forma per share data: |
|||||
| Basic earnings per common share |
$ | 1.53 | |||
| Diluted earnings per common share |
1.51 | ||||
See accompanying notes to unaudited selected pro forma combined financial data in “Unaudited Selected Pro Forma Combined Financial Data.”
15
Table of Contents
Investing in our common stock involves a high degree of risk. Before you decide to invest in our common stock, you should carefully consider the risks described below, together with all other information included in this prospectus, including our consolidated financial statements and the related notes included elsewhere in this prospectus. We believe the events described below are the risks that are material to us as of the date of this prospectus. If any of the following risks actually occurs, our business, prospects, financial condition, results of operations and cash flow could be materially and adversely affected. In such an event, the value of our common stock could decline and you could lose all or part of your investment. This prospectus also contains forward-looking statements, estimates and projections that involve risks and uncertainties. Our actual results could differ materially from those anticipated in the forward-looking statements, estimates and projections as a result of specific factors, including the risk factors described below.
Risks Related to Our Business
Our business concentration in Texas, specifically in the Houston metropolitan area, imposes risks and may magnify the consequences of any regional or local economic downturn affecting Houston, including any downturn in the energy or real estate sectors.
We conduct our operations almost exclusively in the Houston metropolitan area. As of June 30, 2015, the substantial majority of the loans in our loan portfolio were made to borrowers who live and/or conduct business in Texas, and specifically, in the Houston metropolitan area, and the substantial majority of our secured loans were secured by collateral located in the Houston metropolitan area. Accordingly, we are significantly exposed to risks associated with a lack of geographic diversification. The economic conditions in the Houston metropolitan area are dependent on the energy sector generally and the price of oil and gas specifically. Any downturn or adverse development in the energy sector or continued low oil or gas prices could have a material adverse impact on our business, financial condition and results of operations, and future prospects. Adverse economic developments, among other things, could negatively affect the volume of loan originations, increase the level of non-performing assets, increase the rate of foreclosure losses on loans and reduce the value of our loans and loan servicing portfolio. The decline in oil prices of nearly 50% during the six months from the end of June 2014 to the end of 2014 and an extended period of low oil prices following those declines has, and is expected to continue to have, a significant negative impact on the overall Texas economy. Any regional or local economic downturn that affects the Houston metropolitan area or Texas, our existing or prospective borrowers or property values in our market area may affect us and our profitability more significantly and more adversely than those of our competitors, whose operations are less geographically focused.
We may not be able to implement aspects of our growth strategy, which may affect our ability to maintain our historical earnings trends.
Our strategy focuses on organic growth, supplemented by acquisitions. We may not be able to execute on aspects of our growth strategy to sustain our historical rate of growth or may not be able to grow at all. More specifically, we may not be able to generate sufficient new loans and deposits within acceptable risk and expense tolerances, obtain the personnel or funding necessary for additional growth or find suitable acquisition candidates. Various factors, such as economic conditions, in particular, the current environment of low oil prices, and competition, may impede or prohibit the growth of our operations, the opening of new branches and the consummation of acquisitions. Further, we may be unable to attract and retain experienced bankers, which could adversely affect our growth. The success of our strategy also depends on our ability to effectively manage growth, which is dependent upon a number of factors, including our ability to adapt our existing credit, operational, technology and governance infrastructure to accommodate expanded operations. If we fail to implement one or more aspects of our strategy, we may be unable to maintain our historical earnings trends, which could adversely affect our business, financial condition and results of operations.
16
Table of Contents
We are dependent on our executive officers and other key individuals to continue the implementation of our long-term business strategy and the loss of one or more of these key individuals could curtail our growth and adversely affect our business, financial condition, results of operations and prospects.
Our continued success is dependent upon the skills, experience and continued service of our executive management team and board of directors. Our goals, strategies and continued growth are closely tied to the banking philosophy and strengths of our executive management team, including our Chairman and Chief Executive Officer, George Martinez, and our President, Steven F. Retzloff. Successful implementation of our business strategy is also dependent in part on the continued service of our branch presidents. The community involvement and diverse and extensive local business relationships and experience in the Houston market of our officers are important to our success. The loss of services of any of these key personnel in the future could have a negative impact on our business because of their skills, years of industry experience and the difficulty of promptly finding qualified replacement personnel who are experienced in the specialized aspects of our business or who have ties to the communities within our market areas. Currently, it is generally our policy not to have employment agreements with our officers. While we do not anticipate any changes in our executive management team as a result of this offering, the unexpected loss of any of these members of management could have a material effect on us and our ability to implement our business strategy.
Our ability to retain bankers and recruit additional successful bankers is critical to the success of our business strategy and any failure to do so could impair our customer relationships and adversely affect our business and results of operations.
Our ability to retain and grow our loans, deposits and fee income depends upon the business generation capabilities, reputation and relationship management skills of our lenders. If we were to lose the services of any of our bankers, including successful bankers employed by banks that we may acquire, to a new or existing competitor or otherwise, we may not be able to retain valuable relationships and some of our customers could choose to use the services of a competitor instead of our services.
Our success and growth strategy also depends on our continued ability to attract and retain experienced loan officers and support staff, as well as other management personnel. We may face difficulties in recruiting and retaining lenders and other personnel of our desired caliber, including as a result of competition from other financial institutions. Competition for loan officers and other personnel is strong and we may not be successful in attracting or retaining the personnel we require. In particular, many of our competitors are significantly larger with greater financial resources, and may be able to offer more attractive compensation packages and broader career opportunities. Additionally, we may incur significant expenses and expend significant time and resources on training, integration and business development before we are able to determine whether a new loan officer will be profitable or effective. If we are unable to attract and retain successful loan officers and other personnel, or if our loan officers and other personnel fail to meet our expectations in terms of customer relationships and profitability, we may be unable to execute our business strategy and our business, financial condition, results of operations and growth prospects may be negatively affected.
A key piece of our strategic growth plan is a focus on decision-making authority at the branch and market level, and our business, financial condition, results of operations and prospects could be negatively affected if our local teams do not follow our internal policies or are negligent in their decision-making.
We attract and retain our management talent by empowering them to make certain business decisions on a local level. Lending authorities are assigned to branch presidents and their banking teams based on their experience. Additionally, all loan relationships in excess of internal specified maximums are reviewed by the Bank’s Executive Loan Committee, comprised of senior management of the Bank, or the Bank’s board of directors, as the case may be. Our local lenders may not follow our internal procedures or otherwise act in our best interests with respect to their decision-making. A failure of our employees to follow our internal policies, or actions taken by our employees that are negligent could have a material adverse effect on our business, financial condition, results of operations and prospects.
17
Table of Contents
The integration of Farmers & Merchants Bancshares, Inc. may be costly and time consuming and we may not realize all of the anticipated benefits of the acquisition of Farmers & Merchants Bancshares, Inc.
We acquired F&M Bancshares and its wholly-owned subsidiary bank, Enterprise Bank, effective January 1, 2015 and are continuing to integrate our businesses. We will need to successfully combine and integrate the business of F&M Bancshares into our existing business in order to fully realize the benefits of this acquisition. The combination and integration of separate businesses is a complex, costly and time-consuming process. As a result, we will be required to devote significant management attention and resources to integrating the business of F&M Bancshares into our existing business, which may divert the attention of our management from day-to-day operations. If the integration of F&M Bancshares into our existing business is not implemented effectively, we may not realize all of the expected benefits of the transaction. If we fail to meet the challenges involved in integrating successfully the business of F&M Bancshares into our existing business or otherwise fail to realize any of the anticipated benefits of the transaction, we could experience an interruption of, or a loss of momentum in, our business activities, which could harm our results of operations. In addition, in integrating F&M Bancshares into our existing business, we may experience unanticipated problems, expenses, liabilities, competitive responses, loss of client relationships, and diversion of management’s attention.
Even if the business of F&M Bancshares is integrated successfully into our business, we may not fully realize the expected benefits of the transaction, including the synergies, cost savings, or growth opportunities. These benefits may not be achieved within the anticipated time frame, or at all. As a result, we cannot assure you that the acquisition of F&M Bancshares will result in the realization of the full benefits anticipated from the transaction.
Even as we continue to integrate our recent acquisition of F&M Bancshares, our strategic growth plan includes pursuing acquisitions, which could expose us to financial, execution and operational risks that could have a material adverse effect on our business, financial condition, results of operations and growth prospects.
With the acquisition of F&M Bancshares on January 1, 2015, we have acquired two financial institutions and we intend to continue to pursue a strategy that includes future acquisitions. An acquisition strategy involves significant risks, including the following:
| • | discovering proper candidates for acquisition; |
| • | incurring time and expense associated with identifying and evaluating potential acquisitions and negotiating potential transactions, resulting in management’s attention being diverted from the operation of our existing business; |
| • | using inaccurate estimates and judgments to evaluate credit, operations, management, compliance and market risks with respect to the target institution or assets; |
| • | conducting adequate due diligence and managing known and unknown risks and uncertainties; |
| • | obtaining necessary regulatory approvals; |
| • | integrating the operations and personnel of the combined businesses, creating an adverse short-term effect on results of operations; |
| • | attracting and retaining qualified management and key personnel, including lenders; |
| • | maintaining asset quality; |
| • | attracting and retaining customers; |
| • | attracting funding to support additional growth within acceptable risk tolerances; and |
| • | maintaining adequate regulatory capital. |
The market for acquisition targets is highly competitive, which may adversely affect our ability to find acquisition candidates that fit our strategy and standards. To the extent that we are unable to find suitable
18
Table of Contents
acquisition targets, an important component of our growth strategy may not be realized. Acquisitions of financial institutions involve operational risks and uncertainties, such as unknown or contingent liabilities with no available manner of recourse, exposure to unexpected problems such as asset quality, the retention of key employees and customers, and other issues that could negatively affect our business. Acquisitions of financial institutions are also subject to regulatory approvals that can be delayed, in some cases, for a lengthy period of time. We may not be able to complete future acquisitions or, if completed, we may not be able to successfully integrate the operations, technology platforms, management, products and services of the entities that we acquire or to realize our attempts to eliminate redundancies. The integration process may also require significant time and attention from our management that would otherwise be directed toward servicing existing business and developing new business. Further, acquisitions typically involve the payment of a premium over book and market values and, therefore, some dilution of our tangible book value and net income per common share may occur in connection with any future acquisition, and the goodwill that we currently maintain or may recognize in connection with future transactions may be subject to impairment in future periods.
Challenging market conditions and economic trends have adversely affected the banking industry and could adversely affect our business, financial condition and results of operations.
We are a business operating in the challenging and uncertain financial services environment. The success of our business and operations is sensitive to general business and economic conditions in the U.S. and locally in our industry and market. If the U.S. economy weakens and a lack of growth in population, income levels, deposits and business investment in our local markets occurs, our growth and profitability from our lending, deposit and asset management services could be constrained. Although economic conditions have improved in recent years, financial institutions continue to be affected by volatility in the real estate market in some parts of the country and uncertain regulatory and interest rate conditions. We retain direct exposure to the residential and commercial real estate market in Texas, particularly in the Houston metropolitan area, and are affected by these events.
Uncertain market and economic conditions can make our ability to assess the creditworthiness of customers and estimate the losses in our loan portfolio more complex. Another national economic recession or continued deterioration of conditions in our market could drive losses beyond that which is provided for in our allowance for loan losses and result in the following consequences, any of which could have a material adverse effect on our business:
| • | loan delinquencies may rise; |
| • | nonperforming assets and foreclosures may increase; |
| • | demand for our products and services may decline; and |
| • | collateral securing our loans, especially real estate, may decline in value, which could reduce customers’ borrowing power and repayment ability. |
The current environment of low oil prices could have an adverse impact on economic conditions in the U.S. generally and specifically, in the Houston metropolitan area. Declines in real estate values, volume of home sales and financial stress on borrowers as a result of the current environment of low oil prices, including job losses, could have an adverse effect on our borrowers or their customers, which could adversely affect our business, financial condition and results of operations.
The small to medium-sized businesses that we lend to may have fewer resources to weather adverse business developments, which may impair a borrower’s ability to repay a loan, and such impairment could adversely affect our results of operations and financial condition.
We focus our business development and marketing strategy primarily on small to medium-sized businesses which we define as commercial borrowing relationships at Allegiance of less than $5 million of exposure. We had loans totaling approximately $1.12 billion to small to medium-sized businesses, or 72.0%, of our total loans,
19
Table of Contents
as of June 30, 2015 and $749.6 million, or 74.8%, of our total loans as of December 31, 2014. Small to medium-sized businesses frequently have smaller market shares than their competition, may be more vulnerable to economic downturns, often need substantial additional capital to expand or compete and may experience substantial volatility in operating results, any of which may impair a borrower’s ability to repay a loan. In addition, the success of a small and medium-sized business often depends on the management skills, talents and efforts of one or two people or a small group of people, and the death, disability or resignation of one or more of these people could have a material adverse impact on the business and its ability to repay its loan. If general economic conditions negatively impact the Houston metropolitan area or Texas and small to medium-sized businesses are adversely affected, or our borrowers are otherwise affected by adverse business developments, our business, financial condition and results of operations may be negatively affected.
If our allowance for loan losses is not sufficient to cover actual loan losses, our earnings may be affected.
The allowance for loan losses is a valuation allowance for probable incurred loan losses. We establish our allowance for loan losses and maintain it at a level considered adequate by management to absorb probable incurred loan losses in our loan portfolio. The allowance for loan losses represents our estimate of probable losses in the portfolio at each balance sheet date and is based upon relevant information available to us, such as, past loan loss experience, the nature and volume of the portfolio, information about specific borrower situations and estimated collateral values, economic conditions and other factors. Loan losses are charged against the allowance when management believes the uncollectibility of a loan balance is confirmed. Subsequent recoveries, if any, are credited back to the allowance. Our allowance for loan losses consists of a general component based upon probable incurred but unidentified losses in the portfolio and a specific component based on individual loans that are considered impaired. In determining the collectability of certain loans, management also considers the fair value of any underlying collateral. The amount ultimately realized may differ from the carrying value of these assets because of economic, operating or other conditions beyond our control, and any such differences may be material.
As of June 30, 2015, our allowance for loan losses was $10.3 million, which represents 0.66% of our total loans and 180.22% of our total nonperforming loans. As of December 31, 2014, our allowance for loan losses was $8.2 million, which represented 0.82% of our total loans and 258.98% of our total nonperforming loans as of the same date. Additional loan losses will likely occur in the future and may occur at a rate greater than we have previously experienced. We may be required to take additional provisions for loan losses in the future to further supplement the allowance for loan losses, either due to management’s decision to do so or requirements by our banking regulators. In addition, federal and state bank regulatory agencies periodically review our allowance for loan losses and the value attributed to nonaccrual loans or to real estate acquired through foreclosure. Such regulatory agencies may require us to recognize future charge-offs. These adjustments may adversely affect our business, financial condition and results of operations.
The acquisition method of accounting requires that acquired loans are initially recorded at fair value at the time of acquisition, which includes an estimate of loan losses expected to be realized over the remaining lives of the loans, and therefore no corresponding allowance for loan losses is recorded for these loans at acquisition because credit quality, among other elements, was considered in the determination of fair value. To the extent that our estimates of fair value are too high, we will incur losses associated with the acquired loans.
As a significant percentage of our loan portfolio is comprised of real estate loans, an adverse change in the economic conditions of the real estate market where we operate could affect real estate values and may result in losses to our business.
As of June 30, 2015, $1.11 billion, or 70.9%, of our total loans, were comprised of loans with real estate as a primary or secondary component of collateral. The real estate collateral provides an alternate source of repayment in the event of default by the borrower and may deteriorate in value over the term of the loan, limiting our ability to realize the full value of the collateral anticipated at the time of the originating loan. A weakening of the real estate market in our primary market area could have an adverse effect on the demand for new loans, the ability of borrowers to repay
20
Table of Contents
outstanding loans, the value of real estate and other collateral securing the loans and the value of our business. Collateral may have to be sold for less than the outstanding balance of the loan, which could result in losses on such loans. Such declines and losses in real estate values may cause us to experience increases in provisions for loan losses, and charge-offs, which could adversely affect our profitability. While it is still too early to tell whether the decline in oil and gas prices through the end of 2014 and a prolonged period of lower oil and gas prices will have a material adverse effect on the Houston real estate market, preliminary indications suggest the market, although at a slower rate, continues to grow.
Our commercial real estate and construction, land development and other land loan portfolios expose us to credit risks that may be greater than the risks related to other types of loans.
As of June 30, 2015, $691.8 million, or 44.3%, of our total loans, was comprised of commercial real estate loans (including owner-occupied commercial real estate loans) and $140.4 million, or 9.0%, of our total loans, was comprised of construction, land development and other land loans. Commercial real estate loans generally involve relatively large balances to single borrowers or related groups of borrowers. These loans typically involve repayment dependent upon income generated, or expected to be generated, by the property securing the loan in amounts sufficient to cover operating expenses and debt service. The availability of such income for repayment may be adversely affected by changes in the economy or local market conditions. These loans expose a lender to greater credit risk than loans secured by other types of collateral because the collateral securing these loans is typically more difficult to liquidate due to the fluctuation of real estate values. Unexpected deterioration in the credit quality of our commercial real estate loan portfolio could require us to increase our allowance for loan losses, which would reduce our profitability and may have a material adverse effect on our business, financial condition and results of operations.
Real estate construction, land development and other land loans involve risks attributable to the fact that loan funds are secured by a project under construction, and the project is of uncertain value prior to its completion. These risks include: the viability of the contractor; the value of the project being subject to successful completion; the contractor’s ability to complete the project, to meet deadlines and time schedules and to stay within our estimates; and concentration of such loans with a single contractor and its affiliates. Real estate construction lending often involves the disbursement of substantial funds with repayment dependent, in part, on the success of the ultimate project rather than the ability of a borrower or guarantor to repay the loan and also present risks of default in the event of declines in property values or volatility in the real estate market during the construction phase. If we are forced to foreclose on a project prior to completion, we may be unable to recover the entire unpaid portion of the loan. In addition, we may be required to fund additional amounts to complete a project and may have to hold the property for an indeterminate period of time, any of which could adversely affect our business, financial condition and results of operations.
A large portion of our loan portfolio is comprised of commercial and industrial loans secured by receivables, inventory, equipment or other commercial collateral, the deterioration in value of which could increase the potential for future losses.
As of June 30, 2015, $437.2 million, or 28.0%, of our total loans, was comprised of commercial and industrial loans to businesses that are typically based on the borrowers’ ability to repay the loans from the cash flow of their businesses. These loans may involve greater risk because the availability of funds to repay each loan depends substantially on the success of the business itself as these loans are typically larger in amount and, therefore, have the potential for larger losses on a single loan basis. Commercial and industrial loans are collateralized by general business assets including, among other things, accounts receivable, inventory and equipment and generally backed by a personal guaranty of the borrower or principal. This collateral may decline in value more rapidly than we anticipate exposing us to increased credit risk. Significant adverse changes in the economy or local market conditions in which our commercial lending customers operate could cause rapid declines in loan collectability and the values associated with general business assets resulting in inadequate collateral coverage that may expose us to credit losses and could adversely affect our business, financial condition and results of operations.
21
Table of Contents
A lack of liquidity could adversely affect our operations and jeopardize our business, financial condition, and results of operations.
Liquidity is essential to our business. We rely on our ability to generate deposits and effectively manage the repayment and maturity schedules of our loans and investment securities, respectively, to ensure that we have adequate liquidity to fund our operations. An inability to raise funds through deposits, borrowings, the sale of our investment securities, the sale of loans, and other sources could have a substantial negative effect on our liquidity. Our most important source of funds is deposits. Deposit balances can decrease when customers perceive alternative investments as providing a better risk/return tradeoff. If customers move money out of bank deposits and into other investments such as money market funds, we would lose a relatively low-cost source of funds, increasing our funding costs and reducing our net interest income and net income.
Other primary sources of funds consist of cash flows from operations, maturities and sales of investment securities, and proceeds from the issuance and sale of our equity and debt securities to investors. Additional liquidity is provided by the ability to borrow from the Federal Reserve Bank of Dallas and the Federal Home Loan Bank (the “FHLB”) and our ability to raise brokered deposits. We also may borrow funds from third-party lenders, such as other financial institutions. Our access to funding sources in amounts adequate to finance or capitalize our activities, or on terms that are acceptable to us, could be impaired by factors that affect us directly or the financial services industry or economy in general, such as disruptions in the financial markets or negative views and expectations about the prospects for the financial services industry. Our access to funding sources could also be affected by a decrease in the level of our business activity as a result of a downturn in the Houston metropolitan area economy or by one or more adverse regulatory actions against us.
As of June 30, 2015, $519.6 million, or 32.0%, of our deposits consisted of interest-bearing demand deposits and money market and savings accounts. Based on our experience, we believe that our deposit accounts are relatively stable sources of funds. If we increase interest rates paid to retain deposits, our earnings may be adversely affected, which could have an adverse effect on our business, financial condition and results of operations.
Any decline in available funding could adversely impact our ability to originate loans, invest in securities, meet our expenses, or to fulfill obligations such as repaying our borrowings or meeting deposit withdrawal demands, any of which could have a material adverse impact on our liquidity, business, financial condition and results of operations.
If we fail to maintain sufficient capital, whether due to losses, an inability to raise additional capital or otherwise, our financial condition, liquidity and results of operations, as well as our ability to maintain regulatory compliance, could be adversely affected.
We, on a consolidated basis, and the Bank, on a stand-alone basis, must meet certain regulatory capital requirements and maintain sufficient liquidity. Importantly, regulatory capital requirements could increase from current levels, which could require us to raise additional capital or reduce our operations. Our ability to raise additional capital depends on conditions in the capital markets, economic conditions and a number of other factors, including investor perceptions regarding the banking industry, market conditions and governmental activities, and on our financial condition and performance. Accordingly, we cannot assure you that we will be able to raise additional capital if needed or on terms acceptable to us. If we fail to maintain capital to meet regulatory requirements, our liquidity, business, financial condition and results of operations could be materially and adversely affected.
Fluctuations in interest rates may adversely impact our earnings and capital levels and overall results of operations.
Like most financial institutions, our earnings and cash flows depend to a great extent upon the level of our net interest income, or the difference between the interest income we earn on loans, investments and other interest-earning assets, and the interest expense we pay on deposits, borrowings and other interest-bearing
22
Table of Contents
liabilities. Therefore, any change in general market interest rates, such as a change in the monetary policy of the Federal Reserve or otherwise, can have a significant effect on our net interest income. The majority of our banking assets are monetary in nature and subject to risk from changes in interest rates. Changes in interest rates can increase or decrease our net interest income, because different types of assets and liabilities may react differently, and at different times, to market interest rate changes. When interest-bearing liabilities mature or reprice more quickly, or to a greater degree than interest-earning assets in a period, an increase in interest rates could reduce net interest income. Similarly, when interest-earning assets mature or reprice more quickly, or to a greater degree than interest-bearing liabilities, falling interest rates could reduce net interest income.
Additionally, an increase in interest rates may, among other things, adversely affect the demand for loans and our ability to originate loans and decrease loan repayment rates. Conversely, a decrease in the general level of interest rates may affect us through, among other things, increased prepayments on our loan and mortgage-backed securities portfolio and increased competition for deposits. Accordingly, changes in the general level of market interest rates may adversely affect our net yield on interest-earning assets, loan origination volume, loan portfolio and our overall results.
Although our asset-liability management strategy is designed to control and mitigate exposure to the risks related to changes in market interest rates, those rates are affected by many factors outside of our control, including various governmental and regulatory monetary policies, inflation, recession, changes in unemployment, the money supply, international disorder and instability in domestic and foreign financial markets. Adverse changes in the Federal Reserve interest rate policies or other changes in monetary policies and economic conditions could materially and adversely affect us. We may not be able to accurately predict the likelihood, nature and magnitude of those changes or how and to what extent they may affect our business. We also may not be able to adequately prepare for or compensate for the consequences of such changes. Any failure to predict and prepare for changes in interest rates or adjust for the consequences of these changes may adversely affect our earnings and capital levels and overall results.
We could recognize losses on securities held in our securities portfolio, particularly if interest rates increase or economic and market conditions deteriorate.
We invest in available for sale securities with the primary objectives of providing a source of liquidity, providing an appropriate return on funds invested, managing interest rate risk, meeting pledging requirements and meeting regulatory capital requirements. As of June 30, 2015, the book value of our securities portfolio was $151.8 million, which represented 7.8% of total assets. Factors beyond our control can significantly influence the fair value of securities in our portfolio and can cause potential adverse changes to the fair value of these securities. For example, fixed-rate securities are generally subject to decreases in market value when interest rates rise. Additional factors include, but are not limited to, rating agency downgrades of the securities, defaults by the issuer or individual borrowers with respect to the underlying securities, and continued instability in the credit markets. Any of the foregoing factors could cause other-than-temporary impairment in future periods and result in realized losses. The process for determining whether impairment is other-than-temporary usually requires difficult, subjective judgments about the future financial performance of the issuer and any collateral underlying the security in order to assess the probability of receiving all contractual principal and interest payments on the security. Factors beyond our control can significantly influence the fair value of securities in our portfolio and can cause potential adverse changes to the fair value of these securities. Because of changing economic and market conditions affecting interest rates, the financial condition of issuers of the securities and the performance of the underlying collateral, we may recognize realized and/or unrealized losses in future periods, which could have an adverse effect on our business, financial condition and results of operations.
23
Table of Contents
We face strong competition to attract and retain customers from other companies that offer banking services, which could impact our business by preventing us from obtaining customers and adversely affecting our growth and profitability.
We conduct our operations almost exclusively in the Houston metropolitan area. Many of our competitors offer the same, or a wider variety of, banking services within our market area. These competitors include banks with nationwide operations, regional banks and other community banks. We also face competition from many other types of financial institutions, including savings banks, credit unions, finance companies, mutual funds, insurance companies, brokerage and investment banking firms, asset-based non-bank lenders and certain other non-financial entities, such as retail stores which may maintain their own credit programs and certain governmental organizations which may offer more favorable financing or deposit terms than we can. In addition, a number of out-of-state financial intermediaries have opened production offices, or otherwise solicit deposits, in our market area. Increased competition in our market may result in reduced loans and deposits, as well as reduced net interest margin, fee income and profitability. Ultimately, we may not be able to compete successfully against current and future competitors. If we are unable to attract and retain banking customers, we may be unable to continue to grow our loan and deposit portfolios, and our business, financial condition and results of operations could be adversely affected.
Our ability to compete successfully depends on a number of factors, including, among other things:
| • | the ability to develop, maintain and build long-term customer relationships based on top quality service, high ethical standards and safe, sound assets; |
| • | the scope, relevance and pricing of products and services offered to meet customer needs and demands; |
| • | the rate at which we introduce new products and services relative to our competitors; |
| • | customer satisfaction with our level of service; |
| • | the ability to expand our market position; and |
| • | industry and general economic trends. |
Failure to perform in any of these areas could significantly weaken our competitive position, which could adversely affect our growth and profitability, which, in turn, could adversely affect our business, financial condition and results of operations.
We also face competition for acquisition opportunities in connection with the implementation of our acquisition strategy. Because there are a limited number of acquisition opportunities in our target market, we face competition from other banks and financial institutions, many of which possess greater financial, human, technical and other resources than we do. Our ability to compete in acquiring target institutions will depend on our available financial resources to fund the acquisitions, including the amount of cash and cash equivalents we have and the liquidity and market price of our common stock. In addition, increased competition may also drive up the acquisition consideration that we will be required to pay in order to successfully capitalize on attractive acquisition opportunities.
Negative public opinion regarding our company or failure to maintain our reputation in the community we serve could adversely affect our business and prevent us from growing our business.
As a community bank, our reputation within the community we serve is critical to our success. We have set ourselves apart from our competitors by building strong personal and professional relationships with our customers and being active members of the communities we serve. As such, we strive to enhance our reputation by recruiting, hiring and retaining employees who share our core values of being an integral part of the communities we serve and delivering superior service to our customers. If our reputation is negatively affected by the actions of our employees or otherwise, we may be less successful in attracting new customers, and our business, financial condition, results of operations and prospects could be materially and adversely affected.
24
Table of Contents
Further, negative public opinion can expose us to litigation and regulatory action as we seek to implement our growth strategy. While we actively work to minimize reputation risk in dealing with our customers, this risk will always be present given the nature of our business.
If we fail to maintain an effective system of disclosure controls and procedures and internal controls over financial reporting, we may not be able to accurately report our financial results or prevent fraud.
Ensuring that we have adequate disclosure controls and procedures, including internal controls over financial reporting, in place so that we can produce accurate financial statements on a timely basis is costly and time-consuming and needs to be re-evaluated frequently. Our management is responsible for establishing and maintaining adequate internal control over financial reporting and for evaluating and reporting on our system of internal control. Our internal control over financial reporting is a process designed to provide reasonable assurance regarding the reliability of financial reporting and the preparation of financial statement for external purposes in accordance with Generally Accepted Accounting Principles (“GAAP”). We are in the process of documenting, reviewing and, if appropriate, improving our internal controls and procedures in anticipation of being a public company and being subject to the requirements of Section 404 of the Sarbanes-Oxley Act of 2002 (the “Sarbanes-Oxley Act”), which will require annual management assessments of the effectiveness of our internal controls over financial reporting and, when we cease to be an emerging growth company under the JOBS Act, a report by our independent auditors addressing our internal controls over financial reporting. Our management may conclude that our internal controls over financial reporting are not effective due to our failure to cure any identified material weakness or otherwise. Moreover, even if our management concludes that our internal controls over financial reporting are effective, our independent registered public accounting firm may not conclude that our internal controls over financial reporting are effective. In the course of their review, our independent registered public accounting firm may not be satisfied with our internal controls over financial reporting or the level at which our controls are documented, designed, operated or reviewed, or it may interpret the relevant requirements differently from us. In addition, during the course of the evaluation, documentation and testing of our internal controls over financial reporting, we may identify deficiencies that we may not be able to remediate in time to meet the deadline imposed by the Securities and Exchange Commission (the “SEC”) for compliance with the requirements of Section 404 of the Sarbanes-Oxley Act. Any such deficiencies may also subject us to adverse regulatory consequences. If we fail to achieve and maintain the adequacy of our internal controls over financial reporting, as these standards are modified, supplemented or amended from time to time, we may be unable to report our financial information on a timely basis, we may not be able to conclude on an ongoing basis that we have effective internal controls over financial reporting in accordance with the Sarbanes-Oxley Act, and we may suffer adverse regulatory consequences or violations of listing standards. There could also be a negative reaction in the financial markets due to a loss of investor confidence in the reliability of our financial statements.
We are subject to certain operational risks, including, but not limited to, customer or employee fraud and data processing system failures and errors.
We are exposed to many types of operational risk, including the risk of fraud by employees and outsiders, clerical recordkeeping errors and transactional errors. Our business is dependent on our employees as well as third-party service providers to process a large number of increasingly complex transactions. We could be materially adversely affected if one of our employees causes a significant operational breakdown or failure, either as a result of human error or where an individual purposefully sabotages or fraudulently manipulates our operations or systems or if one of our third-party service providers experiences an operational breakdown or failure. Employee errors and employee or customer misconduct could subject us to financial losses or regulatory sanctions and seriously harm our reputation. Misconduct by our employees could include hiding unauthorized activities from us, improper or unauthorized activities on behalf of our customers or improper use of confidential information. It is not always possible to prevent employee errors and misconduct, and the precautions we take to prevent and detect this activity may not be effective in all cases. Employee errors could also subject us to financial claims for negligence.
25
Table of Contents
We maintain a system of internal controls to mitigate against operational risks, including data processing system failures and errors and customer or employee fraud, as well as insurance coverage designed to protect us from material losses associated with these risks including losses resulting from any associated business interruption. However, if our internal controls fail to prevent or detect an occurrence, or if any resulting loss is not insured or exceeds applicable insurance limits, it could have a material adverse effect on our business, financial condition and results of operations.
In addition, when we originate loans, we rely upon information supplied by loan applicants and third parties, including the information contained in the loan application, property appraisal and title information, if applicable, and employment and income documentation provided by third parties. If any of this information is misrepresented and such misrepresentation is not detected prior to loan funding, we generally bear the risk of loss associated with the misrepresentation. Any of these occurrences could result in a diminished ability of us to operate our business, potential liability to customers, reputational damage and regulatory intervention, which could negatively impact our business, financial condition and results of operations.
We have a continuing need for technological change, and we may not have the resources to effectively implement new technology, or we may experience operational challenges when implementing new technology.
The financial services industry is changing rapidly, and to remain competitive, we must continue to enhance and improve the functionality and features of our products, services and technologies. In addition to better serving customers, the effective use of technology increases efficiency and enables financial institutions to reduce costs. Our future success will depend, at least in part, upon our ability to respond to future technological changes and the ability to address the needs of our customers by using technology to provide products and services that will satisfy customer demands for convenience as well as to create additional efficiencies in our operations as we continue to grow and expand our products and service offerings. We may experience operational challenges as we implement these new technology enhancements or products, which could result in us not fully realizing the anticipated benefits from such new technology or require us to incur significant costs to remedy any such challenges in a timely manner.
These changes may be more difficult or expensive than we anticipate. Many of our larger competitors have substantially greater resources to invest in technological improvements. As a result, they may be able to offer additional or superior products to those that we will be able to provide, which would put us at a competitive disadvantage. Accordingly, we may not be able to effectively implement new technology driven products and services or be successful in marketing such products and services to our customers.
Our operations could be interrupted if our third-party service providers experience difficulty, terminate their services or fail to comply with banking regulations.
We depend on a number of relationships with third-party service providers. Specifically, we receive certain third-party services including, but not limited to, core systems processing, essential web hosting and other Internet systems, our online banking services, deposit processing and other processing services. If these third-party service providers experience difficulties, or terminate their services, and we are unable to replace them with other service providers, particularly on a timely basis, our operations could be interrupted. If an interruption were to continue for a significant period of time, our business, financial condition and results of operations could be adversely affected, perhaps materially. Even if we are able to replace third party service providers, it may be at a higher cost to us, which could adversely affect our business, financial condition and results of operations.
System failure or breaches of our cyber security measures could subject us to increased operating costs as well as litigation and other liabilities.
The computer systems and network infrastructure we use, including the systems and infrastructure of our third-party service providers, could be vulnerable to unforeseen problems. Our operations are dependent upon our ability to protect our computer equipment, and the information stored therein, against damage from physical
26
Table of Contents
theft, fire, power loss, telecommunications failure or a similar catastrophic event, as well as from security breaches, denial of service attacks, viruses, worms and other disruptive problems caused by hackers. Any damage or failure that causes breakdowns or disruptions in our general ledger, deposit, loan and other systems could damage our reputation, result in a loss of customer business, subject us to additional regulatory scrutiny, including enforcement action that could restrict our operations, or expose us to civil litigation and possible financial liability, any of which could have a material adverse effect on us. Computer break-ins, phishing and other disruptions could also jeopardize the security of information stored in and transmitted through our computer systems and network infrastructure, which may result in significant liability and reputational harm to us and may cause existing and potential customers to refrain from doing business with us. In addition, advances in computer capabilities could result in a compromise or breach of the systems we and our third-party service providers use to encrypt and protect customer transaction data. A failure of such security measures could have a material adverse effect on our business, financial condition and results of operations.
If the goodwill that we have recorded in connection with a business acquisition becomes impaired, it could require charges to earnings, which would have a negative impact on our financial condition and results of operations.
Goodwill represents the amount by which the cost of an acquisition exceeded the fair value of net assets we acquired in connection with the purchase of another financial institution. We review goodwill for impairment at least annually, or more frequently if a triggering event occurs which indicates that the carrying value of the asset might be impaired.
We determine impairment by comparing the implied fair value of the reporting unit goodwill with the carrying amount of that goodwill. If the carrying amount of the reporting unit goodwill exceeds the implied fair value of that goodwill, an impairment loss is recognized in an amount equal to that excess. Any such adjustments are reflected in our results of operations in the periods in which they become known. As of June 30, 2015, our goodwill totaled $39.4 million. While we have not recorded any impairment charges since we initially recorded the goodwill, our future evaluations of goodwill may result in findings of impairment and related write-downs, which may have a material adverse effect on our financial condition and results of operations.
We may be subject to environmental liabilities and associated costs in connection with the foreclosure on real estate assets securing our loan portfolio, which could adversely affect us.
A significant portion of our loan portfolio is comprised of loans collateralized by real estate. There is a risk that hazardous or toxic waste could be discovered on the properties that secure our loans. If we acquire such properties as a result of foreclosure, we could be held responsible for the cost of cleaning up or removing this waste, and this cost could exceed the value of the underlying properties and materially and adversely affect us. Although we have not historically and do not currently hold a material amount of real property in our loan portfolio that presents a potential for such environmental risks, we do lend to borrowers in segments of the economy that may expose us to heightened environmental risk if we were forced to foreclose on a material amount of real property securing such loans.
Risks Related to Our Industry and Regulation
Our business, financial condition, results of operations and future prospects could be adversely affected by the highly regulated environment and the laws and regulations that govern our operations, corporate governance, executive compensation and accounting principles, or changes in any of them.
As a bank holding company, we are subject to extensive examination, supervision and comprehensive regulation by various federal and state agencies that govern almost all aspects of our operations. These laws and regulations are not intended to protect our shareholders. Rather, these laws and regulations are intended to protect customers, depositors, the Deposit Insurance Fund (the “DIF”) and the overall financial stability of the U.S. These laws and regulations, among other matters, prescribe minimum capital requirements, impose limitations on the business activities in which we can engage, limit the dividend or distributions that the Bank can pay to us,
27
Table of Contents
restrict the ability of institutions to guarantee our debt, and impose certain specific accounting requirements on us that may be more restrictive and may result in greater or earlier charges to earnings or reductions in our capital than generally accepted accounting principles would require. Compliance with these laws and regulations is difficult and costly, and changes to these laws and regulations often impose additional compliance costs. Our failure to comply with these laws and regulations, even if the failure follows good faith effort or reflects a difference in interpretation, could subject us to restrictions on our business activities, fines and other penalties, any of which could adversely affect our results of operations, capital base and the price of our securities. Further, any new laws, rules and regulations could make compliance more difficult or expensive.
The Dodd-Frank Wall Street Reform and Consumer Protection Act of 2010 may have a material adverse effect on our operations.
Recent economic conditions, particularly in the financial markets, have resulted in government regulatory agencies and political bodies placing increased focus and scrutiny on the financial services industry. The Dodd-Frank Wall Street Reform and Consumer Protection Act (“Dodd-Frank Act”) significantly changed the regulation of financial institutions and the financial services industry. The Dodd-Frank Act and the regulations thereunder affect both large and small financial institutions, including several provisions that will affect how community banks, thrifts and small bank and thrift holding companies will be regulated in the future. On July 21, 2010, the Dodd-Frank Act was signed into law, and the process of implementation is ongoing. There remains significant uncertainty surrounding the manner in which the provisions of the Dodd-Frank Act will ultimately be implemented by the various regulatory agencies and the full extent of the impact of the requirements on our operations is unclear. The changes resulting from the Dodd-Frank Act may impact the profitability of our business activities, require changes to certain of our business practices, require the development of new compliance infrastructure, impose upon us more stringent capital, liquidity and leverage requirements or otherwise adversely affect our business. These changes may also require us to invest significant management attention and resources to evaluate and make any changes necessary to comply with new statutory and regulatory requirements. Failure to comply with the new requirements or with any future changes in laws or regulations may negatively impact our business, financial condition and results of operations.
Our management is reviewing the provisions of the Dodd-Frank Act, many of which are to be phased-in over the next several months and years, and assessing its probable impact on our operations. However, the ultimate effect of the Dodd-Frank Act on the financial services industry in general, and us in particular, is uncertain at this time.
New capital rules that were recently issued generally require insured depository institutions and their holding companies to hold more capital. The impact of the new rules on our financial condition and operations is uncertain but could be materially adverse.
The Dodd-Frank Act requires the federal banking agencies to establish stricter risk-based capital requirements and leverage limits to apply to banks and bank and savings and loan holding companies. In July 2013, the federal banking agencies published the final Basel III Capital Rules (as defined in “Regulation and Supervision—Regulatory Capital Requirements and Capital Adequacy—US Implementation of Basel III”) that revised their risk-based and leverage capital requirements and their method for calculating risk-weighted assets. The Basel III Capital Rules will apply to banking organizations, including us and the Bank. As a result of the enactment of the Basel III Capital Rules, we and the Bank will become subject to increased required capital levels. The Basel III Capital Rules became effective as applied to us and the Bank on January 1, 2015 with a phase-in period that generally extends through January 1, 2019.
The final rules increase capital requirements and generally include two new capital measurements that will affect us, a risk-based common equity Tier 1 ratio and a capital conservation buffer. Common Equity Tier 1 (“CET1”) capital is a subset of Tier 1 capital and is limited to common equity (plus related surplus), retained earnings, accumulated other comprehensive income and certain other items. Other instruments that have historically qualified for Tier 1 treatment, including non-cumulative perpetual preferred stock, are consigned to a
28
Table of Contents
category known as Additional Tier 1 capital and must be phased out over a period of nine years beginning in 2014. The rules permit bank holding companies with less than $15 billion in assets (such as us) to continue to include trust preferred securities and non-cumulative perpetual preferred stock issued before May 19, 2010 in Tier 1 capital, but not CET1. Tier 2 capital consists of instruments that have historically been placed in Tier 2, as well as cumulative perpetual preferred stock.
The final rules adjust all three categories of capital by requiring new deductions from and adjustments to capital that will result in more stringent capital requirements and may require changes in the ways we do business. Beginning January 1, 2015, our minimum capital requirements are (1) a CET1 ratio of 4.5%, (2) a Tier 1 capital (CET1 plus Additional Tier 1 capital) of 6.0% (up from 4.0%) and (3) a total capital ratio of 8% (the current requirement). Our leverage ratio requirement will remain at the 4.0% level now required. Beginning in 2016, a capital conservation buffer will phase in over three years, ultimately resulting in a requirement of 2.5% on top of the CET1, Tier 1 and total capital requirements, resulting in a required CET1 ratio of 7.0%, a Tier 1 ratio of 8.5%, and a total capital ratio of 10.5%. Failure to satisfy any of these three capital requirements will result in limits on paying dividends, engaging in share repurchases and paying discretionary bonuses. These limitations will establish a maximum percentage of eligible retained income that could be utilized for such actions. While the final rules will result in higher regulatory capital standards, it is difficult at this time to predict when or how any new standards will ultimately be applied to us.
In addition to the higher required capital ratios and the new deductions and adjustments, the final rules increase the risk weights for certain assets, meaning that we will have to hold more capital against these assets. For example, commercial real estate loans that do not meet certain new underwriting requirements now must be risk-weighted at 150%, rather than the previous 100%. There are also new risk weights for unsettled transactions and derivatives. We also will be required to hold capital against short-term commitments that are not unconditionally cancelable; currently, there are no capital requirements for these off-balance sheet assets. All changes to the risk weights take effect in full in 2015. Implementation of changes to asset risk weightings for risk-based capital calculations, items included or deducted in calculating regulatory capital or additional capital conservation buffers, could result in management modifying our business strategy and could limit our ability to make distributions, including paying dividends or buying back our shares.
State and federal banking agencies periodically conduct examinations of our business, including compliance with laws and regulations, and our failure to comply with any supervisory actions to which we are or become subject as a result of such examinations may adversely affect us.
Texas and federal banking agencies, including the Texas Department of Banking (the “TDB”) and the Federal Reserve, periodically conduct examinations of our business, including compliance with laws and regulations. If, as a result of an examination, a Texas or federal banking agency were to determine that the financial condition, capital resources, asset quality, earnings prospects, management, liquidity or other aspects of any of our operations had become unsatisfactory, or that we, the Bank or our respective management were in violation of any law or regulation, it may take a number of different remedial actions as it deems appropriate. These actions include the power to enjoin “unsafe or unsound” practices, to require affirmative actions to correct any conditions resulting from any violation or practice, to issue an administrative order that can be judicially enforced, to direct an increase in our and/or the Bank’s capital, to restrict our growth, to assess civil monetary penalties against us, the Bank or our respective officers or directors, to remove officers and directors and, if it is concluded that such conditions cannot be corrected or there is an imminent risk of loss to depositors, to terminate the Bank’s deposit insurance. If we become subject to such regulatory actions, our business, financial condition, results of operations, cash flows and reputation may be negatively impacted.
We may be unable to identify and consummate our new activities and expansion plans and successfully implement our growth strategy, which will require regulatory approvals, and failure to obtain them may restrict our growth.
We intend to continue to grow our business through strategic acquisitions of financial institutions coupled with organic growth. Generally, we must receive state and federal regulatory approval before we can acquire an
29
Table of Contents
FDIC-insured depository institution or related business. In determining whether to approve a proposed acquisition, federal banking regulators will consider, among other factors, the effect of the acquisition on competition, our financial condition, liquidity, our future prospects, and the impact of the proposal on U.S. financial stability. The regulators also review current and projected capital ratios and levels, the competence, experience and integrity of management and its record of compliance with laws and regulations, the convenience and needs of the communities to be served (including the acquiring institution’s record of compliance under the Community Reinvestment Act) and the effectiveness of the acquiring institution in combating money laundering activities. Such regulatory approvals may not be granted on terms that are acceptable to us, or at all, or may be granted only after lengthy delay. We may also be required to sell branches as a condition to receiving regulatory approval, which condition may not be acceptable to us or, if acceptable to us, may reduce the benefit of any acquisition.
In addition to the acquisition of existing financial institutions, as opportunities arise, we plan to continue de novo branching as a part of our organic growth strategy. De novo branching and any acquisitions carry with them numerous risks, including the inability to obtain all required regulatory approvals. The failure to obtain these regulatory approvals for potential future strategic acquisitions and de novo branches may impact our business plans and restrict our growth.
We face a risk of noncompliance and enforcement action with the Bank Secrecy Act and other anti-money laundering statutes and regulations.
The federal Bank Secrecy Act, the Uniting and Strengthening America by Providing Appropriate Tools Required to Intercept and Obstruct Terrorism Act of 2001 and other laws and regulations require financial institutions, among other duties, to institute and maintain an effective anti-money laundering program and file suspicious activity and currency transaction reports as appropriate. The federal Financial Crimes Enforcement Network, established by the U.S. Department of the Treasury (“Treasury Department”) to administer the Bank Secrecy Act, is authorized to impose significant civil money penalties for violations of those requirements, and has recently engaged in coordinated enforcement efforts with the individual federal banking regulators, as well as the U.S. Department of Justice (the “Department of Justice”), Drug Enforcement Administration, and Internal Revenue Service. There is also increased scrutiny of compliance with the sanctions programs and rules administered and enforced by the Treasury Department’s Office of Foreign Assets Control.
We provide banking services to customers located outside the United States, primarily in Guatemala. These banking services are primarily deposit accounts, including checking, money market and short term certificates of deposit. As of June 30, 2015, our deposits from foreign nationals, primarily residents in Guatemala, accounted for less than 6.0% of our total deposits.
In order to comply with regulations, guidelines and examination procedures in this area, we have dedicated significant resources to our anti-money laundering program. If our policies, procedures and systems are deemed deficient, we could be subject to liability, including fines and regulatory actions such as restrictions on our ability to pay dividends and the necessity to obtain regulatory approvals to proceed with certain aspects of our business plans, including acquisitions and de novo branching. Failure to maintain and implement adequate programs to combat money laundering and terrorist financing could also have serious reputational consequences for us.
We are subject to numerous federal and state lending laws designed to protect consumers, including the Community Reinvestment Act and fair lending laws, and failure to comply with these laws could lead to material sanctions and penalties.
The Community Reinvestment Act (“CRA”), the Equal Credit Opportunity Act, the Fair Housing Act and other fair lending laws and regulations impose nondiscriminatory lending requirements on financial institutions. The Consumer Financial Protection Bureau, the Department of Justice and other federal and state agencies are responsible for enforcing these laws and regulations. A successful challenge to an institution’s performance under the CRA or fair lending laws and regulations could result in a wide variety of sanctions, including the required payment of damages and civil money penalties, injunctive relief, imposition of restrictions on mergers
30
Table of Contents
and acquisitions activity, and restrictions on expansion activity. Private parties may also have the ability to challenge an institution’s performance under fair lending laws in private class action litigation.
We may be required to pay significantly higher FDIC deposit insurance assessments, as a result of the FDIC’s restoration plan, which could adversely affect our earnings.
As a result of economic conditions and the enactment of the Dodd-Frank Act, the FDIC has increased the deposit insurance assessment rates and thus raised deposit premiums for insured depository institutions. If these increases are insufficient for the DIF to meet its funding requirements, further special assessments or increases in deposit insurance premiums may be required. We are generally unable to control the amount of premiums that we are required to pay for FDIC insurance. If there are additional financial institution failures that affect the DIF, we may be required to pay FDIC premiums higher than current levels. Our regulatory assessments and FDIC Insurance costs were $694 thousand for the six months ended June 30, 2015, compared with $422 thousand for the six months ended June 30, 2014 and were $848 thousand for the year ended December 31, 2014, compared with $602 thousand for the year ended December 31, 2013. Any future additional assessments, increases or required prepayments in FDIC insurance premiums may materially adversely affect our business, financial condition and results of operations.
The Federal Reserve may require us to commit capital resources to support the Bank.
A bank holding company is required to act as a source of financial and managerial strength to its subsidiary banks and to commit resources to support its subsidiary banks. The Federal Reserve may require a bank holding company to make capital injections into a troubled subsidiary bank and may charge the bank holding company with engaging in unsafe and unsound practices for failure to commit resources to such a subsidiary bank. Under these requirements, in the future, we could be required to provide financial assistance to the Bank if it experiences financial distress.
A capital injection may be required at times when our resources are limited and we may be required to borrow the funds to make the required capital injection. In the event of a bank holding company’s bankruptcy, the bankruptcy trustee will assume any commitment by the holding company to a federal bank regulatory agency to maintain the capital of a subsidiary bank. Moreover, bankruptcy law provides that claims based on any such commitment will be entitled to a priority of payment over the claims of the holding company’s general unsecured creditors, including the holders of any note obligations. Thus, any borrowing that must be done by the holding company in order to make the required capital injection becomes more difficult and expensive and will adversely impact the holding company’s business, financial condition and results of operations.
We may be materially and adversely affected by the soundness, creditworthiness and liquidity of other financial institutions.
Financial services institutions are interrelated as a result of trading, clearing, counterparty or other relationships. We have exposure to many different industries and counterparties, and routinely execute transactions with counterparties in the financial services industry, including commercial banks, brokers and dealers, investment banks and other institutional customers. Many of these transactions expose us to credit risk in the event of a default by a counterparty or customer. In addition, our credit risk may be exacerbated when the collateral held by us cannot be realized upon or is liquidated at prices not sufficient to recover the full amount of the credit or derivative exposure due to us. Any such losses could have a material adverse effect on our business, financial condition and results of operations.
Monetary policies and regulations of the Federal Reserve could adversely affect our business, financial condition and results of operations.
In addition to being affected by general economic conditions, our earnings and growth are affected by the policies of the Federal Reserve. An important function of the Federal Reserve is to regulate the U.S. money supply and credit conditions. Among the instruments used by the Federal Reserve to implement these objectives
31
Table of Contents
are open market operations in U.S. government securities, adjustments of both the discount rate and the federal funds rate and changes in reserve requirements against bank deposits. These instruments are used in varying combinations to influence overall economic growth and the distribution of credit, bank loans, investments and deposits. Their use also affects interest rates charged on loans or paid on deposits. The monetary policies and regulations of the Federal Reserve have had a significant effect on the operating results of commercial banks in the past and are expected to continue to do so in the future. Although we cannot determine the effects of such policies on us at this time, such policies could have a material adverse effect on our business, financial condition and results of operations.
Risks Related to this Offering and an Investment in our Common Stock
An active, liquid trading market for our common stock may not develop, which may impair your ability to sell your common stock at or above the initial public offering price.
Prior to this offering there has been no public market for our common stock. An active trading market for shares of our common stock may never develop or be sustained following this offering. If an active trading market does not develop, you may have difficulty selling your shares of common stock at an attractive price, or at all. The initial public offering price for our common stock will be determined by negotiations between us and the representative of the underwriters and may not be indicative of prices that will prevail in the open market following this offering. Consequently, you may not be able to sell your common stock at or above the initial public offering price or at any other price or at the time that you would like to sell. An inactive market may also impair our ability to raise capital by selling our common stock and may impair our ability to expand our business by using our common stock as consideration in an acquisition.
The market price of our common stock could be volatile and may fluctuate significantly, which could cause the value of an investment in our common stock to decline.
The market price of our common stock could fluctuate substantially due to a variety of factors, many of which are beyond our control, including, but not limited to:
| • | general economic conditions and overall market fluctuations; |
| • | actual or anticipated fluctuations in our quarterly or annual operating results; |
| • | operating and stock price performance of other companies that investor deem comparable to us; |
| • | the perception that investment in Texas is unattractive or less attractive during periods of low oil prices; |
| • | announcements by us or our competitors of significant acquisitions, dispositions, innovations or new programs and services; |
| • | the public reaction to our press releases, our other public announcements and our filings with the SEC; |
| • | changes in financial estimates and recommendations by securities analysts following our stock, or the failure of securities analysts to cover our common stock after this offering; |
| • | changes in earnings estimates by securities analysts or our ability to meet those estimates; |
| • | the trading volume of our common stock; |
| • | changes in governmental monetary policies, including the policies of the Federal Reserve; |
| • | changes in business, legal or regulatory conditions, or other developments affecting participants in our industry, and publicity regarding our business or any of our significant customers or competitors; |
| • | changes in accounting standards, policies, guidance, interpretations or principles; and |
| • | future sales of our common stock by us, directors, executives and significant shareholders. |
The realization of any of the risks described in this “Risk Factors” section could have a material adverse effect on the market price of our common stock and cause the value of your investment to decline. In addition,
32
Table of Contents
the stock market experiences extreme volatility that has often been unrelated to the operating performance of particular companies. These types of broad market fluctuations may adversely affect investor confidence and could affect the trading price of our common stock over the short, medium or long term, regardless of our actual performance. If the market price of our common stock reaches an elevated level following this offering, it may materially and rapidly decline. In the past, following periods of volatility in the market price of a company’s securities, shareholders have often instituted securities class action litigation. If we were to be involved in a class action lawsuit, we could incur substantial costs and it could divert the attention of senior management and have a material adverse effect on our business, financial condition and results of operations.
The obligations associated with being a public company will require significant resources and management attention.
As a public company, we will face increased legal, accounting, administrative and other costs and expenses that we have not incurred as a private company, particularly after we are no longer an emerging growth company. After the completion of this offering, we will be subject to the reporting requirements of the Exchange Act, which requires that we file annual, quarterly and current reports with respect to our business and financial condition and proxy and other information statements, and the rules and regulations implemented by the SEC, the Sarbanes-Oxley Act, the Dodd-Frank Act, the PCAOB and The NASDAQ Stock Market, each of which imposes additional reporting and other obligations on public companies. As a public company, we will be required to:
| • | prepare and distribute periodic reports, proxy statements and other shareholder communications in compliance with the federal securities laws and rules; |
| • | expand the roles and duties of our board of directors and committees thereof; |
| • | maintain an internal audit function; |
| • | institute more comprehensive financial reporting and disclosure compliance procedures; |
| • | involve and retain to a greater degree outside counsel and accountants in the activities listed above; |
| • | enhance our investor relations function; |
| • | establish new internal policies, including those relating to trading in our securities and disclosure controls and procedures; |
| • | retain additional personnel; |
| • | comply with The NASDAQ Stock Market listing standards; and |
| • | comply with the Sarbanes-Oxley Act. |
We expect these rules and regulations and changes in laws, regulations and standards relating to corporate governance and public disclosure, which have created uncertainty for public companies, to increase legal and financial compliance costs and make some activities more time consuming and costly. These laws, regulations and standards are subject to varying interpretations, in many cases due to their lack of specificity, and, as a result, their application in practice may evolve over time as new guidance is provided by regulatory and governing bodies. This could result in continuing uncertainty regarding compliance matters and higher costs necessitated by ongoing revisions to disclosure and governance practices. Our investment in compliance with existing and evolving regulatory requirements will result in increased administrative expenses and a diversion of management’s time and attention from revenue-generating activities to compliance activities, which could have a material adverse effect on our business, financial condition and results of operations. These increased costs may require us to divert a significant amount of money that we could otherwise use to expand our business and achieve our strategic objectives.
You will incur immediate dilution as a result of this offering.
If you purchase our common stock in this offering, you will pay more for your shares than the net tangible book value per share immediately following consummation of this offering. As a result, you will incur immediate
33
Table of Contents
dilution of $6.93 per share representing the difference between the offering price of $23.00, the midpoint of the estimated initial public offering price range set forth on the cover page of this prospectus, and our adjusted net tangible book value per share as of June 30, 2015 of $16.07 per share of common stock. This represents 30.1% dilution from the midpoint of the initial public offering price set forth on the cover page of this prospectus. Accordingly, if we were to be liquidated at our book value immediately following this offering, you would not receive the full amount of your investment.
If equity research industry analysts do not initiate or continue coverage on our common stock or if they change their recommendations regarding our stock if our operating results do not meet their expectations, the price and trading volume of our common stock could decline.
The trading market for our common stock could be affected by the research and reports that industry or securities analysts may publish about us or our business. We cannot predict whether any research analysts will cover us and our common stock nor do we have any control over these analysts. If one or more of these analysts ceases coverage of us or fails to publish reports on us regularly, we could lose visibility in the financial markets, which in turn could cause our stock price or trading volume to decline and our common stock to be less liquid. Moreover, if one or more of the analysts who cover us downgrade our stock or if our operating results do not meet their expectations, either absolutely or relative to our competitors, our stock price could quickly decline.
Future issuances of a substantial amount of our common stock may depress the market price of shares of our common stock.
Sales or the availability for sale of substantial amounts of our common stock in the public market could adversely affect the prevailing market price of our common stock and could limit our future ability to raise capital through future sales or an offering of equity securities.
As of June 30, 2015 our amended and restated certificate of formation authorizes us to issue 40,000,000 shares of common stock, of which
12,424,696 will be outstanding upon consummation of this offering (or 12,814,696 assuming the underwriters exercise their option to purchase additional shares in full). This number includes 2,600,000 shares that we are selling in this offering (or
2,990,000 assuming the underwriters exercise their option to purchase additional shares in full), which will be freely transferable without restriction or further registration under the Securities Act of 1933, as amended (the “Securities
Act”). A substantial portion of the remaining 9,822,950 shares of our common stock outstanding, including the shares of common stock retained by members of our management, will be restricted from immediate resale under lock-up agreements
between our executive officers, directors and certain other current shareholders and the underwriters, which generally provide for a lock-up period of 180 days following this offering (unless the representative of the underwriters waives such
lock-up period), but may be sold in the near future. Following the expiration of the applicable lock-up period, all these shares of our common stock will be eligible for resale under
Rule 144 of the Securities Act, subject to volume limitations
and applicable holding period requirements.
We may issue shares of our common stock or other securities from time to time as consideration for future acquisitions and investments and pursuant to compensation and incentive plans. If any such acquisition or investment is significant, the number of shares of our common stock, or the number or aggregate principal amount, as the case may be, of other securities that we may issue may in turn be substantial. We may also grant registration rights covering those shares of our common stock or other securities in connection with any such acquisitions and investments.
We cannot predict the size of future issuances of our common stock or the effect, if any, that future issuances and sales of our common stock will have on the market price of our common stock. Sales of substantial amounts of our common stock (including shares of our common stock issued in connection with an acquisition or under a compensation or incentive plan), or the perception that such sales could occur, may adversely affect prevailing market prices for our common stock and could impair our ability to raise capital through future sales of our securities.
34
Table of Contents
We may issue shares of preferred stock in the future, which could make it difficult for another company to acquire us or could otherwise adversely affect the rights of the holders of our common stock, which could depress the price of our common stock.
Our amended and restated certificate of formation authorizes us to issue up to 1,000,000 shares of one or more series of preferred stock. Our board of directors, in its sole discretion, has the authority to determine the preferences, limitations and relative rights of shares of preferred stock and to fix the number of shares constituting any series, the designation of such series, and the dividend rate for each series, without any further vote or action by our shareholders. Our preferred stock may be issued with voting, liquidation, dividend and other rights superior to the rights of our common stock. The potential issuance of preferred stock may delay or prevent a change in control of us, discouraging bids for our common stock at a premium over the market price, and materially adversely affect the market price and the voting and other rights of the holders of our common stock.
The holders of our debt obligations and shares of our preferred stock will have priority over our common stock with respect to payment in the event of liquidation, dissolution or winding up and with respect to the payment of interest and preferred dividends.
As of June 30, 2015, we had approximately $28.1 million outstanding under our revolving credit facility. In connection with the acquisition of F&M Bancshares, we incurred approximately $29.3 million in indebtedness, including borrowing approximately $18.0 million under our revolving credit facility to repay debt that F&M Bancshares owed to its shareholders and the assumption of junior subordinated debentures with an aggregate original principal and liquidation amount of $11.3 million. Upon our liquidation, dissolution or winding up, holders of our common stock will not be entitled to receive any payment or other distribution of assets until after all of our obligations to our debt holders have been satisfied and holders of the related trust preferred securities have received any payment or distribution due to them. In addition, we are required to pay interest on our outstanding indebtedness before we pay any dividends on our common stock.
Because our decision to issue debt or equity securities or incur other borrowings in the future will depend on market conditions and other factors beyond our control, the amount, timing, nature or success of our future capital raising efforts is uncertain. Thus, common shareholders bear the risk that our future issuances of debt or equity securities or our incurrence of other borrowings will negatively affect the market price of our common stock.
We currently have no plans to pay dividends on our common stock, so you may not receive funds without selling your common stock.
We have not paid dividends on our common stock in the past, and do not anticipate paying any dividends on our common stock in the foreseeable future. Our ability to pay dividends on our common stock is dependent on the Bank’s ability to pay dividends to us, which is limited by applicable laws and banking regulations. Our ability to pay dividends on our common stock is also restricted by the terms of the subordinated debentures we assumed from F&M Bancshares and may in the future be restricted by the terms of any debt or preferred securities we may incur or issue. Payments of future dividends, if any, will be at the discretion of our board of directors after taking into account various factors, including our business, operating results and financial condition, current and anticipated cash needs, plans for expansion and any legal or contractual limitations on our ability to pay dividends. Accordingly, shares of common stock should not be purchased by persons who need or desire dividend income from their investment.
We are dependent upon the Bank for cash flow, and the Bank’s ability to make cash distributions is restricted, which could impact our ability to satisfy our obligations.
Our primary tangible asset is the Bank. As such, we depend upon the Bank for cash distributions (through dividends on the Bank’s stock) that we use to pay our operating expenses and satisfy our obligations (including
35
Table of Contents
debt obligations). There are numerous laws and banking regulations that limit the Bank’s ability to pay dividends to the Company. If the Bank is unable to pay dividends to the Company, we will not be able to satisfy our obligations. These statutes and regulations require, among other things, that the Bank maintain certain levels of capital in order to pay a dividend. Further, federal and state banking authorities have the ability to restrict the Bank’s payment of dividends through supervisory action.
Our management team may allocate the proceeds of this offering in ways in which you may not agree.
We have broad discretion in applying the net proceeds we will receive in this offering. We intend to retain all of our earnings to promote growth and build capital. As part of your investment decision, you will not be able to assess or direct how we apply these net proceeds. If we do not apply these funds effectively, we may lose significant business opportunities. Furthermore, our stock price could decline if the market does not view our use of the net proceeds from this offering favorably.
We are an “emerging growth company,” and we cannot be certain if the reduced disclosure requirements applicable to emerging growth companies will make our common stock less attractive to investors.
We are an “emerging growth company,” as defined in the JOBS Act. As such, we are eligible to take advantage of certain exemptions from various reporting requirements that are applicable to other public companies that are not emerging growth companies. These exemptions allow us, among other things,
| • | to present only two years of audited financial statements and discuss our results of operations for only two years in related Management’s Discussions and Analyses in our initial public offering registration statement; |
| • | not to provide an auditor attestation of our internal control over financial reporting; |
| • | to choose not to comply with any new requirements adopted by the PCAOB requiring mandatory audit firm rotation or a supplement to the auditor’s report providing additional information about the audit and our audited financial statements; |
| • | to provide reduced disclosure regarding our executive compensation arrangements pursuant to the rules applicable to smaller reporting companies, which means we do not have to include a compensation discussion and analysis and certain other disclosure regarding our executive compensation; and |
| • | not to seek a non-binding advisory vote on executive compensation or golden parachute arrangements. |
In addition, even if we comply with the greater disclosure obligations of public companies that are not emerging growth companies immediately after this offering, we may avail ourselves of these reduced requirements applicable to emerging growth companies from time to time in the future, so long as we are an emerging growth company. We will remain an emerging growth company for up to five years, though we may cease to be an emerging growth company earlier under certain circumstances, including if, before the end of such five years, we are deemed to be a large accelerated filer under the rules of the SEC (which depends on, among other things, having a market value of common stock held by non-affiliates in excess of $700.0 million). Investors and securities analysts may find it more difficult to evaluate our common stock because we may rely on one or more of these exemptions, and, as a result, investor confidence and the market price of our common stock may be materially and adversely affected.
Our corporate governance documents and certain corporate and banking provisions of Texas law applicable to us could have an anti-takeover effect and may delay, make more difficult or prevent an attempted acquisition of the Company and other actions that you may favor.
Our amended and restated certificate of formation and bylaws contain certain provisions that may have an anti-takeover effect and may delay, discourage or prevent an attempted acquisition or change of control of the Company. These provisions include:
| • | staggered terms for directors, who may be removed from office only for cause; |
36
Table of Contents
| • | a provision establishing certain advance notice procedures for nomination of candidates for election as directors and for shareholder proposals; and |
| • | a provision that any special meeting of our shareholders may be called only by a majority of the board of directors, the President or a holder or group of holders of at least 50% of our shares entitled to vote at the meeting. |
Our amended and restated certificate of formation does not provide for cumulative voting for directors and authorizes the board of directors to issue shares of its preferred stock without shareholder approval and upon such terms as the board of directors may determine. The issuance of our preferred stock, while providing desirable flexibility in connection with possible acquisitions, financings and other corporate purposes, could have the effect of making it more difficult for a third party to acquire, or of discouraging a third-party from acquiring, a controlling interest in us. In addition, certain provisions of Texas law, including a provision which restricts certain business combinations between a Texas corporation and certain affiliated shareholders, may delay, discourage or prevent an attempted acquisition or change in control.
In addition, banking laws impose notice, approval, and ongoing regulatory requirements on any shareholder or other party that seeks to acquire direct or indirect “control” of an FDIC-insured depository institution. These laws include the Bank Holding Company Act of 1956 (the “BHC Act”) and the Change in Bank Control Act. These laws could delay or prevent an acquisition.
Furthermore, our amended and restated certificate of formation provides that the state and federal courts located in Harris County, Texas, the county in which the City of Houston lies, will be the exclusive forum for: (a) any derivative action or proceeding brought on our behalf; (b) any action asserting a breach of fiduciary duty; (c) any action asserting a claim against us arising pursuant to the TBOC, our certificate of formation, or our bylaws; or (d) any action asserting a claim against us that is governed by the internal affairs doctrine. By becoming a shareholder of our Company, you will be deemed to have notice of and have consented to the provisions of our amended and restated certificate of formation related to choice of forum. The choice of forum provision in our amended and restated certificate of formation may limit our shareholders’ ability to obtain a favorable judicial forum for disputes with us. Alternatively, if a court were to find the choice of forum provision contained in our amended and restated certificate of formation to be inapplicable or unenforceable in an action, we may incur additional costs associated with resolving such action in other jurisdictions, which could harm our business, operating results, and financial condition.
Shareholders may be deemed to be acting in concert or otherwise in control of us, which could impose notice, approval and ongoing regulatory requirements and result in adverse regulatory consequences for such holders.
We are a bank holding company regulated by the Federal Reserve. Banking laws impose notice, approval, and ongoing regulatory requirements on any shareholder or other party that seeks to acquire direct or indirect “control” of an FDIC-insured depository institution or a company that controls an FDIC-insured depository institution, such as a bank holding company. These laws include the BHC Act and the Change in Bank Control Act. The determination whether an investor “controls” a depository institution or holding company is based on all of the facts and circumstances surrounding the investment.
As a general matter, a party is deemed to control a depository institution or other company if the party (1) owns or controls 25.0% or more of any class of voting stock of the bank or other company, (2) controls the election of a majority of the directors of the bank or other company, or (3) has the power to exercise a controlling influence over the management or policies of the bank or other company. In addition, subject to rebuttal, a party may be presumed to control a depository institution or other company if the investor owns or controls 10.0% or more of any class of voting stock. Ownership by affiliated parties, or parties acting in concert, is typically aggregated for these purposes. “Acting in concert” generally means knowing participation in a joint activity or
37
Table of Contents
parallel action towards the common goal of acquiring control of a bank or a parent company, whether or not pursuant to an express agreement. The manner in which this definition is applied in individual circumstances can vary and cannot always be predicted with certainty.
Any shareholder that is deemed to “control” us for regulatory purposes would become subject to notice, approval, and ongoing regulatory requirements and may be subject to adverse regulatory consequences. Potential investors are advised to consult with their legal counsel regarding the applicable regulations and requirements.
An investment in our common stock is not an insured deposit and is not guaranteed by the FDIC, so you could lose some or all of your investment.
An investment in our common stock is not a bank deposit and, therefore, is not insured against loss or guaranteed by the FDIC, any other deposit insurance fund or by any other public or private entity. An investment in our common stock is inherently risky for the reasons described herein. As a result, if you acquire our common stock, you could lose some or all of your investment.
38
Table of Contents
This prospectus contains forward-looking statements that are based on various facts and derived utilizing numerous important assumptions and are subject to known and unknown risks, uncertainties and other factors that may cause our actual results, performance or achievements to be materially different from any future results, performance or achievements expressed or implied by such forward-looking statements. These statements preceded by, followed by or that otherwise include the words “believes,” “expects,” “anticipates,” “intends,” “projects,” “estimates,” “plans” and similar expressions or future or conditional verbs such as “will,” “should,” “would,” “may” and “could” are generally forward-looking in nature and not historical facts, although not all forward looking statements include the foregoing. Forward-looking statements include the information concerning our future financial performance, business and growth strategy, projected plans and objectives, as well as projections of macroeconomic and industry trends, which are inherently unreliable due to the multiple factors that impact economic trends, and any such variations may be material. You should understand that any such forward-looking statements are not guarantees of future performance and are subject to risks, assumptions and uncertainties that are difficult to predict. Although we believe that the expectations reflected in these statements are reasonable as of the date made, actual results may prove to be materially different from the results expressed or implied by the forward-looking statements.
The following important factors could affect our future results and cause actual results to differ materially from those indicated in these forward-looking statements, include, but are not limited to, the following:
| • | risks related to the concentration of our business in Houston, Texas, including risks associated with the recent decrease in oil and gas prices; |
| • | general market conditions and economic trends nationally, regionally and particularly in Houston, Texas; |
| • | our ability to retain executive officers and key employees and their customer and community relationships; |
| • | our ability to recruit and retain successful bankers that meet our expectations in terms of customer and community relationships and profitability; |
| • | risks related to our strategic focus on lending to small to medium-sized businesses; |
| • | our ability to implement our growth strategy, including through the identification of acquisition candidates that will be accretive to our financial condition and results of operation; |
| • | risks related to the integration of Farmers & Merchants Bancshares, Inc. and any businesses we acquire in the future, including exposure to potential asset quality and credit quality risks and unknown or contingent liabilities, the time and costs associated with integrating systems, technology platforms, procedures and personnel, the need for additional capital to finance such transactions, and possible failures in realizing the anticipated benefits from acquisitions; |
| • | potential impairment on the goodwill we have recorded or may record in connection with business acquisitions; |
| • | risks associated with our owner-occupied commercial real estate loan and other commercial real estate loan portfolios, including the risks inherent in the valuation of the collateral securing such loans; |
| • | risks associated with our commercial and industrial loan portfolio, including the risk for deterioration in value of the general business assets that generally secure such loans; |
| • | the accuracy and sufficiency of the assumptions and estimates we make in establishing reserves for potential loan losses and other estimates; |
| • | risk of deteriorating asset quality and higher loan charge-offs; |
| • | time and effort necessary to resolve nonperforming assets; |
39
Table of Contents
| • | potential changes in the prices, values and sales volumes of commercial and residential real estate securing our real estate loans; |
| • | changes in market interest rates that affect the pricing of our loans and deposits and our net interest income; |
| • | potential fluctuations in the market value and liquidity of the securities we hold for sale; |
| • | risk of impairment of investment securities, goodwill, other intangible assets or deferred tax assets; |
| • | the effects of competition from a wide variety of local, regional, national and other providers of financial, investment and insurance services, which may adversely affect our pricing and terms; |
| • | our ability to maintain an effective system of disclosure controls and procedures and internal controls over financial reporting; |
| • | risks associated with fraudulent and negligent acts by our customers, employees or vendors; |
| • | our ability to keep pace with technological change or difficulties when implementing new technologies; |
| • | risks associated with system failures or failures to protect against cybersecurity threats, such as breaches of our network security; |
| • | risks associated with data processing system failures and errors; |
| • | the institution and outcome of litigation and other legal proceeding against us or to which we become subject; |
| • | our ability to maintain adequate liquidity and to raise necessary capital to fund our acquisition strategy and operations or to meet increased minimum regulatory capital levels; |
| • | our ability to comply with various governmental and regulatory requirements applicable to financial institutions; |
| • | the impact of recent and future legislative and regulatory changes, including changes in banking, securities and tax laws and regulations and their application by our regulators, such as the Dodd-Frank Act; |
| • | governmental monetary and fiscal policies, including the policies of the Board of Governors of the Federal Reserve System (the “Federal Reserve”); |
| • | our ability to comply with supervisory actions by federal and state banking agencies; |
| • | changes in the scope and cost of Federal Deposit Insurance Corporation (the “FDIC”) insurance and other coverage; and |
| • | systemic risks associated with the soundness of other financial institutions. |
Further, these forward-looking statements speak only as of the date on which they were made and we undertake no obligation to update or revise any forward-looking statements to reflect events or circumstances after the date on which these statements are made or to reflect the occurrence of unanticipated events, unless required to do so under the federal securities laws. Other factors not identified above, including those described under the headings “Risk Factors” and “Management’s Discussion and Analysis of Financial Condition and Results of Operations,” may also cause actual results to differ materially from those described in our forward-looking statements. Most of these factors are difficult to anticipate and are generally beyond our control. You should consider these factors in connection with considering any forward-looking statements that may be made by us.
40
Table of Contents
We estimate that the net proceeds from the sale of the shares of common stock by us will be approximately $54.4 million, after deducting the estimated underwriting discounts and commissions and estimated offering expenses payable by us, based on an assumed initial public offering price of $23.00 per share, which is the midpoint of the estimated initial public offering price range set forth on the cover page of this prospectus, and after deducting estimated underwriting discounts and offering expenses. If the underwriters exercise their option to purchase additional shares in full, the net proceeds to us will be approximately $62.7 million.
We intend to use the net proceeds to us from this offering, in part, to repay $28.1 million of outstanding indebtedness under a revolving credit facility, plus accrued and unpaid interest, which outstanding indebtedness was $28.1 million as of June 30, 2015. On December 22, 2014, we entered into a $30.0 million revolving credit facility to refinance our existing term loan and for certain costs related to the acquisition of F&M Bancshares and to repay approximately $18.0 million of debt owed by F&M Bancshares to certain of its shareholders. Our revolving credit facility matures in December 2021 and our borrowings bear interest at the Prime Rate minus 25 basis points per annum, which equated to approximately 3.00% at June 30, 2015. For more information regarding our revolving credit agreement, see “Management’s Discussion and Analysis of Financial Condition and Results of Operations—Financial Condition—Other Borrowed Funds.”
We plan to use any remaining net proceeds to us from this offering to support our long-term growth by enhancing our capital ratios to permit growth initiatives and future strategic acquisitions and for general working capital and other corporate expenses. At any given time, we may be evaluating and conducting due diligence with respect to potential acquisition candidates. We cannot assure you that we will enter into any definitive agreements in respect of any such potential transactions. Other than net proceeds used to repay a portion of our revolving credit facility, we have not specifically allocated the amount of net proceeds to us that will be used for these purposes, and our management will have broad discretion over how these proceeds are used.
A $1.00 increase (decrease) in the assumed initial public offering price of $23.00 per share, which is the midpoint of the estimated initial public offering price range set forth on the cover page of this prospectus, would increase (decrease) the net proceeds from the sale of the shares of common stock by us by approximately $2.4 million, assuming that the number of shares offered by us, as set forth on the cover page of this prospectus, remains the same and after deducting estimated underwriting discounts and commissions and estimated offering expenses payable by us.
A 100,000 share increase (decrease) in the number of shares of common stock offered by us, would increase (decrease) the net proceeds from the
sale of the shares of common stock by us by approximately $2.1 million, assuming an initial public offering price of
$23.00 per share, which is the midpoint of the estimated initial public offering price range set forth on the cover page of this
prospectus, and after deducting estimated underwriting discounts and commissions and estimated offering expenses payable by us.
41
Table of Contents
The following table sets forth our capitalization as of June 30, 2015:
| • | On an actual basis; and |
| • | On an as adjusted basis to give effect to the sale of 2,600,000 shares of common stock by us in this offering (assuming the underwriters do not exercise their purchase option), at an assumed initial public offering price of $23.00 per share, the midpoint of the estimated initial public offering price range set forth on the cover page of this prospectus, after deducting the underwriting discounts and commissions and estimated offering expenses payable by us, application of the estimated net proceeds of this offering, and to reflect the redemption of all of our shares of preferred stock on July 15, 2015. |
You should read this table in conjunction with “Use of Proceeds,” “Selected Historical Consolidated Financial Data,” “Management’s Discussion and Analysis of Financial Condition and Results of Operations” and our consolidated financial statements and the related notes included elsewhere in this prospectus.
| As of June 30, 2015 | ||||||||||
| Actual | As Adjusted | |||||||||
| (Dollars in thousands, except share and per share data) | ||||||||||
| Other borrowings: |
||||||||||
| Short-term borrowings |
$ | 75,000 | $ | 75,000 | ||||||
| Long-term borrowings(6) |
28,069 | — | ||||||||
| Subordinated debentures(1) |
9,032 | 9,032 | ||||||||
| Stockholders’ Equity: |
||||||||||
| Preferred stock, $1.00 par value; 1,000,000 shares authorized; issued and outstanding; 11,000 shares of Series A and 550 shares of Series B, each with a $1,000 liquidation value, actual, and no shares on an as adjusted basis(2) |
11,550 | — | ||||||||
| Common Stock $1.00 par value; 40,000,000 shares authorized; 9,824,696 shares issued and 9,822,950 shares outstanding, and 12,424,696 shares issued and 12,422,950 shares outstanding on an as adjusted basis |
9,825 | 12,425 | ||||||||
| Capital surplus |
154,428 | 206,214 | ||||||||
| Retained earnings |
26,152 | 26,152 | ||||||||
| Accumulated other comprehensive loss |
(87 | ) | (87 | ) | ||||||
| Treasury stock, at cost, 1,746 shares |
(38 | ) | (38 | ) | ||||||
|
|
|
|
|
|||||||
| Total stockholders’ equity |
201,830 | 244,666 | ||||||||
|
|
|
|
|
|||||||
| Total capitalization |
$ | 313,931 | $ | 328,698 | ||||||
|
|
|
|
|
|||||||
| Per Share Data: |
||||||||||
| Book value per common share |
$ | 19.37 | $ | 19.69 | ||||||
| Tangible book value per common share(3) |
14.79 | 16.07 | ||||||||
| Capital Ratios: |
||||||||||
| Common equity Tier 1 capital to risk-weighted assets(4) |
8.68 | % | 11.85 | % | ||||||
| Tier 1 capital to average assets |
9.34 | % | 11.61 | % | ||||||
| Tier 1 capital to risk-weighted assets(4) |
9.88 | % | 12.37 | % | ||||||
| Total capital to risk-weighted assets(4) |
10.48 | % | 12.98 | % | ||||||
| Tangible common equity to tangible assets(5) |
7.64 | % | 10.43 | % | ||||||
| (1) | Consists of junior subordinated debentures (and related TruPs) with an aggregate original principal (and liquidation) amount of $11.3 million issued to two unconsolidated subsidiary trusts of F&M Bancshares, the obligations of which we assumed in connection with the merger. Amount includes a fair value adjustment. |
42
Table of Contents
| (2) | On July 15, 2015, we redeemed all of our outstanding shares of Series A and B preferred stock for an aggregate redemption price of $11.7 million. We issued our Series A and Series B preferred stock in connection with the F&M Bancshares acquisition, which had preferred stock outstanding pursuant to the U.S. Treasury’s Troubled Asset Relief Program. We funded the redemption with cash on hand. |
| (3) | For information on how we calculate tangible book value per common share and a reconciliation of this and other non-GAAP financial measures to their most directly comparable GAAP financial measures, see “Management’s Discussion and Analysis of Financial Condition and Results of Operations—GAAP Reconciliation and Management’s Explanation of Non-GAAP Financial Measures.” |
| (4) | We calculate our risk-weighted assets using the standardized method of the Basel III Framework, as implemented by the Federal Reserve and the FDIC. |
| (5) | For information on how we calculate tangible equity and a reconciliation of this and other non-GAAP financial measures to their most directly comparable GAAP financial measures, see “Management’s Discussion and Analysis of Financial Condition and Results of Operations—GAAP Reconciliation and Management’s Explanation of Non-GAAP Financial Measures.” |
| (6) | We intend to use the net proceeds to us from this offering, in part, to repay all $28.1 million of outstanding indebtedness under a revolving credit facility, plus accrued and unpaid interest. |
A $1.00 increase (or decrease) in the assumed initial public offering price of $23.00 per share, which is the midpoint of the estimated initial public offering price range set forth on the cover page of this prospectus, would increase (or decrease) the “as adjusted” amounts of each of total stockholders’ equity and total capitalization by approximately $2.6 million, assuming that the number of shares offered by us, as set forth on the cover page of this prospectus, remains the same and after deducting estimated underwriting discounts and commissions and estimated offering expenses payable by us.
A 100,000 share increase (or decrease) in the number of shares of common stock offered by us would increase (or decrease) the “as adjusted” amounts of each of total stockholders’ equity and total capitalization by approximately $2.3, assuming an initial public offering price of $23.00 per share, which is the midpoint of the estimated initial public offering price range set forth on the cover page of this prospectus, and after deducting estimated underwriting discounts and commissions and estimated offering expenses payable by us.
The “as adjusted” amounts discussed above are illustrative only and subject to the actual initial public offering price and the actual number of shares sold by us in this offering.
43
Table of Contents
If you invest in our common stock, your ownership interest will be immediately diluted to the extent of the difference between the initial public offering price per share of our common stock in this offering and the net tangible book value per share of common stock upon completion of this offering.
Net tangible book value per common share represents the amount of our total tangible assets less total liabilities, divided by the number of shares of common stock outstanding. Our net tangible book value as of June 30, 2015 was $145.2 million, or $14.79 per share of common stock, based upon 9,822,950 shares of common stock outstanding as of such date.
Investors participating in this offering will incur immediate, substantial dilution. After giving effect to the sale of 2,600,000 shares of our common stock by us at the initial public offering price of $23.00 per share, the midpoint of the estimated initial public offering price range set forth on the cover page of this prospectus, and after deducting the estimated underwriting discounts and commissions and estimated offering expenses payable by us, our net tangible book value as of June 30, 2015 would have been approximately $199.6 million, or approximately $16.07 per share of common stock. This represents an immediate increase in net tangible book value of $1.28 per share to existing common shareholders, and an immediate dilution of $6.93 per share to investors participating in this offering. If the initial public offering price is higher or lower, the dilution to new shareholders will be greater or less, respectively.
The following table illustrates this dilution on a per share basis:
| Assumed initial public offering price per share of common stock |
$ | 23.00 | ||||||
| Tangible book value per common share as of June 30, 2015 |
$ | 14.79 | ||||||
| Increase in tangible book value per common share attributable to this offering |
1.28 | |||||||
|
|
|
|||||||
| As adjusted net tangible book value per common share after this offering |
16.07 | |||||||
|
|
|
|||||||
| Dilution in net tangible book value per common share to new investors(1) |
$ | 6.93 | ||||||
|
|
|
| (1) | Dilution is determined by subtracting net tangible book value per common share after giving effect to this offering from the initial public offering price paid by a new investor. |
A $1.00 increase (or decrease) in the assumed initial public offering price of $23.00 per share, which is the midpoint of the estimated initial public offering price range set forth on the cover page of this prospectus, would increase (or decrease) the as adjusted net tangible book value per common share after this offering by approximately $0.19, and dilution in net tangible book value per common share to new investors by approximately $7.74, assuming that the number of shares offered by us, as set forth on the cover page of this prospectus, remains the same and after deducting estimated underwriting discounts and commissions and estimated offering expenses payable by us. If the underwriters exercise in full their option to purchase additional shares of our common stock in this offering, the as adjusted net tangible book value after this offering would be $16.74 per share, the increase in net tangible book value to existing shareholders would be $0.67 per share and the dilution to new investors would be $6.26 per share, in each case assuming an initial public offering price of $23.00 per share, which is the midpoint of the estimated initial public offering price range set forth on the cover page of this prospectus.
The following table summarizes, as of June 30, 2015, the differences between our existing shareholders and new investors with respect to the number of shares of our common stock purchased from us, the total consideration paid and the average price per share paid. The calculations with respect to shares purchased by new
44
Table of Contents
investors in this offering reflect the initial public offering price of $23.00 per share, which is the midpoint of the estimated initial public offering price range set forth on the cover page of this prospectus, before deducting estimated underwriting discounts and commissions and estimated offering expenses payable by us:
| Shares Purchased | Total Consideration | Average Price Per Share |
||||||||||||||||||
| Number | Percentage | Amount | Percentage | |||||||||||||||||
| Existing shareholders |
9,822,950 | 79.1 | % | $ | 161,299,000 | 73.0 | % | $ | 16.43 | |||||||||||
| New investors |
2,600,000 | 20.9 | 59,800,000 | 27.0 | 23.00 | |||||||||||||||
|
|
|
|
|
|
|
|
|
|||||||||||||
| Total |
12,422,950 | 100.0 | % | $ | 221,099,000 | 100.0 | % | $ | 17.80 | |||||||||||
|
|
|
|
|
|
|
|
|
|||||||||||||
Except as otherwise indicated, the discussion and tables above assume no exercise of the underwriters’ option to purchase additional shares, and no exercise of any outstanding options. In addition, if the underwriters’ option to purchase additional shares is exercised in full, the number of shares of common stock held by existing shareholders, will be further reduced to 76.7% of the total number of shares of common stock to be outstanding upon the closing of this offering, and the number of shares of common stock held by investors participating in this offering will be further increased to 2,990,000 shares or 23.3% of the total number of shares of common stock to be outstanding upon the closing of this offering.
The discussion and tables above exclude 895,992 shares of our common stock issuable upon the exercise of outstanding stock options at a weighted average exercise price of $17.05 per share (452,042 shares of which are currently exercisable) and 445,564 shares of common stock reserved for issuance under our Amended and Restated Equity Plan in each case as of June 30, 2015. To the extent any of these options are exercised, there will be further dilution to investors participating in this offering.
45
Table of Contents
We have not declared or paid any dividends on our common stock. We currently intend to retain all of our future earnings, if any, for use in our business and do not anticipate paying cash dividends on our common stock in the foreseeable future. Payments of future dividends, if any, will be at the discretion of our board of directors after taking into account various factors, including our business, operating results and financial condition, current and anticipated cash needs, plans for expansion and any legal or contractual limitations on our ability to pay dividends.
As a bank holding company, our ability to pay dividends is affected by the regulations promulgated by and the policies and enforcement powers of the Federal Reserve. In addition, because we are a holding company, we are dependent upon the payment of dividends by the Bank to us as our principal source of funds to pay dividends in the future, if any, and to make other payments. The Bank is also subject to various legal, regulatory and other restrictions on its ability to pay dividends and make other distributions and payments to us. See “Regulation and Supervision—Regulatory Limits on Dividends and Distributions.”
In connection with the F&M Bancshares acquisition, we assumed junior subordinated debentures that allow us to defer interest payments thereunder for a period of time. To the extent we elect to defer any interest payments under the junior subordinated debentures, we will be prohibited by the terms of the junior subordinated debentures from making dividend payments on our common stock until we retire the arrearages on the junior subordinated debentures. In addition, our existing credit agreement restricts our ability to pay dividends.
46
Table of Contents
Overview
We are a Texas corporation and a registered bank holding company headquartered in Houston, Texas. Through our wholly-owned subsidiary, Allegiance Bank, we provide a diversified range of commercial banking services primarily to Houston metropolitan area-based small to medium-sized businesses and individual customers. We believe the size, growth and increasing economic diversity of the Houston metropolitan area, when combined with our super-community banking strategy, provides us with excellent opportunities for long-term, sustainable growth. Our super-community banking strategy, which we describe in more detail below, is designed to foster strong customer relationships while benefitting from a platform and scale that is competitive with larger local and regional banks. We believe this strategy presents a significant market advantage when serving small to medium-sized business customers and enables us to attract talented bankers.
We currently operate 16 full-service banking locations in the Houston metropolitan area and two full-service banking locations in Central Texas. We have experienced significant growth since we began banking operations in 2007, through both organic growth, including de novo branching, and two whole-bank acquisitions. Most recently, on January 1, 2015, we completed the acquisition of Farmers & Merchants Bancshares, Inc. (“F&M Bancshares”) and its subsidiary bank, Enterprise Bank (“Enterprise Bank”). As of June 30, 2015, we had total assets of $1.95 billion, total loans of $1.56 billion, total deposits of $1.63 billion and total stockholders’ equity of $201.8 million.
Our History and Growth
We commenced banking operations as Allegiance Bank in October 2007. We are led by our co-founder, Chairman and Chief Executive Officer, George Martinez, and co-founder and President, Steven F. Retzloff, who founded Allegiance Bank on the premise that a significant opportunity existed for a bank employing their super-community banking strategy in the Houston metropolitan area. Mr. Martinez is an experienced banker who previously co-founded and led Houston-based Sterling Bancshares, Inc. (“Sterling Bancshares”), a multi-billion dollar in assets publicly traded bank holding company acquired by Comerica Bank in 2011. Mr. Martinez led Sterling Bancshares from its inception in 1980 to 2001 serving as its Chief Executive Officer, and continued as Chairman of the Board until 2004. Mr. Retzloff served on the board of directors of Sterling Bancshares from 1987 to 2006, including as Chairman of the Board from 1990 to 1992 and 2004 to 2005. Messrs. Martinez and Retzloff oversee an experienced senior management team, many of whom they worked with at Sterling Bancshares, including Ramon A. Vitulli, III, the President of Allegiance Bank, and Daryl D. Bohls, the Chief Credit Officer of Allegiance Bank.
Since we began operations in 2007, we have expanded our footprint to 18 branch locations and developed a strong lending team of approximately 60 lenders. We experienced strong growth from our formation and achieved profitability beginning in 2010, our third full year of operations. From December 31, 2007 to June 30, 2015, our book value per common share has increased from $9.62 to $19.37 per share, and our tangible book value per common share has increased from $9.62 to $14.79 per share.
As part of our continued growth, we intend to continue to expand our market position through organic growth, including the establishment of de novo branch locations and select acquisitions of other financial institutions. The following table summarizes, with preacquisition historical balances, our two acquisitions to date, both of which were Houston-based banks:
| Institution Acquired |
Date Completed |
Acquired Assets |
Acquired Loans |
Acquired Deposits |
Number of Branches |
|||||||||||||
| (Dollars in millions) | ||||||||||||||||||
| Independence Bank, N.A. |
November 13, 2013 | $ | 222.1 | $ | 132.4 | $ | 199.4 | 3 | ||||||||||
| F&M Bancshares |
January 1, 2015 | $ | 569.7 | $ | 410.2 | $ | 488.9 | 9 | * | |||||||||
47
Table of Contents
| * | Promptly following the closing, we consolidated two of the F&M Bancshares branches with two of our existing branches. In addition to the consolidation, we intend to sell two former F&M Bancshares branches and their related assets located in Central Texas if we can agree on terms satisfactory to us. We are actively marketing these two branches and expect to sell them in the next twelve months. We currently do not have a definitive agreement to sell these two branches. |
The following illustrates the impact of each of these acquisitions on our overall growth:
Note: For illustrative purposes, the assets acquired in the 2013 Independence acquisition and the F&M Bancshares acquisition are assumed to have stayed the same since each acquisition, respectively. The Company was formed on April 30, 2008 to serve as the holding company of the Bank.
Our Strategy
Our objective is to grow and strengthen our community banking franchise by deploying our super-community banking strategy and pursuing select strategic acquisitions in the Houston metropolitan area. We are positioning the Bank to be a leading provider of personalized commercial banking services by emphasizing the strength and capabilities of local bank office management and providing superior customer service. We have made the strategic decision to focus on the Houston metropolitan area because of our deep roots and experience operating through a variety of economic cycles in this large and vibrant market.
Super-community banking strategy. We focus on establishing personal relationships with customers through superior service, which we provide through responsive decision-making and empowering personnel to respond quickly to customers’ needs. We focus on lending to and banking with small to medium-sized businesses, for which we believe loans can be priced on terms that are more attractive to us than we would achieve by lending to larger businesses. We operate full-service decentralized branches and employ lenders with strong underwriting credentials who we authorize to make loan and underwriting decisions at the branch level up to prescribed limits. We support our branch operations with a centralized credit approval process for larger credit relationships, loan operations, information technology, core data processing, accounting, finance, treasury and treasury management support, deposit operations and executive/board oversight. Our strategy emphasizes community involvement by our directors, officers and employees, which further allows us to be responsive in developing products and services. This approach produces a clear competitive advantage by delivering an extraordinary customer experience and fostering a culture dedicated to achieving both superior external and internal service levels. Greater efficiency results from being focused on serving a select, but significant, portion of the overall banking market and on the operational leverage that results from a market share driven by geographic concentration.
48
Table of Contents
We plan to continue to emphasize our super-community banking strategy to organically grow our presence in the Houston metropolitan area through:
| • | increasing the productivity of our existing bankers, as measured by loans, deposits and fee income per banker, while enhancing profitability by leveraging our existing operating platform; |
| • | focusing on individualized and local decision-making, allowing us to provide customers with rapid decisions on loan requests, which we believe allows us to effectively compete with larger financial institutions; |
| • | identifying and hiring additional seasoned bankers in our existing and target markets in the Houston metropolitan area who will thrive under our super-community banking model, and opening additional branches where we are able to attract seasoned bankers; and |
| • | developing new products designed to serve an increasingly diversified Houston economy, while preserving our strong risk management culture. |
Select strategic acquisitions. We intend to complement our strong organic growth by continuing to pursue a disciplined acquisition strategy within the Houston metropolitan area. Our focus is on like-minded community banks with similar lending strategies. We believe that our management’s experience in assessing, executing and integrating target institutions will allow us to capitalize on acquisition opportunities.
Our Strengths
We believe that we are well positioned to execute our super-community banking strategy as a result of the following competitive strengths:
| • | Experienced senior management team. Our senior management team has a demonstrated track record of managing profitable organic growth, successfully executing and integrating acquisitions, improving operating efficiencies, maintaining a strong risk management culture and implementing a community-and service-focused approach to banking. Many of our senior management executives, lenders and employees served with Messrs. Martinez and Retzloff at Sterling Bancshares, overseeing its strong and profitable growth, which included numerous acquisitions. Our board of directors has many years of combined experience in serving as directors and/or officers of financial institutions. Our directors have a wide array of business experience and, as residents of our primary market area, participate in and support community activities, which is a significant asset to our business development efforts and enables our directors to be responsive to the needs of our customers. The interests of our executive officers and directors are aligned with our shareholders through meaningful ownership in us, with beneficial ownership by our executive officers and directors amounting to approximately 15.7% of our common stock as of August 3, 2015. |
| • | Scalable banking and operational platform designed to foster and accommodate significant growth. Utilizing the significant prior experience of our management team and employees, we believe that we have built a capable and knowledgeable staff; and we have made significant investments in the technology and systems necessary to build a scalable corporate infrastructure with the capacity to support continued growth. We believe that our strong capital and asset quality position will allow us to grow and that our scalable operating platform will allow us to manage that growth effectively, resulting in greater efficiency and enhanced profitability. For the six months ended June 30, 2015, our efficiency ratio was 67.0%. Excluding merger related expenses of $867 thousand in the first quarter of 2015 and $72 thousand in the second quarter of 2015 related to the F&M Bancshares acquisition, our efficiency ratio was 64.7% for the six months ended June 30, 2015. |
| • | Community-focused, full service relationships. We believe that our super-community banking strategy facilitates strong relationships with our customers. We actively solicit the deposit business of our consumer and commercial loan customers and seek to further leverage these relationships by cross- |
49
Table of Contents
| selling our products and services. We are able to achieve favorable loan yields and deposit rates that result in strong levels of net interest margin, which for the six months ended June 30, 2015 was 4.76% on a tax-equivalent basis. |
| • | Loans—By focusing on what we believe is an underserved segment of the market and providing rapid decisions on loan requests, we have been able to obtain favorable loan rates. Our average yield on loans was 5.77% for the six months ended June 30, 2015. |
| • | Deposits—Our emphasis on establishing a full service relationship with our customers has provided us with a significant supply of core deposits, including noninterest-bearing deposits. Noninterest-bearing deposits represented 34.2% of total deposits as of June 30, 2015. Low cost core deposits are an important driver of our profitability, as our average cost of deposits was 0.43% for the six months ended June 30, 2015. |
| • | Focus on seasoned lenders. Our team of seasoned lenders has been a significant component of our organic growth. Our officer compensation structure, which includes equity grants, profit sharing and various incentive programs, motivates our lenders to increase the size of their loan and deposit portfolios and generate fee income while maintaining strong credit quality. We believe that our officer compensation programs attract talented lenders to us. |
| • | Disciplined underwriting and credit administration. Our management, lending officers and credit administration team emphasize a strong risk management culture supported by comprehensive policies and procedures for credit underwriting, funding and administration that we believe has enabled us to maintain sound asset quality. Our underwriting methodology emphasizes analysis of global cash flow coverage, loan to collateral value, and obtaining personal guaranties in all but a few well-secured cases. Our tiered underwriting structure includes progressive levels of individual loan authority, concurrence authority and senior loan committee approval. We intend to continue to emphasize and adhere to these procedures and controls, which we believe have helped to minimize our level of loan charge-offs. Our average annual net charge-offs to average loans for 2012 through 2014 was 0.11%. |
| • | Diversified loan portfolio. Our focus on loans to small to medium-sized businesses results in a more diversified portfolio of relatively smaller loan relationships, thus reducing the risk that results from dependence on larger lending relationships. As of June 30, 2015, our average funded loan size was $259 thousand. We do not lend directly to oil and gas exploration and production companies and roughly 2.5% of our total loan portfolio is to customers in the oilfield services industry. Although we operate in the Houston metropolitan area, we believe that our lack of direct lending to oil and gas exploration and production companies and reserve-based lending will reduce the effect to our business in the event of a prolonged period of lower oil and gas prices. |
Our Market Area
Our primary market is the Houston metropolitan area, which has consistently been one of the most attractive metropolitan markets in the United States over the last 10 years in terms of both demographic and economic growth. The Houston metropolitan area has strong population and employment trends, and an economy supported by a diverse range of businesses.
Population Size and Growth Center. The Houston metropolitan area is the fifth most populous metropolitan area in the United States with 6.5 million people as of 2014 according to U.S. Census Bureau. The population of the Houston metropolitan area is projected to grow by 7.72% from 2015 to 2020, compared to 6.70% for the state of Texas and 3.52% for the United States, according to SNL Financial.
Leading Employment Growth. Since 2007, the Houston metropolitan area has grown nonagricultural employment 14.5%, well above the national average of 2.7% according to the BLS. In 2014 alone, the Houston metropolitan area added 120,600 jobs, outpacing national job growth in every measured sector according to the
50
Table of Contents
BLS. The Greater Houston Partnership or “GHP” reports that the Houston metropolitan area was also the first major metropolitan market to recover from the recession that began in late 2008 and has regained 381.6% of jobs lost since the trough, the highest of the 20 most populous metropolitan statistical areas. In addition, Houston’s unemployment rate has been resilient over the past few months. At the end of November 2014, when the price of West Texas Intermediate Crude (“WTI”) was approximately $66 a barrel, Houston unemployment was 4.5%, the eighth lowest for major metropolitan areas in the United States, and compared favorably to the national rate of 5.8%. At the end of April 2015, when the price of WTI was approximately $59 a barrel, unemployment improved to 4.0%, well below the national average of 5.4% giving Houston the 10th lowest unemployment rate among major metropolitan areas in the United States. During the twelve months ended June 30, 2015, the Houston metropolitan area was ranked eighth out of the 12 largest metropolitan areas in terms of nonagricultural employment growth, with growth of 1.9% compared to the national average of 2.1% according to the BLS.
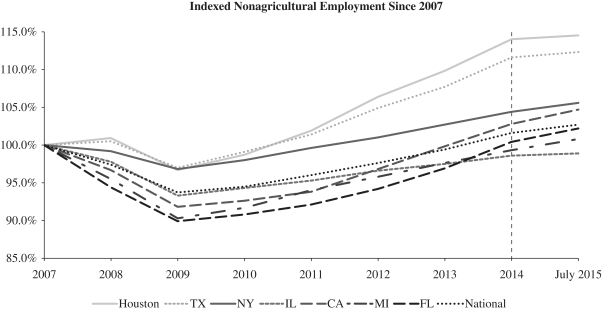
Source: U.S. Bureau of Labor Statistics
Robust Small Business Environment. Small businesses are a key driver of the Houston metropolitan area economy. According to the Houston Business Journal, there were 120,183 small businesses operating in Houston as of April 2014. Of these businesses, 119,005 were businesses with fewer than 100 employees, the ninth most nationwide. Houston also has the fourth most entrepreneurs per 100,000 people of any city in the country and consistently ranks as one of the top metropolitan areas for entrepreneurs according to Forbes. The GHP indicates that in 2013, the Houston metropolitan area had the fastest growing economy of the nation’s 50 most populous metropolitan areas.
Economic Diversity. The Houston metropolitan area has
a robust and increasingly diversified economy outside of the energy sector. According to the GHP, no single industry contributes more than 21% of gross area product in the Houston metropolitan area, with seven industries contributing at least 5%. In
2014, the largest number of new jobs came from the health care/education and construction sectors, which added 23,100 and 14,900 jobs, respectively, according to the BLS. The health care industry has been a long-term growth engine for the Houston
metropolitan area, which is home to 80 hospitals, including the world’s largest medical complex, the Texas Medical Center. Colliers International reports that more than 7.2 million patients visit the Texas Medical Center annually, with an
estimated regional annual economic impact of $15 billion. Construction experienced the
51
Table of Contents
fastest annual rate of job growth of any sector in 2014 of just under 20% according to the GHP. The GHP also indicates that the city of Houston issued $8.7 billion in construction permits in 2014, a 41% increase from 2013, and absorbed 5.5 million square feet of office space. Additionally, 17,600 multifamily units were delivered in Houston in 2014 with another 20,000 expected in 2015 according to the CBRE Group, and 2.4 million square feet of retail were delivered in 2014 with another 3.7 million square feet in 2015 according to the GHP, via Wulfe & Co. The following charts depict Houston’s gross area product and employment by industry segment as of summer 2014 and July 2015, respectively:
Source: GHP, via The Perryman Group and the BLS.
Houston’s increasingly diverse economy is important, particularly during times of lower oil and gas prices. Oil prices have been volatile in recent months, punctuated by a dramatic and rapid decline in prices for WTI Crude from nearly $105 per barrel in June 2014 to $53 per barrel at the end of 2014, a nearly 50% decline in six months. Despite a modest decline in oil prices through July 2015, we cannot predict whether prices have stabilized and whether or when prices will increase. Because the decline in oil and gas prices is still relatively recent, it is unclear how and to what degree such decline, or any prolonged period of lower oil and gas prices will impact Houston’s economy. Greater economic diversity and lower dependence on the energy sector in the future should mitigate the effect of oil price volatility on the Houston economy.
Country’s Largest Exporter. The Port of Houston was the nation’s largest export market, handling $353 billion of trade in 2014 according to the GHP. According to the GHP, the Port of Houston supports more than one million jobs and generates more than $56.5 billion in personal income, $17.9 billion in business revenue, and $4.5 billion of state and local taxes. According to Port of Houston Authority, the Port Authority has handled nearly 14 million tons of cargo between January 1 and July 28, 2015, up 20% for the year, while import steel was up more than 26% for the year through April. In 2011, the last year data is available from the Department of Commerce, 11,940 companies exported from Houston. Of those 11,940 companies, 11,068 were small or medium-sized exporters with fewer than 500 employees according to the Department of Commerce. The imminent completion of the Panama Canal expansion is expected to further increase activity at the Port of Houston.
Our Banking Services
We are focused on delivering a wide variety of high-quality, relationship-driven commercial and community-oriented banking products and services tailored to meet the needs of small to medium-sized businesses, professionals and individuals in the Houston metropolitan area. We provide our customers with a variety of banking services including checking accounts, savings accounts, certificates of deposit, bank-by-mail, cashier’s checks, travelers checks, gift cards, savings bonds, personal loans, automobile loans, commercial loans, mortgage loans, home improvement loans and online banking services. We also offer safe deposit boxes,
52
Table of Contents
automated teller machines, drive-through services and 24-hour depository facilities. Our deposits are insured by the FDIC to the fullest extent permitted by law. A general discussion of the range of our community banking products and other services we offer is presented in this “Business” section.
We believe that recent acquisitions of local financial institutions in the Houston metropolitan area by larger, more regionally focused competitors have led to a reduced number of locally based competitors. We believe this has created an underserved base of small and middle-market businesses and professionals that are interested in banking with a company headquartered in, and with decision-making authority based in, the Houston metropolitan area. We believe our management team’s long-standing presence and experience in the Houston metropolitan area gives us valuable insight into the local market and the ability to successfully recruit talented lenders. We seek to develop comprehensive, long-term banking relationships by cross-selling loans and core deposits, offering an array of products and services and delivering high quality customer service. Our products and services are tailored to the needs of our targeted customers.
We focus on continual internal growth, as each banking location is operated as a separate profit center, maintaining separate data with respect to its net interest income, efficiency ratio, deposit growth, loan growth and overall profitability. Bank office presidents and managers are accountable for performance in these areas and are compensated accordingly. We have centralized many of our critical operations, which are invisible to our customers, such as data and loan processing.
Lending Activities
We offer a wide range of commercial and retail lending services, including commercial loans, mortgage loans, home equity loans, personal loans and automobile loans, among others, specifically designed for small to medium-sized businesses and companies, professionals and individuals generally located within Texas and primarily in Houston. At June 30, 2015, we had total loans of approximately $1.56 billion, representing approximately 80.3% of our total assets.
The table below indicates the composition of our loan portfolio by type along with the outstanding balances, net of unearned income and fees, of each loan type in our portfolio as of the date indicated:
| As of June 30, 2015 | As of December 31, 2014 | |||||||||||||||
| Amount of Loans | Percentage | Amount of Loans | Percentage | |||||||||||||
| (Dollars in thousands) | ||||||||||||||||
| Loans held for sale(1) |
$ | 25,629 | 1.6 | % | $ | — | — | |||||||||
|
|
|
|
|
|
|
|
|
|||||||||
| Commercial and industrial |
$ | 427,958 | 27.4 | % | $ | 270,363 | 27.0 | % | ||||||||
| Real Estate: |
||||||||||||||||
| Commercial real estate (including multi-family residential) |
678,979 | 43.6 | % | 429,986 | 42.9 | % | ||||||||||
| Commercial real estate construction and land development |
140,437 | 9.0 | % | 85,484 | 8.5 | % | ||||||||||
| 1-4 family residential (including home equity) |
178,635 | 11.4 | % | 135,127 | 13.5 | % | ||||||||||
| Residential construction |
94,167 | 6.0 | % | 72,402 | 7.2 | % | ||||||||||
| Consumer and other |
15,852 | 1.0 | % | 8,692 | 0.9 | % | ||||||||||
|
|
|
|
|
|
|
|
|
|||||||||
| Total loans held for investment |
1,536,028 | 98.4 | % | 1,002,054 | 100.0 | % | ||||||||||
|
|
|
|
|
|
|
|
|
|||||||||
| Total loans |
1,561,657 | 100.0 | % | 1,002,054 | 100.0 | % | ||||||||||
|
|
|
|
|
|
|
|
|
|||||||||
| Allowance for loan losses |
(10,312 | ) | (8,246 | ) | ||||||||||||
|
|
|
|
|
|||||||||||||
| Loans, net |
$ | 1,551,345 | $ | 993,808 | ||||||||||||
|
|
|
|
|
|||||||||||||
| (1) | Consists of loans at two former F&M Bancshares locations in Central Texas acquired on January 1, 2015. We are actively marketing and intend to sell these two branches and their related assets if we can agree on terms satisfactory to us. As of June 30, 2015, loans held for sale consists of $9.2 million of commercial |
53
Table of Contents
| and industrial loans, $12.9 million of commercial real estate (including multifamily residential) loans, $2.7 million of l-4 family residential (including home equity) loans and $838 thousand of consumer and other loans. Loans held for sale are carried at lower of aggregate cost or fair value. |
Loan Types. A general description of the types of loans we offer (including loans held for sale) follows below.
Commercial and Industrial. We make commercial and industrial loans in our market area that are underwritten on the basis of the borrower’s ability to service the debt from income. We take as collateral a lien on any available real estate, equipment or other assets owned by the borrower and typically obtain a personal guaranty of the borrower or principal. In general, commercial loans involve more credit risk than residential mortgage loans and commercial mortgage loans and therefore typically bear a higher interest rate. The increased risk in commercial loans derives from the expectation that commercial and industrial loans generally are serviced principally from the operations of the business, which may not be successful, and from the type of collateral securing these loans. As a result, commercial and industrial loans require more extensive underwriting and servicing than other types of loans. Our commercial and industrial loans at June 30, 2015 totaled $437.2 million.
Commercial Real Estate (Including Multi-Family Residential). We make loans are primarily loans secured by real estate, including commercial and residential construction, owner-occupied and nonowner-occupied and multi-family commercial real estate, raw land and other real estate based loans.
Our nonowner-occupied and multi-family commercial real estate lending typically involves higher loan principal amounts and the repayment of these loans is dependent, in large part, on sufficient income from the properties securing the loans to cover operating expenses and debt service. We generally require the borrower to establish a deposit relationship with us or, if already an existing customer, have a proven record of success. In addition, these loans are guaranteed by individual owners of the borrower and have typically lower loan to value ratios.
Loans secured by owner-occupied properties generally involve less risk and represented $364.7 million, or 52.7% of the outstanding principal balance of our commercial real estate (including multi-family) loans at June 30, 2015. We are dependent on the cash flows of the business occupying the property and its owners and require these loans to be secured by property with adequate margins and to be guaranteed by the individual owners. Our owner-occupied commercial real estate loans collateralized by first liens on real estate, typically have fixed interest rates and amortize over a 10 to 20 year period. Our commercial real estate (including multi-family residential) loans at June 30, 2015 totaled $691.8 million.
Commercial Real Estate Construction and Land Development and Residential Construction. We make loans to finance the construction of residential and, to a lesser extent, nonresidential properties. Construction loans generally are collateralized by first liens on real estate and generally have fixed interest rates. Underwriting guidelines similar to those described above are also used in our construction lending activities.
Construction loans involve additional risks as they often involve the disbursement of funds with the repayment dependent on the successful completion of the project. We conduct periodic inspections, either directly or through an agent, prior to approval of periodic draws on these loans. Sources of repayment for these loans may be pre-committed permanent financing or sale of the developed property. The loans in this portfolio are monitored closely by management. Due to uncertainties inherent in estimating construction costs, the market value of the completed project and the effects of governmental regulation on real property; it can be difficult to accurately evaluate the total funds required to complete a project and the related loan to value ratio. As a result of these uncertainties, construction lending often involves the disbursement of substantial funds with repayment dependent, in part, on the success of the ultimate project rather than the ability of a borrower or guarantor to repay the loan. If we are forced to foreclose on a project prior to completion, there is no assurance that we will be
54
Table of Contents
able to recover all of the unpaid portion of the loan. In addition, we may be required to fund additional amounts to complete a project and may have to hold the property for an indeterminate period of time. Our commercial real estate construction and land development loans and residential construction loans at June 30, 2015 totaled $140.4 million and $94.2 million, respectively.
1-4 Family Residential (Including Home Equity). Our lending activities also include the origination of 1-4 family residential mortgage loans (including home equity, home improvement and home equity line of credit, or “HELOC,” loans) collateralized by owner-occupied residential properties located in our market areas. We offer a variety of mortgage loan portfolio products which have a term of 5 to 7 years and generally amortize over 10 to 20 years. Loans collateralized by 1-4 family residential real estate generally have been originated in amounts of no more than 90% of appraised value. Our 1-4 family residential (including home equity) loans at June 30, 2015 totaled $181.4 million.
Consumer and Other. We make a variety of loans to individuals for personal and household purposes including secured and unsecured installment and term loans, home improvement loans, home equity loans and home equity lines of credit. Consumer loans are underwritten based on the individual borrower’s income, current debt level, past credit history and the value of any available collateral. Our consumer and other loans at June 30, 2015 totaled $16.7 million.
Credit Administration and Loan Review
Certain credit risks are inherent in making loans and managing these risks is a company-wide process. These include repayment risks, risks resulting from uncertainties in the future value of collateral, risks resulting from changes in economic and industry conditions and risks inherent in dealing with individual borrowers. We attempt to mitigate repayment risks by adhering to internal credit policies and procedures.
We have several procedures in place to assist us in maintaining the overall quality of our loan portfolio. Our strategy for credit risk management includes a conservative underwriting process. Our board of directors has established underwriting guidelines to be followed by our officers, and we monitor delinquency levels for any negative or adverse trends. There can be no assurance, however, that our loan portfolio will not become subject to increasing pressures from deteriorating borrower credit due to general economic conditions or other factors.
We implement our underwriting policy through a tiered system of individual loan authority for our loan officers and a loan committee approval structure. Lending officers are assigned various levels of authority based upon their respective levels of experience and expertise. Loans with relationships over the lending authority of the loan officer must be approved by a structured concurrence approval process or, based on the loan relationship size, by the Bank’s Executive Loan Committee, comprised of senior management of the Bank. Loans exceeding the authority of the Bank’s Executive Loan Committee must be approved by the Bank’s board of directors. The Bank’s Executive Loan Committee meets weekly or more frequently if required to evaluate applications for new and renewed loans, or modifications to loans, in which the loan relationship is above an individual loan officer’s approval authority. Our strategy in considering a loan is to follow conservative and consistent underwriting practices, which include:
| • | knowing our customers to ensure a complete understanding of their financial condition and ability to repay the loan; |
| • | verifying that primary and secondary sources of repayment are adequate in relation to the amount of the loan; |
| • | developing and maintaining targeted levels of diversification for our loan portfolio as a whole and for loans within each category; and |
| • | ensuring that each loan is properly documented with perfected liens on collateral, and that any insurance coverage requirements are satisfied. |
As part of the underwriting process, we seek to minimize risk in a variety of ways, including the following:
| • | analyzing the borrower’s financial condition, cash flow, liquidity, and leverage; |
| • | assessing the company’s operating history, operating projections, location and condition; |
55
Table of Contents
| • | reviewing appraisals, title commitment and environmental reports; |
| • | considering the management experience and financial strength of the principals of the borrower; and |
| • | evaluating economic trends and industry conditions. |
Lending Limits
Our lending activities are subject to a variety of lending limits imposed by state and federal law. In general, we are subject to a legal limit on loans to a single borrower equal to 25% of the Bank’s Tier 1 capital or 40% of its Tier 1 capital if the amount that exceeds 25% is secured by readily marketable collateral, as determined by reliable and continuously available price quotations. This limit increases or decreases as the Bank’s capital increases or decreases. In order to ensure compliance with legal lending limits and in accordance with our strong risk management culture, we maintain internal lending limits that are significantly less than the legal lending limits. We are able to sell participations in our larger loans to other financial institutions, which allows us to manage the risk involved in these loans and to meet the lending needs of our customers requiring extensions of credit in excess of these limits. Regulatory and supervisory loan-to-value limits are established by the Federal Deposit Insurance Corporation Improvement Act of 1991. The Bank’s internal loan-to-value limitations follow these limits.
Deposit Products
Deposits are our principal source of funds for use in lending and other general banking purposes. We offer a variety of deposit products and services that are consistent with the goal of attracting a wide variety of customers, with an emphasis on small to medium-sized businesses. The types of deposit accounts that we offer are typical of most commercial banks and consist of checking accounts, commercial accounts, savings accounts and other time deposits of various types, ranging from daily money market accounts to longer-term certificates of deposit. We actively pursue business checking accounts by offering our business customers competitive rates, telephone banking, online banking and other convenient services to our business customers.
Other Banking Services
We offer basic banking products and services that we believe are attractively priced and easily understood by the customer. We focus on making our products and services convenient and readily accessible to the customer. In addition to banking during normal business hours, we offer extended drive-through hours, ATMs, and banking by telephone, mail, internet and personal appointment. We also provide debit card services, cash management services, wire transfer services and offer night depository, direct deposits, cashier’s and travelers checks and letters of credit. We have continued our established relationships with correspondent banks and other independent financial institutions to provide other services requested by customers, including loan participations sold where the requested loan amount exceeds the lending limits in our lending policies. We offer customers convenient telephonic access to their accounts. We maintain an internet banking website that allows customers to obtain account balances and transfer funds among accounts. The website also provides online bill payment and electronic delivery of customer statements.
Competition
We compete in the highly competitive commercial banking industry solely through the Bank and firmly believe that the Bank’s presence in the community and personal service philosophy enhances our ability to attract and retain customers. The Bank faces strong direct competition for deposit funds, lending opportunities, talented lenders, acquisition candidates and other financial-related services. We compete with other commercial banks, thrifts and credit unions.
We compete for loans primarily with other commercial banks, savings banks, savings and loan associations, credit unions, finance companies, mutual funds, insurance companies, brokerage and investment banking firms, asset-based nonbank lenders and certain other nonfinancial entities, including retail stores which may maintain their own credit programs and certain governmental organizations, all of which are actively engaged in providing various types of loans and other financial services that may offer more favorable financing than we are able to
56
Table of Contents
offer. Although some of our competitors are situated locally, others have statewide or nationwide presence. We believe that we are able to compete effectively with other financial institutions because of our banking professionals, the range and quality of products that we offer, our responsive decision-making with respect to loans and our emphasis on customer service, establishing strong customer relationships and building customer loyalty that distinguishes us from our competitors.
We rely heavily on the continued business generation of our bankers and the efforts of our officers and directors for the solicitation and referral of potential customers and we expect this to continue for the foreseeable future. According to the FDIC, as of June 30, 2014, we had the 6th largest deposit market share in the zip codes in which we operate. We believe that our strong market share in our zip codes of operation is a reflection of our ability to compete with more prominent banking franchises in our markets.
Our Employees
As of June 30, 2015, we employed approximately 289 full time and 15 part time employees. None of our employees were represented by a collective bargaining unit or party to a collective bargaining agreement. We believe that our relationships with our employees are good.
57
Table of Contents
Our Properties
Our principal executive offices are located at our West Belt Corporate office at 8847 W. Sam Houston Parkway N., Suite 200, Houston, Texas 77040. We currently lease approximately 15,248 square feet of office space at this location, which houses our corporate and back office operations. This office includes a drive through facility attached to the building. As of June 30, 2015, we had 19 locations, one of which is our corporate office, 16 branches located in the Houston metropolitan area and two branches located in Central Texas. The following table sets forth a list of our 18 branch locations and one corporate support office.
| Houston Metropolitan Area Locations | |||||||||||||
| Office |
Location |
Own or Lease | Square Feet | ||||||||||
| 290 Office |
13100 Northwest Freeway, Suite 100 Houston, Texas 77040 |
Lease | 11,312 | ||||||||||
| Bellaire Office |
5410 Bellaire Blvd., Suite B Bellaire, Texas 77401 |
Lease | 4,010 | ||||||||||
| Brookshire Office |
550 FM 1489 Brookshire, Texas 77423 |
Own | 4,000 | ||||||||||
| Clear Lake Office |
2200 NASA Road One, Suite 100 Houston, Texas 77058 |
Lease | 5,945 | ||||||||||
| Eldridge Office |
2401 Eldridge Parkway South Houston, Texas 77077 |
Own | 4,530 | ||||||||||
| Galleria Office |
1455 West Loop South, Suite 150 Houston, Texas 77027 |
Lease | 4,864 | ||||||||||
| Gulf Freeway Office |
7125 Gulf Freeway Houston, Texas 77087 |
Own | 4,900 | ||||||||||
| Heights Office |
2222 North Durham Houston, Texas 77008 |
Own | 4,666 | ||||||||||
| Katy Office |
520 Westgreen Blvd. Katy, Texas 77450 |
Own | 4,811 | ||||||||||
| Katy-Pin Oak Office |
722 Pin Oak Road Katy, Texas 77494 |
Lease | 5,102 | ||||||||||
| Kirby Office |
3963 Kirby Drive Houston, Texas 77098 |
Lease | 4,938 | ||||||||||
| Memorial Spring Branch Office |
8800 Katy Freeway, Suite 110 Houston, Texas 77024 |
Lease | 8,348 | ||||||||||
| North Loop Office |
1405 North Loop West Houston, Texas 77008 |
Own | 6,000 | ||||||||||
| Town & Country Office |
650 W. Bough Lane, Suite 140 Houston, Texas 77024 |
Lease | 1,663 | ||||||||||
| West Belt Office |
8727 W. Sam Houston Parkway N. Houston, Texas 77040 |
Lease | 22,412 | ||||||||||
| West Belt Corporate Office* |
8847 W. Sam Houston Parkway N., Suite 200 Houston, Texas 77040 |
Lease | 15,248 | ||||||||||
| Woodway West Office |
6363 Woodway Drive Houston, Texas 77057 |
Lease | 6,123 | ||||||||||
58
Table of Contents
| Central Texas Locations** | ||||||||||||
| Office |
Location |
Own or Lease | Square Feet | |||||||||
| Mart Office** |
714 E. Texas Avenue Mart, Texas 76664 |
Own | 3,100 | |||||||||
| Rosebud Office** |
339 Main Street Rosebud, Texas 76570 |
Own | 3,000 | |||||||||
| * | Our West Belt Corporate Office is not a banking location. |
| ** | We intend to sell these two former F&M Bancshares branches and their related assets located in Central Texas, which we acquired on January 1, 2015, if we can agree on terms satisfactory to us. We are actively marketing these two branches and expect to sell them in the next twelve months. We currently do not have a definitive agreement to sell these two branches. |
Legal Proceedings
From time to time we are subject to claims and litigation arising in the ordinary course of business. At this time, in the opinion of management, we are not party to any legal proceedings the resolution of which we believe would have a material adverse effect on our business, prospects, financial condition, liquidity, results of operation, cash flows or capital levels. However, one or more unfavorable outcomes in any claim or litigation against us could have a material adverse effect for the period in which such claim or litigation is resolved. In addition, regardless of their merits or their ultimate outcomes, such matters are costly, divert management’s attention and may materially adversely affect our reputation, even if resolved in our favor. We intend to defend ourselves vigorously against any future claims or litigation.
59
Table of Contents
MANAGEMENT’S DISCUSSION AND ANALYSIS OF FINANCIAL CONDITION
AND RESULTS OF OPERATIONS
The following discussion and analysis of our financial condition and results of operations for the six months ended June 30, 2015 and 2014 and for the years ended December 31, 2014 and 2013 should be read in conjunction with “Selected Historical Consolidated Financial Data” and our consolidated financial statements and the accompanying notes included elsewhere in this prospectus. This discussion and analysis contains forward-looking statements that are subject to certain risks and uncertainties and are based on certain assumptions that we believe are reasonable but may prove to be inaccurate. Certain risks, uncertainties and other factors, including those set forth under “Forward-Looking Statements,” “Risk Factors” and elsewhere in this prospectus, may cause actual results to differ materially from those projected results discussed in the forward-looking statements appearing in this discussion and analysis. We assume no obligation to update any of these forward-looking statements.
Overview
We are a Texas corporation and a registered bank holding company headquartered in Houston, Texas. Through our wholly-owned subsidiary, Allegiance Bank, we provide a diversified range of commercial banking services primarily to Houston metropolitan area-based small to medium-sized businesses and individual customers. We currently operate 16 full-service banking locations in the Houston metropolitan area and two full-service banking locations in Central Texas.
On January 1, 2015, we completed the acquisition of F&M Bancshares and its subsidiary bank, Enterprise Bank. The results for the six months ended June 30, 2015 reflect the combined entity. The impact of this acquisition is not reflected in the discussion and analysis of our financial condition and results of operations as of and for the year ended December 31, 2014. In addition to the impact of the acquisition of F&M Bancshares, the comparability of our consolidated results of operations for the years ended December 31, 2014 and 2013 is affected by our acquisition of Independence Bank, National Association (“Independence”) during the fourth quarter of 2013. The results of the acquired operations of Independence were included in our results of operations for only a portion of 2013, as compared to the full year in 2014.
We generate most of our revenues from interest income on loans, service charges on customer accounts and interest income from investments in securities. We incur interest expense on deposits and other borrowed funds and noninterest expenses such as salaries and employee benefits and occupancy expenses. Net interest income is the difference between interest income on earning assets such as loans and securities and interest expense on liabilities such as deposits and borrowings that are used to fund those assets. Net interest income is our largest source of revenue. To evaluate net interest income, we measure and monitor (1) yields on our loans and other interest-earning assets, (2) the interest expenses of our deposits and other funding sources, (3) our net interest spread and (4) our net interest margin. Net interest spread is the difference between rates earned on interest-earning assets and rates paid on interest-bearing liabilities. Net interest margin is calculated as net interest income divided by average interest-earning assets. Because noninterest-bearing sources of funds, such as noninterest-bearing deposits and stockholders’ equity also fund interest-earning assets, net interest margin includes the benefit of these noninterest-bearing sources.
Our net interest income is affected by changes in the amount and mix of interest-earning assets and interest-bearing liabilities, referred to as a “volume change.” Periodic changes in the volume and types of loans in our loan portfolio are affected by, among other factors, economic and competitive conditions in Texas and specifically in the Houston metropolitan area, as well as developments affecting the real estate, technology, financial services, insurance, transportation, manufacturing and energy sectors within our target market and throughout the state of Texas. We have recognized increased net interest income due primarily to an increase in the volume of our interest-earning assets.
60
Table of Contents
Our net interest income is also affected by changes in yields earned on interest-earning assets and rates paid on interest-bearing deposits and other borrowed funds, referred to as a “rate change.” Fluctuations in market interest rates are driven by many factors, including governmental monetary policies, inflation, deflation, macroeconomic developments, changes in unemployment, the money supply, political and international conditions and conditions in domestic and foreign financial markets.
Recent Developments
On July 15, 2015, we redeemed all of the outstanding shares of Series A and Series B preferred stock for an aggregate redemption price of $11.7 million (which is the sum of the liquidation amount plus accrued and unpaid dividends up to, but excluding the redemption date). We issued the shares of Series A and Series B preferred stock in connection with the F&M Bancshares acquisition, which had preferred stock outstanding pursuant to the U.S. Treasury’s Troubled Asset Relief Program. We funded the redemption with cash on hand.
Third Quarter 2015 Update
We expect to report net income in the range of $4.0 million to $4.3 million and net income attributable to common stockholders in the range of $3.8 million to $4.1 million for the three months ended September 30, 2015 as compared to net income of $3.9 million and net income attributable to common stockholders of $3.6 million for the three months ended June 30, 2015. The expected increase in net income is primarily attributable to growth in outstanding loan balances, a corresponding increase in net interest income and efficiencies achieved through our continued integration of F&M Bancshares. For the period from June 30, 2015 to September 15, 2015, average loans increased $92.7 million to $1.57 billion from $1.48 billion for the three months ended June 30, 2015.
We expect to report diluted earnings per share in the range of $0.40 to $0.43 for the three months ended September 30, 2015. We expect to report tangible book value per common share in the range of $15.34 to $15.37 as of September 30, 2015.
We have provided a range, rather than a specific amount, for certain of the preliminary results described above primarily because our financial closing procedures for the three months ending September 30, 2015 are not yet complete. We expect to complete our closing procedures with respect to the three months ending September 30, 2015 after the completion of this offering. These closing procedures could result in material changes to our preliminary estimates indicated above. The foregoing estimates constitute forward-looking statements and are subject to risks and uncertainties, including those described under “Risk Factors” in this prospectus. Accordingly, our final results for the three month period ending September 30, 2015 may not be consistent with the foregoing estimates. See “Risk Factors—Risks Related to Our Business” and “Forward-Looking Statements.”
Acquisition of Farmers & Merchants Bancshares, Inc.
On January 1, 2015, we completed our acquisition of F&M Bancshares and its wholly-owned subsidiary Enterprise Bank. In connection with the acquisition, we acquired seven additional banking locations in the Houston metropolitan area as well as two banking locations in Central Texas. During the first quarter of 2015, we consolidated two of the seven Houston metropolitan area locations that we acquired due to the close proximity of these locations to our existing banking locations. In addition to the consolidation, we intend to sell two former F&M Bancshares branches and their related assets located in Central Texas if we can agree on terms satisfactory to us. We currently do not have a definitive agreement to sell these two branches. With the acquisition, we continued to expand our geographic footprint within attractive areas of the Houston metropolitan area and added 18 lenders to our team. As of December 31, 2014, F&M Bancshares, on a consolidated basis, reported total assets of $569.7 million, total loans of $410.2 million and total deposits of $488.9 million. Because the acquisition closed on January 1, 2015, our historical financial condition and results of operations as of and for periods ending on or before December 31, 2014 contained in this prospectus do not reflect the financial condition and results of operations of F&M Bancshares.
61
Table of Contents
In connection with the acquisition of F&M Bancshares, we incurred approximately $29.3 million in indebtedness, including borrowing approximately $18.0 million under our revolving credit facility to repay debt that F&M Bancshares owed to its shareholders and the assumption of junior subordinated debentures with an aggregate original principal amount of $11.3 million issued to two statutory trusts.
As of June 30, 2015, we are actively marketing the two Central Texas locations for sale. The loans are presented as loans held for sale on the balance sheet. The branch assets held for sale are reported on the balance sheet and include accrued interest receivable and premises and equipment for these two respective locations.
Critical Accounting Policies
Our accounting policies are integral to understanding our results of operations. Our accounting policies are described in greater detail in Note 1 to our annual and interim consolidated financial statements included elsewhere is this prospectus. We believe that of our accounting policies, the following may involve a higher degree of judgment and complexity:
Securities
Debt securities are classified as available for sale when they might be sold before maturity. Securities available for sale are carried at fair value. Unrealized gains and losses are excluded from earnings and reported, net of tax, as a separate component of stockholders’ equity until realized. Securities within the available for sale portfolio may be used as part of our asset/liability strategy and may be sold in response to changes in interest rate risk, prepayment risk or other similar economic factors.
Interest earned on these assets is included in interest income. Interest income includes amortization of purchase premium or discount. Premiums and discounts on securities are amortized on the level-yield method, except for mortgage backed securities where prepayments are anticipated. Gains and losses on sales are recorded on the trade date and determined using the specific identification method.
Management evaluates debt securities for other-than-temporary impairment (“OTTI”) on at least a quarterly basis, and more frequently when economic or market conditions warrant such an evaluation. For securities in an unrealized loss position, management considers the extent and duration of the unrealized loss, and the financial condition and near-term prospects of the issuer. Management also assesses whether it intends to sell, or it is more likely than not that it will be required to sell, a security in an unrealized loss position before recovery of its amortized cost basis. If either of the criteria regarding intent or requirement to sell is met, the entire difference between amortized cost and fair value is recognized as impairment through earnings. For debt securities that do not meet the aforementioned criteria, the amount of impairment is split into two components as follows: (1) OTTI related to credit loss, which must be recognized in the income statement, and (2) OTTI related to other factors, which is recognized in other comprehensive income, net of applicable taxes. The credit loss is defined as the difference between the present value of the cash flows expected to be collected and the amortized cost basis. The previous amortized cost basis less the OTTI recognized in earnings becomes the new amortized cost basis of the security.
Loans Held for Investment
Loans held for investment are those that management has the intent and ability to hold for the foreseeable future or until maturity or payoff are reported at the principal balance outstanding, net of deferred loan fees and costs, and an allowance for loan losses. Loans are typically secured by specific items of collateral including business assets, consumer assets, and commercial and residential real estate. Commercial loans are expected to be repaid from cash flow from operations of businesses. Interest income is accrued on the unpaid principal balance.
62
Table of Contents
Nonperforming and Past Due Loans
Loans are placed on nonaccrual status when payment in full of principal or interest is not expected or upon which principal or interest has been in default for a period of 90 days or more unless the asset is both well secured and in the process of collection. If the decision is made to continue accruing interest on the loan, periodic reviews are made to confirm the accruing status of the loan. Nonaccrual loans and loans past due 90 days include both smaller balance homogeneous loans that are collectively evaluated for impairment and individually classified impaired loans.
When available information confirms that specific loans, or portions thereof, are uncollectible, these amounts are charged off against the allowance. All loan types are considered delinquent after 30 days past due and are typically charged off no later than 120 days past due, with consideration of the following guidelines in determining the need and ultimate timing of the charge-off: 1) the Bank is in the process of repossession and there appears to be a likely deficiency, 2) the collateral securing the loan has been sold and there is an actual deficiency, 3) the Bank is proceeding with lengthy legal action to collect its balance, 4) the borrower has left the service area and is unable to be located, or 5) the borrower has filed bankruptcy and the Bank is either in an unsecured or weak collateral position. Confirming events requiring charge-offs occur when a shortfall is identified between the recorded investment in the loan and the underlying value of the collateral on a collateral dependent loan.
Allowance for Loan Losses
The allowance for loan losses is a valuation allowance that is established through charges to earnings in the form of a provision for loan losses. The amount of the allowance for loan losses is affected by the following: (1) charge-off of loans that decrease the allowance, (2) subsequent recoveries on loans previously charged off that increase the allowance and (3) provisions for loan losses charged to earnings that increase the allowance.
Throughout the year, management estimates the probable incurred losses in the loan portfolio to determine if the allowance for loan losses is adequate to absorb such losses. The allowance for loan losses consists of specific and general components. The specific component relates to loans that are individually classified as impaired. We follow a loan review program to evaluate the credit risk in the loan portfolio. Loans that have been identified as impaired are reviewed on a quarterly basis in order to determine whether a specific reserve is required. The general component covers non-impaired loans and is based on industry and our specific historical loan loss experience, volume, growth and composition of the loan portfolio, the evaluation of our loan portfolio through our internal loan review process, general current economic conditions both internal and external to us that may affect the borrower’s ability to pay, value of collateral and other qualitative relevant risk factors. Based on a review of these estimates, we adjust the allowance for loan losses to a level determined by management to be adequate. Estimates of loan losses are inherently subjective as they involve an exercise of judgment.
Our allowance for loan losses, both in dollars and as a percentage of total loans, may not be comparable to other similar sized institutions due to the impact of acquisition accounting. As part of acquisition accounting, acquired loans are initially recognized at fair value with no corresponding allowance for loan losses. Initial fair value of the loans includes consideration of expected credit losses.
Loans, for which the terms have been modified, and for which the borrower is experiencing financial difficulties, are considered troubled debt restructurings and therefore classified as impaired. Subsequent to identification as a troubled debt restructuring, such loans are then evaluated for impairment on an individual basis whereby we determine the amount of reserve in accordance with the accounting policy for the impaired loans as part of our allowance for loan losses calculation. If a loan is impaired, a specific valuation allowance is allocated, if necessary, so that the loan is reported net, at the present value of estimated future cash flows using the loan’s existing rate or at the fair value of collateral if repayment is expected solely from the collateral.
63
Table of Contents
Accounting for Acquired Loans
At acquisition, we evaluate loans to determine if they are purchase credit impaired loans. Purchased credit impaired loans are those acquired loans with evidence of credit deterioration for which it was probable at acquisition that we would be unable to collect all contractual payments. We make this determination by considering past due and/or nonaccrual status, prior designation of a troubled debt restructuring, or other factors that may suggest we will not be able to collect all contractual payments. Purchased credit impaired loans are initially recorded at fair value with the difference between fair value and estimated future cash flows accreted over the expected cash flow period as income only to the extent we can reasonably estimate the timing and amount of future cash flows. In this case, these loans would be classified as accruing. In the event we are unable to reasonably estimate timing and amount of future cash flows, the loan is classified as non-accrual. An acquired loan previously classified by the seller as a troubled debt restructuring is no longer classified as such at the date of acquisition. Past due status is reported based on contractual payment status.
Our purchase credit impaired loans have generally been de minimis and comprised 0.1% of our loan portfolio at June 30, 2015. Historically, purchased credit impaired loans have been placed on nonaccrual status and reported as such until we are able to reasonably estimate the timing and amount of future expected cash flows. Income associated with purchased credit impaired loans for 2015 and prior periods has been immaterial.
All loans not otherwise classified as purchase credit impaired are recorded at fair value with the discount to contractual value accreted over the life of the loan. When determining the allowance for loan losses on acquired loans, we bifurcate the allowance between legacy loans and acquired loans. Loans remain designated as acquired until either (i) loan is renewed or (ii) loan is substantially modified whereby modification results in a new loan. When determining the allowance on acquired loans, the Company estimates principal losses as compared to the Company’s recorded investment, with the recorded investment being net of any unaccreted discounts from the acquisition. At June 30, 2015, we had $387.7 million in acquired loans that have not been renewed or substantially modified which is net of an unaccreted discount of $3.5 million or 0.91%.
Goodwill
Goodwill resulting from business combinations is generally determined as the excess of the fair value of the consideration transferred, plus the fair value of any noncontrolling interests in the acquiree, over the fair value of the net assets acquired and liabilities assumed as of the acquisition date. Goodwill is assessed annually for impairment or when events or changes in circumstances indicate that the carrying amount of the asset may not be recoverable.
Goodwill acquired in a purchase business combination that is determined to have an indefinite useful life, is not amortized, but tested for impairment as described above. We perform our annual impairment test on October 1st. Goodwill is the only intangible asset with an indefinite life on our balance sheet.
Recently Issued Accounting Pronouncements
ASU 2014-09 “Revenue from Contract with Customers (Topic 606).” ASU 2014-09 supersedes the revenue recognition requirements in Revenue Recognition (Topic 605), and most industry-specific guidance throughout the Industry Topics of the Codification. The core principle of ASU 2014-09 is that an entity should recognize revenue to depict the transfer of promised goods or services to customers in an amount that reflects the consideration to which the entity expects to be entitled in exchange for those goods or services. ASU 2014-09 is effective for us beginning after January 1, 2018, subject to delay that has been proposed by the Financial Accounting Standards Board, with retrospective application to each prior reporting period presented. We are still evaluating the potential impact on our financial statements.
ASU 2014-04 “Receivables—Troubled Debt Restructurings by Creditors (Subtopic 310-40)—Reclassification of Residential Real Estate Collateralized Consumer Mortgage Loans upon Foreclosure.” ASU 2014-04 intends to reduce diversity by clarifying that an in substance repossession or foreclosure occurs when a
64
Table of Contents
creditor is considered to have received physical possession of residential real estate property collateralizing a consumer mortgage loan such that the loan receivable should be derecognized and the real estate property recognized. ASU 2014-04 became effective for us on January 1, 2015 and did not have a material impact on our financial statements.
Results of Operations
Net Interest Income
Six months ended June 30, 2015 compared with six months ended June 30, 2014. Net interest income before the provision for loan losses for the six months ended June 30, 2015 was $38.5 million compared with $22.1 million for the six months ended June 30, 2014, an increase of $16.4 million, or 74.2%. The increase in net interest income was primarily due to the increase in average interest-earning assets of $593.8 million or 56.6% for the six months ended June 30, 2015 compared with the six months ended June 30, 2014. The increase in our average interest-earning assets during the first six months of 2015 as compared to the same period in 2014 was primarily the result of the acquisition of F&M Bancshares which was completed on January 1, 2015, as well as organic growth in our loan portfolio.
Interest income was $42.7 million for the six months ended June 30, 2015, an increase of $17.9 million compared with the six months ended June 30, 2014 primarily due to an increase of $17.7 million of interest income and fees on loans during the six months ended June 30, 2015 compared to the same period in 2014 as a result of the increase in average loans outstanding of $574.5 million for the same period. Additionally, during the six months ended June 30, 2015, we benefitted from acquisition accounting loan discount accretion of $2.4 million.
Interest expense was $4.2 million for the six months ended June 30, 2015, an increase of $1.5 million compared to the six months ended June 30, 2014. This increase was primarily due to an increase in average interest-bearing liabilities of $377.8 million for the six months ended June 30, 2015 compared to the six months ended June 30, 2014. The increase was also impacted by the addition of $18.0 million, on our borrowing agreement with another financial institution, on January 1, 2015, to repay debt acquired from F&M Bancshares. Additionally, we assumed $11.3 million of junior subordinated debentures as part of the acquisition of F&M Bancshares on January 1, 2015.
Tax equivalent net interest margin, defined as net interest income adjusted for tax-free income divided by average interest-earning assets, for the six months ended June 30, 2015 was 4.76%, an increase of 50 basis points compared to 4.26% for the six months ended June 30, 2014. Tax equivalent adjustments to net interest margin are the result of increasing income from tax-free securities by an amount equal to the taxes that would have been paid if the income were fully taxable based on a 35% federal tax rate, thus making tax-exempt yields comparable to taxable asset yields. The impact of acquisition accounting adjustments of $2.6 million on the tax equivalent net interest margin was an increase of 34 basis points for the six months ended June 30, 2015. The tax equivalent net interest margin for the three months ended June 30, 2015 was 4.79% compared to 4.72% for the three months ended March 31, 2015. Excluding acquisition accounting adjustments of $1.2 million for the three months ended June 30, 2015 and $1.4 million for the three months ended March 31, 2015, would have resulted in tax equivalent net interest margins of 4.49% and 4.38%, respectively.
65
Table of Contents
The following table presents, for the periods indicated, the total dollar amount of average balances, interest income from average interest-earning assets and the resultant yields, as well as the interest expense on average interest-bearing liabilities, expressed both in dollars and rates. Average outstanding balances were calculated in accordance with the description previously provided in the “Selected Historical Consolidated Financial Data”. Any nonaccruing loans have been included in the table as loans carrying a zero yield.
| For the Six Months Ended June 30, | ||||||||||||||||||||||||
| 2015 | 2014 | |||||||||||||||||||||||
| Average Outstanding Balance |
Interest Earned/ Interest Paid |
Average Yield/Rate |
Average Outstanding Balance |
Interest Earned/ Interest Paid |
Average Yield/Rate |
|||||||||||||||||||
| (Dollars in thousands) | ||||||||||||||||||||||||
| Assets |
||||||||||||||||||||||||
| Interest-Earning Assets: |
||||||||||||||||||||||||
| Loans(3) |
$ | 1,447,629 | $ | 41,385 | 5.77 | % | $ | 873,150 | $ | 23,698 | 5.47 | % | ||||||||||||
| Securities |
110,355 | 1,160 | 2.12 | % | 89,469 | 929 | 2.09 | % | ||||||||||||||||
| Deposits in other financial institutions |
85,162 | 124 | 0.29 | % | 86,747 | 173 | 0.40 | % | ||||||||||||||||
|
|
|
|
|
|
|
|
|
|||||||||||||||||
| Total interest-earning assets |
1,643,146 | $ | 42,669 | 5.24 | % | 1,049,366 | $ | 24,800 | 4.77 | % | ||||||||||||||
|
|
|
|
|
|
|
|
|
|||||||||||||||||
| Allowance for loan losses |
(8,881 | ) | (6,742 | ) | ||||||||||||||||||||
| Noninterest-earning assets |
210,533 | 109,122 | ||||||||||||||||||||||
|
|
|
|
|
|||||||||||||||||||||
| Total assets |
$ | 1,844,798 | $ | 1,151,746 | ||||||||||||||||||||
|
|
|
|
|
|||||||||||||||||||||
| Liabilities and Stockholders’ Equity |
||||||||||||||||||||||||
| Interest-Bearing Liabilities: |
||||||||||||||||||||||||
| Interest-bearing demand deposits |
$ | 103,744 | $ | 80 | 0.15 | % | $ | 63,363 | $ | 76 | 0.24 | % | ||||||||||||
| Money market and savings deposits |
413,287 | 858 | 0.42 | % | 248,137 | 540 | 0.44 | % | ||||||||||||||||
| Certificates and other time deposits |
548,679 | 2,454 | 0.90 | % | 410,579 | 2,008 | 0.99 | % | ||||||||||||||||
| Short-term borrowings |
2,238 | 2 | 0.16 | % | — | — | 0.00 | % | ||||||||||||||||
| Subordinated debt |
8,940 | 325 | 7.33 | % | — | — | 0.00 | % | ||||||||||||||||
| Other borrowed funds |
28,243 | 446 | 3.18 | % | 5,239 | 75 | 2.88 | % | ||||||||||||||||
|
|
|
|
|
|
|
|
|
|||||||||||||||||
| Total interest-bearing liabilities |
1,105,131 | 4,165 | 0.76 | % | 727,318 | 2,699 | 0.75 | % | ||||||||||||||||
|
|
|
|
|
|
|
|
|
|||||||||||||||||
| Noninterest-Bearing liabilities: |
||||||||||||||||||||||||
| Noninterest-bearing demand deposits |
533,098 | 307,825 | ||||||||||||||||||||||
| Other liabilities |
6,907 | 2,858 | ||||||||||||||||||||||
|
|
|
|
|
|||||||||||||||||||||
| Total liabilities |
1,645,136 | 1,038,001 | ||||||||||||||||||||||
| Stockholders’ equity |
199,662 | 113,745 | ||||||||||||||||||||||
|
|
|
|
|
|||||||||||||||||||||
| Total liabilities and stockholders’ equity |
$ | 1,844,798 | $ | 1,151,746 | ||||||||||||||||||||
|
|
|
|
|
|||||||||||||||||||||
| Net interest rate spread |
4.48 | % | 4.02 | % | ||||||||||||||||||||
| Net interest income and margin(1) |
$ | 38,504 | 4.73 | % | $ | 22,101 | 4.25 | % | ||||||||||||||||
|
|
|
|
|
|||||||||||||||||||||
| Net interest income and margin (tax equivalent)(2) |
$ | 38,762 | 4.76 | % | $ | 22,192 | 4.26 | % | ||||||||||||||||
|
|
|
|
|
|||||||||||||||||||||
| (1) | The net interest margin is equal to net interest income divided by average interest-earning assets. |
| (2) | In order to make pretax income and resultant yields on tax-exempt investments and loans comparable to those on taxable investments and loans, a tax equivalent adjustment has been computed using a federal income tax rate of 35% for the six months ended June 30, 2015 and 2014 and other applicable effective tax rates. |
| (3) | Includes loans held for sale at June 30, 2015. |
Year ended December 31, 2014 compared with the year ended December 31, 2013. Net interest income before the provision for loan losses for 2014 was $46.8 million compared with $33.9 million for 2013, an increase of $12.9 million, or 38.2%. The increase in net interest income was primarily due to the increase in average interest-earning assets of $279.9 million, or 34.5%, during 2014. The increase in our average interest-earning assets during 2014 as compared to 2013 was primarily the result of the full year effect of the Independence acquisition, which was completed in November 2013, as well as organic growth in our loan
66
Table of Contents
portfolio. From 2013 to 2014, average loans as a percentage of average interest-earning assets increased from 80.1% to 84.1%. The organic growth in our loan portfolio in 2014 was largely driven by higher production from our existing loan producers, including former Independence lenders who were able to expand their loan portfolios through our banking and operational platform, which we believe demonstrates the strength of our platform and super-community banking strategy. We also benefited from the late 2013 opening of our new banking location in Clear Lake within the Houston metropolitan area, which further contributed to our loan growth during 2014. Our net interest income also benefited from our capital position, which, consistent with our deposit strategy, allowed us to grow our loan portfolio at a faster rate than we grew our deposits.
Interest income for 2014 was $52.4 million compared with $38.3 million for 2013, an increase of $14.1 million, or 36.7%. This increase was primarily due to an increase in interest income and fees on loans of $13.3 million for 2014 compared to 2013 as a result of the increase in average loans outstanding of $267.9 million for 2014 compared to 2013. This increase in average loans outstanding was primarily the result of the full year effect of the Independence acquisition, increased productivity of our existing lenders and the opening of our Clear Lake banking location, slightly offset by a 21 basis point decrease in average yield on our loan portfolio.
Interest expense for 2014 was $5.6 million compared to $4.4 million for 2013, an increase of $1.1 million, or 25.3%. This increase was primarily due to an increase in average interest-bearing liabilities of $182.4 million for 2014 compared to 2013, partially offset by the average rate paid on interest-bearing liabilities decreasing to 0.75% from 0.79% for the same period. Our growth in average interest-bearing liabilities was largely the result of a $109.6 million, or 37.2%, increase in certificates and other time deposits, which was primarily the result of the full year effect of certificates of deposit acquired in the Independence acquisition.
Tax equivalent net interest margin, defined as net interest income adjusted for tax-free income divided by average interest-earning assets, for 2014 was 4.32%, an increase of 13 basis points compared with 4.19% for 2013. This net interest margin increase was primarily due to growth of higher-yielding interest-earning assets, namely in our loan portfolio. Tax equivalent adjustments to net interest margin are the result of increasing income from tax-free securities by an amount equal to the taxes that would have been paid if the income were fully taxable based on a 35% federal tax rate, thus making tax-exempt yields comparable to taxable asset yields.
67
Table of Contents
The following table presents, for the periods indicated, the total dollar amount of average balances, interest income from average interest-earning assets and the resultant yields, as well as the interest expense on average interest-bearing liabilities, expressed both in dollars and rates. Average outstanding balances were calculated in accordance with the description previously provided in the “Selected Historical Consolidated Financial Data”. Any nonaccruing loans have been included in the table as loans carrying a zero yield.
| For the Years Ended December 31, | ||||||||||||||||||||||||||||||||||||
| 2014 | 2013 | 2012 | ||||||||||||||||||||||||||||||||||
| Average Outstanding Balance |
Interest Earned/ Interest Paid |
Average Yield/ Rate |
Average Outstanding Balance |
Interest Earned/ Interest Paid |
Average Yield/ Rate |
Average Outstanding Balance |
Interest Earned/ Interest Paid |
Average Yield/ Rate |
||||||||||||||||||||||||||||
| (Dollars in thousands) | ||||||||||||||||||||||||||||||||||||
| Assets |
||||||||||||||||||||||||||||||||||||
| Interest-Earning Assets: |
||||||||||||||||||||||||||||||||||||
| Loans |
$ | 917,218 | $ | 50,243 | 5.48 | % | $ | 649,362 | $ | 36,960 | 5.69 | % | $ | 533,809 | $ | 31,772 | 5.95 | % | ||||||||||||||||||
| Securities |
91,318 | 1,851 | 2.03 | % | 53,441 | 1,026 | 1.92 | % | 30,977 | 762 | 2.46 | % | ||||||||||||||||||||||||
| Deposits in other financial institutions |
81,839 | 311 | 0.38 | % | 107,675 | 352 | 0.33 | % | 91,849 | 367 | 0.40 | % | ||||||||||||||||||||||||
|
|
|
|
|
|
|
|
|
|
|
|
|
|||||||||||||||||||||||||
| Total interest-earning assets |
1,090,375 | $ | 52,405 | 4.81 | % | 810,478 | $ | 38,338 | 4.73 | % | 656,635 | $ | 32,901 | 5.01 | % | |||||||||||||||||||||
|
|
|
|
|
|
|
|
|
|
|
|
|
|||||||||||||||||||||||||
| Allowance for loan losses |
(7,276 | ) | (6,674 | ) | (6,310 | ) | ||||||||||||||||||||||||||||||
| Noninterest-earning assets |
109,852 | 68,281 | 47,948 | |||||||||||||||||||||||||||||||||
|
|
|
|
|
|
|
|||||||||||||||||||||||||||||||
| Total assets |
$ | 1,192,951 | $ | 872,085 | $ | 698,273 | ||||||||||||||||||||||||||||||
|
|
|
|
|
|
|
|||||||||||||||||||||||||||||||
| Liabilities and Stockholders’ Equity |
||||||||||||||||||||||||||||||||||||
| Interest-Bearing Liabilities: |
||||||||||||||||||||||||||||||||||||
| Interest-bearing demand deposits |
$ | 69,139 | $ | 135 | 0.20 | % | $ | 41,162 | $ | 77 | 0.19 | % | $ | 30,948 | $ | 60 | 0.19 | % | ||||||||||||||||||
| Money market and savings deposits |
263,277 | 1,126 | 0.43 | % | 225,436 | 1,159 | 0.51 | % | 200,867 | 1,096 | 0.55 | % | ||||||||||||||||||||||||
| Certificates and other time deposits |
404,006 | 4,081 | 1.01 | % | 294,413 | 3,196 | 1.09 | % | 225,426 | 2,619 | 1.16 | % | ||||||||||||||||||||||||
| Other borrowed funds |
7,536 | 229 | 3.04 | % | 504 | 15 | 2.98 | % | 14 | — | 0.00 | % | ||||||||||||||||||||||||
|
|
|
|
|
|
|
|
|
|
|
|
|
|||||||||||||||||||||||||
| Total interest-bearing liabilities |
743,958 | 5,571 | 0.75 | % | 561,515 | 4,447 | 0.79 | % | 457,255 | 3,775 | 0.83 | % | ||||||||||||||||||||||||
|
|
|
|
|
|
|
|
|
|
|
|
|
|||||||||||||||||||||||||
| Noninterest-Bearing liabilities: |
||||||||||||||||||||||||||||||||||||
| Noninterest-bearing demand deposits |
328,743 | 232,197 | 177,064 | |||||||||||||||||||||||||||||||||
| Other liabilities |
3,790 | 2,586 | 2,255 | |||||||||||||||||||||||||||||||||
|
|
|
|
|
|
|
|||||||||||||||||||||||||||||||
| Total liabilities |
1,076,491 | 796,298 | 636,574 | |||||||||||||||||||||||||||||||||
| Stockholders’ equity |
116,460 | 75,787 | 61,699 | |||||||||||||||||||||||||||||||||
|
|
|
|
|
|
|
|||||||||||||||||||||||||||||||
| Total liabilities and stockholders’ equity |
$ | 1,192,951 | $ | 872,085 | $ | 698,273 | ||||||||||||||||||||||||||||||
|
|
|
|
|
|
|
|||||||||||||||||||||||||||||||
| Net interest rate spread |
4.06 | % | 3.94 | % | 4.18 | % | ||||||||||||||||||||||||||||||
| Net interest income and margin(1) |
$ | 46,834 | 4.30 | % | $ | 33,891 | 4.18 | % | $ | 29,126 | 4.44 | % | ||||||||||||||||||||||||
|
|
|
|
|
|
|
|||||||||||||||||||||||||||||||
| Net interest income and margin (tax equivalent)(2) |
$ | 47,079 | 4.32 | % | $ | 33,925 | 4.19 | % | $ | 29,134 | 4.44 | % | ||||||||||||||||||||||||
|
|
|
|
|
|
|
|||||||||||||||||||||||||||||||
| (1) | The net interest margin is equal to net interest income divided by average interest-earning assets. |
| (2) | In order to make pretax income and resultant yields on tax-exempt investments and loans comparable to those on taxable investments and loans, a tax equivalent adjustment has been computed using a federal income tax rate of 35% for the years ended December 31, 2014, 2013 and 2012 and other applicable effective tax rates. |
68
Table of Contents
The following table presents information regarding the dollar amount of changes in interest income and interest expense for the periods indicated for each major component of interest-earning assets and interest-bearing liabilities and distinguishes between the changes attributable to changes in volumes and changes attributable to changes in interest rates. For purposes of this table, changes attributable to both rate and volume that cannot be segregated have been allocated to rate.
| For the Six Months Ended June 30, | For the Years Ended December 31, | |||||||||||||||||||||||
| 2015 vs. 2014 | 2014 vs. 2013 | |||||||||||||||||||||||
| Increase (Decrease) Due to Change in |
Increase (Decrease) Due to Change in |
|||||||||||||||||||||||
| Volume | Rate | Total | Volume | Rate | Total | |||||||||||||||||||
| (Dollars in thousands) |
(Dollars in thousands) | |||||||||||||||||||||||
| Interest-Earning assets: |
||||||||||||||||||||||||
| Loans |
$ | 15,592 | $ | 2,095 | $ | 17,687 | $ | 15,246 | $ | (1,963 | ) | $ | 13,283 | |||||||||||
| Securities |
217 | 14 | 231 | 727 | 98 | 825 | ||||||||||||||||||
| Deposits in other financial institutions |
(3 | ) | (46 | ) | (49 | ) | (84 | ) | 43 | (41 | ) | |||||||||||||
|
|
|
|
|
|
|
|
|
|
|
|
|
|||||||||||||
| Total increase (decrease) in interest income |
15,806 | 2,063 | 17,869 | 15,889 | (1,822 | ) | 14,067 | |||||||||||||||||
|
|
|
|
|
|
|
|
|
|
|
|
|
|||||||||||||
| Interest-Bearing liabilities: |
||||||||||||||||||||||||
| Interest-bearing demand deposits |
48 | (44 | ) | 4 | 52 | 6 | 58 | |||||||||||||||||
| Money market and savings deposits |
359 | (41 | ) | 318 | 195 | (228 | ) | (33 | ) | |||||||||||||||
| Certificates and other time deposits |
676 | (230 | ) | 446 | 1,190 | (305 | ) | 885 | ||||||||||||||||
| Short-term borrowings |
2 | — | 2 | — | — | — | ||||||||||||||||||
| Subordinated debt |
325 | — | 325 | — | — | — | ||||||||||||||||||
| Other borrowed funds |
328 | 43 | 371 | 221 | (7 | ) | 214 | |||||||||||||||||
|
|
|
|
|
|
|
|
|
|
|
|
|
|||||||||||||
| Total increase (decrease) in interest expense |
1,738 | (272 | ) | 1,466 | 1,658 | (534 | ) | 1,124 | ||||||||||||||||
|
|
|
|
|
|
|
|
|
|
|
|
|
|||||||||||||
| Increase (decrease) in net interest income |
$ | 14,068 | $ | 2,335 | $ | 16,403 | $ | 14,231 | $ | (1,288 | ) | $ | 12,943 | |||||||||||
|
|
|
|
|
|
|
|
|
|
|
|
|
|||||||||||||
Provision for Loan Losses
Our provision for loan losses is established through charges to income in the form of the provision in order to bring our allowance for loan losses to a level deemed appropriate by management. The allowance for loan losses at June 30, 2015 and December 31, 2014 was $10.3 million and $8.2 million, respectively, representing 0.66% and 0.82% of total loans as of such dates. Acquired loans are recorded at fair value based on a discounted cash flow valuation methodology that considers, among other things, projected default rates, losses given existing defaults, and recovery rates. No carryover of any allowance for loan losses occurs when loans are acquired. We recorded a $2.1 million provision for loan losses for the six months ended June 30, 2015 and a $900 thousand provision for the six months ended June 30, 2014. The increase in the provision was related to the increase in the allowance of $2.1 million for the six months ended June 30, 2015 compared to December 31, 2014. The increase in the allowance was primarily due to an increase in required reserves associated with organic loan growth and an increase of $208 thousand of allowance on loans individually evaluated for impairment.
The provision for loan losses for the year ended December 31, 2014 was $2.2 million compared with $240 thousand for the year ended December 31, 2013. The increase in the provision was largely the result of the growth in our loan portfolio. Additionally, the provision in 2013 reflected improvement in credit quality, relative to prior years, in our portfolio as a result of improved economic conditions in 2013.
Noninterest Income
Our primary sources of noninterest income are service charges on deposit accounts and nonsufficient funds fees. Noninterest income does not include loan origination fees which are recognized over the life of the related loan as an adjustment to yield using the interest method.
69
Table of Contents
Six months ended June 30, 2015 compared with six months ended June 30, 2014. Noninterest income totaled $1.8 million for the six months ended June 30, 2015 compared to $1.3 million for the six months ended June 30, 2014, an increase of $492 thousand or 37.2%. This increase was primarily due to the effect of the additional accounts acquired in the acquisition of F&M Bancshares.
Year ended December 31, 2014 compared with year ended December 31, 2013. Noninterest income totaled $2.6 million for the year ended December 31, 2014, an increase of $968 thousand, or 59.1%, compared with the same period in 2013. This increase was mainly due to the full year effect of the Independence acquisition, which was completed in November 2013.
The following table presents, for the periods indicated, the major categories of noninterest income:
| For the Six Months Ended June 30, |
Increase (Decrease) |
For the Years Ended December 31, |
Increase (Decrease) |
|||||||||||||||||||||
| 2015 | 2014 | 2014 | 2013 | |||||||||||||||||||||
| (Dollars in thousands) |
||||||||||||||||||||||||
| Nonsufficient funds (NSF) fees |
$ | 333 | $ | 217 | $ | 116 | $ | 455 | $ | 331 | $ | 124 | ||||||||||||
| Service charges on deposit accounts |
351 | 253 | 98 | 490 | 329 | 161 | ||||||||||||||||||
| Debit card and ATM card income |
292 | 157 | 135 | 369 | 224 | 145 | ||||||||||||||||||
| Gain on sales of other real estate |
(6 | ) | 188 | (194 | ) | 188 | 201 | (13 | ) | |||||||||||||||
| Gain on sale of securities |
— | — | — | 83 | — | 83 | ||||||||||||||||||
| Bank owned life insurance income |
266 | — | 266 | — | — | — | ||||||||||||||||||
| Rebate from correspondent bank |
101 | 181 | (80 | ) | 294 | 305 | (11 | ) | ||||||||||||||||
| Other(1) |
476 | 325 | 151 | 728 | 249 | 479 | ||||||||||||||||||
|
|
|
|
|
|
|
|
|
|
|
|
|
|||||||||||||
| Total noninterest income |
$ | 1,813 | $ | 1,321 | $ | 492 | $ | 2,607 | $ | 1,639 | $ | 968 | ||||||||||||
|
|
|
|
|
|
|
|
|
|
|
|
|
|||||||||||||
| (1) | Other includes wire transfer and letter of credit fees, among other items. |
Noninterest Expense
Six months ended June 30, 2015 compared with six months ended June 30, 2014. Noninterest expense was $27.0 million for the six months ended June 30, 2015 compared to $15.3 million for the six months ended June 30, 2014, an increase of $11.7 million or 76.9%. This increase is primarily attributable to merger related expenses of approximately $939 thousand for the six months ended June 30, 2015 incurred in connection with the F&M Bancshares acquisition in addition to significant personnel, facilities and infrastructure acquired on January 1, 2015.
Year ended December 31, 2014 compared with year ended December 31, 2013. Noninterest expense totaled $33.5 million for the year ended December 31, 2014, an increase of $8.9 million, or 36.0%, compared with 2013. This increase was primarily due to increased salaries and benefits, occupancy and data processing expenses to support our growth and as a result of the full year effect of the Independence acquisition, which was completed in November 2013.
70
Table of Contents
The following table presents, for the periods indicated, the major categories of noninterest expense:
| For the Six Months Ended June 30, |
Increase (Decrease) |
For the Years Ended December 31, |
Increase (Decrease) |
|||||||||||||||||||||
| 2015 | 2014 | 2014 | 2013 | |||||||||||||||||||||
| (Dollars in thousands) |
||||||||||||||||||||||||
| Salaries and employee benefits(1) |
$ | 17,423 | $ | 9,503 | $ | 7,920 | $ | 20,179 | $ | 15,371 | $ | 4,808 | ||||||||||||
| Net occupancy and equipment |
2,358 | 1,581 | 777 | 3,316 | 2,420 | 896 | ||||||||||||||||||
| Data processing and software amortization |
1,453 | 833 | 620 | 1,658 | 1,202 | 456 | ||||||||||||||||||
| Professional fees |
877 | 529 | 348 | 2,294 | 1,681 | 613 | ||||||||||||||||||
| Regulatory assessments and FDIC insurance |
694 | 422 | 272 | 848 | 602 | 246 | ||||||||||||||||||
| Core deposit intangibles amortization |
415 | 148 | 267 | 298 | 37 | 261 | ||||||||||||||||||
| Depreciation |
776 | 503 | 273 | 1,084 | 813 | 271 | ||||||||||||||||||
| Communications |
692 | 306 | 386 | 684 | 432 | 252 | ||||||||||||||||||
| Advertising |
322 | 278 | 44 | 601 | 582 | 19 | ||||||||||||||||||
| Other real estate expense |
44 | 6 | 38 | 6 | 86 | (80 | ) | |||||||||||||||||
| Printing and supplies |
188 | 90 | 98 | 159 | 122 | 37 | ||||||||||||||||||
| Other |
1,766 | 1,070 | 696 | 2,331 | 1,250 | 1,081 | ||||||||||||||||||
|
|
|
|
|
|
|
|
|
|
|
|
|
|||||||||||||
| Total noninterest expense |
$ | 27,008 | $ | 15,269 | $ | 11,739 | $ | 33,458 | $ | 24,598 | $ | 8,860 | ||||||||||||
|
|
|
|
|
|
|
|
|
|
|
|
|
|||||||||||||
| (1) | Total salaries and employee benefits includes $642 thousand and $326 thousand for the six months ended June 30, 2015 and 2014, respectively, and $731 thousand and $375 thousand for the years ended December 31, 2014 and 2013, respectively, in stock based compensation expense. |
Salaries and Employee Benefits. Salaries and benefits were $17.4 million for the six months ended June 30, 2015 compared to $9.5 million for the six months ended June 30, 2014, an increase of $7.9 million or 83.3%. The increase is attributable to the increase in the total size of our workforce between these periods as our full-time employees increased from 195 employees at December 31, 2014 to 289 employees at June 30, 2015. This increase is primarily a result of a combination of the acquisition of F&M Bancshares, and additional employees hired to support our growth. Additionally the company incurred pre-tax merger related severance expenses of approximately $555 thousand related to the F&M Bancshares acquisition during the six months ended June 30, 2015.
Salaries and benefits were $20.2 million for the year ended December 31, 2014, an increase of $4.8 million, or 31.3%, compared to 2013. This increase was primarily due to the full year effect of the Independence acquisition completed during 2013 which resulted in an increase of 35 employees. In addition, due to our growth, we added experienced banking and accounting professionals in 2014 which contributed to the increase in our employees from 165 at December 31, 2013 to 179 at December 31, 2014.
Net Occupancy and Equipment. Net occupancy and equipment expenses were $2.4 million for the six months ended June 30, 2015 compared to $1.6 million for the six months ended June 30, 2014. This increase is primarily attributable to the cost of the retail branches acquired in the acquisition of F&M Bancshares including utilities, rent, and other occupancy expenses.
Net occupancy and equipment expenses were $3.3 million and $2.4 million for the years ended December 31, 2014 and 2013, respectively. The increase of $896 thousand, or 37.0%, for 2014 compared with 2013 was due primarily to the full year effect of the Independence acquisition completed during 2013 and the opening of our banking location in Clear Lake in late 2013.
Data Processing and Software Amortization. Data processing and software amortization were $1.5 million for the six months ended June 30, 2015 compared to $833 thousand for the six months ended June 30, 2014. This increase is primarily attributable to the additional hardware and software expenses acquired as part of the acquisition of F&M Bancshares and the resulting increase in transaction volume.
71
Table of Contents
Data processing and software amortization expenses were $1.7 million and $1.2 million for the years ended December 31, 2014 and 2013, respectively. The increase of $456 thousand, or 38.0%, for 2014 compared with 2013 was due primarily to increased transaction volume and a portion of the Independence conversion fee.
Core Deposit Intangibles Amortization. Core deposit intangibles amortization increased $267 thousand for the six months ended June 30, 2015 to $415 thousand compared to $148 thousand for the six months ended June 30, 2014. This increase is attributable to the acquisition of F&M Bancshares.
Core deposit intangibles amortization increased $261 thousand to $298 thousand for the year ended December 31, 2014 compared with $37 thousand for the year ended December 31, 2013. The increase in 2014 was attributable to the addition of Independence in November 2013. Core deposit intangibles are amortized using a straight-line amortization method over its estimated useful life of 7 years.
Professional Fees. Professional fees were $877 thousand for the six months ended June 30, 2015 compared to $529 thousand for the six months ended June 30, 2014. This increase is primarily attributable to pre-tax merger related expenses of approximately $248 thousand incurred to complete the conversion of F&M Bancshares during the six months ended June 30, 2015.
Professional fees were $2.3 million for the year ended December 31, 2014, an increase of $613 thousand, or 36.5%, compared to the year ended December 31, 2013. This increase was primarily due to approximately $500 thousand related to system conversions during the year. In 2014, we converted to a new accounting system, completed the conversion of Independence and incurred costs in preparation for the first quarter of 2015 conversion of F&M Bancshares, which was acquired on January 1, 2015.
Efficiency Ratio. The efficiency ratio is a supplemental financial measure utilized in management’s internal evaluation of our performance and is not defined under generally accepted accounting principles. We calculate our efficiency ratio by dividing total noninterest expense, excluding loan loss provisions, by net interest income plus noninterest income, excluding net gains and losses on the sale of securities and assets. Additionally, taxes are not part of this calculation. An increase in the efficiency ratio indicates that more resources are being utilized to generate the same volume of income, while a decrease would indicate a more efficient allocation of resources. Our efficiency ratio was 67.0% for the six months ended June 30, 2015, compared with 65.2% for the six months ended June 30, 2014. The efficiency ratio for the six months ended June 30, 2015 was impacted by merger expenses related to the F&M Bancshares acquisition of approximately $867 thousand in the first quarter of 2015 and $72 thousand in the second quarter of 2015. Excluding these merger expenses, our efficiency ratio was 64.7% for the six months ended June 30, 2015.
Our efficiency ratio was 67.7% for the year ended December 31, 2014, compared with 69.2% for the year ended December 31, 2013. The efficiency ratios for 2014 and 2013 were impacted by merger-related expenses of approximately $630 thousand and $240 thousand, respectively.
We monitor the efficiency ratio in comparison with changes in our total assets and loans, and we believe that maintaining or reducing the efficiency ratio during periods of growth, as we did from 2013 to 2014, demonstrates the scalability of our operating platform. We expect to continue to benefit from our scalable platform in future periods as we believe we have already incurred a significant portion of the overhead expense necessary to support our growth.
Income Taxes
The amount of federal and state income tax expense is influenced by the amount of pre-tax income, the amount of tax-exempt income and the amount of other nondeductible expenses. For the six months ended June 30, 2015, income tax expense was $3.9 million compared to $2.6 million for the six months ended June 30, 2014. For the year ended December 31, 2014, income tax expense was $4.8 million compared with $3.9 million for the year ended December 31, 2013. The increases in income tax expense quarter over quarter and year over year were primarily attributable to higher pre-tax net earnings.
72
Table of Contents
The effective income tax rates for the six months ended June 30, 2015 and 2014 were 34.4% and 35.4%, respectively, and for the years ended December 31, 2014 and 2013 were 34.9% and 36.0%, respectively.
Financial Condition
Loan Portfolio
At June 30, 2015 total loans (including loans held for sale) were $1.56 billion, an increase of $559.6 million, or 55.9% compared with December 31, 2014 primarily due to $404.6 million of loans, net of acquisition accounting adjustments, acquired in the F&M Bancshares acquisition as well as organic growth in our loan portfolio. At December 31, 2014, total loans were $1.00 billion, an increase of $165.4 million, or 19.8%, compared with $836.7 million at December 31, 2013. This increase was primarily due to higher production from our existing lenders, including increased productivity of former Independence lenders, the addition of loan producers in connection with opening of our Clear Lake banking location, and growth in the Houston market. We believe the increased productivity of former Independence lenders demonstrates the scalability of our banking and operational platform and the strength of our growth strategy.
Total loans (including loans held for sale) as a percentage of deposits were 96.1%, 88.4% and 80.0% as of June 30, 2015, December 31, 2014 and 2013, respectively. Our capital positions in 2015 and 2014 allowed us to grow our loan portfolio at a faster rate than we grew our deposits. Total loans as a percentage of assets were 80.3%, 78.3% and 71.8% as of June 30, 2015, December 31, 2014 and 2013, respectively.
Lending activities originate from the efforts of our lenders, with an emphasis on lending to small to medium-sized businesses and companies, professionals and individuals located in the Houston metropolitan area.
The following table summarizes our loan portfolio by type of loan as of the dates indicated. All loans in our loan portfolio are held for investment.
| As of June 30, | As of December 31, | |||||||||||||||||||||||||||||||||||||||||||||||
| 2015 | 2014 | 2013 | 2012 | 2011 | 2010 | |||||||||||||||||||||||||||||||||||||||||||
| Amount | Percent | Amount | Percent | Amount | Percent | Amount | Percent | Amount | Percent | Amount | Percent | |||||||||||||||||||||||||||||||||||||
| (Dollars in thousands) | ||||||||||||||||||||||||||||||||||||||||||||||||
| Loans held for sale(1) |
$ | 25,629 | 1.6 | % | $ | — | 0.0 | % | $ | — | 0.0 | % | $ | — | 0.0 | % | $ | — | 0.0 | % | $ | — | 0.0 | % | ||||||||||||||||||||||||
|
|
|
|
|
|
|
|
|
|
|
|
|
|
|
|
|
|
|
|
|
|
|
|
|
|||||||||||||||||||||||||
| Commercial and industrial |
$ | 427,958 | 27.4 | % | $ | 270,363 | 27.0 | % | $ | 227,382 | 27.2 | % | $ | 169,952 | 29.5 | % | $ | 150,617 | 32.5 | % | $ | 82,683 | 25.7 | % | ||||||||||||||||||||||||
| Real Estate: |
||||||||||||||||||||||||||||||||||||||||||||||||
| Commercial real estate (including multi-family residential) |
678,979 | 43.6 | % | 429,986 | 42.9 | % | 401,048 | 47.9 | % | 268,810 | 46.5 | % | 205,445 | 44.4 | % | 150,047 | 46.6 | % | ||||||||||||||||||||||||||||||
| Commercial real estate construction and land development |
140,437 | 9.0 | % | 85,484 | 8.5 | % | 71,633 | 8.6 | % | 36,097 | 6.3 | % | 24,020 | 5.2 | % | 19,886 | 6.2 | % | ||||||||||||||||||||||||||||||
| 1-4 family residential (including home equity) |
178,635 | 11.4 | % | 135,127 | 13.5 | % | 89,334 | 10.7 | % | 69,204 | 12.0 | % | 51,905 | 11.2 | % | 39,021 | 12.1 | % | ||||||||||||||||||||||||||||||
| Residential construction |
94,167 | 6.0 | % | 72,402 | 7.2 | % | 38,891 | 4.6 | % | 22,352 | 3.9 | % | 19,968 | 4.3 | % | 22,052 | 6.9 | % | ||||||||||||||||||||||||||||||
| Consumer and other |
15,852 | 1.0 | % | 8,692 | 0.9 | % | 8,406 | 1.0 | % | 10,174 | 1.8 | % | 10,907 | 2.4 | % | 8,031 | 2.5 | % | ||||||||||||||||||||||||||||||
|
|
|
|
|
|
|
|
|
|
|
|
|
|
|
|
|
|
|
|
|
|
|
|
|
|||||||||||||||||||||||||
| Total loans held for investment |
1,536,028 | 98.4 | % | 1,002,054 | 100.0 | % | 836,694 | 100.0 | % | 576,589 | 100.0 | % | 462,862 | 100.0 | % | 321,720 | 100.0 | % | ||||||||||||||||||||||||||||||
|
|
|
|
|
|
|
|
|
|
|
|
|
|
|
|
|
|
|
|
|
|
|
|
|
|||||||||||||||||||||||||
| Total loans |
1,561,657 | 100.0 | % | 1,002,054 | 100.0 | % | 836,694 | 100.0 | % | 576,589 | 100.0 | % | 462,862 | 100.0 | % | 321,720 | 100.0 | % | ||||||||||||||||||||||||||||||
|
|
|
|
|
|
|
|
|
|
|
|
|
|
|
|
|
|
|
|
|
|
|
|
|
|||||||||||||||||||||||||
| Allowance for loan losses |
(10,312 | ) | (8,246 | ) | (6,655 | ) | (6,539 | ) | (5,543 | ) | (4,026 | ) | ||||||||||||||||||||||||||||||||||||
|
|
|
|
|
|
|
|
|
|
|
|
|
|||||||||||||||||||||||||||||||||||||
| Loans, net |
$ | 1,551,345 | $ | 993,808 | $ | 830,039 | $ | 570,050 | $ | 457,319 | $ | 317,694 | ||||||||||||||||||||||||||||||||||||
|
|
|
|
|
|
|
|
|
|
|
|
|
|||||||||||||||||||||||||||||||||||||
| (1) | Consists of loans at two former F&M Bancshares locations acquired on January 1, 2015. We intend to sell two former F&M Bancshares branches and their related assets located in Central Texas if we can agree on terms satisfactory to us. As of June 30, 2015, loans held for sale consists of $9.2 million of commercial and industrial loans, $12.9 million of commercial real estate (including multifamily residential) loans, $2.7 million of l-4 family residential (including home equity) loans and $838 thousand of consumer and other loans. Loans held for sale are carried at lower of aggregate cost or fair value. |
73
Table of Contents
The principal categories of our loan portfolio (including loans held for sale) are discussed below:
Commercial and Industrial. We make commercial loans in our market area that are underwritten on the basis of the borrower’s ability to service the debt from income. Our commercial and industrial loan portfolio increased $166.8 million, or 61.7%, to $437.2 million as of June 30, 2015 compared to $270.4 million as of December 31, 2014 as a result of organic loan growth of $87.6 million in the commercial and industrial portfolio during the first six months of 2015, of this amount, $52.9 million of growth was related to the mortgage warehouse portfolio. The remainder of the increase was due to loans acquired in the F&M acquisition. Our commercial and industrial loan portfolio increased $43.0 million, or 18.9%, to $270.4 million as of December 31, 2014 from $227.4 million as of December 31, 2013. This increase was primarily the result of increased lending activity due to an increase in demand in the growing Houston metropolitan area.
Commercial Real Estate (Including Multi-Family Residential). We make loans collateralized by owner-occupied, nonowner-occupied and multi-family real estate to finance the purchase or ownership of real estate. As of June 30, 2015, December 31, 2014 and 2013, 52.7%, 59.7% and 55.9%, respectively, of our commercial real estate loans were owner-occupied. Our commercial real estate loan portfolio increased $261.9 million, or 60.9%, to $691.8 million as of June 30, 2015 from $430.0 million as of December 31, 2014, as a result of organic loan growth of $49.3 million in the commercial real estate portfolio during the first six months of 2015 with the remainder of the change due to loans acquired in the F&M acquisition. Our commercial real estate loan portfolio increased $28.9 million, or 7.2%, to $430.0 million as of December 31, 2014 from $401.0 million as of December 31, 2013, as a result of the increased demand for commercial real estate loans within our market and from increased lending activity resulting from the addition of experienced lending officers.
Commercial Real Estate Construction and Land Development. We make commercial real estate construction and land development loans to fund commercial construction, land acquisition and real estate development construction. Commercial real estate construction and land development land loans increased $55.0 million, or 64.3% to $140.4 million as of June 30, 2015 compared to $85.5 million as of December 31, 2014 as a result of organic loan growth of $38.2 million in the commercial real estate construction portfolio during the first six months of 2015 with the remainder of the change due to loans acquired in the F&M acquisition. Commercial real estate construction and land development loans increased $13.9 million, or 19.3%, to $85.5 million as of December 31, 2014 from $71.6 million as of December 31, 2013 as a result of the increased demand for such loans.
1-4 Family Residential (Including Home Equity). Our residential real estate loans include the origination of 1-4 family residential mortgage loans (including home equity and home improvement loans and home equity lines of credit) collateralized by owner-occupied residential properties located in our market areas. Our residential real estate portfolio (including home equity) increased $46.2 million, or 34.2%, to $181.4 million as of June 30, 2015 from $135.1 million as of December 31, 2014 as a result of organic loan growth of $13.8 million in the 1-4 family residential portfolio during the first six months of 2015 with the remainder of the change due to loans acquired in the F&M acquisition. Our residential real estate portfolio (including home equity) increased $45.8 million, or 51.3%, to $135.1 million as of December 31, 2014 from $89.3 million as of December 31, 2013. The home equity portion of our residential real estate portfolio increased $1.8 million, or 55.3%, to $5.0 million as of December 31, 2014 from $3.2 million as of December 31, 2013. These increases were primarily the result of increased lending activity due to an increase in demand in the growing Houston metropolitan area.
Residential Construction. We make residential construction loans to home builders and individuals to fund the construction of single-family residences with the understanding that such loans will be repaid from the proceeds of the sale of the homes by builders or with the proceeds of a mortgage loan. These loans are secured by the real property being built and are made based on our assessment of the value of the property on an as-completed basis. Our residential construction loans portfolio increased $21.8 million, or 30.1%, to $94.2 million as of June 30, 2015 from $72.4 million as of December 31, 2014 as a result of organic loan growth of $18.8 million in the residential construction portfolio during the first six months of 2015 with the remainder of the change due to loans acquired in the F&M acquisition. Our residential construction loans portfolio increased
74
Table of Contents
$33.5 million, or 86.2%, to $72.4 million as of December 31, 2014 from $38.9 million as of December 31, 2013, as a result of the increase in demand for new housing and an increase in new home construction in the growing Houston metropolitan area.
Consumer and Other. Our consumer and other loan portfolio is made up of loans made to individuals for personal purposes. Our consumer and other loan portfolio increased $8.0 million, or 92.0%, to $16.7 million as of June 30, 2015 from $8.7 million as of December 31, 2014. The increase in our consumer and other loan portfolio is primarily due to the additional loans acquired from F&M Bancshares. Our consumer and other loan portfolio increased $286 thousand, or 3.4%, to $8.7 million as of December 31, 2014 from $8.4 million as of December 31, 2013.
For a more detailed discussion of the types of loans in our loan portfolio see “Business—Lending Activities—Loan Types.”
The contractual maturity ranges of loans held for investment in our loan portfolio and the amount of such loans with predetermined interest rates in each maturity range and the amount of loans with predetermined interest rates and floating interest rates in each maturity range, in each case as of the date indicated, are summarized in the following tables:
| As of June 30, 2015 | ||||||||||||||||
| Due in One Year or Less |
Due After One Year Through Five Years |
Due After Five Years |
Total | |||||||||||||
| (Dollars in thousands) | ||||||||||||||||
| Commercial and industrial |
$ | 236,134 | $ | 154,812 | $ | 37,012 | $ | 427,958 | ||||||||
| Real Estate: |
||||||||||||||||
| Commercial real estate (including multi-family residential) |
67,028 | 481,778 | 130,173 | 678,979 | ||||||||||||
| Commercial real estate construction and land development |
43,283 | 77,453 | 19,701 | 140,437 | ||||||||||||
| 1-4 family residential (including home equity) |
36,799 | 94,345 | 47,491 | 178,635 | ||||||||||||
| Residential construction |
90,362 | 3,805 | — | 94,167 | ||||||||||||
| Consumer and other |
7,410 | 8,391 | 51 | 15,852 | ||||||||||||
|
|
|
|
|
|
|
|
|
|||||||||
| Total loans held for investment |
$ | 481,016 | $ | 820,584 | $ | 234,428 | $ | 1,536,028 | ||||||||
|
|
|
|
|
|
|
|
|
|||||||||
| Loans with fixed rates |
$ | 284,560 | $ | 665,090 | $ | 108,948 | $ | 1,058,598 | ||||||||
| Loans with floating rates |
196,456 | 155,494 | 125,480 | 477,430 | ||||||||||||
|
|
|
|
|
|
|
|
|
|||||||||
| Total loans held for investment |
$ | 481,016 | $ | 820,584 | $ | 234,428 | $ | 1,536,028 | ||||||||
|
|
|
|
|
|
|
|
|
|||||||||
75
Table of Contents
| As of December 31, 2014 | ||||||||||||||||
| Due in One Year or Less |
Due After One Year Through Five Years |
Due After Five Years |
Total | |||||||||||||
| (Dollars in thousands) | ||||||||||||||||
| Commercial and industrial |
$ | 129,710 | $ | 107,238 | $ | 33,415 | $ | 270,363 | ||||||||
| Real Estate: |
||||||||||||||||
| Commercial real estate (including multi-family residential) |
34,632 | 309,395 | 85,959 | 429,986 | ||||||||||||
| Commercial real estate construction and land development |
28,316 | 38,139 | 19,029 | 85,484 | ||||||||||||
| 1-4 family residential (including home equity) |
28,964 | 62,911 | 43,252 | 135,127 | ||||||||||||
| Residential construction |
72,001 | 401 | — | 72,402 | ||||||||||||
| Consumer and other |
4,442 | 4,177 | 73 | 8,692 | ||||||||||||
|
|
|
|
|
|
|
|
|
|||||||||
| Total loans held for investment |
$ | 298,065 | $ | 522,261 | $ | 181,728 | $ | 1,002,054 | ||||||||
|
|
|
|
|
|
|
|
|
|||||||||
| Loans with fixed rates |
$ | 176,779 | $ | 461,863 | $ | 77,755 | $ | 716,397 | ||||||||
| Loans with floating rates |
121,286 | 60,398 | 103,973 | 285,657 | ||||||||||||
|
|
|
|
|
|
|
|
|
|||||||||
| Total loans held for investment |
$ | 298,065 | $ | 522,261 | $ | 181,728 | $ | 1,002,054 | ||||||||
|
|
|
|
|
|
|
|
|
|||||||||
| As of December 31, 2013 | ||||||||||||||||
| Due in One Year or Less |
Due After One Year Through Five Years |
Due After Five Years |
Total | |||||||||||||
| (Dollars in thousands) | ||||||||||||||||
| Commercial and industrial |
$ | 93,809 | $ | 109,382 | $ | 24,191 | $ | 227,382 | ||||||||
| Real Estate: |
||||||||||||||||
| Commercial real estate (including multi-family residential) |
41,057 | 293,068 | 66,923 | 401,048 | ||||||||||||
| Commercial real estate construction and land development |
26,056 | 35,664 | 9,913 | 71,633 | ||||||||||||
| 1-4 family residential (including home equity) |
21,213 | 52,769 | 15,352 | 89,334 | ||||||||||||
| Residential construction |
33,311 | 5,580 | — | 38,891 | ||||||||||||
| Consumer and other |
3,273 | 4,926 | 207 | 8,406 | ||||||||||||
|
|
|
|
|
|
|
|
|
|||||||||
| Total loans |
$ | 218,719 | $ | 501,389 | $ | 116,586 | $ | 836,694 | ||||||||
|
|
|
|
|
|
|
|
|
|||||||||
| Loans with fixed rates |
$ | 105,365 | $ | 428,102 | $ | 48,721 | $ | 582,188 | ||||||||
| Loans with floating rates |
113,354 | 73,287 | 67,865 | 254,506 | ||||||||||||
|
|
|
|
|
|
|
|
|
|||||||||
| Total loans |
$ | 218,719 | $ | 501,389 | $ | 116,586 | $ | 836,694 | ||||||||
|
|
|
|
|
|
|
|
|
|||||||||
Concentrations of Credit
The vast majority of our lending activity occurs in the Houston metropolitan area. Our loans are primarily loans secured by real estate, including commercial and residential construction, owner-occupied and nonowner-occupied and multi-family commercial real estate, raw land and other real estate based loans in respect of real estate located in the Houston metropolitan area. As of June 30, 2015, December 31, 2014 and December 31, 2013, commercial real estate and commercial construction loans represented approximately 53.3%, 51.4% and 56.5%, respectively, of our total loans including loans held for sale.
Asset Quality
Nonperforming Loans
We have several procedures in place to assist us in maintaining the overall quality of our loan portfolio. We have established underwriting guidelines to be followed by our officers, and monitor our delinquency levels for any negative or adverse trends.
76
Table of Contents
We had $5.7 million, $3.2 million and $2.6 million in nonperforming loans as of June 30, 2015, December 31, 2014, and December 31, 2013, respectively. At June 30, 2015, $1.8 million of purchase credit impaired loans acquired from F&M Bancshares were classified as nonperforming loans. If interest on nonaccrual loans had been accrued under the original loan terms, $187 thousand would have been recorded as income for the year ended December 31, 2014 and $263 thousand would have been recorded as income for the year ended December 31, 2013.
The following table presents information regarding nonperforming assets as of the dates indicated:
| As of June 30, |
As of December 31, | |||||||||||||||||||||||
| 2015 | 2014 | 2013 | 2012 | 2011 | 2010 | |||||||||||||||||||
| (Dollars in thousands) | ||||||||||||||||||||||||
| Nonaccrual loans: |
||||||||||||||||||||||||
| Loans held for sale |
$ | 1,130 | $ | — | $ | — | $ | — | $ | — | $ | — | ||||||||||||
| Commercial and industrial |
3,186 | 1,527 | 2,290 | 2,524 | 10 | — | ||||||||||||||||||
| Real Estate: |
||||||||||||||||||||||||
| Commercial real estate (including multi-family residential) |
974 | 1,653 | — | 2,687 | — | — | ||||||||||||||||||
| Commercial real estate construction and land development |
— | — | — | — | — | 1,905 | ||||||||||||||||||
| 1-4 family residential (including home equity) |
343 | — | 83 | 87 | — | — | ||||||||||||||||||
| Residential construction |
— | — | — | — | — | — | ||||||||||||||||||
| Consumer and other |
89 | 4 | 199 | 106 | 60 | — | ||||||||||||||||||
|
|
|
|
|
|
|
|
|
|
|
|
|
|||||||||||||
| Total nonaccrual loans(2) |
5,722 | 3,184 | 2,572 | 5,404 | 70 | 1,905 | ||||||||||||||||||
| Accruing loans 90 or more days past due |
— | — | — | — | — | — | ||||||||||||||||||
|
|
|
|
|
|
|
|
|
|
|
|
|
|||||||||||||
| Total nonperforming loans |
5,722 | 3,184 | 2,572 | 5,404 | 70 | 1,905 | ||||||||||||||||||
| Other real estate |
21 | — | 332 | 914 | 1,798 | 2,723 | ||||||||||||||||||
| Other repossessed assets |
491 | — | — | — | — | — | ||||||||||||||||||
|
|
|
|
|
|
|
|
|
|
|
|
|
|||||||||||||
| Total nonperforming assets |
$ | 6,234 | $ | 3,184 | $ | 2,904 | $ | 6,318 | $ | 1,868 | $ | 4,628 | ||||||||||||
|
|
|
|
|
|
|
|
|
|
|
|
|
|||||||||||||
| Restructured loans(1) |
$ | — | $ | — | $ | 1,503 | $ | 1,074 | $ | 2,124 | $ | 23 | ||||||||||||
| Nonperforming assets to total assets(3) |
0.32 | % | 0.25 | % | 0.25 | % | 0.82 | % | 0.30 | % | 1.08 | % | ||||||||||||
| Nonperforming loans to total loans(4) |
0.37 | % | 0.32 | % | 0.31 | % | 0.94 | % | 0.02 | % | 0.59 | % | ||||||||||||
| (1) | Restructured loans represent the balance at the end of the respective period for those loans modified in a troubled debt restructuring that are not already reported as a nonperforming loan. |
| (2) | Includes $1.8 million of loans acquired from F&M Bancshares as of June 30, 2015. |
| (3) | At June 30, 2015, this ratio would have been 0.23% excluding nonperforming loans acquired from F&M Bancshares. |
| (4) | At June 30, 2015, this ratio would have been 0.25% excluding nonperforming loans acquired from F&M Bancshares. |
Allowance for loan losses
The allowance for loan losses is a valuation allowance that is established through charges to earnings in the form of a provision for loan losses. The amount of the allowance for loan losses is affected by the following: (1) charge-offs of loans that occur when loans are deemed uncollectible and decrease the allowance, (2) recoveries on loans previously charged off that increase the allowance and (3) provisions for loan losses charged to earnings that increase the allowance.
77
Table of Contents
All loans were acquired at fair value without a carryover of the F&M Bancshares allowance for loan losses. The discount recognized on acquired loans is prospectively accreted, increasing the Company’s basis in such loans. Due to acquisition accounting, our allowance for loan losses to total loans may not be comparable to our peers particularly as it relates to the allowance to gross loan percentage and the allowance to non-performing loans. Recognizing that acquired purchased credit impaired loans have been de minimis, the Company monitors credit quality trends on a post-acquisition basis with an emphasis on past due, charge-off, classified loan, and non-performing trends. The amount of discount recorded by the Company on the acquisition date of the F&M Bancshares acquisition was $6.0 million, or 1.47% on loans acquired. The remaining discount on F&M Bancshares acquired loans as of June 30, 2015 was $3.6 million, or 1.14%. The unaccreted discount represents additional protection against potential losses and is presented as a reduction of the recorded investment in the loans rather than an allowance for loan losses.
At June 30, 2015, our allowance for loan losses amounted to $10.3 million, or 0.66% of total loans compared with $8.2 million, or 0.82% as of December 31, 2014.
The decrease in the December 31, 2014 to June 30, 2015 allowance for loan losses ratio to total loans is attributable to loans acquired in the F&M Bancshares acquisition that was recorded at fair value and did not have an allowance as of June 30, 2015 as there has been no evidence of credit deterioration since acquisition date. Excluding the acquired loans at June 30, 2015, the allowance would have been 0.88% of total loans. The increase in the allowance of $1.9 million for the six months ended June 30, 2015 was primarily due to an increase in required reserves associated with organic loan growth and an increase of $208 thousand of allowance on loans individually evaluated for impairment. We believe that the allowance for loan losses at June 30, 2015 and December 31, 2014 was adequate to cover probable incurred losses in the loan portfolio as of such dates. Nevertheless, we could sustain losses in future periods that could be substantial in relation to the size of the allowance at June 30, 2015 and December 31, 2014.
The ratio of annualized net charge-offs to average loans outstanding decreased to 0.01% for the six months ended June 30, 2015 compared to 0.02% for the six months ended June 30, 2014 and 0.06% for the year ended December 31, 2014.
78
Table of Contents
The following table presents, as of and for the periods indicated, an analysis of the allowance for loan losses and other related data:
| As of and for the Six Months Ended June 30, |
As of and for the Years Ended December 31, | ||||||||||||||||||||||||||||||||||
| 2015 | 2014 | 2014 | 2013 | 2012 | 2011 | 2010 | |||||||||||||||||||||||||||||
| (Dollars in thousands) | |||||||||||||||||||||||||||||||||||
| Average loans outstanding |
$ | 1,447,629 | $ | 873,150 | $ | 917,218 | $ | 649,362 | $ | 533,809 | $ | 376,270 | $ | 289,180 | |||||||||||||||||||||
| Gross loans outstanding at end of period |
1,561,657 | 933,134 | 1,002,054 | 836,694 | 576,589 | 462,862 | 321,720 | ||||||||||||||||||||||||||||
| Allowance for loan losses at beginning of period |
8,246 | 6,655 | 6,655 | 6,539 | 5,543 | 4,026 | 3,180 | ||||||||||||||||||||||||||||
| Provision for loan losses |
2,103 | 900 | 2,150 | 240 | 2,337 | 2,454 | 1,692 | ||||||||||||||||||||||||||||
| Charge-offs: |
|||||||||||||||||||||||||||||||||||
| Commercial and industrial |
(82 | ) | (74 | ) | (567 | ) | (369 | ) | (1,411 | ) | (155 | ) | (329 | ) | |||||||||||||||||||||
| Real Estate: |
|||||||||||||||||||||||||||||||||||
| Commercial real estate (including multi-family residential) |
— | — | — | — | — | — | — | ||||||||||||||||||||||||||||
| Commercial real estate construction and land development |
— | — | — | — | — | (622 | ) | (247 | ) | ||||||||||||||||||||||||||
| 14 family residential (including home equity) |
— | — | — | — | — | — | (241 | ) | |||||||||||||||||||||||||||
| Residential construction |
— | — | — | — | — | (182 | ) | — | |||||||||||||||||||||||||||
| Consumer and other |
(18 | ) | (40 | ) | (40 | ) | (19 | ) | (2 | ) | — | (30 | ) | ||||||||||||||||||||||
|
|
|
|
|
|
|
|
|
|
|
|
|
|
|
||||||||||||||||||||||
| Total charge-offs for all loan types |
(100 | ) | (114 | ) | (607 | ) | (388 | ) | (1,413 | ) | (959 | ) | (847 | ) | |||||||||||||||||||||
|
|
|
|
|
|
|
|
|
|
|
|
|
|
|
||||||||||||||||||||||
| Recoveries: |
|||||||||||||||||||||||||||||||||||
| Commercial and industrial |
39 | 20 | 32 | 33 | 12 | — | — | ||||||||||||||||||||||||||||
| Real Estate: |
|||||||||||||||||||||||||||||||||||
| Commercial real estate (including multi-family residential) |
— | — | — | — | — | — | — | ||||||||||||||||||||||||||||
| Commercial real estate construction and land development |
— | — | — | — | — | 20 | — | ||||||||||||||||||||||||||||
| 1-4 family residential (including home equity) |
— | — | — | 228 | 13 | — | — | ||||||||||||||||||||||||||||
| Residential construction |
22 | — | — | 1 | 47 | — | — | ||||||||||||||||||||||||||||
| Consumer and other |
2 | 1 | 16 | 2 | — | 2 | 1 | ||||||||||||||||||||||||||||
|
|
|
|
|
|
|
|
|
|
|
|
|
|
|
||||||||||||||||||||||
| Total recoveries for all loan types |
63 | 21 | 48 | 264 | 72 | 22 | 1 | ||||||||||||||||||||||||||||
|
|
|
|
|
|
|
|
|
|
|
|
|
|
|
||||||||||||||||||||||
| Net charge-offs |
$ | (37 | ) | $ | (93 | ) | $ | (559 | ) | $ | (124 | ) | $ | (1,341 | ) | $ | (937 | ) | $ | (846 | ) | ||||||||||||||
|
|
|
|
|
|
|
|
|
|
|
|
|
|
|
||||||||||||||||||||||
| Allowance for loan losses at end of period |
$ | 10,312 | $ | 7,462 | $ | 8,246 | $ | 6,655 | $ | 6,539 | $ | 5,543 | $ | 4,026 | |||||||||||||||||||||
| Allowance to total loans |
0.66 | % | 0.80 | % | 0.82 | % | 0.80 | % | 1.13 | % | 1.20 | % | 1.25 | % | |||||||||||||||||||||
| Provision for loan losses to average loans(1) |
0.29 | % | 0.21 | % | 0.23 | % | 0.04 | % | 0.44 | % | 0.65 | % | 0.59 | % | |||||||||||||||||||||
| Net charge-offs to average loans(1) |
0.01 | % | 0.02 | % | 0.06 | % | 0.02 | % | 0.25 | % | 0.25 | % | 0.29 | % | |||||||||||||||||||||
| Allowance to nonperforming loans(2) |
180.22 | % | 224.42 | % | 258.98 | % | 258.75 | % | 121.00 | % | 7,918.57 | % | 211.34 | % | |||||||||||||||||||||
| (1) | Interim period annualized. |
| (2) | At June 30, 2015, this ratio would have been 262.53% excluding nonperforming loans acquired from F&M Bancshares. |
79
Table of Contents
In connection with our review of our loan portfolio, we consider the following risk elements attributable to particular loan types or categories in assessing the quality of individual loans:
| • | for commercial and industrial loans, the operating results of the commercial, industrial or professional enterprise, the borrower’s business, professional and financial ability and expertise, the specific risks and volatility of income and operating results typical for businesses in that category and the value, nature and marketability of collateral; |
| • | for commercial real estate (including multi-family residential) loans, the debt service coverage ratio (income from the property in excess of operating expenses compared to loan payment requirements), operating results of the owner in the case of owner-occupied properties, the loan to value ratio, the age and condition of the collateral and the volatility of income, property value and future operating results typical of properties of that type; |
| • | for commercial real estate construction and land development and residential construction loans, the perceived feasibility of the project including the ability to sell developed lots or improvements constructed for resale or the ability to lease property constructed for lease, the quality and nature of contracts for presale or prelease, if any, experience and ability of the developer and loan to value ratio; |
| • | for 1-4 family residential (including home equity) loans, the borrower’s ability to repay the loan, including a consideration of the debt to income ratio and employment and income stability, the loan to value ratio, and the age, condition and marketability of collateral; and |
| • | for consumer and other loans, the individual borrower’s income, current debt level, past credit history and the value of any available collateral. |
Based on our review of our loan portfolio, we classify our loans by credit risk and track risk ratings. The following is a general description of the risk ratings we use:
| • | loans classified as “watch” loans may still be of high quality, but have an element of risk added to the credit such as declining payment history, deteriorating financial position of the borrower or a decrease in collateral value. |
| • | loans classified as “special mention” have a potential weakness that deserves management’s close attention. If left uncorrected, these potential weaknesses may result in deterioration of the repayment prospects for the loan or of our credit position at some future date. They are characterized by the distinct possibility that we will sustain some loss if the deficiencies are not corrected. |
| • | loans classified as “substandard” have well-defined weaknesses on a continuing basis and are inadequately protected by the current net worth and paying capacity of the borrower, impaired or declining collateral values, or a continuing downturn in their industry which is reducing their profits to below zero and having a significantly negative impact on their cash flow. These loans so classified are characterized by the distinct possibility that we will sustain some loss if the deficiencies are not corrected. |
| • | loans classified as “doubtful” have all the weaknesses inherent in those classified as substandard with the added characteristic that the weaknesses make collection or liquidation in full on the basis of currently existing facts, conditions, and values, highly questionable and improbable. |
Loans not meeting the criteria above that are analyzed individually are considered to be pass rated loans.
See “—Critical Accounting Policies—Allowance for Loan Losses” for additional information regarding how we estimate and evaluate the credit risk in our loan portfolio.
80
Table of Contents
The following table shows the allocation of the allowance for loan losses among our loan categories and certain other information as of the dates indicated. The allocation is made for analytical purposes and is not necessarily indicative of the categories in which future losses may occur. The total allowance is available to absorb losses from any loan category.
| As of June 30, | As of December 31, | |||||||||||||||||||||||||||||||||||||||||||||||||||||||||||||||||||||
| 2015 | 2014 | 2014 | 2013 | 2012 | 2011 | 2010 | ||||||||||||||||||||||||||||||||||||||||||||||||||||||||||||||||
| Amount | Percent of Loans to Total Loans |
Amount | Percent of Loans to Total Loans |
Amount | Percent of Loans to Total Loans |
Amount | Percent of Loans to Total Loans |
Amount | Percent of Loans to Total Loans |
Amount | Percent of Loans to Total Loans |
Amount | Percent of Loans to Total Loans | |||||||||||||||||||||||||||||||||||||||||||||||||||||||||
| (Dollars in thousands) | ||||||||||||||||||||||||||||||||||||||||||||||||||||||||||||||||||||||
| Balance of allowance for loan losses applicable to: |
||||||||||||||||||||||||||||||||||||||||||||||||||||||||||||||||||||||
| Commercial and industrial loans |
$ | 2,905 | 28.0 | % | $ | 2,083 | 24.8 | % | $ | 2,334 | 27.0 | % | $ | 2,729 | 27.2 | % | $ | 2,713 | 29.5 | % | $ | 2,969 | 32.5 | % | $ | 1,822 | 25.7 | % | ||||||||||||||||||||||||||||||||||||||||||
| Real Estate: |
||||||||||||||||||||||||||||||||||||||||||||||||||||||||||||||||||||||
| Commercial real estate (including multi-family residential) |
4,533 | 44.3 | % | 3,396 | 46.6 | % | 3,799 | 42.9 | % | 2,175 | 47.9 | % | 2,124 | 46.5 | % | 1,077 | 44.4 | % | 595 | 46.6 | % | |||||||||||||||||||||||||||||||||||||||||||||||||
| Commercial real estate construction and land development |
842 | 9.0 | % | 615 | 8.9 | % | 578 | 8.5 | % | 357 | 8.6 | % | 225 | 6.3 | % | 126 | 5.2 | % | 206 | 6.2 | % | |||||||||||||||||||||||||||||||||||||||||||||||||
| 1-4 family residential (including home equity) |
1,255 | 11.6 | % | 875 | 12.5 | % | 1,008 | 13.5 | % | 558 | 10.7 | % | 608 | 12.0 | % | 475 | 11.2 | % | 419 | 12.1 | % | |||||||||||||||||||||||||||||||||||||||||||||||||
| Residential construction |
710 | 6.0 | % | 441 | 6.4 | % | 475 | 7.2 | % | 598 | 4.6 | % | 560 | 3.9 | % | 566 | 4.3 | % | 834 | 6.9 | % | |||||||||||||||||||||||||||||||||||||||||||||||||
| Consumer and other |
67 | 1.1 | % | 52 | 0.8 | % | 52 | 0.9 | % | 238 | 1.0 | % | 309 | 1.8 | % | 330 | 2.4 | % | 150 | 2.5 | % | |||||||||||||||||||||||||||||||||||||||||||||||||
|
|
|
|
|
|
|
|
|
|
|
|
|
|
|
|
|
|
|
|
|
|
|
|
|
|
|
|
|
|||||||||||||||||||||||||||||||||||||||||||
| Total allowance for loan losses |
$ | 10,312 | 100.0 | % | $ | 7,462 | 100.0 | % | $ | 8,246 | 100.0 | % | $ | 6,655 | 100.0 | % | $ | 6,539 | 100.0 | % | $ | 5,543 | 100.0 | % | $ | 4,026 | 100.0 | % | ||||||||||||||||||||||||||||||||||||||||||
|
|
|
|
|
|
|
|
|
|
|
|
|
|
|
|
|
|
|
|
|
|
|
|
|
|
|
|
|
|||||||||||||||||||||||||||||||||||||||||||
Securities
We use our securities portfolio to provide a source of liquidity, to provide an appropriate return on funds invested, to manage interest rate risk, to meet pledging requirements and to meet regulatory capital requirements. As of June 30, 2015, the carrying amount of investment securities totaled $151.7 million, an increase of $66.7 million or 78.5% compared with $85.0 million as of December 31, 2014. At December 31, 2014, the carrying amount of investment securities totaled $85.0 million, a decrease of $2.0 million, or 2.3%, compared with $87.0 million at December 31, 2013, due in part to growth in our loan portfolio and redeploying capital in connection therewith. Securities represented 7.8%, 6.6% and 7.5% of total assets as of June 30, 2015, December 31, 2014 and December 31, 2013, respectively.
All of the securities in our securities portfolio are classified as available for sale. Debt securities classified as available for sale are measured at fair value in the financial statements with unrealized gains and losses reported, net of tax, as accumulated comprehensive income or loss until realized. Interest earned on debt securities is included in interest income.
81
Table of Contents
The following table summarizes the amortized cost and fair value of the securities in our securities portfolio as of the dates shown:
| June 30, 2015 | ||||||||||||||||
| Amortized Cost |
Gross Unrealized Gains |
Gross Unrealized Losses |
Fair Value | |||||||||||||
| (Dollars in thousands) |
||||||||||||||||
| Available for Sale |
||||||||||||||||
| U.S. Government and agency securities |
$ | 8,641 | $ | 351 | $ | — | $ | 8,992 | ||||||||
| Municipal securities |
108,009 | 316 | (928 | ) | 107,397 | |||||||||||
| Agency mortgage-backed pass-through securities |
32,771 | 467 | (262 | ) | 32,976 | |||||||||||
| Agency collateralized mortgage obligations |
2,374 | 19 | (96 | ) | 2,297 | |||||||||||
|
|
|
|
|
|
|
|
|
|||||||||
| Total |
$ | 151,795 | $ | 1,153 | $ | (1,286 | ) | $ | 151,662 | |||||||
|
|
|
|
|
|
|
|
|
|||||||||
| December 31, 2014 | ||||||||||||||||
| Amortized Cost |
Gross Unrealized Gains |
Gross Unrealized Losses |
Fair Value |
|||||||||||||
| (Dollars in thousands) | ||||||||||||||||
| Available for Sale |
||||||||||||||||
| U.S. Government and agency securities |
$ | 14,080 | $ | 442 | $ | (45 | ) | $ | 14,477 | |||||||
| Municipal securities |
35,272 | 283 | (74 | ) | 35,481 | |||||||||||
| Agency mortgage-backed pass-through securities |
32,191 | 472 | (188 | ) | 32,475 | |||||||||||
| Agency collateralized mortgage obligations |
2,587 | 21 | (79 | ) | 2,529 | |||||||||||
|
|
|
|
|
|
|
|
|
|||||||||
| Total |
$ | 84,130 | $ | 1,218 | $ | (386 | ) | $ | 84,962 | |||||||
|
|
|
|
|
|
|
|
|
|||||||||
| December 31, 2013 | ||||||||||||||||
| Amortized Cost |
Gross Unrealized Gains |
Gross Unrealized Losses |
Fair Value |
|||||||||||||
| (Dollars in thousands) | ||||||||||||||||
| Available for Sale |
||||||||||||||||
| U.S. Treasury securities |
$ | 1,848 | $ | — | $ | (44 | ) | $ | 1,804 | |||||||
| U.S. Government and agency securities |
14,397 | 30 | (264 | ) | 14,163 | |||||||||||
| Municipal securities |
30,337 | 4 | (94 | ) | 30,247 | |||||||||||
| Agency mortgage-backed pass-through securities |
38,428 | 287 | (833 | ) | 37,882 | |||||||||||
| Agency collateralized mortgage obligations |
3,011 | 22 | (122 | ) | 2,911 | |||||||||||
|
|
|
|
|
|
|
|
|
|||||||||
| Total |
$ | 88,021 | $ | 343 | $ | (1,357 | ) | $ | 87,007 | |||||||
|
|
|
|
|
|
|
|
|
|||||||||
Certain investment securities are valued at less than their historical cost. Management evaluates securities for other-than-temporary impairment (“OTTI”) at least on a quarterly basis, and more frequently when economic or market conditions warrant such an evaluation. See “—Critical Accounting Policies—Securities” for additional information regarding how and when management evaluates securities for OTTI.
As of June 30, 2015, we do not intend to sell any debt securities classified as available for sale with unrealized losses; and management believes that we more likely than not will not be required to sell any debt securities before their anticipated recovery at which time we will receive full value for the securities. The unrealized losses are largely due to increases in market interest rates over the yields available at the time the underlying securities were purchased. The fair value is expected to recover as the securities approach their maturity date or repricing date or if market yields for such investments decline. Management does not believe any of the securities are impaired due to reasons of credit quality. Accordingly, as of June 30, 2015, management believes any impairment in our securities is temporary, and no impairment loss has been realized in our consolidated statements of income.
82
Table of Contents
The following table summarizes the contractual maturity of securities and their weighted average yields as of the dates indicated. The contractual maturity of a mortgage-backed security is the date at which the last underlying mortgage matures. Available for sale securities are shown at amortized cost. For purposes of the table below, municipal securities are calculated on a tax equivalent basis.
| June 30, 2015 | ||||||||||||||||||||||||||||||||||||||||
| Within One Year |
After One Year but Within Five Years |
After Five Years but Within Ten Years |
After Ten Years | Total | ||||||||||||||||||||||||||||||||||||
| Amount | Yield | Amount | Yield | Amount | Yield | Amount | Yield | Total | Yield | |||||||||||||||||||||||||||||||
| (Dollars in thousands) | ||||||||||||||||||||||||||||||||||||||||
| Available for Sale |
||||||||||||||||||||||||||||||||||||||||
| U.S. government and agency securities |
$ | — | 0.00 | % | $ | 2,008 | 1.46 | % | $ | 6,633 | 3.86 | % | $ | — | 0.00 | % | $ | 8,641 | 3.30 | % | ||||||||||||||||||||
| Municipal securities |
7,770 | 1.23 | % | 12,657 | 1.99 | % | 21,896 | 3.17 | % | 65,686 | 4.49 | % | 108,009 | 3.69 | % | |||||||||||||||||||||||||
| Agency mortgage-backed pass-through securities |
— | 0.00 | % | — | 0.00 | % | 3,424 | 2.16 | % | 29,347 | 2.52 | % | 32,771 | 2.49 | % | |||||||||||||||||||||||||
| Agency collateralized mortgage obligations |
— | 0.00 | % | — | 0.00 | % | — | 0.00 | % | 2,374 | 2.02 | % | 2,374 | 2.02 | % | |||||||||||||||||||||||||
|
|
|
|
|
|
|
|
|
|
|
|||||||||||||||||||||||||||||||
| Total |
$ | 7,770 | 1.23 | % | $ | 14,665 | 1.92 | % | $ | 31,953 | 3.20 | % | $ | 97,407 | 3.84 | % | $ | 151,795 | 3.38 | % | ||||||||||||||||||||
|
|
|
|
|
|
|
|
|
|
|
|||||||||||||||||||||||||||||||
| As of December 31, 2014 | ||||||||||||||||||||||||||||||||||||||||||||||||||
| Within One Year |
After One Year but within Five Years |
After Five Years but Within Ten Years |
After Ten Years | Total | ||||||||||||||||||||||||||||||||||||||||||||||
| Amount | Yield | Amount | Yield | Amount | Yield | Amount | Yield | Total | Yield | |||||||||||||||||||||||||||||||||||||||||
| (Dollars in thousands) | ||||||||||||||||||||||||||||||||||||||||||||||||||
| Available for Sale |
||||||||||||||||||||||||||||||||||||||||||||||||||
| U.S. government and agency securities |
$ | — | 0.00 | % | $ | 2,006 | 1.46 | % | $ | 7,966 | 3.19 | % | $ | 4,108 | 2.72 | % | $ | 14,080 | 2.82 | % | ||||||||||||||||||||||||||||||
| Municipal securities |
7,228 | 1.07 | % | 15,393 | 1.83 | % | 9,759 | 3.05 | % | 2,892 | 5.46 | % | 35,272 | 2.32 | % | |||||||||||||||||||||||||||||||||||
| Agency mortgage-backed pass-through securities |
— | 0.00 | % | — | 0.00 | % | 2,894 | 1.81 | % | 29,297 | 2.54 | % | 32,191 | 2.47 | % | |||||||||||||||||||||||||||||||||||
| Agency collateralized mortgage obligations |
— | 0.00 | % | — | 0.00 | % | — | 0.00 | % | 2,587 | 2.02 | % | 2,587 | 2.02 | % | |||||||||||||||||||||||||||||||||||
|
|
|
|
|
|
|
|
|
|
|
|||||||||||||||||||||||||||||||||||||||||
| Total |
$ | 7,228 | 1.07 | % | $ | 17,399 | 1.78 | % | $ | 20,619 | 2.95 | % | $ | 38,884 | 2.76 | % | $ | 84,130 | 2.46 | % | ||||||||||||||||||||||||||||||
|
|
|
|
|
|
|
|
|
|
|
|||||||||||||||||||||||||||||||||||||||||
| As of December 31, 2013 | ||||||||||||||||||||||||||||||||||||||||||||||||||
| Within One Year |
After One Year but Within Five Years |
After Five Years but Within Ten Years |
After Ten Years | Total | ||||||||||||||||||||||||||||||||||||||||||||||
| Amount | Yield | Amount | Yield | Amount | Yield | Amount | Yield | Total | Yield | |||||||||||||||||||||||||||||||||||||||||
| (Dollars in thousands) | ||||||||||||||||||||||||||||||||||||||||||||||||||
| Available for Sale |
||||||||||||||||||||||||||||||||||||||||||||||||||
| U.S. Treasury securities |
$ | — | 0.00 | % | $ | — | 0.00 | % | $ | 1,848 | 2.67 | % | $ | — | 0.00 | % | $ | 1,848 | 2.67 | % | ||||||||||||||||||||||||||||||
| U.S. government and agency securities |
— | 0.00 | % | 2,002 | 1.46 | % | 6,979 | 3.13 | % | 5,416 | 2.88 | % | 14,397 | 2.82 | % | |||||||||||||||||||||||||||||||||||
| Municipal securities |
4,284 | 0.61 | % | 18,496 | 0.94 | % | 4,149 | 2.37 | % | 3,408 | 3.42 | % | 30,337 | 1.38 | % | |||||||||||||||||||||||||||||||||||
| Agency mortgage-backed pass-through securities |
— | 0.00 | % | — | 0.00 | % | 146 | 3.73 | % | 38,282 | 2.36 | % | 38,428 | 2.36 | % | |||||||||||||||||||||||||||||||||||
| Agency collateralized mortgage obligations |
— | 0.00 | % | — | 0.00 | % | — | 0.00 | % | 3,011 | 2.08 | % | 3,011 | 2.08 | % | |||||||||||||||||||||||||||||||||||
|
|
|
|
|
|
|
|
|
|
|
|||||||||||||||||||||||||||||||||||||||||
| Total |
$ | 4,284 | 0.61 | % | $ | 20,498 | 1.00 | % | $ | 13,122 | 2.85 | % | $ | 50,117 | 2.48 | % | $ | 88,021 | 2.10 | % | ||||||||||||||||||||||||||||||
|
|
|
|
|
|
|
|
|
|
|
|||||||||||||||||||||||||||||||||||||||||
83
Table of Contents
The contractual maturity of mortgage-backed securities, collateralized mortgage obligations and asset backed securities is not a reliable indicator of their expected life because borrowers may have the right to prepay their obligations. Mortgage-backed securities, collateralized mortgage obligations and asset-backed securities are typically issued with stated principal amounts and are backed by pools of mortgage loans and other loans with varying maturities The term of the underlying mortgages and loans may vary significantly due to the ability of a borrower to pre-pay and, in particular, monthly pay downs on mortgage-backed securities tend to cause the average life of the securities to be much different than the stated contractual maturity. During a period of increasing interest rates, fixed rate mortgage-backed securities do not tend to experience heavy prepayments of principal and, consequently, the average life of this security will be lengthened. If interest rates begin to fall, prepayments may increase, thereby shortening the estimated life of this security.
As of June 30, 2015, December 31, 2014 and 2013, we did not own securities of any one issuer (other than the U.S. government and its agencies or sponsored entities) for which the aggregate adjusted cost exceeded 10% of our consolidated stockholders’ equity.
The average yield of our securities portfolio was 2.12% during the six months ended June 30, 2015 compared with 2.03% for the year ended December 31, 2014. The increase in average yield during 2014 compared to 2013 was primarily due to cash flows from lower-yielding, shorter-term securities that were reinvested in higher-yielding, longer-duration securities.
Goodwill and Core Deposit Intangibles
Our goodwill as of June 30, 2015, December 31, 2014 and 2013 was $39.4 million, $11.1 million and $11.0 million, respectively, and increases resulted from the F&M Bancshares acquisition, completed in January 2015, and the Independence acquisition, completed in November 2013. The slight increase in goodwill between December 31, 2013 and 2014 was the result of a measurement period adjustment recorded during 2014 related to the Independence acquisition. Goodwill resulting from business combinations represents the excess of the consideration paid over the fair value of the net assets acquired. Goodwill is assessed annually for impairment or when events or changes in circumstances indicate that the carrying amount of the asset may not be recoverable.
Our core deposit intangibles, net as of June 30, 2015, December 31, 2014 and 2013, was $5.6 million, $1.7 million and $2.0 million, respectively, and increased as a result of the F&M Bancshares acquisition, completed in January 2015, and the Independence acquisition, completed in November 2013. Core deposit intangibles arising from the Independence and F&M Bancshares acquisitions are amortized using a straight-line amortization method over its estimated useful life of 7 to 9 years.
Deposits
Our lending and investing activities are primarily funded by deposits. We offer a variety of deposit accounts having a wide range of interest rates and terms including demand, savings, money market and certificates and other time accounts. We rely primarily on convenient locations, personalized service and our customer relationships to attract and retain these deposits. At present, we do not attempt to attract deposits by offering high rates. Rather, we seek customers that will both engage in a lending and deposit relationship with us.
Total deposits at June 30, 2015 were $1.63 billion, an increase of $491.6 million, or 43.4%, compared with $1.13 billion at December 31, 2014. Noninterest-bearing deposits at June 30, 2015 were $556.5 million, an increase of $182.7 million, or 48.9%, compared with $373.8 million at December 31, 2014. Interest-bearing deposits at June 30, 2015 were $1.07 billion, an increase of $308.9 million, or 40.7%, compared with $759.9 million at December 31, 2014. The increase in deposits was primarily due to the deposits acquired in the F&M acquisition.
Total deposits at December 31, 2014 were $1.13 billion, an increase of $88.4 million, or 8.5%, compared with $1.05 billion at December 31, 2013. Noninterest-bearing deposits at December 31, 2014 were $373.8 million, an increase of $48.4 million, or 14.9%, compared with $325.4 million at December 31, 2013. Interest-
84
Table of Contents
bearing deposits at December 31, 2014 were $759.9 million, an increase of $40.0 million, or 5.6%, compared with $719.9 million at December 31, 2013. We did not actively seek to grow deposits in 2014. The deposit growth we experienced was largely the result of the growth in our customer lending base, many of whom also establish a deposit relationship with us.
The following table presents the daily average balances and weighted average rates paid on deposits for the periods indicated:
| For the Six Months Ended June 30, | For the Years Ended December 31, | |||||||||||||||||||||||||||||||
| 2015 | 2014 | 2014 | 2013 | |||||||||||||||||||||||||||||
| Average Balance |
Average Rate |
Average Balance |
Average Rate |
Average Balance |
Average Rate |
Average Balance |
Average Rate |
|||||||||||||||||||||||||
| (Dollars in thousands) |
||||||||||||||||||||||||||||||||
| Interest-bearing demand |
$ | 103,744 | 0.15 | % | $ | 63,363 | 0.24 | % | $ | 69,139 | 0.20 | % | $ | 41,162 | 0.19 | % | ||||||||||||||||
| Money market and savings |
413,287 | 0.42 | % | 248,137 | 0.44 | % | 263,277 | 0.43 | % | 225,436 | 0.51 | % | ||||||||||||||||||||
| Certificates and other time |
548,679 | 0.90 | % | 410,579 | 0.99 | % | 404,006 | 1.01 | % | 294,413 | 1.09 | % | ||||||||||||||||||||
|
|
|
|
|
|
|
|
|
|||||||||||||||||||||||||
| Total interest-bearing deposits |
1,065,710 | 0.64 | % | 722,079 | 0.73 | % | 736,422 | 0.73 | % | 561,011 | 0.79 | % | ||||||||||||||||||||
| Noninterest-bearing deposits |
533,098 | — | 307,825 | — | 328,743 | — | 232,197 | — | ||||||||||||||||||||||||
|
|
|
|
|
|
|
|
|
|||||||||||||||||||||||||
| Total deposits |
$ | 1,598,808 | 0.43 | % | $ | 1,029,904 | 0.51 | % | $ | 1,065,165 | 0.50 | % | $ | 793,208 | 0.56 | % | ||||||||||||||||
|
|
|
|
|
|
|
|
|
|||||||||||||||||||||||||
Our ratio of average noninterest-bearing deposits to average total deposits for the six months ended June 30, 2015 and for the years ended December 31, 2014 and 2013 was 33.3%, 30.9% and 29.3%, respectively.
The following table sets forth the amount of our certificates of deposit that are $100 thousand or greater by time remaining until maturity:
| As of June 30, 2015 |
As of December 31, 2014 |
|||||||
| (Dollars in thousands) | ||||||||
| Three months or less |
$ | 113,799 | $ | 74,431 | ||||
| Over three months through six months |
61,187 | 52,651 | ||||||
| Over six months through 12 months |
120,423 | 62,696 | ||||||
| Over 12 months through three years |
97,350 | 79,168 | ||||||
| Over three years |
29,876 | 33,606 | ||||||
|
|
|
|
|
|||||
| Total |
$ | 422,635 | $ | 302,552 | ||||
|
|
|
|
|
|||||
Borrowings
The Company has an available line of credit with the FHLB of Dallas, which allows us to borrow on a collateralized basis. FHLB advances are short-term, overnight borrowings and are used to manage liquidity as needed. Maturing advances are replaced by drawing on available cash, making additional borrowings or through increased customer deposits. At June 30, 2015, we had total funds of $548.6 million available under this agreement, of which $76.5 million was outstanding. Short-term overnight FHLB advances of $75.0 million were outstanding at June 30, 2015, at a weighted average rate of rate of 0.16%.
As of June 30, 2015, December 31, 2014 and 2013, we had $28.1 million, $10.1 million and $5.0 million, respectively, of indebtedness owed to another financial institution. On December 22, 2014, in connection with the acquisition of F&M Bancshares, we entered into a revolving credit agreement. Pursuant to our new revolving credit agreement, we borrowed approximately $10.1 million in December 2014 to pay off the prior indebtedness. In January 2015, we borrowed an additional $18.0 million under our revolving credit agreement to repay debt that F&M Bancshares owed to its shareholders. Our borrowings under the revolving credit agreement mature in
85
Table of Contents
December 2021. Interest accrues on borrowed funds at the Prime Rate minus 25 basis points, which equated to approximately 3.00% at June 30, 2015. Interest payments are due quarterly. In December 2015, we will begin paying annual payments on the principal amount outstanding. The revolving credit agreement is secured by 100% of the capital stock of the Bank.
The maximum commitment to advance funds under our revolving credit agreement is $30.0 million, which is reduced by $4.3 million on each December 22nd, beginning on December 22, 2015. We are required to repay any outstanding balance in excess of the then-current maximum commitment amount.
Our revolving credit agreement contains certain restrictive covenants, including limitations on our ability to incur additional indebtedness or engage in certain fundamental corporate transactions, such as mergers, reorganizations and recapitalizations. Additionally, the Bank is required to maintain a “well-capitalized” rating, a minimum return on assets of 0.65%, measured quarterly, a ratio of loan loss reserve to non-performing loans equal to or greater than 75%, measured quarterly, and a ratio of non-performing assets to aggregate equity plus loan loss reserves minus intangible assets of less than 35%, measured quarterly. As of June 30, 2015, we believe we are in compliance with these debt covenants and the lender has not delivered any notice of noncompliance under the terms of the credit documents.
Interest Rate Sensitivity and Market Risk
Our asset liability and funds management policy provides management with the guidelines for effective funds management, and we have established a measurement system for monitoring our net interest rate sensitivity position. We manage our sensitivity position within our established guidelines.
As a financial institution, our primary component of market risk is interest rate volatility. Fluctuations in interest rates will ultimately impact both the level of income and expense recorded on most of our assets and liabilities, and the market value of all interest-earning assets and interest-bearing liabilities, other than those which have a short term to maturity. Interest rate risk is the potential of economic losses due to future interest rate changes. These economic losses can be reflected as a loss of future net interest income and/or a loss of current fair market values. The objective is to measure the effect on net interest income and to adjust the balance sheet to minimize the inherent risk while at the same time maximizing income.
We have not entered into instruments such as leveraged derivatives, interest rate swaps, financial options, financial future contracts or forward delivery contracts for the purpose of reducing interest rate risk. Based upon the nature of our operations, we are not subject to foreign exchange or commodity price risk. We do not own any trading assets. We manage our exposure to interest rates by structuring our balance sheet in the ordinary course of a community banking business.
Our exposure to interest rate risk is managed by our Asset Liability Committee (“ALCO”), which is composed of certain members of our board of directors and Bank management, in accordance with policies approved by our board of directors. The ALCO formulates strategies based on appropriate levels of interest rate risk. In determining the appropriate level of interest rate risk, the ALCO considers the impact on earnings and capital of the current outlook on interest rates, potential changes in interest rates, regional economies, liquidity, business strategies and other factors. The ALCO meets regularly to review, among other things, the sensitivity of assets and liabilities to interest rate changes, the book and market values of assets and liabilities, unrealized gains and losses, purchase and sale activities, commitments to originate loans and the maturities of investments and borrowings. Additionally, the ALCO reviews liquidity, cash flow flexibility, maturities of deposits and consumer and commercial deposit activity. Management uses two methodologies to manage interest rate risk: (1) an analysis of relationships between interest-earning assets and interest-bearing liabilities; and (2) an interest rate shock simulation model. We have traditionally managed our business to reduce our overall exposure to changes in interest rates.
We use an interest rate risk simulation model and shock analysis to test the interest rate sensitivity of net interest income and the balance sheet, respectively. Contractual maturities and repricing opportunities of loans are incorporated in the model as are prepayment assumptions, maturity data and call options within the
86
Table of Contents
investment portfolio. Assumptions based on past experience are incorporated into the model for nonmaturity deposit accounts. The assumptions used are inherently uncertain and, as a result, the model cannot precisely measure future net interest income or precisely predict the impact of fluctuations in market interest rates on net interest income. Actual results will differ from the model’s simulated results due to timing, magnitude and frequency of interest rate changes as well as changes in market conditions and the application and timing of various management strategies.
We utilize static balance sheet rate shocks to estimate the potential impact on net interest income of changes in interest rates under various rate scenarios. This analysis estimates a percentage of change in the metric from the stable rate base scenario versus alternative scenarios of rising and falling market interest rates by instantaneously shocking a static balance sheet.
The following table summarizes the simulated change in net interest income over a 12-month horizon as of the dates indicated:
| Percent Change in Net Interest Income | ||||||||||||
| As of June 30, | As of December 31, | |||||||||||
| Change in Interest Rates (Basis Points) |
2015 | 2014 | 2013 | |||||||||
| +300 |
2.9 | % | 10.0 | % | 9.0 | % | ||||||
| +200 |
1.0 | % | 5.8 | % | 4.0 | % | ||||||
| +100 |
(0.5 | )% | 2.2 | % | 0.0 | % | ||||||
| Base |
0.0 | % | 0.0 | % | 0.0 | % | ||||||
| -100 |
2.5 | % | 2.4 | % | 0.0 | % | ||||||
The results are primarily due to behavior of demand, money market and savings deposits during such rate fluctuations. We have found that, historically, interest rates on these deposits change more slowly than changes in the discount and federal funds rates. This assumption is incorporated into the simulation model and is generally not fully reflected in an interest rate sensitivity analysis. The assumptions incorporated into the model are inherently uncertain and, as a result, the model cannot precisely measure future net interest income or precisely predict the impact of fluctuations in market interest rates on net interest income. Actual results will differ from the model’s simulated results due to timing, magnitude and frequency of interest rate changes as well as changes in market conditions and the application and timing of various strategies.
Liquidity and Capital Resources
Liquidity
Liquidity is the measure of our ability to meet the cash flow requirements of depositors and borrowers, while at the same time meeting our operating, capital, strategic cash flow needs and to maintain reserve requirements to operate on an ongoing basis and manage unexpected events, all at a reasonable cost. During the six months ended June 30, 2015 and the years ended December 31, 2014 and 2013, our liquidity needs have been met by core deposits, security and loan maturities and amortizing investment and loan portfolios. The Bank has access to purchased funds from correspondent banks and overnight advances from the FHLB are available under a security and pledge agreement to take advantage of investment opportunities.
87
Table of Contents
Average assets totaled $1.84 billion for the six months ended June 30, 2015 and $1.19 billion and $872.1 million, for the years ended December 31, 2014 and 2013, respectively. The following table illustrates, during the periods presented, the mix of our funding sources and the average assets in which those funds are invested as a percentage of our average total assets for the period indicated.
| For the Six Months Ended June 30, |
For the Years Ended December 31, |
|||||||||||
| 2015 | 2014 | 2013 | ||||||||||
| Sources of Funds: |
||||||||||||
| Deposits: |
||||||||||||
| Noninterest-bearing |
28.9 | % | 27.6 | % | 26.6 | % | ||||||
| Interest-bearing |
57.8 | % | 61.7 | % | 64.3 | % | ||||||
| Short-term borrowings |
0.1 | % | 0.0 | % | 0.0 | % | ||||||
| Subordinated debt |
0.5 | % | 0.0 | % | 0.0 | % | ||||||
| Other borrowed funds |
1.5 | % | 0.6 | % | 0.1 | % | ||||||
| Other liabilities |
0.4 | % | 0.3 | % | 0.3 | % | ||||||
| Stockholders’ equity |
10.8 | % | 9.8 | % | 8.7 | % | ||||||
|
|
|
|
|
|
|
|||||||
| Total |
100.0 | % | 100.0 | % | 100.0 | % | ||||||
|
|
|
|
|
|
|
|||||||
| Uses of Funds: |
||||||||||||
| Loans |
78.5 | % | 76.8 | % | 74.5 | % | ||||||
| Securities |
6.0 | % | 7.7 | % | 6.1 | % | ||||||
| Deposits in other financial institutions |
4.6 | % | 6.9 | % | 12.3 | % | ||||||
| Noninterest-earning assets |
10.9 | % | 8.6 | % | 7.1 | % | ||||||
|
|
|
|
|
|
|
|||||||
| Total |
100.0 | % | 100.0 | % | 100.0 | % | ||||||
|
|
|
|
|
|
|
|||||||
| Average noninterest-bearing deposits to average deposits |
33.3 | % | 30.9 | % | 29.3 | % | ||||||
| Average loans to average deposits |
90.5 | % | 86.1 | % | 81.9 | % | ||||||
Our largest source of funds is deposits and our largest use of funds is loans. We do not expect a change in the source or use of our funds in the foreseeable future. Our average loans increased $530.4 million, or 57.8%, for the six months ended June 30, 2015 compared with the year ended December 31, 2014. Our average loans increased $267.9 million, or 41.2% for the year ended December 31, 2014 compared with the year ended December 31, 2013. We predominantly invest excess deposits in Federal Reserve Bank of Dallas balances, securities, interest bearing deposits at other banks or other short-term liquid investments until the funds are needed to fund loan growth. Our securities portfolio had a weighted average life of 7.0 years and a modified duration of 5.9 years at June 30, 2015, a weighted average life of 5.2 years and a modified duration of 4.5 years at December 31, 2014 and a weighted average life of 4.9 years and a modified duration of 4.4 years at December 31, 2013.
As of June 30, 2015 and December 31, 2014, we had outstanding $490.2 million and $393.0 million, respectively, in commitments to extend credit and $6.4 million and $4.0 million, respectively, in commitments associated with outstanding standby letters of credit. Since commitments associated with letters of credit and commitments to extend credit may expire unused, the total outstanding may not necessarily reflect the actual future cash funding requirements.
As of June 30, 2015, December 31, 2014 and 2013, we had no exposure to future cash requirements associated with known uncertainties or capital expenditures of a material nature.
As of June 30, 2015, we had cash and cash equivalents of $138.7 million compared with $167.5 million at December 31, 2014, a decrease of $28.9 million. This decrease in cash and cash equivalents was primarily due to the purchase of securities of $542.3 million, an increase in total loans of $152.7 million and the purchase of bank owned life insurance of $10.0 million partially offset by proceeds from the maturities and paydowns of securities of $474.2 million, cash acquired in the F&M Bancshares acquisition of $106.5 million and proceeds from short-term borrowings of $75.0 million from FHLB.
88
Table of Contents
As of December 31, 2014, we had cash and cash equivalents of $167.5 million compared with $213.1 million at December 31, 2013, a decrease of $45.4 million. This decrease was primarily due to a net increase in loans held for investment of $165.9 million partially offset by an increase in deposits of $88.4 million, proceeds from the common stock offering in 2014 of $10.5 million, net earnings of $9.0 million and $5.1 million in net proceeds from a long-term borrowing.
Contractual Obligations
The following table summarizes our contractual obligations and other commitments to make future payments as of June 30, 2015 and December 31, 2014 (other than deposit obligations), which consist of our future cash payments associated with our contractual obligations pursuant to our non-cancelable future operating leases and our indebtedness owed to another financial institution. Payments related to leases are based on actual payments specified in underlying contracts.
| As of June 30, 2015 | ||||||||||||||||||||
| Less than 1 year |
1-3 years | 3 years or more but less than 5 years |
5 years or more |
Total | ||||||||||||||||
| (Dollars in thousands) | ||||||||||||||||||||
| Bank loan |
$ | 2,354 | $ | 8,570 | $ | 8,570 | $ | 8,575 | $ | 28,069 | ||||||||||
| Operating leases |
2,798 | 2,600 | 4,564 | 5,629 | 15,591 | |||||||||||||||
|
|
|
|
|
|
|
|
|
|
|
|||||||||||
| Total |
$ | 5,152 | $ | 11,170 | $ | 13,134 | $ | 14,204 | $ | 43,660 | ||||||||||
|
|
|
|
|
|
|
|
|
|
|
|||||||||||
| As of December 31, 2014 | ||||||||||||||||||||
| Less than 1 year |
1-3 Years |
3 years or more but less than 5 years |
5 years or more |
Total | ||||||||||||||||
| (Dollars in thousands) | ||||||||||||||||||||
| Bank loan |
$ | — | $ | — | $ | 1,494 | $ | 8,575 | $ | 10,069 | ||||||||||
| Operating leases |
2,281 | 4,664 | 3,072 | 3,867 | 13,884 | |||||||||||||||
|
|
|
|
|
|
|
|
|
|
|
|||||||||||
| Total |
$ | 2,281 | $ | 4,664 | $ | 4,566 | $ | 12,442 | $ | 23,953 | ||||||||||
|
|
|
|
|
|
|
|
|
|
|
|||||||||||
Off-Balance Sheet Items
In the normal course of business, we enter into various transactions, which, in accordance with accounting principles generally accepted in the United States, are not included in our consolidated balance sheets. We enter into these transactions to meet the financing needs of our customers. These transactions include commitments to extend credit and standby and commercial letters of credit, which involve, to varying degrees, elements of credit risk and interest rate risk in excess of the amounts recognized in our consolidated balance sheets.
89
Table of Contents
Our commitments associated with outstanding standby letters of credit and commitments to extend credit expiring by period are summarized below. Since commitments associated with letters of credit and commitments to extend credit may expire unused, the amounts shown do not necessarily reflect the actual future cash funding requirements:
| As of June 30, 2015 | ||||||||||||||||||||
| Less than 1 year |
1-3 years |
3 years or more but less than 5 years |
5 years or more |
Total | ||||||||||||||||
| (Dollars in thousands) | ||||||||||||||||||||
| Commitments to extend credit |
$ | 135,540 | $ | 224,340 | $ | 26,708 | $ | 103,635 | $ | 490,223 | ||||||||||
| Standby letters of credit |
4,056 | 2,382 | — | — | 6,438 | |||||||||||||||
|
|
|
|
|
|
|
|
|
|
|
|||||||||||
| Total |
$ | 139,596 | $ | 226,722 | $ | 26,708 | $ | 103,635 | $ | 496,661 | ||||||||||
|
|
|
|
|
|
|
|
|
|
|
|||||||||||
| As of December 31, 2014 | ||||||||||||||||||||
| Less than 1 year |
1-3 years |
3 years or more but less than 5 years |
5 years or more |
Total | ||||||||||||||||
| (Dollars in thousands) | ||||||||||||||||||||
| Commitments to extend credit |
$ | 285,641 | $ | 32,049 | $ | 34,354 | $ | 40,954 | $ | 392,998 | ||||||||||
| Standby letters of credit |
3,839 | 167 | — | — | 4,006 | |||||||||||||||
|
|
|
|
|
|
|
|
|
|
|
|||||||||||
| Total |
$ | 289,480 | $ | 32,216 | $ | 34,354 | $ | 40,954 | $ | 397,004 | ||||||||||
|
|
|
|
|
|
|
|
|
|
|
|||||||||||
Commitments to Extend Credit. We enter into contractual commitments to extend credit, normally with fixed expiration dates or termination clauses, at specified rates and for specific purposes. Substantially all of our commitments to extend credit are contingent upon customers maintaining specific credit standards at the time of loan funding. We minimize our exposure to loss under these commitments by subjecting them to credit approval and monitoring procedures. The amount and type of collateral obtained, if considered necessary by us, upon extension of credit, is based on management’s credit evaluation of the customer. Management assesses the credit risk associated with certain commitments to extend credit in determining the level of the allowance for loan losses.
Standby Letters of Credit. Standby letters of credit are conditional commitments issued by us to guarantee the performance of a customer to a third party. If the customer does not perform in accordance with the terms of the agreement with the third party, we would be required to fund the commitment and we would have the rights to the underlying collateral. The maximum potential amount of future payments we could be required to make is represented by the contractual amount of the commitment. Our policies generally require that standby letter of credit arrangements contain security and debt covenants similar to those contained in loan agreements.
Capital Resources
Capital management consists of providing equity to support our current and future operations. We are subject to capital adequacy requirements imposed by the Federal Reserve and the Bank is subject to capital adequacy requirements imposed by the FDIC. Both the Federal Reserve and the FDIC have adopted risk-based capital requirements for assessing bank holding company and bank capital adequacy. These standards define capital and establish minimum capital requirements in relation to assets and off-balance sheet exposure, adjusted for credit risk. The risk-based capital standards currently in effect are designed to make regulatory capital requirements more sensitive to differences in risk profiles among bank holding companies and banks, to account for off-balance sheet exposure and to minimize disincentives for holding liquid assets. Assets and off-balance sheet items are assigned to broad risk categories, each with appropriate relative risk weights. The resulting capital ratios represent capital as a percentage of total risk-weighted assets and off-balance sheet items.
90
Table of Contents
Under current guidelines, the minimum ratio of total capital to risk-weighted assets (which are primarily the credit risk equivalents of balance sheet assets and certain off-balance sheet items such as standby letters of credit) is 8.0%. At least half of total capital must be composed of tier 1 capital, which includes common stockholders’ equity (including retained earnings), less goodwill, other disallowed intangibles, and disallowed deferred tax assets, among other items. The Federal Reserve also has adopted a minimum leverage ratio, requiring tier 1 capital of at least 4.0% of average quarterly total consolidated assets, net of goodwill and certain other intangible assets, for all by the most highly rated bank holding companies. The federal banking agencies have also established risk-based and leverage capital guidelines that FDIC-insured depository institutions are required to meet. These regulations are generally similar to those established by the Federal Reserve for bank holding companies.
Under the Federal Deposit Insurance Act, the federal bank regulatory agencies must take “prompt corrective action” against undercapitalized U.S. depository institutions. U.S. depository institutions are assigned one of five capital categories: “well capitalized,” “adequately capitalized,” “undercapitalized,” “significantly undercapitalized” and “critically undercapitalized,” and are subjected to different regulation corresponding to the capital category within which the institution falls. A depository institution is deemed to be “well capitalized” if the banking institution has a total risk-based capital ratio of 10.0% or greater, a tier 1 risk-based capital ratio of 8.0% or greater, a common equity Tier 1 capital ratio of 6.5% and a leverage ratio of 5.0% or greater, and the institution is not subject to an order, written agreement, capital directive or prompt corrective action directive to meet and maintain a specific level for any capital measure. Under certain circumstances, a well-capitalized, adequately capitalized or undercapitalized institution may be treated as if the institution were in the next lower capital category.
Failure to meet capital guidelines could subject the institution to a variety of enforcement remedies by federal bank regulatory agencies, including: termination of deposit insurance by the FDIC, restrictions on certain business activities, and appointment of the FDIC as conservator or receiver. As of June 30, 2015, December 31, 2014 and December 31, 2013, the Bank was well-capitalized.
Total stockholder’s equity was $201.8 million at June 30, 2015, compared with $131.8 million at December 31, 2014, an increase of $70.1 million, or 53.2%. This increase was primarily the result of $51.4 million of common stock issued in connection with the acquisition of F&M Bancshares and net income of $7.4 million for the six months ended June 30, 2015.
Total stockholders’ equity increased to $131.8 million at December 31, 2014, compared with $109.7 million at December 31, 2013, an increase of $22.1 million, or 20.1%. This increase was primarily the result of $10.5 million in proceeds from the issuance of common stock in 2014 to support our capital position and net income in 2014 of $9.0 million.
91
Table of Contents
The following table provides a comparison our leverage and risk-weighted capital ratios as of the dates indicated to the minimum and well-capitalized regulatory standards:
| Actual | For Capital Adequacy Purposes |
To Be Categorized As Well Capitalized Under Prompt Corrective Action Provisions | ||||||||||||||||||||||||||||
| Amount | Ratio | Amount | Ratio(1) | Amount | Ratio | |||||||||||||||||||||||||
| (Dollars in thousands) | ||||||||||||||||||||||||||||||
| ALLEGIANCE BANCSHARES, INC. (Consolidated) |
||||||||||||||||||||||||||||||
| As of June 30, 2015 |
||||||||||||||||||||||||||||||
| Total Capital (to Risk Weighted Assets) |
$ | 179,614 | 10.48 | % | $ | 137,141 | 8.00 | % | N/A | N/A | ||||||||||||||||||||
| Common Equity Tier I Capital (to Risk Weighted Assets) |
148,719 | 8.68 | % | 77,142 | 4.50 | % | N/A | N/A | ||||||||||||||||||||||
| Tier I Capital (to Risk Weighted Assets) |
169,301 | 9.88 | % | 102,856 | 6.00 | % | N/A | N/A | ||||||||||||||||||||||
| Tier I Capital (to Average Tangible Assets) |
169,301 | 9.34 | % | 72,521 | 4.00 | % | N/A | N/A | ||||||||||||||||||||||
| As of December 31, 2014(2) |
||||||||||||||||||||||||||||||
| Total Capital (to Risk Weighted Assets) |
$ | 126,584 | 12.80 | % | $ | 79,127 | 8.00 | % | N/A | N/A | ||||||||||||||||||||
| Tier I Capital (to Risk Weighted Assets) |
118,338 | 11.96 | % | 39,564 | 4.00 | % | N/A | N/A | ||||||||||||||||||||||
| Tier I Capital (to Average Tangible Assets) |
118,338 | 9.55 | % | 49,549 | 4.00 | % | N/A | N/A | ||||||||||||||||||||||
| Actual | For Capital Adequacy Purposes |
To Be Categorized As Well Capitalized Under Prompt Corrective Action Provisions | ||||||||||||||||||||||||||||
| Amount | Ratio | Amount | Ratio(1) | Amount | Ratio | |||||||||||||||||||||||||
| (Dollars in thousands) | ||||||||||||||||||||||||||||||
| ALLEGIANCE BANK |
||||||||||||||||||||||||||||||
| As of June 30, 2015 |
||||||||||||||||||||||||||||||
| Total Capital (to Risk Weighted Assets) |
$ | 195,666 | 11.42 | % | $ | 137,067 | 8.00 | % | $ | 171,333 | 10.00 | % | ||||||||||||||||||
| Common Equity Tier I Capital (to Risk Weighted Assets) |
185,354 | 10.82 | % | 77,100 | 4.50 | % | 102,800 | 6.50 | % | |||||||||||||||||||||
| Tier I Capital (to Risk Weighted Assets) |
185,354 | 10.82 | % | 102,800 | 6.00 | % | 102,800 | 8.00 | % | |||||||||||||||||||||
| Tier I Capital (to Average Tangible Assets) |
185,354 | 10.23 | % | 72,489 | 4.00 | % | 90,611 | 5.00 | % | |||||||||||||||||||||
| As of December 31, 2014(2) |
||||||||||||||||||||||||||||||
| Total Capital (to Risk Weighted Assets) |
$ | 124,472 | 12.59 | % | $ | 79,066 | 8.00 | % | $ | 98,833 | 10.00 | % | ||||||||||||||||||
| Tier I Capital (to Risk Weighted Assets) |
116,226 | 11.76 | % | 39,533 | 4.00 | % | 59,300 | 6.00 | % | |||||||||||||||||||||
| Tier I Capital (to Average Tangible Assets) |
116,226 | 9.38 | % | 49,549 | 4.00 | % | 61,936 | 5.00 | % | |||||||||||||||||||||
| (1) | The Federal Reserve may require the Company and the FDIC may require the Bank to maintain capital ratios above the required minimums. |
| (2) | Does not reflect impact of acquisition of F&M Bancshares and/or Enterprise Bank. |
In July 2013, the federal banking agencies published final rules establishing a new comprehensive capital framework for U.S. banking organizations. These rules became effective as applied to us on January 1, 2015, with a phase in period from January 1, 2015 through January 1, 2019. See “Regulation and Supervision—US Implementation of Basel III.”
Quantitative and Qualitative Disclosures About Market Risk
For information regarding the market risk of our financial instruments, see “—Interest Rate Sensitivity and Market Risk.” Our principal market risk exposure is to changes in interest rates.
92
Table of Contents
GAAP Reconciliation and Management’s Explanation of Non-GAAP Financial Measures
We identify certain financial measures discussed in this prospectus as being “non-GAAP financial measures.” In accordance with the SEC’s rules, we classify a financial measure as being a non-GAAP financial measure if that financial measure excludes or includes amounts, or is subject to adjustments that have the effect of excluding or including amounts, that are included or excluded, as the case may be, in the most directly comparable measure calculated and presented in accordance with generally accepted accounting principles as in effect from time to time in the United States in our statements of income, balance sheet or statements of cash flows. Non-GAAP financial measures do not include operating and other statistical measures or ratios or statistical measures calculated using exclusively either financial measures calculated in accordance with GAAP, operating measures or other measures that are not non-GAAP financial measures or both.
The non-GAAP financial measures that we discuss in this prospectus should not be considered in isolation or as a substitute for the most directly comparable or other financial measures calculated in accordance with GAAP. Moreover, the manner in which we calculate the non-GAAP financial measures that we discuss in this prospectus may differ from that of other companies reporting measures with similar names. You should understand how such other banking organizations calculate their financial measures similar or with names similar to the non-GAAP financial measures we have discussed in this prospectus when comparing such non-GAAP financial measures.
Our management uses these non-GAAP financial measures in its analysis of our performance.
| • | “Tangible Stockholders’ Equity” is stockholders’ equity reduced by goodwill and core deposit intangibles, net of accumulated amortization. |
| • | “Tangible Book Value Per Share” is a non-GAAP measure generally used by financial analysts and investment bankers to evaluate financial institutions. Tangible book value per share is defined as total equity reduced by goodwill and core deposit intangibles, net of accumulated amortization, divided by total shares outstanding. This measure is important to investors interested in changes from period to period in book value per share, exclusive of changes in intangible assets. For tangible book value per share, the most directly comparable financial measure calculated in accordance with GAAP is our book value per share. |
| • | “Tangible Equity to Tangible Assets” is a non-GAAP measure generally used by financial analysts and investment bankers to evaluate financial institutions. Tangible equity to tangible assets is defined as the ratio of total stockholders’ equity less goodwill and core deposit intangibles, net of accumulated amortization, divided by tangible assets, which are total assets less goodwill and core deposit intangibles, net of accumulated amortization. This measure is important to investors interested in changes from period to period in equity and total assets, each exclusive of changes in intangible assets. For tangible equity to tangible assets, the most directly comparable financial measure calculated in accordance with GAAP is total stockholders’ equity to total assets. We believe that this measure is important to many investors in the marketplace who are interested in the relative changes from period to period in common equity and total assets, each exclusive of changes in intangible assets. Goodwill and other intangible assets have the effect of increasing both total stockholders’ equity and assets while not increasing our tangible common equity or tangible assets. |
93
Table of Contents
We believe these non-GAAP financial measures provide useful information to management and investors that is supplementary to our financial condition, results of operations and cash flows computed in accordance with GAAP; however, we acknowledge that our non-GAAP financial measures have a number of limitations. As such, you should not view these disclosures as a substitute for results determined in accordance with GAAP, and they are not necessarily comparable to non-GAAP financial measures that other companies use. The following reconciliation tables provides a more detailed analysis of these non-GAAP financial measures:
| As of and for the Six Months Ended June 30, |
As of and for the Years Ended December 31, | |||||||||||||||||||||||||||
| 2015 | 2014 | 2014 | 2013 | 2012 | 2011 | 2010 | ||||||||||||||||||||||
| (Dollars in thousands, except share and per share data) | ||||||||||||||||||||||||||||
| Total stockholders’ equity |
$ | 201,830 | $ | 116,071 | $ | 131,778 | $ | 109,736 | $ | 68,085 | $ | 52,907 | $ | 45,392 | ||||||||||||||
| Less: |
||||||||||||||||||||||||||||
| Goodwill and core deposit intangibles, net |
45,034 | 13,050 | 12,891 | 13,044 | — | — | — | |||||||||||||||||||||
|
|
|
|
|
|
|
|
|
|
|
|
|
|
|
|||||||||||||||
| Tangible stockholders’ equity |
$ | 156,796 | $ | 103,021 | $ | 118,887 | $ | 96,692 | $ | 68,085 | $ | 52,907 | $ | 45,392 | ||||||||||||||
|
|
|
|
|
|
|
|
|
|
|
|
|
|
|
|||||||||||||||
| Less: |
||||||||||||||||||||||||||||
| Preferred stock |
11,550 | — | — | — | — | — | — | |||||||||||||||||||||
|
|
|
|
|
|
|
|
|
|
|
|
|
|
|
|||||||||||||||
| Tangible common stockholders’ equity |
$ | 145,246 | $ | 103,021 | $ | 118,887 | $ | 96,69 | 2 | $ | 68,085 | $ | 52,907 | $ | 45,392 | |||||||||||||
|
|
|
|
|
|
|
|
|
|
|
|
|
|
|
|||||||||||||||
| Shares outstanding at end of period(1) |
9,822,950 | 6,977,246 | 7,477,309 | 6,953,125 | 5,182,734 | 4,557,992 | 4,333,782 | |||||||||||||||||||||
| Tangible book value per common share |
$ | 14.79 | $ | 14.77 | $ | 15.90 | $ | 13.91 | $ | 13.14 | $ | 11.61 | $ | 10.47 | ||||||||||||||
| Net income attributable to common stockholders |
$ | 6,968 | $ | 4,684 | $ | 9,005 | $ | 6,839 | $ | 4,555 | $ | 2,995 | $ | 2,013 | ||||||||||||||
|
|
|
|
|
|
|
|
|
|
|
|
|
|
|
|||||||||||||||
| Average common stockholders’ equity |
188,112 | 113,745 | $ | 116,460 | $ | 75,787 | $ | 61,699 | $ | 47,523 | $ | 42,297 | ||||||||||||||||
| Less: |
||||||||||||||||||||||||||||
| Average goodwill and other intangible assets, net |
45,205 | 13,049 | 13,007 | 1,615 | — | — | — | |||||||||||||||||||||
|
|
|
|
|
|
|
|
|
|
|
|
|
|
|
|||||||||||||||
| Average tangible common stockholders’ equity |
$ | 142,907 | $ | 100,696 | $ | 103,453 | $ | 74,172 | $ | 61,699 | $ | 47,523 | $ | 42,297 | ||||||||||||||
|
|
|
|
|
|
|
|
|
|
|
|
|
|
|
|||||||||||||||
| Return on average tangible common equity(2)(3) |
9.83 | % | 9.38 | % | 8.70 | % | 9.22 | % | 7.38 | % | 6.30 | % | 4.76 | % | ||||||||||||||
| Total assets |
$ | 1,945,156 | $ | 1,205,632 | $ | 1,280,008 | $ | 1,164,759 | $ | 774,308 | $ | 616,467 | $ | 428,445 | ||||||||||||||
| Less: |
||||||||||||||||||||||||||||
| Goodwill and core deposit intangibles, net |
45,034 | 13,050 | 12,891 | 13,044 | — | — | — | |||||||||||||||||||||
|
|
|
|
|
|
|
|
|
|
|
|
|
|
|
|||||||||||||||
| Tangible assets |
$ | 1,900,122 | $ | 1,192,582 | $ | 1,267,117 | $ | 1,151,715 | $ | 774,308 | $ | 616,467 | $ | 428,445 | ||||||||||||||
|
|
|
|
|
|
|
|
|
|
|
|
|
|
|
|||||||||||||||
| Tangible common equity to tangible assets |
7.64 | % | 8.64 | % | 9.38 | % | 8.40 | % | 8.79 | % | 8.58 | % | 10.59 | % | ||||||||||||||
| (1) | Does not include 1,746, 3,467, 7,199, 11,426, 8,366 and 3,500 shares of treasury stock as of June 30, 2015 and 2014 and December 31, 2013, 2012 and 2010, respectively. There were no shares of treasury stock outstanding as of December 31, 2014 or December 31, 2011. |
| (2) | As a result of system conversions, we are unable to calculate daily average balances for 2012, 2011 or 2010. For these periods, average loans, securities, deposits in other financial institutions, assets and equity are calculated by averaging the ending balance of the prior month and the ending balance of the current month and multiplying the average by the number of days in the current month. The twelve resulting products were then added together and the resulting sum is divided by the number of days in the year. |
| (3) | Interim periods annualized. |
94
Table of Contents
| Three Months Ended | ||||||||
| June 30, 2015 |
March 31, 2015 |
|||||||
| Total stockholders’ equity |
$ | 201,830 | $ | 199,024 | ||||
| Less: |
||||||||
| Goodwill and core deposit intangibles, net |
45,034 | 45,241 | ||||||
|
|
|
|
|
|||||
| Tangible stockholders’ equity |
$ | 156,796 | $ | 153,783 | ||||
|
|
|
|
|
|||||
| Less: |
||||||||
| Preferred stock |
11,550 | 11,550 | ||||||
|
|
|
|
|
|||||
| Tangible common stockholders’ equity |
$ | 145,246 | $ | 142,233 | ||||
|
|
|
|
|
|||||
| Shares outstanding at end of period(1) |
9,822,950 | 9,824,116 | ||||||
| Tangible book value per common share |
$ | 14.79 | $ | 14.48 | ||||
| Net income attributable to common stockholders |
$ | 3,623 | $ | 3,345 | ||||
|
|
|
|
|
|||||
| Average common stockholders’ equity |
189,907 | 186,294 | ||||||
| Less: |
||||||||
| Average goodwill and other intangible assets, net |
45,150 | 45,260 | ||||||
|
|
|
|
|
|||||
| Average tangible common stockholders’ equity |
$ | 144,757 | $ | 141,034 | ||||
|
|
|
|
|
|||||
| Return on average tangible common equity(2) |
10.04 | % | 9.62 | % | ||||
| Total assets |
$ | 1,945,156 | $ | 1,884,886 | ||||
| Less: |
||||||||
| Goodwill and core deposit intangibles, net |
45,034 | 45,241 | ||||||
|
|
|
|
|
|||||
| Tangible assets |
$ | 1,900,122 | $ | 1,839,645 | ||||
|
|
|
|
|
|||||
| Tangible common equity to tangible assets |
7.64 | % | 7.73 | % | ||||
| (1) | Does not include 1,746 shares of treasury stock as of June 30, 2015. There were no shares of treasury stock |
outstanding as of March 31, 2015.
| (2) | Interim periods annualized. |
95
Table of Contents
UNAUDITED SELECTED PRO FORMA COMBINED FINANCIAL DATA
The following unaudited selected pro forma combined financial data combines data from the historical consolidated financial statements of the Company and the historical consolidated financial statements of F&M Bancshares, giving effect to the merger of the two institutions.
The following unaudited selected pro forma combined statement of income data for the year ended December 31, 2014 combines data from the historical consolidated statement of income of the Company for the year ended December 31, 2014 and the historical consolidated statement of income of F&M Bancshares for the year ended December 31, 2014, giving effect to the merger as if it had been consummated on January 1, 2014.
The following unaudited selected pro forma combined financial data give effect to the merger using the acquisition method of accounting for business combinations as required by accounting principles generally accepted in the United States of America.
The following unaudited selected pro forma combined financial data should be read in conjunction with the audited consolidated financial statements and the notes thereto of each of the Company and F&M Bancshares contained elsewhere in this prospectus.
The following unaudited selected pro forma combined financial data are provided for informational purposes only and are not necessarily indicative of the actual results that might have been achieved for the periods or dates indicated, nor are they necessarily indicative of the future results of the combined company. The following unaudited selected pro forma combined financial data are based on estimates and assumptions set forth below.
In connection with the integration of F&M Bancshares into the Company, the Company has incurred and will incur costs associated with systems implementation, severance and other costs related to exit or disposal activities. The following unaudited selected pro forma combined financial data do not reflect these transaction costs or cost savings expected to be realized from the elimination of certain expenses and from synergies expected to be created or the costs to achieve such cost savings or synergies. Transaction costs not yet incurred or cost savings not yet realized will be recorded when incurred, are non-recurring and are thus not reflected in the calculations of pro forma income.
96
Table of Contents
Unaudited Selected Pro Forma Combined Income Statement(1)
| For the Year Ended December 31, 2014 | ||||||||||||||||||
| Allegiance | F&M Bancshares |
Pro Forma Adjustments |
Combined | |||||||||||||||
| (Dollars in thousands, except share and per share data) | ||||||||||||||||||
| Interest income |
||||||||||||||||||
| Interest and fees on loans |
$ | 50,243 | $ | 23,104 | $ | 3,916 | (A) | $ | 77,263 | |||||||||
| Interest on investment securities |
1,851 | 378 | — | 2,229 | ||||||||||||||
| Interest on deposits at other financial institutions |
311 | 136 | — | 447 | ||||||||||||||
|
|
|
|
|
|
|
|
|
|||||||||||
| Total interest income |
52,405 | 23,618 | 3,916 | 79,939 | ||||||||||||||
| Interest expense on deposits |
5,342 | 2,020 | (507 | ) | (B) | 6,855 | ||||||||||||
| Interest expense on subordinated debt |
— | 309 | 329 | (C) | 638 | |||||||||||||
| Interest expense on borrowings |
229 | 1,273 | (720 | ) | (D) | 782 | ||||||||||||
|
|
|
|
|
|
|
|
|
|||||||||||
| Net interest income |
46,834 | 20,016 | 4,814 | 71,664 | ||||||||||||||
| Provision for loan losses |
2,150 | — | — | (E) | 2,150 | |||||||||||||
|
|
|
|
|
|
|
|
|
|||||||||||
| Net interest income after provision for loan losses |
44,684 | 20,016 | 4,814 | 69,514 | ||||||||||||||
| Noninterest income |
||||||||||||||||||
| Service charges and NSF fees on deposit accounts |
945 | 888 | — | 1,833 | ||||||||||||||
| Other income |
1,662 | 470 | — | 2,132 | ||||||||||||||
|
|
|
|
|
|
|
|
|
|||||||||||
| Total noninterest income |
2,607 | 1,358 | — | 3,965 | ||||||||||||||
| Noninterest expenses |
||||||||||||||||||
| Salaries and employee benefits |
20,179 | 12,026 | (2,217 | ) | (F) | 29,988 | ||||||||||||
| Net occupancy and equipment |
3,316 | 1,197 | — | 4,513 | ||||||||||||||
| Data processing and software amortization |
1,658 | 670 | (2 | ) | (F) | 2,326 | ||||||||||||
| Depreciation |
1,084 | 271 | — | 1,355 | ||||||||||||||
| Professional fees |
2,294 | 2,355 | (976 | ) | (F) | 3,673 | ||||||||||||
| Regulatory assessments and FDIC Insurance |
848 | 402 | — | 1,250 | ||||||||||||||
| Core deposit intangibles and amortization |
298 | — | 533 | (G) | 831 | |||||||||||||
| Other |
3,781 | 1,266 | (18 | ) | (F) | 5,029 | ||||||||||||
|
|
|
|
|
|
|
|
|
|||||||||||
| Total noninterest expenses |
33,458 | 18,187 | (2,680 | ) | 48,965 | |||||||||||||
|
|
|
|
|
|
|
|
|
|||||||||||
| Income before income tax |
13,833 | 3,187 | 7,494 | 24,514 | ||||||||||||||
| Income tax expense |
4,828 | 1,015 | 2,623 | (H) | 8,466 | |||||||||||||
|
|
|
|
|
|
|
|
|
|||||||||||
| Net income |
$ | 9,005 | $ | 2,172 | $ | 4,871 | $ | 16,048 | ||||||||||
|
|
|
|
|
|
|
|
|
|||||||||||
| Preferred stock dividends |
— | (1,049 | ) | — | (1,049 | ) | ||||||||||||
|
|
|
|
|
|
|
|
|
|||||||||||
| Net income attributable to common stockholders |
$ | 9,005 | $ | 1,123 | $ | 4,871 | $ | 14,999 | ||||||||||
|
|
|
|
|
|
|
|
|
|||||||||||
| Earnings per common share: |
||||||||||||||||||
| Basic |
$ | 1.29 | $ | 1.53 | ||||||||||||||
| Diluted |
$ | 1.26 | $ | 1.51 | ||||||||||||||
| Average common shares outstanding: |
||||||||||||||||||
| Basic |
6,978,025 | 9,796,389 | ||||||||||||||||
| Diluted |
7,142,377 | 9,960,742 | ||||||||||||||||
| (1) | The acquisition of F&M Bancshares was closed on January 1, 2015, which was a bank holiday and a day on which no business was transacted. We have not included pro forma combined income statement information for the six months ended June 30, 2015 in this prospectus as our historical consolidated income statement information for the three months ended June 30, 2015 includes F&M Bancshares. |
97
Table of Contents
Notes to Unaudited Selected Pro Forma Combined Financial Data
The following pro forma adjustments have been reflected in the unaudited selected pro forma combined financial information. Certain adjustments are based on assumptions and valuations performed by a third party, which are subject to change, and are part of the acquisition accounting transactions.
| (A) | Adjustment represents the change in loan interest income for the year ended December 31, 2014 that would have resulted had the loans been acquired as of January 1, 2014. We evaluated the acquired loan portfolio to estimate the necessary credit and interest rate fair value adjustments. Subsequently, the accretable portion of the fair value adjustment will be accreted into earnings using the level yield method over the remaining maturity of the underlying loans. The adjustment represents interest accretion for a full year. |
| (B) | We have evaluated the acquired certificate of deposit portfolio to estimate the necessary fair value adjustments. Subsequently, the fair value adjustment will be accreted into earnings using the level yield method over the estimated lives of the acquired certificates of deposit. |
| (C) | We have evaluated the acquired junior subordinated debentures to estimate the necessary fair value adjustments. Subsequently, the fair value adjustment will be amortized into earnings using the level yield method. |
| (D) | F&M Bancshares had related party borrowings at 7.00%. As part of the acquisition, we entered into a borrowing agreement at 3.00%. This adjustment represents the difference in interest expense between F&M Bancshares’ borrowing rate and our borrowing rate. |
| (E) | Provision for loan losses does not reflect any potential impact of the fair value adjustments related to loans which include an estimate of credit losses. |
| (F) | Adjustments eliminate $3.2 million of direct, incremental costs of the F&M Bancshares acquisition that were previously recognized in the historical financial statements of the Company and F&M Bancshares. These costs primarily include $2.2 million of bonus payments related to the cancellation of stock options held by F&M Bancshares employees, $763 thousand associated with professional consulting fees and $213 thousand of legal fees related to the transaction. |
| (G) | Adjustment reflects the change in amortization for the year ended December 31, 2014 that would have resulted from the amortization of the core deposit intangible had the deposits been acquired as of January 1, 2014. The amortization of the core deposit intangible was calculated on a straight-line basis over the estimated useful life of eight years. |
| (H) | Adjustment reflects the tax impact of the pro forma acquisition adjustments to our marginal income tax rate of 35%. |
98
Table of Contents
The U.S. banking industry is highly regulated under federal and state law. These laws and regulations affect the operations and performance of us and our subsidiaries.
Statutes, regulations and policies limit the activities in which we may engage and how we conduct certain permitted activities. Further, the bank regulatory system imposes reporting and information collection obligations. We incur significant costs relating to compliance with these laws and regulations. Banking statutes, regulations and policies are continually under review by federal and state legislatures and regulatory agencies, and a change in them, including changes in how they are interpreted or implemented, could have a material adverse effect on our business.
The material statutory and regulatory requirements that are applicable to us are summarized below. The description below is not intended to summarize all laws and regulations applicable to us and our subsidiaries, and is based upon the statutes, regulations, policies, interpretive letters and other written guidance that are in effect as of the date of this prospectus.
Bank and Bank Holding Company Regulation
The Bank is currently a Texas-chartered banking association, the deposits of which are insured by the FDIC’s Deposit Insurance Fund up to applicable legal limits. The Bank is subject to ongoing and comprehensive supervision, regulation, examination and enforcement by the Texas Department of Banking (the “TDB”) and the FDIC.
Any entity that directly or indirectly controls a bank must be approved to become a bank holding company by the Federal Reserve under the Bank Holding Company Act of 1956 (the “BHC Act”). Bank holding companies are subject to regulation, inspection, examination, supervision and enforcement by the Federal Reserve under the BHC Act. The Federal Reserve’s jurisdiction also extends to any company that is directly or indirectly controlled by a bank holding company.
As a bank holding company, we are subject to ongoing and comprehensive supervision, regulation, examination and enforcement by the Federal Reserve. As a bank holding company of a Texas state chartered bank, we are also subject to supervision, regulation, examination and enforcement by the TDB.
Broad Supervision, Examination and Enforcement Powers
A principal objective of the U.S. bank regulatory system is to protect depositors by ensuring the financial safety and soundness of banking organizations. To that end, the banking regulators have broad regulatory, examination and enforcement authority. The regulators regularly examine the operations of banking organizations. In addition, banking organizations are subject to periodic reporting requirements. Insured depository institutions with total assets of $500 million or more must submit annual audit reports prepared by independent auditors to federal and state regulators. In some instances, the audit report of the insured depository institution’s bank holding company can be used to satisfy this requirement. Auditors must receive examination reports, supervisory agreements and reports of enforcement actions.
The regulators have various remedies available if they determine that the financial condition, capital resources, asset quality, earnings prospects, management, liquidity or other aspects of a banking organization’s operations are unsatisfactory. The regulators may also take action if they determine that the banking organization or its management is violating or has violated any law or regulation. The regulators have the power to, among other things:
| • | enjoin “unsafe or unsound” practices; |
| • | require affirmative actions to correct any violation or practice; |
99
Table of Contents
| • | issue administrative orders that can be judicially enforced; |
| • | direct increases in capital; |
| • | direct the sale of subsidiaries or other assets; |
| • | limit dividends and distributions; |
| • | restrict growth; |
| • | assess civil monetary penalties; |
| • | remove officers and directors; and |
| • | terminate deposit insurance. |
The FDIC may terminate a depository institution’s deposit insurance upon a finding that the institution’s financial condition is unsafe or unsound or that the institution has engaged in unsafe or unsound practices or has violated any applicable rule, regulation, order or condition enacted or imposed by the institution’s bank regulators. Engaging in unsafe or unsound practices or failing to comply with applicable laws, regulations and supervisory agreements could subject us and our subsidiaries or their officers, directors and institution-affiliated parties to the remedies described above and other sanctions.
The Dodd-Frank Act
On July 21, 2010, the Dodd-Frank Wall Street Reform and Consumer Protection Act (the “Dodd-Frank Act”) was signed into law. The Dodd-Frank Act is having a broad impact on the financial services industry, and imposes significant regulatory and compliance requirements, including the designation of certain financial companies as systemically important financial companies, enhanced oversight of credit rating agencies, the imposition of increased capital, leverage, and liquidity requirements, and numerous other provisions designed to improve supervision and oversight of, and strengthen safety and soundness within, the financial services sector. Additionally, the Dodd-Frank Act established a new framework of authority to conduct systemic risk oversight within the financial system to be distributed among federal regulatory agencies, including the Financial Stability Oversight Council, the Federal Reserve, the Office of the Comptroller of the Currency (the “OCC”), and the FDIC.
The following items provide a brief description of certain provisions of the Dodd-Frank Act that are most relevant to us and the Bank.
| • | Source of strength. Under Federal Reserve policy, bank holding companies have historically been required to act as a source of financial and managerial strength to each of their banking subsidiaries, and the Dodd-Frank Act codified this policy as a statutory requirement. The Dodd-Frank Act requires all companies, including bank holding companies, that directly or indirectly control an insured depository institution to serve as a source of strength for the institution. As a result of this requirement, in the future we could be required to provide financial assistance to the Bank should it experience financial distress. |
| • | Mortgage loan origination. The Dodd-Frank Act authorized the Consumer Financial Protection Bureau (the “CFPB”) to establish certain minimum standards for the origination of residential mortgages, including a determination of the borrower’s ability to repay a residential mortgage loan. Under the Dodd-Frank Act, financial institutions may not make a residential mortgage loan unless they make a “reasonable and good faith determination” that the consumer has a “reasonable ability” to repay the loan. The Dodd-Frank Act allows borrowers to raise certain defenses to foreclosure but provides a full or partial safe harbor from such defenses for loans that are “qualified mortgages.” The CFPB has promulgated final rules to, among other things, specify the types of income and assets that may be considered in the ability to repay determination, the permissible sources for verification and the |
100
Table of Contents
| required methods of calculating the loan’s monthly payments. The rules extend the requirement that creditors verify and document a borrower’s income and assets to include all information that creditors rely on in determining repayment ability. The rules also provide further examples of third party documents that may be relied on for such verification, such as government records and check cashing or funds transfer service receipts. The new rules became effective on January 10, 2014. The rules also define “qualified mortgages,” imposing both underwriting standards—for example, a borrower’s debt to income ratio may not exceed 43%—and limits on the terms of their loans. Points and fees are subject to a relatively stringent cap, and the terms include a wide array of payments that may be made in the course of closing a loan. Certain loans, including interest only loans and negative amortization loans, cannot be qualified mortgages. |
| • | Risk retention. On October 22, 2014, the OCC, the Federal Reserve, the FDIC, the SEC, the Federal Housing Finance Agency and the Department of Housing and Urban Development issued a final rule in connection with the risk retention requirement mandated by Section 941 of the Dodd-Frank Act. The risk retention requirement generally requires a securitizer to retain no less than 5% of the credit risk in assets it sells into a securitization and prohibits a securitizer from directly or indirectly hedging or otherwise transferring the credit risk that the securitizer is required to retain, subject to limited exemptions. One significant exemption is for securities entirely collateralized by “qualified residential mortgages” (“QRMs”), which are loans deemed to have a lower risk of default. The final rule defines QRMs to have the same meaning as the term “qualified mortgage,” as defined by the CFPB. In addition, the final rule provides for reduced risk retention requirements for qualifying commercial loan, commercial real estate loan and auto loan securitizations. |
| • | Imposition of restrictions on certain activities. The Dodd-Frank Act imposes a new regulatory structure on the over-the-counter derivatives market, including requirements for clearing, exchange trading, capital, margin, reporting and record keeping. In addition, certain swaps and other derivatives activities are required to be “pushed out” of insured depository institutions and conducted in separately capitalized non-bank affiliates. The Dodd-Frank Act also requires certain persons to register as a “major swap participant,” “swap dealer,” “major security-based swap participant” or a “security-based swap dealer.” The U.S. Commodity Futures Trading Commission has substantially completed adopting regulations to implement much of the new derivatives regulatory structure of the Dodd-Frank Act. The SEC and other U.S. regulators are still in the process of adopting regulations to implement the new derivatives regulatory structure of the Dodd-Frank Act. With regard to security-based swaps, it is anticipated that this further rulemaking will further clarify, among other things, reporting and recordkeeping obligations, margin and capital requirements, the scope of registration requirements, and what swaps are required to be centrally cleared and exchange-traded. Rules will also be issued to enhance the oversight of clearing and trading entities. As these remaining rules are implemented, new restrictions or limitations may affect our ability to manage certain risks in our business. |
| • | Expanded FDIC resolution authority. While insured depository institutions have long been subject to the FDIC’s resolution process, the Dodd-Frank Act creates a new mechanism for the FDIC to conduct the orderly liquidation of certain “covered financial companies,” including bank and thrift holding companies and systemically significant non-bank financial companies. Upon certain findings being made, the FDIC may be appointed receiver for a covered financial company, and would conduct an orderly liquidation of the entity. The FDIC liquidation process is modeled on the existing Federal Deposit Insurance Act and generally gives the FDIC more discretion than in the traditional bankruptcy context. The FDIC has issued final rules implementing the orderly liquidation authority. |
| • | Consumer Financial Protection Bureau. The Dodd-Frank Act created the CFPB, which is tasked with establishing and implementing rules and regulations under certain federal consumer protection laws with respect to the conduct of providers of certain consumer financial products and services. The CFPB has rulemaking authority over many of the statutes governing products and services offered to bank and thrift consumers. For banking organizations with assets of $10 billion or more, the CFPB has exclusive rule-making, examination, and primary enforcement authority under federal consumer financial laws. |
101
Table of Contents
| In addition, the Dodd-Frank Act permits states to adopt consumer protection laws and regulations that are stricter than those regulations promulgated by the CFPB. Compliance with any such new regulations would increase our cost of operations. |
| • | Deposit insurance. The Dodd-Frank Act made permanent the general $250 thousand deposit insurance limit for insured deposits. Amendments to the Federal Deposit Insurance Act (the “FDIA”) also revised the assessment base against which an insured depository institution’s deposit insurance premiums paid to the FDIC’s Deposit Insurance Fund will be calculated. Under the amendments, the assessment base is no longer the institution’s deposit base, but rather its average consolidated total assets less its average tangible equity. Additionally, the Dodd-Frank Act made changes to the minimum designated reserve ratio of the Deposit Insurance Fund, increasing the minimum from 1.15% to 1.35% of the estimated amount of total insured deposits, and eliminating the requirement that the FDIC pay dividends to depository institutions when the reserve ratio exceeds certain thresholds. Several of these provisions may impact the FDIC deposit insurance premiums paid by the Bank. |
| • | Transactions with affiliates and insiders. The Dodd-Frank Act generally enhanced the restrictions on transactions with affiliates under Section 23A and 23B of the Federal Reserve Act, including an expansion of the definition of “covered transactions” and clarification regarding the amount of time for which collateral requirements regarding covered credit transactions must be satisfied. Insider transaction limitations are expanded through the strengthening of loan restrictions to insiders and the expansion of the types of transactions subject to the various limits, including derivatives transactions, repurchase agreements, reverse repurchase agreements and securities lending or borrowing transactions. Restrictions are also placed on certain asset sales to and from an insider to an institution, including requirements that such sales be on market terms and, in certain circumstances, approved by the institution’s board of directors. |
| • | Corporate governance. The Dodd-Frank Act addresses many investor protection, corporate governance and executive compensation matters that will affect most U.S. publicly traded companies, including us. The Dodd-Frank Act (i) grants shareholders of U.S. publicly traded companies an advisory vote on executive compensation; (ii) enhances independence requirements for compensation committee members; (iii) requires companies listed on national securities exchanges to adopt incentive-based compensation clawback policies for executive officers; and (iv) provides the SEC with authority to adopt proxy access rules that would allow shareholders of publicly traded companies to nominate candidates for election as a director and have those nominees included in a company’s proxy materials. For so long as we are an emerging growth company, we may take advantage of the provisions of the JOBS Act allowing us to not seek a non-binding advisory vote on executive compensation or golden parachute arrangements. |
The requirements of the Dodd-Frank Act are in the process of being implemented and many of the requirements remain subject to regulations implemented over the course of several years. Given the uncertainty associated with the manner in which the provisions of the Dodd-Frank Act will be implemented by the various regulatory agencies and through regulations, the full extent of the impact such requirements will have on our operations is unclear. The changes resulting from the Dodd-Frank Act may impact the profitability of our business activities, require changes to certain of our business practices, impose upon us more stringent capital, liquidity and leverage requirements or otherwise adversely affect our business. These changes may also require us to invest significant management attention and resources to evaluate and make any changes necessary to comply with new statutory and regulatory requirements.
Failure to comply with the new requirements may negatively impact our results of operations and financial condition.
102
Table of Contents
The Volcker Rule
On December 10, 2013, the federal bank regulatory agencies, together with the SEC and the U.S. Commodity Futures Trading Commission, adopted a final rule, commonly known as the “Volcker Rule,” under Section 619 of the Dodd-Frank Act that generally prohibits “banking entities” from engaging in “proprietary trading” and making investments and conducting certain other activities with “private equity funds and hedge funds.” Although the final rule provides some tiering of compliance and reporting obligations based on size, the fundamental prohibitions of the Volcker Rule apply to banking entities of any size, including us and the Bank. The final regulations became effective April 1, 2014; however, at the time the agencies released the final Volcker Rule, the Federal Reserve announced an extension of the conformance period for all banking entities until July 21, 2015.
In response to industry questions regarding the final Volcker Rule, the OCC, Federal Reserve, FDIC, SEC and CFTC issued a clarifying interim final rule on January 14, 2014, permitting banking entities to retain interests in certain collateralized debt obligations backed by trust preferred securities if the collateralized debt obligations meet certain requirements.
We have reviewed the scope of the Volcker Rule and have determined that we do not have any investments that meet the requirements of the rule at this time.
Notice and Approval Requirements Related to Control
Federal and state banking laws impose notice, approval and ongoing regulatory requirements on any shareholder or other party that seeks to acquire direct or indirect “control” of an FDIC-insured depository institution. These laws include the BHC Act and the Change in Bank Control Act. Among other things, these laws require regulatory filings by a shareholder or other party that seeks to acquire direct or indirect “control” of an FDIC-insured depository institution. The determination whether an investor “controls” a depository institution is based on all of the facts and circumstances surrounding the investment. As a general matter, a party is deemed to control a depository institution or other company if the party owns or controls 25% or more of any class of voting stock. Subject to rebuttal, a party may be presumed to control a depository institution or other company if the investor owns or controls 10% or more of any class of voting stock. Ownership by affiliated parties, or parties acting in concert, is typically aggregated for these purposes. If a party’s ownership of us were to exceed certain thresholds, the investor could be deemed to “control” us for regulatory purposes. This could subject the investor to regulatory filings or other regulatory consequences.
In addition, except under limited circumstances, bank holding companies are prohibited from acquiring, without prior approval:
| • | control of any other bank or bank holding company or all or substantially all the assets thereof; or |
| • | more than 5% of the voting shares of a bank or bank holding company which is not already a subsidiary. |
Permissible Activities and Investments
Banking laws generally restrict our ability to engage in, or acquire 5% or more of the voting shares of a company engaged in, activities other than those determined by the Federal Reserve to be so closely related to banking as to be a proper incident thereto. The Gramm-Leach-Bliley Financial Modernization Act of 1999 (the “GLB Act”) expanded the scope of permissible activities for a bank holding company that qualifies as a financial holding company. Under the regulations implementing the GLB Act, a financial holding company may engage in additional activities that are financial in nature or incidental or complementary to a financial activity. Those activities include, among other activities, certain insurance and securities activities. Qualifications for becoming a financial holding company include, among other things, meeting certain specified capital standards and
103
Table of Contents
achieving certain management ratings in examinations. Under the Dodd-Frank Act, bank holding companies and their subsidiaries must be well-capitalized and well-managed in order for the bank holding company and its non-bank affiliates to engage in the expanded financial activities permissible only for a financial holding company.
In addition, as a general matter, we must receive prior regulatory approval before establishing or acquiring a depository institution or, in certain cases, a non-bank entity.
The Texas Constitution, as amended in 1986, provides that a Texas-chartered bank has the same rights and privileges that are or may be granted to national banks domiciled in Texas. To the extent that the Texas laws and regulations may have allowed state-chartered banks to engage in a broader range of activities than national banks, the Federal Deposit Insurance Corporation Improvement Act of 1991 (the “FDICIA”), has operated to limit this authority. The FDICIA provides that no state bank or subsidiary thereof may engage as a principal in any activity not permitted for national banks, unless the institution complies with applicable capital requirements and the FDIC determines that the activity poses no significant risk to the Deposit Insurance Fund of the FDIC. In general, statutory restrictions on the activities of banks are aimed at protecting the safety and soundness of depository institutions.
Branching
Texas law provides that a Texas-chartered bank can establish a branch anywhere in Texas provided that the branch is approved in advance by the TDB. The branch must also be approved by the FDIC, which considers a number of factors, including financial history, capital adequacy, earnings prospects, character of management, needs of the community and consistency with corporate powers. The Dodd-Frank Act permits insured state banks to engage in de novo interstate branching if the laws of the state where the new branch is to be established would permit the establishment of the branch if it were chartered by such state.
Regulatory Capital Requirements and Capital Adequacy
The federal bank regulators view capital levels as important indicators of an institution’s financial soundness. As a general matter, FDIC-insured depository institutions and their holding companies are required to maintain minimum capital relative to the amount and types of assets they hold. The final supervisory determination on an institution’s capital adequacy is based on the regulator’s assessment of numerous factors.
As a BHC and a state-chartered member bank, we and the Bank are subject to regulatory capital requirements. In addition to the federal requirements set forth below, the TDB has issued a policy which generally requires state chartered banks to maintain a leverage ratio (defined in accordance with federal capital guidelines) of 5.0%.
The Federal Reserve has established risk-based and leverage capital guidelines for bank holding companies and state member banks, including us and the Bank. The risk-based capital guidelines were based upon the 1988 capital accord of the International Basel Committee on Banking Supervision (“Basel Committee”), a committee of central banks and bank supervisors, as implemented by the U.S. federal banking agencies. The original framework was commonly referred to as “Basel I.” The federal banking agencies subsequently adopted separate risk-based capital guidelines for so-called “core banks” based upon the Revised Framework for the International Convergence of Capital Measurement and Capital Standards (“Basel II”) issued by the Basel Committee in November 2005, and most recently have implemented the recently revised framework referred to as “Basel III.”
Basel I
Under Basel I, the minimum ratio of total capital to risk-weighted assets (which are primarily the credit risk equivalents of balance sheet assets and certain off-balance sheet items such as standby letters of credit) was 8%. At least half of total capital had to be composed of tier 1 capital, which included common shareholders’ equity
104
Table of Contents
(including retained earnings), qualifying non-cumulative perpetual preferred stock (and, for bank holding companies only, a limited amount of qualifying cumulative perpetual preferred stock and a limited amount of trust preferred securities), and minority interests in the equity accounts of consolidated subsidiaries, less goodwill, other disallowed intangibles, and disallowed deferred tax assets, among other items. The Federal Reserve also had adopted a minimum leverage ratio for bank holding companies, requiring tier 1 capital of at least 3% of average quarterly total consolidated assets (as defined for regulatory purposes), net of goodwill and certain other intangible assets.
The federal banking agencies also established risk-based and leverage capital guidelines that FDIC-insured depository institutions are required to meet. These regulations are generally similar to those established by the Federal Reserve for bank holding companies.
Basel II
Under the final U.S. Basel II rules issued by the federal banking agencies, there were a small number of “core” banking organizations that were required to use the advanced approaches under Basel II for calculating risk-based capital related to credit risk and operational risk, instead of the methodology reflected in the regulations effective prior to adoption of Basel II. The rules also required core banking organizations to have rigorous processes for assessing overall capital adequacy in relation to their total risk profiles, and to publicly disclose certain information about their risk profiles and capital adequacy. We and the Bank are not among the core banking organizations required to use Basel II advanced approaches.
Under these previous guidelines, Federal Reserve regulations required state chartered member banks and bank holding companies generally to maintain three minimum capital standards: (i) a Tier 1 capital to total assets ratio, or “leverage capital ratio,” of at least 4.0%; (ii) a Tier 1 capital to risk-weighted assets ratio, or “Tier 1 risk-based capital ratio,” of at least 4.0%; and (iii) a total risk-based capital (Tier 1 plus Tier 2) to risk-weighted assets ratio, or “total risk-based capital ratio,” of at least 8.0%.
Basel III
On December 16, 2010, the Basel Committee released its final framework for strengthening international capital and liquidity regulation, known as Basel III. The Basel III calibration and phase-in arrangements were previously endorsed by the Seoul G20 Leaders Summit in November 2010, and are subject to individual adoption by member nations, including the United States. Under these standards, when fully phased-in on January 1, 2019, banking institutions will be required to satisfy six risk-based capital ratios:
| (i) | A common equity tier 1 ratio of at least 7.0%, inclusive of 4.5% minimum common equity tier 1 ratio, net of regulatory deductions, and the new 2.5% “capital conservation buffer” of common equity to risk-weighted assets; |
| (ii) | A tier 1 capital ratio of at least 8.5%, inclusive of the 2.5% capital conservation buffer; and |
| (iii) | A total capital ratio of at least 10.5%, inclusive of the 2.5% capital conservation buffer. |
U.S. Implementation of Basel III
In July 2013, the federal banking agencies published final capital rules under Basel III (“Basel III Capital Rules”) that revised their risk-based and leverage capital requirements and their method for calculating risk-weighted assets to implement, in part, agreements reached by the Basel Committee and certain provisions of the Dodd-Frank Act. The Basel III Capital Rules implemented the Basel Committee’s December 2010 framework for strengthening international capital and liquidity regulation, known as Basel III, which substantially revised the existing capital requirements for banking organizations. While some provisions are tailored to larger institutions, the Basel III Capital Rules generally apply to all banking organizations, including
105
Table of Contents
us and the Bank. The Basel III Capital Rules also address risk weights and other issues affecting the denominator in banking institutions’ regulatory capital ratios and replace the existing risk-weighting approach, which was derived from the Basel I capital accords of the Basel Committee, with a more risk-sensitive approach based, in part, on the standardized approach in the Basel Committee’s 2004 “Basel II” capital accords. The Basel III Capital Rules also implement the requirements of Section 939A of the Dodd-Frank Act to remove references to credit ratings from the federal banking agencies’ rules. The Basel III Capital Rules became effective for us and the Bank on January 1, 2015, subject to a phase-in period for certain provisions.
Among other things, the Basel III Capital Rules: (i) introduce a new capital measure entitled “Common Equity Tier 1,” or CET1; (ii) specify that Tier 1 capital consist of CET1 and additional financial instruments satisfying specified requirements that permit inclusion in Tier 1 capital; (iii) define CET1 narrowly by requiring that most deductions or adjustments to regulatory capital measures be made to CET1 and not to the other components of capital; and (4) expand the scope of the deductions or adjustments from capital as compared to the existing regulations.
Under the Basel III Capital Rules, banking organizations were provided a one-time option in their initial regulatory financial report filed after January 1, 2015, to remove certain components of accumulated other comprehensive income from the computation of common equity regulatory capital. The Basel III Capital Rules also provide a permanent exemption from the proposed phase out of existing trust preferred securities and cumulative perpetual preferred stock from regulatory capital for banking organizations with less than $15 billion in total assets, while also implementing stricter eligibility requirements for regulatory capital instruments that should serve to disallow the inclusion of all non-exempt issuances of trust preferred securities and cumulative perpetual preferred stock from Tier 1 capital. The Basel III Capital Rules also provide additional constraints on the inclusion of minority interests, mortgage servicing assets, deferred tax assets and certain investments in the capital of unconsolidated financial institutions in Tier 1 capital, as well as providing stricter risk weighting rules to these assets.
The initial minimum capital ratios under the Basel III Capital Rules that became effective as of January 1, 2015, are (i) 4.5% CET1 to risk-weighted assets, (ii) 6.0% Tier 1 capital to risk-weighted assets, (iii) 8.0% Total capital to risk-weighted assets, and (iv) 4.0% Tier 1 capital to average quarterly assets. As of June 30, 2015, we exceeded these initial minimum capital ratio requirements under the Basel III Capital Rules.
The Basel III Capital Rules additionally require institutions to retain a capital conservation buffer of 2.5% above these required minimum capital ratio levels. Banking organizations that fail to maintain the minimum 2.5% capital conservation buffer could face restrictions on capital distributions or discretionary bonus payments to executive officers, with distributions and discretionary bonus payments being completely prohibited if no capital conservation buffer exists, or in the event of the following: (i) the banking organization’s capital conservation buffer was below 2.5% at the beginning of a quarter; and (ii) its cumulative net income for the most recent quarterly period plus the preceding four calendar quarters is less than its cumulative capital distributions (as well as associated tax effects not already reflected in net income) during the same measurement period.
The Basel III Capital Rules also provide stricter rules related to the risk weighting of past due and certain commercial real estate loans, as well as on some equity investment exposures, and replaces the existing credit rating approach for determining the risk weighting of securitization exposures with an alternative approach.
Finally, the Basel III Capital Rules amended the thresholds under the prompt corrective action framework applicable to the Bank to reflect both (i) the generally heightened requirements for regulatory capital ratios, and (ii) the introduction of the CET1 capital measure.
Liquidity Requirements
Historically, regulation and monitoring of bank and bank holding company liquidity has been addressed as a supervisory matter, without required formulaic measures. The Basel III Capital Rules did not address the
106
Table of Contents
proposed liquidity coverage ratio called for by the Basel Committee’s Basel III framework. The Basel III liquidity framework requires banks and bank holding companies to measure their liquidity against specific liquidity tests that, although similar in some respects to liquidity measures historically applied by banks and regulators for management and supervisory purposes, will be required by regulation going forward. One of the liquidity tests included in the new rule, referred to as the liquidity coverage ratio (the “LCR”), is designed to ensure that a banking entity maintains an adequate level of unencumbered high-quality liquid assets equal to the entity’s expected net cash outflow for a 30-day time horizon (or, if greater, 25% of its expected total cash outflow) under an acute liquidity stress scenario. The other test, referred to as the net stable funding ratio (the “NSFR”), is designed to promote more medium- and long-term funding of the assets and activities of banking entities over a one-year time horizon. These requirements are predicted to encourage the covered banking entities to increase their holdings of U.S. Treasury securities and other sovereign debt as a component of assets, and also to increase the use of long-term debt as a funding source. Regulators may change capital and liquidity requirements including previous interpretations of practices related to risk weights that could require an increase to the allocation of capital to assets held by the Bank, and they could require banks to make retroactive adjustments to financial statements to reflect such changes. In September 2014, the federal banking agencies approved final rules implementing (i) the LCR for advanced approaches banking organizations (i.e., banking organizations with $250 billion or more in total consolidated assets or $10 billion or more in total on-balance sheet foreign exposure), and (ii) a modified version of the LCR for bank holding companies with at least $50 billion in total consolidated assets that are not advanced approach banking organizations. Neither rule would apply to us or the Bank. The federal banking agencies have not yet proposed rules to implement the NSFR or addressed the scope of bank organizations to which it will apply.
Prompt Corrective Action
Under the FDIA, the federal bank regulatory agencies must take prompt corrective action against undercapitalized U.S. depository institutions. U.S. depository institutions are assigned one of five capital categories: “well capitalized,” “adequately capitalized,” “undercapitalized,” “significantly undercapitalized,” and “critically undercapitalized,” and are subjected to different regulation corresponding to the capital category within which the institution falls. As of June 30, 2015, a depository institution is deemed to be “well capitalized” if it has a total risk-based capital ratio of 10.0% or greater, a CET1 capital ratio of 6.5% or greater, a Tier 1 risk-based capital ratio of 8.0% or greater, a leverage ratio of 5.0% or greater and the institution is not subject to an order, written agreement, capital directive or prompt corrective action directive to meet and maintain a specific level for any capital measure. A depository institution is deemed to be “adequately capitalized” if it has a total risk-based capital ratio of 8.0% or greater, a CET1 capital ratio of 4.5% or greater; a Tier 1 risk-based capital ratio of 6.0% or greater (4.0% prior to January 1, 2015); a leverage ratio of 4.0% or greater; and does not meet the criteria for a “well capitalized” bank. A depository institution is “under capitalized” if it has a total risk-based capital ratio of less than 8.0%, a CET1 capital ratio less than 4.5%, a Tier 1 risk-based capital ratio of less than 6.0% (4.0% prior to January 1, 2015) or a leverage ratio of less than 4.0%. Under certain circumstances, a well-capitalized, adequately capitalized or undercapitalized institution may be treated as if the institution were in the next lower capital category. A banking institution that is undercapitalized is required to submit a capital restoration plan. The capital restoration plan will not be accepted by the regulators unless each company having control of the undercapitalized institution guarantees the subsidiary’s compliance with the capital restoration plan up to a certain specified amount.
Failure to meet capital guidelines could subject the institution to a variety of enforcement remedies by federal bank regulatory agencies, including: termination of deposit insurance by the FDIC, restrictions on certain business activities, and appointment of the FDIC as conservator or receiver. As of June 30, 2015, the Bank met the requirements to be “well capitalized” under the prompt corrective action regulations.
Regulatory Limits on Dividends and Distributions
As a bank holding company, we are subject to certain restrictions on dividends under applicable banking laws and regulations. The Federal Reserve has issued a policy statement that provides that a bank holding
107
Table of Contents
company should not pay dividends unless (i) its net income over the last four quarters (net of dividends paid) has been sufficient to fully fund the dividends, (ii) the prospective rate of earnings retention appears to be consistent with the capital needs, asset quality and overall financial condition of the bank holding company and its subsidiaries and (iii) the bank holding company will continue to meet minimum required capital adequacy ratios. Accordingly, a bank holding company should not pay cash dividends that exceeds its net income or that can only be funded in ways that weaken the bank holding company’s financial health, such as by borrowing. The Dodd-Frank Act imposes, and Basel III results in, additional restrictions on the ability of banking institutions to pay dividends.
Substantially all of our income, and a principal source of our liquidity, are dividends from the Bank, and the ability of the Bank to pay dividends to us is also restricted by federal and state laws, regulations and policies. Texas state law places limitations on the amount that state banks may pay in dividends, which the Bank must adhere to when paying dividends to us. Federal law also imposes limitations upon certain capital distributions by banks that are members of the Federal Reserve System, such as certain cash dividends, payments to repurchase or otherwise acquire its shares, payments to shareholders of another institution in a cash-out merger and other distributions charged against capital. The Federal Reserve and TDB regulate all capital distributions by the Bank directly or indirectly to us, including dividend payments.
Additionally, under federal law, the Bank may not pay dividends to us if, after paying those dividends, the Bank would fail to meet the required minimum levels under risk-based capital guidelines and the minimum leverage and tangible capital ratio requirements. Under the FDIA, an insured depository institution such as the Bank is prohibited from making capital distributions, including the payment of dividends, if, after making such distribution, the institution would become “undercapitalized.” The Federal Reserve may further restrict the payment of dividends by requiring the Bank to maintain a higher level of capital than would otherwise be required to be adequately capitalized for regulatory purposes. Payment of dividends by the Bank also may be restricted at any time at the discretion of the appropriate regulator if it deems the payment to constitute an unsafe and unsound banking practice. As noted above, the capital conservation buffer created under the Basel III Capital Rules, when fully implemented, may also have the effect of limiting the payment of capital distributions from the Bank.
Reserve Requirements
Pursuant to regulations of the Federal Reserve, all banking organizations are required to maintain average daily reserves at mandated ratios against their transaction accounts. In addition, reserves must be maintained on certain non-personal time deposits. These reserves must be maintained in the form of vault cash or in an account at a Federal Reserve Bank.
Limits on Transactions with Affiliates and Insiders
Insured depository institutions are subject to restrictions on their ability to conduct transactions with affiliates and other related parties. Section 23A of the Federal Reserve Act imposes quantitative limits, qualitative requirements, and collateral requirements on certain transactions by an insured depository institution with, or for the benefit of, its affiliates. Transactions covered by Section 23A include loans, extensions of credit, investment in securities issued by an affiliate, and acquisitions of assets from an affiliate. Section 23B of the Federal Reserve Act requires that most types of transactions by an insured depository institution with, or for the benefit of, an affiliate be on terms at least as favorable to the insured depository institution as if the transaction were conducted with an unaffiliated third party.
As noted above, the Dodd-Frank Act generally enhances the restrictions on transactions with affiliates under Section 23A and 23B of the Federal Reserve Act, including an expansion of the definition of “covered transactions” and a clarification regarding the amount of time for which collateral requirements regarding covered credit transactions must be satisfied. The ability of the Federal Reserve to grant exemptions from these restrictions is also narrowed by the Dodd-Frank Act, including by requiring coordination with other bank regulators.
108
Table of Contents
The Federal Reserve’s Regulation O regulations impose restrictions and procedural requirements in connection with the extension of credit by an insured depository institution to directors, executive officers, principal shareholders and their related interests.
Brokered Deposits
The FDIA restricts the use of brokered deposits by certain depository institutions. Under the applicable regulations, (i) a “well capitalized insured depository institution” may solicit and accept, renew or roll over any brokered deposit without restriction, (ii) an “adequately capitalized insured depository institution” may not accept, renew or roll over any brokered deposit unless it has applied for and been granted a waiver of this prohibition by the FDIC and (iii) an “undercapitalized insured depository institution” may not accept, renew or roll over any brokered deposit. The FDIC may, on a case-by-case basis and upon application by an adequately capitalized insured depository institution, waive the restriction on brokered deposits upon a finding that the acceptance of brokered deposits does not constitute an unsafe or unsound practice with respect to such institution.
Concentrated Commercial Real Estate Lending Guidance
The federal banking agencies, including the Federal Reserve, have promulgated guidance governing financial institutions with concentrations in commercial real estate lending. The guidance provides that a bank has a concentration in commercial real estate lending if (i) total reported loans for construction, land development, and other land represent 100% or more of total capital or (ii) total reported loans secured by multifamily and non-farm residential properties and loans for construction, land development, and other land represent 300% or more of total capital and the bank’s commercial real estate loan portfolio has increased 50% or more during the prior 36 months. Owner-occupied commercial real estate loans are excluded from this second category. If a concentration is present, management must employ heightened risk management practices that address the following key elements: including board and management oversight and strategic planning, portfolio management, development of underwriting standards, risk assessment and monitoring through market analysis and stress testing and maintenance of increased capital levels as needed to support the level of commercial real estate lending.
Examination and Examination Fees
The FDIC periodically examines and evaluates state non-member banks. Based on such an evaluation, the Bank, among other things, may be required to revalue its assets and establish specific reserves to compensate for the difference between the Bank’s assessment and that of the FDIC. The TDB also conducts examinations of state banks but may accept the results of a federal examination in lieu of conducting an independent examination. In addition, the FDIC and TDB may elect to conduct a joint examination. The FDIC currently charges fees to recover the costs of examining member banks, processing applications and other filings and covering direct and indirect expenses in regulating member banks. The TDB charges fees to recover the costs of examining Texas chartered banks. The Dodd-Frank Act provides various agencies with the authority to assess additional supervision fees.
Deposit Insurance and Deposit Insurance Assessments
The FDIC is an independent federal agency that insures the deposits of federally insured depository institutions up to applicable limits. The FDIC also has certain regulatory, examination and enforcement powers with respect to FDIC-insured institutions. The deposits of the Bank are insured by the FDIC up to applicable limits. As a general matter, the maximum deposit insurance amount is $250 thousand per depositor.
FDIC-insured depository institutions are required to pay deposit insurance assessments to the FDIC. The amount of a particular institution’s deposit insurance assessment for institutions with less than $10 billion in
109
Table of Contents
assets is based on that institution’s risk classification under an FDIC risk based assessment system, with certain adjustments for any unsecured debt or brokered deposits held by the insured bank. An institution’s risk classification is assigned based on its capital levels and the level of supervisory concern the institution poses to the regulators. Institutions assigned to higher risk categories (that is, institutions that pose a higher risk of loss to the Deposit Insurance Fund) pay assessments at higher rates than institutions that pose a lower risk. An institution’s risk classification is assigned based on a combination of its financial ratios and supervisory ratings, reflecting, among other things, its capital levels and the level of supervisory concern that the institution poses to the regulators. Deposit insurance assessments fund the Deposit Insurance Fund, which is currently underfunded.
As noted above, the Dodd-Frank Act changed the way an insured depository institution’s deposit insurance premiums are calculated. Continued action by the FDIC to replenish the Deposit Insurance Fund, as well as these changes may impact assessment rates, which could impact the profitability of our operations.
Depositor Preference
The FDIA provides that, in the event of the “liquidation or other resolution” of an insured depository institution, the claims of depositors of the institution (including the claims of the FDIC as subrogee of insured depositors) and certain claims for administrative expenses of the FDIC as a receiver will have priority over other general unsecured claims against the institution. If we invest in or acquire an insured depository institution that fails, insured and uninsured depositors, along with the FDIC, will have priority in payment ahead of unsecured, non-deposit creditors, including us, with respect to any extensions of credit they have made to such insured depository institution.
Anti-Money Laundering and OFAC
Under federal law, financial institutions must maintain anti-money laundering programs that include established internal policies, procedures and controls; a designated compliance officer; an ongoing employee training program; and testing of the program by an independent audit function. Financial institutions are also prohibited from entering into specified financial transactions and account relationships and must meet enhanced standards for due diligence and customer identification in their dealings with non-U.S. financial institutions and non-U.S. customers. Financial institutions must take reasonable steps to conduct enhanced scrutiny of account relationships to guard against money laundering and to report any suspicious transactions, and law enforcement authorities have been granted increased access to financial information maintained by financial institutions. Bank regulators routinely examine institutions for compliance with these obligations and they must consider an institution’s compliance with such obligations in connection with the regulatory review of applications, including applications for banking mergers and acquisitions. The regulatory authorities have imposed “cease and desist” orders and civil money penalty sanctions against institutions found to be violating these obligations.
The U.S. Department of the Treasury’s Office of Foreign Assets Control (“OFAC”), is responsible for helping to ensure that U.S. entities do not engage in transactions with certain prohibited parties, as defined by various Executive Orders and Acts of Congress. OFAC publishes lists of persons, organizations, and countries suspected of aiding, harboring or engaging in terrorist acts, known as Specially Designated Nationals and Blocked Persons. If we or the Bank find a name on any transaction, account or wire transfer that is on an OFAC list, we or the Bank must freeze or block such account or transaction, file a suspicious activity report and notify the appropriate authorities.
Consumer Laws and Regulations
Banking organizations are subject to numerous laws and regulations intended to protect consumers. These laws include, among others:
| • | Truth in Lending Act; |
| • | Truth in Savings Act; |
110
Table of Contents
| • | Electronic Funds Transfer Act; |
| • | Expedited Funds Availability Act; |
| • | Equal Credit Opportunity Act; |
| • | Fair and Accurate Credit Transactions Act; |
| • | Fair Housing Act; |
| • | Fair Credit Reporting Act; |
| • | Fair Debt Collection Act; |
| • | Gramm-Leach-Bliley Act; |
| • | Home Mortgage Disclosure Act; |
| • | Right to Financial Privacy Act; |
| • | Real Estate Settlement Procedures Act; |
| • | laws regarding unfair and deceptive acts and practices; and |
| • | usury laws. |
Many states and local jurisdictions have consumer protection laws analogous to, and in addition to, those listed above. These federal, state and local laws regulate the manner in which financial institutions deal with customers when taking deposits, making loans, or conducting other types of transactions. Failure to comply with these laws and regulations could give rise to regulatory sanctions, customer rescission rights, action by state and local attorneys general and civil or criminal liability. The creation of the CFPB by the Dodd-Frank Act has led to enhanced enforcement of consumer financial protection laws.
The Community Reinvestment Act
The Community Reinvestment Act (the “CRA”), is intended to encourage banks to help meet the credit needs of their service areas, including low and moderate-income neighborhoods, consistent with safe and sound operations. The bank regulators examine and assign each bank a public CRA rating. The CRA then requires bank regulators to take into account the federally insured bank’s record in meeting the needs of its service area when considering an application by a bank to establish or relocate a branch or to conduct certain mergers or acquisitions. The Federal Reserve is required to consider the CRA records of a bank holding company’s controlled banks when considering an application by the bank holding company to acquire a banking organization or to merge with another bank holding company. When we or the Bank applies for regulatory approval to engage in certain transactions, the regulators will consider the CRA record of target institutions and our depository institution subsidiaries. An unsatisfactory CRA record could substantially delay approval or result in denial of an application. The regulatory agency’s assessment of the institution’s record is made available to the public. The Bank received an overall CRA rating of “satisfactory” on its most recent CRA examination.
Changes in Laws, Regulations or Policies
Federal, state and local legislators and regulators regularly introduce measures or take actions that would modify the regulatory requirements applicable to banks, their holding companies and other financial institutions. Changes in laws, regulations or regulatory policies could adversely affect the operating environment for us in substantial and unpredictable ways, increase our cost of doing business, impose new restrictions on the way in which we conducts our operations or add significant operational constraints that might impair our profitability. Whether new legislation will be enacted and, if enacted, the effect that it, or any implementing regulations, would have on us and our subsidiaries’ business, financial condition or results of operations cannot be predicted. The Dodd-Frank Act is in the process of imposing substantial changes to the regulatory framework applicable to
111
Table of Contents
us and our subsidiaries. The majority of these changes will be implemented over time by various regulatory agencies. The full effect that these changes will have on us and our subsidiaries remains uncertain at this time and may have a material adverse effect on our business and results of operations.
Effect on Economic Environment
The policies of regulatory authorities, including the monetary policy of the Federal Reserve, have a significant effect on the operating results of bank holding companies and their subsidiaries. Among the means available to the Federal Reserve to affect the money supply are open market operations in U.S. government securities, changes in the discount rate on member bank borrowings, and changes in reserve requirements against member bank deposits. These means are used in varying combinations to influence overall growth and distribution of bank loans, investments and deposits, and their use may affect interest rates charged on loans or paid for deposits. Federal Reserve monetary policies have materially affected the operating results of commercial banks in the past and are expected to continue to do so in the future. We cannot predict the nature of future monetary policies and the effect of such policies on our business and earnings.
112
Table of Contents
Executive Officers and Directors
The following table sets forth information regarding our directors and executive officers as of the date of this prospectus.
| Name |
Age | Position |
Term Expires | |||||||
| George Martinez |
73 | Chairman and Chief Executive Officer | 2017 | |||||||
| Steven F. Retzloff |
59 | Director and President and Chairman of the Bank | 2018 | |||||||
| Daryl D. Bohls |
64 | Director and Executive Vice President and Chief Credit Officer of the Bank | 2016 | |||||||
| Ramon A. Vitulli, III |
47 | Director and Executive Vice President and President of the Bank | 2018 | |||||||
| Laurence L. Lehman III |
55 | Executive Vice President and Chief Financial Officer | N/A | |||||||
| John Beckworth |
57 | Director | 2017 | |||||||
| Lawrence G. Fraser |
81 | Director | 2016 | |||||||
| Matthew H. Hartzell |
57 | Director | 2016 | |||||||
| Frances H. Jeter |
58 | Director | 2017 | |||||||
| James J. Kearney |
72 | Director | 2016 | |||||||
| P. Michael Mann, M.D. |
73 | Director | 2016 | |||||||
| David B. Moulton |
75 | Director | 2017 | |||||||
| William S. Nichols, III |
63 | Director | 2018 | |||||||
| Thomas A. Reiser |
63 | Director | 2017 | |||||||
| Raimundo Riojas E. |
74 | Director | 2018 | |||||||
| Fred S. Robertson |
65 | Director | 2018 | |||||||
The following is a brief discussion of the business and banking background and experience of our directors and executive officers. No director has any family relationship, as defined in Item 401 of Regulation S-K, with any other director or with any of our executive officers.
George Martinez is one of the organizers of the Bank and has been the Chairman of our board and our Chief Executive Officer since 2008 and Chief Executive Officer of the Bank since 2007. Mr. Martinez began his banking career in 1974 as the co-founder of Sterling Bank, where he served as an Executive Vice President from 1974 to 1980, and then as Chief Executive Officer of Sterling Bancshares from 1980-2001 and as Chairman from 1992-2004. From 1998 to 2008, Mr. Martinez served as President of Chrysalis Partners, LLC, a consulting firm. He currently serves the board of directors of NCI Building Systems, Inc., Landmark Worldwide Enterprises, Inc., the University of St. Thomas and the Collaborative for Children. Mr. Martinez received a Bachelor of Business Administration degree from Rice University. With over 50 years of business experience, Mr. Martinez’s significant leadership skills and extensive experience in community banking qualify him to serve on our board and as our Chairman.
Steven F. Retzloff is one of the organizers of the Bank and has been our President since 2008 and Chairman of the Bank since 2007. Mr. Retzloff has over 35 years of business experience. Mr. Retzloff served as a director of Sterling Bancshares, Inc. and Sterling Bank from 1987 to 2006, including terms as Chairman of the board of Sterling Bancshares from 1990 to 1992 and from 2004 to 2005. He is currently Chairman, President and a director of Retzloff Industries, Inc. From 1988 to 2007, Mr. Retzloff served as Chairman and Chief Executive Officer of Travis Body & Trailer, Inc., a manufacturer specialized in truck trailers. Mr. Retzloff received a Bachelor of Industrial Engineering degree from the Georgia Institute of Technology and a Master of Business Administration degree (with distinction) from Wake Forest University. Mr. Retzloff’s significant experience as a director and officer of community banks and his extensive leadership skills qualify him to serve on our board.
113
Table of Contents
Ramon A. Vitulli, III has been a Bank office president since 2007 and has been President of the Bank since 2013. He has served on our board since 2014 and has been a director of the Bank since 2008. Mr. Vitulli has over 23 years of banking experience. He started his career as a loan review examiner at Charter National Bank in Houston and worked as a senior credit analyst and later as bank manager for Charter until his move to Sterling Bank in 1996. Mr. Vitulli previously was the Market Chief Executive Officer at Sterling Bank, where he managed six bank offices with total assets in excess of $250 million. He presently serves on the St. Pius X High School Foundation and School Board and is a current member of the Dominican Sisters of Houston, Texas Finance Committee. Mr. Vitulli received a Bachelor of Business Administration degree in finance from the University of Texas at Austin. Mr. Vitulli’s considerable business experience, and in particular his considerable experience in community banking, qualifies him to serve on our board.
Laurence L. Lehman III has served as our Executive Vice President and Chief Financial Officer since 2013. Mr. Lehman has 31 years of banking experience in Houston. Previously, he served as Corporate Controller at Cadence Bancorp from January 2011 to May 2013 and worked at Amegy Bank for 17 years serving as the Controller for 7 of those years. He is a Certified Public Accountant and a Chartered Global Management Accountant. He is also a member of both the American Institute of Certified Public Accountants and the Texas Society of Certified Public Accountants. Mr. Lehman serves on the Senior Council of St. Martin’s Episcopal Church. He is on the Board of Directors of the Open Door Mission Houston where he also served as a mentor for over 5 years. Mr. Lehman is also an advisor to the Pi Kappa Alpha fraternity. Mr. Lehman received his Bachelor of Business Administration in Accounting from Texas A&M University.
Daryl D. Bohls is one of the organizers of the Bank and has served as Executive Vice President and Chief Credit Officer of the Bank since 2007. Mr. Bohls has served on our board since 2008. Mr. Bohls has 35 years of banking experience in the Houston market, including 20 years with Sterling Bank, and he has been the president of four Houston banks. During his tenure with Sterling Bank, Mr. Bohls held the positions of President, Executive Vice President, Director, Chief Credit Officer, Senior Loan Officer, Regional CEO and Chairman of Senior Loan Committee, the latter a position he held for 17 years. Mr. Bohls currently serves as immediate past President and a board member of the Gulf Coast Chapter of the Risk Management Association, and recently served as a board member of the Independent Bankers Association of Texas. Mr. Bohls has been an appointed Civil Service Commissioner with the Harris County Sheriff’s Department since 1999. He serves on the Board of Trustees of the Cy-Fair Educational Foundation, the Merchandising Committee of the Houston Livestock Show and Rodeo and as an adjunct Finance Professor at Sam Houston State University, where he teaches courses on commercial lending and analyzing financial statements. He is a member of the Association of Real Estate Professionals and the Houston C-Club. Mr. Bohls received a Bachelor of Business Administration degree in accounting from the University of Texas, and a Master of Business Administration in banking from Sam Houston State University. Mr. Bohls diverse business experience qualifies him to serve on our board.
John Beckworth has served on our board since 2009. Mr. Beckworth practiced law in Houston for thirty years from 1983 until 2013. He commenced his law practice as an associate and then as a partner at Fulbright & Jaworski LLP, before leaving to start his own firm. Mr. Beckworth co-founded WattBeckworth in Houston where he remained a partner until March of 2015. In 2013, Mr. Beckworth left active law practice to become an Associate Dean at the University of Texas School of Law. He has served as Chairman of the Board of Trustees of the Kinkaid School in Houston and he is a Life Trustee of the school. He is a former Trustee of the University of Texas Law School Foundation, and he has served as President and Chairman of the Board of the University of Texas Ex Students’ Association. He is a director of the Kinkaid Investments Foundation and the Texas Exes Scholarship Foundation. Mr. Beckworth also operates family ranching, oil and gas, and investments interests. Mr. Beckworth received Bachelor of Arts and Juris Doctor degrees from The University of Texas at Austin and The University of Texas School of Law. Mr. Beckworth’s legal and business experience qualify him to serve on our board.
Lawrence G. Fraser has served on our board since our acquisition of Independence Bank in 2013. Mr. Fraser has been involved in the commercial banking business for over 50 years, the mortgage banking
114
Table of Contents
business for 5 years, and has started several Texas-based banks. Prior to our acquisition of Independence Bank, Mr. Fraser served as Chairman of the board of Independence. Mr. Fraser was founder, President and Chairman of Beltway Bank from 1972 until 1981 when it was sold to Allied Bancshares, Inc. Mr. Fraser also founded and served as President and Chairman of Texas Capital Bank from 1981 until in 1995 when it was sold to Coastal Banc, SSB. While at Texas Capital Bank, Mr. Fraser was instrumental in bringing branch banking to Texas. After a short retirement, he successfully reorganized two problem banks. Mr. Fraser received his degree from the University of Windsor, Ontario, Canada. Mr. Fraser’s considerable experience in the community banking industry qualifies him to serve on our board.
Matthew H. Hartzell has served on our board since our acquisition of Independence Bank in 2013. Prior to the acquisition, Mr. Hartzell served Independence Bank as the Vice Chairman of the board, the Chair of both the IT committee and the compensation committee for over five years each, and a member of the executive committee. Mr. Hartzell is presently Chief Administrative Officer of N.F. Smith & Associates, L.P., an independent distributor of computer hardware components, and served as their Chief Operating Officer for the six years prior. For the past 17 years, he has also served as General Counsel of Valid Management, LLC, one of the holdings in N.F. Smith’s diversified portfolio of technology businesses. Prior to joining Valid Management, Mr. Hartzell was a shareholder and associate with Hirsch & Westheimer, P.C., for more than a decade. Since 2010 he has served as a member of the SAE G-19 Committee, a committee dedicated to promulgating standards for the mitigation of counterfeit parts in electronic part purchasing. Mr. Hartzell is past president and a longtime board member of the Woodlands Heights Civic Association. He received a Bachelor of Arts degree from St. John’s College, Annapolis, Maryland and a Juris Doctor degree from the University of Houston. Mr. Hartzell’s extensive legal experience and business skills qualify him to serve on our board.
Frances H. Jeter has served on our board since 2014. She has more than 25 years of experience in marketing, public affairs and business and nonprofit management. Ms. Jeter is presently group Vice President of internal and external affairs for Spectra Energy. Before joining Spectra, Ms. Jeter served as Chief Marketing Officer for Bracewell & Giuliani LLP. She previously served as Vice President of public affairs for Duke Energy Gas Transmission, a predecessor company of Spectra. Ms. Jeter served as Director of marketing and customer service for the Metropolitan Transit Authority of Harris County and was manager of government relations for Geosource, Inc. She also served as assistant Vice President of institutional advancement for Rice University and as Associate Director of external relations at the Rice University James A. Baker III Institute of Public Policy. She is a life trustee and a past chair of The Kinkaid School board of trustees in Houston and a former trustee of The Hockaday School in Dallas. She is the founding Chair of Houston’s The Fay School and is also a founding board member and former chair of LIFE Houston, and is a former member of the board of directors of the Greater Houston Community Foundation, St. Luke’s Episcopal Health Charities and Park People. Ms. Jeter received a Bachelor of Arts degree from the University of North Carolina at Chapel Hill. Ms. Jeter’s significant knowledge of marketing and business affairs in the Houston area qualifies her to serve on our board.
James J. Kearney has served on our board since 2013. Mr. Kearney is presently Senior Vice President of Investments for Raymond James & Associates, Inc., Member New York Stock Exchange/SIPC, which provides brokerage, investment banking, trust, and other financial services. From 2001 through 2003, Mr. Kearney was Senior Vice President of the Houston office of Robert W. Baird & Co, a New York Stock Exchange investment banking and securities brokerage firm. From 1974 until December 2000, Mr. Kearney was Senior Vice President and Director of the Private Client Group for the Houston office of SG Cowen & Co. From 2006 to 2012 he was a director of First Community Bank of Fort Bend. He served as a Director on the board of Sterling Bank from 1985 to 1992 and the board of Sterling Bancshares, Inc. from 1992 to 2006. Mr. Kearney is a member of the Dominican Sisters Board and has served on the Investment Advisory Committee for the Sacred Heart Convent Retirement Trust since 1988. Mr. Kearney received his Master of Arts in economics from the University of Missouri, a Master of Arts from the University of London and a Doctor of Philosophy from the University of Missouri. Mr. Kearney’s diverse business experience and community involvement qualify him to serve on our board.
115
Table of Contents
P. Michael Mann, M.D. is one of the organizers of the Bank and has served on our board since 2008. Dr. Mann is the Chairman and co-owner of Mann Eye Center, P.A. From 1979 to 2004, Mr. Mann served as a director of Sterling Bank from 1997 to 2004. He has served on the board of trustees of the Houston Symphony and the Centenary College. He is a member of numerous medical professional organizations, including the American College of Surgeons, the American Academy of Ophthalmology, Windsor National Associates, and the Houston Ophthalmological Society. Dr. Mann received a Bachelor of Science degree from Centenary College of Louisiana and a Medical Degree from Louisiana State University in New Orleans, and he completed residency in Ophthalmology at Tulane University School of Medicine. Mr. Mann’s leadership skills and business experience qualify him to serve on our board.
David B. Moulton has served on our board since 2008 and the board of the Bank since 2007. Mr. Moulton is a retired banker. He began his career in banking in 1969 with Texas Commerce Bank. He was the Chairman and CEO of National Commerce Bank from 1986 to 1995, when it was acquired by Frost Bank. He was the Chairman and CEO of Almeda Bancshares, Inc. from 1996 to 1999, when it was acquired by Sterling Bancshares, Inc., and he served as a director of Sterling Bancshares until 2004. Mr. Moulton attended the University of Georgia and the Southwestern Graduate School of Banking at Southern Methodist University. Mr. Moulton’s extensive business experience, particularly in the community banking industry, qualifies him to serve on our board.
William S. Nichols, III is one of the organizers of the Bank and has served on our board since 2008 and the board of the Bank since 2007. He is the Chairman of our audit committee. Mr. Nichols is presently the President of Suncor Companies, LLC, a real estate development company that primarily focuses on the development of freestanding retail facilities throughout the United States. He is also general partner of numerous real estate development partnerships. From 1974 to 1984 he worked as an audit principal at Ernst & Young. He has held numerous board appointments, including advisory director at Community Bank, Katy, Texas. Additionally, he is the founder and director of the Nichols Foundation, a foundation to provide college scholarships to students on a need basis. He also serves on the development council of the Mays Business School at Texas A&M University. Mr. Nichols is a Certified Public Accountant and is a member of the American Institute of Certified Public Accountants and the Texas Society of Certified Public Accountants. He received a Bachelor of Business Administration degree from Texas A&M University. Mr. Nichols’ understanding of the Houston business market and leadership experience qualify him to serve on our board.
Thomas A. Reiser is one of the organizers of the Bank and has served on our board since 2007 and the board of the Bank since 2007. Mr. Reiser has over 30 years of business experience. He is presently the Chairman and Chief Executive Officer of Upstream Insurance Brokers. He has over 20 years of board membership, including from 1994 to 2006 when he served as a Director of Sterling Bancshares, Inc. Mr. Reiser has served on numerous board committees, including audit, enterprise risk management and IT committees. Mr. Reiser received a Bachelor of Arts degree from the College of William and Mary. Mr. Reiser’s extensive business experience in the community banking industry qualifies him to serve on our board.
Raimundo Riojas E. has served on our board since 2012. Mr. Riojas is the President of Duwest, Inc., a joint venture of Westrade, Inc. and E.I. DuPont de Nemours, engaged in the distribution of crop protection products and the manufacture of industrial and automotive coatings. Mr. Riojas presently manages a group of companies in Central America, Colombia and the Caribbean. From 1994 to 2011, he served as a director of Sterling Bancshares, Inc. He has also served as a director of The American Brahman Breeders Association since 1996. Mr. Riojas received a Chemical Engineering degree from Texas A&M University. Mr. Riojas’ international business experience and relationships in the banking industry qualifies him to serve on our board.
Fred S. Robertson has served on our board since 2011. Mr. Robertson has over 30 years of experience overseeing institutional and retail investments. He has managed fixed income investments and designed extensive quantitative models for bond management. For the past five years, Mr. Robertson has been managing his personal investments. Mr. Robertson holds a number of board appointments, including with the Texas Presbyterian Foundation and the Houston Firefighters Relief and Retirement Fund, and volunteers with many
116
Table of Contents
organizations in Houston. Mr. Robertson received a Bachelor of Science from Cornell University and a Masters of Business Administration in finance from the College of William and Mary. Mr. Robertson’s significant experience in the banking industry and leadership skills qualify him to serve on our board.
Composition of the Board of Directors; Classes of Directors
Upon completion of the proposed offering, our board of directors will consist of 15 members, 10 of whom will qualify as independent directors under the corporate governance standards of The NASDAQ Stock Market.
Our board of directors is divided into three classes, denominated as class I, class II and class III. Members of each class hold office for staggered three-year terms. At each annual meeting of our shareholders, the successors to the directors whose term expires at that meeting will be elected to serve until the third annual meeting after their election or until their successors have been elected and qualified. Messrs. Bohls, Fraser, Hartzell, Kearney and Mann serve as class I directors whose terms expire at the 2016 annual meeting of shareholders. Ms. Jeter and Messrs. Beckworth, Martinez, Moulton and Reiser serve as class II directors whose terms expire at the 2017 annual meeting of shareholders. Messrs. Nichols, Retzloff, Riojas, Robertson and Vitulli serve as class III directors whose terms expire at the 2018 annual meeting of shareholders.
Director Independence
Under the rules of The NASDAQ Stock Market, independent directors must comprise a majority of our board of directors within a specified period of time of this offering. The rules of The NASDAQ Stock Market, as well as those of the SEC, also impose several other requirements with respect to the independence of our directors. Our board of directors has undertaken a review of the independence of each director based upon these rules. Applying these standards, our board of directors has affirmatively determined that, with the exception of Messrs. Bohls, Fraser, Martinez, Retzloff and Vitulli, each of our current directors qualifies as an independent director under applicable rules. In making these determinations, our board of directors considered the current and prior relationships that each director has with our company and all other facts and circumstances our board of directors deemed relevant in determining their independence, including the beneficial ownership of our capital stock by each director, and the transactions involving them described in the section titled “Certain Relationships and Related Party Transactions.”
Risk Management and Oversight
Our board of directors oversees our risk management process, including the company-wide approach to risk management, carried out by our management. Our full board determines the appropriate risk for us generally, assesses the specific risks faced by us, and reviews the steps taken by management to manage those risks. While our full board maintains the ultimate oversight responsibility for the risk management process, its committees oversee risk in certain specified areas. In particular, our compensation committee is responsible for overseeing the management of risks relating to our executive compensation plans and arrangements, and the incentives created by the compensation awards it administers. Our audit committee oversees management of enterprise risks as well as financial risks and is also responsible for overseeing potential conflicts of interests. Our corporate governance and nominating committee is responsible for overseeing the management of risks associated with the independence of our board of directors. Pursuant to our board’s instruction, management regularly reports on applicable risks to the relevant committee or the full board, as appropriate, with additional review or reporting on risks conducted as needed or as requested by our board of directors and its committees.
Leadership Structure
Our board of directors meets quarterly, and the board of directors of the Bank meets monthly. Our board of directors does not have a policy regarding the separation of the roles of Chief Executive Officer and Chairman of the Board, as the board believes that it is in the best interests of our organization to make that determination from
117
Table of Contents
time to time based on the position and direction of our organization and the membership of the board. The board has determined that having our Chief Executive Officer serve as Chairman of the Board is in the best interests of our shareholders at this time. This structure makes best use of the Chief Executive Officer’s extensive knowledge of our organization and the banking industry. The board views this arrangement as also providing an efficient nexus between our organization and the board, enabling the board to obtain information pertaining to operational matters expeditiously and enabling our Chairman to bring areas of concern before the board in a timely manner.
Committees of the Board of Directors
Our board of directors has established the following standing committees: an audit committee, a compensation committee and a corporate governance and nominating committee. The composition and responsibilities of each committee are described below. Members serve on these committees until their resignation or until otherwise determined by our board of directors.
Audit Committee
Our audit committee consists of Messrs. Nichols, Mann and Reiser, with Mr. Nichols serving as chair of the audit committee. Our audit committee has responsibility for, among other things:
| • | selecting and hiring our independent registered public accounting firm, and approving the audit and non-audit services to be performed by our independent registered public accounting firm; |
| • | evaluating the qualifications, performance and independence of our independent registered public accounting firm; |
| • | monitoring the integrity of our financial statements and our compliance with legal and regulatory requirements as they relate to financial statements or accounting matters; |
| • | reviewing the adequacy and effectiveness of our internal control policies and procedures; |
| • | discussing the scope and results of the audit with the independent registered public accounting firm and reviewing with management and the independent registered public accounting firm our interim and year-end operating results; and |
| • | preparing the audit committee report required by the SEC to be included in our annual proxy statement. |
Rule 10A-3 promulgated by the SEC under the Exchange Act and applicable rules of The NASDAQ Stock Market require our audit committee to be composed entirely of independent directors upon the effective date of our registration statement. Our board of directors has affirmatively determined that each of the members of our audit committee qualifies as independent directors under the rules of The NASDAQ Stock Market and for purposes of serving on an audit committee under applicable SEC rules. Our board of directors also has determined that Mr. Nichols qualifies as an “audit committee financial expert” as defined by the SEC.
Our board of directors has adopted a written charter for our audit committee, which will be available on our corporate website upon completion of this offering.
Compensation Committee
Our compensation committee consists of Messrs. Moulton, Beckworth, Nichols, Riojas and Robertson, with Mr. Moulton serving as chair of the compensation committee. The compensation committee is responsible for, among other things:
| • | reviewing and approving compensation of our executive officers including annual base salary, annual incentive bonuses, specific goals, equity compensation, employment agreements, severance and change in control arrangements, and any other benefits, compensation or arrangements; |
| • | reviewing succession planning for our executive officers; |
118
Table of Contents
| • | reviewing and recommending compensation goals, bonus and stock compensation criteria for our employees; |
| • | determining the compensation of our directors; |
| • | reviewing and discussing annually with management our executive compensation disclosure required by SEC rules; |
| • | preparing the compensation committee report required by the SEC to be included in our annual proxy statement; and |
| • | administering, reviewing and making recommendations with respect to our equity compensation plans. |
Our board of directors has evaluated the independence of the members of our compensation committee and has determined that each of the members of our compensation committee is independent under The NASDAQ Stock Market standards. The members of the compensation committee also qualify as “non-employee directors” within the meaning of Rule 16b-3 under the Exchange Act and “outside directors” within the meaning of Section 162(m) of the Internal Revenue Code of 1986, as amended.
Our board of directors has adopted a written charter for our compensation committee, which will be available on our corporate website upon completion of this offering.
Corporate Governance and Nominating Committee
Our corporate governance and nominating committee consists of Ms. Jeter and Messrs. Beckworth and Moulton, with Mr. Beckworth serving as chair of the corporate governance and nominating committee. The corporate governance and nominating committee is responsible for, among other things:
| • | assisting our board of directors in identifying prospective director nominees and recommending nominees for each annual meeting of shareholders to the board of directors; |
| • | reviewing developments in corporate governance practices and developing and recommending governance principles applicable to our board of directors; |
| • | overseeing the evaluation of our board of directors and management; and |
| • | recommending members for each board committee of our board of directors. |
Our board of directors has evaluated the independence of the members of our corporate governance and nominating committee and has determined that each of the members of our corporate governance and nominating committee is independent under The NASDAQ Stock Market standards.
Our board of directors has adopted a written charter for our corporate governance and nominating committee, which will be available on our corporate website upon completion of this offering.
Compensation Committee Interlocks and Insider Participation
None of our executive officers currently serves, or in the past year has served, as a member of the board of directors or compensation committee of any entity that has one or more executive officers serving on our board of directors.
Corporate Governance Guidelines and Code of Business Conduct and Ethics
Our board of directors will adopt corporate governance guidelines, which will set forth a flexible framework within which our board of directors, assisted by board committees, will direct the affairs of the Company. The guidelines will address, among other things, the composition and functions of our board of directors, director independence, compensation of directors, management succession and review, board committees and selection of new directors.
119
Table of Contents
We will adopt a code of business conduct and ethics applicable to our principal executive, financial and accounting officers and all persons performing similar functions. A copy of that code and the corporate governance guidelines will be available on our corporate website upon completion of this offering. We expect that any amendments to such code and guidelines, or any waivers of their requirements, will be disclosed on our corporate website.
120
Table of Contents
EXECUTIVE COMPENSATION AND OTHER MATTERS
We are providing compensation disclosure that satisfies the requirements applicable to emerging growth companies, as defined in the JOBS Act. Our named executive officers for 2014, which consists of our principal executive officer and the two other most highly compensated executive officers, are George Martinez, Steven F. Retzloff and Daryl D. Bohls.
Summary Compensation Table
The following table sets forth information regarding the compensation of our named executive officers for the year ended December 31, 2014. Except as set forth in the notes to the table, all cash compensation for each of our named executive officers was paid by the Bank, where each of the following persons also serve as an executive officer.
| Name and Principal Position |
Year | Salary(1) ($) |
Bonus(2) ($) |
Stock Awards ($) |
Option Awards ($) |
Non-Equity Incentive Plan Compensation ($)(4) |
Nonqualified Deferred Compensation Earnings ($) |
All Other Compensation ($) |
Total ($) | ||||||||||||||||||||||||||||||||||||
| George Martinez, Chairman and Chief Executive Officer of the Company |
2014 | 350,000 | — | — | — | 19,040 | — | 1,200 | (5) | 370,240 | |||||||||||||||||||||||||||||||||||
| Steven F. Retzloff, President of the Company and Chairman of the Bank |
2014 | 350,000 | — | — | — | 15,818 | — | — | 365,818 | ||||||||||||||||||||||||||||||||||||
| Daryl D. Bohls, Executive Vice President |
2014 | 232,771 | 24,451 | 16,340 | 6,780 | (3) | 13,941 | 47 | 4,223 | (6) | 298,553 | ||||||||||||||||||||||||||||||||||
| (1) | The amounts shown in this column reflect salaries earned during 2014. |
| (2) | The amounts shown reflect cash bonuses earned in 2014, but that were paid in 2015. See “—Officer Incentive Bonus” for additional information regarding how we determine our incentive bonuses. |
| (3) | Stock option award to purchase 339 shares at an exercise price of $20.00 that vest in four annual installments beginning on the first anniversary of the grant date. |
| (4) | The amounts in this column reflect matching contributions to the employee’s 401(k) and profit sharing plan. |
| (5) | The amounts shown in this column include benefit received for not enrolling in company provided medical insurance. |
| (6) | The amounts shown include club dues of $4,223. |
Officer Incentive Bonus
Our executive officers, with the exception of our Chairman and Chief Executive Officer participate in an annual incentive bonus program, which is one component of our multifaceted compensation strategy. Our annual incentive bonus program and our overall compensation strategy is designed by our compensation committee with the goal of providing competitive compensation that rewards and incentivizes excellent performance and retains and attracts well qualified employees. Our overall approach to bonus compensation is to influence and reward our officers as a team, thus, all participate, while providing well-reasoned rewards to incentivize performance and asset quality.
The incentive bonus is based on the overall pre-tax profitability of the Bank, using a preset formula established by our compensation committee to create a cash bonus pool which is available for distribution at year end. The bonus is primarily cash, however, if the cash pool is determined by our board of directors to be insufficient to meet our strategic needs, our compensation committee may elect to supplement cash bonuses with restricted stock grants as part of the annual incentive bonus.
Distribution of the aforementioned pool to each of the offers is based on a “point” system. Each officer is awarded points based on his or her current level of responsibility, total base pay earned during a year and performance rating. Once each officer’s points are calculated, the total points for all officers is calculated. Eighty percent of the cash bonus pool is distributed to the officers based on their individual percentage of the total points for all of the officers. The remaining 20% of the cash bonus pool is distributed to officers based on a determination by the compensation committee. In determining the distribution of the remaining 20%, the compensation committee takes into consideration contribution and value of each officer to our overall success, among other things.
121
Table of Contents
Outstanding Equity Awards at 2014 Fiscal Year-End
The table below sets forth information relating to the unexercised options and outstanding stock awards held by our named executive officers as of December 31, 2014.
| Options Awards | Stock Awards | |||||||||||||||||||||||||||||||||||
| Name |
Number of Securities Underlying Unexercised Options Exercisable (#) |
Number of Securities Underlying Unexercised Options Unexercisable (#) |
Equity Incentive Plan Awards: Number of Securities Underlying Unexercised Unearned Options (#) |
Option Exercise Price ($) |
Option Expiration Date |
Number of shares or units of stock that have not vested (#) |
Market value of shares or units of stock that have not vested ($)(2) |
Equity incentive plan awards: Number of unearned shares, units or other rights that have not vested (#) |
Equity incentive plan awards: Market or payout value of unearned shares, units or other rights that have not vested ($) |
|||||||||||||||||||||||||||
| George Martinez |
— | — | — | — | — | — | — | — | — | |||||||||||||||||||||||||||
| Steven F. Retzloff |
— | — | — | — | — | — | — | — | — | |||||||||||||||||||||||||||
| Daryl D. Bohls |
— | — | — | — | — | 1,188 | (1) | 27,324 | — | — | ||||||||||||||||||||||||||
| (1) | Mr. Bohls received a grant of 2,200 shares of restricted stock on June 30, 2011, the restrictions on which lapse in equal parts on the first, second, third and fourth anniversary of the grant date. Mr. Bohls also received a grant of 850 shares of restricted stock on January 2, 2013, the restrictions on which lapse in equal parts on the first, second, third and fourth anniversary of the grant date. |
| (2) | Calculated based on an assumed initial public offering price of $23.00 per share, which is the midpoint of the estimated initial public offering price range set forth on the cover page of this prospectus. |
Amended and Restated Equity Plan
On February 27, 2015, our board of directors approved an amended and restated equity incentive plan (the “Amended and Restated Equity Plan”). The plan was approved by the affirmative vote of the holders of a majority of the outstanding shares of our common stock represented at our annual meeting of stockholders on March 23, 2015. The Amended and Restated Equity Plan is an amendment and restatement of our Allegiance Bancshares, Inc. 2008 Stock Awards and Incentive Plan (the “2008 Plan”), which we adopted in 2008 and was subsequently amended on March 24, 2014. The purpose of Amended and Restated Equity Plan is to provide incentive compensation opportunities that are competitive with those of similar companies in order to attract, retain and motivate those individuals eligible to participate in the Amended and Restated Equity Plan by providing for both the direct award or sale of shares and for the grant of options to purchase shares of our common stock.
The Amended and Restated Equity Plan amends the 2008 Plan by, among other things, increasing the maximum number of shares of our common stock that may be issued pursuant to stock grants or options from 1,040,000 shares to 1,460,000 shares. As of August 3, 2015, 394,044 shares remained available for future grant under the Amended and Restated Equity Plan. A summary of the material terms of the Amended and Restated Equity Plan are described below.
Plan Administration. A committee of the board administers the Amended and Restated Equity Plan and determines which employees, directors and other individuals shall receive grants of options and awards, and has the authority to determine the vesting, restrictions and other terms of the agreements representing such options or awards, as the case may be. The committee is also authorized to interpret the Amended and Restated Equity Plan and the respective award agreements executed under the Amended and Restated Equity Plan and to make all other determinations with respect to the Amended and Restated Equity Plan. The board of directors, in its discretion but subject to applicable laws, may amend any provision of an option or other award, including for the purpose of extending the date through which an award is exercisable, and/or accelerating the date on which an award becomes exercisable, vested, free from restrictions or payable.
Eligibility. Awards under the Amended and Restated Equity Plan may be granted to all employees of the Company and its affiliates, directors of the Company and its affiliates or other individuals who perform services for the Company and its affiliates; provided that incentive stock options may be granted only to employees of the Company or its affiliates.
122
Table of Contents
Shares Available for Issuance. The Amended and Restated Equity Plan provides for the grant of awards covering an aggregate of 1,460,000 shares of the Company’s common stock (to include awards granted prior to the effective date of the Amended and Restated Equity Plan) in any combination of the following:
| • | options to purchase shares of the Company’s common stock, which may be incentive stock options or non-qualified stock options; |
| • | stock appreciation rights; |
| • | restricted stock awards; |
| • | performance compensation awards; and |
| • | phantom stock awards. |
If an option or award expires, is forfeited or is terminated or is settled in cash, the shares that were subject to the unexercised or unvested portion will be available for future awards granted under the Amended and Restated Equity Plan. Shares surrendered or withheld in payment of the exercise price of an option or withheld to satisfy tax withholding obligations will count against the aggregate share limit and will not again be available for the grant of awards. The number of shares covered by each outstanding option or award and the exercise price of outstanding options shall be proportionately adjusted for any increase or decrease in the number of the Company’s outstanding shares resulting from various changes in its capitalization, such as stock splits or stock dividends.
Types of Awards. The Amended and Restated Equity Plan provides for the granting of incentive stock options, nonqualified stock options, stock appreciation rights, restricted stock awards, performance compensation awards and phantom stock awards. A summary of each type of award is as follows:
Stock Options. A stock option confers upon the awardee the right to purchase a certain number of shares of the Company’s common stock at an established exercise price. The committee may authorize the grant of options that are incentive stock options within the meaning of Section 422(b) of the Code or options that do not constitute incentive stock options (nonqualified stock options). The exercise price of each incentive and nonqualified stock option granted under the Amended and Restated Equity Plan will be determined by the committee, and, except in the event of certain situations for, or assumption of other options in, compliance with applicable law, the exercise price cannot be less than the fair market value of the Company’s common stock at the grant date. For each option, the committee will establish (1) the term of the option, (2) the time or period of time in which the option will vest, (3) the form of payment due upon exercise of the option and (4) the treatment of the option upon the awardee’s termination of employment or service. At the time of a grant of stock options the committee may also prescribe additional terms, conditions or restrictions relating to the options, including, but not limited to, provisions relating to tax matters (including provisions covering applicable withholding requirements) and any other matters not inconsistent with the Amended and Restated Equity Plan. Each grant of stock options may have different terms and conditions. No more than 100,000 shares of the Company’s common stock may be subject to stock options granted under the Amended and Restated Equity Plan to any one individual during any one year period.
Incentive stock options (“ISOs”) are subject to certain special rules under the Internal Revenue Code. Except as provided below, the maximum term of an ISO may not exceed ten years. Except as otherwise provided under the Code or applicable regulations, to the extent that the aggregate fair market value (determined at the time the option is granted) of the Company’s common stock with respect to which ISOs (determined without regard to this sentence) are exercisable for the first time by any employee during any calendar year under all plans of the Company and its affiliates exceeds $100 thousand, such options shall be treated as nonqualified stock options. No ISO may be granted to an individual if, at the time the option is granted, such individual owns stock possessing more than 10% of the total combined voting power of all classes of stock of the Company or of its affiliates, unless (i) at the time the option is granted the exercise price is at least 110% of the fair market value of the Company’s common stock subject to the option and (ii) the option is not exercisable after the expiration of five years from the date of grant.
123
Table of Contents
Stock Appreciation Rights. A stock appreciation right (“SAR”) is the right to receive an amount equal to the excess, if any, of the fair market value of a share of the Company’s common stock on the date the right is exercised over the exercise price of the SAR as determined by the committee as of the date of grant of the SAR, which shall not be less than the fair market value of one share of the Company’s common stock on the date of grant. The committee will determine (1) the time or times at which an SAR may be exercised in whole or in part, (2) whether payment upon exercise will be made in cash, shares of the Company’s common stock or a combination thereof and (3) the treatment of SARs upon the awardee’s termination of employment or service. At the time of an award of SARs, the committee may prescribe additional terms, conditions or restrictions relating to the SAR, including, but not limited to, provisions relating to (a) vesting of SARs, (b) tax matters (including provisions covering applicable wage withholding requirements) and (c) any other matters not inconsistent with the Amended and Restated Equity Plan. Each award of SARs may have different terms and conditions. SARs may be granted in connection with the grant of stock options, in which case the exercise of SARs will result in the surrender of the right to purchase the shares under the option as to which the SARs were exercised. No more than 50,000 shares of the Company’s common stock may be subject to SARs granted under the Amended and Restated Equity Plan to any one individual during any one year period.
Restricted Stock Awards. A grant of shares of restricted stock represents shares of the Company’s common stock that are subject to restrictions on disposition and the obligation of the awardee to forfeit and surrender the shares under certain circumstances (forfeiture restrictions). The committee will have sole discretion to determine the forfeiture restrictions and may provide that such forfeiture restrictions shall lapse upon (1) the attainment of one or more performance targets established by the committee or (2) the awardee’s continued employment or service with the Company for a specified period of time. Each award of restricted stock may have different forfeiture restrictions. Except to the extent restricted under the terms of the Amended and Restated Equity Plan and any agreement relating to the award of restricted stock, an awardee granted restricted stock shall have all of the rights of a shareholder including, without limitation, the right to vote restricted stock or the right to receive dividends thereon.
At the time of the award of restricted stock, the committee may prescribe additional terms, conditions or restrictions including, but not limited to, rules related to the (1) vesting of restricted stock awards, (2) termination of employment or service of the awardee prior to the lapse of the forfeiture restrictions, (3) the amount and form of any payment for shares of the Company’s common stock received pursuant to a restricted stock award, (4) tax matters and (5) any other matters not inconsistent with the Amended and Restated Equity Plan. No more than 100,000 shares of the Company’s common stock may be granted under the Amended and Restated Equity Plan as a restricted stock award to any one individual during any one year period. Each grant of restricted stock may have different terms and conditions.
Performance Compensation Awards. The committee may designate any award or a portion of any award as a “performance compensation award,” other than options or SARs granted with an exercise price equal to or greater than the fair market value of a share of the Company’s common stock on the grant date. In addition, the committee may make an award of a cash bonus to any awardee and designate the award as a performance compensation award. The maximum amount that can be paid in any calendar year to any awardee pursuant to such a cash bonus award is $500 thousand. The committee has discretion to select the length of the performance period, the type of performance compensation award to be issued, the performance criteria that will be used to establish the performance goals, the level of performance goals that must be achieved and any performance formula used to determine achievement. An awardee will be eligible to receive payment with respect to a performance compensation award only to the extent that the applicable performance goals are achieved, and the committee determines that the application of the performance formula results in some or all of the awardee’s award being earned for the performance period. Unless otherwise provided in the applicable award agreement, an awardee must be employed by the Company or an affiliate on the last day of a performance period to be eligible for payment with respect to a performance compensation award for such performance period. Performance criteria include the following:
| • | the price of a share of the Company’s common stock; |
| • | the Company’s earnings per share |
124
Table of Contents
| • | the Company’s net earnings; |
| • | the Company’s return on stockholders’ equity; |
| • | the Company’s return on assets; |
| • | the Company’s net interest margin; or |
| • | the Company’s efficiency ratio. |
The committee may adjust or modify the calculation of a performance goal for a performance period in order to prevent the dilution or enlargement of the rights of participants based on the following events: asset write-downs; litigation or claim judgments or settlements; the effect of changes in tax laws, accounting principles, or other laws or regulatory rules affecting reported results; any reorganization and restructuring programs; extraordinary nonrecurring items; acquisitions or divestitures; any other specific unusual or nonrecurring events, or objectively determinable category thereof; foreign exchange gains and losses; or a change in our fiscal year. For any award that is intended to constitute qualified performance-based compensation under Section 162(m) of the Internal Revenue Code, such adjustment or modification may be made only to the extent permitted by the Internal Revenue Code.
Phantom Stock Awards. A phantom stock award is the right to receive shares of the Company’s common stock (or cash in an amount equal to the fair market value thereof), or an amount equal to any appreciation in the fair market value of the Company’s common stock over a specified period of time, which vest over a period of time or upon the occurrence of an event as established by the committee, without payment of any amounts by the awardee (except to the extent required by law) or satisfaction of any performance criteria or objectives. Each phantom stock award has a maximum value established by the committee at the time of the award grant. The committee will determine (1) the period over which, or the event upon which, the phantom stock award will vest, (2) whether payment upon vesting will be made in cash, shares of the Company’s common stock or a combination thereof and (3) the treatment of the phantom stock award upon the awardee’s termination of employment or service. Each phantom stock award may have different terms and conditions.
Amendment and Termination. The board of directors may alter or amend the Amended and Restated Equity Plan at any time, except that it may not make any amendment which would impair any existing rights under an option or award without the consent of the holder. The board of directors may not, without approval of the Company’s shareholders, amend the Amended and Restated Equity Plan if shareholder approval is required to satisfy applicable laws, rules, regulations or securities exchange listing requirements. With respect to any shares for which awards have not been granted, the board of directors may terminate the Amended and Restated Equity Plan at any time. Except with respect to awards then outstanding, if not sooner terminated or extended, the Amended and Restated Equity Plan will terminate and no further awards shall be granted after the expiration of ten years from its effective date.
Employment Agreements
Currently, it is generally our policy to not have employment agreements with our employees. We do not have employment agreements with any of our named executive officers.
Director Compensation
We currently pay our directors, other than those directors who are employed by the Bank or us, based on the directors’ participation in board and committee meetings, and the Bank currently pays its directors in the same manner. Directors who are also employed by the Bank or us do not receive remuneration for serving as a director of the Bank or us, but are compensated in their capacity as employees. Additionally, we are party to a consulting agreement with Mr. Fraser pursuant to which we pay Mr. Fraser an annual fee of $185 thousand paid semi-monthly. The initial term of the consulting agreement expires on November 13, 2015 and renews automatically month-to-month unless terminated by either party prior to such renewal.
125
Table of Contents
The following table sets forth the compensation paid to each non-employee director who served on our board of directors in 2014. The table also includes compensation earned by each director that is attributable to his service as a director of the Bank.
| Name |
Fees Earned or Paid in Cash ($)(1) |
Option Awards ($)(2) | Total ($) | ||||||||||||
| John Beckworth |
4,650 | — | 4,650 | ||||||||||||
| Lawrence G. Fraser(3) |
193,854 | — | 193,854 | ||||||||||||
| Matthew H. Hartzell |
3,300 | — | 3,300 | ||||||||||||
| Frances H. Jeter |
2,100 | — | 2,100 | ||||||||||||
| James J. Kearney |
10,650 | — | 10,650 | ||||||||||||
| P. Michael Mann, M.D. |
4,200 | — | 4,200 | ||||||||||||
| David B. Moulton |
27,450 | — | 27,450 | ||||||||||||
| William S. Nichols, III |
9,150 | — | 9,150 | ||||||||||||
| Thomas A. Reiser |
5,550 | — | 5,550 | ||||||||||||
| Raimundo Riojas E. |
2,250 | — | 2,250 | ||||||||||||
| Fred S. Robertson |
11,700 | — | 11,700 | ||||||||||||
| (1) | The amounts shown in this column include fees for serving on the board of directors and any of its committees. |
| (2) | No options were granted to directors during the year ended December 31, 2014. |
| (3) | Includes $185 thousand paid pursuant to our consulting agreement with Mr. Fraser. |
126
Table of Contents
The following table sets forth information with respect to the beneficial ownership of our common stock as of August 3, 2015, subject to certain assumptions set forth in the footnotes and as adjusted to reflect the sale of the shares of our common stock offered in this offering for:
| • | each shareholder, or group of affiliated shareholders, who we know beneficially owns more than 5% of the outstanding shares of our common stock; |
| • | each of our current directors; |
| • | each of our named executive officers; and |
| • | all of our executive officers and directors as a group. |
Beneficial ownership is determined in accordance with rules of the SEC and generally includes any shares over which a person exercises sole or shared voting and/or investment power. Shares of common stock subject to options and warrants currently exercisable or exercisable within 60 days are deemed outstanding for purposes of computing the percentage ownership of the person holding the options but are not deemed outstanding for purposes of computing the percentage ownership of any other person. Except as otherwise indicated, we believe the beneficial owners of the common stock listed below, based on information furnished by them, have sole voting and investment power with respect to the number of shares listed opposite their names.
We have based our calculation of beneficial ownership prior to this offering on 9,823,025 shares of our common stock outstanding on August 3, 2015. We have based our calculation of beneficial ownership after giving effect to this offering on 12,423,025 shares of our common stock outstanding, which gives effect to the issuance of 2,600,000 shares of common stock in this offering, assuming no exercise of the underwriters’ option to purchase additional shares.
Unless otherwise indicated, the address of each of the individuals and entities named in the table below under “Executive Officers and Directors” is c/o Allegiance Bancshares, Inc., 8847 West Sam Houston Parkway N., Suite 200, Houston, Texas 77040.
| Shares Beneficially Owned Prior to this Offering(1) |
Shares Beneficially Owned After Giving Effect to this Offering(1) |
|||||||||||
| Name |
Number | Percentage | Percentage | |||||||||
| Executive Officers and Directors: |
||||||||||||
| John Beckworth |
173,335 | (2) | 1.76 | % | 1.40 | % | ||||||
| Daryl D. Bohls |
36,512 | (3) | * | * | ||||||||
| Lawrence G. Fraser |
34,912 | (4) | * | * | ||||||||
| Matthew H. Hartzell |
9,227 | (5) | * | * | ||||||||
| Frances H. Jeter |
— | — | — | |||||||||
| James J. Kearney |
22,166 | (6) | * | * | ||||||||
| P. Michael Mann, M.D. |
255,636 | (7) | 2.60 | 2.06 | ||||||||
| George Martinez |
281,167 | (8) | 2.86 | 2.26 | ||||||||
| David B. Moulton |
25,833 | (9) | * | * | ||||||||
| William S. Nichols, III |
80,800 | (10) | * | * | ||||||||
| Thomas A. Reiser |
83,867 | (11) | * | * | ||||||||
| Steven F. Retzloff |
288,501 | (12) | 2.94 | 2.32 | ||||||||
| Raimundo Riojas E. |
155,455 | (13) | 1.58 | 1.25 | ||||||||
| Fred S. Robertson |
62,000 | (14) | * | * | ||||||||
| Ramon A. Vitulli III |
29,005 | (15) | * | * | ||||||||
| Directors and Executive Officers as a group (16 persons) |
1,546,416 | (16) | 15.65 | % | 12.39 | % | ||||||
127
Table of Contents
| * | Amount represents less than 1% of outstanding common stock. |
| (1) | Percentage is based on 9,823,025 shares of the Company’s common stock issued and outstanding and assumes the exercise by the shareholder or group named in each row of all vested options for the purchase of the Company’s common stock held by such shareholder that are exercisable within 60 days and all shares of restricted stock granted to date. The percentage for “Shares Beneficially Owned After Giving Effect to this Offering” assumes that none of our directors or executive officers participate in this offering. |
| (2) | Consists of 6,667 shares held of record by Mr. Beckworth, 57,143 shares held of record by John Beckworth & Laura H. Beckworth Ten Com, 14,286 shares held of record by Mr. Beckworth’s son, Carter H. Beckworth, 14,286 shares held of record by his son, John P. Beckworth, 14,286 shares held of record by his son, William L. Beckworth, and 66,667 shares held of record by the Laura Hobby Beckworth 1999 WPH Trust, of which his spouse is trustee. |
| (3) | Consists of 5,000 shares held of record by an IRA rollover account for the benefit of Mr. Bohls, 1,001 shares held of record by Mr. Bohls, 426 shares that can be acquired pursuant to the vesting of Restricted Stock Awards and 30,085 shares that can be acquired pursuant to the exercise of outstanding stock options. |
| (4) | Consists of 8,918 shares held of record by Mr. Fraser, 22,096 shares held of record by Fraser Family Partnership Ltd., of which Mr. Fraser is a limited partner 3,816 shares in three trusts for his grandchildren (1,272 for each trust) and 82 shares held of record by Mr. Fraser’s son, Alfred Brian Fraser. |
| (5) | Consists of 3,974 shares held of record by Mr. Hartzell and 5,253 shares held by an IRA account for the benefit of Mr. Hartzell. |
| (6) | Consists of 20,166 shares held of record by Mr. Kearney and his wife, Kina. and 2,000 shares held of record by Mr. Kearney’s daughter Kara Elsik. All shares have been pledged as security for a loan. |
| (7) | Consists of 37,500 shares held of record by White House Realty, LLC, of which Dr. Mann is President, 9,400 shares held of record by an IRA for the benefit of Dr. Mann, 31,773 shares of record by Paul Michael Mann, 153,001 shares held of record by MCRP Interests Ltd., of which Dr. Mann is President, and 23,962 shares held of record by Dr. Mann’s son Paul Michael Mann II. |
| (8) | Consists of 280,167 shares held of record by Martinez 2007 Family Partnership Ltd., of which Mr. Martinez is a limited partner and 1,000 shares held of record by Mr. Martinez’s brother Julio Martinez. |
| (9) | Consists of 12,500 shares held of record by Mr. Moulton and 13,333 shares held of record by an IRA account for the benefit of Mr. Moulton. |
| (10) | Consists of 63,300 shares held of record by Nichols Realty Investments I, LTD., of which Mr. Nichols is the President of the managing partner, Nichols GP Investment, Inc., 16,000 shares held of record by Nichols Rising Star Partners II, LTD., of which Mr. Nichols is the President of the managing partner, Nichols GP Investment, Inc., 250 shares held of record by Mr. Nichols’ son, Jeremy Nichols, and 1,250 shares held of record by Mr. Nichols’ son, William S. Nichols IV. |
| (11) | Consists of 82,417 shares held of record by Mr. Reiser and 1,450 shares held of record by Mr. Reiser’s sister Susan Lee Fontaine. |
| (12) | Consists of 13,500 shares held of record by Mr. Retzloff and his wife, Barbara, 266,667 shares held of record by Retzloff Holdings, LTD., of which Mr. Retzloff is a limited partner, 1,667 shares held of record by Mr. Retzloff’s daughter and 6,667 shares held of record by Mr. Retzloff’s son. |
| (13) | Consists of 155,455 shares held of record by Glencox Investments, Inc., of which Mr. Riojas is President. |
| (14) | Consists of 62,000 shares held of record by The Robertson Family Trust, of which Mr. Robertson is the trustee. |
| (15) | Consists of 6,667 shares held of record by an IRA account for the benefit of Mr. Vitulli, 1,648 shares held individually, 352 shares that can be acquired pursuant to vesting of Restricted Stock Awards, and 20,338 shares that can be acquired pursuant to the exercise of outstanding stock options. |
| (16) | Includes 56,423 shares that can be acquired pursuant to outstanding stock options that are exercisable within 60 days. |
128
Table of Contents
CERTAIN RELATIONSHIPS AND RELATED PARTY TRANSACTIONS
General
Some of our officers, directors and principal shareholders and their affiliates are our customers. Such officers, directors and principal shareholders and their affiliates have had transactions in the ordinary course of business with us, including borrowings, all of which were effected on substantially the same terms and conditions, including interest rate and collateral, as those prevailing from time to time for comparable transactions with persons unaffiliated with us and did not involve more than the normal risk of collectability or other unfavorable features. We expect to continue to have such transactions on similar terms and conditions with such officers, directors and shareholders and their affiliates in the future.
Review and Approval of Transactions with Related Persons
Transactions by us with related parties are subject to a formal written policy, as well as regulatory requirements and restrictions. These requirements and restrictions include Sections 23A and 23B of the Federal Reserve Act (which govern certain transactions by the Bank with its affiliates) and the Federal Reserve’s Regulation O (which governs certain loans by the Bank to its executive officers, directors, and principal shareholders). See “Regulation and Supervision—Limits on Transactions with Affiliates and Insiders.” We have adopted policies to comply with these regulatory requirements and restrictions.
In connection with this offering, we intend to supplement our related party transaction policy in order to comply with all applicable requirements of the SEC and The NASDAQ Stock Market concerning related party transactions. Related party transactions will be referred for approval or ratification to our audit committee. In determining whether to approve a related party transaction, our audit committee will consider, among other factors, the fairness of the proposed transaction, the direct or indirect nature of the director’s, executive officer’s or related party’s interest in the transaction, the appearance of an improper conflict of interests for any director, executive officer or related party of the Company, taking into account the size of the transaction and the financial position of the director, executive officer or related party, whether the transaction would impair an outside director’s independence, the acceptability of the transaction to our regulators and the potential violations of other Company policies. A copy of our audit committee charter will be available on our corporate website upon completion of this offering.
129
Table of Contents
General
The following discussion is a summary of the material rights of our shareholders, including the material terms and provisions of our amended and restated certificate of formation and bylaws in effect upon completion of this offering. This discussion does not purport to be a complete description of these rights and may not contain all of the information regarding our common stock that is important to you. You should refer to our amended and restated certificate of formation and bylaws included as exhibits to the registration statement on Form S-1 of which this prospectus forms a part.
We are incorporated in the State of Texas. The rights of our shareholders are generally covered by Texas law and our amended and restated certificate of formation and bylaws. The terms of our capital stock are therefore subject to Texas law, including the Texas Business Organizations Code, and the common and constitutional law of Texas. We amended and restated our certificate of formation and bylaws prior to the consummation of this offering. Our amended and restated certificate of formation and bylaws have been filed with the SEC as Exhibit 3.1 and Exhibit 3.2 to the registration statement on Form S-1 of which this prospectus is a part, and we encourage you to read those documents.
Upon completion of this offering, our authorized capital stock will consist of 40,000,000 shares of common stock, par value $1.00 per share, and 1,000,000 shares of preferred stock, par value $1.00 per share. As of August 3, 2015, we had 9,823,025 shares of our common stock outstanding, held by 865 shareholders of record. Additionally, as of that same date we had 947,437 outstanding options to purchase shares of our common stock held by our employees, officers and directors, pursuant to our Amended and Restated Equity Plan. All of our shares outstanding at that date were fully paid and non-assessable. Immediately following the completion of this offering, we will have shares of common stock outstanding, not including shares that may be issued to the underwriters upon their exercise of their option to purchase additional shares.
Common Stock
Voting Rights. Subject to any special voting rights that may be given to any series of preferred stock that we may issue in the future, holders of our common stock are entitled to one vote per share in the election of directors and on all other matters submitted to a vote at a meeting of shareholders. No shareholder has the right of cumulative voting with respect to the election of directors. Directors will be elected by a plurality of the votes cast.
Liquidation Rights. On liquidation of the Company, the holders of the common stock are entitled to share pro rata with the holders of shares of other common stock of the Company in any distribution of the assets of the Company after the holders of shares of preferred stock have received the liquidation preference of their shares as determined by the board of directors plus any declared but unpaid dividends, if any, and after all other indebtedness of the Company has been retired.
Other. Our common stock has no preemptive or conversion rights and is not entitled to the benefits of any redemption or sinking fund provision.
Preferred Stock
Our amended and restated certificate of formation permits us to issue one or more series of preferred stock and authorizes our board of directors to designate the designations, preferences, limitations and relative rights of any such series of preferred stock, in each case, without any further action by our shareholders. Each share of a series of preferred stock will have the same relative rights as, and be identical in all respects with, all the other shares of the same series. Preferred stock may have voting rights, subject to applicable law and the determination at issuance by our board of directors. While the terms of preferred stock may vary from series to series, holders
130
Table of Contents
of our common stock should assume that all shares of preferred stock will be senior to our common stock in respect of distributions and on liquidation.
Although the creation and authorization of preferred stock does not, in and of itself, have any effect on the rights of the holders of our common stock, the issuance of one or more series of preferred stock may affect the holders of common stock in a number of respects, including the following:
| • | by subordinating our common stock to the preferred stock with respect to dividend rights, liquidation preferences, and other rights, preferences, and privileges; |
| • | by diluting the voting power of our common stock; |
| • | by diluting the earnings per share of our common stock; and |
| • | by issuing common stock, upon the conversion of the preferred stock, at a price below the fair market value or original issue price of the common stock that is outstanding prior to such issuance. |
As of the date of this prospectus, we had no shares of preferred stock issued and outstanding.
Business Combinations under Texas Law
A number of provisions of Texas law and our amended and restated certificate of formation and bylaws could have an anti-takeover effect and make any potential acquisition of the Company by means of a tender offer, a proxy contest or otherwise and the removal of incumbent directors more difficult. These provisions are intended to discourage coercive takeover practices and inadequate takeover bids and to encourage persons seeking to acquire control of the Company to negotiate first with our board of directors.
We are subject to the provisions of Title 2, Chapter 21, Subchapter M of the Texas Business Organizations Code (the “Texas Business Combination Law”), which provides that a Texas corporation that qualifies as an “issuing public corporation” (as defined in the Texas Business Combination Law) may not engage in specified types of business combinations, including mergers, consolidations and asset sales, with a person, or an affiliate or associate of that person, who is an “affiliated shareholder.” For purposes of this law, an “affiliated shareholder” is, or was, during the prior three years, the beneficial owner of 20.0% or more of the corporation’s voting shares. The prohibition on certain transactions with such affiliated shareholders extends for a three-year period from the date such shareholder first becomes an affiliated shareholder. These prohibitions do not apply if:
| • | the business combination or the acquisition of shares by the affiliated shareholder was approved by the board of directors of the corporation before the affiliated shareholder became an affiliated shareholder; or |
| • | the business combination was approved by the affirmative vote of the holders of at least two-thirds of the outstanding voting shares of the corporation not beneficially owned by the affiliated shareholder or an affiliate or associate of the affiliated shareholder, at a meeting of shareholders called for that purpose, not less than six months after the affiliated shareholder became an affiliated shareholder. |
As we currently have more than 100 shareholders, we are considered an “issuing public corporation” for purposes of this law. The Texas Business Combination Law does not apply to the following:
| • | the business combination of an issuing public corporation: where the corporation’s original certificate of formation or bylaws contain a provision expressly electing not to be governed by the Texas Business Combination Law; or that adopts an amendment to its certificate of formation or bylaws, by the affirmative vote of the holders, other than affiliated shareholders, of at least two-thirds of the outstanding voting shares of the corporation, expressly electing not to be governed by the Texas Business Combination Law and so long as the amendment does not take effect for 18 months following the date of the vote and does not apply to a business combination with an affiliated shareholder who became affiliated on or before the effective date of the amendment; |
131
Table of Contents
| • | a business combination of an issuing public corporation with an affiliated shareholder that became an affiliated shareholder inadvertently, if the affiliated shareholder divests itself, as soon as possible, of enough shares to no longer be an affiliated shareholder and would not at any time within the three-year period preceding the announcement of the business combination have been an affiliated shareholder but for the inadvertent acquisition; |
| • | a business combination with an affiliated shareholder who became an affiliated shareholder through a transfer of shares by will or intestacy and continuously was an affiliated shareholder until the announcement date of the business combination; and |
| • | a business combination of a corporation with its wholly owned subsidiary if the subsidiary is a Texas entity and not an affiliate or associate of the affiliated shareholder other than by reason of the affiliated shareholder’s beneficial ownership of voting shares of the corporation. |
Neither our amended and restated certificate of formation nor our amended and restated bylaws contains any provision expressly providing that we will not be subject to the Texas Business Combination Law. As a result, the Texas Business Combination Law may prevent a non-negotiated merger or other business combination involving the Company, even if such a merger or combination would be beneficial to our shareholders.
Action by Consent
Under Texas law, no action required or permitted to be taken at an annual or special meeting of shareholders may be taken by written consent in lieu of a meeting of shareholders without the unanimous written consent of all shareholders entitled to vote on the action unless the certificate of formation specifically allows action to be taken by a written consent of the shareholders holding the minimum number of shares necessary to take the action that is subject to that consent at a meeting of shareholders, even though such consent is not signed by all of the corporation’s shareholders. Our amended and restated certificate of formation does not provide for shareholder action by less than unanimous written consent.
Certain Certificate of Formation and Bylaw Provisions Potentially Having an Anti-takeover Effect
Our amended and restated certificate of formation and bylaws contain certain provisions which may have an anti-takeover effect and thus discourage potential takeover attempts and make it more difficult for our shareholders to change management or receive a premium for their shares. These provisions include:
| • | staggered terms for directors, who may be removed from office only for cause; |
| • | a prohibition on cumulative voting in the election of directors; |
| • | authority for the board of directors to issue shares of our preferred stock without shareholder approval and upon such terms as the board of directors may determine; |
| • | a provision establishing certain advance notice procedures for nomination of candidates for election as directors and for shareholder proposals; and |
| • | a provision that any special meeting of our shareholders may be called only by a majority of the board of directors, the President or a holder or group of holders of at least 50 % of our shares entitled to vote at the meeting. |
In addition to these provisions of our amended and restated certificate of formation and bylaws, banking laws impose notice, approval, and ongoing regulatory requirements on any shareholder or other party that seeks to acquire direct or indirect “control” of an FDIC-insured depository institution. These laws include the BHC Act and the Change in Bank Control Act. These laws could delay or prevent an acquisition. See “Regulation and Supervision—Notice and Approval Requirements Related to Control.”
132
Table of Contents
Exclusive Forum
Our amended and restated certificate of formation provides that, subject to certain exceptions, the state and federal courts located in Harris County, Texas, the county in which the City of Houston lies, shall be the sole and exclusive forum for certain shareholder litigation matters. Although we believe this provision benefits us by providing increased consistency in the application of Texas law in the types of lawsuits to which it applies, the provision may have the effect of discouraging lawsuits against our directors and officers and may limit our shareholders’ ability to obtain a favorable judicial forum for disputes with us. However, it is possible that a court could rule that this provision is unenforceable or inapplicable to a particular dispute.
Limitation of Liability and Indemnification of Officers and Directors
Our amended and restated certificate of formation provides that our directors and officers will be indemnified by us to the fullest extent permitted under the Texas Business Organizations Code and applicable federal laws and regulations, against all reasonable expenses incurred in connection with their service for or on our behalf. Our amended and restated certificate of formation also makes mandatory the indemnification permitted under Section 8.101 of the Texas Business Organizations Code and makes mandatory the payment or reimbursement of reasonable expenses under Section 8.10 of the Texas Business Organizations Code, and extends this mandatory indemnification and mandatory payment or reimbursement of expenses to all former or present officers of the Company and all persons who were serving at the request of the Company as the director, officer, partner, agent or trustee of another foreign or domestic entity. In addition, our amended and restated certificate of formation provides that our directors and officers will not be personally liable for monetary damages to us to the fullest extent permitted by the Texas Business Organizations Code.
At the time of this offering, we will have entered into indemnification agreements with our officers and directors pursuant to which they are indemnified as described above and will be advanced costs and expenses subject to the condition that an indemnitee shall reimburse the indemnitor for all the amounts paid if a final judicial determination is made that the indemnittee is not entitled to be so indemnified under applicable law and regulation.
Transfer Agent and Registrar
The transfer agent and registrar for our common stock is Computershare Trust Company, N.A.
Listing
We have applied to list our common stock on the NASDAQ Global Market under the symbol “ABTX.”
133
Table of Contents
SHARES ELIGIBLE FOR FUTURE SALE
Prior to this offering, there has been no public market for our common stock, and no predictions can be made about the effect, if any, that market sales of shares of our common stock or the availability of such shares for sale will have on the market price prevailing from time to time. Nevertheless, the actual sale of, or the perceived potential for the sale of, our common stock in the public market may have a material adverse effect on the market price for our common stock and could impair our ability to raise capital through future sales of our securities.
Sale of Restricted Shares
Upon completion of this offering, we will have an aggregate of 12,423,025 shares of our common stock outstanding (or 12,813,025 shares of our common stock if the underwriters exercise their option to purchase additional shares in full). Of these shares, the shares of our common stock to be sold in this offering will be freely tradable without restriction or further registration under the Securities Act, except for any shares which may be subsequently acquired by any of our affiliates as that term is defined in Rule 144 under the Securities Act. As of August 3, 2015 the remaining 9,823,025 shares of our common stock outstanding will be restricted securities, as that term is defined in Rule 144, and such shares and any unrestricted shares acquired by any of our affiliates may in the future be sold under the Securities Act to the extent permitted by Rule 144 or any applicable exemption under the Securities Act.
Amended and Restated Equity Plan
Following the completion of this offering, we intend to file a registration statement on Form S-8 under the Securities Act with the SEC to register 1,460,000 shares of our common stock issued or reserved for issuance under our Amended and Restated Equity Plan. The Form S-8 is expected to become effective immediately upon filing. Subject to expiration of any lock-up restrictions as described below and following the completion of any remaining vesting periods and other vesting requirements, shares of our common stock issued under our Amended and Restated Equity Plan and shares of our common stock issuable upon the exercise of options granted or to be granted under our Amended and Restated Equity Plan will be freely tradable without restriction under the Securities Act, unless such shares are held by any of our affiliates.
As of August 3, 2015, time-based options to purchase a total of 947,437 shares of common stock under our Amended and Restated Equity Plan were outstanding, of which options to purchase 460,595 shares were exercisable. Additionally, as of that same date, and 25,180 shares of restricted stock were outstanding. See “Executive Compensation and Other Matters—Amended and Restated Equity Plan” for a description of our Amended and Restated Equity Plan.
Lock-up Agreements
Holders of approximately 57% of the shares of our common stock outstanding prior to this offering, including all of our executive officers and directors and certain other current shareholders have agreed not to sell any shares of our common stock for a period of at least 180 days from the date of this prospectus, subject to certain exceptions. See “Underwriting—Lock-Up Agreements” for a description of the terms, including any exceptions to the provisions of these agreements.
Rule 144
In general, under Rule 144 under the Securities Act as currently in effect, beginning 90 days after the date of this offering, a person who is not one of our affiliates who has beneficially owned shares of our common stock for at least six months may sell shares without restriction, provided the current public information requirements of Rule 144 continue to be satisfied. If a person who is not one of our affiliates has beneficially owned the shares
134
Table of Contents
of common stock proposed to be sold for at least one year, then that person may sell those shares without complying with any of the requirements of Rule 144, including the 90 day period described above. Other than shares of our common stock issued to former shareholders of F&M Bancshares in connection with our acquisition of F&M Bancshares, which we discuss below in “—Shares Issued to Former F&M Bancshares Shareholders,” we estimate that substantially all of the shares of common stock that are not subject to the lockup restrictions described above have been held by non-affiliates for at least one year and therefor may be freely sold by such persons upon the completion of this offering.
Our affiliates who have beneficially owned shares of our common stock for at least six months may, in reliance on Rule 144, sell within any three-month period a number of shares that does not exceed the greater of:
| • | 1.0% of the number of shares of our common stock then outstanding, which will equal approximately 124,230 shares immediately after this offering, assuming the underwriters do not exercise their option to purchase additional shares; and |
| • | the average weekly trading volume of our common stock on the NASDAQ Global Market during the four calendar weeks immediately preceding the filing of a notice on Form 144 with respect to the sale. |
Sales of restricted shares by our affiliates under Rule 144 are also subject to requirements regarding the manner of sale, notice, and the availability of current public information about us. Rule 144 also provides that affiliates relying on Rule 144 to sell shares of our common stock that are not restricted shares must nonetheless comply with the same restrictions applicable to restricted shares, other than the holding period requirement.
Rule 701
In general, under Rule 701 of the Securities Act, most of our employees, consultants or advisors who purchased shares from us in connection with a qualified compensatory stock plan or other written agreement are eligible to resell those shares 90 days after the date of this prospectus in reliance on Rule 144, but without compliance with the holding period or certain other restrictions contained in Rule 144.
Shares Issued to Former F&M Bancshares Shareholders
The 2,338,520 shares of our common stock issued to former shareholders of F&M Bancshares on January 1, 2015 in connection with our acquisition of F&M Bancshares were issued in reliance on the federal exemption from registration found in Section 3(a)(11) of the Securities Act and Rule 147 promulgated thereunder. Pursuant to Section 3(a)(11) of the Securities Act and Rule 147 thereunder, the former shareholders of F&M Bancshares may not resell the shares of our common stock they received in the acquisition prior to October 1, 2015, other than resales to bona fide residents of the State of Texas.
135
Table of Contents
MATERIAL U.S. FEDERAL INCOME TAX CONSIDERATIONS FOR NON-U.S. HOLDERS
The following is a summary of the material U.S. federal income tax considerations relating to the purchase, ownership and disposition of our common stock by “non-U.S. holders” that purchase our common stock pursuant to this offering and hold such common stock as a capital asset (generally, property held for investment). For purposes of this discussion, a “non-U.S. holder” means a beneficial owner of our common stock that, for U.S. federal income tax purposes, is not treated as a partnership and is also not any of the following:
| • | an individual who is a citizen or resident of the United States; |
| • | a corporation (or other entity taxable as a corporation) created or organized in or under the laws of the United States or any state thereof, including the District of Columbia; |
| • | an estate the income of which is subject to U.S. federal income tax regardless of its source; or |
| • | a trust (i) if a court within the United States is able to exercise primary supervision over its administration and one or more U.S. persons have the authority to control all of its substantial decisions, or (ii) that has in effect a valid election under applicable Treasury Regulations to be treated as a U.S. person. |
If an entity or arrangement classified as a partnership for U.S. federal income tax purposes holds our common stock, the tax treatment of any person treated as partner in such partnership for U.S. federal income tax purposes will generally depend upon the status of such person and the activities of that entity. A partnership that holds our common stock and any person treated as a partner thereof should consult their tax advisors regarding the U.S. federal income tax considerations of an investment in our common stock.
This discussion is based on currently existing provisions of the Internal Revenue Code of 1986, as amended (the “Code”), applicable Treasury Regulations promulgated thereunder, judicial decisions, and rulings and pronouncements of the Internal Revenue Service (the “IRS”) all as of the date hereof and all of which are subject to change at any time, possibly on a retroactive basis. There can be no assurance that the IRS will not challenge one or more of the tax considerations described herein, and we have not obtained, nor do we intend to obtain a ruling from the IRS with respect to the U.S. federal income tax considerations to a non-U.S. holder of the purchase, ownership or disposition of our common stock.
This discussion does not purport to be a complete analysis of all the potential tax considerations relevant to non-U.S. holders of the purchase, ownership and/or disposition of our common stock and does not address U.S. federal estate or gift considerations or considerations under the tax laws of any state, local, or non-U.S. jurisdiction. In addition, this discussion does not describe all aspects of U.S. federal income considerations that may be relevant to specific holders in light of their particular circumstances or status and does not address the tax consequences holders subject to special treatment under U.S. federal income tax laws including, without limitation: financial institutions, insurance companies, tax-exempt organizations, controlled foreign corporations, passive foreign investment companies, retirement plans, partnerships (or other pass-through entities) and their partners, dealers in securities, brokers, U.S. expatriates, persons subject to the alternative minimum tax, persons who have acquired our common stock as compensation or otherwise in connection with the performance of services, or persons holding our common stock as part of a straddle, hedge, conversion transaction or other integrated investment.
THIS DISCUSSION IS PROVIDED FOR GENERAL INFORMATION ONLY AND DOES NOT CONSTITUTE LEGAL ADVICE TO ANY PROSPECTIVE PURCHASER OF OUR COMMON STOCK. YOU ARE URGED TO CONSULT YOUR TAX ADVISOR WITH RESPECT TO THE APPLICATION OF THE U.S. FEDERAL INCOME TAX LAWS TO YOUR PARTICULAR SITUATION, AS WELL AS ANY SPECIFIC TAX CONSEQUENCES OF THE PURCHASE, OWNERSHIP AND DISPOSITION OF OUR COMMON STOCK ARISING UNDER THE U.S. FEDERAL ESTATE OR GIFT TAX RULES OR UNDER THE LAWS OF ANY STATE, LOCAL, NON-U.S. OR OTHER TAXING JURISDICTION OR UNDER ANY APPLICABLE TAX TREATY.
136
Table of Contents
Dividends and Distributions on our Common Stock
We do not currently expect to pay dividends (see “Dividend Policy” above). However, in the event that we do make a distribution of cash or other property (other than certain distributions of our stock) in respect of our common stock, such distribution will be treated as a dividend to the extent of our current or accumulated earnings and profits as determined under U.S. federal income tax principles. Amounts not treated as dividends for U.S. federal income tax purposes will constitute a return of capital and first be applied against and reduce a Non-U.S. Holder’s adjusted tax basis in its common stock, but not below zero. Any excess will be treated as capital gain from the disposition of our common stock and will be treated as described below under “Sale, Exchange or Other Taxable Disposition of our Common Stock.”
Subject to the discussion below on effectively connected income, any dividends paid to non-U.S. holders generally will be subject to U.S. federal withholding tax at a rate of 30% of the gross amount of the dividend or such lower rate specified by an applicable income tax treaty. In order to receive a reduced treaty rate, the non-U.S. holder must provide to the applicable withholding agent an IRS Form W-8BEN or Form W-8BEN-E (or other applicable form) including a U.S. taxpayer identification number and certifying qualification for the reduced rate. A Non-U.S. Holder that does not timely furnish the required documentation, but that qualifies for a reduced treaty rate, may obtain a refund of any excess amounts withheld by timely filing an appropriate claim for refund with the IRS.
Dividends received by a non-U.S. holder that are effectively connected with such non-U.S. holder’s conduct of a U.S. trade or business (and, if required by an applicable income tax treaty, that are attributable to a permanent establishment or a fixed base maintained by such non-U.S. holder in the United States) are exempt from U.S. federal withholding tax described above. In order to obtain this exemption, the non-U.S. holder must provide to the applicable withholding agent an IRS Form W-8ECI (or other applicable form) properly certifying such exemption. Such effectively connected dividends, although not subject to withholding tax, generally are taxed at the same graduated rates applicable to U.S. persons, net of certain deductions and credits.
In addition, dividends received by a non-U.S. holder that is treated as a corporation for U.S. federal income tax purposes and that are effectively connected with such holder’s conduct of a U.S. trade or business may also be subject to a branch profits tax at a rate of 30% or such lower rate as may be specified by an applicable income tax treaty.
Sale, Exchange or Other Taxable Disposition of our Common Stock
Subject to the discussion below regarding backup withholding and FATCA, a non-U.S. holder generally will not be subject to U.S. federal income or withholding tax on any gain realized upon the sale, exchange or other taxable disposition of our common stock unless:
| • | the gain is effectively connected with a trade or business of the non-U.S. holder within the United States (and, if required by an applicable income tax treaty, the gain is attributable to a U.S. permanent establishment or a fixed base of such non-U.S. holder); |
| • | the non-U.S. holder is an individual who is present in the United States for a period or periods aggregating 183 days or more during the calendar year in which the sale or disposition occurs and certain other conditions are met; or |
| • | we are or have been a “United States real property holding corporation” for U.S. federal income tax purposes at any time during the shorter of the five-year period ending on the date of the disposition and the period that the non-U.S. holder held our common stock and either (a) our common stock has ceased to be treated as traded on an established securities market prior to the beginning of the calendar year in which the disposition occurs, or (b) the non-U.S. holder owns (actually or constructively) more than five percent of our common stock at some time during the shorter of the five-year period ending on the date of the disposition and the period that the non-U.S. holder held our common stock. |
137
Table of Contents
Although there can be no assurances, we believe that we are not currently, and do not anticipate becoming, a United States real property holding corporation. Furthermore, no assurance can be provided that our common stock will be treated as regularly traded on an established securities market for purposes of the rules described above.
A non-U.S. holder described in the first bullet above will be required to pay tax at regular graduated U.S. federal income tax rates on the net gain derived from the sale in the same manner as if such non-U.S. holder were a U.S. person, and a corporate non-U.S. holder described in the first bullet above also may be subject to the branch profits tax at a 30% rate, or such lower rate as may be specified by an applicable income tax treaty. An individual non-U.S. holder described in the second bullet above will be required to pay a flat 30% tax on the gain derived from the sale, which may be offset by U.S.-source capital losses for the year. Any applicable income tax or other treaty may provide for different rules.
Information Reporting and Backup Withholding
Information returns will be filed with the IRS in connection with payments of dividends on our common stock. Unless the non-U.S. holder complies with certification procedures to establish that it is not a U.S. person, information returns may be filed with the IRS in connection with the proceeds from a sale or other disposition of our common stock and the non-U.S. holder may be subject to U.S. backup withholding on dividend payments on our common stock or on the proceeds from a sale or other disposition of our common stock. The amount of any backup withholding from a payment to a non-U.S. holder will be allowed as a credit against such holder’s U.S. federal income tax liability and may entitle such holder to a refund, provided that the required information is timely furnished to the IRS.
Foreign Account Tax Compliance Act
Legislation enacted in 2010 (commonly known as “FATCA”) and subsequent administrative guidance generally imposes withholding at a rate of 30% on certain payments to certain foreign entities (including financial intermediaries) of dividends on and, after December 31, 2016, the gross proceeds of dispositions of U.S. common stock, unless various U.S. information reporting and due diligence requirements (generally relating to ownership by U.S. persons of interests in or accounts with those entities) have been satisfied. An intergovernmental agreement between the United States and the foreign entity’s jurisdiction may modify these requirements. Non-U.S. holders should consult their tax advisors regarding the possible implications of FATCA on their investment in our common stock.
Federal Estate Tax
The estates of nonresident alien individuals generally are subject to U.S. federal estate tax on property with a U.S. situs. Because we are a U.S. corporation, our common stock will be U.S. situs property and therefore will be includible in the U.S. taxable estate of a nonresident alien decedent who owns or possesses certain powers or interests in our common stock (including through certain trusts), unless an applicable estate tax treaty provides otherwise.
138
Table of Contents
We are offering the shares of our common stock described in this prospectus through a number of underwriters for whom Robert W. Baird & Co. Incorporated and Stephens Inc. are acting as representatives of the several underwriters named below. We and the underwriters will enter into an underwriting agreement with respect to the common stock being offered. Subject to the terms and conditions contained in the underwriting agreement, the underwriters have agreed, severally and not jointly, to purchase, at the initial public offering price less the underwriting discounts and commissions set forth on the cover page of this prospectus, the respective number of shares of our common stock set forth opposite their respective names below:
| Name |
Numbers of Shares | |||
| Robert W. Baird & Co. Incorporated |
||||
| Stephens Inc. |
||||
| Keefe, Bruyette & Woods, Inc. |
||||
| Sandler O’Neill & Partners, L.P. |
||||
|
|
|
|||
| Total |
2,600,000 | |||
|
|
|
|||
If an underwriter defaults, the underwriting agreement provides that the purchase commitments of the non-defaulting underwriters may be increased or this offering may be terminated.
Discounts, Commissions and Expenses
The underwriters propose to offer shares of our common stock directly to the public at the initial public offering price set forth on the cover of this prospectus and to dealers at the initial public offering price less a concession not in excess of $ per share. The underwriters may allow, and the dealers may re-allow, a concession not in excess of $ per share on sales to other brokers and dealers. After the public offering of our common stock, the underwriters may change the offering price, concessions and other selling terms.
The following table shows the per share and total underwriting discounts and commissions that we will pay to the underwriters and the proceeds we will receive before expenses. These amounts are shown assuming both no exercise and full exercise of the underwriters’ purchase option.
| Per Share |
No Exercise |
Full Exercise |
||||||||||
| Initial public offering price |
$ | $ | $ | |||||||||
| Underwriting discounts and commissions to be paid by us |
||||||||||||
| Proceeds to us, before expenses |
||||||||||||
We estimate that the total expenses of this offering, exclusive of the underwriting discounts and commissions, will be approximately $ , which are payable by us. The underwriters will be reimbursed for certain expenses attributable to filings with the Financial Industry Regulatory Authority, or FINRA, including related legal fees estimated at $7,500, and for the registration or qualification of the common stock under blue sky laws, in an amount up to $10,000.
Purchase Option
We have granted the underwriters the option to purchase up to an additional 390,000 shares of our common stock from us at the initial public offering price, less the underwriting discounts and commissions set forth on the cover page of this prospectus, to cover sales of shares by the underwriters that exceed the number of shares specified in the table above. If any shares are purchased with this option, the underwriters will purchase shares in approximately the same proportion as shown in the table above. If any of the additional shares of common stock are purchased, the underwriters will offer the additional shares on the same terms as those on which the other shares are being offered. The underwriters have 30 days from the date of this prospectus to exercise this option. We will be obligated to sell these shares of common stock to the underwriters to the extent the purchase option is
139
Table of Contents
exercised. The underwriters are not obligated to take or pay for the shares of our common stock covered by the underwriters’ purchase option described below, unless and until that option is exercised.
Lock-Up Agreements
We, our directors and officers, and certain other current shareholders have entered into lock-up agreements with the underwriters. Under these agreements, we and each of these persons may not, without the prior written approval of the representatives, subject to limited exceptions,
| • | offer, pledge, sell, contract to sell, sell any option or contract to purchase, purchase any option or contract to sell, grant any option, right or warrant for the sale of, or otherwise dispose of or transfer any of our common stock or any securities convertible into or exchangeable or exercisable for our common stock, whether now owned or hereafter acquired or with respect to which such person has or hereafter acquires the power of disposition, or file any registration statement under the Securities Act, with respect to any of the foregoing; or |
| • | enter into any swap or any other agreement or any transaction that transfers, in whole or in part, directly or indirectly, the economic consequence of ownership of our common stock whether any such swap or transaction is to be settled by delivery of our common stock or other securities, in cash or otherwise. |
These restrictions will be in effect for a period of 180 days after the date of the underwriting agreement. The representatives may, in its sole discretion, waive or release all or some of the securities from these lock-up agreements.
At present, the representatives do not intend to waive or release any of these securities prior to the expiration of the 180-day period. In addition, the restrictions described above will not apply to certain transfers of the locked-up shares, so long as the transferee agrees, among other things, to be bound by the terms of the lock-up agreement. Such transfers permitted under the lock-up agreement include, but are not limited to transfers of shares of our common stock:
| (a) | as a bona fide gift; |
| (b) | by will or estate or intestate succession to a shareholder’s family, or to a trust, the beneficiaries of which are exclusively the shareholder or members of the shareholder’s family, or to a charitable foundation; |
| (c) | if the shareholder is not a natural person, of shares of our common stock or any security convertible into common stock to limited partners, members, subsidiaries, stockholders or affiliates of the shareholder to the extent the shareholder is a partnership, limited liability company or corporation; |
| (d) | involving the exercise of any options to purchase shares of our common stock or the vesting, award, delivery or settlement of shares of our common stock and the receipt by the shareholder from us of shares of common stock thereunder, in each case pursuant to our existing stock option or equity-based compensation plans; or |
| (e) | to us to satisfy any tax withholding obligations upon the exercise or vesting of equity awards under our existing stock option or equity-based compensation plans. |
These restrictions also apply to any shares of our common stock sold in the directed share program described below under “—Directed Share Program.”
Offering Price Determination
Prior to this offering, there has been no public market for our common stock. The initial public offering price will be negotiated between the representatives and us. In determining the initial public offering price of our common stock, the representatives will consider, among other things, prevailing market conditions, our historical performance, estimates of our business potential and our earnings prospects, our book value, an assessment of our management and the consideration of the foregoing factors in relation to market valuation of comparable
140
Table of Contents
companies. We offer no assurances that the initial public offering price will correspond to the price at which our common stock will trade in the public market subsequent to the offering or that an active trading market for our common stock will develop and continue after the offering.
Directed Share Program
At our request, the underwriters have reserved for sale, at the initial public offering price, up to 5% of the common stock being offered by this prospectus, to our directors, officers and employees and other certain persons who have expressed an interest in purchasing our common stock in this offering. We will offer these shares to the extent permitted under applicable laws in the United States through a directed share program. The number of shares available for sale to the general public in the offering will be reduced to the extent these persons purchase the reserved shares. Any reserved shares not so purchased will be offered by the underwriters to the general public on the same terms as the other shares. Any shares sold in the directed share program to directors, officers and employees will be subject to the 180-day lock-up agreements described above.
Listing
We have applied to have our common stock approved for listing on the NASDAQ Global Market under the symbol “ABTX.”
Indemnification
We have agreed to indemnify the underwriters, and persons who control the underwriters, against certain liabilities, including liabilities under the Securities Act, and to contribute to payments that the underwriters may be required to make in respect of these liabilities.
Stabilization
In connection with this offering, the underwriters may, but are not obligated to, engage in stabilizing transactions, overallotment transactions, syndicate covering transactions and penalty bids.
| • | Overallotment transactions involve sales by the underwriters of shares of common stock in excess of the number of shares the underwriters are obligated to purchase. This creates a syndicate short position that may be either a covered short position or a naked short position. In a covered short position, the number of shares of common stock over-allotted by the underwriters is not greater than the number of shares that they may purchase in the purchase option. In a naked short position, the number of shares involved is greater than the number of shares in the purchase option. The underwriters may close out any short position by exercising their purchase option and/or purchasing shares in the open market. |
| • | Syndicate covering transactions involve purchases of common stock in the open market after the distribution has been completed in order to cover syndicate short positions. In determining the source of shares to close out the short position, the underwriters will consider, among other things, the price of shares available for purchase in the open market as compared with the price at which they may purchase shares through exercise of the purchase option. If the underwriters sell more shares than could be covered by exercise of the purchase option and, therefore, have a naked short position, the position can be closed out only by buying shares in the open market. A naked short position is more likely to be created if the underwriters are concerned that after pricing there could be downward pressure on the price of the shares in the open market that could adversely affect investors who purchase in this offering. |
| • | Penalty bids permit the underwriters to reclaim a selling concession from a syndicate member when the common stock originally sold by that syndicate member is purchased in stabilizing or syndicate covering transactions to cover syndicate short positions. |
141
Table of Contents
| • | Stabilizing transactions permit bids to purchase shares of common stock so long as the stabilizing bids do not exceed a specified maximum, and are engaged in for the purpose of preventing or mitigating a decline in the market price of the common stock while this offering is in progress. |
These stabilizing transactions, syndicate covering transactions and penalty bids may have the effect of raising or maintaining the market price of our common stock or preventing or mitigating a decline in the market price of our common stock. As a result, the price of our common stock in the open market may be higher than it would otherwise be in the absence of these transactions. Neither we nor the underwriters make any representation or prediction as to the effect that the transactions described above may have on the price of our common stock. These transactions may be effected on the NASDAQ Global Market, in the over-the-counter market or otherwise and, if commenced, may be discontinued at any time.
Electronic Distribution
A prospectus in electronic format may be made available by e-mail or on the websites or through online services maintained by one or more of the underwriters, or by their affiliates. In those cases, prospective investors may view offering terms online and may be allowed to place orders online. The underwriters may agree with us to allocate a specific number of shares for sale to online brokerage account holders. Any such allocation for online distributions will be made by the underwriters on the same basis as other allocations.
Other than this prospectus in electronic format, information on such websites and any information contained in any other website maintained by the underwriters or any of their affiliates is not part of this prospectus or registration statement of which the prospectus forms a part, has not been approved or endorsed by us or the underwriters in their capacities as underwriters and should not be relied on by investors.
Our Relationship with the Underwriters
Certain of the underwriters and/or their affiliates have engaged, and may in the future engage, in investment banking transactions with us in the ordinary course of their business. They have received, and expect to receive, customary compensation and expense reimbursement for these investment banking transactions.
142
Table of Contents
The validity of the common stock offered hereby will be passed upon for us by Bracewell & Giuliani LLP, Houston, Texas, and for the underwriters by Kilpatrick Townsend & Stockton LLP, Washington, D.C.
The consolidated financial statements of Allegiance Bancshares, Inc. as of and for the year ended December 31, 2014 included in this prospectus and included elsewhere in the registration statement have been so included in reliance on the report of Crowe Horwath LLP, independent registered public accountants, given on the authority of said firm as experts in accounting and auditing.
The consolidated financial statements of Allegiance Bancshares, Inc. as of and for the year ended December 31, 2013 included in this prospectus and included elsewhere in the registration statement have been so included in reliance upon the report of Seidel, Schroeder and Company, independent registered public accountants, upon the authority of said firm as experts in accounting and auditing.
The consolidated financial statements of Farmers & Merchants Bancshares, Inc., as of and for the years ended December 31, 2014 and 2013 included in this prospectus and included elsewhere in the registration statement have been so included in reliance upon the report of Harper & Pearson Company, P.C., independent auditors, upon the authority of said firm as experts in accounting and auditing.
WHERE YOU CAN FIND MORE INFORMATION
We have filed with the SEC a registration statement on Form S-1 under the Securities Act relating to the common stock that includes important business and financial information about us that is not included in or delivered with this prospectus. If we have made references in this prospectus to any contracts, agreements or other documents and also filed any of those contracts, agreements or other documents as exhibits to the registration statement, you should read the relevant exhibit for a more complete understanding of the document or the matter involved.
You may read and copy the registration statement and the related exhibits, and the reports, proxy statements and other information we will file with the SEC, at the SEC’s public reference room maintained by the SEC at Room 1580, 100 F Street N.E., Washington, D.C. 20549. You can also request copies of those documents, upon payment of a duplicating fee, by writing to the SEC. Please call the SEC at 1-800-SEC-0330 for further information on the operation of the public reference room. The SEC also maintains an Internet site that contains reports, proxy and information statements and other information regarding issuers that file with the SEC. The site’s Internet address is www.sec.gov. We also maintain a website at www.allegiancebank.com. Upon completion of this offering, you may access these materials free of charge as soon as reasonably practicable after they are electronically filed with, or furnished to, the SEC. Information contained on our website is not a part of this prospectus and the inclusion of our website address in this prospectus is an inactive textual reference only. You should not rely on any such information in making your decision whether to purchase our securities.
143
Table of Contents
F-1
Table of Contents
CONSOLIDATED BALANCE SHEETS
| June 30, 2015 |
December 31, 2014 |
|||||||
| (Unaudited) | ||||||||
| (Dollars in thousands, except share data) | ||||||||
| ASSETS | ||||||||
| Cash and due from banks |
$ | 85,042 | $ | 57,314 | ||||
| Interest bearing deposits at other institutions |
53,643 | 110,226 | ||||||
|
|
|
|
|
|||||
| Total cash and cash equivalents |
138,685 | 167,540 | ||||||
| Available for sale securities, at fair value |
151,662 | 84,962 | ||||||
| Loans held for sale |
25,629 | — | ||||||
| Loans held for investment |
1,536,028 | 1,002,054 | ||||||
| Less: allowance for loan losses |
(10,312 | ) | (8,246 | ) | ||||
|
|
|
|
|
|||||
| Loans, net |
1,551,345 | 993,808 | ||||||
| Accrued interest receivable |
5,265 | 3,285 | ||||||
| Goodwill |
39,389 | 11,144 | ||||||
| Core deposit intangibles, net |
5,645 | 1,747 | ||||||
| Premises and equipment, net |
18,887 | 10,969 | ||||||
| Other real estate owned |
21 | — | ||||||
| Federal Home Loan Bank stock |
3,588 | 468 | ||||||
| Branch assets held for sale |
1,320 | — | ||||||
| Bank owned life insurance |
20,872 | — | ||||||
| Other assets |
8,477 | 6,085 | ||||||
|
|
|
|
|
|||||
| TOTAL ASSETS |
$ | 1,945,156 | $ | 1,280,008 | ||||
|
|
|
|
|
|||||
| LIABILITIES AND STOCKHOLDERS’ EQUITY | ||||||||
| LIABILITIES: |
||||||||
| Deposits: |
||||||||
| Noninterest-bearing |
$ | 556,502 | $ | 373,795 | ||||
| Interest-bearing |
||||||||
| Demand |
99,633 | 87,806 | ||||||
| Money market and savings |
419,986 | 279,595 | ||||||
| Certificates and other time |
549,203 | 392,488 | ||||||
|
|
|
|
|
|||||
| Total interest-bearing deposits |
1,068,822 | 759,889 | ||||||
|
|
|
|
|
|||||
| Total deposits |
1,625,324 | 1,133,684 | ||||||
| Accrued interest payable |
101 | 43 | ||||||
| Short-term borrowings |
75,000 | — | ||||||
| Subordinated debentures |
9,032 | — | ||||||
| Other borrowed funds |
28,069 | 10,069 | ||||||
| Other liabilities |
5,800 | 4,434 | ||||||
|
|
|
|
|
|||||
| Total liabilities |
1,743,326 | 1,148,230 | ||||||
| COMMITMENTS AND CONTINGENCIES |
— | — | ||||||
| STOCKHOLDERS’ EQUITY: |
||||||||
| Preferred stock, $1 par value; 1,000,000 shares authorized; issued and outstanding; 11,000 shares of Series A and 550 shares of Series B, each with a $1,000 liquidation value |
11,550 | — | ||||||
| Common stock, $1 par value; 40,000,000 shares authorized; 9,824,696 shares issued and 9,822,950 shares outstanding at June 30, 2015 and 7,477,309 shares issued and outstanding at December 31, 2014 |
9,825 | 7,477 | ||||||
| Capital surplus |
154,428 | 104,568 | ||||||
| Retained earnings |
26,152 | 19,184 | ||||||
| Accumulated other comprehensive (loss) income |
(87 | ) | 549 | |||||
| Less: Treasury stock, at cost, 1,746 shares |
(38 | ) | — | |||||
|
|
|
|
|
|||||
| Total stockholders’ equity |
201,830 | 131,778 | ||||||
|
|
|
|
|
|||||
| TOTAL LIABILITIES AND STOCKHOLDERS’ EQUITY |
$ | 1,945,156 | $ | 1,280,008 | ||||
|
|
|
|
|
|||||
See condensed notes to interim consolidated financial statements.
F-2
Table of Contents
CONSOLIDATED STATEMENTS OF INCOME
(Unaudited)
| Six Months Ended June 30, | ||||||||
| 2015 | 2014 | |||||||
| (Dollars in thousands, except per share data) | ||||||||
| INTEREST INCOME: |
||||||||
| Loans, including fees |
$ | 41,385 | $ | 23,698 | ||||
| Securities: |
||||||||
| Taxable |
442 | 721 | ||||||
| Tax-exempt |
718 | 208 | ||||||
| Deposits in other financial institutions |
124 | 173 | ||||||
|
|
|
|
|
|||||
| Total interest income |
42,669 | 24,800 | ||||||
|
|
|
|
|
|||||
| INTEREST EXPENSE: |
||||||||
| Demand, money market and savings deposits |
938 | 616 | ||||||
| Certificates and other time deposits |
2,454 | 2,008 | ||||||
| Short-term borrowings |
2 | — | ||||||
| Subordinated debt |
325 | — | ||||||
| Other borrowed funds |
446 | 75 | ||||||
|
|
|
|
|
|||||
| Total interest expense |
4,165 | 2,699 | ||||||
|
|
|
|
|
|||||
| NET INTEREST INCOME |
38,504 | 22,101 | ||||||
| PROVISION FOR LOAN LOSSES |
2,103 | 900 | ||||||
|
|
|
|
|
|||||
| NET INTEREST INCOME AFTER PROVISION FOR LOAN LOSSES |
36,401 | 21,201 | ||||||
|
|
|
|
|
|||||
| NONINTEREST INCOME: |
||||||||
| Nonsufficient funds fees |
333 | 217 | ||||||
| Service charges on deposit accounts |
351 | 253 | ||||||
| Gains (losses) on sales of other real estate |
(6 | ) | 188 | |||||
| Other |
1,135 | 663 | ||||||
|
|
|
|
|
|||||
| Total noninterest income |
1,813 | 1,321 | ||||||
|
|
|
|
|
|||||
| NONINTEREST EXPENSE: |
||||||||
| Salaries and employee benefits |
17,423 | 9,503 | ||||||
| Net occupancy and equipment |
2,358 | 1,581 | ||||||
| Data processing and software amortization |
1,453 | 833 | ||||||
| Professional fees |
877 | 529 | ||||||
| Regulatory assessments and FDIC insurance |
694 | 422 | ||||||
| Core deposit intangibles amortization |
415 | 148 | ||||||
| Depreciation |
776 | 503 | ||||||
| Communications |
692 | 306 | ||||||
| Advertising |
322 | 278 | ||||||
| Other |
1,998 | 1,166 | ||||||
|
|
|
|
|
|||||
| Total noninterest expense |
27,008 | 15,269 | ||||||
|
|
|
|
|
|||||
| INCOME BEFORE INCOME TAXES |
11,206 | 7,253 | ||||||
| Provision for income taxes |
3,852 | 2,569 | ||||||
|
|
|
|
|
|||||
| NET INCOME |
$ | 7,354 | $ | 4,684 | ||||
|
|
|
|
|
|||||
| Preferred stock dividends |
(386 | ) | — | |||||
|
|
|
|
|
|||||
| NET INCOME ATTRIBUTABLE TO COMMON STOCKHOLDERS |
$ | 6,968 | $ | 4,684 | ||||
|
|
|
|
|
|||||
| EARNINGS PER COMMON SHARE: |
||||||||
| Basic |
$ | 0.71 | $ | 0.67 | ||||
|
|
|
|
|
|||||
| Diluted |
$ | 0.70 | $ | 0.66 | ||||
|
|
|
|
|
|||||
See condensed notes to interim consolidated financial statements.
F-3
Table of Contents
CONSOLIDATED STATEMENTS OF COMPREHENSIVE INCOME
(Unaudited)
| Six Months Ended June 30, |
||||||||
| 2015 | 2014 | |||||||
| (Dollars in thousands) | ||||||||
| Net income |
$ | 7,354 | $ | 4,684 | ||||
| Other comprehensive income (loss), before tax: |
||||||||
| Unrealized gain (loss) on securities: |
||||||||
| Change in unrealized holding gain (loss) on available for sale securities during the period |
(965 | ) | 1,513 | |||||
|
|
|
|
|
|||||
| Total other comprehensive income (loss) |
(965 | ) | 1,513 | |||||
| Deferred tax expense (benefit) related to other comprehensive income (loss) |
329 | (450 | ) | |||||
|
|
|
|
|
|||||
| Other comprehensive income (loss), net of tax |
(636 | ) | 1,063 | |||||
|
|
|
|
|
|||||
| Comprehensive income |
$ | 6,718 | $ | 5,747 | ||||
|
|
|
|
|
|||||
See condensed notes to interim consolidated financial statements.
F-4
Table of Contents
CONSOLIDATED STATEMENTS OF CHANGES IN STOCKHOLDERS’ EQUITY
(Unaudited)
|
Preferred Stock |
Common Stock |
Capital Surplus |
Retained Earnings |
Accumulated Other Comprehensive Income (Loss) |
Treasury Stock |
Total Stockholders’ Equity |
||||||||||||||||||||||||||||||
| Shares | Amount | Shares | Amount | |||||||||||||||||||||||||||||||||
| (In thousands, except share data) | ||||||||||||||||||||||||||||||||||||
| BALANCE AT JANUARY 1, 2014 |
— | $ | — | 6,964,551 | $ | 6,965 | $ | 93,459 | $ | 10,179 | $ | (669 | ) | $ | (198 | ) | $ | 109,736 | ||||||||||||||||||
| Net income |
4,684 | 4,684 | ||||||||||||||||||||||||||||||||||
| Other comprehensive income |
1,063 | 1,063 | ||||||||||||||||||||||||||||||||||
| Common stock issued in connection with the exercise of stock options and restricted stock awards and the Employee Stock Purchase Plan (“ESPP”) |
14,975 | 15 | 172 | 75 | 262 | |||||||||||||||||||||||||||||||
| Stock based compensation expense |
326 | 326 | ||||||||||||||||||||||||||||||||||
|
|
|
|
|
|
|
|
|
|
|
|
|
|
|
|
|
|
|
|||||||||||||||||||
| BALANCE AT JUNE 30, 2014 |
— | — | 6,979,526 | 6,980 | 93,957 | 14,863 | 394 | (123 | ) | 116,071 | ||||||||||||||||||||||||||
|
|
|
|
|
|
|
|
|
|
|
|
|
|
|
|
|
|
|
|||||||||||||||||||
| BALANCE AT JANUARY 1, 2015 |
— | — | 7,477,309 | 7,477 | 104,568 | 19,184 | 549 | — | 131,778 | |||||||||||||||||||||||||||
| Net income |
7,354 | 7,354 | ||||||||||||||||||||||||||||||||||
| Other comprehensive loss |
(636 | ) | (636 | ) | ||||||||||||||||||||||||||||||||
| Common stock issued in connection with the exercise of stock options and restricted stock awards |
3,983 | 4 | 7 | — | 11 | |||||||||||||||||||||||||||||||
| Repurchase of treasury stock |
(51 | ) | (51 | ) | ||||||||||||||||||||||||||||||||
| Issuance of common stock |
4,884 | 5 | 103 | 13 | 121 | |||||||||||||||||||||||||||||||
| Common stock issued in connection with the acquisition of F&M Bancshares, Inc. |
2,338,520 | 2,339 | 49,108 | 51,447 | ||||||||||||||||||||||||||||||||
| Preferred stock issued in connection with the acquisition of F&M Bancshares, Inc. |
11,550 | 11,550 | 11,550 | |||||||||||||||||||||||||||||||||
| Preferred stock dividends |
(386 | ) | (386 | ) | ||||||||||||||||||||||||||||||||
| Stock based compensation expense |
642 | 642 | ||||||||||||||||||||||||||||||||||
|
|
|
|
|
|
|
|
|
|
|
|
|
|
|
|
|
|
|
|||||||||||||||||||
| BALANCE AT JUNE 30, 2015 |
11,550 | $ | 11,550 | 9,824,696 | $ | 9,825 | $ | 154,428 | $ | 26,152 | $ | (87 | ) | $ | (38 | ) | $ | 201,830 | ||||||||||||||||||
|
|
|
|
|
|
|
|
|
|
|
|
|
|
|
|
|
|
|
|||||||||||||||||||
See condensed notes to interim consolidated financial statements.
F-5
Table of Contents
CONSOLIDATED STATEMENTS OF CASH FLOWS
| Six Months Ended June 30, |
||||||||
| 2015 | 2014 | |||||||
| (Unaudited) | ||||||||
| (Dollars in thousands) | ||||||||
| CASH FLOWS FROM OPERATING ACTIVITIES: |
||||||||
| Net income |
$ | 7,354 | $ | 4,684 | ||||
| Adjustments to reconcile net income to net cash provided by operating activities: |
||||||||
| Depreciation and core deposit intangibles amortization |
1,190 | 651 | ||||||
| Provision for credit losses |
2,103 | 900 | ||||||
| Net amortization of premium on investments |
455 | 18 | ||||||
| Net (accretion) amortization of (discount) premium on loans |
(2,350 | ) | 57 | |||||
| Net amortization of premium on subordinated debentures |
161 | — | ||||||
| Net (gain) loss on sale or write down of premises, equipment and other real estate |
6 | (188 | ) | |||||
| Stock based compensation expense |
642 | 326 | ||||||
| (Increase) decrease in accrued interest receivable and other assets |
(2,950 | ) | 2,156 | |||||
| Decrease in accrued interest payable and other liabilities |
(894 | ) | (1,685 | ) | ||||
|
|
|
|
|
|||||
| Net cash provided by operating activities |
5,717 | 6,919 | ||||||
|
|
|
|
|
|||||
| CASH FLOWS FROM INVESTING ACTIVITIES: |
||||||||
| Proceeds from maturities and principal paydowns of available for sale securities |
474,189 | 624,843 | ||||||
| Proceeds from sales of available for sale securities |
14,748 | — | ||||||
| Purchase of available for sale securities |
(542,335 | ) | (626,614 | ) | ||||
| Net increase in total loans |
(152,652 | ) | (96,590 | ) | ||||
| Purchase of bank premises and equipment |
(1,531 | ) | (1,689 | ) | ||||
| Proceeds from sale of bank premises, equipment and other real estate |
— | 520 | ||||||
| Purchase of bank owned life insurance |
(10,000 | ) | — | |||||
| Net cash and cash equivalents acquired in the purchase of F&M Bancshares, Inc. |
106,486 | — | ||||||
|
|
|
|
|
|||||
| Net cash used in investing activities |
(111,095 | ) | (99,530 | ) | ||||
|
|
|
|
|
|||||
| CASH FLOWS FROM FINANCING ACTIVITIES: |
||||||||
| Net (decrease) increase in noninterest-bearing deposits |
(2,822 | ) | 16,237 | |||||
| Net increase in interest-bearing deposits |
4,650 | 14,986 | ||||||
| Paydowns of long-term borrowings |
(18,000 | ) | — | |||||
| Proceeds from long-term borrowings |
18,000 | — | ||||||
| Proceeds from short-term borrowings |
75,000 | |||||||
| Preferred stock dividends |
(386 | ) | — | |||||
| Proceeds from stock option exercises, restricted stock awards and the ESPP |
132 | 262 | ||||||
| Repurchase of treasury stock |
(51 | ) | — | |||||
|
|
|
|
|
|||||
| Net cash provided by financing activities |
76,523 | 31,485 | ||||||
|
|
|
|
|
|||||
| NET CHANGE IN CASH AND CASH EQUIVALENTS |
(28,855 | ) | (61,126 | ) | ||||
| CASH AND CASH EQUIVALENTS, BEGINNING OF PERIOD |
167,540 | 213,076 | ||||||
|
|
|
|
|
|||||
| CASH AND CASH EQUIVALENTS, END OF PERIOD |
$ | 138,685 | $ | 151,950 | ||||
|
|
|
|
|
|||||
| NONCASH ACTIVITIES: |
||||||||
| Acquired loans transferred to loans held for sale |
$ | 33,409 | $ | — | ||||
| Acquired premises and equipment and accrued interest receivable transferred to branch assets held for sale |
1,662 | — | ||||||
| SUPPLEMENTAL INFORMATION: |
||||||||
| Income taxes paid |
$ | 3,400 | $ | 2,300 | ||||
| Interest paid |
3,647 | 2,342 | ||||||
| See Note 2 regarding non-cash transactions included in the F&M Bancshares, Inc. acquisition |
||||||||
See condensed notes to interim consolidated financial statements.
F-6
Table of Contents
CONDENSED NOTES TO INTERIM CONSOLIDATED FINANCIAL STATEMENTS
(Unaudited)
1. NATURE OF OPERATIONS AND SUMMARY OF SIGNIFICANT ACCOUNTING AND REPORTING POLICIES
Nature of Operations—Allegiance Bancshares, Inc. (“Allegiance”) and its subsidiary, Allegiance Bank (the “Bank”, and together with Allegiance, collectively referred to as the “Company”) provide commercial and retail loans and commercial banking services. The Company derives substantially all of its revenues and income from the operation of the Bank. On August 10, 2015, the Texas Department of Banking approved the Company’s request to change the name of the bank to Allegiance Bank.
Basis of Presentation—The accompanying unaudited condensed consolidated financial statements of the Company have been prepared in accordance with United States Generally Accepted Accounting Principles (GAAP) for interim financial information and in accordance with guidance provided by the Securities and Exchange Commission. Accordingly, the condensed financial statements do not include all of the information and footnotes required by GAAP for complete financial statements. The preparation of consolidated financial statements in conformity with GAAP requires management to make estimates and assumptions that affect the amounts reported in the consolidated financial statements and accompanying notes. Actual results could differ from those estimates.
In the opinion of management, the accompanying unaudited condensed consolidated financial statements reflect all adjustments considered necessary for a fair presentation of the financial position, results of operations and cash flows of the Company on a consolidated basis, and all such adjustments are of a normal recurring nature. Transactions with the subsidiary have been eliminated. The condensed consolidated financial statements should be read in conjunction with the audited consolidated financial statements and footnotes thereto included in the Company’s S-1 for the fiscal year ended December 31, 2014. Operating results for the six months ended June 30, 2015 are not necessarily indicative of the results that may be expected for the year ending December 31, 2015. Furthermore, the acquisition of F&M Bancshares, Inc. during the first quarter of 2015 may impact the comparability of year to date 2015 versus year to date 2014 comparable information.
Significant Accounting and Reporting Policies:
The Company’s significant accounting and reporting policies can be found in Note 1 of the Company’s annual financial statements included elsewhere in this Prospectus. The following accounting and reporting policies were adopted during the first quarter of 2015 as part of the F&M Bancshares, Inc. transaction:
Bank Owned Life Insurance-During the first quarter of 2015, the Company purchased bank owned life insurance policies on certain key executives and in conjunction with the acquisition of F&M Bancshares, the Company acquired life insurance policies. Bank owned life insurance is recorded at the amount that can be realized under the insurance contract at the balance sheet date, which is the cash surrender value, which is the most reasonable estimate of fair value, adjusted for other charges or other amounts due that are probable at settlement.
Loans held for Sale-Loans held for sale are carried at lower of aggregate cost or fair value. During the first quarter of 2015, the Company purchased F&M Bancshares. At June 30, 2015, loans held for sale consists of loans at two former F&M Bancshares branches in Central Texas that are for sale.
F-7
Table of Contents
ALLEGIANCE BANCSHARES, INC.
CONDENSED NOTES TO INTERIM CONSOLIDATED FINANCIAL STATEMENTS
(Unaudited)
1. NATURE OF OPERATIONS AND SUMMARY OF SIGNIFICANT ACCOUNTING AND REPORTING POLICIES (Continued)
New Accounting Standards
Adoption of New Accounting Standards
On January 1, 2015, the Company adopted Accounting Standards Update (ASU) 2014-04 “Receivables—Troubled Debt Restructurings by Creditors (Subtopic 310-40)—Reclassification of Residential Real Estate Collateralized Consumer Mortgage Loans upon Foreclosure.” ASU 2014-04 intends to reduce diversity by clarifying an in substance repossession or foreclosure occurs when a creditor is considered to have received physical possession of residential real estate property collateralizing a consumer mortgage loan such that the loan receivable should be derecognized and the real estate property recognized. The adoption of this ASU did not have a material impact on the Company’s financial statements.
Newly Issued But Not Yet Effective Accounting Standards
ASU 2014-09 “Revenue from Contract with Customers (Topic 606).” ASU 2014-09 supersedes the revenue recognition requirements in Revenue Recognition (Topic 605), and most industry-specific guidance throughout the Industry Topics of the Codification. The core principle of ASU 2014-09 is that an entity should recognize revenue to depict the transfer of promised goods or services to customers in an amount that reflects the consideration to which the entity expects to be entitled in exchange for those goods or services. ASU 2014-09 is currently effective for the Company beginning on January 1, 2017 with retrospective application to each prior reporting period presented. The Company is still evaluating the potential impact on the Company’s financial statements.
2. ACQUISITIONS
Acquisition of F&M Bancshares—On January 1, 2015, the Company completed the acquisition of F&M Bancshares, Inc. (“F&M”) and its wholly-owned subsidiary Enterprise Bank (“Enterprise”) headquartered in Houston, Texas. Enterprise operated 9 banking locations, 7 in Houston, Texas and 2 in Central Texas, 1 in Rosebud, Texas and 1 in Mart, Texas. The 2 Central Texas locations and their related assets have been classified within loans held for sale and branch assets held for sale as of March 31, 2015. During the first quarter of 2015, the Company consolidated 2 of the 7 acquired Houston area locations due to the close proximity of these locations to its existing banking locations. The Company acquired F&M to further expand its Houston, Texas area markets.
Pursuant to the merger agreement, the Company issued 2,338,520 shares of Company common stock for all outstanding shares of F&M capital stock and paid $642 thousand in cash for any fractional and out of state shares held by F&M shareholders. The Company recognized initial goodwill of $28.2 million which is calculated as the excess of both the consideration exchanged and liabilities assumed as compared to the fair value of identifiable assets acquired, none of which is expected to be deductible for tax purposes. F&M’s results of operations were included in the Company’s results beginning January 1, 2015. For the six months ended June 30, 2015, net interest income associated with F&M was $9.1 million. The Company does not track separately the noninterest income and noninterest expense of the F&M branches.
(Continued)
F-8
Table of Contents
ALLEGIANCE BANCSHARES, INC.
CONDENSED NOTES TO INTERIM CONSOLIDATED FINANCIAL STATEMENTS
(Unaudited)
2. ACQUISITIONS (Continued)
The period during which the initial fair value adjustments may be revised is generally referred to as the measurement period. During the measurement period, the Company also shall recognize additional assets or liabilities if new information is obtained about facts and circumstances that existed as of the acquisition date that, if known, would have resulted in the recognition of those assets and liabilities as of that date. The measurement period ends as soon as the Company receives the information it was seeking about facts and circumstances that
existed as of the acquisition date or learns that more information is not obtainable. However, the measurement period shall not exceed one year from the acquisition date. The Company is finalizing its estimates related to taxes for the F&M Bancshares acquisition.
The following table summarizes the allocation of the purchase price to assets and liabilities acquired on January 1, 2015 (dollars in thousands):
| Fair value of consideration paid: |
||||
| Common shares issued (2,338,520 shares) |
$ | 51,447 | ||
| Preferred shares issued (11,550 shares) |
11,550 | |||
| Cash consideration |
642 | |||
|
|
|
|||
| Total consideration paid |
$ | 63,639 | ||
|
|
|
|||
| Fair value of assets acquired: |
||||
| Cash and cash equivalents |
$ | 107,128 | ||
| Investment Securities |
14,722 | |||
| Loans, net |
404,637 | |||
| Premises and equipment |
7,699 | |||
| Core deposit intangibles |
4,313 | |||
| Other assets |
15,896 | |||
|
|
|
|||
| Total assets acquired |
$ | 554,395 | ||
|
|
|
|||
| Fair value of liabilities assumed: |
||||
| Deposits |
$ | 489,556 | ||
| Subordinated debt |
8,871 | |||
| Other borrowed funds |
18,000 | |||
| Other liabilities |
2,574 | |||
|
|
|
|||
| Total liabilities assumed |
519,001 | |||
|
|
|
|||
| Fair value of net assets acquired |
$ | 35,394 | ||
|
|
|
|||
| Goodwill resulting from acquisition |
$ | 28,245 | ||
|
|
|
Subsequent to the acquisition, the Company paid off the $18.0 million of borrowed funds from F&M shareholders by drawing on its borrowing with another financial institution. Additionally, the securities acquired from F&M were sold subsequent to the acquisition with no income statement impact.
(Continued)
F-9
Table of Contents
ALLEGIANCE BANCSHARES, INC.
CONDENSED NOTES TO INTERIM CONSOLIDATED FINANCIAL STATEMENTS
(Unaudited)
2. ACQUISITIONS (Continued)
The fair value of net assets acquired includes fair value adjustments to certain acquired loans that were not considered impaired as of the acquisition date. The fair value adjustments were determined using discounted contractual cash flows. The following presents details of all loans acquired as of January 1, 2015:
| Contractual Balance |
Fair Value | Discount | ||||||||||
| Commercial and industrial |
$ | 96,891 | $ | 95,256 | $ | (1,635 | ) | |||||
| Real estate: |
||||||||||||
| Commercial real estate (including multi-family residential) |
225,191 | 222,082 | (3,109 | ) | ||||||||
| Commercial real estate construction and land development |
40,787 | 40,094 | (693 | ) | ||||||||
| 1-4 family residential (including home equity) |
35,897 | 35,488 | (409 | ) | ||||||||
| Residential construction |
6,467 | 6,395 | (72 | ) | ||||||||
| Consumer and other |
5,421 | 5,322 | (99 | ) | ||||||||
|
|
|
|
|
|
|
|||||||
| Total loans |
$ | 410,654 | $ | 404,637 | $ | (6,017 | ) | |||||
|
|
|
|
|
|
|
|||||||
Included in the table above are $3.9 million of purchase credit impaired loans that the Company has classified as nonaccrual.
The following table presents pro forma information as if the acquisition had occurred at the beginning of 2014. The pro forma financial information is not necessarily indicative of the results of operations that would have occurred had the transactions been effected on the assumed dates.
| For the Six Months Ending June 30, |
||||||||
| 2015 | 2014 | |||||||
| Net interest income |
$ | 36,668 | $ | 34,887 | ||||
| Net income attributable to common stockholders |
4,977 | 7,920 | ||||||
| Basic earnings per common share |
0.51 | 0.85 | ||||||
| Diluted earnings per common share |
0.50 | 0.84 | ||||||
The Company incurred approximately $939 thousand of pre-tax merger related expenses during the six months ended June 30, 2015. The merger expenses are reflected on the Company’s income statement for the applicable period and are reported primarily in the categories of salaries and benefits and professional fees.
As of June 30, 2015, the Company held the two Central Texas locations and their related assets for sale. The assets held for sale of these locations include loans, the related accrued interest receivable on those loans and premises and equipment. The loans are presented as loans held for sale on the balance sheet. The branch assets held for sale reported on the balance sheet include accrued interest receivable and premises and equipment for these two respective locations.
(Continued)
F-10
Table of Contents
ALLEGIANCE BANCSHARES, INC.
CONDENSED NOTES TO INTERIM CONSOLIDATED FINANCIAL STATEMENTS
(Unaudited)
3. GOODWILL AND CORE DEPOSIT INTANGIBLES
Changes in the carrying amount of the Company’s goodwill and core deposit intangibles were as follows:
| Goodwill | Core Deposit Intangibles |
|||||||
| (Dollars in thousands) | ||||||||
| Balance as of January 1, 2014 |
$ | 10,999 | $ | 2,045 | ||||
| Measurement period adjustment |
145 | — | ||||||
| Amortization |
— | (298 | ) | |||||
|
|
|
|
|
|||||
| Balance as of December 31, 2014 |
11,144 | 1,747 | ||||||
| Acquisition of F&M Bancshares, Inc. |
28,245 | 4,313 | ||||||
| Amortization |
— | (415 | ) | |||||
|
|
|
|
|
|||||
| Balance as of June 30, 2015 |
$ | 39,389 | $ | 5,645 | ||||
|
|
|
|
|
|||||
Goodwill is recorded on the acquisition date of an entity. During the measurement period, the Company may record subsequent adjustments to goodwill for provisional amounts recorded at the acquisition date.
4. SECURITIES
The amortized cost and fair value of investment securities were as follows (dollars in thousands):
| June 30, 2015 | ||||||||||||||||
| Amortized Cost |
Gross Unrealized Gains |
Gross Unrealized Losses |
Fair Value | |||||||||||||
| (Dollars in thousands) | ||||||||||||||||
| Available for Sale |
||||||||||||||||
| U.S. Government and agency securities |
$ | 8,641 | $ | 351 | $ | — | $ | 8,992 | ||||||||
| Municipal securities |
108,009 | 316 | (928 | ) | 107,397 | |||||||||||
| Agency mortgage-backed pass-through securities |
32,771 | 467 | (262 | ) | 32,976 | |||||||||||
| Agency collateralized mortgage obligations |
2,374 | 19 | (96 | ) | 2,297 | |||||||||||
|
|
|
|
|
|
|
|
|
|||||||||
| Total |
$ | 151,795 | $ | 1,153 | $ | (1,286 | ) | $ | 151,662 | |||||||
|
|
|
|
|
|
|
|
|
|||||||||
| December 31, 2014 | ||||||||||||||||
| Amortized Cost |
Gross Unrealized Gains |
Gross Unrealized Losses |
Fair Value |
|||||||||||||
| (Dollars in thousands) | ||||||||||||||||
| Available for Sale |
||||||||||||||||
| U.S. Government and agency securities |
$ | 14,080 | $ | 442 | $ | (45 | ) | $ | 14,477 | |||||||
| Municipal securities |
35,272 | 283 | (74 | ) | 35,481 | |||||||||||
| Agency mortgage-backed pass-through securities |
32,191 | 472 | (188 | ) | 32,475 | |||||||||||
| Agency collateralized mortgage obligations |
2,587 | 21 | (79 | ) | 2,529 | |||||||||||
|
|
|
|
|
|
|
|
|
|||||||||
| Total |
$ | 84,130 | $ | 1,218 | $ | (386 | ) | $ | 84,962 | |||||||
|
|
|
|
|
|
|
|
|
|||||||||
(Continued)
F-11
Table of Contents
ALLEGIANCE BANCSHARES, INC.
CONDENSED NOTES TO INTERIM CONSOLIDATED FINANCIAL STATEMENTS
(Unaudited)
4. SECURITIES (Continued)
Securities with unrealized losses segregated by length of time such securities have been in a continuous loss position are as follows:
| June 30, 2015 | ||||||||||||||||||||||||
| Less than 12 Months | More than 12 Months | Total | ||||||||||||||||||||||
| Estimated Fair Value |
Unrealized Losses |
Estimated Fair Value |
Unrealized Losses |
Estimated Fair Value |
Unrealized Losses |
|||||||||||||||||||
| (Dollars in thousands) | ||||||||||||||||||||||||
| Available for Sale |
||||||||||||||||||||||||
| U.S. Government and agency securities |
$ | — | $ | — | $ | — | $ | — | $ | — | $ | — | ||||||||||||
| Municipal securities |
50,414 | (925 | ) | 225 | (3 | ) | 50,639 | (928 | ) | |||||||||||||||
| Agency mortgage-backed pass-through securities |
9,491 | (73 | ) | 7,255 | (189 | ) | 16,746 | (262 | ) | |||||||||||||||
| Agency collateralized mortgage obligations |
— | — | 1,476 | (96 | ) | 1,476 | (96 | ) | ||||||||||||||||
|
|
|
|
|
|
|
|
|
|
|
|
|
|||||||||||||
| Total |
$ | 59,905 | $ | (998 | ) | $ | 8,956 | $ | (288 | ) | $ | 68,861 | $ | (1,286 | ) | |||||||||
|
|
|
|
|
|
|
|
|
|
|
|
|
|||||||||||||
| December 31, 2014 | ||||||||||||||||||||||||
| Less than 12 Months | More than 12 Months | Total | ||||||||||||||||||||||
| Estimated Fair Value |
Unrealized Losses |
Estimated Fair Value |
Unrealized Losses |
Estimated Fair Value |
Unrealized Losses |
|||||||||||||||||||
| (Dollars in thousands) | ||||||||||||||||||||||||
| Available for Sale |
||||||||||||||||||||||||
| U.S. Government and agency securities |
$ | 2,842 | $ | (3 | ) | $ | 1,748 | $ | (42 | ) | $ | 4,590 | $ | (45 | ) | |||||||||
| Municipal securities |
14,102 | (74 | ) | — | — | 14,102 | (74 | ) | ||||||||||||||||
| Agency mortgage-backed pass-through securities |
498 | (1 | ) | 14,058 | (187 | ) | 14,556 | (188 | ) | |||||||||||||||
| Agency collateralized mortgage obligations |
— | — | 1,607 | (79 | ) | 1,607 | (79 | ) | ||||||||||||||||
|
|
|
|
|
|
|
|
|
|
|
|
|
|||||||||||||
| Total |
$ | 17,442 | $ | (78 | ) | $ | 17,413 | $ | (308 | ) | $ | 34,855 | $ | (386 | ) | |||||||||
|
|
|
|
|
|
|
|
|
|
|
|
|
|||||||||||||
As of June 30, 2015, management does not intend to sell any debt securities classified as available for sale in the table above and believes that the Company more likely than not will not be required to sell any of these debt securities before their anticipated recovery at which time the Company will receive full value for the securities. The fair value is expected to recover as the securities approach their maturity date or repricing date or if market yields for such investments decline. Management does not believe any of the securities are impaired due to reasons of credit quality. Accordingly, as of June 30, 2015, management believes the unrealized losses in the previous table are temporary and no other than temporary impairment loss has been realized in the Company’s consolidated statements of income.
(Continued)
F-12
Table of Contents
ALLEGIANCE BANCSHARES, INC.
CONDENSED NOTES TO INTERIM CONSOLIDATED FINANCIAL STATEMENTS
(Unaudited)
4. SECURITIES (Continued)
The amortized cost and fair value of investment securities at June 30, 2015, by contractual maturity, are shown below. Expected maturities may differ from contractual maturities if borrowers have the right to call or prepay obligations at any time with or without call or prepayment penalties.
| Amortized Cost |
Fair Value |
|||||||
| (Dollars in thousands) | ||||||||
| Due in one year or less |
$ | 7,770 | $ | 7,781 | ||||
| Due after one year through five years |
14,665 | 14,728 | ||||||
| Due after five years through ten years |
28,529 | 28,724 | ||||||
| Due after ten years |
65,686 | 65,156 | ||||||
|
|
|
|
|
|||||
| Subtotal |
116,650 | 116,389 | ||||||
| Agency mortgage-backed pass through securities and agency collateralized mortgage obligations |
35,145 | 35,273 | ||||||
|
|
|
|
|
|||||
| Total |
$ | 151,795 | $ | 151,662 | ||||
|
|
|
|
|
|||||
During the first quarter of 2015, the Company sold all securities acquired in the F&M Bancshares transaction resulting in gross proceeds of approximately $15.0 million. No gains or losses were recognized. No securities were sold during the six months ended June 30, 2014.
5. LOANS AND ALLOWANCE FOR LOAN LOSSES
The loan portfolio balances, net of unearned income and fees, consist of various types of loans primarily all made to borrowers located within Texas and are classified by major type as follows:
| June 30, | December 31, | |||||||
| 2015 | 2014 | |||||||
| (Dollars in thousands) | ||||||||
| Loans held for sale(1) |
$ | 25,629 | $ | — | ||||
|
|
|
|
|
|||||
| Commercial and industrial |
427,958 | 270,363 | ||||||
| Real estate: |
||||||||
| Commercial real estate (including multi-family residential) |
678,979 | 429,986 | ||||||
| Commercial real estate construction and land development |
140,437 | 85,484 | ||||||
| 1-4 family residential (including home equity) |
178,635 | 135,127 | ||||||
| Residential construction |
94,167 | 72,402 | ||||||
| Consumer and other |
15,852 | 8,692 | ||||||
|
|
|
|
|
|||||
| Total loans held for investment |
1,536,028 | 1,002,054 | ||||||
|
|
|
|
|
|||||
| Total loans |
1,561,657 | 1,002,054 | ||||||
|
|
|
|
|
|||||
| Allowance for loan losses |
(10,312 | ) | (8,246 | ) | ||||
|
|
|
|
|
|||||
| Loans, net |
$ | 1,551,345 | $ | 993,808 | ||||
|
|
|
|
|
|||||
(Continued)
F-13
Table of Contents
ALLEGIANCE BANCSHARES, INC.
CONDENSED NOTES TO INTERIM CONSOLIDATED FINANCIAL STATEMENTS
(Unaudited)
5. LOANS AND ALLOWANCE FOR LOAN LOSSES (Continued)
| (1) | Consists of loans at two former F&M Bancshares locations acquired on January 1, 2015. The Company intends to sell these former F&M branches and their related assets located in Central Texas if it can agree on terms satisfactory to the Company. As of June 30, 2015, loans held for sale consists of $9.2 million of commercial and industrial loans, $12.9 million of commercial real estate (including multi-family residential) loans, $2.7 million of 1-4 family residential (including home equity) loans and $838,000 of consumer and other loans. Loans held for sale are carried at lower of aggregate cost or fair value. |
Nonaccrual and Past Due Loans
An aging analysis of the recorded investment in past due loans, segregated by class of loans, is as follows:
| June 30, 2015 | ||||||||||||||||||||||||
| Loans Past Due and Still Accruing | ||||||||||||||||||||||||
| 30-89 Days(2) | 90 or More Days |
Total Past Due Loans |
Nonaccrual Loans(3) |
Current Loans |
Total Loans |
|||||||||||||||||||
| (Dollars in thousands) | ||||||||||||||||||||||||
| Loans held for sale |
$ | 13 | $ | — | $ | 13 | $ | 1,130 | $ | 24,486 | $ | 25,629 | ||||||||||||
|
|
|
|
|
|
|
|
|
|
|
|
|
|||||||||||||
| Commercial and industrial |
350 | — | 350 | 3,186 | 424,422 | 427,958 | ||||||||||||||||||
| Real estate: |
||||||||||||||||||||||||
| Commercial real estate (including multi-family residential) |
2,493 | — | 2,493 | 974 | 675,512 | 678,979 | ||||||||||||||||||
| Commercial real estate construction and land development |
— | — | — | — | 140,437 | 140,437 | ||||||||||||||||||
| 1-4 family residential (including home equity) |
343 | — | 343 | 343 | 177,949 | 178,635 | ||||||||||||||||||
| Residential construction |
— | — | — | — | 94,167 | 94,167 | ||||||||||||||||||
| Consumer and other |
12 | — | 12 | 89 | 15,751 | 15,852 | ||||||||||||||||||
|
|
|
|
|
|
|
|
|
|
|
|
|
|||||||||||||
| Total loans held for investment |
3,198 | — | 3,198 | 4,592 | 1,528,238 | 1,536,028 | ||||||||||||||||||
|
|
|
|
|
|
|
|
|
|
|
|
|
|||||||||||||
| Total loans |
$ | 3,211 | $ | — | $ | 3,211 | $ | 5,722 | $ | 1,552,724 | $ | 1,561,657 | ||||||||||||
|
|
|
|
|
|
|
|
|
|
|
|
|
|||||||||||||
(Continued)
F-14
Table of Contents
ALLEGIANCE BANCSHARES, INC.
CONDENSED NOTES TO INTERIM CONSOLIDATED FINANCIAL STATEMENTS
(Unaudited)
5. LOANS AND ALLOWANCE FOR LOAN LOSSES (Continued)
| December 31, 2014 | ||||||||||||||||||||||||
| Loans Past Due and Still Accruing | ||||||||||||||||||||||||
| 30-89 Days | 90 or More Days |
Total Past Due Loans |
Nonaccrual Loans |
Current Loans |
Total Loans |
|||||||||||||||||||
| (Dollars in thousands) | ||||||||||||||||||||||||
| Commercial and industrial |
$ | 274 | $ | — | $ | 274 | $ | 1,527 | $ | 268,562 | $ | 270,363 | ||||||||||||
| Real estate: |
||||||||||||||||||||||||
| Commercial real estate (including multi-family residential) |
— | — | — | 1,653 | 428,333 | 429,986 | ||||||||||||||||||
| Commercial real estate construction and land development |
— | — | — | — | 85,484 | 85,484 | ||||||||||||||||||
| 1-4 family residential (including home equity) |
— | — | — | 135,127 | 135,127 | |||||||||||||||||||
| Residential construction |
413 | — | 413 | — | 71,989 | 72,402 | ||||||||||||||||||
| Consumer and other |
46 | — | 46 | 4 | 8,642 | 8,692 | ||||||||||||||||||
|
|
|
|
|
|
|
|
|
|
|
|
|
|||||||||||||
| Total loans |
$ | 733 | $ | — | $ | 733 | $ | 3,184 | $ | 998,137 | $ | 1,002,054 | ||||||||||||
|
|
|
|
|
|
|
|
|
|
|
|
|
|||||||||||||
| (2) | Includes $502 thousand of loans acquired from F&M Bancshares. |
| (3) | Includes $1.8 million of loans acquired from F&M Bancshares. |
(Continued)
F-15
Table of Contents
ALLEGIANCE BANCSHARES, INC.
CONDENSED NOTES TO INTERIM CONSOLIDATED FINANCIAL STATEMENTS
(Unaudited)
5. LOANS AND ALLOWANCE FOR LOAN LOSSES (Continued)
Impaired Loans
Impaired loans by class of loans are set forth in the following tables. The average recorded investment presented in the table below is reported on a year-to-date basis.
| June 30, 2015 | ||||||||||||||||||||
| Recorded Investment |
Unpaid Principal Balance |
Related Allowance |
Average Recorded Investment |
Interest Income Recognized |
||||||||||||||||
| (Dollars in thousands) | ||||||||||||||||||||
| With no related allowance recorded: |
||||||||||||||||||||
| Commercial and industrial |
$ | 2,211 | $ | 2,272 | $ | — | $ | 2,329 | $ | 56 | ||||||||||
| Commercial real estate (including multi-family residential) |
2,033 | 2,033 | — | 2,072 | 67 | |||||||||||||||
| Commercial real estate construction and land development |
— | — | — | — | — | |||||||||||||||
| 1-4 family residential (including home equity) |
381 | 381 | — | 384 | 10 | |||||||||||||||
| Residential construction |
— | — | — | — | — | |||||||||||||||
| Consumer and other |
104 | 104 | — | 112 | 4 | |||||||||||||||
|
|
|
|
|
|
|
|
|
|
|
|||||||||||
| Total |
4,729 | 4,790 | — | 4,897 | 137 | |||||||||||||||
|
|
|
|
|
|
|
|
|
|
|
|||||||||||
| With an allowance recorded: |
||||||||||||||||||||
| Commercial and industrial |
1,974 | 1,974 | 709 | 2,007 | 42 | |||||||||||||||
| Commercial real estate (including multi-family residential) |
176 | 176 | 6 | 178 | 6 | |||||||||||||||
| Commercial real estate construction and land development |
— | — | — | — | — | |||||||||||||||
| 1-4 family residential (including home equity) |
— | — | — | — | — | |||||||||||||||
| Residential construction |
— | — | — | — | — | |||||||||||||||
| Consumer and other |
29 | 29 | 5 | 29 | 1 | |||||||||||||||
|
|
|
|
|
|
|
|
|
|
|
|||||||||||
| Total |
2,179 | 2,179 | 720 | 2,214 | 49 | |||||||||||||||
|
|
|
|
|
|
|
|
|
|
|
|||||||||||
| Total: |
||||||||||||||||||||
| Commercial and industrial |
4,185 | 4,246 | 709 | 4,336 | 98 | |||||||||||||||
| Commercial real estate (including multi-family residential) |
2,209 | 2,209 | 6 | 2,250 | 73 | |||||||||||||||
| Commercial real estate construction and land development |
— | — | — | — | — | |||||||||||||||
| 1-4 family residential (including home equity) |
381 | 381 | — | 384 | 10 | |||||||||||||||
| Residential construction |
— | — | — | — | — | |||||||||||||||
| Consumer and other |
133 | 133 | 5 | 141 | 5 | |||||||||||||||
|
|
|
|
|
|
|
|
|
|
|
|||||||||||
| $ | 6,908 | $ | 6,969 | $ | 720 | $ | 7,111 | $ | 186 | |||||||||||
|
|
|
|
|
|
|
|
|
|
|
|||||||||||
(Continued)
F-16
Table of Contents
ALLEGIANCE BANCSHARES, INC.
CONDENSED NOTES TO INTERIM CONSOLIDATED FINANCIAL STATEMENTS
(Unaudited)
5. LOANS AND ALLOWANCE FOR LOAN LOSSES (Continued)
| December 31, 2014 | ||||||||||||||||||||
| Recorded Investment |
Unpaid Principal Balance |
Related Allowance |
Average Recorded Investment |
Interest Income Recognized |
||||||||||||||||
| (Dollars in thousands) | ||||||||||||||||||||
| With no related allowance recorded: |
||||||||||||||||||||
| Commercial and industrial |
$ | 999 | $ | 1,054 | $ | — | $ | 1,292 | $ | 83 | ||||||||||
| Commercial real estate (including multi-family residential) |
2,894 | 2,894 | — | 1,641 | 182 | |||||||||||||||
| Commercial real estate construction and land development |
— | — | — | — | — | |||||||||||||||
| 1-4 family residential (including home equity) |
— | — | — | 2 | — | |||||||||||||||
| Residential construction |
— | — | — | — | — | |||||||||||||||
| Consumer and other |
— | — | — | 1,084 | — | |||||||||||||||
|
|
|
|
|
|
|
|
|
|
|
|||||||||||
| Total |
3,893 | 3,948 | — | 4,019 | 265 | |||||||||||||||
|
|
|
|
|
|
|
|
|
|
|
|||||||||||
| With an allowance recorded: |
||||||||||||||||||||
| Commercial and industrial |
1,802 | 1,802 | 501 | 2,247 | 128 | |||||||||||||||
| Commercial real estate (including multi-family residential) |
180 | 180 | 10 | 715 | 12 | |||||||||||||||
| Commercial real estate construction and land development |
— | — | — | — | — | |||||||||||||||
| 1-4 family residential (including home equity) |
— | — | — | 40 | — | |||||||||||||||
| Residential construction |
— | — | — | — | — | |||||||||||||||
| Consumer and other |
4 | 4 | 1 | 2,102 | — | |||||||||||||||
|
|
|
|
|
|
|
|
|
|
|
|||||||||||
| Total |
1,986 | 1,986 | 512 | 5,104 | 140 | |||||||||||||||
|
|
|
|
|
|
|
|
|
|
|
|||||||||||
| Total: |
||||||||||||||||||||
| Commercial and industrial |
2,801 | 2,856 | 501 | 3,539 | 211 | |||||||||||||||
| Commercial real estate (including multi-family residential) |
3,074 | 3,074 | 10 | 2,356 | 194 | |||||||||||||||
| Commercial real estate construction and land development |
— | — | — | — | — | |||||||||||||||
| 1-4 family residential (including home equity) |
— | — | — | 42 | — | |||||||||||||||
| Residential construction |
— | — | — | — | — | |||||||||||||||
| Consumer and other |
4 | 4 | 1 | 3,186 | — | |||||||||||||||
|
|
|
|
|
|
|
|
|
|
|
|||||||||||
| $ | 5,879 | $ | 5,934 | $ | 512 | $ | 9,123 | $ | 405 | |||||||||||
|
|
|
|
|
|
|
|
|
|
|
|||||||||||
The average recorded investment of impaired loans for the six months ended June 30, 2014 was $6.3 million. Interest income recognized for the six months ended June 30, 2014 on impaired loans was not material.
Credit Quality Indicators
The company categorizes loans into risk categories based on relevant information about the ability of borrowers to service their debt including factors such as: current financial information, historical payment experience, credit documentation, public information, and current economic trends. The Company analyzes loans individually by classifying the loans by credit risk. As part of the ongoing monitoring of the credit quality of the Company’s loan portfolio and methodology for calculating the allowance for credit losses, management assigns and tracks risk ratings to be used as credit quality indicators.
(Continued)
F-17
Table of Contents
ALLEGIANCE BANCSHARES, INC.
CONDENSED NOTES TO INTERIM CONSOLIDATED FINANCIAL STATEMENTS
(Unaudited)
5. LOANS AND ALLOWANCE FOR LOAN LOSSES (Continued)
The following is a general description of the risk ratings used:
Watch—Loans classified as watch have an element of risk added to the credit such as declining payment history, deteriorating financial position of the borrower or a decrease in collateral value.
Special Mention—Loans classified as special mention have a potential weakness that deserves management’s close attention. If left uncorrected, these potential weaknesses may result in deterioration of the repayment prospects for the loan or of the institution’s credit position at some future date. They are characterized by the distinct possibility that the institution will sustain some loss if the deficiencies are not corrected.
Substandard—Loans classified as substandard have well-defined weaknesses on a continuing basis and are inadequately protected by the current net worth and paying capacity of the borrower, impaired or declining collateral values, or a continuing downturn in their industry which is reducing their profits to below zero and having a significantly negative impact on their cash flow. These loans so classified are characterized by the distinct possibility that the institution will sustain some loss if the deficiencies are not corrected.
Doubtful—Loans classified as doubtful have all the weaknesses inherent in those classified as substandard with the added characteristic that the weaknesses make collection or liquidation in full on the basis of currently existing facts, conditions, and values, highly questionable and improbable.
Loans not meeting the criteria above that are analyzed individually as part of the above described process are considered to be pass rated loans.
Based on the most recent analysis performed, the risk category of loans by class of loan at June 30, 2015 is as follows:
| Pass | Watch | Special Mention | Substandard | Doubtful | Total | |||||||||||||||||||
| (Dollars in thousands) | ||||||||||||||||||||||||
| Loans held for sale |
$ | 24,218 | $ | — | $ | 29 | $ | 1,382 | $ | — | $ | 25,629 | ||||||||||||
|
|
|
|
|
|
|
|
|
|
|
|
|
|||||||||||||
| Commercial and industrial |
416,526 | 3,108 | 3,375 | 4,949 | — | 427,958 | ||||||||||||||||||
| Commercial real estate (including multi-family residential) |
657,681 | 10,460 | 464 | 10,374 | — | 678,979 | ||||||||||||||||||
| Commercial real estate construction and land development |
136,500 | 3,937 | — | — | — | 140,437 | ||||||||||||||||||
| 1-4 family residential (including home equity) |
174,481 | 1,780 | 894 | 1,480 | — | 178,635 | ||||||||||||||||||
| Residential construction |
94,167 | — | — | — | — | 94,167 | ||||||||||||||||||
| Consumer and other |
15,678 | 73 | — | 101 | — | 15,852 | ||||||||||||||||||
|
|
|
|
|
|
|
|
|
|
|
|
|
|||||||||||||
| Total loans held for investment |
1,495,033 | 19,358 | 4,733 | 16,904 | — | 1,536,028 | ||||||||||||||||||
|
|
|
|
|
|
|
|
|
|
|
|
|
|||||||||||||
| Total loans |
$ | 1,519,251 | $ | 19,358 | $ | 4,762 | $ | 18,286 | $ | — | $ | 1,561,657 | ||||||||||||
|
|
|
|
|
|
|
|
|
|
|
|
|
|||||||||||||
(Continued)
F-18
Table of Contents
ALLEGIANCE BANCSHARES, INC.
CONDENSED NOTES TO INTERIM CONSOLIDATED FINANCIAL STATEMENTS
(Unaudited)
5. LOANS AND ALLOWANCE FOR LOAN LOSSES (Continued)
The following table presents the risk category of loans by class of loan at December 31, 2014:
| Pass | Watch | Special Mention | Substandard | Doubtful | Total |
|||||||||||||||||||
| (Dollars in thousands) | ||||||||||||||||||||||||
| Commercial and industrial |
$ | 263,335 | $ | 1,817 | $ | 291 | $ | 4,920 | $ | — | $ | 270,363 | ||||||||||||
| Commercial real estate (including multi-family residential) |
408,117 | 9,365 | — | 12,504 | — | 429,986 | ||||||||||||||||||
| Commercial real estate construction and land development |
82,643 | 2,841 | — | — | — | 85,484 | ||||||||||||||||||
| 1-4 family residential (including home equity) |
132,979 | 1,677 | 83 | 388 | — | 135,127 | ||||||||||||||||||
| Residential construction |
71,025 | — | 1,200 | 177 | — | 72,402 | ||||||||||||||||||
| Consumer and other |
8,636 | 35 | — | 21 | — | 8,692 | ||||||||||||||||||
|
|
|
|
|
|
|
|
|
|
|
|
|
|||||||||||||
| Total loans held for investment |
$ | 966,735 | $ | 15,735 | $ | 1,574 | $ | 18,010 | $ | — | $ | 1,002,054 | ||||||||||||
|
|
|
|
|
|
|
|
|
|
|
|
|
|||||||||||||
Allowance for Loan Losses
The following table presents the activity in the allowance for loan losses by portfolio type for the six months ended June 30, 2015 and 2014:
| Commercial and Industrial |
Commercial real estate (including multi-family residential) |
Commercial real estate construction and land development |
1-4 family residential (including home equity) |
Residential Construction |
Consumer and Other |
Total | ||||||||||||||||||||||
| (Dollars in thousands) | ||||||||||||||||||||||||||||
| Allowance for loan losses: |
||||||||||||||||||||||||||||
| Six Months Ended |
||||||||||||||||||||||||||||
| Balance January 1, 2015 |
$ | 2,334 | $ | 3,799 | $ | 578 | $ | 1,008 | $ | 475 | $ | 52 | $ | 8,246 | ||||||||||||||
| Provision for loan losses |
614 | 734 | 264 | 247 | 213 | 31 | 2,103 | |||||||||||||||||||||
| Charge-offs |
(82 | ) | — | — | — | — | (18 | ) | (100 | ) | ||||||||||||||||||
| Recoveries |
39 | — | — | — | 22 | 2 | 63 | |||||||||||||||||||||
|
|
|
|
|
|
|
|
|
|
|
|
|
|
|
|||||||||||||||
| Net charge-offs |
(43 | ) | — | — | — | 22 | (16 | ) | (37 | ) | ||||||||||||||||||
|
|
|
|
|
|
|
|
|
|
|
|
|
|
|
|||||||||||||||
| Balance June 30, 2015 |
$ | 2,905 | $ | 4,533 | $ | 842 | $ | 1,255 | $ | 710 | $ | 67 | $ | 10,312 | ||||||||||||||
|
|
|
|
|
|
|
|
|
|
|
|
|
|
|
|||||||||||||||
| Allowance for loan losses: |
||||||||||||||||||||||||||||
| Six Months Ended |
||||||||||||||||||||||||||||
| Balance January 1, 2014 |
$ | 2,729 | $ | 2,175 | $ | 357 | $ | 558 | $ | 598 | $ | 238 | $ | 6,655 | ||||||||||||||
| Provision for loan losses |
(592 | ) | 1,221 | 258 | 317 | (157 | ) | (147 | ) | 900 | ||||||||||||||||||
| Charge-offs |
(74 | ) | — | — | — | — | (40 | ) | (114 | ) | ||||||||||||||||||
| Recoveries |
20 | — | — | — | — | 1 | 21 | |||||||||||||||||||||
|
|
|
|
|
|
|
|
|
|
|
|
|
|
|
|||||||||||||||
| Net charge-offs |
(54 | ) | — | — | — | — | (39 | ) | (93 | ) | ||||||||||||||||||
|
|
|
|
|
|
|
|
|
|
|
|
|
|
|
|||||||||||||||
| Balance June 30, 2014 |
$ | 2,083 | $ | 3,396 | $ | 615 | $ | 875 | $ | 441 | $ | 52 | $ | 7,462 | ||||||||||||||
|
|
|
|
|
|
|
|
|
|
|
|
|
|
|
|||||||||||||||
(Continued)
F-19
Table of Contents
ALLEGIANCE BANCSHARES, INC.
CONDENSED NOTES TO INTERIM CONSOLIDATED FINANCIAL STATEMENTS
(Unaudited)
5. LOANS AND ALLOWANCE FOR LOAN LOSSES (Continued)
The following table presents the balance in the allowance for loan losses by portfolio type based on the impairment method as of June 30, 2015 and December 31, 2014:
| Commercial and Industrial |
Commercial real estate (including multi-family residential) |
Commercial real estate construction and land development |
1-4 family residential (including home equity) |
Residential Construction |
Consumer and Other |
Total | ||||||||||||||||||||||
| (Dollars in thousands) | ||||||||||||||||||||||||||||
| Allowance for loan losses related to: |
||||||||||||||||||||||||||||
| June 30, 2015 |
||||||||||||||||||||||||||||
| Individually evaluated for impairment |
$ | 709 | $ | 6 | $ | — | $ | — | $ | — | $ | 5 | $ | 720 | ||||||||||||||
| Collectively evaluated for impairment |
2,196 | 4,527 | 842 | 1,255 | 710 | 62 | 9,592 | |||||||||||||||||||||
|
|
|
|
|
|
|
|
|
|
|
|
|
|
|
|||||||||||||||
| Total allowance for loan losses |
$ | 2,905 | $ | 4,533 | $ | 842 | $ | 1,255 | $ | 710 | $ | 67 | $ | 10,312 | ||||||||||||||
|
|
|
|
|
|
|
|
|
|
|
|
|
|
|
|||||||||||||||
| December 31, 2014 |
||||||||||||||||||||||||||||
| Individually evaluated for impairment |
$ | 501 | $ | 10 | $ | — | $ | — | $ | — | $ | 1 | $ | 512 | ||||||||||||||
| Collectively evaluated for impairment |
1,833 | 3,789 | 578 | 1,008 | 475 | 51 | 7,734 | |||||||||||||||||||||
|
|
|
|
|
|
|
|
|
|
|
|
|
|
|
|||||||||||||||
| Total allowance for loan losses |
$ | 2,334 | $ | 3,799 | $ | 578 | $ | 1,008 | $ | 475 | $ | 52 | $ | 8,246 | ||||||||||||||
|
|
|
|
|
|
|
|
|
|
|
|
|
|
|
|||||||||||||||
(Continued)
F-20
Table of Contents
ALLEGIANCE BANCSHARES, INC.
CONDENSED NOTES TO INTERIM CONSOLIDATED FINANCIAL STATEMENTS
(Unaudited)
5. LOANS AND ALLOWANCE FOR LOAN LOSSES (Continued)
The following table presents the recorded investment in loans held for investment by portfolio type based on the impairment method as of June 30, 2015 and December 31, 2014:
| Commercial and Industrial |
Commercial real estate (including multi- family residential) |
Commercial real estate construction and land development |
1-4 family residential (including home equity) |
Residential Construction |
Consumer and Other |
Total | ||||||||||||||||||||||
| (Dollars in thousands) | ||||||||||||||||||||||||||||
| Recorded investment in loans: |
||||||||||||||||||||||||||||
| June 30, 2015 |
||||||||||||||||||||||||||||
| Individually evaluated for impairment |
$ | 4,185 | $ | 2,209 | $ | — | $ | 381 | $ | — | $ | 133 | $ | 6,908 | ||||||||||||||
| Collectively evaluated for impairment |
423,773 | 676,770 | 140,437 | 178,254 | 94,167 | 15,719 | 1,529,120 | |||||||||||||||||||||
|
|
|
|
|
|
|
|
|
|
|
|
|
|
|
|||||||||||||||
| Total loans evaluated for impairment |
$ | 427,958 | $ | 678,979 | $ | 140,437 | $ | 178,635 | $ | 94,167 | $ | 15,852 | $ | 1,536,028 | ||||||||||||||
|
|
|
|
|
|
|
|
|
|
|
|
|
|
|
|||||||||||||||
| December 31, 2014 |
||||||||||||||||||||||||||||
| Individually evaluated for impairment |
$ | 2,801 | $ | 3,074 | $ | — | $ | — | $ | — | $ | 4 | $ | 5,879 | ||||||||||||||
| Collectively evaluated for impairment |
267,562 | 426,912 | 85,484 | 135,127 | 72,402 | 8,688 | 996,175 | |||||||||||||||||||||
|
|
|
|
|
|
|
|
|
|
|
|
|
|
|
|||||||||||||||
| Total loans evaluated for impairment |
$ | 270,363 | $ | 429,986 | $ | 85,484 | $ | 135,127 | $ | 72,402 | $ | 8,692 | $ | 1,002,054 | ||||||||||||||
|
|
|
|
|
|
|
|
|
|
|
|
|
|
|
|||||||||||||||
Troubled Debt Restructurings
As of June 30, 2015 and December 31, 2014, the Company had a recorded investment in troubled debt restructurings of $3.0 million and $1.7 million, respectively. The Company added $2.0 million in troubled debt restructurings during the six months ended June 30, 2015. The Company allocated $696 thousand and $205 thousand of specific reserves for troubled debt restructurings at June 30, 2015 and December 31, 2014, respectively, and did not commit to lend additional amounts on these loans. As of June 30, 2015, there have been no defaults on any loans that were modified as troubled debt restructurings during the preceding 12 months. Default in determined at 90 or more days past due.
6. FAIR VALUE
The Company uses fair value measurements to record fair value adjustments to certain assets and to determine fair value disclosures. Fair value represents the exchange price that would be received from selling an asset or paid to transfer a liability, otherwise known as an “exit price” in the principal or most advantageous market available to the entity in an orderly transaction between market participants on the measurement date.
(Continued)
F-21
Table of Contents
ALLEGIANCE BANCSHARES, INC.
CONDENSED NOTES TO INTERIM CONSOLIDATED FINANCIAL STATEMENTS
(Unaudited)
6. FAIR VALUE (Continued)
There are three levels of inputs that may be used to measure fair values. The fair value hierarchy is as follows:
Fair Value Hierarchy
The Company groups financial assets and financial liabilities measured at fair value in three levels, based on the markets in which the assets and liabilities are traded and the reliability of the assumptions used to determine fair value. These levels are:
| • | Level 1—Quoted prices for identical assets or liabilities in active markets that the entity has the ability to access as of the measurement date. |
| • | Level 2—Significant other observable inputs other than Level 1 prices such as quoted prices for similar assets or liabilities; quoted prices in markets that are not active; or other inputs that are observable or can be corroborated by observable market data. |
| • | Level 3—Significant unobservable inputs that reflect management’s judgment and assumptions that market participants would use in pricing an asset or liability that are supported by little or no market activity. |
Loans Held For Sale-Loans held for sale are carried at the lower of aggregate cost or fair value, which is evaluated on a pool-level basis. The fair value of loans held for sale was determined using assets, adjusted for specific attributes of that loan or other observable market data. The Company classifies the fair value of loans held for sale as Level 3.
The carrying amounts and estimated fair values of financial instruments that are reported on the balance sheet are as follows:
| As of June 30, 2015 | ||||||||||||||||||||
| Carrying Amount |
Estimated Fair Value | |||||||||||||||||||
| Level 1 | Level 2 | Level 3 | Total | |||||||||||||||||
| (Dollars in thousands) | ||||||||||||||||||||
| Financial assets |
||||||||||||||||||||
| Cash and cash equivalents |
$ | 138,685 | $ | 138,685 | $ | — | $ | — | $ | 138,685 | ||||||||||
| Available-for-sale securities |
151,662 | — | 151,662 | — | 151,662 | |||||||||||||||
| Loans held for sale |
25,629 | — | — | 25,629 | 25,629 | |||||||||||||||
| Loans held for investment, net of allowance |
1,525,716 | — | — | 1,532,431 | 1,532,431 | |||||||||||||||
| Accrued interest receivable |
5,265 | — | 958 | 4,307 | 5,265 | |||||||||||||||
| Financial liabilities |
||||||||||||||||||||
| Deposits |
$ | 1,625,324 | $ | — | $ | — | $ | 1,626,235 | $ | 1,708,020 | ||||||||||
| Short-term borrowings |
75,000 | — | 75,000 | — | 75,000 | |||||||||||||||
| Subordinated debt |
9,032 | — | 9,032 | — | 9,032 | |||||||||||||||
| Other borrowed funds |
28,069 | — | 28,069 | — | 28,069 | |||||||||||||||
| Accrued interest payable |
101 | — | 37 | 64 | 101 | |||||||||||||||
(Continued)
F-22
Table of Contents
ALLEGIANCE BANCSHARES, INC.
CONDENSED NOTES TO INTERIM CONSOLIDATED FINANCIAL STATEMENTS
(Unaudited)
6. FAIR VALUE (Continued)
| As of December 31, 2014 | ||||||||||||||||||||
| Carrying Amount |
Estimated Fair Value | |||||||||||||||||||
| Level 1 | Level 2 | Level 3 | Total | |||||||||||||||||
| (Dollars in thousands) | ||||||||||||||||||||
|
|
||||||||||||||||||||
| Cash and cash equivalents |
$ | 167,540 | $ | 167,540 | $ | — | $ | — | $ | 167,540 | ||||||||||
| Available-for-sale securities |
84,962 | — | 84,962 | — | 84,962 | |||||||||||||||
| Loans held for investment, net of allowance |
993,808 | — | — | 998,575 | 998,575 | |||||||||||||||
| Accrued interest receivable |
3,285 | — | 473 | 2,812 | 3,285 | |||||||||||||||
| Financial liabilities |
||||||||||||||||||||
| Deposits |
$ | 1,625,324 | $ | — | $ | — | $ | 1,627,983 | $ | 1,627,983 | ||||||||||
| Other borrowings |
10,069 | — | 10,069 | — | 10,069 | |||||||||||||||
| Accrued interest payable |
43 | — | — | 43 | 43 | |||||||||||||||
The fair value estimates presented above are based on pertinent information available to management as of the dates indicated. The methods used to determine fair value are described in our audited financial statements which are presented elsewhere in this prospectus.
The following method to determine fair value of loans held for sale was adopted during the first quarter of 2015 as part of the F&M Bancshares, Inc. transaction.
The following tables present fair values for assets measured at fair value on a recurring basis:
| As of June 30, 2015 | ||||||||||||||||
| Level 1 | Level 2 | Level 3 | Total | |||||||||||||
| (Dollars in thousands) | ||||||||||||||||
| Available for sale securities: |
||||||||||||||||
| U.S. Government and agency securities |
$ | — | $ | 8,992 | $ | — | $ | 8,992 | ||||||||
| Municipal securities |
— | 107,397 | — | 107,397 | ||||||||||||
| Agency mortgage-backed pass-through securities |
— | 32,976 | — | 32,976 | ||||||||||||
| Agency collateralized mortgage obligations |
— | 2,297 | — | 2,297 | ||||||||||||
|
|
|
|
|
|
|
|
|
|||||||||
| $ | — | $ | 151,662 | $ | — | $ | 151,662 | |||||||||
|
|
|
|
|
|
|
|
|
|||||||||
(Continued)
F-23
Table of Contents
ALLEGIANCE BANCSHARES, INC.
CONDENSED NOTES TO INTERIM CONSOLIDATED FINANCIAL STATEMENTS
(Unaudited)
6. FAIR VALUE (Continued)
| As of December 31, 2014 | ||||||||||||||||
| Level 1 | Level 2 | Level 3 | Total | |||||||||||||
| (Dollars in thousands) | ||||||||||||||||
| Available for sale securities: |
||||||||||||||||
| U.S. Government and agency securities |
$ | — | $ | 14,477 | $ | — | $ | 14,477 | ||||||||
| Municipal securities |
— | 35,481 | — | 35,481 | ||||||||||||
| Agency mortgage-backed pass-through securities |
— | 32,475 | — | 32,475 | ||||||||||||
| Agency collateralized mortgage obligations |
— | 2,529 | — | 2,529 | ||||||||||||
|
|
|
|
|
|
|
|
|
|||||||||
| $ | — | $ | 84,962 | $ | — | $ | 84,962 | |||||||||
|
|
|
|
|
|
|
|
|
|||||||||
There were no liabilities measured at fair value on a recurring basis as of June 30, 2015 or December 31, 2014. There were no transfers between levels during the six months ended June 30, 2015 or 2014.
Certain assets and liabilities are measured at fair value on a nonrecurring basis; that is the instruments are not measured at fair value on an ongoing basis but are subject to fair value adjustments in certain circumstances such as evidence of impairment.
| As of June 30, 2015 | ||||||||||||
| Level 1 | Level 2 | Level 3 | ||||||||||
| (Dollars in thousands) | ||||||||||||
| Impaired loans: |
||||||||||||
| Commercial and industrial |
$ | — | $ | — | $ | 1,265 | ||||||
| Commercial real estate (including multi-family residential) |
— | — | 170 | |||||||||
| Consumer and other |
— | — | 24 | |||||||||
|
|
|
|
|
|
|
|||||||
| $ | — | $ | — | $ | 1,459 | |||||||
|
|
|
|
|
|
|
|||||||
| As of December 31, 2014 | ||||||||||||
| Level 1 | Level 2 | Level 3 | ||||||||||
| (Dollars in thousands) | ||||||||||||
| Impaired loans |
||||||||||||
| Commercial and industrial |
$ | — | $ | — | $ | 1,301 | ||||||
| Commercial real estate (including multi-family residential) |
— | — | 170 | |||||||||
| Consumer and other |
— | — | 3 | |||||||||
|
|
|
|
|
|
|
|||||||
| $ | — | $ | — | $ | 1,474 | |||||||
|
|
|
|
|
|
|
|||||||
There were no loans need for sale measured at fair value on a nonrecurring basis as of June 30, 2015.
Level 3 Valuations
Financial instruments are considered Level 3 when their values are determined using pricing models, discounted cash flow methodologies or similar techniques and at least one significant model assumption or input is unobservable. Level 3 financial instruments also include those for which the determination of fair value requires significant management judgment or estimation. Currently, we measure the fair value for certain loans on a nonrecurring basis as described below.
(Continued)
F-24
Table of Contents
ALLEGIANCE BANCSHARES, INC.
CONDENSED NOTES TO INTERIM CONSOLIDATED FINANCIAL STATEMENTS
(Unaudited)
6. FAIR VALUE (Continued)
During the six months ended June 30, 2015 and the year ended December 31, 2014, certain impaired loans were reevaluated and reported at fair value through a specific allocation of the allowance for loan losses. At June 30, 2015, the total reported fair value of impaired loans of $1.5 million based on collateral valuations utilizing Level 3 valuation inputs had a carrying value of $2.2 million that was reduced by specific allowance allocations totaling $720 thousand. At December 31, 2014, the total reported fair value of impaired loans of $1.5 million based on collateral valuations utilizing Level 3 valuation inputs had a carrying value of $2.0 million that was reduced by specific allowance allocations totaling $512 thousand.
7. DEPOSITS
Time deposits that meet or exceed the FDIC Insurance limit of $250 thousand at June 30, 2015 and December 31, 2014 were $144.0 million and $97.0 million, respectively.
Scheduled maturities of time deposits for the next five years are as follows (dollars in thousands):
| Within one year |
$ | 377,752 | ||
| After one but within two years |
105,532 | |||
| After two but within three years |
29,242 | |||
| After three but within four years |
23,912 | |||
| After four but within five years |
12,765 | |||
|
|
|
|||
| Total |
$ | 549,203 | ||
|
|
|
8. BORROWINGS
The Company has an available line of credit with the FHLB of Dallas, which allows the Company to borrow on a collateralized basis. FHLB advances are short-term, overnight borrowings and are used to manage liquidity as needed. Maturing advances are replaced by drawing on available cash, making additional borrowings or through increased customer deposits. At June 30, 2015, the Company had total funds of $548.6 million available under this agreement, of which $76.5 million was outstanding. Short-term overnight FHLB advances of $75.0 million were outstanding at June 30, 2015, at a weighted average rate of rate of 0.16%.
(Continued)
F-25
Table of Contents
ALLEGIANCE BANCSHARES, INC.
CONDENSED NOTES TO INTERIM CONSOLIDATED FINANCIAL STATEMENTS
(Unaudited)
8. BORROWINGS (Continued)
In 2015, the Company borrowed an additional $18.0 million on a borrowing agreement with another financial institution in addition to the $10.1 million indebtedness incurred in 2014. The borrowing matures in December 2021. The Company used the funds borrowed in 2015 to repay debt that F&M owed to its shareholders and used the borrowed funds in 2014 to pay off a previous borrowing with another financial institution entered into during 2013 in conjunction with the purchase of Independence Bank. The note agreement requires the Company to meet certain restrictive covenants. At June 30, 2015, the Company believes it is in compliance with its debt covenants and had not been made aware of any noncompliance by the lender. The interest rate on the debt is the Prime Rate minus 25 basis points, or 3.00%, at June 30, 2015, and is paid quarterly. Scheduled principal maturities are as follows (dollars in thousands):
| 2015 |
$ | 2,354 | ||
| 2016 |
4,285 | |||
| 2017 |
4,285 | |||
| 2018 |
4,285 | |||
| 2019 and therafter |
12,860 | |||
|
|
|
|||
| $ | 28,069 | |||
|
|
|
9. SUBORDINATED DEBENTURES
On January 1, 2015, the Company acquired F&M and assumed Farmers & Merchants Capital Trust II and Farmers & Merchants Capital Trust III. Each of the trusts is a capital or statutory business trust organized for the sole purpose of issuing trust securities and investing the proceeds in the Company’s junior subordinated debentures. The preferred trust securities of each trust represent preferred beneficial interests in the assets of the respective trusts and are subject to mandatory redemption upon payment of the junior subordinated debentures held by the trust. The common securities of each trust are wholly owned by the Company. Each trust’s ability to pay amounts due on the trust preferred securities is solely dependent upon the Company making payment on the related junior subordinated debentures. The debentures, which are the only assets of each trust, are subordinate and junior in right of payment to all of the Company’s present and future senior indebtedness. The Company has fully and unconditionally guaranteed each trust’s obligations under the trust securities issued by such trust to the extent not paid or made by each trust, provided such trust has funds available for such obligations.
Under the provisions of each issue of the debentures, the Company has the right to defer payment of interest on the debentures at any time, or from time to time, for periods not exceeding five years. If interest payments on either issue of the debentures are deferred, the distributions on the applicable trust preferred securities and common securities will also be deferred.
(Continued)
F-26
Table of Contents
ALLEGIANCE BANCSHARES, INC.
CONDENSED NOTES TO INTERIM CONSOLIDATED FINANCIAL STATEMENTS
(Unaudited)
9. SUBORDINATED DEBENTURES (Continued)
At June 30, 2015, the Company had $11.3 million outstanding in junior subordinated debentures issued to the Company’s unconsolidated subsidiary trusts. On January 1, 2015, the Company recorded the debentures at fair value. The differences between the carrying value and contractual balance will be recognized as a yield adjustment over the remaining term for the debentures. A summary of pertinent information related to the Company’s issues of junior subordinated debentures outstanding at June 30, 2015 is set forth in the table below:
| Description |
Issuance Date | Trust Preferred Securities Outstanding |
Interest Rate(1) | Junior Subordinated Debt Owed to Trusts |
Maturity Date(2) | |||||||||||
| (Dollars in thousands) | ||||||||||||||||
| Farmers & Merchants Capital Trust II |
November 13, 2003 | $ | 7,500 | 3 month LIBOR + 3.00 | % | $ | 7,732 | November 8, 2033 | ||||||||
| Farmers & Merchants Capital Trust III |
June 30, 2005 | 3,500 | 3 month LIBOR + 1.80 | % | 3,609 | July 7, 2035 | ||||||||||
|
|
|
|||||||||||||||
| $ | 11,341 | |||||||||||||||
|
|
|
|||||||||||||||
| (1) | The 3-month LIBOR in effect as of June 30, 2015 was 0.2827%. |
| (2) | All debentures are currently callable. |
10. INCOME TAXES
The amount of federal and state income tax expense is influenced by the amount of pre-tax income, the amount of tax-exempt income and the amount of other nondeductible items. For the six months ended, June 30, 2015, income tax expense was $3.9 million compared with $2.6 million for the six months ended June 30, 2014. The increase in income tax expense year over year was primarily attributable to higher pre-tax earnings. The effective income tax rate for the six months ended June 30, 2015 was 34.4% and for the six months ended June 30, 2014 was 35.4%, respectively.
Interest and penalties related to tax positions are recognized in the period in which they begin accruing or when the entity claims the position that does not meet the minimum statutory thresholds. The Company has not recorded any interest and penalties in the income statement for the six months ended June 30, 2015.
11. STOCK BASED COMPENSATION
During 2008, the Company’s Board of Directors and shareholders approved the 2008 Stock Awards and Incentive Plan (the “Plan”) covering certain key employees to purchase shares of the Company’s stock. The Plan was amended in 2015 as the shareholders authorized a maximum aggregate number of shares of stock to be issued of 1,460,000, any or all of which may be issued through incentive stock options. The Company accounts for stock-based employee compensation plans using the fair value-based method of accounting. The Company recognized total stock-based compensation expense of $642 thousand and $326 thousand for the six months ended June 30, 2015 and 2014, respectively.
(Continued)
F-27
Table of Contents
ALLEGIANCE BANCSHARES, INC.
CONDENSED NOTES TO INTERIM CONSOLIDATED FINANCIAL STATEMENTS
(Unaudited)
11. STOCK BASED COMPENSATION (Continued)
Stock Option Plan
Options to purchase a total of 1,060,711 shares of Company stock have been granted as of June 30, 2015. Under the stock option plan; options are exercisable up to 10 years from the date of the grant, unless otherwise provided by the Board of Directors and are fully vested 4 years after the date of grant.
The fair value of stock options granted is estimated at the date of grant using the Black-Scholes option-pricing model.
A summary of the activity in the stock option plan during the six months ended June 30, 2015 is set forth below:
| Number of Options |
Weighted Average Exercise Price |
Weighted Average Remaining Contractual Term |
Aggregate Intrinsic Value |
|||||||||||||
| (In thousands) | (In years) | (In thousands) | ||||||||||||||
| Options outstanding, December 31, 2014 |
694 | $ | 15.60 | 6.57 | $ | 4,437 | ||||||||||
| Options granted |
226 | 22.00 | ||||||||||||||
| Options exercised |
— | — | ||||||||||||||
| Options forfeited |
(24 | ) | 22.00 | |||||||||||||
|
|
|
|
|
|||||||||||||
| Options outstanding, June 30, 2015 |
896 | $ | 17.05 | 6.87 | $ | 4,432 | ||||||||||
|
|
|
|
|
|
|
|
|
|||||||||
| Options vested and exercisable, June 30, 2015 |
452 | $ | 13.25 | 4.78 | $ | 3,956 | ||||||||||
|
|
|
|
|
|
|
|
|
|||||||||
The fair value of options granted was determined using the following weighted-average assumptions as of the grant date.
| 2015 | ||||
| Risk-free interest rate |
2.70 | % | ||
| Expected term |
10.00 | |||
| Expected stock price volatility |
17.72 | % | ||
| Dividend yield |
— | |||
Share Award Plan
During 2015, the Company issued 3,983 shares of restricted stock with a grant date fair value of $22 per share. The restricted stock shares will vest over a period of 4 years but are considered outstanding at the date of issuance. The Company accounts for restricted stock grants by recording the fair value of the grant as compensation expense over the vesting period.
(Continued)
F-28
Table of Contents
ALLEGIANCE BANCSHARES, INC.
CONDENSED NOTES TO INTERIM CONSOLIDATED FINANCIAL STATEMENTS
(Unaudited)
11. STOCK BASED COMPENSATION (Continued)
A summary of the activity of the nonvested shares of restricted stock as of June 30, 2015 is as follows:
| Number of Shares |
Weighted Average Grant Date Fair Value |
|||||||
| (Shares in thousands) | ||||||||
| Nonvested share awards outstanding, December 31, 2014 |
27 | $ | 18.23 | |||||
| Share awards granted |
4 | 22.00 | ||||||
| Share awards vested |
(12 | ) | 17.20 | |||||
| Unvested share awards forfeited |
— | — | ||||||
|
|
|
|
|
|||||
| Nonvested share awards outstanding, June 30, 2015 |
19 | $ | 19.73 | |||||
|
|
|
|
|
|||||
12. OFF-BALANCE SHEET ARRANGEMENTS, COMMITMENTS AND CONTINGENCIES
In the normal course of business, the Company enters into various transactions, which, in accordance with accounting principles generally accepted in the United States are not included in the Company’s consolidated balance sheets. The Company enters into these transactions to meet the financing needs of its customers. These transactions include commitments to extend credit and standby and commercial letters of credit, which involve to varying degrees elements of credit risk and interest rate risk in excess of the amounts recognized in the consolidated balance sheets. The Company uses the same credit policies in making commitments and conditional obligations as it does for on balance sheet instruments.
The contractual amounts of financial instruments with off-balance sheet risk at June 30, 2015 are as follows:
| June 30, | December 31, | |||||||||||||||
| 2015 | 2014 | |||||||||||||||
| Fixed Rate |
Variable Rate |
Fixed Rate |
Variable Rate |
|||||||||||||
| (Dollars in thousands) | ||||||||||||||||
| Commitments to extend credit |
$ | 273,050 | $ | 217,173 | $ | 178,803 | $ | 214,195 | ||||||||
| Standby letters of credit |
6,327 | 111 | 4,006 | — | ||||||||||||
|
|
|
|
|
|
|
|
|
|||||||||
| Total |
$ | 279,377 | $ | 217,284 | $ | 182,809 | $ | 214,195 | ||||||||
|
|
|
|
|
|
|
|
|
|||||||||
Commitments to make loans are generally made for periods of 120 days or less. As of June 30, 2015, the fixed rate loan commitments have interest rates ranging from 1.60% to 9.50% with a weighted average maturity of 2.03 years.
Litigation
The Company and the Bank are defendants, from time to time, in legal actions arising from transactions conducted in the ordinary course of business. The Company and the Bank believe, after consultations with legal counsel, that the ultimate liability, if any, arising from such actions will not have a material adverse effect on the financial statements.
(Continued)
F-29
Table of Contents
ALLEGIANCE BANCSHARES, INC.
CONDENSED NOTES TO INTERIM CONSOLIDATED FINANCIAL STATEMENTS
(Unaudited)
13. REGULATORY CAPITAL MATTERS
The Company and the Bank are subject to various regulatory capital requirements administered by the federal banking agencies. Capital adequacy guidelines prompt corrective action regulations and involve quantitative measures of assets, liabilities and certain off balance sheet items calculated under regulatory accounting practices. Capital amounts and classifications are also subject to qualitative judgments by regulators about components, risk weightings, and other factors. Any institution that fails to meet its minimum capital requirements is subject to actions by regulators that could have a direct material effect on the Company’s financial statements.
Prompt corrective action regulations provide five classifications: well capitalized, adequately capitalized, undercapitalized, significantly undercapitalized, and critically undercapitalized, although these terms are not used to represent overall financial condition. If adequately capitalized, regulatory approval is required to accept brokered deposits. If undercapitalized, capital distributions are limited as is asset growth and expansion; and capital restoration plans are required.
On July 2, 2013, the Federal Reserve approved a final rule that establishes an integrated regulatory capital framework. The rule implements the Basel III regulatory capital reforms from the Basel Committee on Banking Supervision and certain changes required by the Dodd-Frank Act. In general, under the new rules, minimum requirements have increased for both the quantity and quality of capital held by banking organizations. Consistent with the Basel framework, the new rules include a new minimum ratio of common equity Tier 1 capital to risk-weighted assets of 4.5% and a common equity Tier 1 capital conservation buffer of 2.5% of risk-weighted assets that applies to all supervised financial institutions. The rule also raises the minimum ratio of Tier 1 capital to risk weighted assets from 4.0% to 6.0% and includes a minimum leverage ratio of 4.0% for all banking organizations. The new rules also change the methodology for calculating risk-weighted assets to enhance risk sensitivity and became effective on January 1, 2015. As of June 30, 2015, the Company and the Bank met all capital adequacy requirements to which they were subject.
The Company’s principal source of funds for dividend payments is dividends received from the Bank. Banking regulations limit the amount of dividends that may be paid without prior approval of regulatory agencies. Under these regulations, the amount of dividends that may be paid by the Bank in any calendar year is limited to the current year’s net profits combined with the retained net profits of the preceding two years, subject to the capital requirements described above.
(Continued)
F-30
Table of Contents
ALLEGIANCE BANCSHARES, INC.
CONDENSED NOTES TO INTERIM CONSOLIDATED FINANCIAL STATEMENTS
(Unaudited)
13. REGULATORY CAPITAL MATTERS (Continued)
The following is a summary of the Company’s and the Bank’s actual and required capital ratios at June 30, 2015 and December 31, 2014:
| Minimum Required For Capital Adequacy Purposes |
To Be Categorized As Well Capitalized Under Prompt Corrective Action Provisions |
Actual Ratio | ||||
| ALLEGIANCE BANCSHARES, INC. (Consolidated) |
||||||
| As of June 30, 2015 |
||||||
| Common equity Tier 1 capital (to risk weighted assets) |
4.50% | N/A | 8.68% | |||
| Leverage ratio (to average assets) |
4.00% | N/A | 9.34% | |||
| Tier 1 risk-based capital ratio (to risk weighted assets) |
6.00% | N/A | 9.88% | |||
| Total risk-based capital ratio (to risk weighted assets) |
8.00% | N/A | 10.48% | |||
| As of December 31, 2014 |
||||||
| Common equity Tier 1 capital (to risk weighted assets) |
N/A | N/A | N/A | |||
| Leverage ratio (to average assets) |
4.00% | N/A | 9.55% | |||
| Tier 1 risk-based capital ratio (to risk weighted assets) |
4.00% | N/A | 11.96% | |||
| Total risk-based capital ratio (to risk weighted assets) |
8.00% | N/A | 12.80% | |||
| Minimum Required For Capital Adequacy Purposes |
To Be Categorized As Well Capitalized Under Prompt Corrective Action Provisions |
Actual Ratio | ||||
| ALLEGIANCE BANK: |
||||||
| As of June 30, 2015 |
||||||
| Common equity Tier 1 capital (to risk weighted assets) |
4.50% | 6.50% | 10.82% | |||
| Leverage ratio (to average assets) |
4.00% | 5.00% | 10.23% | |||
| Tier 1 risk-based capital ratio (to risk weighted assets) |
6.00% | 8.00% | 10.82% | |||
| Total risk-based capital ratio (to risk weighted assets) |
8.00% | 10.00% | 11.42% | |||
| As of December 31, 2014 |
||||||
| Common equity Tier 1 capital (to risk weighted assets) |
N/A | N/A | N/A | |||
| Leverage ratio (to average assets) |
4.00% | 5.00% | 9.38% | |||
| Tier 1 risk-based capital ratio (to risk weighted assets) |
4.00% | 6.00% | 11.76% | |||
| Total risk-based capital ratio (to risk weighted assets) |
8.00% | 10.00% | 12.59% | |||
(Continued)
F-31
Table of Contents
ALLEGIANCE BANCSHARES, INC.
CONDENSED NOTES TO INTERIM CONSOLIDATED FINANCIAL STATEMENTS
(Unaudited)
14. EARNINGS PER COMMON SHARE
Diluted earnings per common share is computed using the weighted-average number of common shares determined for the basic earnings per common share computation plus the potential dilution that could occur if securities or other contracts to issue common stock were exercised or converted into common stock using the treasury stock method. Outstanding stock options issued by the Company represent the only dilutive effect reflected in diluted weighted average shares. Restricted shares are considered outstanding at the date of grant and are included in basic and diluted weighted average common shares outstanding.
| Six Months Ended June 30, | ||||||||||||||||
| 2015 | 2014 | |||||||||||||||
| (Amounts in thousands, except per share data) | ||||||||||||||||
| Amount | Per Share Amount |
Amount | Per Share Amount |
|||||||||||||
| Net income attributable to common stockholders |
$ | 6,968 | $ | 4,684 | ||||||||||||
|
|
|
|
|
|||||||||||||
| Basic: |
||||||||||||||||
| Weighted average common shares outstanding |
9,824 | $ | 0.71 | 6,969 | $ | 0.67 | ||||||||||
|
|
|
|
|
|||||||||||||
| Diluted: |
||||||||||||||||
| Add incremental shares for: |
||||||||||||||||
| Dilutive effect of stock option exercises |
177 | 154 | ||||||||||||||
|
|
|
|
|
|||||||||||||
| Total |
10,001 | $ | 0.70 | 7,123 | $ | 0.66 | ||||||||||
|
|
|
|
|
|
|
|
|
|||||||||
Stock options for 267 thousand shares and 241 thousand shares of common stock were not considered in computing diluted earnings per common share for June 30, 2015 and 2014, respectively, because they were antidilutive.
15. SUBSEQUENT EVENT
On July 15, 2015, the Company redeemed all of the outstanding shares of Series A and Series B preferred stock, for an aggregate redemption price of $11.7 million (which is the sum of the liquidation amount plus accrued and unpaid dividends up to, but excluding, the redemption date). We issued the shares of Series A and Series B preferred stock in connection with the F&M Bancshares acquisition, which had preferred stock outstanding pursuant to the U.S. Treasury’s Troubled Asset Relief Program. We funded the redemption with cash on hand.
(Continued)
F-32
Table of Contents

|
Crowe Horwath LLP
Independent Member Crowe Horwath International
REPORT OF INDEPENDENT REGISTERED PUBLIC ACCOUNTING FIRM
Board of Directors and Shareholders
Allegiance Bancshares, Inc.
Houston, Texas
We have audited the accompanying consolidated balance sheet of Allegiance Bancshares, Inc. (the “Company”) as of December 31, 2014, and the related consolidated statements of income, comprehensive income, changes in stockholders’ equity, and cash flows for the year then ended. These consolidated financial statements are the responsibility of the Company’s management. Our responsibility is to express an opinion on these consolidated financial statements based on our audit.
We conducted our audit in accordance with the standards of the Public Company Accounting Oversight Board (United States). Those standards require that we plan and perform the audit to obtain reasonable assurance about whether the financial statements are free of material misstatement. The Company is not required to have, nor were we engaged to perform, an audit of its internal control over financial reporting. Our audit included consideration of internal control over financial reporting as a basis for designing audit procedures that are appropriate in the circumstances, but not for the purpose of expressing an opinion on the effectiveness of the Company’s internal control over financial reporting. Accordingly, we express no such opinion. An audit includes examining, on a test basis, evidence supporting the amounts and disclosures in the financial statements. An audit also includes assessing the accounting principles used and significant estimates made by management, as well as evaluating the overall financial statement presentation. We believe that our audit provides a reasonable basis for our opinion.
In our opinion, the consolidated financial statements referred to above present fairly, in all material respects, the financial position of Allegiance Bancshares, Inc. as of December 31, 2014, and the results of its operations and its cash flows for the year ended December 31, 2014, in conformity with U.S. generally accepted accounting principles.

Crowe Horwath LLP
Dallas, Texas
March 23, 2015
F-33
Table of Contents

REPORT OF INDEPENDENT REGISTERED PUBLIC ACCOUNTING FIRM
To the Board of Directors and Stockholders
Allegiance Bancshares, Inc.
We have audited the accompanying balance sheet of Allegiance Bancshares, Inc. as of December 31, 2013, and the related statements of income, comprehensive income, changes in stockholders’ equity, and cash flows for the year then ended. Allegiance Bancshares, Inc.’s management is responsible for these consolidated financial statements. Our responsibility is to express an opinion on these financial statements based on our audit.
We conducted our audit in accordance with the standards of the Public Company Accounting Oversight Board (United States). Those standards require that we plan and perform the audit to obtain reasonable assurance about whether the financial statements are free of material misstatement. The company is not required to have, nor were we engaged to perform, an audit of its internal control over financial reporting. Our audit included consideration of internal control over financial reporting as a basis for designing audit procedures that are appropriate in the circumstances, but not for the purpose of expressing an opinion on the effectiveness of the company’s internal control over financial reporting. Accordingly, we express no such opinion. An audit also includes examining, on a test basis, evidence supporting the amounts and disclosures in the financial statements, assessing the accounting principles used and significant estimates made by management, as well as evaluating the overall financial statement presentation. We believe that our audit provides a reasonable basis for our opinion.
In our opinion, the financial statements referred to above present fairly, in all material respects, the consolidated financial position of Allegiance Bancshares, Inc. as of December 31, 2013 and the consolidated results of their operations and cash flows for the year then ended, in conformity with accounting principles generally accepted in the United States of America.
| Brenham, Texas March 19, 2014 |

|
304 East Blue Bell Rd. ● Brenham, Texas 77833 ● 979/836-6131 ● FAX 979/830-8131
F-34
Table of Contents
CONSOLIDATED BALANCE SHEETS
| December 31, | ||||||||
| 2014 | 2013 | |||||||
| (Dollars in thousands, except share data) | ||||||||
| ASSETS | ||||||||
| Cash and due from banks |
$ | 57,314 | $ | 63,572 | ||||
| Interest bearing deposits at other institutions |
110,226 | 149,504 | ||||||
|
|
|
|
|
|||||
| Total cash and cash equivalents |
167,540 | 213,076 | ||||||
| Available for sale securities, at fair value |
84,962 | 87,007 | ||||||
| Loans held for investment |
1,002,054 | 836,694 | ||||||
| Less: allowance for loan losses |
(8,246 | ) | (6,655 | ) | ||||
|
|
|
|
|
|||||
| Loans, net |
993,808 | 830,039 | ||||||
| Accrued interest receivable |
3,285 | 2,983 | ||||||
| Goodwill |
11,144 | 10,999 | ||||||
| Core deposit intangibles, net |
1,747 | 2,045 | ||||||
| Premises and equipment, net |
10,969 | 10,044 | ||||||
| Other real estate owned |
— | 332 | ||||||
| Federal Home Loan Bank stock |
468 | 398 | ||||||
| Other assets |
6,085 | 7,836 | ||||||
|
|
|
|
|
|||||
| TOTAL ASSETS |
$ | 1,280,008 | $ | 1,164,759 | ||||
|
|
|
|
|
|||||
| LIABILITIES AND STOCKHOLDERS’ EQUITY | ||||||||
| LIABILITIES: |
||||||||
| Deposits: |
||||||||
| Noninterest-bearing |
$ | 373,795 | $ | 325,410 | ||||
| Interest-bearing |
||||||||
| Demand |
87,806 | 63,369 | ||||||
| Money market and savings |
279,595 | 233,153 | ||||||
| Certificates and other time |
392,488 | 423,399 | ||||||
|
|
|
|
|
|||||
| Total interest-bearing deposits |
759,889 | 719,921 | ||||||
|
|
|
|
|
|||||
| Total deposits |
1,133,684 | 1,045,331 | ||||||
| Accrued interest payable |
43 | 79 | ||||||
| Other borrowed funds |
10,069 | 5,000 | ||||||
| Other liabilities |
4,434 | 4,613 | ||||||
|
|
|
|
|
|||||
| Total liabilities |
1,148,230 | 1,055,023 | ||||||
| COMMITMENTS AND CONTINGENCIES |
— | — | ||||||
| STOCKHOLDERS’ EQUITY: |
||||||||
| Preferred stock, $1 par value; 1,000,000 shares authorized; none issued or outstanding |
— | — | ||||||
| Common stock, $1 par value; 19,000,000 shares authorized; 7,477,309 issued and outstanding at December 31, 2014 and 6,964,551 shares issued and 6,953,125 shares outstanding at December 31, 2013 |
7,477 | 6,965 | ||||||
| Capital surplus |
104,568 | 93,459 | ||||||
| Retained earnings |
19,184 | 10,179 | ||||||
| Accumulated other comprehensive income (loss) |
549 | (669 | ) | |||||
| Less treasury stock, at cost, 11,426 shares outstanding at December 31, 2013. There were no treasury shares at December 31, 2014. |
— | (198 | ) | |||||
|
|
|
|
|
|||||
| Total stockholders’ equity |
131,778 | 109,736 | ||||||
|
|
|
|
|
|||||
| TOTAL LIABILITIES AND STOCKHOLDERS’ EQUITY |
$ | 1,280,008 | $ | 1,164,759 | ||||
|
|
|
|
|
|||||
See notes to consolidated financial statements.
F-35
Table of Contents
CONSOLIDATED STATEMENTS OF INCOME
| For the Years Ended December 31, | ||||||||||
| 2014 | 2013 | |||||||||
| (Dollars in thousands, except per share data) | ||||||||||
| INTEREST INCOME: |
||||||||||
| Loans, including fees |
$ | 50,243 | $ | 36,960 | ||||||
| Securities: |
||||||||||
| Taxable |
1,435 | 957 | ||||||||
| Tax-exempt |
416 | 69 | ||||||||
| Deposits in other financial institutions |
311 | 352 | ||||||||
|
|
|
|
|
|||||||
| Total interest income |
52,405 | 38,338 | ||||||||
|
|
|
|
|
|||||||
| INTEREST EXPENSE: |
||||||||||
| Demand, money market and savings deposits |
1,261 | 1,236 | ||||||||
| Certificates and other time deposits |
4,081 | 3,196 | ||||||||
| Other borrowed funds |
229 | 15 | ||||||||
|
|
|
|
|
|||||||
| Total interest expense |
5,571 | 4,447 | ||||||||
|
|
|
|
|
|||||||
| NET INTEREST INCOME |
46,834 | 33,891 | ||||||||
| PROVISION FOR LOAN LOSSES |
2,150 | 240 | ||||||||
|
|
|
|
|
|||||||
| NET INTEREST INCOME AFTER PROVISION FOR LOAN LOSSES |
44,684 | 33,651 | ||||||||
|
|
|
|
|
|||||||
| NONINTEREST INCOME: |
||||||||||
| Nonsufficient funds (NSF) fees |
455 | 331 | ||||||||
| Service charges on deposit accounts |
490 | 329 | ||||||||
| Gains on sales of other real estate |
188 | 201 | ||||||||
| Other |
1,474 | 778 | ||||||||
|
|
|
|
|
|||||||
| Total noninterest income |
2,607 | 1,639 | ||||||||
|
|
|
|
|
|||||||
| NONINTEREST EXPENSE: |
||||||||||
| Salaries and employee benefits |
20,179 | 15,371 | ||||||||
| Net occupancy and equipment |
3,316 | 2,420 | ||||||||
| Data processing and software amortization |
1,658 | 1,202 | ||||||||
| Professional fees |
2,294 | 1,681 | ||||||||
| Regulatory assessments and FDIC insurance |
848 | 602 | ||||||||
| Core deposit intangibles amortization |
298 | 37 | ||||||||
| Depreciation |
1,084 | 813 | ||||||||
| Communications |
684 | 432 | ||||||||
| Advertising |
601 | 582 | ||||||||
| Other real estate expense |
6 | 86 | ||||||||
| Other |
2,490 | 1,372 | ||||||||
|
|
|
|
|
|||||||
| Total noninterest expense |
33,458 | 24,598 | ||||||||
|
|
|
|
|
|||||||
| INCOME BEFORE INCOME TAXES |
13,833 | 10,692 | ||||||||
| PROVISION FOR INCOME TAXES |
4,828 | 3,853 | ||||||||
|
|
|
|
|
|||||||
| NET INCOME |
$ | 9,005 | $ | 6,839 | ||||||
|
|
|
|
|
|||||||
| EARNINGS PER SHARE: |
||||||||||
| Basic |
$ | 1.29 | $ | 1.25 | ||||||
|
|
|
|
|
|||||||
| Diluted |
$ | 1.26 | $ | 1.22 | ||||||
|
|
|
|
|
|||||||
See notes to consolidated financial statements.
F-36
Table of Contents
CONSOLIDATED STATEMENTS OF COMPREHENSIVE INCOME
| For the Years Ended December 31, |
||||||||
| 2014 | 2013 | |||||||
| (Dollars in thousands) | ||||||||
| Net income |
$ | 9,005 | $ | 6,839 | ||||
| Other comprehensive income (loss), before tax: |
||||||||
| Unrealized gain (loss) on securities: |
||||||||
| Change in unrealized holding gains (losses) on available for sale securities during the period |
1,928 | (1,888 | ) | |||||
| Reclassification of amount realized through the sale of securities |
(82 | ) | — | |||||
|
|
|
|
|
|||||
| Total other comprehensive income (loss) |
1,846 | (1,888 | ) | |||||
| Deferred tax (expense) benefit related to other comprehensive income |
(628 | ) | 642 | |||||
|
|
|
|
|
|||||
| Other comprehensive income (loss), net of tax |
1,218 | (1,246 | ) | |||||
|
|
|
|
|
|||||
| Comprehensive income |
$ | 10,223 | $ | 5,593 | ||||
|
|
|
|
|
|||||
See notes to consolidated financial statements.
F-37
Table of Contents
CONSOLIDATED STATEMENTS OF CHANGES IN STOCKHOLDERS’ EQUITY
|
Common Stock |
Capital Surplus |
Retained Earnings |
Accumulated Other Comprehensive Income (Loss) |
Treasury Stock |
Total Stockholders’ Equity | ||||||||||||||||||||||||||||||
| Shares | Amount | ||||||||||||||||||||||||||||||||||
| (In thousands, except share data) | |||||||||||||||||||||||||||||||||||
| BALANCE AT DECEMBER 31, 2012 |
5,191,100 | $ | 5,191 | $ | 59,120 | $ | 3,340 | $ | 577 | $ | (144 | ) | $ | 68,084 | |||||||||||||||||||||
| Net income |
6,839 | 6,839 | |||||||||||||||||||||||||||||||||
| Other comprehensive loss |
(1,246 | ) | (1,246 | ) | |||||||||||||||||||||||||||||||
| Common stock issued in connection with the exercise of stock options and restricted stock awards |
21,084 | 21 | 10 | 31 | |||||||||||||||||||||||||||||||
| Issuance of common shares |
887,644 | 888 | 16,915 | 17,803 | |||||||||||||||||||||||||||||||
| Common stock issued in connection with the acquisition of Independence Bank |
864,723 | 865 | 17,039 | 17,904 | |||||||||||||||||||||||||||||||
| Purchase of treasury stock |
(54 | ) | (54 | ) | |||||||||||||||||||||||||||||||
| Stock based compensation expense |
375 | 375 | |||||||||||||||||||||||||||||||||
|
|
|
|
|
|
|
|
|
|
|
|
|
|
|
||||||||||||||||||||||
| BALANCE AT DECEMBER 31, 2013 |
6,964,551 | 6,965 | 93,459 | 10,179 | (669 | ) | (198 | ) | 109,736 | ||||||||||||||||||||||||||
| Net income |
9,005 | 9,005 | |||||||||||||||||||||||||||||||||
| Other comprehensive income |
1,218 | 1,218 | |||||||||||||||||||||||||||||||||
| Common stock issued in connection with the exercise of stock options, restricted stock awards and the Employee Stock Purchase Plan (“ESPP”) |
36,566 | 36 | 378 | 198 | 612 | ||||||||||||||||||||||||||||||
| Issuance of common shares |
476,192 | 476 | 10,000 | 10,476 | |||||||||||||||||||||||||||||||
| Stock based compensation expense |
731 | 731 | |||||||||||||||||||||||||||||||||
|
|
|
|
|
|
|
|
|
|
|
|
|
|
|
||||||||||||||||||||||
| BALANCE AT DECEMBER 31, 2014 |
7,477,309 | $ | 7,477 | $ | 104,568 | $ | 19,184 | $ | 549 | $ | — | $ | 131,778 | ||||||||||||||||||||||
|
|
|
|
|
|
|
|
|
|
|
|
|
|
|
||||||||||||||||||||||
See notes to consolidated financial statements.
F-38
Table of Contents
CONSOLIDATED STATEMENTS OF CASH FLOWS
| For the Years Ended December 31, | ||||||||||
| 2014 | 2013 | |||||||||
| (Dollars in thousands) | ||||||||||
| CASH FLOWS FROM OPERATING ACTIVITIES: |
||||||||||
| Net income |
$ | 9,005 | $ | 6,839 | ||||||
| Adjustments to reconcile net income to net cash provided by operating activities: |
||||||||||
| Depreciation and core deposit intangibles amortization |
1,382 | 916 | ||||||||
| Gain on sale of securities |
(82 | ) | — | |||||||
| Provision for credit losses |
2,150 | 240 | ||||||||
| Deferred income tax expense |
277 | (157 | ) | |||||||
| Net amortization of premium on investments |
710 | 643 | ||||||||
| Net gain on sale or write down of premises, equipment and other real estate |
(102 | ) | (190 | ) | ||||||
| Stock based compensation expense |
731 | 375 | ||||||||
| Decrease (increase) in accrued interest receivable and other assets |
329 | (587 | ) | |||||||
| (Decrease) increase in accrued interest payable and other liabilities |
(215 | ) | 1,914 | |||||||
|
|
|
|
|
|||||||
| Net cash provided by operating activities |
14,185 | 9,993 | ||||||||
|
|
|
|
|
|||||||
| CASH FLOWS FROM INVESTING ACTIVITIES: |
||||||||||
| Proceeds from maturities and principal paydowns of available for sale securities |
1,400,243 | 1,002,640 | ||||||||
| Proceeds from sales of available for sale securities |
1,941 | — | ||||||||
| Purchase of available for sale securities |
(1,398,921 | ) | (1,011,438 | ) | ||||||
| Net increase in loans held for investment |
(165,919 | ) | (130,208 | ) | ||||||
| Purchase of bank premises and equipment |
(2,095 | ) | (505 | ) | ||||||
| Proceeds from sale of bank premises, equipment and other real estate |
520 | 1,229 | ||||||||
| Net cash and cash equivalents acquired in the purchase of Independence Bank |
— | 25,951 | ||||||||
|
|
|
|
|
|||||||
| Net cash used in investing activities |
(164,231 | ) | (112,331 | ) | ||||||
|
|
|
|
|
|||||||
| CASH FLOWS FROM FINANCING ACTIVITIES: |
||||||||||
| Net increase in noninterest-bearing deposits |
48,385 | 65,489 | ||||||||
| Net increase in interest-bearing deposits |
39,968 | 75,455 | ||||||||
| Paydowns of long-term borrowings |
(10,000 | ) | — | |||||||
| Net proceeds from long-term borrowings |
15,069 | 5,000 | ||||||||
| Proceeds from common stock offering |
10,476 | 17,802 | ||||||||
| Proceeds from stock option exercises, restricted stock awards and the ESPP |
612 | 31 | ||||||||
| Purchase of treasury stock |
— | (54 | ) | |||||||
|
|
|
|
|
|||||||
| Net cash provided by financing activities |
104,510 | 163,723 | ||||||||
|
|
|
|
|
|||||||
| NET CHANGE IN CASH AND CASH EQUIVALENTS |
(45,536 | ) | 61,385 | |||||||
| CASH AND CASH EQUIVALENTS, BEGINNING OF PERIOD |
213,076 | 151,691 | ||||||||
|
|
|
|
|
|||||||
| CASH AND CASH EQUIVALENTS, END OF PERIOD |
$ | 167,540 | $ | 213,076 | ||||||
|
|
|
|
|
|||||||
| NONCASH ACTIVITIES: |
||||||||||
| Stock issued in connection with the Independence Bank acquisition (See Footnote 2-Acquisitions) |
$ | — | $ | 17,904 | ||||||
| Acquisition of real estate through foreclosure of collateral |
— | 2,792 | ||||||||
| SUPPLEMENTAL INFORMATION: |
||||||||||
| Income taxes paid |
$ | 4,900 | $ | 3,850 | ||||||
| Interest paid |
6,039 | 4,447 | ||||||||
See notes to consolidated financial statements.
F-39
Table of Contents
ALLEGIANCE BANCSHARES, INC.
NOTES TO CONSOLIDATED FINANCIAL STATEMENTS
1. NATURE OF OPERATIONS AND SUMMARY OF SIGNIFICANT ACCOUNTING AND REPORTING POLICIES
Nature of Operations—Allegiance Bancshares, Inc. (“Allegiance”) and its subsidiary, Allegiance Bank Texas (the “Bank”, and together with Allegiance, collectively referred to as the “Company”) provide commercial and retail loans and commercial banking services. The Company derives substantially all of its revenues and income from the operation of the Bank.
Allegiance Bank is a Texas banking association which began operations in October of 2007. The Company is focused on delivering a wide variety of relationship-driven commercial banking products and community-oriented services tailored to meet the needs of small to mid-sized businesses, professionals and individuals through its 11 offices in Houston, Texas and the surrounding region. The Bank provides its customers with a variety of banking services including checking accounts, savings accounts and certificates of deposit and its primary lending products are commercial, personal, automobile, mortgage and home improvement loans. The Bank also offers safe deposit boxes, automated teller machines, drive-through services and 24-hour depository facilities.
Principles of consolidation—The consolidated financial statements include the accounts of Allegiance Bancshares, Inc. and its wholly-owned subsidiary, Allegiance Bank Texas, after elimination of all intercompany transactions and balances.
Subsequent Events—The Company has evaluated subsequent events for recognition and disclosure through March 23, 2015, which was the date the financial statements were available to be issued.
Use of Estimates—The preparation of financial statements in conformity with accounting principles generally accepted in the United States of America requires management to make estimates and assumptions based on available information. These estimates and assumptions affect the reporting of assets and liabilities and disclosure of contingent assets and liabilities at the date of the financial statements and the reported amounts of revenues and expenses during the reporting period. Actual results could differ from those estimates.
Cash and cash equivalents—Cash and cash equivalents include cash, deposits with other financial institutions with maturities not greater than one year. Net cash flows are reported for customer loan and deposit transactions.
Securities—Debt securities are classified as available for sale when they might be sold before maturity. Equity securities with readily determinable fair values are classified as available for sale. Securities available for sale are carried at fair value. Unrealized gains and losses are excluded from earnings and reported, net of tax, as a separate component of stockholders’ equity until realized. Securities within the available for sale portfolio may be used as part of the Company’s asset/liability strategy and may be sold in response to changes in interest rate risk, prepayment risk or other similar economic factors.
Interest earned on these assets is included in interest income. Interest income includes amortization of purchase premium or discount. Premiums and discounts on securities are amortized on the level-yield method, except for mortgage backed securities where prepayments are anticipated. Gains and losses on sales are recorded on the trade date and determined using the specific identification method.
(Continued)
F-40
Table of Contents
ALLEGIANCE BANCSHARES, INC.
NOTES TO CONSOLIDATED FINANCIAL STATEMENTS
1. NATURE OF OPERATIONS AND SUMMARY OF SIGNIFICANT ACCOUNTING AND REPORTING POLICIES (Continued)
Management evaluates debt securities for other-than-temporary impairment (“OTTI”) on at least a quarterly basis, and more frequently when economic or market conditions warrant such an evaluation. For securities in an unrealized loss position, management considers the extent and duration of the unrealized loss, and the financial condition and near-term prospects of the issuer. Management also assesses whether it intends to sell, or it is more likely than not that it will be required to sell, a security in an unrealized loss position before recovery of its amortized cost basis. If either of the criteria regarding intent or requirement to sell is met, the entire difference between amortized cost and fair value is recognized as impairment through earnings. For debt securities that do not meet the aforementioned criteria, the amount of impairment is split into two components as follows: 1) OTTI related to credit loss, which must be recognized in the income statement and 2) OTTI related to other factors, which is recognized in other comprehensive income, net of applicable taxes. The credit loss is defined as the difference between the present value of the cash flows expected to be collected and the amortized cost basis. The previous amortized cost bases less the OTTI recognized in earnings shall become the new amortized cost basis of the security.
Loans Held for Investment—Loans held for investment are those that management has the intent and ability to hold for the foreseeable future or until maturity or payoff are reported at the principal balance outstanding, net of deferred loan fees and costs, and an allowance for loan losses. Loans are typically secured by specific items of collateral including business assets, consumer assets, and commercial and residential real estate. Commercial loans are expected to be repaid from cash flow from operations of businesses. Interest income is accrued on the unpaid principal balance.
Nonrefundable Fees and Costs Associated with Lending Activities—Loan commitment and loan origination fees, net of certain direct origination costs, are deferred and recognized in interest income as an adjustment to yield without anticipating prepayments using the interest method over the related loan life or; if the commitment expires unexercised, balances are recognized in income upon expiration of the commitment.
Nonperforming and Past Due Loans—The Company has several procedures in place to assist it in maintaining the overall quality of its loan portfolio. The Company has established underwriting guidelines to be followed by its officers, and monitors its delinquency levels for any negative or adverse trends. There can be no assurance, however, that the Company’s loan portfolio will not become subject to increasing pressures from deteriorating borrower credit due to general economic conditions.
Past due status is based on the contractual terms of the loan. Loans are considered past due if the required principal and interest payments have not been received as of the date such payments were due. The Company generally classifies a loan as nonperforming, automatically places the loan on nonaccrual status, ceases accruing interest and reverses all unpaid accrued interest against interest income, when, in management’s opinion, the borrower may be unable to meet payment obligations, when the payment of principal or interest on a loan is delinquent for 90 days, as well as when required by regulatory provisions, unless the loan is in the process of collection and the underlying collateral fully supports the carrying value of the loan. Any payments received on nonaccrual loans are applied first to outstanding loan amounts. Interest income is subsequently recognized only to the extent cash payments are received in excess of principal due. Any excess is treated as recovery of lost interest. Loans are returned to accrual status when all of the principal and interest amounts contractually due are brought current and future payments are reasonably assured.
(Continued)
F-41
Table of Contents
ALLEGIANCE BANCSHARES, INC.
NOTES TO CONSOLIDATED FINANCIAL STATEMENTS
1. NATURE OF OPERATIONS AND SUMMARY OF SIGNIFICANT ACCOUNTING AND REPORTING POLICIES (Continued)
In all cases, loans are placed on nonaccrual or charged-off at an earlier date if collection of principal or interest is considered doubtful. If the decision is made to continue accruing interest on the loan, periodic reviews are made to confirm the accruing status of the loan. Nonaccrual loans and loans past due 90 days include both smaller balance homogeneous loans that are collectively evaluated for impairment and individually classified impaired loans. When available information confirms that specific loans, or portions thereof, are uncollectible, these amounts are charged off against the allowance. All loan types are considered delinquent after 30 days past due and are typically charged off no later than 120 days past due, with consideration of the following guidelines in determining the need and ultimate timing of the charge-off: 1) the Bank is in the process of repossession and there appears to be a likely deficiency, 2) the collateral securing the loan has been sold and there is an actual deficiency, 3) the Bank is proceeding with lengthy legal action to collect its balance, 4) the borrower has left the service area and is unable to be located, or 5) the borrower has filed bankruptcy and the Bank is either in an unsecured or weak collateral position. Confirming events requiring charge-offs occur when a shortfall is identified between the recorded investment in the loan and the underlying value of the collateral on a collateral dependent loan.
Troubled debt restructurings (TDRs)—Loans on which terms have been modified resulting in a concession granted because of a borrower’s financial difficulty are considered troubled debt restructurings and classified as impaired. The restructuring of a loan is considered a troubled debt restructuring if both (i) the borrower is experiencing financial difficulties and (ii) the creditor has granted a concession that is would not otherwise consider. Concessions may include reductions of interest rates to a below market interest rate: extension of the terms of the debt, principal forgiveness, restructuring the payment of the debt obligation; and other actions intended to minimize potential losses. Subsequent to identification as a troubled debt restructuring such loans are then evaluated for impairment on an individual basis whereby the loans are measured at the present value of estimated future cash flows using the loan’s effective rate at inception. If a troubled debt restructuring is considered to be a collateral dependent loan: the loan is reported, net, at the fair value of the collateral.
Impaired Loans—On a continuous basis, loans are evaluated for impairment classification. Loans are considered impaired when based on current information and events, it is probable the Company will be unable to collect all amounts due in accordance with the original contractual terms of the loan agreement including scheduled principal and interest payments. Impairment is evaluated in total for smaller-balance loans of a similar nature and on an individual loan basis for other loans. If a loan is impaired, a specific valuation allowance is allocated, if necessary, so that the loan is reported net, at the present value of estimated future cash flows using the loan’s existing rate or at the fair value of collateral if repayment is expected solely from the collateral. Factors considered by management in determining impairment include payment status, collateral value, and the probability of collecting scheduled principal and interest payments when due. Loans that experience insignificant payment delays and payment shortfalls generally are not classified as impaired. Management determines the significance of payment delays and payment shortfalls on case-by-case basis taking into consideration all of the circumstances surrounding the loan and the borrower including the length of the delay, the reasons for the delay, the borrower’s prior payment record, and the amount of the shortfall in relation to the principal and interest owed.
Allowance for Loan Losses—The allowance for loan losses is a valuation allowance that is established through charges to earnings in the form of a provision for loan losses. The amount of the allowance for loan losses is
(Continued)
F-42
Table of Contents
ALLEGIANCE BANCSHARES, INC.
NOTES TO CONSOLIDATED FINANCIAL STATEMENTS
1. NATURE OF OPERATIONS AND SUMMARY OF SIGNIFICANT ACCOUNTING AND REPORTING POLICIES (Continued)
affected by the following: (i) charge-off of loans that decrease the allowance, (ii) subsequent recoveries on loans previously charged off that increase the allowance and (iii) provisions for loan losses charged to earnings that increase the allowance.
Throughout the year, management estimates the probable incurred losses in the loan portfolio to determine if the allowance for loan losses is adequate to absorb such losses. The allowance for loan losses consists of specific and general components. The specific component relates to loans that are individually classified as impaired. The Company follows a loan review program to evaluate the credit risk in the loan portfolio. Loans that have been identified as impaired are reviewed on a quarterly basis in order to determine whether a specific reserve is required. The general component covers non-impaired loans and is based on industry and Company specific historical loan loss experience, volume, growth and composition of the loan portfolio, the evaluation of the Company’s loan portfolio through its internal loan review process, general current economic conditions both internal and external to the Company that may affect the borrower’s ability to pay, value of collateral and other qualitative relevant risk factors. Based on a review of these estimates, the allowance for loan losses is adjusted to a level determined to be adequate. Estimates of loan losses are inherently subjective as it involves an exercise of judgment. It is the judgment of management that the allowance for loan losses reflected in the consolidated balance sheets is adequate to absorb probable losses that exist in the loan portfolio as of the reporting date.
For troubled debt restructurings that subsequently default, the Company determines the amount of reserve in accordance with the accounting policy for the allowance for loan losses. We assesses the exposure for each modification, either by collateral discounting or by calculation of the present value of future cash flows, and determines if a specific allocation to the allowance for loan losses is needed. Once an obligation has been restructured because of such credit problems, it continues to be considered a troubled debt restructuring until paid in full; or, if an obligation yields a market interest rate and no longer has any concession regarding payment amount or amortization, then it is not considered a troubled debt restructuring at the beginning of the calendar year after the year in which the improvement takes place. We return troubled debt restructurings to accrual status only if (1) all contractual amounts due can reasonably be expected to be repaid within a prudent period, and (2) repayment has been in accordance with the contract for a sustained period, typically at least twelve months.
Loans acquired in business combinations are initially recorded at fair value, which includes an estimate of loan losses expected to be realized over the remaining lives of the loans. Therefore no corresponding allowance for loan losses is recorded for these loans at acquisition. Methods utilized to estimate any subsequently required allowance for loan losses for acquired loans not deemed credit-impaired at acquisition are similar to originated loans. However, the estimate of loss is based on the unpaid principal balance and then compared to any remaining unaccreted purchase discount. To the extent that the calculated loss is greater than the remaining unaccreted purchase discount, an allowance is recorded for such difference.
Premises and Equipment—Premises and equipment are carried at cost less accumulated depreciation. Depreciation expense is calculated principally using the straight-line method over the estimated useful lives of the assets which range from 3 to 40 years. Leasehold improvements are amortized using the straight-line method over the periods of the leases or the estimated useful lives, whichever is shorter. Land is carried at cost.
(Continued)
F-43
Table of Contents
ALLEGIANCE BANCSHARES, INC.
NOTES TO CONSOLIDATED FINANCIAL STATEMENTS
1. NATURE OF OPERATIONS AND SUMMARY OF SIGNIFICANT ACCOUNTING AND REPORTING POLICIES (Continued)
Other Real Estate Owned—Assets acquired through or instead of loan foreclosure are held for sale and are initially recorded at fair value less estimated selling costs when acquired, establishing a new cost basis. Costs after acquisition are generally expensed. If the fair value of the asset declines, a write-down is recorded through expense. The valuation of foreclosed assets is subjective in nature and may be adjusted in the future because of changes in economic conditions.
Federal Home Loan Bank (“FHLB”) Stock—The Bank is a member of the FHLB system. Members are required to own a certain amount of stock based on the level of borrowings and other factors and may invest in additional amounts. FHLB stock is carried at cost, classified as a restricted security, and periodically evaluated for impairment based on ultimate recovery of par value. Both cash and stock dividends are reported as income.
Goodwill—Goodwill resulting from business combinations is generally determined as the excess of the fair value of the consideration transferred, plus the fair value of any noncontrolling interests in the acquiree, over the fair value of the net assets acquired and liabilities assumed as of the acquisition date. Goodwill is assessed annually for impairment or when events or changes in circumstances indicate that the carrying amount of the asset may not be recoverable.
Goodwill acquired in a purchase business combination that is determined to have an indefinite useful life, is not amortized, but tested for impairment at least annually or more frequently if events and circumstances exists that indicate that a goodwill impairment test should be performed. The Company performs its annual impairment test on October 1st. Goodwill is the only intangible asset with an indefinite life on the Company’s balance sheet.
Amortization of Core Deposit Intangibles—Core deposit and acquired customer relationship intangibles arising from acquisitions are amortized using a straight-line amortization method over their estimated useful lives, which is 7 years.
Long-term borrowings—The Company has a borrowing agreement with another financial institution. The Company pledged its shares in the Bank’s stock as collateral for the borrowing.
Loan Commitments and Related Financial Instruments—Financial instruments include off-balance sheet credit instruments, such as commitments to extend credit, issued to meet customer financing needs. The face amount for these items represents the exposure to loss before considering customer collateral or ability to repay. Such financial instruments are recorded when they are funded.
Income Taxes—Income tax expense is the total of the current year income tax due and the change in deferred tax assets or liabilities. Deferred tax assets and liabilities are recognized for the estimated tax consequences attributable to differences between the financial statement carrying amounts of existing assets and liabilities and their respective tax bases and are recorded in other assets on the Company’s consolidated balance sheets.
The Company records uncertain tax positions on the basis of a two-step process whereby (1) the Company determines whether it is more likely than not that the tax positions will be sustained on the basis of the technical merits of the position and (2) for those tax positions that meet the more likely than not recognition threshold, the
(Continued)
F-44
Table of Contents
ALLEGIANCE BANCSHARES, INC.
NOTES TO CONSOLIDATED FINANCIAL STATEMENTS
1. NATURE OF OPERATIONS AND SUMMARY OF SIGNIFICANT ACCOUNTING AND REPORTING POLICIES (Continued)
Company recognizes the largest amount of tax benefit that is greater than 50 percent likely of being realized upon ultimate settlement with the related tax authority. For tax positions not meeting the more likely than not test, no tax benefit is recorded.
The Company files a consolidated federal income tax return.
Stock-Based Compensation—Compensation cost is recognized for stock options and restricted stock awards issued to employees, based on the fair value of these awards at the date of grant. The expense associated with stock-based compensation is recognized over the required service period, generally defined as the vesting period of each individual arrangement. For awards with graded vesting, compensation cost is recognized on a straight-line basis over the requisite service period for the entire award.
The fair value of stock options granted is estimated at the date of grant using the Black-Scholes option-pricing model and the market price of the Company’s common stock on the date of grant is used to value restricted stock awards.
Comprehensive income—Comprehensive income consists of net income and other comprehensive income which includes unrealized gains and losses on securities available for sale which are also recognized as separate components of equity.
Fair Value of Financial Instruments—Fair values of financial instruments are estimated using relevant market information and other assumptions, as more fully disclosed in a separate note. Fair value estimates involve uncertainties and matters of significant judgment regarding interest rates, credit risk, prepayments, and other factors, especially in the absence of broad markets for particular items. Changes in assumptions or in market conditions could significantly affect these estimates.
Operating Segments—While management monitors the revenue streams of the various products and services, operations are managed and financial performance is evaluated on a Company-wide basis. All of the financial service operations are considered by management to be aggregated in one reportable operating segment.
Reclassifications—Some items in the prior year financial statements were reclassified to conform to the current presentation. Reclassifications in 2013 did not impact net income or stockholders’ equity. The Company recorded measurement period adjustments to goodwill related to a previous acquisition as noted in Note 3—Goodwill and Core Deposit Intangibles.
Earnings per Common Share—Basic earnings per common share is calculated as net income divided by the weighted average number of common shares outstanding during the period. Diluted earnings per common share includes the dilutive effect of additional potential common shares issuable under stock options.
Loss Contingencies—Loss contingencies, including claims and legal actions arising in the ordinary course of business, are recorded as liabilities when the likelihood of loss is probable and an amount or range of loss can be reasonably estimated. Management does not believe there are such matters that will have a material effect on the financial statements.
(Continued)
F-45
Table of Contents
ALLEGIANCE BANCSHARES, INC.
NOTES TO CONSOLIDATED FINANCIAL STATEMENTS
1. NATURE OF OPERATIONS AND SUMMARY OF SIGNIFICANT ACCOUNTING AND REPORTING POLICIES (Continued)
Dividend Restrictions—Banking regulations require maintaining certain capital levels and may limit the dividends paid by the Bank to Allegiance or by Allegiance to its shareholders.
New Accounting Standards
Accounting Standards Updates (“ASU”)
ASU 2014-09 “Revenue from Contract with Customers (Topic 606).” ASU 2014-09 supersedes the revenue recognition requirements in Revenue Recognition (Topic 605), and most industry-specific guidance throughout the Industry Topics of the Codification. The core principle of ASU 2014-09 is that an entity should recognize revenue to depict the transfer of promised goods or services to customers in an amount that reflects the consideration to which the entity expects to be entitled in exchange for those goods or services. ASU 2014-09 is effective for the Company beginning after January 1, 2017 with retrospective application to each prior reporting period presented. The Company is still evaluating the potential impact on the Company’s financial statements.
ASU 2014-04 “Receivables—Troubled Debt Restructurings by Creditors (Subtopic 310-40)—Reclassification of Residential Real Estate Collateralized Consumer Mortgage Loans upon Foreclosure.” ASU 2014-04 intends to reduce diversity by clarifying when an in substance repossession or foreclosure occurs that is when a creditor should be considered to have received physical possession of residential real estate property collateralizing a consumer mortgage loan such that the loan receivable should be derecognized and the real estate property recognized. ASU 2014-04 became effective for the Company on January 1, 2015 and did not have a material impact on the Company’s financial statements.
2. ACQUISITIONS
Acquisitions are accounted for using the acquisition method of accounting. Accordingly, the assets and liabilities of an acquired entity are recorded at its fair value at the acquisition date. The excess of the purchase price over the estimated fair value of the net assets is recorded as goodwill, none of which is deductible for tax purposes. The results of operations for an acquisition have been included in the Company’s consolidated financial results beginning on the respective acquisition date.
The measurement period for the Company to determine the fair values of acquired identifiable assets and assumed liabilities will end at the earlier of (i) twelve months from the date of the acquisition or (ii) as soon as the Company receives the information it was seeking about facts and circumstances that existed as of the acquisition date or learns that more information is not obtainable. The following acquisition was completed on the date indicated:
2013 Acquisition
Acquisition of Independence Bank, N.A.—On November 15, 2013, the Company completed the acquisition of Independence Bank, N.A. (“Independence Bank”). Independence Bank operated 3 banking offices in Houston, Texas. The Company acquired Independence Bank to increase its market share in the Houston, Texas area, enhance its SBA lending capabilities, expand its commercial lending team and solidify its mortgage warehouse program.
(Continued)
F-46
Table of Contents
ALLEGIANCE BANCSHARES, INC.
NOTES TO CONSOLIDATED FINANCIAL STATEMENTS
2. ACQUISITIONS (Continued)
Under the terms of the acquisition agreement, the Company issued 864,723 shares of Company common stock, converted existing options to purchase shares in Independence Bank to options in the Company’s stock and paid $17.3 million in cash for all outstanding shares of Independence Bank common stock, warrants and options.
As of December 31, 2013, the following table summarizes the allocation of the purchase price to assets and liabilities acquired on November 15, 2013 (dollars in thousands):
| Fair value of consideration paid: |
||||
| Common stock issued and options issued |
$ | 17,904 | ||
| Cash |
17,336 | |||
|
|
|
|||
| Total consideration paid |
$ | 35,240 | ||
|
|
|
|||
| Fair value of assets acquired: |
||||
| Cash and cash equivalents |
$ | 43,287 | ||
| Securities |
43,812 | |||
| Loans held for investment |
132,167 | |||
| Premises and equipment |
589 | |||
| Core deposit intangibles |
2,082 | |||
| Other assets |
3,053 | |||
|
|
|
|||
| Total assets acquired |
224,990 | |||
|
|
|
|||
| Fair value of liabilities assumed: |
||||
| Deposits |
200,309 | |||
| Other liabilities |
440 | |||
|
|
|
|||
| Total liabilities assumed |
200,749 | |||
|
|
|
|||
| Fair value of net assets acquired |
$ | 24,241 | ||
|
|
|
|||
| Goodwill resulting from acquisition |
$ | 10,999 | ||
|
|
|
As of December 31, 2014 and 2013, total goodwill related to the Independence Bank acquisition was $11.1 million and $11.0 million, respectively. Goodwill resulted from a combination of expected operational synergies, an enhanced branching network, and cross-selling opportunities. Goodwill is not expected to be deductible for tax purposes.
(Continued)
F-47
Table of Contents
ALLEGIANCE BANCSHARES, INC.
NOTES TO CONSOLIDATED FINANCIAL STATEMENTS
3. GOODWILL AND CORE DEPOSIT INTANGIBLES
Changes in the carrying amount of the Company’s goodwill and core deposit intangibles for 2014 and 2013 were as follows:
| Goodwill | Core Deposit Intangibles |
|||||||
| (Dollars in thousands) | ||||||||
| Balance as of December 31, 2012 |
$ | — | $ | — | ||||
| Acquisition of Independence Bank |
10,999 | 2,082 | ||||||
| Amortization |
— | (37 | ) | |||||
|
|
|
|
|
|||||
| Balance as of December 31, 2013 |
10,999 | 2,045 | ||||||
| Measurement period adjustment |
145 | — | ||||||
| Amortization |
— | (298 | ) | |||||
|
|
|
|
|
|||||
| Balance as of December 31, 2014 |
$ | 11,144 | $ | 1,747 | ||||
|
|
|
|
|
|||||
Goodwill is recorded on the acquisition date of an entity. The Company may record subsequent adjustments to goodwill for provisional amounts recorded at the acquisition date. There was a $145 thousand measurement period adjustment recorded during 2014 related to the Independence Bank acquisition.
At October 1, 2014, the Company elected to perform a quantitative (Step 1) goodwill assessment. Step 1 assessment includes the determination of the carrying value of the reporting unit, including the existing goodwill and intangible assets, and estimating the fair value of the reporting unit. The quantitative assessment indicated that the fair value of the reporting unit exceeded its carrying value, resulting in no impairment.
The estimated aggregate future amortization expense for core deposit intangibles remaining as of December 31, 2014 is as follows (dollars in thousands):
| 2015 |
$ | 297 | ||
| 2016 |
297 | |||
| 2017 |
297 | |||
| 2018 |
297 | |||
| 2019 |
297 | |||
| Thereafter |
262 | |||
|
|
|
|||
| Total |
$ | 1,747 | ||
|
|
|
4. CASH AND DUE FROM BANKS
The Bank is required by the Federal Reserve Bank of Dallas to maintain average reserve balances. “Cash and due from banks” in the consolidated balance sheets includes restricted amounts of $27.4 million and $20.3 million at December 31, 2014 and 2013, respectively.
(Continued)
F-48
Table of Contents
ALLEGIANCE BANCSHARES, INC.
NOTES TO CONSOLIDATED FINANCIAL STATEMENTS
5. SECURITIES
The amortized cost and fair value of investment securities were as follows (dollars in thousands):
| December 31, 2014 | ||||||||||||||||
| Amortized Cost |
Gross Unrealized Gains |
Gross Unrealized Losses |
Fair Value |
|||||||||||||
| (Dollars in thousands) | ||||||||||||||||
| Available for Sale |
||||||||||||||||
| U.S. Government and agency securities |
$ | 14,080 | $ | 442 | $ | (45 | ) | $ | 14,477 | |||||||
| Municipal securities |
35,272 | 283 | (74 | ) | 35,481 | |||||||||||
| Agency mortgage-backed pass-through securities |
32,191 | 472 | (188 | ) | 32,475 | |||||||||||
| Agency collateralized mortgage obligations |
2,587 | 21 | (79 | ) | 2,529 | |||||||||||
|
|
|
|
|
|
|
|
|
|||||||||
| Total |
$ | 84,130 | $ | 1,218 | $ | (386 | ) | $ | 84,962 | |||||||
|
|
|
|
|
|
|
|
|
|||||||||
| December 31, 2013 | ||||||||||||||||
| Amortized Cost |
Gross Unrealized Gains |
Gross Unrealized Losses |
Fair Value |
|||||||||||||
| (Dollars in thousands) | ||||||||||||||||
| Available for Sale |
||||||||||||||||
| U.S. Treasury securities |
$ | 1,848 | $ | — | $ | (44 | ) | $ | 1,804 | |||||||
| U.S. Government and agency securities |
14,397 | 30 | (264 | ) | 14,163 | |||||||||||
| Municipal securities |
30,337 | 4 | (94 | ) | 30,247 | |||||||||||
| Agency mortgage-backed pass-through securities |
38,428 | 287 | (833 | ) | 37,882 | |||||||||||
| Agency collateralized mortgage obligations |
3,011 | 22 | (122 | ) | 2,911 | |||||||||||
|
|
|
|
|
|
|
|
|
|||||||||
| Total |
$ | 88,021 | $ | 343 | $ | (1,357 | ) | $ | 87,007 | |||||||
|
|
|
|
|
|
|
|
|
|||||||||
As of December 31, 2014, the Company does not intend to sell any debt securities classified as available for sale; and management believes that the Company more likely than not will not be required to sell any debt securities before their anticipated recovery at which time the Company will receive full value for the securities. The unrealized losses are largely due to increases in market interest rates over the yields available at the time the underlying securities were purchased. The fair value is expected to recover as the securities approach their maturity date or repricing date or if market yields for such investments decline. Management does not believe any of the securities are impaired due to reasons of credit quality. Accordingly, as of December 31, 2014, management believes any impairment in the Company’s securities is temporary, and no impairment loss has been realized in the Company’s consolidated statements of income.
(Continued)
F-49
Table of Contents
ALLEGIANCE BANCSHARES, INC.
NOTES TO CONSOLIDATED FINANCIAL STATEMENTS
5. SECURITIES (Continued)
Securities with unrealized losses segregated by length of time such securities have been in a continuous loss position are as follows:
| December 31, 2014 | ||||||||||||||||||||||||
| Less than 12 Months | More than 12 Months | Total | ||||||||||||||||||||||
| Estimated Fair Value |
Unrealized Losses |
Estimated Fair Value |
Unrealized Losses |
Estimated Fair Value |
Unrealized Losses |
|||||||||||||||||||
| (Dollars in thousands) | ||||||||||||||||||||||||
| Available for Sale |
||||||||||||||||||||||||
| U.S. Treasury securities |
$ | — | $ | — | $ | — | $ | — | $ | — | $ | — | ||||||||||||
| U.S. Government and agency securities |
2,842 | (3 | ) | 1,748 | (42 | ) | 4,590 | (45 | ) | |||||||||||||||
| Municipal securities |
14,102 | (74 | ) | — | — | 14,102 | (74 | ) | ||||||||||||||||
| Agency mortgage-backed pass-through securities |
498 | (1 | ) | 14,058 | (187 | ) | 14,556 | (188 | ) | |||||||||||||||
| Agency collateralized mortgage obligations |
— | — | 1,607 | (79 | ) | 1,607 | (79 | ) | ||||||||||||||||
|
|
|
|
|
|
|
|
|
|
|
|
|
|||||||||||||
| Total |
$ | 17,442 | $ | (78 | ) | $ | 17,413 | $ | (308 | ) | $ | 34,855 | $ | (386 | ) | |||||||||
|
|
|
|
|
|
|
|
|
|
|
|
|
|||||||||||||
| December 31, 2013 | ||||||||||||||||||||||||
| Less than 12 Months | More than 12 Months | Total | ||||||||||||||||||||||
| Estimated Fair Value |
Unrealized Losses |
Estimated Fair Value |
Unrealized Losses |
Estimated Fair Value |
Unrealized Losses |
|||||||||||||||||||
| (Dollars in thousands) | ||||||||||||||||||||||||
| Available for Sale |
||||||||||||||||||||||||
| U.S. Treasury securities |
$ | 1,805 | $ | (44 | ) | $ | — | $ | — | $ | 1,805 | $ | (44 | ) | ||||||||||
| U.S. Government and agency securities |
11,343 | (264 | ) | — | — | 11,343 | (264 | ) | ||||||||||||||||
| Municipal securities |
14,070 | (55 | ) | 838 | (39 | ) | 14,908 | (94 | ) | |||||||||||||||
| Agency mortgage-backed pass-through securities |
25,776 | (768 | ) | 3,625 | (65 | ) | 29,401 | (833 | ) | |||||||||||||||
| Agency collateralized mortgage obligations |
890 | (69 | ) | 864 | (53 | ) | 1,754 | (122 | ) | |||||||||||||||
|
|
|
|
|
|
|
|
|
|
|
|
|
|||||||||||||
| Total |
$ | 53,884 | $ | (1,200 | ) | $ | 5,327 | $ | (157 | ) | $ | 59,211 | $ | (1,357 | ) | |||||||||
|
|
|
|
|
|
|
|
|
|
|
|
|
|||||||||||||
At December 31, 2014, there were 19 securities in an unrealized loss position for more than 12 months. There were no realized losses on these securities as the Company believes these securities are temporarily impaired due to changes in market interest rates.
(Continued)
F-50
Table of Contents
ALLEGIANCE BANCSHARES, INC.
NOTES TO CONSOLIDATED FINANCIAL STATEMENTS
5. SECURITIES (Continued)
The amortized cost and fair value of investment securities at December 31, 2014, by contractual maturity, are shown below. Expected maturities may differ from contractual maturities if borrowers have the right to call or prepay obligations at any time with or without call or prepayment penalties.
| Amortized Cost |
Fair Value |
|||||||
| (Dollars in thousands) | ||||||||
| Due in one year or less |
$ | 7,228 | $ | 7,235 | ||||
| Due after one year through five years |
24,661 | 24,662 | ||||||
| Due after five years through ten years |
10,463 | 10,870 | ||||||
| Due after ten years |
7,000 | 7,191 | ||||||
|
|
|
|
|
|||||
| Subtotal |
49,352 | 49,958 | ||||||
| Agency mortgage-backed securities and collateralized mortgage obligations |
34,778 | 35,004 | ||||||
|
|
|
|
|
|||||
| Total |
$ | 84,130 | $ | 84,962 | ||||
|
|
|
|
|
|||||
The Company sold $2.0 million in securities in 2014 and recorded a gross gain on the sale of $82 thousand. There was no gain or loss on the sale of securities for the twelve months ended December 31, 2013.
At December 31, 2014 and 2013, the Company did not own securities of any one issuer, other than the U.S. government and its agencies, in an amount greater than 10% of the consolidated stockholders’ equity at such respective dates.
The Company did not have pledged securities at December 31, 2014 and 2013, respectively.
6. LOANS AND ALLOWANCE FOR LOAN LOSSES
The loan portfolio balances, net of unearned income and fees, consist of various types of loans primarily all made to borrowers located within Texas and are classified by major type as follows:
| December 31, | ||||||||||||||||
| 2014 | 2013 | |||||||||||||||
| Amount | Percent | Amount | Percent | |||||||||||||
| (Dollars in thousands) | ||||||||||||||||
| Commercial and industrial |
$ | 270,363 | 27.0 | % | $ | 227,382 | 27.2 | % | ||||||||
| Real estate: |
||||||||||||||||
| Commercial real estate (including multi-family residential) |
429,986 | 42.9 | % | 401,048 | 47.9 | % | ||||||||||
| Commercial real estate construction and land development |
85,484 | 8.5 | % | 71,633 | 8.6 | % | ||||||||||
| 1-4 family residential (including home equity) |
135,127 | 13.5 | % | 89,334 | 10.7 | % | ||||||||||
| Residential construction |
72,402 | 7.2 | % | 38,891 | 4.6 | % | ||||||||||
| Consumer and other |
8,692 | 0.9 | % | 8,406 | 1.0 | % | ||||||||||
|
|
|
|
|
|
|
|
|
|||||||||
| Total loans held for investment |
1,002,054 | 100.0 | % | 836,694 | 100.0 | % | ||||||||||
|
|
|
|
|
|
|
|
|
|||||||||
| Allowance for Loan Losses |
(8,246 | ) | (6,655 | ) | ||||||||||||
|
|
|
|
|
|||||||||||||
| Loans, net |
$ | 993,808 | $ | 830,039 | ||||||||||||
|
|
|
|
|
|||||||||||||
(Continued)
F-51
Table of Contents
ALLEGIANCE BANCSHARES, INC.
NOTES TO CONSOLIDATED FINANCIAL STATEMENTS
6. LOANS AND ALLOWANCE FOR LOAN LOSSES (Continued)
Loan Origination/Risk Management
The Company’s lending activities originate from the efforts of Allegiance’s bankers with an emphasis on lending to individuals, professionals, small to medium-sized businesses and commercial companies generally located in the Houston, Texas area. The Company’s strategy for credit risk management generally includes well-defined, centralized credit policies; uniform underwriting criteria; and ongoing risk monitoring and review processes for all credit exposures. The strategy generally emphasizes regular credit examinations and management reviews of loans. The Company has certain lending policies and procedures in place that are designed to maximize loan income within an acceptable level of risk. The Company maintains an independent loan review department that reviews and validates the credit risk program on a periodic basis. In addition, an independent third party loan review is performed on an annual basis. Results of these reviews are presented to management. The loan review process complements and reinforces the risk identification and assessment decisions made by lenders and credit personnel as well as the Company’s policies and procedures.
(i) Commercial and Industrial Loans. The Company makes commercial and industrial loans in its market area that are underwritten on the basis of the borrower’s ability to service the debt from income. The Company takes as collateral a lien on any available real estate, equipment or other assets owned by the borrower and typically obtains a personal guaranty of the borrower or principal. In general, commercial loans involve more credit risk than residential mortgage loans and commercial mortgage loans and therefore typically yield a higher return. The increased risk in commercial loans derives from the expectation that commercial and industrial loans generally are serviced principally from the operations of the business, which may not be successful, and from the type of collateral securing these loans. As a result, commercial and industrial loans require more extensive underwriting and servicing than other types of loans.
(ii) Commercial Real Estate. The Company makes loans collateralized by owner-occupied, nonowner-occupied and multi-family real estate to finance the purchase or ownership of real estate.
The Company’s nonowner-occupied and multi-family commercial real estate lending typically involves higher loan principal amounts and the repayment of these loans is dependent, in large part, on sufficient income from the properties securing the loans to cover operating expenses and debt service. The Company generally requires the borrower to have had an existing relationship with the Company and have a proven record of success. In addition, these loans are guaranteed by individual owners of the borrower and have typically lower loan to value ratios.
Loans secured by owner-occupied properties generally involve less risk and represented approximately 60% of the outstanding principal balance of the Company’s commercial real estate loans at December 31, 2014. The Company is dependent on the cash flows of the business occupying the property and its owners and requires these loans to be secured by property with adequate margins and to be guaranteed by the individual owners. The Company’s owner-occupied commercial real estate loans collateralized by first liens on real estate, typically have fixed interest rates and amortize over a 10 to 20 year period.
(iii) Construction and Land Development Loans. The Company makes loans to finance the construction of residential and to a lesser extent nonresidential properties. Construction loans generally are collateralized by first liens on real estate and have floating interest rates. The Company conducts periodic inspections, either directly or
(Continued)
F-52
Table of Contents
ALLEGIANCE BANCSHARES, INC.
NOTES TO CONSOLIDATED FINANCIAL STATEMENTS
6. LOANS AND ALLOWANCE FOR LOAN LOSSES (Continued)
through an agent, prior to approval of periodic draws on these loans. Underwriting guidelines similar to those described above are also used in the Company’s construction lending activities. Construction loans involve additional risks as they often involve the disbursement of funds with the repayment dependent on the ultimate success of the projects completion. Sources of repayment for these loans may be pre-committed permanent financing or sale of the developed property. The loans in this portfolio are monitored closely by management. Due to uncertainties inherent in estimating construction costs, the market value of the completed project and the effects of governmental regulation on real property; it can be difficult to accurately evaluate the total funds required to complete a project and the related loan to value ratio. As a result of these uncertainties; construction lending often involves the disbursement of substantial funds with repayment dependent, in part, on the success of the ultimate project rather than the ability of a borrower or guarantor to repay the loan. If the Company is forced to foreclose on a project prior to completion, there is no assurance that the Company will be able to recover all of the unpaid portion of the loan. In addition, the Company may be required to fund additional amounts to complete a project and may have to hold the property for an indeterminate period of time.
(iv) Residential Real Estate Loans. The Company’s lending activities also include the origination of 1-4 family residential mortgage loans (including home equity loans) collateralized by owner-occupied residential properties located in the Company’s market areas. The Company offers a variety of mortgage loan portfolio products which have a term of 5 to 7 years and generally amortize over 10 to 20 years. Loans collateralized by 1-4 family residential real estate generally have been originated in amounts of no more than 90% of appraised value.
(v) Consumer and Other Loans. The Company makes a variety of loans to individuals for personal and household purposes including secured and unsecured installment and term loans, home improvement loans, home equity loans and home equity lines of credit. Consumer loans are underwritten based on the individual borrower’s income, current debt level, past credit history and the value of any available collateral. The terms of these loans typically range from 12 to 60 months and vary based upon the nature of collateral and size of loan. Generally, consumer loans entail greater risk than residential real estate loans because they may be unsecured or if secured the value of the collateral, such as an automobile or boat, may be more difficult to assess and more likely to decrease in value than real estate. In such cases, any repossessed collateral for a defaulted consumer loan may not provide an adequate source of repayment for the outstanding loan balance. The remaining deficiency often does not warrant further substantial collection efforts against the borrower beyond obtaining a deficiency judgment. In addition, consumer loan collections are dependent on the borrower’s continuing financial stability, and thus are more likely to be adversely affected by job loss, divorce, illness or personal bankruptcy. Furthermore, the application of various federal and state laws may limit the amount which can be recovered on such loans.
Concentrations of Credit
The vast majority of the Company’s lending activity occurs in and around the Houston, Texas area. The Company’s loans are primarily loans secured by real estate, including commercial and residential construction, owner-occupied and nonowner-occupied and multi-family commercial real estate, raw land and other real estate based loans.
Related Party Loans
As of December 31, 2014
and 2013, loans outstanding to directors, officers and their affiliates totaled $1.3 million and
$731 thousand, respectively.
(Continued)
F-53
Table of Contents
ALLEGIANCE BANCSHARES, INC.
NOTES TO CONSOLIDATED FINANCIAL STATEMENTS
6. LOANS AND ALLOWANCE FOR LOAN LOSSES (Continued)
An analysis of activity with respect to these related-party loans is as follows:
| 2014 | 2013 | |||||||
| (Dollars in thousands) | ||||||||
| Beginning balance on January 1 |
$ | 731 | $ | 759 | ||||
| New loans and reclassified related loans |
729 | 154 | ||||||
| Repayments |
(131 | ) | (182 | ) | ||||
|
|
|
|
|
|||||
| Ending balance on December 31 |
$ | 1,329 | $ | 731 | ||||
|
|
|
|
|
|||||
Nonaccrual and Past Due Loans
An aging analysis of the recorded investment in past due loans, segregated by class of loans, is as follows:
| December 31, 2014 | ||||||||||||||||||||||||
| Loans Past Due and Still Accruing | ||||||||||||||||||||||||
| 30-89 Days | 90 or More Days |
Total Past Due Loans |
Nonaccrual Loans |
Current Loans |
Total Loans |
|||||||||||||||||||
| (Dollars in thousands) | ||||||||||||||||||||||||
| Commercial and industrial |
$ | 274 | $ | — | $ | 274 | $ | 1,527 | $ | 268,562 | $ | 270,363 | ||||||||||||
| Real estate: |
||||||||||||||||||||||||
| Commercial real estate (including multi-family residential) |
— | — | — | 1,653 | 428,333 | 429,986 | ||||||||||||||||||
| Commercial real estate construction and land development |
— | — | — | — | 85,484 | 85,484 | ||||||||||||||||||
| 1-4 family residential (including home equity) |
— | — | — | 135,127 | 135,127 | |||||||||||||||||||
| Residential construction |
413 | — | 413 | — | 71,989 | 72,402 | ||||||||||||||||||
| Consumer and other |
46 | — | 46 | 4 | 8,642 | 8,692 | ||||||||||||||||||
|
|
|
|
|
|
|
|
|
|
|
|
|
|||||||||||||
| Total |
$ | 733 | $ | — | $ | 733 | $ | 3,184 | $ | 998,137 | $ | 1,002,054 | ||||||||||||
|
|
|
|
|
|
|
|
|
|
|
|
|
|||||||||||||
| December 31, 2013 | ||||||||||||||||||||||||
| Loans Past Due and Still Accruing | ||||||||||||||||||||||||
| 30-89 Days | 90 or More Days |
Total Past Due Loans |
Nonaccrual Loans |
Current Loans |
Total Loans |
|||||||||||||||||||
| (Dollars in thousands) | ||||||||||||||||||||||||
| Commercial and industrial |
$ | 648 | $ | — | $ | 648 | $ | 2,290 | $ | 224,444 | $ | 227,382 | ||||||||||||
| Real estate: |
||||||||||||||||||||||||
| Commercial real estate (including multi-family residential) |
3,888 | — | 3,888 | — | 397,160 | 401,048 | ||||||||||||||||||
| Commercial real estate construction and land development |
— | — | — | — | 71,633 | 71,633 | ||||||||||||||||||
| 1-4 family residential (including home equity) |
738 | — | 738 | 83 | 88,513 | 89,334 | ||||||||||||||||||
| Residential construction |
— | — | — | — | 38,891 | 38,891 | ||||||||||||||||||
| Consumer and other |
117 | — | 117 | 199 | 8,090 | 8,406 | ||||||||||||||||||
|
|
|
|
|
|
|
|
|
|
|
|
|
|||||||||||||
| Total |
$ | 5,391 | $ | — | $ | 5,391 | $ | 2,572 | $ | 828,731 | $ | 836,694 | ||||||||||||
|
|
|
|
|
|
|
|
|
|
|
|
|
|||||||||||||
(Continued)
F-54
Table of Contents
ALLEGIANCE BANCSHARES, INC.
NOTES TO CONSOLIDATED FINANCIAL STATEMENTS
6. LOANS AND ALLOWANCE FOR LOAN LOSSES (Continued)
Nonaccrual loans at December 31, 2014 consisted of 9 separate credits.
If interest on nonaccrual loans had been accrued under the original loan terms, approximately $187 thousand and $263 thousand would have been recorded as income for the years ended December 31, 2014 and 2013, respectively.
Impaired Loans
Impaired loans by class of loans are set forth in the following tables. The average recorded investment presented in the table below is reported on a year-to-date basis.
| December 31, 2014 | ||||||||||||||||||||
| Recorded Investment |
Unpaid Principal Balance |
Related Allowance |
Average Recorded Investment |
Interest Income Recognized |
||||||||||||||||
| (Dollars in thousands) | ||||||||||||||||||||
| With no related allowance recorded: |
||||||||||||||||||||
| Commercial and industrial |
$ | 999 | $ | 1,054 | $ | — | $ | 1,292 | $ | 83 | ||||||||||
| Commercial real estate (including multi-family residential) |
2,894 | 2,894 | — | 1,641 | 182 | |||||||||||||||
| Commercial real estate construction and land development |
— | — | — | — | — | |||||||||||||||
| 1-4 family residential (including home equity) |
— | — | — | 2 | — | |||||||||||||||
| Residential construction |
— | — | — | — | — | |||||||||||||||
| Consumer and other |
— | — | — | 1,084 | — | |||||||||||||||
|
|
|
|
|
|
|
|
|
|
|
|||||||||||
| Total |
3,893 | 3,948 | — | 4,019 | 265 | |||||||||||||||
|
|
|
|
|
|
|
|
|
|
|
|||||||||||
| With an allowance recorded: |
||||||||||||||||||||
| Commercial and industrial |
1,802 | 1,802 | 501 | 2,247 | 128 | |||||||||||||||
| Commercial real estate (including multi-family residential) |
180 | 180 | 10 | 715 | 12 | |||||||||||||||
| Commercial real estate construction and land development |
— | — | — | — | — | |||||||||||||||
| 1-4 family residential (including home equity) |
— | — | — | 40 | — | |||||||||||||||
| Residential construction |
— | — | — | — | — | |||||||||||||||
| Consumer and other |
4 | 4 | 1 | 2,102 | — | |||||||||||||||
|
|
|
|
|
|
|
|
|
|
|
|||||||||||
| Total |
1,986 | 1,986 | 512 | 5,104 | 140 | |||||||||||||||
|
|
|
|
|
|
|
|
|
|
|
|||||||||||
| Total: |
||||||||||||||||||||
| Commercial and industrial |
2,801 | 2,856 | 501 | 3,539 | 211 | |||||||||||||||
| Commercial real estate (including multi-family residential) |
3,074 | 3,074 | 10 | 2,356 | 194 | |||||||||||||||
| Commercial real estate construction and land development |
— | — | — | — | — | |||||||||||||||
| 1-4 family residential (including home equity) |
— | — | — | 42 | — | |||||||||||||||
| Residential construction |
— | — | — | — | — | |||||||||||||||
| Consumer and other |
4 | 4 | 1 | 3,186 | — | |||||||||||||||
|
|
|
|
|
|
|
|
|
|
|
|||||||||||
| $ | 5,879 | $ | 5,934 | $ | 512 | $ | 9,123 | $ | 405 | |||||||||||
|
|
|
|
|
|
|
|
|
|
|
|||||||||||
(Continued)
F-55
Table of Contents
ALLEGIANCE BANCSHARES, INC.
NOTES TO CONSOLIDATED FINANCIAL STATEMENTS
6. LOANS AND ALLOWANCE FOR LOAN LOSSES (Continued)
| December 31, 2013 | ||||||||||||||||||||
| Recorded Investment |
Unpaid Principal Balance |
Related Allowance |
Average Recorded Investment |
Interest Income Recognized |
||||||||||||||||
| (Dollars in thousands) | ||||||||||||||||||||
| With no related allowance recorded: |
||||||||||||||||||||
| Commercial and industrial |
$ | 1,584 | $ | 1,639 | $ | — | $ | 1,797 | $ | 118 | ||||||||||
| Commercial real estate (including multi-family residential) |
388 | 388 | — | 392 | 13 | |||||||||||||||
| Commercial real estate construction and land development |
— | — | — | — | — | |||||||||||||||
| 1-4 family residential (including home equity) |
4 | 4 | — | 6 | — | |||||||||||||||
| Residential construction |
— | — | — | — | — | |||||||||||||||
| Consumer and other |
191 | 191 | — | 209 | 12 | |||||||||||||||
|
|
|
|
|
|
|
|
|
|
|
|||||||||||
| Total |
2,167 | 2,222 | — | 2,404 | 143 | |||||||||||||||
|
|
|
|
|
|
|
|
|
|
|
|||||||||||
| With an allowance recorded: |
||||||||||||||||||||
| Commercial and industrial |
2,693 | 2,693 | 567 | 3,112 | 206 | |||||||||||||||
| Commercial real estate (including multi-family residential) |
1,250 | 1,250 | 180 | 1,271 | 83 | |||||||||||||||
| Commercial real estate construction and land development |
— | — | — | — | — | |||||||||||||||
| 1-4 family residential (including home equity) |
79 | 79 | 1 | 83 | 6 | |||||||||||||||
| Residential construction |
— | — | — | — | — | |||||||||||||||
| Consumer and other |
177 | 177 | 156 | 189 | 12 | |||||||||||||||
|
|
|
|
|
|
|
|
|
|
|
|||||||||||
| Total |
4,199 | 4,199 | 904 | 4,655 | 307 | |||||||||||||||
|
|
|
|
|
|
|
|
|
|
|
|||||||||||
| Total: |
||||||||||||||||||||
| Commercial and industrial |
4,277 | 4,332 | 567 | 4,909 | 324 | |||||||||||||||
| Commercial real estate (including multi-family residential) |
1,638 | 1,638 | 180 | 1,663 | 96 | |||||||||||||||
| Commercial real estate construction and land development |
— | — | — | — | — | |||||||||||||||
| 1-4 family residential (including home equity) |
83 | 83 | 1 | 89 | 6 | |||||||||||||||
| Residential construction |
— | — | — | — | — | |||||||||||||||
| Consumer and other |
368 | 368 | 156 | 398 | 24 | |||||||||||||||
|
|
|
|
|
|
|
|
|
|
|
|||||||||||
| $ | 6,366 | $ | 6,421 | $ | 904 | $ | 7,059 | $ | 450 | |||||||||||
|
|
|
|
|
|
|
|
|
|
|
|||||||||||
Credit Quality Indicators
The company categorizes loans into risk categories based on relevant information about the ability of borrowers to service their debt including factors such as: current financial information, historical payment experience, credit documentation, public information, and current economic trends. The Company analyzes loans individually by classifying the loans by credit risk. As part of the ongoing monitoring of the credit quality of the Company’s loan portfolio and methodology for calculating the allowance for credit losses, management assigns and tracks risk ratings to be used as credit quality indicators.
(Continued)
F-56
Table of Contents
ALLEGIANCE BANCSHARES, INC.
NOTES TO CONSOLIDATED FINANCIAL STATEMENTS
6. LOANS AND ALLOWANCE FOR LOAN LOSSES (Continued)
The following is a general description of the risk ratings used:
Watch—Loans classified as watch loans may still be of high quality, but have an element of risk added to the credit such as declining payment history, deteriorating financial position of the borrower or a decrease in collateral value.
Special Mention—Loans classified as special mention have a potential weakness that deserves management’s close attention. If left uncorrected, these potential weaknesses may result in deterioration of the repayment prospects for the loan or of the institution’s credit position at some future date. They are characterized by the distinct possibility that the institution will sustain some loss if the deficiencies are not corrected.
Substandard—Loans classified as substandard have well-defined weaknesses on a continuing basis and are inadequately protected by the current net worth and paying capacity of the borrower, impaired or declining collateral values, or a continuing downturn in their industry which is reducing their profits to below zero and having a significantly negative impact on their cash flow. These loans so classified are characterized by the distinct possibility that the institution will sustain some loss if the deficiencies are not corrected.
Doubtful—Loans classified as doubtful have all the weaknesses inherent in those classified as substandard with the added characteristic that the weaknesses make collection or liquidation in full on the basis of currently existing facts, conditions, and values, highly questionable and improbable.
Loans not meeting the criteria above that are analyzed individually as part of the above described process are considered to be pass rated loans.
Based on the most recent analysis performed, the risk category of loans by class of loan at December 31, 2014 is as follows:
| Pass | Watch | Special Mention | Substandard | Doubtful | Total | |||||||||||||||||||
| (Dollars in thousands) | ||||||||||||||||||||||||
| Commercial and industrial |
$ | 263,335 | $ | 1,817 | $ | 291 | $ | 4,920 | $ | — | $ | 270,363 | ||||||||||||
| Commercial real estate (including multi-family residential) |
408,117 | 9,365 | — | 12,504 | — | 429,986 | ||||||||||||||||||
| Commercial real estate construction and land development |
82,643 | 2,841 | — | — | — | 85,484 | ||||||||||||||||||
| 1-4 family residential (including home equity) |
132,979 | 1,677 | 83 | 388 | — | 135,127 | ||||||||||||||||||
| Residential construction |
71,025 | — | 1,200 | 177 | — | 72,402 | ||||||||||||||||||
| Consumer and other |
8,636 | 35 | — | 21 | — | 8,692 | ||||||||||||||||||
|
|
|
|
|
|
|
|
|
|
|
|
|
|||||||||||||
| Total |
$ | 966,735 | $ | 15,735 | $ | 1,574 | $ | 18,010 | $ | — | $ | 1,002,054 | ||||||||||||
|
|
|
|
|
|
|
|
|
|
|
|
|
|||||||||||||
(Continued)
F-57
Table of Contents
ALLEGIANCE BANCSHARES, INC.
NOTES TO CONSOLIDATED FINANCIAL STATEMENTS
6. LOANS AND ALLOWANCE FOR LOAN LOSSES (Continued)
The following table presents the risk category of loans by class of loan at December 31, 2013:
| Pass | Watch | Special Mention | Substandard | Doubtful | Total | |||||||||||||||||||
| (Dollars in thousands) | ||||||||||||||||||||||||
| Commercial and industrial |
$ | 218,967 | $ | 1,003 | $ | 1,776 | $ | 5,636 | $ | — | $ | 227,382 | ||||||||||||
| Commercial real estate (including multi-family residential) |
379,596 | 8,211 | 3,298 | 9,943 | — | 401,048 | ||||||||||||||||||
| Commercial real estate construction and land development |
71,633 | — | — | — | — | 71,633 | ||||||||||||||||||
| 1-4 family residential (including home equity) |
86,609 | 2,238 | — | 487 | — | 89,334 | ||||||||||||||||||
| Residential construction |
38,891 | — | — | — | — | 38,891 | ||||||||||||||||||
| Consumer and other |
7,916 | 45 | 23 | 422 | — | 8,406 | ||||||||||||||||||
|
|
|
|
|
|
|
|
|
|
|
|
|
|||||||||||||
| Total |
$ | 803,612 | $ | 11,497 | $ | 5,097 | $ | 16,488 | $ | — | $ | 836,694 | ||||||||||||
|
|
|
|
|
|
|
|
|
|
|
|
|
|||||||||||||
Allowance for Loan Losses
At December 31, 2014, the allowance for loan losses totaled $8.2 million, or 0.82% of total loans. At December 31, 2013, the allowance aggregated $6.7 million or 0.80% of total loans.
The following table presents the activity in the allowance for loan losses by portfolio type for the years ended December 31, 2014 and 2013:
| Commercial and Industrial |
Commercial real estate (including multi-family residential) |
Commercial real estate construction and land development |
1-4 family residential (including home equity) |
Residential Construction |
Consumer and Other |
Total | |||||||||||||||||||||||||||||
| (Dollars in thousands) | |||||||||||||||||||||||||||||||||||
| Allowance for loan losses: |
|||||||||||||||||||||||||||||||||||
| Balance December 31, 2013 |
$ | 2,729 | $ | 2,175 | $ | 357 | $ | 558 | $ | 598 | $ | 238 | $ | 6,655 | |||||||||||||||||||||
| Provision for loan losses |
140 | 1,624 | 221 | 450 | (123 | ) | (162 | ) | 2,150 | ||||||||||||||||||||||||||
| Charge-offs |
(567 | ) | — | — | — | — | (40 | ) | (607 | ) | |||||||||||||||||||||||||
| Recoveries |
32 | — | — | — | — | 16 | 48 | ||||||||||||||||||||||||||||
|
|
|
|
|
|
|
|
|
|
|
|
|
|
|
||||||||||||||||||||||
| Net charge-offs |
(535 | ) | — | — | — | — | (24 | ) | (559 | ) | |||||||||||||||||||||||||
|
|
|
|
|
|
|
|
|
|
|
|
|
|
|
||||||||||||||||||||||
| Balance December 31, 2014 |
$ | 2,334 | $ | 3,799 | $ | 578 | $ | 1,008 | $ | 475 | $ | 52 | $ | 8,246 | |||||||||||||||||||||
|
|
|
|
|
|
|
|
|
|
|
|
|
|
|
||||||||||||||||||||||
| Allowance for loan losses: |
|||||||||||||||||||||||||||||||||||
| Balance December 31, 2012 |
$ | 2,713 | $ | 2,127 | $ | 222 | $ | 608 | $ | 560 | $ | 309 | $ | 6,539 | |||||||||||||||||||||
| Provision for loan losses |
352 | 48 | 135 | (278 | ) | 37 | (54 | ) | 240 | ||||||||||||||||||||||||||
| Charge-offs |
(369 | ) | — | — | — | — | (19 | ) | (388 | ) | |||||||||||||||||||||||||
| Recoveries |
33 | — | — | 228 | 1 | 2 | 264 | ||||||||||||||||||||||||||||
|
|
|
|
|
|
|
|
|
|
|
|
|
|
|
||||||||||||||||||||||
| Net charge-offs |
(336 | ) | — | — | 228 | 1 | (17 | ) | (124 | ) | |||||||||||||||||||||||||
|
|
|
|
|
|
|
|
|
|
|
|
|
|
|
||||||||||||||||||||||
| Balance December 31, 2013 |
$ | 2,729 | $ | 2,175 | $ | 357 | $ | 558 | $ | 598 | $ | 238 | $ | 6,655 | |||||||||||||||||||||
|
|
|
|
|
|
|
|
|
|
|
|
|
|
|
||||||||||||||||||||||
(Continued)
F-58
Table of Contents
ALLEGIANCE BANCSHARES, INC.
NOTES TO CONSOLIDATED FINANCIAL STATEMENTS
6. LOANS AND ALLOWANCE FOR LOAN LOSSES (Continued)
The following table presents the balance in the allowance for loan losses by portfolio type based on the impairment method as of December 31, 2014 and 2013:
| Commercial and Industrial |
Commercial real estate (including multi-family residential) |
Commercial real estate construction and land development |
1-4 family residential (including home equity) |
Residential Construction |
Consumer and Other |
Total | |||||||||||||||||||||||||||||
| (Dollars in thousands) | |||||||||||||||||||||||||||||||||||
| Allowance for loan losses related to: |
|||||||||||||||||||||||||||||||||||
| December 31, 2014 |
|||||||||||||||||||||||||||||||||||
| Individually evaluated for impairment |
$ | 501 | $ | 10 | $ | — | $ | — | $ | — | $ | 1 | $ | 512 | |||||||||||||||||||||
| Collectively evaluated for impairment |
1,833 | 3,789 | 578 | 1,008 | 475 | 51 | 7,734 | ||||||||||||||||||||||||||||
|
|
|
|
|
|
|
|
|
|
|
|
|
|
|
||||||||||||||||||||||
| Total allowance for loan losses |
$ | 2,334 | $ | 3,799 | $ | 578 | $ | 1,008 | $ | 475 | $ | 52 | $ | 8,246 | |||||||||||||||||||||
|
|
|
|
|
|
|
|
|
|
|
|
|
|
|
||||||||||||||||||||||
| December 31, 2013 |
|||||||||||||||||||||||||||||||||||
| Individually evaluated for impairment |
$ | 567 | $ | 180 | $ | — | $ | 1 | $ | — | $ | 156 | $ | 904 | |||||||||||||||||||||
| Collectively evaluated for impairment |
2,162 | 1,995 | 357 | 557 | 598 | 82 | 5,751 | ||||||||||||||||||||||||||||
|
|
|
|
|
|
|
|
|
|
|
|
|
|
|
||||||||||||||||||||||
| Total allowance for loan losses |
$ | 2,729 | $ | 2,175 | $ | 357 | $ | 558 | $ | 598 | $ | 238 | $ | 6,655 | |||||||||||||||||||||
|
|
|
|
|
|
|
|
|
|
|
|
|
|
|
||||||||||||||||||||||
The following table presents the recorded investment in loans by portfolio type based on the impairment method as of December 31, 2014 and 2013:
| Commercial and Industrial |
Commercial real estate (including multi-family residential) |
Commercial real estate construction and land development |
1-4 family residential (including home equity) |
Residential Construction |
Consumer and Other |
Total | |||||||||||||||||||||||||||||
| (Dollars in thousands) | |||||||||||||||||||||||||||||||||||
| Recorded investment in loans: |
|||||||||||||||||||||||||||||||||||
| December 31, 2014 |
|||||||||||||||||||||||||||||||||||
| Individually evaluated for impairment |
$ | 2,801 | $ | 3,074 | $ | — | $ | — | $ | — | $ | 4 | $ | 5,879 | |||||||||||||||||||||
| Collectively evaluated for impairment |
267,562 | 426,912 | 85,484 | 135,127 | 72,402 | 8,688 | 996,175 | ||||||||||||||||||||||||||||
|
|
|
|
|
|
|
|
|
|
|
|
|
|
|
||||||||||||||||||||||
| Total loans evaluated for impairment |
$ | 270,363 | $ | 429,986 | $ | 85,484 | $ | 135,127 | $ | 72,402 | $ | 8,692 | $ | 1,002,054 | |||||||||||||||||||||
|
|
|
|
|
|
|
|
|
|
|
|
|
|
|
||||||||||||||||||||||
| December 31, 2013 |
|||||||||||||||||||||||||||||||||||
| Individually evaluated for impairment |
$ | 4,277 | $ | 1,638 | $ | — | $ | 83 | $ | — | $ | 368 | $ | 6,366 | |||||||||||||||||||||
| Collectively evaluated for impairment |
223,105 | 399,410 | 71,633 | 89,251 | 38,891 | 8,038 | 830,328 | ||||||||||||||||||||||||||||
|
|
|
|
|
|
|
|
|
|
|
|
|
|
|
||||||||||||||||||||||
| Total loans evaluated for impairment |
$ | 227,382 | $ | 401,048 | $ | 71,633 | $ | 89,334 | $ | 38,891 | $ | 8,406 | $ | 836,694 | |||||||||||||||||||||
|
|
|
|
|
|
|
|
|
|
|
|
|
|
|
||||||||||||||||||||||
(Continued)
F-59
Table of Contents
ALLEGIANCE BANCSHARES, INC.
NOTES TO CONSOLIDATED FINANCIAL STATEMENTS
6. LOANS AND ALLOWANCE FOR LOAN LOSSES (Continued)
Troubled Debt Restructurings
As of December 31, 2014 and 2013, the Company had a recorded investment in troubled debt restructurings of $1.7 million and $3.7 million, respectively. The Company allocated $205 thousand and $447 thousand of specific reserves for these loans at December 31, 2014 and 2013, respectively, and did not commit to lend additional amounts on these loans.
The following table presents information regarding loans modified in a troubled debt restructuring during the years ended December 31, 2014 and 2013:
| As of December 31, | ||||||||||||||||||||||||||||||
| 2014 | 2013 | |||||||||||||||||||||||||||||
| Number of Contracts |
Pre- Modification of Outstanding Recorded Investment |
Post- Modification of Outstanding Recorded Investment |
Number of Contracts |
Pre- Modification of Outstanding Recorded Investment |
Post- Modification of Outstanding Recorded Investment | |||||||||||||||||||||||||
| (Dollars in thousands) | ||||||||||||||||||||||||||||||
| Troubled Debt Restructurings |
||||||||||||||||||||||||||||||
| Commercial and industrial |
— | $ | — | $ | — | 3 | $ | 2,106 | $ | 2,106 | ||||||||||||||||||||
| Commercial real estate (including multi-family residential) |
1 | 161 | 161 | — | — | — | ||||||||||||||||||||||||
| Commercial real estate construction and land development |
— | — | — | — | — | — | ||||||||||||||||||||||||
| 1-4 family residential (including home equity) |
— | — | — | — | — | — | ||||||||||||||||||||||||
| Residential construction |
— | — | — | — | — | — | ||||||||||||||||||||||||
| Consumer and other |
— | — | — | — | — | — | ||||||||||||||||||||||||
|
|
|
|
|
|
|
|
|
|
|
|
|
|||||||||||||||||||
| Total |
1 | $ | 161 | $ | 161 | 3 | $ | 2,106 | $ | 2,106 | ||||||||||||||||||||
|
|
|
|
|
|
|
|
|
|
|
|
|
|||||||||||||||||||
Troubled debt restructurings resulted in charge offs of $38 thousand and $19 thousand during the years ended December 31, 2014 and 2013, respectively.
Default is determined at 90 or more days past due. The modifications primarily related to extending the amortization periods of the loans. The Company did not grant principal reductions on any restructured loans. During the year ended December 31, 2014, the Company added $199 thousand in new troubled debt restructurings, of which $161 thousand were still outstanding on December 31, 2014. These modifications did not have a material impact on the Company’s determination of the allowance for loan losses. There was no specific reserve allocated for the troubled debt restructuring at December 31, 2014 as the loans were fully collateralized. The remaining restructured loans are performing and accruing loans.
(Continued)
F-60
Table of Contents
ALLEGIANCE BANCSHARES, INC.
NOTES TO CONSOLIDATED FINANCIAL STATEMENTS
7. FAIR VALUE
The Company uses fair value measurements to record fair value adjustments to certain assets and to determine fair value disclosures. Fair value represents the estimated exchange price that would be received from selling an asset or paid to transfer a liability, otherwise known as an “exit price” in the principal or most advantageous market available to the entity in an orderly transaction between market participants on the measurement date.
ASC Topic 820, “Fair Value Measurements and Disclosures” establishes a three level fair value hierarchy for valuation inputs that gives the highest priority to quoted prices in active markets for identical assets or liabilities and the lowest priority to unobservable inputs. The fair value hierarchy is as follows:
Fair Value Hierarchy
The Company groups financial assets and financial liabilities measured at fair value in three levels, based on the markets in which the assets and liabilities are traded and the reliability of the assumptions used to determine fair value. These levels are:
| • | Level 1—Quoted prices for identical assets or liabilities in active markets that the entity has the ability to access as of the measurement date. |
| • | Level 2—Significant other observable inputs other than Level 1 prices such as quoted prices for similar assets or liabilities; quoted prices in markets that are not active; or other inputs that are observable or can be corroborated by observable market data. |
| • | Level 3—Significant unobservable inputs that reflect management’s judgment and assumptions that market participants would use in pricing an asset or liability that are supported by little or no market activity. |
The carrying amounts and estimated fair values of financial instruments that are reported on the balance sheet are as follows:
| As of December 31, 2014 | |||||||||||||||||||||||||||||||
| Carrying Amount |
Estimated Fair Value | ||||||||||||||||||||||||||||||
| Level 1 | Level 2 | Level 3 | Total | ||||||||||||||||||||||||||||
| (Dollars in thousands) | |||||||||||||||||||||||||||||||
| Financial assets |
|||||||||||||||||||||||||||||||
| Cash and cash equivalents |
$ | 167,540 | $ | 167,540 | $ | — | $ | — | $ | 167,540 | |||||||||||||||||||||
| Available-for-sale securities |
84,962 | — | 84,962 | — | 84,962 | ||||||||||||||||||||||||||
| Loans held for investment, net of allowance |
993,808 | — | — | 998,575 | 998,575 | ||||||||||||||||||||||||||
| Accrued interest receivable |
3,285 | — | 473 | 2,812 | 3,285 | ||||||||||||||||||||||||||
| Financial liabilities |
|||||||||||||||||||||||||||||||
| Deposits |
$ | 1,133,684 | $ | — | $ | — | $ | 1,133,684 | $ | 1,133,684 | |||||||||||||||||||||
| Borrowings |
10,069 | — | 10,069 | — | 10,069 | ||||||||||||||||||||||||||
| Accrued interest payable |
43 | — | — | 43 | 43 | ||||||||||||||||||||||||||
(Continued)
F-61
Table of Contents
ALLEGIANCE BANCSHARES, INC.
NOTES TO CONSOLIDATED FINANCIAL STATEMENTS
7. FAIR VALUE (Continued)
| As of December 31, 2013 | |||||||||||||||||||||||||||||||
| Carrying Amount |
Estimated Fair Value | ||||||||||||||||||||||||||||||
| Level 1 | Level 2 | Level 3 | Total | ||||||||||||||||||||||||||||
| (Dollars in thousands) | |||||||||||||||||||||||||||||||
| Financial assets |
|||||||||||||||||||||||||||||||
| Cash and cash equivalents |
$ | 213,076 | $ | 213,076 | $ | — | $ | — | $ | 213,076 | |||||||||||||||||||||
| Available-for-sale securities |
87,007 | — | 87,007 | — | 87,007 | ||||||||||||||||||||||||||
| Loans held for investment, net of allowance |
830,039 | — | — | 836,809 | 836,809 | ||||||||||||||||||||||||||
| Accrued interest receivable |
2,983 | — | 493 | 2,490 | 2,983 | ||||||||||||||||||||||||||
| Financial liabilities |
|||||||||||||||||||||||||||||||
| Deposits |
$ | 1,045,331 | $ | — | $ | — | $ | 1,046,420 | $ | 1,046,420 | |||||||||||||||||||||
| Other borrowings |
5,000 | — | 5,000 | — | 5,000 | ||||||||||||||||||||||||||
| Accrued interest payable |
79 | — | — | 79 | 79 | ||||||||||||||||||||||||||
The fair value estimates presented herein are based on pertinent information available to management as of the dates indicated. The following is a description of valuation methodologies used for assets and liabilities recorded at fair value, non-financial assets and non-financial liabilities and for estimating fair value for financial instruments not recorded at fair value:
Cash and Due From Banks—For these short-term instruments, the carrying amount is a reasonable estimate of fair value. The Company classifies the estimated fair value of these instruments as Level 1.
Investment Securities—Fair values for investment securities are based upon quoted market prices, if available, and are considered Level 1 inputs. Level 1 securities consist of U.S. Treasury securities which are included in the available for sale portfolio. For all other available for sale securities, if quoted prices are not available, fair values are measured based on market prices for similar securities and are considered Level 2 inputs. For these securities, the Company generally obtains fair value measurements from an independent pricing service. The fair value measurements consider observable data that may include dealer quotes, market spreads, cash flows, the U.S. Treasury yield curve, live trading levels, trade execution data, market consensus prepayment speeds, credit information and the bond’s terms and conditions, among other things.
Available for sale securities are recorded at fair value on a recurring basis.
Loans Held for Investment—The estimated fair value approximates carrying value for variable-rate loans that reprice frequently and that have no significant change in credit risk. Fair values for fixed-rate loans and variable-rate loans which reprice infrequently are estimated by discounting future cash flows based on interest rates currently being offered for loans with similar terms to borrowers of similar credit quality. Loan fair value estimates include judgments regarding future expected loss experience and risk characteristics. A valuation adjustment is made for specific credit risks as well as general portfolio credit risk. The Company classifies the estimated fair value of loans held for investment as Level 3.
Federal Home Loan Bank Stock—The fair value of FHLB stock is estimated to be equal to its carrying amount as it is not practical to determine the fair value of FHLB stock due to restrictions placed on its transferability.
(Continued)
F-62
Table of Contents
ALLEGIANCE BANCSHARES, INC.
NOTES TO CONSOLIDATED FINANCIAL STATEMENTS
7. FAIR VALUE (Continued)
Deposits—The fair value of demand deposits, savings accounts and certain money market deposits is the amount payable on demand at the reporting date. The fair value of fixed rate certificates of deposit is estimated using a discounted cash flows calculation that applies interest rates currently offered for deposits of similar remaining maturities. Deposit fair value measurements utilize Level 3 inputs.
Other Borrowings—The fair values of the Company’s borrowings are estimated using discounted cash flow analyses based on the current borrowing rates for similar types of borrowing arrangements and are measured utilizing Level 2 inputs.
Off-balance sheet instruments—The fair values of off-balance sheet commitments to extend credit and standby letters of credit financial instruments are based on fees currently charged to enter into similar agreements, taking into account the remaining terms of the agreements and the counterparties’ credit standing. The Company has reviewed the unfunded portion of commitments to extend credit as well as standby and other letters of credit and has determined that the fair value of such financial instruments is not material.
The following tables present fair values for assets measured at fair value on a recurring basis:
| As of December 31, 2014 | ||||||||||||||||
| Level 1 | Level 2 | Level 3 | Total | |||||||||||||
| (Dollars in thousands) | ||||||||||||||||
| Available for sale securities: |
||||||||||||||||
| U.S. Government and agency securities |
$ | — | $ | 14,477 | $ | — | $ | 14,477 | ||||||||
| Municipal securities |
— | 35,481 | — | 35,481 | ||||||||||||
| Agency mortgage-backed pass-through securities |
— | 32,475 | — | 32,475 | ||||||||||||
| Agency collateralized mortgage obligations |
— | 2,529 | — | 2,529 | ||||||||||||
|
|
|
|
|
|
|
|
|
|||||||||
| $ | — | $ | 84,962 | $ | — | $ | 84,962 | |||||||||
|
|
|
|
|
|
|
|
|
|||||||||
| As of December 31, 2013 | ||||||||||||||||
| Level 1 | Level 2 | Level 3 | Total | |||||||||||||
| (Dollars in thousands) | ||||||||||||||||
| Available for sale securities: |
||||||||||||||||
| U.S. Treasury securities |
$ | 1,804 | $ | — | $ | — | $ | 1,804 | ||||||||
| U.S. Government and agency securities |
— | 14,163 | — | 14,163 | ||||||||||||
| Municipal securities |
— | 30,247 | — | 30,247 | ||||||||||||
| Agency mortgage-backed pass-through securities |
— | 37,882 | — | 37,882 | ||||||||||||
| Agency collateralized mortgage obligations |
— | 2,911 | — | 2,911 | ||||||||||||
|
|
|
|
|
|
|
|
|
|||||||||
| $ | 1,804 | $ | 85,203 | $ | — | $ | 87,007 | |||||||||
|
|
|
|
|
|
|
|
|
|||||||||
There were no liabilities measured at fair value on a recurring basis as of December 31, 2014 and 2013. There were no transfers between Level 1 and Level 2 during 2014 or 2013.
Certain assets and liabilities are measured at fair value on a nonrecurring basis; that is the instruments are not measured at fair value on an ongoing basis but are subject to fair value adjustments in certain circumstances such as evidence of impairment.
(Continued)
F-63
Table of Contents
ALLEGIANCE BANCSHARES, INC.
NOTES TO CONSOLIDATED FINANCIAL STATEMENTS
7. FAIR VALUE (Continued)
| As of December 31, 2014 | ||||||||||||
| Level 1 | Level 2 | Level 3 | ||||||||||
| (Dollars in thousands) | ||||||||||||
| Other real estate owned |
$ | — | $ | — | $ | — | ||||||
| Impaired loans: |
||||||||||||
| Commercial and industrial |
— | — | 1,301 | |||||||||
| Commercial real estate (including multi-family residential) |
— | — | 170 | |||||||||
| Consumer and other |
— | — | 3 | |||||||||
|
|
|
|
|
|
|
|||||||
| $ | — | $ | — | $ | 1,474 | |||||||
|
|
|
|
|
|
|
|||||||
| As of December 31, 2013 | ||||||||||||
| Level 1 | Level 2 | Level 3 | ||||||||||
| (Dollars in thousands) | ||||||||||||
| Other real estate owned |
$ | — | $ | 332 | $ | — | ||||||
| Impaired loans |
||||||||||||
| Commercial and industrial |
— | — | 2,126 | |||||||||
| Commercial real estate (including multi-family residential) |
— | — | 1,070 | |||||||||
| 1-4 family residential (including home equity) |
— | — | 78 | |||||||||
| Consumer and other |
— | — | 21 | |||||||||
|
|
|
|
|
|
|
|||||||
| $ | — | $ | 332 | $ | 3,295 | |||||||
|
|
|
|
|
|
|
|||||||
Level 3 Valuations
Financial instruments are considered Level 3 when their values are determined using pricing models, discounted cash flow methodologies or similar techniques and at least one significant model assumption or input is unobservable. Level 3 financial instruments also include those for which the determination of fair value requires significant management judgment or estimation. Currently, we measure fair value for certain loans and other real estate owned on a nonrecurring basis as described below.
Other real estate owned
Other real estate owned is comprised of real estate acquired in partial or full satisfaction of loans. Other real estate owned is recorded at its estimated fair value less estimated selling and closing costs at the date of transfer Any excess of the related loan balance over the fair value less expected selling costs is charged to the allowance. Subsequent declines in fair value are reported as adjustments to the carrying amount and are recorded against earnings. The fair value of other real estate owned is determined using appraisals or other indications of value based on recent comparable sales of similar properties or assumptions generally observable in the marketplace. The Company did not have any other real estate owned at December 31, 2014. At December 31, 2013, other real estate owned had a carrying value of $652 thousand with a specific valuation allowance of $320 thousand.
Impaired Loans with Specific Allocation of Allowance
Impaired loans are those loans the Company has measured at fair value, generally based on the fair value of the loan’s collateral. A loan is considered impaired when, based on current information and events, it is probable that the Company will be unable to collect all amounts due pursuant to the contractual terms of the loan agreement.
(Continued)
F-64
Table of Contents
ALLEGIANCE BANCSHARES, INC.
NOTES TO CONSOLIDATED FINANCIAL STATEMENTS
7. FAIR VALUE (Continued)
Fair value is generally determined based on appraisals of the properties which are then adjusted for the estimated selling and closing costs related to liquidation of the collateral, or discounted cash flows based upon the expected proceeds. Estimated selling and closing costs range from 5% to 10% of the value of the underlying collateral.
During the years ended December 31, 2014 and 2013, certain impaired loans were reevaluated and reported at fair value through a specific allocation of
the allowance for loan losses. At December 31, 2014, the total reported fair value of impaired loans of
$1.5 million based on collateral valuations utilizing Level 3 valuation inputs had a carrying value of $2.0 million that was reduced by
specific allowance allocations totaling $512 thousand. At December 31, 2013, the total reported fair value of impaired loans of
$3.3 million based on collateral valuations utilizing Level 3 valuation inputs had a carrying value of $4.2
million that was reduced by specific allowance allocations totaling $904 thousand.
8. PREMISES AND EQUIPMENT
Premises and equipment are summarized as follows:
| December 31, | ||||||||
| 2014 | 2013 | |||||||
| (Dollars in thousands) | ||||||||
| Land |
$ | 2,203 | $ | 2,203 | ||||
| Buildings |
3,558 | 3,535 | ||||||
| Leasehold improvements |
4,349 | 3,691 | ||||||
| Furniture, fixtures and equipment |
5,350 | 4,345 | ||||||
| Construction in progress |
82 | 26 | ||||||
|
|
|
|
|
|||||
| Total |
15,542 | 13,800 | ||||||
| Less: accumulated depreciation |
4,573 | 3,756 | ||||||
|
|
|
|
|
|||||
| Premises and equipment, net |
$ | 10,969 | $ | 10,044 | ||||
|
|
|
|
|
|||||
Depreciation expense was $1.1 million and $813 thousand for the years ended December 31, 2014 and 2013, respectively.
9. DEPOSITS
Time deposits that meet or exceed the
FDIC Insurance limit of $250 thousand at December 31, 2014 and 2013 were
$97.0 million and $96.8 million, respectively.
Scheduled maturities of time deposits for the next five years are as follows (dollars in thousands):
| 2015 |
$ | 243,409 | ||
| 2016 |
73,923 | |||
| 2017 |
33,830 | |||
| 2018 |
25,798 | |||
| 2019 |
15,528 | |||
|
|
|
|||
| Total |
$ | 392,488 | ||
|
|
|
(Continued)
F-65
Table of Contents
ALLEGIANCE BANCSHARES, INC.
NOTES TO CONSOLIDATED FINANCIAL STATEMENTS
9. DEPOSITS (Continued)
The Company has $50.6 million and $49.2 million of brokered deposits; and there are no major concentrations of deposits with any one depositor at December 31, 2014 and 2013, respectively. Included in these amounts are reciprocal deposits that the Company has placed through the Certificates of Deposits Account Registry Service (CDARS) Network of $49.5 million and $48.1 million, at December 31, 2014 and 2013, respectively.
Related party deposits from principal officers, directors, and their affiliates at December 31, 2014 and 2013 were $7.1 million and $8.0 million, respectively.
10. BORROWINGS
In 2014, the Company entered into a borrowing agreement with another financial institution. The Company borrowed
$10 million for a period of 7 years,
maturing in December 2021. The Company used the borrowed funds to pay off a previous borrowing with another financial institution entered into during 2013 in conjunction with the purchase of Independence Bank. The note agreement requires the Company
to meet certain restrictive covenants. At December 31, 2014, the Company believes it is in compliance with its debt covenants and had not been made aware of any noncompliance by the lender. The interest rate on the debt is the Prime Rate minus
25 basis points. Interest is paid quarterly and payments will begin on March 31, 2015. In addition, the Company will begin paying annual principal payments in 2019. The collateral for the loan is 100% of the capital stock of Allegiance Bank.
Scheduled principal maturities are as follows (dollars in thousands):
| 2019 |
$ | 1,494 | ||
| 2020 |
4,285 | |||
| 2021 |
4,290 | |||
|
|
|
|||
| $ | 10,069 | |||
|
|
|
At December 31, 2013, the Company had outstanding debt of $5.0 million accruing interest at 3.00%.
11. INCOME TAXES
The components of the provision for federal income taxes are as follows:
| Year Ended December 31, | ||||||||
| 2014 | 2013 | |||||||
| (Dollars in thousands) | ||||||||
| Current |
$ | 4,551 | $ | 4,002 | ||||
| Deferred |
277 | (149 | ) | |||||
|
|
|
|
|
|||||
| Total |
$ | 4,828 | $ | 3,853 | ||||
|
|
|
|
|
|||||
(Continued)
F-66
Table of Contents
ALLEGIANCE BANCSHARES, INC.
NOTES TO CONSOLIDATED FINANCIAL STATEMENTS
11. INCOME TAXES (Continued)
Effective tax rates differ from the amount computed by applying the federal income tax statutory rate to income before income taxes due to the following:
| Year Ended December 31, | ||||||||
| 2014 | 2013 | |||||||
| (Dollars in thousands) | ||||||||
| Taxes calculated at statutory rate |
$ | 4,685 | $ | 3,635 | ||||
| Increase (decrease) resulting from: |
||||||||
| Qualified stock options |
180 | 63 | ||||||
| Merger related expenses |
192 | 124 | ||||||
| Tax exempt income |
(154 | ) | (21 | ) | ||||
| Other, net |
(75 | ) | 52 | |||||
|
|
|
|
|
|||||
| Total |
$ | 4,828 | $ | 3,853 | ||||
|
|
|
|
|
|||||
Deferred tax assets and liabilities are as follows:
| December 31, | ||||||||
| 2014 | 2013 | |||||||
| (Dollars in thousands) | ||||||||
| Deferred tax assets: |
||||||||
| Allowance for credit losses |
$ | 3,460 | $ | 3,008 | ||||
| Deferred loan fees and costs |
— | 261 | ||||||
| Deferred compensation |
170 | 128 | ||||||
| Net unrealized loss on available for sale securities |
— | 345 | ||||||
|
|
|
|
|
|||||
| Total deferred tax assets |
3,630 | 3,742 | ||||||
|
|
|
|
|
|||||
| Deferred tax liabilities: |
||||||||
| Core deposit intangible and other purchase accounting adjustments |
(676 | ) | (281 | ) | ||||
| Net unrealized gain on available for sale securities |
(283 | ) | — | |||||
| Fixed asset basis difference |
(294 | ) | (179 | ) | ||||
|
|
|
|
|
|||||
| Total deferred tax liabilities |
(1,253 | ) | (460 | ) | ||||
|
|
|
|
|
|||||
| Net deferred tax assets |
$ | 2,377 | $ | 3,282 | ||||
|
|
|
|
|
|||||
Interest and penalties related to tax positions are recognized in the period in which they begin accruing or when the entity claims the position that does not meet the minimum statutory thresholds. The Company has not recorded any interest and penalties in the income statement for the years ended December 31, 2014 and 2013. The Company is subject to U.S. Federal income tax and is no longer subject to examination by taxing authorities for years before 2011. The Company does not expect the total amount of unrecognized tax benefits to significantly increase or decrease in the next 12 months.
(Continued)
F-67
Table of Contents
ALLEGIANCE BANCSHARES, INC.
NOTES TO CONSOLIDATED FINANCIAL STATEMENTS
12. STOCK-BASED COMPENSATION
During 2008, the Company’s Board of Directors and shareholders approved the 2008 Stock Awards and Incentive Plan (the “Plan”) covering certain key employees to purchase shares of the Company’s stock. The Plan was amended in 2014 as the shareholders authorized a maximum aggregate number of shares of stock to be issued of 1,040,000, any or all of which may be issued through incentive stock options. The Company accounts for stock-based employee compensation plans using the fair value-based method of accounting. The Company recognized total stock-based compensation expense of $731 thousand and $375 thousand for the years ended December 31, 2014 and 2013, respectively. There was approximately $148 thousand and $53 thousand of income tax expense recorded for the stock-based compensation expense for the same periods, respectively.
Stock Option Plan
Options to purchase a total of 736,396 shares of Company stock have been granted as of December 31, 2014. Under the stock option plan; options are exercisable up to 10 years from the date of the grant, unless otherwise provided by the Board of Directors and are fully vested 4 years after the date of grant.
On November 15, 2013, the Company acquired Independence Bank and assumed 97,537 options to purchase stock with a weighted average exercise price of $13.75. At the time of the acquisition all shares were fully vested and exercisable. The fair value of stock options granted is estimated at the date of grant using the Black-Scholes option-pricing model. Black-Scholes pricing model utilizes certain assumptions noted in the table below. Given minimal trading in the Company’s stock, it is not practicable for the Company to estimate volatility of its share price; therefore, the Company uses the volatility of an appropriate industry index (the NASDAQ Community Bank Index) as an input in the valuation model. The Company uses historical data to estimate option exercise and post-vesting termination behavior. The expected term of options granted is based on historical data and represents the period of time that options granted are expected to be outstanding and takes into account that the options are not transferable. The risk-free interest rate for the expected term of the option is based on the U.S. Treasury yield curve in effect at the time of the grant.
| 2014 | 2013 | |||||||
| Risk-free interest rate |
2.70 | % | 2.35 | % | ||||
| Expected term |
10.00 | 10.00 | ||||||
| Expected stock price volatility |
17.7 | % | 17.2 | % | ||||
| Dividend yield |
— | — | ||||||
(Continued)
F-68
Table of Contents
ALLEGIANCE BANCSHARES, INC.
NOTES TO CONSOLIDATED FINANCIAL STATEMENTS
12. STOCK-BASED COMPENSATION (Continued)
A summary of the activity in the stock option plan during December 31, 2014 and 2013 is set forth below:
| Number of Options |
Weighted Average Exercise Price |
Weighted Average Remaining Contractual Term |
Aggregate Intrinsic Value |
|||||||||||||
| (In thousands) | (In years) | (In thousands) | ||||||||||||||
| Options outstanding, December 31, 2012 |
360 | $ | 12.19 | 6.78 | $ | 1,913 | ||||||||||
| Options granted |
59 | 19.57 | ||||||||||||||
| Options issued in acquitstion |
97 | 13.75 | ||||||||||||||
| Options exercised |
(4 | ) | 13.37 | |||||||||||||
| Options forfeited |
(21 | ) | 13.98 | |||||||||||||
|
|
|
|
|
|||||||||||||
| Options outstanding, December 31, 2013 |
491 | 13.29 | 6.23 | 3,291 | ||||||||||||
| Options granted |
239 | 20.33 | ||||||||||||||
| Options exercised |
(28 | ) | 14.50 | |||||||||||||
| Options forfeited |
(8 | ) | 19.07 | |||||||||||||
|
|
|
|
|
|||||||||||||
| Options outstanding, December 31, 2014 |
694 | $ | 15.60 | 6.57 | $ | 4,437 | ||||||||||
|
|
|
|
|
|
|
|
|
|||||||||
| Options vested and exercisable, December 31, 2014 |
389 | $ | 12.24 | 4.71 | $ | 3,794 | ||||||||||
|
|
|
|
|
|
|
|
|
|||||||||
The Company expects all outstanding options at December 31, 2014 to vest.
Information related to the stock option plan during each year is as follows:
| 2014 | 2013 | |||||||
| (In thousands) | ||||||||
| Intrinsic value of options exercised |
$ | 202 | $ | 27 | ||||
| Cash received from option exercises |
407 | 53 | ||||||
| Weighted average fair value of options granted |
$ | 6.79 | $ | 6.25 | ||||
As of December 31, 2014, there was $1.6 million of total unrecognized compensation cost related to nonvested stock options granted under the Plan. The cost is expected to be recognized over a weighted-average period of 2.70 years.
Share Award Plan
Under the 2008 Stock Awards and Incentive Plan, the Company awarded 17,084 shares of restricted stock during 2013 with a grant date fair value of $18.00 per share. During 2014, the Company issued 8,385 shares of restricted stock with a grant date fair value of $20.34 per share. The restricted stock shares will vest over a period of 4 years but are considered outstanding at the date of issuance. The Company accounts for restricted stock grants by recording the fair value of the grant as compensation expense over the vesting period.
(Continued)
F-69
Table of Contents
ALLEGIANCE BANCSHARES, INC.
NOTES TO CONSOLIDATED FINANCIAL STATEMENTS
12. STOCK-BASED COMPENSATION (Continued)
A summary of the activity of the nonvested shares of restricted stock as of December 31, 2014 and 2013 including changes during the years then ended is as follows:
| Number of Shares |
Weighted Average Grant Date Fair Value |
|||||||
| (Shares in thousands) | ||||||||
| Nonvested share awards outstanding, December 31, 2012 |
20 | $ | 16.00 | |||||
| Share awards granted |
17 | 18.00 | ||||||
| Share awards vested |
(7 | ) | 16.00 | |||||
| Unvested share awards forfeited |
(1 | ) | 16.00 | |||||
|
|
|
|
|
|||||
| Nonvested share awards outstanding, December 31, 2013 |
29 | $ | 16.64 | |||||
|
|
|
|
|
|||||
| Share awards granted |
8 | 20.34 | ||||||
| Share awards vested |
(10 | ) | 16.75 | |||||
| Unvested share awards forfeited |
— | — | ||||||
|
|
|
|
|
|||||
| Nonvested share awards outstanding, December 31, 2014 |
27 | $ | 18.23 | |||||
|
|
|
|
|
|||||
At December 31, 2014 and 2013, there was $338 thousand and $414 thousand, respectively, of unrecognized compensation expense related to the restricted stock awards which is expected to be recognized over a remaining period of 4 years and 3 years, respectively. The total fair value of restricted stock awards that fully vested during the year ended December 31, 2014 was approximately $200 thousand.
13. OTHER EMPLOYEE BENEFITS
401(k) benefit plan
The Company has a 401(k) benefit plan whereby participants may contribute a percentage of their compensation. The Company matches 50% of an employee contributions up to 6% of the employee’s compensation, for a maximum match of 3% of compensation. Matching contribution expense as of December 31, 2014 and 2013 was $303 thousand and $212 thousand, respectively.
Profit sharing plan
The financial statements include an accrual for $823 thousand and $583 thousand for a contribution to the plan as a profit sharing contribution for the years ended December 31, 2014 and 2013, respectively.
Employee Stock Purchase Plan
The Company offers its employees an opportunity to purchase shares of the Company’s common stock, $1.00 par value per share, pursuant to the terms of the Allegiance Bancshares, Inc. Amended and Restated Employee Stock Purchase Plan (“ESPP Plan”). The ESPP Plan was adopted by the Board of Directors to provide employees with an opportunity to purchase shares of the Company in order to provide employees a more direct opportunity to participate in the Company’s growth. During 2014, the Company issued 14,975 shares under the ESPP Plan.
(Continued)
F-70
Table of Contents
ALLEGIANCE BANCSHARES, INC.
NOTES TO CONSOLIDATED FINANCIAL STATEMENTS
14. OFF-BALANCE SHEET ARRANGEMENTS, COMMITMENTS AND CONTINGENCIES
In the normal course of business, the Company enters into various transactions, which, in accordance with accounting principles generally accepted in the United States are not included in the Company’s consolidated balance sheets. The Company enters into these transactions to meet the financing needs of its customers. These transactions include commitments to extend credit and standby and commercial letters of credit, which involve to varying degrees elements of credit risk and interest rate risk in excess of the amounts recognized in the consolidated balance sheets. The Company uses the same credit policies in making commitments and conditional obligations as it does for on balance sheet instruments.
The contractual amounts of financial instruments with off-balance sheet risk at December 31, 2014 are as follows:
| 1 year or less | More than 1 year but less than 3 years |
3 years or more but less than 5 years |
5 years or more |
Total | ||||||||||||||||
| (Dollars in thousands) | ||||||||||||||||||||
| Commitments to extend credit |
$ | 285,641 | $ | 32,049 | $ | 34,354 | $ | 40,954 | $ | 392,998 | ||||||||||
| Standby letters of credit |
3,839 | 167 | — | — | 4,006 | |||||||||||||||
|
|
|
|
|
|
|
|
|
|
|
|||||||||||
| Total |
$ | 289,480 | $ | 32,216 | $ | 34,354 | $ | 40,954 | $ | 397,004 | ||||||||||
|
|
|
|
|
|
|
|
|
|
|
|||||||||||
The Company’s commitments and contingent liabilities associated with outstanding commitments to extend credit and standby letters of credit expiring by period are summarized below:
| December 31, | ||||||||||||||||
| 2014 | 2013 | |||||||||||||||
| Fixed Rate | Variable Rate |
Fixed Rate | Variable Rate |
|||||||||||||
| (Dollars in thousands) | ||||||||||||||||
| Commitments to extend credit |
$ | 178,803 | $ | 214,195 | $ | 102,131 | $ | 219,432 | ||||||||
| Standby letters of credit |
4,006 | — | 2,964 | 320 | ||||||||||||
|
|
|
|
|
|
|
|
|
|||||||||
| Total |
$ | 182,809 | $ | 214,195 | $ | 105,095 | $ | 219,752 | ||||||||
|
|
|
|
|
|
|
|
|
|||||||||
Commitments to make loans are generally made for periods of 120 days or less. As of December 31, 2014, the fixed rate loan commitments have interest rates ranging from 1.85% to 8.00% with a weighted average maturity of 2 years.
Commitments to Extend Credit
Commitments to extend credit are agreements to lend to a customer as long as there is no violation of any condition established in the contract. Commitments generally have fixed expiration dates or other termination clauses and may require payment of a fee. Since many of the commitments are expected to expire without being fully drawn upon, the total commitment amounts disclosed above does not necessarily represent future cash funding requirements. The Company evaluates each customer’s creditworthiness on a case-by-case basis. The Company minimizes its exposure to loss under these commitments by subjecting them to credit approval and
(Continued)
F-71
Table of Contents
ALLEGIANCE BANCSHARES, INC.
NOTES TO CONSOLIDATED FINANCIAL STATEMENTS
14. OFF-BALANCE SHEET ARRANGEMENTS, COMMITMENTS AND CONTINGENCIES (Continued)
monitoring procedures. Management assesses the credit risk associated with certain commitments to extend credit in determining the level of the allowance for credit losses. The amount and type of collateral, if deemed necessary by the Company upon extension of credit, is based on management’s credit evaluation of the customer.
Standby Letters of Credit
Standby letters of credit are written conditional commitments issued by the Company to guarantee the performance of a customer to a third party. In the event of nonperformance by the customer, the Company has the rights to the underlying collateral. The credit risk to the Company in issuing letters of credit is essentially the same as that involved in extending loan facilities to its customers. The Company’s policy for obtaining collateral, and the nature of such collateral, is essentially the same as that involved in making commitments to extend credit.
Leases
The following table presents a summary of non-cancelable future operating lease commitments as of December 31, 2014 (dollars in thousands):
| 2015 |
$ | 2,281 | ||
| 2016 |
2,316 | |||
| 2017 |
2,348 | |||
| 2018 |
1,844 | |||
| 2019 |
1,228 | |||
| Thereafter |
3,867 | |||
|
|
|
|||
| $ | 13,884 | |||
|
|
|
It is expected that in the normal course of business, expiring leases will be renewed or replaced by leases on other property or equipment.
Rent expense under all noncancelable operating lease obligations aggregated approximately $2.0 million for the year ended December 31, 2014 and $1.5 million for the year ended December 31, 2013.
Litigation
The Company and the Bank are defendants, from time to time, in legal actions arising from transactions conducted in the ordinary course of business. The Company and the Bank believe, after consultations with legal counsel, that the ultimate liability, if any, arising from such actions will not have a material adverse effect on their financial statements.
15. REGULATORY CAPITAL MATTERS
The Company and the Bank are subject to various regulatory capital requirements administered by the federal banking agencies. Capital adequacy guidelines prompt corrective action regulations and involve quantitative measures of assets, liabilities and certain off balance sheet items calculated under regulatory accounting practices. Capital amounts and classifications are also subject to qualitative judgments by regulators about
(Continued)
F-72
Table of Contents
ALLEGIANCE BANCSHARES, INC.
NOTES TO CONSOLIDATED FINANCIAL STATEMENTS
15. REGULATORY CAPITAL MATTERS (Continued)
components, risk weightings, and other factors. Any institution that fails to meet its minimum capital requirements is subject to actions by regulators that could have a direct material effect on the Company’s financial statements.
To meet the capital adequacy requirements, the Company and the Bank must maintain minimum capital amounts and ratios of Total and Tier 1 capital to risk weighted assets, and of Tier 1 capital to average total assets as defined in the regulations. As of December 31, 2014, the Company and the Bank met all capital adequacy requirements to which they were subject.
Prompt corrective action regulations provide five classifications: well capitalized, adequately capitalized, undercapitalized, significantly undercapitalized, and critically undercapitalized, although these terms are not used to represent overall financial condition. If adequately capitalized, regulatory approval is required to accept brokered deposits. If undercapitalized, capital distributions are limited as is asset growth and expansion; and capital restoration plans are required.
As of December 31, 2014, the most recent notification from the FDIC categorized the Bank as “well capitalized” under the regulatory framework for prompt corrective action. To be categorized as well capitalized the Bank must maintain minimum total risk-based, Tier I risk-based and Tier I leverage ratios as set forth in the table below. There have been no conditions or events since that notification that management believes have changed the Bank’s category.
The Company’s principal source of funds for dividend payments is dividends received from the Bank. Banking regulations limit the amount of dividends that may be paid without prior approval of regulatory agencies. Under these regulations, the amount of dividends that may be paid by the Bank in any calendar year is limited to the current year’s net profits combined with the retained net profits of the preceding two years, subject to the capital requirements described above.
(Continued)
F-73
Table of Contents
ALLEGIANCE BANCSHARES, INC.
NOTES TO CONSOLIDATED FINANCIAL STATEMENTS
15. REGULATORY CAPITAL MATTERS (Continued)
The following is a summary of the Company’s and the Bank’s actual and required capital ratios at December 31, 2014 and 2013:
| Actual | For Capital Adequacy Purposes |
To Be Categorized As Well Capitalized Under Prompt Corrective Action Provisions |
||||||||||||||||||||||
| Amount | Ratio | Amount | Ratio | Amount | Ratio | |||||||||||||||||||
| (Dollars in thousands) | ||||||||||||||||||||||||
| CONSOLIDATED: |
||||||||||||||||||||||||
| As of December 31, 2014 |
||||||||||||||||||||||||
| Total Capital |
||||||||||||||||||||||||
| (to Risk Weighted Assets) |
$ | 126,584 | 12.80 | % | $ | 79,127 | 8.00 | % | N/A | N/A | ||||||||||||||
| Tier I Capital |
||||||||||||||||||||||||
| (to Risk Weighted Assets) |
118,338 | 11.96 | % | 39,564 | 4.00 | % | N/A | N/A | ||||||||||||||||
| Tier I Capital |
||||||||||||||||||||||||
| (to Average Tangible Assets) |
118,338 | 9.55 | % | 49,549 | 4.00 | % | N/A | N/A | ||||||||||||||||
| As of December 31, 2013 |
||||||||||||||||||||||||
| Total Capital |
||||||||||||||||||||||||
| (to Risk Weighted Assets) |
$ | 104,018 | 12.39 | % | $ | 67,162 | 8.00 | % | N/A | N/A | ||||||||||||||
| Tier I Capital |
||||||||||||||||||||||||
| (to Risk Weighted Assets) |
97,363 | 11.60 | % | 33,581 | 4.00 | % | N/A | N/A | ||||||||||||||||
| Tier I Capital |
||||||||||||||||||||||||
| (to Average Tangible Assets) |
97,363 | 9.61 | % | 40,513 | 4.00 | % | N/A | N/A | ||||||||||||||||
| ALLEGIANCE BANK |
||||||||||||||||||||||||
| As of December 31, 2014 |
||||||||||||||||||||||||
| Total Capital |
||||||||||||||||||||||||
| (to Risk Weighted Assets) |
$ | 124,472 | 12.59 | % | $ | 79,066 | 8.00 | % | $ | 98,833 | 10.00 | % | ||||||||||||
| Tier I Capital |
||||||||||||||||||||||||
| (to Risk Weighted Assets) |
116,226 | 11.76 | % | 39,533 | 4.00 | % | 59,300 | 6.00 | % | |||||||||||||||
| Tier I Capital |
||||||||||||||||||||||||
| (to Average Tangible Assets) |
116,226 | 9.38 | % | 49,549 | 4.00 | % | 61,936 | 5.00 | % | |||||||||||||||
| As of December 31, 2013 |
||||||||||||||||||||||||
| Total Capital |
||||||||||||||||||||||||
| (to Risk Weighted Assets) |
$ | 103,320 | 12.32 | % | $ | 67,091 | 8.00 | % | $ | 83,864 | 10.00 | % | ||||||||||||
| Tier I Capital |
||||||||||||||||||||||||
| (to Risk Weighted Assets) |
96,665 | 11.52 | % | 33,564 | 4.00 | % | 50,346 | 6.00 | % | |||||||||||||||
| Tier I Capital |
||||||||||||||||||||||||
| (to Average Tangible Assets) |
96,665 | 9.54 | % | 40,530 | 4.00 | % | 50,663 | 5.00 | % | |||||||||||||||
16. EARNINGS PER SHARE
Diluted earnings per common share is computed using the weighted-average number of shares determined for the basic earnings per common share computation plus the potential dilution that could occur if securities or other
(Continued)
F-74
Table of Contents
ALLEGIANCE BANCSHARES, INC.
NOTES TO CONSOLIDATED FINANCIAL STATEMENTS
16. EARNINGS PER SHARE (Continued)
contracts to issue common stock were exercised or converted into common stock using the treasury stock method. Outstanding stock options issued by the Company represent the only dilutive effect reflected in diluted weighted average shares. Restricted shares are considered outstanding at the date of grant.
| Year Ended December 31, | ||||||||||||||||
| 2014 | 2013 | |||||||||||||||
| (Amounts in thousands, except per share data) | ||||||||||||||||
| Amount | Per Share Amount |
Amount | Per Share Amount |
|||||||||||||
| Net income |
$ | 9,005 | $ | 6,839 | ||||||||||||
|
|
|
|
|
|||||||||||||
| Basic: |
||||||||||||||||
| Weighted average shares outstanding |
6,978 | $ | 1.29 | 5,450 | $ | 1.25 | ||||||||||
|
|
|
|
|
|||||||||||||
| Diluted: |
||||||||||||||||
| Add incremental shares for: |
||||||||||||||||
| Dilutive effect of stock option exercises |
164 | 171 | ||||||||||||||
|
|
|
|
|
|||||||||||||
| Total |
7,142 | $ | 1.26 | 5,621 | $ | 1.22 | ||||||||||
|
|
|
|
|
|
|
|
|
|||||||||
Stock options for 39 thousand shares of common stock issued at $22.00 per share and 42 thousand shares of common stock issued at $20.00 per share were not considered in computing diluted earnings per common share for 2014 and 2013 because they were antidilutive.
17. ACCUMULATED OTHER COMPREHENSIVE INCOME (LOSS)
The components of accumulated other comprehensive income (loss) are as follows:
| December 31, | ||||||||
| 2014 | 2013 | |||||||
| (Dollars in thousands) | ||||||||
| Unrealized gains (losses) on securities |
$ | 832 | $ | (1,014 | ) | |||
| Deferred tax |
(283 | ) | 345 | |||||
|
|
|
|
|
|||||
| Accumulated other comprehensive income (loss) |
$ | 549 | $ | (669 | ) | |||
|
|
|
|
|
|||||
18. SUBSEQUENT EVENT
Acquisition of Farmers & Merchants Bancshares, Inc.—On January 1, 2015, Allegiance acquired 100% of the outstanding stock of Farmers & Merchants Bancshares, Inc., a Texas corporation (“F&M”) and its wholly-owned subsidiary Enterprise Bank (“Enterprise”) headquartered in Houston, Texas. Enterprise Bank operated 9 banking locations: 7 in Houston, Texas, 1 in Rosebud, Texas and 1 in Mart, Texas. The Company acquired F&M to further expand its Houston, Texas area markets.
As of December 31, 2014, F&M, on a consolidated basis, reported total assets of $569.7 million, total loans of $410.2 million and total deposits of $488.9 million. Pursuant to the merger agreement, F&M shareholders
(Continued)
F-75
Table of Contents
ALLEGIANCE BANCSHARES, INC.
NOTES TO CONSOLIDATED FINANCIAL STATEMENTS
18. SUBSEQUENT EVENT (Continued)
received 10.909 shares of Allegiance common stock and $642 thousand in cash for any fractional and out of state shares held by F&M shareholders for all outstanding shares of F&M capital stock. The Company is in the process of making fair value determinations as part of the initial accounting for the transaction. Goodwill is not expected to be deductible for tax purposes.
19. PARENT COMPANY ONLY CONDENSED FINANCIAL STATEMENTS
ALLEGIANCE BANCSHARES, INC.
(Parent Company Only)
CONDENSED BALANCE SHEETS
| December 31, | ||||||||
| 2014 | 2013 | |||||||
| (Dollars in thousands) | ||||||||
| ASSETS |
||||||||
| Cash |
$ | 11,769 | $ | 5,711 | ||||
| Investment in subsidiary |
129,667 | 109,040 | ||||||
| Other assets |
760 | 321 | ||||||
|
|
|
|
|
|||||
| TOTAL |
$ | 142,196 | $ | 115,072 | ||||
|
|
|
|
|
|||||
| LIABILITIES AND STOCKHOLDERS’ EQUITY |
||||||||
| LIABILITIES: |
||||||||
| Other borrowed funds |
$ | 10,069 | $ | 5,000 | ||||
| Accrued interest payable and other liabilities |
349 | 336 | ||||||
|
|
|
|
|
|||||
| Total liabilities |
10,418 | 5,336 | ||||||
| STOCKHOLDERS’ EQUITY: |
||||||||
| Common stock |
7,477 | 6,965 | ||||||
| Capital surplus |
104,568 | 93,459 | ||||||
| Retained earnings |
19,184 | 10,179 | ||||||
| Accumulated other comprehensive income (loss) |
549 | (669 | ) | |||||
| Less: treasury stock, at cost |
||||||||
| There were no treasury shares outstanding at December 31, 2014 |
— | (198 | ) | |||||
|
|
|
|
|
|||||
| Total stockholders’ equity |
131,778 | 109,736 | ||||||
|
|
|
|
|
|||||
| TOTAL |
$ | 142,196 | $ | 115,072 | ||||
|
|
|
|
|
|||||
(Continued)
F-76
Table of Contents
ALLEGIANCE BANCSHARES, INC.
NOTES TO CONSOLIDATED FINANCIAL STATEMENTS
19. PARENT COMPANY ONLY CONDENSED FINANCIAL STATEMENTS (Continued)
ALLEGIANCE BANCSHARES, INC.
(Parent Company Only)
CONDENSED STATEMENTS OF INCOME
| For the Years Ended December 31, | ||||||||
| 2014 | 2013 | |||||||
| (Dollars in thousands) | ||||||||
| OPERATING INCOME: |
||||||||
| Other income |
$ | — | $ | — | ||||
|
|
|
|
|
|||||
| Total income |
— | — | ||||||
| OPERATING EXPENSE: |
||||||||
| Interest expense on borrowed funds |
229 | 15 | ||||||
| Other expenses |
810 | 409 | ||||||
|
|
|
|
|
|||||
| Total operating expense |
1,039 | 424 | ||||||
| INCOME BEFORE INCOME TAX BENEFIT AND EQUITY IN UNDISTRIBUTED EARNINGS OF SUBSIDIARIES |
(1,039 | ) | (424 | ) | ||||
| FEDERAL INCOME TAX BENEFIT |
353 | 18 | ||||||
|
|
|
|
|
|||||
| INCOME BEFORE EQUITY IN UNDISTRIBUTED EARNINGS OF SUBSIDIARIES |
(686 | ) | (406 | ) | ||||
| EQUITY IN UNDISTRIBUTED EARNINGS OF SUBSIDIARIES |
9,691 | 7,245 | ||||||
|
|
|
|
|
|||||
| NET INCOME |
$ | 9,005 | $ | 6,839 | ||||
|
|
|
|
|
|||||
(Continued)
F-77
Table of Contents
ALLEGIANCE BANCSHARES, INC.
NOTES TO CONSOLIDATED FINANCIAL STATEMENTS
19. PARENT COMPANY ONLY CONDENSED FINANCIAL STATEMENTS (Continued)
ALLEGIANCE BANCSHARES, INC.
(Parent Company Only)
CONDENSED STATEMENTS OF CASH FLOWS
| For the Years Ended December 31, | ||||||||
| 2014 | 2013 | |||||||
| (Dollars in thousands) | ||||||||
| CASH FLOWS FROM OPERATING ACTIVITIES: |
||||||||
| Net income |
$ | 9,005 | $ | 6,839 | ||||
| Adjustments to reconcile net income to net cash used in operating activities: |
||||||||
| Equity in undistributed earnings of subsidiaries |
(9,691 | ) | (7,245 | ) | ||||
| Decrease (increase) in other assets |
28 | (555 | ) | |||||
| (Decrease) increase in accrued interest payable and other liabilities |
(441 | ) | 578 | |||||
|
|
|
|
|
|||||
| Net cash used in operating activities |
(1,099 | ) | (383 | ) | ||||
| CASH FLOWS FROM INVESTING ACTIVITIES: |
||||||||
| Payments for investments in and advances to subsidiaries |
(9,000 | ) | (38,979 | ) | ||||
|
|
|
|
|
|||||
| Net cash used in investing activities |
(9,000 | ) | (38,979 | ) | ||||
|
|
|
|
|
|||||
| CASH FLOWS FROM FINANCING ACTIVITIES: |
||||||||
| Proceeds from issuance of common stock |
11,088 | 35,738 | ||||||
| Repurchase of common stock |
— | (54 | ) | |||||
| Proceeds from issuance of long-term debt |
5,069 | 5,000 | ||||||
| Other |
— | (220 | ) | |||||
|
|
|
|
|
|||||
| Net cash provided by financing activities |
16,157 | 40,464 | ||||||
|
|
|
|
|
|||||
| NET INCREASE IN CASH AND CASH EQUIVALENTS |
6,058 | 1,102 | ||||||
| CASH AND CASH EQUIVALENTS, BEGINNING OF PERIOD |
5,711 | 4,609 | ||||||
|
|
|
|
|
|||||
| CASH AND CASH EQUIVALENTS, END OF PERIOD |
$ | 11,769 | $ | 5,711 | ||||
|
|
|
|
|
|||||
(Continued)
F-78
Table of Contents

INDEPENDENT AUDITOR’S REPORT
To Management
Farmers & Merchants Bancshares, Inc.
We have audited the accompanying consolidated financial statements of Farmers & Merchants Bancshares, Inc. (the Company) which comprise the consolidated balance sheets as of December 31, 2014 and 2013, and the related consolidated statements of income, comprehensive income, changes in shareholders’ equity and cash flows for the years then ended, and the related notes to the consolidated financial statements.
Management’s Responsibility for the Consolidated Financial Statements
Management is responsible for the preparation and fair presentation of these consolidated financial statements in accordance with accounting principles generally accepted in the United States of America; this includes the design, implementation, and maintenance of internal control relevant to the preparation and fair presentation of consolidated financial statements that are free from material misstatement, whether due to fraud or error.
Auditor’s Responsibility
Our responsibility is to express an opinion on these consolidated financial statements based on our audits. We conducted our audits in accordance with auditing standards generally accepted in the United States of America. Those standards require that we plan and perform the audit to obtain reasonable assurance about whether the consolidated financial statements are free of material misstatement.
An audit involves performing procedures to obtain audit evidence about the amounts and disclosures in the consolidated financial statements. The procedures selected depend on the auditor’s judgment, including the assessment of the risks of material misstatement of the consolidated financial statements, whether due to fraud or error. In making those risk assessments, the auditor considers internal control relevant to the entity’s preparation and fair presentation of the consolidated financial statements in order to design audit procedures that are appropriate in the circumstances, but not for the purpose of expressing an opinion on the effectiveness of the entity’s internal control. Accordingly, we express no such opinion. An audit also includes evaluating the appropriateness of accounting policies used and the reasonableness of significant accounting estimates made by management, as well as evaluating the overall presentation of the consolidated financial statements.
We believe that the audit evidence we have obtained is sufficient and appropriate to provide a reasonable basis for our opinion.
F-79
Table of Contents
Opinion
In our opinion, the consolidated financial statements referred to above present fairly, in all material respects, the financial position of Farmers & Merchants Bancshares, Inc. as of December 31, 2014 and 2013, and the results of its operations and cash flows for the years then ended in conformity with accounting principles generally accepted in the United States of America.

Houston, Texas
March 30, 2015
One Riverway • Suite 1900 • Houston, Texas 77056-1973 • 713.622.2310 • 713.622.5613 fax
harperpearson.com
F-80
Table of Contents
FARMERS & MERCHANTS BANCSHARES, INC.
CONSOLIDATED BALANCE SHEETS
FOR THE YEARS ENDED DECEMBER 31, 2014 AND 2013
| 2014 | 2013 | |||||||||
| ASSETS | ||||||||||
| Cash and due from banks |
$ | 103,838,397 | $ | 58,921,695 | ||||||
| Interest-bearing deposits with banks |
1,014,144 | 1,011,107 | ||||||||
| Federal funds sold |
2,275,000 | 1,867,000 | ||||||||
|
|
|
|
|
|||||||
| Total Cash and Cash Equivalents |
107,127,541 | 61,799,802 | ||||||||
| Securities held to maturity |
15,101,560 | 15,236,978 | ||||||||
| Federal Home Loan Bank stock |
220,900 | 220,100 | ||||||||
| Loans, net of deferred loan fees |
410,200,529 | 400,067,903 | ||||||||
| Less allowance for possible credit losses |
(4,553,856 | ) | (4,972,486 | ) | ||||||
|
|
|
|
|
|||||||
| Loans, net |
405,646,673 | 395,095,417 | ||||||||
| Premises and equipment, net |
6,707,331 | 6,887,054 | ||||||||
| Accrued interest receivable |
1,451,535 | 1,457,719 | ||||||||
| Other real estate owned |
— | 2,035,252 | ||||||||
| Goodwill |
19,204,744 | 19,204,744 | ||||||||
| Investment in unconsolidated subsidiaries |
375,407 | 1,132,433 | ||||||||
| Bank owned life insurance (BOLI) |
10,606,661 | 188,675 | ||||||||
| Prepaid expenses and other assets |
3,242,430 | 2,462,065 | ||||||||
|
|
|
|
|
|||||||
| Total Assets |
$ | 569,684,782 | $ | 505,720,239 | ||||||
|
|
|
|
|
|||||||
| LIABILITIES AND SHAREHOLDERS’ EQUITY | ||||||||||
| Liabilities |
||||||||||
| Deposits: |
||||||||||
| Noninterest-bearing |
$ | 185,529,086 | $ | 142,095,438 | ||||||
| Interest-bearing: |
||||||||||
| Savings and money markets |
143,111,428 | 127,380,834 | ||||||||
| Time |
160,282,530 | 157,597,470 | ||||||||
|
|
|
|
|
|||||||
| Total Deposits |
488,923,044 | 427,073,742 | ||||||||
| Accrued interest payable |
287,498 | 286,384 | ||||||||
| Other borrowings |
18,000,000 | 18,000,000 | ||||||||
| Subordinated debentures |
11,341,000 | 11,341,000 | ||||||||
| Other liabilities |
292,765 | 969,011 | ||||||||
|
|
|
|
|
|||||||
| Total Liabilities |
518,844,307 | 457,670,137 | ||||||||
|
|
|
|
|
|||||||
| Commitments and Contingencies |
||||||||||
| Shareholders’ Equity |
||||||||||
| Preferred stock, $1.00 par value per share; $1,000 per share liquidation value; 100,000 shares authorized, 11,550 shares issued and outstanding |
11,550,000 | 11,550,000 | ||||||||
| Common stock, $1.00 par value, 1,000,000 shares authorized, 281,877 and 266,895 shares issued; and 217,044 and 202,062 shares outstanding at December 31, 2014 and 2013, respectively |
281,877 | 266,895 | ||||||||
| Capital surplus |
28,883,898 | 27,232,417 | ||||||||
| Retained earnings |
16,061,790 | 14,937,880 | ||||||||
| Treasury stock, 64,833 shares at cost |
(5,937,090 | ) | (5,937,090 | ) | ||||||
| Accumulated other comprehensive income, net |
— | — | ||||||||
|
|
|
|
|
|||||||
| Total Shareholders’ Equity |
50,840,475 | 48,050,102 | ||||||||
|
|
|
|
|
|||||||
| Total Liabilities and Shareholders’ Equity |
$ | 569,684,782 | $ | 505,720,239 | ||||||
|
|
|
|
|
|||||||
See accompanying notes to consolidated financial statements.
F-81
Table of Contents
FARMERS & MERCHANTS BANCSHARES, INC.
CONSOLIDATED STATEMENTS OF INCOME
FOR THE YEARS ENDED DECEMBER 31, 2014 AND 2013
| 2014 | 2013 | |||||||||
| INTEREST INCOME |
||||||||||
| Interest and fees on loans |
$ | 23,104,445 | $ | 22,221,367 | ||||||
| Securities |
378,026 | 541,346 | ||||||||
| Federal funds sold |
2,769 | 6,631 | ||||||||
| Time deposits with banks |
133,323 | 181,276 | ||||||||
|
|
|
|
|
|||||||
| Total Interest Income |
23,618,563 | 22,950,620 | ||||||||
|
|
|
|
|
|||||||
| INTEREST EXPENSE |
||||||||||
| Deposits |
2,019,637 | 2,096,837 | ||||||||
| Subordinated debentures |
308,821 | 332,846 | ||||||||
| Other borrowed funds |
1,273,741 | 1,260,000 | ||||||||
|
|
|
|
|
|||||||
| Total Interest Expense |
3,602,199 | 3,689,683 | ||||||||
|
|
|
|
|
|||||||
| NET INTEREST INCOME |
20,016,364 | 19,260,937 | ||||||||
| PROVISION FOR POSSIBLE CREDIT LOSSES |
— | (1,000,000 | ) | |||||||
|
|
|
|
|
|||||||
| NET INTEREST INCOME AFTER PROVISION FOR POSSIBLE CREDIT LOSSES |
20,016,364 | 20,260,937 | ||||||||
|
|
|
|
|
|||||||
| NONINTEREST INCOME |
||||||||||
| Deposit account service charges |
887,808 | 994,023 | ||||||||
| Gain on sale of investment securities |
— | 274,474 | ||||||||
| Loss on sale of premises and equipment |
— | — | ||||||||
| Loss on sale of other real estate owned |
(174,355 | ) | (147,474 | ) | ||||||
| Gain on sale of unconsolidated subsidiary |
362,374 | — | ||||||||
| Increase cash surrender value of BOLI |
249,562 | — | ||||||||
| Other |
32,496 | 67,641 | ||||||||
|
|
|
|
|
|||||||
| Total Noninterest Income |
1,357,885 | 1,188,664 | ||||||||
|
|
|
|
|
|||||||
| NONINTEREST EXPENSE |
||||||||||
| Salaries and employee benefits |
12,025,936 | 9,209,354 | ||||||||
| Net occupancy expense |
1,197,469 | 1,120,511 | ||||||||
| Regulatory and insurance expense |
402,460 | 422,834 | ||||||||
| Professional fees |
2,354,594 | 1,812,691 | ||||||||
| Data processing and network expenses |
669,994 | 353,921 | ||||||||
| Communication expense |
326,451 | 343,757 | ||||||||
| Loan related expenses |
236,037 | 546,170 | ||||||||
| Printing, stationery and office expense |
277,940 | 320,360 | ||||||||
| Advertising, marketing and business development |
36,065 | 32,148 | ||||||||
| Other |
659,915 | 640,856 | ||||||||
|
|
|
|
|
|||||||
| Total Noninterest Expense |
18,186,861 | 14,802,602 | ||||||||
|
|
|
|
|
|||||||
| INCOME BEFORE FEDERAL INCOME TAX EXPENSE |
3,187,388 | 6,646,999 | ||||||||
| FEDERAL INCOME TAX EXPENSE |
1,014,969 | 2,253,746 | ||||||||
|
|
|
|
|
|||||||
| CONSOLIDATED NET INCOME |
$ | 2,172,419 | $ | 4,393,253 | ||||||
|
|
|
|
|
|||||||
See accompanying notes to consolidated financial statements.
F-82
Table of Contents
FARMERS & MERCHANTS BANCSHARES, INC.
CONSOLIDATED STATEMENTS OF COMPREHENSIVE INCOME
FOR THE YEARS ENDED DECEMBER 31, 2014 AND 2013
| 2014 | 2013 | |||||||
| Consolidated Net Income |
$ | 2,172,419 | $ | 4,393,253 | ||||
| Other Comprehensive (Loss) Income: |
||||||||
| Reclassification adjustments for beginning of year net unrealized gain realized in income |
— | (314,726 | ) | |||||
|
|
|
|
|
|||||
| Other Comprehensive (Loss) Income |
— | (314,726 | ) | |||||
|
|
|
|
|
|||||
| Total Comprehensive Income |
$ | 2,172,419 | $ | 4,078,527 | ||||
|
|
|
|
|
|||||
See accompanying notes to consolidated financial statements
F-83
Table of Contents
FARMERS & MERCHANTS BANCSHARES, INC.
CONSOLIDATED STATEMENTS OF CHANGES IN SHAREHOLDERS’ EQUITY
FOR THE YEARS ENDED DECEMBER 31, 2014 AND 2013
| Preferred Stock |
Common Stock |
Capital Surplus |
Retained Earnings |
Treasury Stock |
Accumulated Other Comprehensive Income |
Total | |||||||||||||||||||||||||||||
| Balance, December 31, 2012 |
$ | 11,550,000 | $ | 264,826 | $ | 27,040,414 | $ | 11,144,127 | $ | (5,937,090 | ) | $ | 314,726 | $ | 44,377,003 | ||||||||||||||||||||
| Stock Options Exercised (2,069 shares) |
— | 2,069 | 192,003 | — | — | — | 194,072 | ||||||||||||||||||||||||||||
| Dividends on Preferred Stock |
— | — | — | (599,500 | ) | — | — | (599,500 | ) | ||||||||||||||||||||||||||
| Consolidated Net Income |
— | — | — | 4,393,253 | — | — | 4,393,253 | ||||||||||||||||||||||||||||
| Change in Unrealized Gain on Securities, Net of Tax of $162,132 |
— | — | — | — | — | (314,726 | ) | (314,726 | ) | ||||||||||||||||||||||||||
|
|
|
|
|
|
|
|
|
|
|
|
|
|
|
||||||||||||||||||||||
| Balance, December 31, 2013 |
11,550,000 | 266,895 | 27,232,417 | 14,937,880 | (5,937,090 | ) | — | 48,050,102 | |||||||||||||||||||||||||||
| Stock Options Exercised (14,982 shares) |
— | 14,982 | 1,651,481 | — | — | — | 1,666,463 | ||||||||||||||||||||||||||||
| Dividends on Preferred Stock |
— | — | — | (1,048,509 | ) | — | — | (1,048,509 | ) | ||||||||||||||||||||||||||
| Consolidated Net Income |
— | — | — | 2,172,419 | — | — | 2,172,419 | ||||||||||||||||||||||||||||
|
|
|
|
|
|
|
|
|
|
|
|
|
|
|
||||||||||||||||||||||
| Balance, December 31, 2014 |
$ | 11,550,000 | $ | 281,877 | $ | 28,883,898 | $ | 16,061,790 | $ | (5,937,090 | ) | $ | — | $ | 50,840,475 | ||||||||||||||||||||
|
|
|
|
|
|
|
|
|
|
|
|
|
|
|
||||||||||||||||||||||
See accompanying notes to consolidated financial statements.
F-84
Table of Contents
FARMERS & MERCHANTS BANCSHARES, INC.
CONSOLIDATED STATEMENTS OF CASH FLOWS
FOR THE YEARS ENDED DECEMBER 31, 2014 AND 2013
| 2014 | 2013 | |||||||||
| CASH FLOWS FROM OPERATING ACTIVITIES: |
||||||||||
| Consolidated net income |
$ | 2,172,419 | $ | 4,393,253 | ||||||
|
|
|
|
|
|||||||
| Adjustments to reconcile consolidated net income to net cash provided by operating activities: |
||||||||||
| Provision for possible credit losses |
— | (1,000,000 | ) | |||||||
| Depreciation and amortization |
272,136 | 298,522 | ||||||||
| Amortization of premiums and discounts on investment securities, net |
882 | 56,612 | ||||||||
| Gain on sale on investment securities |
— | (274,474 | ) | |||||||
| Loss on sale of other real estate owned |
174,355 | 147,474 | ||||||||
| Gain on sale of unconsolidated subsidiary |
(362,374 | ) | — | |||||||
| Write-down of other real estate owned |
59,578 | 121,399 | ||||||||
| Increase in FHLB stock |
(800 | ) | (800 | ) | ||||||
| Increase in cash surrender value of bank owned life insurance, net |
(215,486 | ) | — | |||||||
| Deferred tax provision |
593,883 | 755,763 | ||||||||
| Change in operating assets and liabilities: |
||||||||||
| Accrued interest receivable |
6,184 | 177,603 | ||||||||
| Prepaid expenses and other assets |
(1,354,848 | ) | 764,922 | |||||||
| Accrued interest payable |
1,114 | (112,939 | ) | |||||||
| Other liabilities |
73,129 | 52,810 | ||||||||
|
|
|
|
|
|||||||
| Total adjustments |
(752,247 | ) | 986,892 | |||||||
|
|
|
|
|
|||||||
| Net cash provided by operating activities |
1,420,172 | 5,380,145 | ||||||||
|
|
|
|
|
|||||||
| CASH FLOWS FROM INVESTING ACTIVITIES: |
||||||||||
| Securities available for sale: |
||||||||||
| Proceeds from sales |
— | 5,561,661 | ||||||||
| Repayments |
— | 1,424,652 | ||||||||
| Securities held to maturity: |
||||||||||
| Repayments |
134,536 | 285,168 | ||||||||
| Purchases of bank premises and equipment, net |
(92,413 | ) | (142,335 | ) | ||||||
| Proceeds from sale of other real estate owned |
1,312,339 | 1,934,087 | ||||||||
| Proceeds from sale of unconsolidated subsidiary |
1,100,000 | — | ||||||||
| Purchase of bank owned life insurance |
(10,202,500 | ) | — | |||||||
| Decrease in loans, net |
(10,062,276 | ) | (29,938,304 | ) | ||||||
|
|
|
|
|
|||||||
| Net cash used by investing activities |
(17,810,314 | ) | (20,875,071 | ) | ||||||
|
|
|
|
|
|||||||
| CASH FLOWS FROM FINANCING ACTIVITIES: |
||||||||||
| Net increase (decrease) in noninterest-bearing deposits |
43,433,648 | (16,925,221 | ) | |||||||
| Net increase (decrease) in interest-bearing deposits |
18,415,654 | (7,343,331 | ) | |||||||
| Proceeds from stock options exercised |
1,666,463 | 194,072 | ||||||||
| Dividends paid |
(1,797,884 | ) | (149,875 | ) | ||||||
|
|
|
|
|
|||||||
| Net cash provided (used) by financing activities |
61,717,881 | (24,224,355 | ) | |||||||
|
|
|
|
|
|||||||
| NET INCREASE (DECREASE) IN CASH AND CASH EQUIVALENTS |
45,327,739 | (39,719,281 | ) | |||||||
| CASH AND CASH EQUIVALENTS, BEGINNING |
61,799,802 | 101,519,083 | ||||||||
|
|
|
|
|
|||||||
| CASH AND CASH EQUIVALENTS, ENDING |
$ | 107,127,541 | $ | 61,799,802 | ||||||
|
|
|
|
|
|||||||
See accompanying notes to consolidated financial statements.
F-85
Table of Contents
FARMERS & MERCHANTS BANCSHARES, INC.
NOTES TO CONSOLIDATED FINANCIAL STATEMENTS
FOR THE YEARS ENDED DECEMBER 31, 2014 AND 2013
NOTE A BASIS OF PRESENTATION AND SUMMARY OF SIGNIFICANT ACCOUNTING POLICIES
Nature of Organization—Farmers & Merchants Bancshares, Inc. (the “Company”), through its Bank subsidiary, Enterprise Bank (the “Bank”), operates its main banking facility and branches in Houston, Texas, and also maintains branches in Katy, Brookshire, Mart and Rosebud, Texas. The Bank’s primary source of revenue is from investing funds received from depositors and from providing loan and other financial services to its customers. The Bank operates under a state charter and therefore is subject to regulation by the Texas Department of Banking and the Federal Deposit Insurance Corporation (FDIC). The Company is subject to regulation by the Federal Reserve Board.
Basis of Presentation—The accompanying consolidated financial statements as of December 31, 2014 and 2013 include the accounts of Farmers & Merchants Bancshares, Inc. and its wholly owned subsidiary Enterprise Bank. All material intercompany balances and transactions have been eliminated in consolidation.
Subsequent Events—The Company has evaluated subsequent events for potential recognition and/or disclosure through March 30, 2015, the date the consolidated financial statements were available to be issued.
No subsequent events occurred which require adjustment to the financial statements at December 31, 2014. Subsequent events that require disclosure include the merger with Allegiance Bancshares, Inc. as described below.
Merger with Allegiance Bank Texas—On July 28, 2014, the Company entered into an Agreement and Plan of Reorganization (the Merger Agreement) with Allegiance Bancshares, Inc. (Allegiance) to sell the Company, and its subsidiary Bank, for a combination of cash and stock. The merger was approved by the Boards of Directors of both companies and closed January 1, 2015.
The terms of the Merger Agreement required the Company to repurchase, for cash consideration, all outstanding vested and unvested unexercised employee options to purchase Company common stock prior to the merger closing date. The amount of cash consideration paid was determined to be the positive difference between the strike price of the options and the per share cash merger consideration paid to the Company’s shareholders. The outstanding, unexercised options were repurchased by the Company on December 30, 2014 and the total cash consideration paid to the option holders was approximately $2.2 million, which is recorded as salary and benefit expense in the Company’s consolidated statement of income for the year ending December 31, 2014. Refer to Note Q for more information on the Company’s stock options.
Summary of Significant Accounting and Reporting Policies—The accounting and reporting policies of the Company conform, in all material respects, to accounting principles generally accepted in the United States of America (U.S. GAAP) and to prevailing practices within the financial services industry. A summary of significant accounting policies follows.
(Continued)
F-86
Table of Contents
FARMERS & MERCHANTS BANCSHARES, INC.
NOTES TO CONSOLIDATED FINANCIAL STATEMENTS
FOR THE YEARS ENDED DECEMBER 31, 2014 AND 2013
NOTE A BASIS OF PRESENTATION AND SUMMARY OF SIGNIFICANT ACCOUNTING POLICIES (Continued)
Cash Flow Reporting—Cash and cash equivalents include cash, interest-bearing and noninterest-bearing deposits with other financial institutions that have an initial maturity of 90 days or less, and federal funds sold. Cash flows are reported net for loans, deposits and short-term borrowings. Supplemental cash flow information follows:
| 2014 | 2013 | |||||||
| Cash paid for interest on deposits |
$ | 1,984,548 | $ | 2,111,057 | ||||
|
|
|
|
|
|||||
| Cash paid for debt service interest |
$ | 1,616,537 | $ | 1,691,565 | ||||
|
|
|
|
|
|||||
| Cash paid during the year for income taxes |
$ | 1,945,000 | $ | 1,185,182 | ||||
|
|
|
|
|
|||||
| Real estate acquired through foreclosure |
$ | — | $ | 368,022 | ||||
|
|
|
|
|
|||||
Cash and Due from Banks—The Bank, as a correspondent of the Federal Reserve Bank (FRB), is required to maintain reserves for the purpose of facilitating the implementation of monetary policy. These reserves may be maintained in the form of balances at the FRB or by vault cash maintained at the Bank. The Bank’s reserve requirements were approximately $9,551,000 and $3,611,000 at December 31, 2014 and 2013, respectively. Accordingly, cash and due from banks balances were restricted to that extent.
The majority of cash and cash equivalents are maintained with major financial institutions in the United States. Interest-bearing account deposits with these financial institutions may exceed the amount of insurance provided on such deposits; however, these deposits typically may be redeemed upon demand and therefore, bear minimal risk. In monitoring this credit risk, the Company periodically evaluates the stability of the financial institutions with which it has deposits. The Company has cash deposits in correspondent financial institutions in excess of the amount insured by the FDIC in the amount of $17,465,214 and $50,717,575 at December 31, 2014 and 2013, respectively.
Securities—Securities are accounted for on a trade date basis. Premiums and discounts are amortized and accreted to operations using the level-yield method of accounting, adjusted for prepayments as applicable. Interest earned on these assets is included in interest income. The specific identification method of accounting is used to compute gains or losses on the sales of these assets.
Securities held to maturity are carried at cost, adjusted for the amortization of premiums and the accretion of discounts. Management has the positive intent and the ability to hold these assets as long-term securities until their estimated maturities.
Securities available for sale are carried at fair value. Unrealized gains and losses are excluded from earnings and reported as a separate component of shareholders’ equity until realized. Securities within the available for sale portfolio may be used as part of management’s asset/liability strategy and may be sold in response to changes in liquidity, interest risk, prepayment risk or other similar economic factors. The Company held no securities available for sale at December 31, 2014 and 2013.
(Continued)
F-87
Table of Contents
FARMERS & MERCHANTS BANCSHARES, INC.
NOTES TO CONSOLIDATED FINANCIAL STATEMENTS
FOR THE YEARS ENDED DECEMBER 31, 2014 AND 2013
NOTE A BASIS OF PRESENTATION AND SUMMARY OF SIGNIFICANT ACCOUNTING POLICIES (Continued)
Investment securities classified as available for sale or held to maturity are generally evaluated for other-than-temporary impairment (OTTI) under Accounting Standards Codification (ASC) Topic 320, Investments—Debt and Equity Securities. In determining OTTI, management considers many factors, including: (i) the length of time and the extent to which the fair value has been less than cost, (ii) the financial condition and near-term prospects of the issuer, and (iii) the intent and the ability of the Company to retain its investment in the issuer for a period of time sufficient to allow for any anticipated recovery in fair value. The assessment of whether an other-than-temporary decline exists involves a high degree of subjectivity and judgment and is based on the information available to management at a point in time.
When OTTI occurs, the amount of the OTTI recognized in earnings depends on whether the Company intends to sell the security or will be required to sell the security before recovery of its amortized cost basis less any current-period credit loss. If the Company intends to sell the security or it is more likely that the Company will be required to sell the security before recovery of its amortized cost basis less any current-period credit loss, the OTTI shall be recognized in earnings equal to the entire difference between the investment’s amortized cost basis and its fair value at the balance sheet date. If the Company does not intend to sell the security and it is not likely that the Company will be required to sell the security before recovery of its amortized cost basis less any current-period loss, the OTTI shall be separated into the amount representing the credit loss and the amount related to all other factors. The amount of the total OTTI related to the credit loss is determined based on the present value of cash flows expected to be collected and is recognized in earnings. The amount of the total OTTI related to other factors shall be recognized in other comprehensive income. The previous amortized cost basis less the OTTI recognized in earnings shall become the new amortized cost basis of the investment.
Equity Investments—Banks that are members of the Federal Home Loan Bank of Dallas (FHLB) are required to maintain a stock investment in the FHLB calculated as a percentage of aggregate outstanding mortgages, outstanding FHLB advances, and other financial instruments. FHLB stock is capital stock bought from and sold to the FHLB at $100 par value. Both stock and cash dividends may be received on FHLB stock and are recorded when received as interest income.
Investments in the stock of the FHLB are considered to be a restricted investment with limited marketability and are stated at cost as management believes the cost basis is ultimately recoverable.
Loans—Loans are stated at unpaid principal balances, less the allowance for possible credit losses and deferred loan fees. Interest on loans is recognized by using the simple interest method.
Nonrefundable Fees and Costs Associated with Lending Activities—Loan origination and commitment fees in excess of management’s estimate of the costs to fund and book loans are deferred and amortized as a yield adjustment over the lives of the related loans using the straight-line method. The effect of this method on operations is not deemed to be materially different from the deferral of direct origination fees and costs, and the amortization thereof as an adjustment of the yield on the related loan as required by U.S. GAAP. Amortization of deferred loan fees is discontinued when a loan is placed on nonaccrual status.
(Continued)
F-88
Table of Contents
FARMERS & MERCHANTS BANCSHARES, INC.
NOTES TO CONSOLIDATED FINANCIAL STATEMENTS
FOR THE YEARS ENDED DECEMBER 31, 2014 AND 2013
NOTE A BASIS OF PRESENTATION AND SUMMARY OF SIGNIFICANT ACCOUNTING POLICIES (Continued)
Nonperforming Loans—Included in the nonperforming loan category are loans which have been categorized by management as nonaccrual because of delinquency status or because collection of interest is doubtful.
When the payment of principal or interest on a loan is delinquent for 90 days, or earlier in some cases, the loan is placed on nonaccrual status, unless the loan is in the process of collection and the underlying collateral fully supports the carrying value of the loan. If the decision is made to continue accruing interest on the loan, periodic reviews are made to confirm the accruing status of the loan and the probability that the Company will collect all principal and interest amounts outstanding.
When a loan is placed on nonaccrual status, interest accrued and uncollected during the current year prior to the judgment of uncollectability, is charged to operations unless the loan is well secured with collateral values sufficient to ensure collection of both principal and interest. Generally, any payments received on nonaccrual loans are applied first to outstanding loan amounts and next to the recovery of charged-off loan amounts. Any excess is treated as recovery of lost interest. Loans are returned to accrual status when all the principal and interest amounts contractually due are brought current and future payments are reasonably assured.
A loan is defined as impaired if, based on current information and events, it is probable that the Company will be unable to collect all amounts due in accordance with the original contractual terms of the loan agreement, including scheduled principal and interest payments.
The allowance for possible credit losses related to impaired loans is determined based on the difference of carrying value of loans and the present value of expected cash flows discounted at the loan’s effective interest rate or, as a practical expedient, the loan’s observable market price or the fair value of the collateral if the loan is collateral dependent.
Interest income received on impaired loans is either applied against principal or realized as interest income, according to management’s judgment as to the collectability of principal.
Troubled Debt Restructurings—The Company will classify a loan as a troubled debt restructuring if both (i) the borrower is experiencing financial difficulties and (ii) the borrower has been granted a concession. Concessions may include interest rate reductions or below market interest rates, principal forgiveness, restructuring amortization schedules and other actions intended to minimize potential losses. Interest is generally accrued on such loans in accordance with the new terms.
Allowance for Possible Credit Losses—The allowance for possible credit losses is a valuation allowance established through a provision for possible credit losses charged to expense, which represents management’s best estimate of probable losses on loans within the existing portfolio of loans. All losses are charged to the allowance for possible credit losses when the loss actually occurs or when a determination is made that a loss is likely to occur. Recoveries are credited to the allowance at the time of recovery.
The allowance, in the judgment of management, is necessary to reserve for the estimated loan losses and risks inherent in the loan portfolio. Therefore, the level of the allowance reflects management’s continuing evaluation
(Continued)
F-89
Table of Contents
FARMERS & MERCHANTS BANCSHARES, INC.
NOTES TO CONSOLIDATED FINANCIAL STATEMENTS
FOR THE YEARS ENDED DECEMBER 31, 2014 AND 2013
NOTE A BASIS OF PRESENTATION AND SUMMARY OF SIGNIFICANT ACCOUNTING POLICIES (Continued)
of industry concentrations, specific credit risks, loan loss experience, current loan portfolio quality, present economic, political and regulatory conditions, and unidentified losses inherent in the current loan portfolio, as well as trends in the foregoing. Portions of the allowance may be allocated for specific credits; however, generally, the entire allowance is available for any credit that, in management’s judgment, should be charged-off. While management utilizes its best judgment and information available, the ultimate adequacy of the allowance is dependent upon a variety of factors beyond the Company’s control, including the performance of the Company’s loan portfolio, the economy, changes in interest rates, and the view of the regulatory authorities toward loan classifications.
Concentrations of Risk—The Company’s investments are subject to various levels of risk associated with economic and political events beyond management’s control. Consequently, management’s judgment as to the level of losses that currently exist or may develop in the future involves the consideration of current and anticipated conditions and their potential effects on the Company’s investments. In determining fair value of these investments, management obtains information, which is considered reliable, from third parties in order to value its investments. Due to the level of uncertainty related to changes in the value of investment securities, it is possible that changes in risks could materially impact the amounts reflected herein in the near term.
Generally, the Company’s loans, loan commitments, and letters of credit have been granted to customers in the Company’s primary market area, which includes Harris and surrounding counties. The Company’s loans are typically secured by specific items of collateral including real property, consumer assets, and business assets. Although the Company has a diversified loan portfolio, a substantial portion of its debtors’ ability to honor their contracts is dependent on local economic conditions. Concentrations of credit by type of loan are set forth in Note C. It is the Company’s policy to not extend credit to any single borrower or group of related borrowers in excess of the Bank’s legal lending limit as defined by state and federal banking regulations.
Interest Rate Risk—The Company is principally engaged in providing short-term commercial loans with interest rates that fluctuate with various market indices and intermediate-term, fixed rate real estate loans. These loans are primarily funded through short-term demand deposits and longer-term certificates of deposit with fixed rates. The Company may borrow against available lines of credit to fund additional loan growth, or other investment strategies, should the need arise. Deposits that are not utilized to fund loans are invested in securities that meet the Company’s investment quality guidelines. Unrealized investment gains and losses resulting from changing market interest rates on investments available for sale are reflected in other comprehensive income.
A portion of the Company’s investments that have contractual maturity dates through the year 2026, bear fixed rates of interest and are collateralized by residential mortgages. Repayment of principal on these mortgage-backed securities is primarily dependent on the cash flows received from the payments on the underlying collateral to the bond issuer. Reduced prepayments extend the Company’s original anticipated holding period and thus increases interest rate risk over time, should market rates increase.
Premises and Equipment—Premises and equipment are carried at cost less accumulated depreciation and amortization. Depreciation expense is computed principally on the straight-line method over the estimated useful
(Continued)
F-90
Table of Contents
FARMERS & MERCHANTS BANCSHARES, INC.
NOTES TO CONSOLIDATED FINANCIAL STATEMENTS
FOR THE YEARS ENDED DECEMBER 31, 2014 AND 2013
NOTE A BASIS OF PRESENTATION AND SUMMARY OF SIGNIFICANT ACCOUNTING POLICIES (Continued)
lives of the assets. Land is carried at cost. Leasehold improvements are amortized over the life of the lease plus renewal options. Gains and losses on dispositions are included in noninterest income. During periods of real estate development, interest on construction costs is capitalized if considered material by management.
Bank Owned Life Insurance (BOLI)—The Company owns cash value life insurance policies which pay benefits to the Company upon the death of certain employees. Increases to the cash surrender value of the policies are noncash earnings and are recorded in noninterest income.
During 2014, the Company purchased approximately $10,202,500 in single premium BOLI policies. The income recorded on these policies was $249,562 and the associated of costs were $34,077, which are recorded net and are reflected in the cash surrender value of the policies and in other noninterest income in the Company’s consolidated financial statements at December 31, 2014.
Prepaid Expenses and Other Assets—Prepaid expenses are amortized into noninterest expense over the estimated useful life of the expenditure.
Other Real Estate Owned—Real estate and other assets acquired through repossession or foreclosure are held for sale and are initially recorded at the fair value of the asset less any selling costs, establishing a new cost basis. Outstanding loan balances are reduced to reflect this value through charges to the allowance for possible credit losses. Subsequent to repossession or foreclosure, the asset is carried at the lower of its new cost basis or fair value, less estimated costs to sell. Subsequent adjustments to reflect changes in value above or below the recorded amounts are recognized in income in the period such determinations are assessed. Required developmental costs associated with foreclosed property under construction are capitalized and considered in determining the fair value of the property. Operating expenses of these assets, net of related income, and gains and losses on their disposition are included in other noninterest income or expense.
Goodwill—ASC Topic 350, Goodwill and Other Intangible Assets, requires a regular assessment for impairment of goodwill, and a write down of the goodwill if impairment occurs. Management has determined goodwill recorded at December 31, 2014 and 2013 is not impaired.
Income Taxes—The Company files consolidated federal and state income tax returns. Deferred tax assets and liabilities are recognized for temporary differences when the tax basis of an asset or liability differs from that reported in the consolidated financial statements, and for carryforwards for tax credits and tax losses. Deferred tax assets and liabilities are measured using enacted tax rates expected to apply to taxable income in the years in which those temporary differences are expected to be recovered or settled. Deferred tax expense or benefit is recognized for the change in the asset or liability during the year. The Company’s net deferred tax asset is included in prepaid expenses and other assets in the December 31, 2014 and 2013 consolidated balance sheets.
A valuation allowance, if needed, reduces deferred tax assets to the expected amount most likely to be realized. Realization of deferred tax assets is dependent upon the generation of a sufficient level of future taxable income and recoverable taxes paid in prior years. Although realization is not assured, management believes it is more likely than not that all of the deferred tax assets will be realized. In addition, management does not believe there are any unrecorded deferred tax liabilities that are material to the consolidated financial statements.
(Continued)
F-91
Table of Contents
FARMERS & MERCHANTS BANCSHARES, INC.
NOTES TO CONSOLIDATED FINANCIAL STATEMENTS
FOR THE YEARS ENDED DECEMBER 31, 2014 AND 2013
NOTE A BASIS OF PRESENTATION AND SUMMARY OF SIGNIFICANT ACCOUNTING POLICIES (Continued)
The Company believes that all significant tax positions utilized by the Company will more likely than not be sustained upon examination. As of December 31, 2014, the tax years that remain subject to examination by the major tax jurisdictions under the statute of limitations are from the year 2011 forward (with limited exceptions). Tax penalties and interest, if any, would be accrued as incurred and would be classified as tax expense in the consolidated statements of income.
Treasury Stock—The Company has repurchased shares of its authorized and issued common stock which is now held in treasury pending use for general corporate purposes or retirement. At December 31, 2014 and 2013, the Company held 64,833 treasury shares which are reflected as a component of shareholders’ equity on the accompanying consolidated balance sheets.
Comprehensive Income—Comprehensive income includes all changes in shareholders’ equity during a period, except those resulting from transactions with shareholders. Besides net income, other components of the Company’s comprehensive income includes the effect of changes in the net unrealized gain/loss on securities available for sale.
Fair Value Measurements—In general, fair values of financial instruments are based upon quoted market prices, where available. If such quoted market prices are not available, fair value is based upon internally developed models that primarily use, as inputs, observable market-based parameters. Valuation adjustments may be made to ensure that financial instruments are recorded at fair value. These adjustments may include amounts to reflect counterparty credit quality and the entity’s creditworthiness, among other things, as well as unobservable parameters. Any such valuation adjustments are applied consistently over time.
The Company has not elected to account for any financial assets or liabilities as trading instruments for which changes in market value on these instruments would be recorded in the Company’s consolidated statement of income.
Transfers of Financial Assets—Transfers of financial assets are accounted for as sales when control over the assets has been surrendered. Control over transferred assets is deemed to be surrendered when (i) the assets have been isolated from the Company, (ii) the transferee obtains the right (free of conditions that constrain it from taking advantage of that right) to pledge or exchange the transferred assets, and (iii) the Company does not maintain effective control over the transferred assets through an agreement to repurchase them before their maturity.
If a transfer of an entire financial asset, a group of entire financial assets, or a participating interest in an entire financial asset does not meet the conditions for sale treatment, or if a transfer of a portion of an entire financial interest does not meet the definition of a participating interest, the transferor and the transferee shall account for the transfer as a secured borrowing with pledge of collateral. The transferor shall continue to report the transferred financial assets in its financial statements with no change in their measurement.
The Company’s loan participations sold are subject to these accounting guidelines and at December 31, 2014 and 2013, all transfers of financial assets subject to this guidance materially met the conditions to be treated as a sale.
(Continued)
F-92
Table of Contents
FARMERS & MERCHANTS BANCSHARES, INC.
NOTES TO CONSOLIDATED FINANCIAL STATEMENTS
FOR THE YEARS ENDED DECEMBER 31, 2014 AND 2013
NOTE A BASIS OF PRESENTATION AND SUMMARY OF SIGNIFICANT ACCOUNTING POLICIES (Continued)
New Accounting Standards and Disclosure Requirements—Accounting Standards Update (ASU) 2014-02, Intangibles—Goodwill and Other (Topic 350)—Under this update, an entity may elect an accounting alternative within U.S. GAAP to amortize goodwill on a straight-line basis over a period of ten years or less. An entity that elects this accounting alternative is required to make an accounting policy decision to test goodwill for impairment when a triggering event occurs that indicates that the fair value of the entity may be below its carrying amount. This accounting alternative, if elected, should be applied prospectively for years beginning after December 15, 2014. Early adoption and application is permitted. Management does not expect to adopt this accounting alternative and there is no expected impact to the Company’s consolidated financial statements.
ASU 2013-12, Definition of a Public Business Entity—an Addition to the Master Glossary amends the Master Glossary of the Financial Accounting Standards Board Accounting Standards Codification to include one definition of a public business entity for future use in U.S. GAAP, and identifies the type of business entities that are excluded from the scope of The Private Company Decision-Making Framework: A Guide for Evaluating Financial Accounting and Reporting for Private Companies. As a result of ASU 2013-12, the Company falls within the definition of a Public Business Entity and will apply accounting guidance accordingly. For the years ending December 31, 2014 and 2013, this guidance did not have a significant impact on the Company’s consolidated financial statements.
NOTE B SECURITIES
The amortized cost and estimated fair values of investments in debt securities held to maturity at December 31, 2014 and 2013 are summarized in the following tables:
| Amortized Cost |
Gross Unrealized Gains |
Gross Unrealized Losses |
Estimated Fair Value |
|||||||||||||
| 2014 |
||||||||||||||||
| U.S. Government and agency securities: |
||||||||||||||||
| Agency notes/bonds |
$ | 14,748,332 | $ | — | $ | (602,098 | ) | $ | 14,146,234 | |||||||
| Mortgage-backed securities |
353,228 | 15,309 | — | 368,537 | ||||||||||||
|
|
|
|
|
|
|
|
|
|||||||||
| $ | 15,101,560 | $ | 15,309 | $ | (602,098 | ) | $ | 14,514,771 | ||||||||
|
|
|
|
|
|
|
|
|
|||||||||
| 2013 |
||||||||||||||||
| U.S. Government and agency securities: |
||||||||||||||||
| Agency notes/bonds |
$ | 14,748,361 | $ | — | $ | (1,576,013 | ) | $ | 13,172,348 | |||||||
| Mortgage-backed securities |
488,617 | 27,344 | — | 515,961 | ||||||||||||
|
|
|
|
|
|
|
|
|
|||||||||
| $ | 15,236,978 | $ | 27,344 | $ | (1,576,013 | ) | $ | 13,688,309 | ||||||||
|
|
|
|
|
|
|
|
|
|||||||||
(Continued)
F-93
Table of Contents
FARMERS & MERCHANTS BANCSHARES, INC.
NOTES TO CONSOLIDATED FINANCIAL STATEMENTS
FOR THE YEARS ENDED DECEMBER 31, 2014 AND 2013
NOTE B SECURITIES (Continued)
The amortized cost and estimated fair value of securities at December 31, 2014, by contractual maturities, are shown below. Expected maturities will differ from contractual maturities because borrowers may have the right to call or prepay obligations with or without call or prepayment penalties.
| Securities Held to Maturity | ||||||||
| Amortized Cost |
Estimated Fair Value |
|||||||
| Amounts Maturing In: |
||||||||
| 5 years through 10 years |
$ | 10,518,227 | $ | 9,764,399 | ||||
| After 10 years |
4,583,333 | 4,750,372 | ||||||
|
|
|
|
|
|||||
| $ | 15,101,560 | $ | 14,514,771 | |||||
|
|
|
|
|
|||||
At December 31, 2014 and 2013, no securities were pledged to secure liabilities.
Gross realized gains on sales of securities available for sale during 2013 were $274,474. For the years ending December 31, 2014 and 2013, the Bank purchased treasury securities with a one day maturity and no gain or loss was realized or recorded on those maturities.
For securities in an unrealized loss position, the following table shows the gross unrealized loss and fair value by the length of time the individual security has been in a continuous unrealized loss position. At December 31, 2014 and 2013, there were two securities in a continuous loss position as follows:
| Less Than Twelve Months | Over Twelve Months | |||||||||||||||
| Gross Unrealized Losses |
Estimated Fair Value |
Gross Unrealized Losses |
Estimated Fair Value |
|||||||||||||
| 2014 |
||||||||||||||||
| U.S. Government and agency securities: |
||||||||||||||||
| Agency notes/bonds |
$ | — | $ | — | $ | (602,098 | ) | $ | 14,146,234 | |||||||
|
|
|
|
|
|
|
|
|
|||||||||
| 2013 |
||||||||||||||||
| U.S. Government and agency securities: |
||||||||||||||||
| Agency notes/bonds |
$ | (415,983 | ) | $ | 4,167,378 | $ | (1,160,030 | ) | $ | 9,004,970 | ||||||
|
|
|
|
|
|
|
|
|
|||||||||
The unrealized losses are attributable primarily to changes in market interest rates relative to those available when the securities were acquired. The fair value of these securities is expected to recover as the securities reach their maturity or re-pricing date, or if changes in market rates for such investments decline. Management does not believe that any of the securities are impaired due to reasons of credit quality. Accordingly, as of December 31, 2014, management believes the impairments for securities in an unrealized loss position are temporary and no impairment loss has been realized in the Company’s consolidated statements of income for the year then ended.
(Continued)
F-94
Table of Contents
FARMERS & MERCHANTS BANCSHARES, INC.
NOTES TO CONSOLIDATED FINANCIAL STATEMENTS
FOR THE YEARS ENDED DECEMBER 31, 2014 AND 2013
NOTE C LOANS
Loans by portfolio segment, at December 31, 2014 and 2013 are summarized as follows:
| 2014 | 2013 | |||||||
| Commercial and industrial |
$ | 82,267,542 | $ | 89,270,817 | ||||
| Commercial real estate |
240,434,839 | 228,125,084 | ||||||
| Residential real estate |
42,449,114 | 41,097,870 | ||||||
| Agriculture and farmland |
39,838,881 | 35,146,760 | ||||||
| Consumer and other |
5,738,272 | 6,855,469 | ||||||
|
|
|
|
|
|||||
| 410,728,648 | 400,496,000 | |||||||
| Less deferred loan fees, net |
(528,119 | ) | (428,097 | ) | ||||
| Less allowance for possible credit losses |
(4,553,856 | ) | (4,972,486 | ) | ||||
|
|
|
|
|
|||||
| $ | 405,646,673 | $ | 395,095,417 | |||||
|
|
|
|
|
|||||
At December 31, 2014 and 2013, included in consumer and other loans are $24,913 and $27,642, respectively, in overdrawn deposit accounts.
Portfolio Segments and Loan Classes
The Company has certain lending policies and procedures in place that are designed to maximize loan income within an acceptable level of risk. Management reviews and approves these policies and procedures on a regular basis. The Company’s loans are segmented by type as noted in the preceding table. The Company sub-segments commercial real estate loans into the following classes: commercial real estate mortgage and land acquisition and development. The Company sub-segments residential real estate into classes that include 1-4 family residential and multi-family residential mortgages.
Commercial and Industrial—The Company’s commercial and industrial loans include asset based revolving lines, equipment purchase money, and unsecured loans and are underwritten on the basis of the borrower’s ability to service the debt from income. The Company’s commercial and industrial loans represent credit extended to small to medium sized businesses generally for the purpose of providing working capital and equipment purchase financing. Commercial and industrial loans often are dependent on the profitable operations of the borrower. These credits are primarily made based on the identified cash flow of the borrower and secondarily on the underlying collateral provided by the borrower. Most commercial and industrial loans are secured by the assets being financed or other business assets such as accounts receivable or inventory and may also incorporate a personal guarantee. Some shorter term loans may be extended on an unsecured basis. In the case of loans secured by accounts receivable, the availability of funds for the repayment of these loans may be substantially dependent on the ability of the borrower to collect amounts due from its customers. The cash flows of borrowers may not be as expected and the collateral securing these loans may fluctuate, increasing the risk associated with this loan segment. As a result of the additional complexities, variables, and risks, commercial loans typically require more thorough underwriting and servicing than other types of loans.
Commercial Real Estate—The Company makes commercial real estate mortgage loans which are primarily viewed as cash flow loans and secondarily as loans secured by real estate. The properties securing the
(Continued)
F-95
Table of Contents
FARMERS & MERCHANTS BANCSHARES, INC.
NOTES TO CONSOLIDATED FINANCIAL STATEMENTS
FOR THE YEARS ENDED DECEMBER 31, 2014 AND 2013
NOTE C LOANS (Continued)
Company’s commercial real estate mortgage loans can be owner occupied or nonowner occupied. Concentrations within the various types of commercial properties are monitored by management in order to assess the risks in the portfolio. The repayment of these loans is largely dependent on the successful operation of the property securing the loan or the business conducted on the property and securing the loan. Accordingly, repayment of these loans may be subject to adverse conditions in the real estate market or the economy to a greater extent than other types of loans. The Company seeks to minimize these risks in a variety of ways in connection with underwriting these loans including giving careful consideration to the property’s operating history, future operating projections, current and projected occupancy, location and the physical condition of the property.
Land acquisition and development loans are generally nonowner occupied and are subject to certain risks attributable to the fact that loan funds are advanced over the construction phase and the project is of uncertain value prior to its completion. Construction loans are generally based upon estimates of costs and value associated with the completed project with repayment dependent, in part, on the success of the ultimate project rather than the ability of the borrower or guarantor to repay the loan. The Company has underwriting and funding procedures designed to address what it believes to be the risks associated with such loans; however, no assurance can be given the procedures will prevent losses resulting from the risks described above.
Residential Real Estate—The Company’s lending activities also include the origination of 1-4 family residential and multi-family residential loans. The terms of these loans typically range from five to thirty years. The Company requires the borrowers to maintain mortgage title insurance and hazard insurance. The Company has elected to keep all 1-4 family residential loans for its own account rather than selling such loans into the secondary market. By doing so, the Company is able to realize a higher yield on these loans; however, the Company also incurs interest rate risk as well as the risks associated with nonpayments on such loans.
Agriculture and Farmland—The Company provides crop production and farm equipment loans to local area farmers. The Company also extends credit to local farmers secured by agriculture real estate and improvements thereon. Agriculture real estate includes land known to be used for agricultural purposes, such as crop and livestock production. The Company evaluates agricultural borrowers primarily based on their historical profitability, level of experience in their particular agricultural industry, overall financial capacity and the availability of secondary collateral to withstand economic and natural variations common to the industry.
Consumer and Other—The Company’s consumer loans include lines of credit, automobile loans, personal loans (collateralized and uncollateralized) and deposit account collateralized loans. The terms of these loans typically range from one to ten years and vary based on the nature of collateral and size of the loan. Consumer loan collections are dependent on the borrower’s continuing financial stability, and thus more likely to be adversely affected by job loss, illness or personal bankruptcy. Furthermore, the application of various federal and state laws may limit the amount which can be recovered on such loans. To monitor and manage consumer loan risk, policies and procedures are developed and modified, as deemed appropriate by management.
Other loans consist of smaller loans extended to individuals or small businesses for various personal or business purposes.
(Continued)
F-96
Table of Contents
FARMERS & MERCHANTS BANCSHARES, INC.
NOTES TO CONSOLIDATED FINANCIAL STATEMENTS
FOR THE YEARS ENDED DECEMBER 31, 2014 AND 2013
NOTE D LOAN PERFORMANCE
The following is an aging analysis of loans past due and nonaccrual loans, segregated by loan class, as of December 31, 2014 and 2013. The Company did not have any loans greater than 90 days and accruing as of December 31, 2014 and 2013.
| Current | 30-89 days past due & accruing |
Nonaccrual Loans |
Total Loans | |||||||||||||||||
| 2014 |
||||||||||||||||||||
| Commercial and industrial |
$ | 81,153,771 | $ | 367,472 | $ | 746,299 | $ | 82,267,542 | ||||||||||||
| Commercial real estate mortgage |
187,684,815 | 574,382 | 11,930 | 188,271,127 | ||||||||||||||||
| Land acquisition and development |
40,211,309 | — | 238,117 | 40,449,426 | ||||||||||||||||
| 1-4 family residential |
40,717,345 | 1,654,158 | 77,611 | 42,449,114 | ||||||||||||||||
| Multi-family residential |
11,714,286 | — | — | 11,714,286 | ||||||||||||||||
| Agriculture and farmland |
38,224,987 | 569,867 | 1,044,027 | 39,838,881 | ||||||||||||||||
| Consumer and other |
5,469,797 | 209,682 | 58,793 | 5,738,272 | ||||||||||||||||
|
|
|
|
|
|
|
|
|
|||||||||||||
| Total |
$ | 405,176,310 | $ | 3,375,561 | $ | 2,176,777 | $ | 410,728,648 | ||||||||||||
|
|
|
|
|
|
|
|
|
|||||||||||||
| Current | 30-89 days past due & accruing |
Nonaccrual Loans |
Total Loans | |||||||||||||
| 2013 |
||||||||||||||||
| Commercial and industrial |
$ | 88,182,877 | $ | 342,050 | $ | 745,890 | $ | 89,270,817 | ||||||||
| Commercial real estate mortgage |
186,213,748 | — | 853,485 | 187,067,233 | ||||||||||||
| Land acquisition and development |
33,551,604 | 523,176 | 230,407 | 34,305,187 | ||||||||||||
| 1-4 family residential |
40,907,516 | 158,157 | 32,197 | 41,097,870 | ||||||||||||
| Multi-family residential |
6,752,664 | — | — | 6,752,664 | ||||||||||||
| Agriculture and farmland |
33,671,497 | 238,398 | 1,236,865 | 35,146,760 | ||||||||||||
| Consumer and other |
6,555,190 | 258,199 | 42,080 | 6,855,469 | ||||||||||||
|
|
|
|
|
|
|
|
|
|||||||||
| Total |
$ | 395,835,096 | $ | 1,519,980 | $ | 3,140,924 | $ | 400,496,000 | ||||||||
|
|
|
|
|
|
|
|
|
|||||||||
For the years ending December 31, 2014 and 2013, interest income on nonaccrual loans was reversed when the loan was placed on nonaccrual. Interest income that would have been earned under the original terms of the loans since placed on nonaccrual was approximately $125,000 and $88,900 at December 31, 2014 and 2013, respectively.
(Continued)
F-97
Table of Contents
FARMERS & MERCHANTS BANCSHARES, INC.
NOTES TO CONSOLIDATED FINANCIAL STATEMENTS
FOR THE YEARS ENDED DECEMBER 31, 2014 AND 2013
NOTE D LOAN PERFORMANCE (Continued)
Troubled Debt Restructurings
The Company had the following troubled debt restructurings outstanding as of December 31, 2014 and 2013:
| Number of Contracts |
Outstanding Principal Balance |
|||||||
| 2014 |
||||||||
| Commercial and industrial |
11 | $ | 1,101,237 | |||||
| Commercial real estate mortgage |
2 | 316,557 | ||||||
| Land acquisition and development |
4 | 1,385,807 | ||||||
| 1-4 family residential |
1 | 609,341 | ||||||
| Agriculture and farmland |
9 | 1,543,434 | ||||||
| Consumer and other |
1 | 4,062 | ||||||
|
|
|
|||||||
| $ | 4,960,438 | |||||||
|
|
|
|||||||
| 2013 |
||||||||
| Commercial and industrial |
14 | $ | 1,264,391 | |||||
| Commercial real estate mortgage |
2 | 339,548 | ||||||
| Land acquisition and development |
4 | 1,532,010 | ||||||
| 1-4 family residential |
1 | 629,907 | ||||||
| Agriculture and farmland |
3 | 1,247,365 | ||||||
| Consumer and other |
1 | 8,262 | ||||||
|
|
|
|||||||
| $ | 5,021,483 | |||||||
|
|
|
|||||||
The Company had five borrowers default on troubled debt restructurings during the year ended December 31, 2014 in the amount of $1,813,453. The Company had five borrowers default on troubled debt restructurings during the year ended December 31, 2013 in the amount of $981,698. Default is determined at 90 days or more past due or when a loan is written off.
During the years ended December 31, 2014 and 2013, the modifications were primarily related to extending the amortization periods of the loans. The Company did not grant principal reductions on any restructured loan. For the years ended December 31, 2014 and 2013 the Company added $726,325 and $1,826,930, respectively, in new troubled debt restructurings, all of which were outstanding at year end. Two and five loans restructured during the years ended December 31, 2014 and 2013, respectively, were on nonaccrual status as of year end. Specific reserves on troubled debt restructuring were $254,700 and $849,462 at December 31, 2014 and 2013, respectively.
NOTE E ALLOWANCE FOR POSSIBLE CREDIT LOSSES
For purposes of determining the allowance for possible credit losses, the Company considers the loans in its portfolio by segment, class, and risk grade. Management uses significant judgment to determine the estimation method that fits the credit risk characteristics of each portfolio segment or class. To assist in the assessment of
(Continued)
F-98
Table of Contents
FARMERS & MERCHANTS BANCSHARES, INC.
NOTES TO CONSOLIDATED FINANCIAL STATEMENTS
FOR THE YEARS ENDED DECEMBER 31, 2014 AND 2013
NOTE E ALLOWANCE FOR POSSIBLE CREDIT LOSSES (Continued)
risk, management reviews reports related to loan production, loan quality, concentrations of credit, loan delinquencies, and nonperforming and potential problem loans. The Company utilizes an independent third party loan review service to review the credit risk assigned to loans on a periodic basis and the results are presented to management for review.
The following table presents a detail of the activity in the allowance for possible credit losses segregated by loan class for the years ending December 31, 2014 and 2013.
| Balance beginning of year |
Provisions | Charge-Offs | Recoveries | Balance end of year |
||||||||||||||||
| 2014 |
||||||||||||||||||||
| Commercial and industrial |
$ | 1,298,715 | $ | 561,980 | $ | (840,041 | ) | $ | 144,777 | $ | 1,165,431 | |||||||||
| Commercial real estate mortgage |
1,188,873 | (194,358 | ) | — | 155,000 | 1,149,515 | ||||||||||||||
| Land acquisition and development |
973,030 | (518,160 | ) | — | 57,057 | 511,927 | ||||||||||||||
| 1-4 family residential |
456,893 | (36,962 | ) | — | 900 | 420,831 | ||||||||||||||
| Multi-family residential |
44,618 | 93,219 | — | — | 137,837 | |||||||||||||||
| Agriculture and farmland |
582,055 | (15,863 | ) | — | 108,392 | 674,584 | ||||||||||||||
| Consumer and other |
68,629 | 38,044 | (62,005 | ) | 17,290 | 61,958 | ||||||||||||||
| Unallocated |
359,673 | 72,100 | — | — | 431,773 | |||||||||||||||
|
|
|
|
|
|
|
|
|
|
|
|||||||||||
| Total |
$ | 4,972,486 | $ | — | $ | (902,046 | ) | $ | 483,416 | $ | 4,553,856 | |||||||||
|
|
|
|
|
|
|
|
|
|
|
|||||||||||
| 2013 |
||||||||||||||||||||
| Commercial and industrial |
$ | 1,445,894 | $ | 161,196 | $ | (374,531 | ) | $ | 66,156 | $ | 1,298,715 | |||||||||
| Commercial real estate mortgage |
1,169,852 | 19,021 | — | — | 1,188,873 | |||||||||||||||
| Land acquisition and development |
1,614,528 | (711,081 | ) | — | 69,583 | 973,030 | ||||||||||||||
| 1-4 family residential |
741,491 | (89,964 | ) | (195,534 | ) | 900 | 456,893 | |||||||||||||
| Multi-family residential |
49,493 | (4,875 | ) | — | — | 44,618 | ||||||||||||||
| Agriculture and farmland |
522,930 | 270,002 | (220,022 | ) | 9,145 | 582,055 | ||||||||||||||
| Consumer and other |
108,478 | 21,252 | (79,522 | ) | 18,421 | 68,629 | ||||||||||||||
| Unallocated |
1,025,224 | (665,551 | ) | — | — | 359,673 | ||||||||||||||
|
|
|
|
|
|
|
|
|
|
|
|||||||||||
| Total |
$ | 6,677,890 | $ | (1,000,000 | ) | $ | (869,609 | ) | $ | 164,205 | $ | 4,972,486 | ||||||||
|
|
|
|
|
|
|
|
|
|
|
|||||||||||
Risk Grading
As part of the on-going monitoring of the credit quality of the Company’s loan portfolio and methodology for calculating the allowance for possible credit losses, management assigns and tracks loan grades to be used as credit quality and risk indicators. The following is a general description of the loan grades used as of December 31, 2014 and 2013.
Grade 1-3—This category of credits are considered “pass” which indicates prudent underwriting and a normal amount of risk. The range of risk within these credits can vary from little to no risk with cash securing a credit, to a level of risk that requires a strong secondary source of repayment on the debt. Pass credits with a higher level
(Continued)
F-99
Table of Contents
FARMERS & MERCHANTS BANCSHARES, INC.
NOTES TO CONSOLIDATED FINANCIAL STATEMENTS
FOR THE YEARS ENDED DECEMBER 31, 2014 AND 2013
NOTE E ALLOWANCE FOR POSSIBLE CREDIT LOSSES (Continued)
of risk may be to borrowers that are higher leveraged, less well capitalized or in an industry or economic area that is known to carry a higher level of risk, volatility, or susceptibility to weaknesses in the economy. This higher risk grade may be assigned due to out of date credit information, as well as collateral information which may need to be updated for current market value in order to allow a credit quality analysis of the credit.
Grade 4—Credits in this category contain more than the normal amount of risk and are referred to as “other assets especially mentioned”, or OAEM, in accordance with regulatory guidelines. These credits possess clearly identifiable temporary weaknesses or trends that, if not corrected or revised, will result in a condition that exposes the Company to higher level of risk of loss.
Grade 5—Credits in this category are “substandard” in accordance with regulatory guidelines and of unsatisfactory credit quality with well defined weaknesses or weaknesses that jeopardize the liquidation of the debt. Credits in this category are inadequately protected by the current sound worth and paying capacity of the obligor or the collateral pledged, if any, and may be placed on nonaccrual status as deemed appropriate by management. These credits are characterized by the distinct possibility that the Company will sustain some loss if the deficiencies are not corrected. Often, the assets in this category will have a valuation allowance representative of management’s estimated loss that is probable to be incurred.
Grade 6—Credits in this category are considered “doubtful” in accordance with regulatory guidelines, are placed on nonaccrual status and may be dependent upon collateral having a value that is difficult to determine or upon some near-term event which lacks certainty. Generally, these credits will have a valuation allowance based upon management’s best estimate of the losses probable to occur in the liquidation of the debt.
Grade 7—Credits in this category are considered “loss” in accordance with regulatory guidelines and are considered uncollectible and of such little value as to question their continued existence as assets on the Company’s consolidated financial statements. Such credits are to be charged off or charged down when payment is acknowledged to be uncertain or when the timing or value of payments cannot be determined. This category does not intend to imply that the debt, or some portion of it will never be paid, nor does it in any way imply that the debt will be forgiven.
(Continued)
F-100
Table of Contents
FARMERS & MERCHANTS BANCSHARES, INC.
NOTES TO CONSOLIDATED FINANCIAL STATEMENTS
FOR THE YEARS ENDED DECEMBER 31, 2014 AND 2013
NOTE E ALLOWANCE FOR POSSIBLE CREDIT LOSSES (Continued)
The following table presents risk grades and classified loans by loan class at December 31, 2014 and 2013. Pass loans include risk grades 1 through 3. Classified loans include risk grades 4, 5, 6, and 7. The Company had no loans graded 7 at December 31, 2014 and 2013.
| Pass | Grade 4 | Grade 5 | Grade 6 | Total Loans | ||||||||||||||||
| 2014 |
||||||||||||||||||||
| Commercial and industrial |
$ | 79,355,052 | $ | 1,158,999 | $ | 1,738,220 | $ | 15,271 | $ | 82,267,542 | ||||||||||
| Commercial real estate mortgage |
187,847,329 | 250,021 | 173,777 | — | 188,271,127 | |||||||||||||||
| Land acquisition and development |
37,810,223 | 1,881,420 | 757,783 | — | 40,449,426 | |||||||||||||||
| 1-4 family residential |
41,388,949 | 197,525 | 862,640 | — | 42,449,114 | |||||||||||||||
| Multi-family residential |
11,714,286 | — | — | — | 11,714,286 | |||||||||||||||
| Agriculture and farmland |
37,853,357 | 69,295 | 1,916,229 | — | 39,838,881 | |||||||||||||||
| Consumer and other |
5,624,112 | 7,673 | 106,487 | — | 5,738,272 | |||||||||||||||
|
|
|
|
|
|
|
|
|
|
|
|||||||||||
| Total |
$ | 401,593,308 | $ | 3,564,933 | $ | 5,555,136 | $ | 15,271 | $ | 410,728,648 | ||||||||||
|
|
|
|
|
|
|
|
|
|
|
|||||||||||
| Pass | Grade 4 | Grade 5 | Grade 6 | Total Loans | ||||||||||||||||
| 2013 |
||||||||||||||||||||
| Commercial and industrial |
$ | 84,413,581 | $ | 3,029,617 | $ | 1,791,568 | $ | 36,051 | $ | 89,270,817 | ||||||||||
| Commercial real estate mortgage |
184,105,783 | 1,973,163 | 988,287 | — | 187,067,233 | |||||||||||||||
| Land acquisition and development |
31,418,039 | 318,565 | 2,568,583 | — | 34,305,187 | |||||||||||||||
| 1-4 family residential |
39,811,842 | 399,414 | 886,614 | — | 41,097,870 | |||||||||||||||
| Multi-family residential |
6,752,664 | — | — | — | 6,752,664 | |||||||||||||||
| Agriculture and farmland |
33,703,279 | 71,000 | 1,372,481 | — | 35,146,760 | |||||||||||||||
| Consumer and other |
6,753,947 | 29,141 | 72,381 | — | 6,855,469 | |||||||||||||||
|
|
|
|
|
|
|
|
|
|
|
|||||||||||
| Total |
$ | 386,959,135 | $ | 5,820,900 | $ | 7,679,914 | $ | 36,051 | $ | 400,496,000 | ||||||||||
|
|
|
|
|
|
|
|
|
|
|
|||||||||||
(Continued)
F-101
Table of Contents
FARMERS & MERCHANTS BANCSHARES, INC.
NOTES TO CONSOLIDATED FINANCIAL STATEMENTS
FOR THE YEARS ENDED DECEMBER 31, 2014 AND 2013
NOTE E ALLOWANCE FOR POSSIBLE CREDIT LOSSES (Continued)
The Company’s recorded investment in loans and allowance for credit losses as of December 31, 2014 and 2013 related to each balance in the allowance for possible credit losses by loan class and disaggregated on the basis of the Company’s impairment methodology is as follows:
| Loans individually evaluated for impairment |
Loans collectively evaluated for impairment |
Total Loans | Allowance related to loans individually evaluated for impairment |
|||||||||||||
| 2014 |
||||||||||||||||
| Commercial and industrial |
$ | 2,912,491 | $ | 79,355,051 | $ | 82,267,542 | $ | 435,506 | ||||||||
| Commercial real estate mortgage |
423,797 | 187,847,330 | 188,271,127 | — | ||||||||||||
| Land acquisition and development |
2,639,204 | 37,810,222 | 40,449,426 | 58,000 | ||||||||||||
| 1-4 family residential |
1,060,165 | 41,388,949 | 42,449,114 | — | ||||||||||||
| Multi-family residential |
— | 11,714,286 | 11,714,286 | — | ||||||||||||
| Agriculture and farmland |
1,985,524 | 37,853,357 | 39,838,881 | 57,115 | ||||||||||||
| Consumer and other |
114,159 | 5,624,113 | 5,738,272 | — | ||||||||||||
|
|
|
|
|
|
|
|
|
|||||||||
| Total |
$ | 9,135,340 | $ | 401,593,308 | $ | 410,728,648 | $ | 550,621 | ||||||||
|
|
|
|
|
|
|
|
|
|||||||||
| Loans individually evaluated for impairment |
Loans collectively evaluated for impairment |
Total Loans | Allowance related to loans individually evaluated for impairment |
|||||||||||||
| 2013 |
||||||||||||||||
| Commercial and industrial |
$ | 745,890 | $ | 88,524,927 | $ | 89,270,817 | $ | 673,847 | ||||||||
| Commercial real estate mortgage |
853,485 | 186,213,748 | 187,067,233 | 18,290 | ||||||||||||
| Land acquisition and development |
2,568,583 | 31,736,604 | 34,305,187 | 400,585 | ||||||||||||
| 1-4 family residential |
662,104 | 40,435,766 | 41,097,870 | — | ||||||||||||
| Multi-family residential |
— | 6,752,664 | 6,752,664 | — | ||||||||||||
| Agriculture and farmland |
1,236,865 | 33,909,895 | 35,146,760 | — | ||||||||||||
| Consumer and other |
42,080 | 6,813,389 | 6,855,469 | — | ||||||||||||
|
|
|
|
|
|
|
|
|
|||||||||
| Total |
$ | 6,109,007 | $ | 394,386,993 | $ | 400,496,000 | $ | 1,092,722 | ||||||||
|
|
|
|
|
|
|
|
|
|||||||||
(Continued)
F-102
Table of Contents
FARMERS & MERCHANTS BANCSHARES, INC.
NOTES TO CONSOLIDATED FINANCIAL STATEMENTS
FOR THE YEARS ENDED DECEMBER 31, 2014 AND 2013
NOTE E ALLOWANCE FOR POSSIBLE CREDIT LOSSES (Continued)
The following table reflects the unpaid principal balances for impaired loans, segregated by loan class, with the associated allowance amount as of December 31, 2014 and 2013:
| Impaired loans without specific allowance |
Impaired loans with specific allowance |
Related allowance |
||||||||||
| 2014 |
||||||||||||
| Commercial and industrial |
$ | 2,201,326 | $ | 711,165 | $ | 435,506 | ||||||
| Commercial real estate mortgage |
423,797 | — | — | |||||||||
| Land acquisition and development |
2,127,055 | 512,149 | 58,000 | |||||||||
| 1-4 family residential |
1,060,165 | — | — | |||||||||
| Agriculture and farmland |
1,793,161 | 192,363 | 57,115 | |||||||||
| Consumer and other |
114,159 | — | — | |||||||||
|
|
|
|
|
|
|
|||||||
| Total |
$ | 7,719,663 | $ | 1,415,677 | $ | 550,621 | ||||||
|
|
|
|
|
|
|
|||||||
| 2013 |
||||||||||||
| Commercial and industrial |
$ | 72,043 | $ | 673,847 | $ | 673,847 | ||||||
| Commercial real estate mortgage |
631,810 | 221,675 | 18,290 | |||||||||
| Land acquisition and development |
230,407 | 2,338,176 | 400,585 | |||||||||
| 1-4 family residential |
662,104 | — | — | |||||||||
| Agriculture and farmland |
1,236,865 | — | — | |||||||||
| Consumer and other |
42,080 | — | — | |||||||||
|
|
|
|
|
|
|
|||||||
| Total |
$ | 2,875,309 | $ | 3,233,698 | $ | 1,092,722 | ||||||
|
|
|
|
|
|
|
|||||||
NOTE F PREMISES AND EQUIPMENT
Premises and equipment at December 31, 2014 and 2013 are summarized as follows:
| 2014 | 2013 | |||||||
| Land |
$ | 1,898,069 | $ | 1,898,069 | ||||
| Buildings |
5,683,916 | 5,683,916 | ||||||
| Leasehold Improvements |
429,780 | 432,845 | ||||||
| Furniture and Equipment |
2,110,885 | 2,359,668 | ||||||
|
|
|
|
|
|||||
| Total |
10,122,650 | 10,374,498 | ||||||
| Less accumulated depreciation and amoritization |
(3,415,319 | ) | (3,487,444 | ) | ||||
|
|
|
|
|
|||||
| Total, net |
$ | 6,707,331 | $ | 6,887,054 | ||||
|
|
|
|
|
|||||
(Continued)
F-103
Table of Contents
FARMERS & MERCHANTS BANCSHARES, INC.
NOTES TO CONSOLIDATED FINANCIAL STATEMENTS
FOR THE YEARS ENDED DECEMBER 31, 2014 AND 2013
NOTE F PREMISES AND EQUIPMENT (Continued)
Future minimum rent commitments under various leases pursuant to the terms of noncancelable operating lease agreements in effect at December 31, 2014 are as follows:
| 2015 |
$ | 377,211 | ||
| 2016 |
283,539 | |||
| 2017 |
200,837 | |||
| 2018 |
170,335 | |||
| 2019 |
173,896 | |||
| Thereafter |
388,743 | |||
|
|
|
|||
| $ | 1,594,558 | |||
|
|
|
It is expected that in the normal course of business, leases that expire will be renewed or replaced by leases on other property or equipment.
Total rent expense for operating leases of premises and equipment was $420,368 and $403,893 for the years ended December 31, 2014 and 2013, respectively.
NOTE G ACCRUED INTEREST RECEIVABLE
Accrued interest receivable consists of the following at December 31, 2014 and 2013:
| 2014 | 2013 | |||||||
| Loans |
$ | 1,366,571 | $ | 1,372,227 | ||||
| Investments |
84,964 | 85,492 | ||||||
|
|
|
|
|
|||||
| $ | 1,451,535 | $ | 1,457,719 | |||||
|
|
|
|
|
|||||
NOTE H OTHER REAL ESTATE OWNED
An analysis of activity in other real estate owned for the years ended December 31, 2014 and 2013 is as follows:
| 2014 | 2013 | |||||||
| Balance at beginning of the year |
$ | 2,035,252 | $ | 3,870,190 | ||||
| Noncash foreclosure and repossession of real estate in partial satisfaction of debt |
— | 368,022 | ||||||
| Sales, at carrying value |
(1,975,674 | ) | (2,081,561 | ) | ||||
| Market value adjustments |
(59,578 | ) | (121,399 | ) | ||||
|
|
|
|
|
|||||
| Balance at end of the year |
$ | — | $ | 2,035,252 | ||||
|
|
|
|
|
|||||
(Continued)
F-104
Table of Contents
FARMERS & MERCHANTS BANCSHARES, INC.
NOTES TO CONSOLIDATED FINANCIAL STATEMENTS
FOR THE YEARS ENDED DECEMBER 31, 2014 AND 2013
NOTE H OTHER REAL ESTATE OWNED (Continued)
For the years ended December 31, 2014 and 2013, the Company recorded a net loss, respectively, on sales of other real estate owned as follows:
| 2014 | 2013 | |||||||
| Proceeds from sales |
$ | 1,312,339 | $ | 1,934,087 | ||||
| Sales financed |
488,980 | — | ||||||
| Carrying value recorded |
(1,975,674 | ) | (2,081,561 | ) | ||||
|
|
|
|
|
|||||
| Loss on sale of other real estate owned, net |
$ | (174,355 | ) | $ | (147,474 | ) | ||
|
|
|
|
|
|||||
Expenses related to other real estate owned that were charged against earnings amounted to $131,958 and $308,668 for the years ended December 31, 2014 and 2013, respectively, and are included in loan related expenses in the Company’s consolidated statements of income. Also included in loan related expenses, are the recorded write downs to fair value.
NOTE I INVESTMENT IN UNCONSOLIDATED SUBSIDIARIES
FriendTX Holdings, Inc.
In 2011, the Bank acquired through foreclosure a 49% limited and 1% general partnership interest in Friendswood Lake Commercial Properties (FLCP), a Texas limited liability partnership. In 2012, the Bank established FriendTX Holdings, Inc. (the Subsidiary), a Texas limited liability corporation, for the primary purpose of owning the combined 50% interest in FLCP.
FLCP develops and sells tracts of land in Friendswood, Texas. FLCP records purchases and sales of land on the date funds are paid or received. Interest and taxes incurred during property development are capitalized as one of the elements of cost and are amortized over the estimated useful lives of the assets. No interest was capitalized during the years ended December 31, 2014 and 2013.
During the year ending December 31, 2014, all tracks of land were sold for aggregate proceeds of $2,200,000, of which 50% was distributed to FriendTX Holdings, Inc., and resulted in a realized gain on sale of $362,374, based upon the Subsidiary’s $737,626 recorded investment in the partnership, which is net of a valuation allowance of approximately $370,000. The valuation allowance was attributable to poor credit quality of the borrower in combination with a discount applied to the appraised value of the land held as collateral prior to foreclosure. This gain is reflected in the Company’s consolidated statement of income as of December 31, 2014. A final tax return is expected to be filed as of December 31, 2014 and the subsidiary will be dissolved effective that date.
(Continued)
F-105
Table of Contents
FARMERS & MERCHANTS BANCSHARES, INC.
NOTES TO CONSOLIDATED FINANCIAL STATEMENTS
FOR THE YEARS ENDED DECEMBER 31, 2014 AND 2013
NOTE I INVESTMENT IN UNCONSOLIDATED SUBSIDIARIES (Continued)
FLCP recorded no revenue and general and administrative expenses for the years ended December 31, 2014 and 2013. Summarized unaudited financial information related to FLCP’s balance sheet is as follows at December 31, 2013:
| 2013 | ||||
| Current Assets |
$ | 151,221 | ||
| Land |
2,234,590 | |||
|
|
|
|||
| Total assets |
$ | 2,385,811 | ||
|
|
|
|||
| Current liabilities |
121,482 | |||
| Partner’s equity |
2,264,329 | |||
|
|
|
|||
| Total Liabilities and partners’ equity |
$ | 2,385,811 | ||
|
|
|
|||
Trust II and Trust III
At December 31, 2014 and 2013, $375,407 and $395,807 represents the investment in Trust II and Trust III as described at Note O.
NOTE J DEPOSITS
The aggregate amount of time deposits in denominations of $100,000 or more at December 31, 2014 and 2013 was $114,635,036 and $102,271,149, respectively. Interest expense for time deposits in denominations of $100,000 or more was $987,135 and $956,489 for the years ended December 31, 2014 and 2013, respectively.
At December 31, 2014, the scheduled maturities of all time deposits are as follows:
| 2015 |
$ | 131,386,295 | ||
| 2016 |
27,598,180 | |||
| 2017 |
1,280,732 | |||
| 2018 |
— | |||
| 2019 |
17,323 | |||
|
|
|
|||
| $ | 160,282,530 | |||
|
|
|
At December 31, 2014 and 2013, the Company had $2,062,316 and $2,047,667 in brokered deposits, respectively.
NOTE K RELATED PARTY TRANSACTIONS
In the ordinary course of business, the Company has and expects to continue to conduct routine banking business with related parties, including its executive officers and directors of the Company and the Bank, and Company shareholders, and their affiliates in which they directly or indirectly have 5% or more beneficial ownership.
(Continued)
F-106
Table of Contents
FARMERS & MERCHANTS BANCSHARES, INC.
NOTES TO CONSOLIDATED FINANCIAL STATEMENTS
FOR THE YEARS ENDED DECEMBER 31, 2014 AND 2013
NOTE K RELATED PARTY TRANSACTIONS (Continued)
Loans—In the opinion of management, loans to related parties were entered into in the ordinary course of business and were made on substantially the same terms, including interest rates and collateral, as those prevailing at the time of comparable transactions and did not involve more than a normal risk of collectability or present any other unfavorable features to the Company. Loans to such borrowers at December 31, 2014 and 2013, respectively, are summarized below.
| 2014 | 2013 | |||||||
| Balance, beginning of year |
$ | 2,255,767 | $ | 2,456,499 | ||||
| New loans |
20,000 | 1,339,710 | ||||||
| Repayments |
(71,025 | ) | (1,540,442 | ) | ||||
|
|
|
|
|
|||||
| Balance, end of year |
$ | 2,204,742 | $ | 2,255,767 | ||||
|
|
|
|
|
|||||
Unfunded Commitments—At December 31, 2014 and 2013, the Company had approximately $959,200 and $1,175,000, respectively, in unfunded loan commitments to related parties.
Deposits—The Company held related party (which include officers of the bank) deposits of $8,526,391 and $18,620,876 at December 31, 2014 and 2013, respectively.
Borrowings—The Company held related party borrowings of $5,000,000 at December 31, 2014 and 2013. Refer to Note N for more information on Company borrowings.
NOTE L FINANCIAL INSTRUMENTS WITH OFF-BALANCE-SHEET RISK
The Company is party to various financial instruments with off-balance-sheet risk in the normal course of business to meet the financing needs of its customers. These financial instruments include commitments to extend credit for loans in process, commercial lines of credit, overdraft protection lines, and standby letters of credit at both fixed and variable rates of interest. Those instruments involve, to varying degrees, elements of credit and interest rate risk in excess of the amounts recognized in the consolidated balance sheets. The contract or notional amounts of those instruments reflect the extent of the involvement the Company has in particular classes of financial instruments. The Company’s exposure to credit loss in the event of nonperformance by the other party to the financial instrument for commitments to extend credit and standby letters of credit is represented by the contractual notional amount of those instruments. The Company uses the same credit policies in making these commitments and conditional obligations as it does for on-balance-sheet instruments.
The Company evaluates each customer’s credit worthiness on a case-by-case basis. The amount of collateral obtained, if considered necessary by the Company upon extension of credit, is based on management’s credit evaluation of the customer.
(Continued)
F-107
Table of Contents
FARMERS & MERCHANTS BANCSHARES, INC.
NOTES TO CONSOLIDATED FINANCIAL STATEMENTS
FOR THE YEARS ENDED DECEMBER 31, 2014 AND 2013
NOTE L FINANCIAL INSTRUMENTS WITH OFF-BALANCE-SHEET RISK (Continued)
The following is a summary of the various financial instruments whose contract amounts represent credit risk at December 31, 2014 and 2013:
| 2014 | 2013 | |||||||
| Commitments to extend credit |
$ | 79,237,722 | $ | 55,215,699 | ||||
|
|
|
|
|
|||||
| Standby letters of credit |
$ | 2,804,126 | $ | 4,577,796 | ||||
|
|
|
|
|
|||||
Commitments to extend credit are agreements to lend to a customer as long as there is no violation of any condition established in the contract. Commitments generally have fixed expiration dates or other termination clauses and may require payment of a fee. Since many of the commitments are expected to expire without being fully drawn upon, the total commitment amounts disclosed above do not necessarily represent future cash requirements.
Standby letters of credit are conditional commitments issued by the Company to guarantee the performance of a customer to a third party. The credit risk involved in issuing letters of credit is essentially the same as that involved in extending loan facilities to its customers.
NOTE M FEDERAL INCOME TAXES
The components of the provision for federal income tax expense at December 31, 2014 and 2013 are as follows:
| 2014 | 2013 | |||||||
| Current |
$ | 421,086 | $ | 1,497,983 | ||||
| Deferred |
593,883 | 755,763 | ||||||
|
|
|
|
|
|||||
| Federal income tax expense |
$ | 1,014,969 | $ | 2,253,746 | ||||
|
|
|
|
|
|||||
Income tax expense at the statutory rate of 34% for the year ended December 31, 2014 and 2013 differs from the federal income tax expense for financial reporting purposes as follows:
| 2014 | 2013 | |||||||
| Tax expense calculated at statutory rate |
$ | 1,083,712 | $ | 2,259,980 | ||||
| Increase (decrease) resulting from: |
||||||||
| Nondeductible travel and entertainment |
4,992 | 4,484 | ||||||
| Nondeductible memberships and dues |
9,800 | 9,869 | ||||||
| Tax exempt income of life insurance policies |
(84,851 | ) | — | |||||
| Other |
1,316 | (20,587 | ) | |||||
|
|
|
|
|
|||||
| Federal income tax expense |
$ | 1,014,969 | $ | 2,253,746 | ||||
|
|
|
|
|
|||||
(Continued)
F-108
Table of Contents
FARMERS & MERCHANTS BANCSHARES, INC.
NOTES TO CONSOLIDATED FINANCIAL STATEMENTS
FOR THE YEARS ENDED DECEMBER 31, 2014 AND 2013
NOTE M FEDERAL INCOME TAXES (Continued)
Deferred income taxes are provided for differences between the financial statement carrying amount of existing assets and liabilities and their respective tax basis. Deferred tax assets and liabilities are as follows at December 31, 2014 and 2013. The Company’s net deferred tax asset is included in prepaid expenses and other assets in the December 31, 2014 and 2013 consolidated balance sheets.
| 2014 | 2013 | |||||||
| Deferred Tax Assets (Liabilities) |
||||||||
| Allowance for possible credit losses |
$ | 1,548,400 | $ | 1,690,734 | ||||
| Depreciation |
(365,403 | ) | (389,765 | ) | ||||
| Deferred loan fees |
174,773 | 145,553 | ||||||
| Loan related expenses |
— | 441,423 | ||||||
| Other |
244,225 | 307,933 | ||||||
|
|
|
|
|
|||||
| Net deferred tax asset |
$ | 1,601,995 | $ | 2,195,878 | ||||
|
|
|
|
|
|||||
NOTE N BORROWINGS AND CONTINGENT LIABILITIES
Borrowings
At December 31, 2014 and 2013, the Company has outstanding $18,000,000 in borrowings to related (directors and existing shareholders) and unrelated parties, of which $9,000,000 is secured by Enterprise Bank common stock. The remainder of the debt is secured by a second lien on Enterprise Bank common stock.
The $9,000,000 in debt secured by Bank stock originated in February 2011, matured August 2014, was extended under the terms of the merger agreement, and calls for interest paid quarterly at a rate of Wall Street Journal prime plus 2.00% floating with a floor of 7.00%. The related party portion of this debt is $3,000,000 at December 31, 2014 and 2013. The debt was paid in full on January 2, 2015.
The $9,000,000 in second lien debt originated in 2009 and 2010, matured in August 2014, was extended under the terms of the merger agreement, and calls for interest paid quarterly at a fixed rate of 7.00%. The related party portion of this debt is $2,000,000 at December 31, 2014 and 2013. The debt was paid in full on January 2, 2015.
Lines of Credit
At December 31, 2014 and 2013, the Company has established unsecured lines of credit totaling $25,000,000, with two correspondent financial institutions. During the years ended December 31, 2014 and 2013, there were no borrowings on these lines.
The Company had available borrowings through the FHLB of $199,178,350 based upon available and qualifying collateral consisting of certain loans at December 31, 2014. No borrowings were outstanding on the FHLB credit facility at December 31, 2014 and 2013.
(Continued)
F-109
Table of Contents
FARMERS & MERCHANTS BANCSHARES, INC.
NOTES TO CONSOLIDATED FINANCIAL STATEMENTS
FOR THE YEARS ENDED DECEMBER 31, 2014 AND 2013
NOTE N BORROWINGS AND CONTINGENT LIABILITIES (Continued)
Contingent Liabilities
The Company is subject to claims and lawsuits which arise primarily in the ordinary course of business. Based on information presently available and advice received from legal counsel representing the Company, it is the opinion of management that the disposition or ultimate determination of such claims and lawsuits will not have a material adverse effect on the financial position of the Company.
NOTE O JUNIOR SUBORDINATED DEBT AND INVESTMENT IN SUBSIDIARY TRUSTS
The Company owns an investment in its wholly owned subsidiaries Farmers & Merchants Capital Trust II (Trust II) and Farmers & Merchants Capital Trust III (Trust III). At December 31, 2014 and 2013, the Company’s consolidated financial statements reflect in investment in unconsolidated subsidiaries an investment in Trust II and Trust III (the subsidiary trusts) of approximately $375,000 and $395,000, respectively, along with the debt owed to the subsidiary trusts of $11,341,000 which is reflected in subordinated debentures on the Company’s consolidated balance sheet.
During 2003 and 2005, the subsidiary trusts issued $7,500,000 and $3,500,000 respectively, of capital securities to a third party, and $232,000 and $109,000, respectively of common stock to the Company. The subsidiary trusts invested the proceeds in $11,341,000 of the Company’s junior subordinated debentures due in 2033 and 2035, respectively. The interest rate for Trust II is floating at the 3-month LIBOR plus 3.00%, or 3.25% and 3.31% at December 31, 2014 and 2013, respectively. The interest rate for Trust III is floating at 3 month LIBOR plus 1.80%, or 2.05% and 2.11% at December 31, 2014 and 2013, respectively. The Company’s subordinated debentures carry the same rates with interest payable to Trust II and Trust III.
The subsidiary trusts are considered entities for which the Company is not the primary beneficiary and therefore the Company does not consolidate the trusts in its consolidated financial statements.
The debentures, which are the only assets of each trust, are subordinate and junior in right of payment to all present and future senior indebtedness of the Company. The Company has fully and unconditionally guaranteed the subsidiary trusts’ capital securities obligations.
NOTE P PREFERRED STOCK
In connection with the Company’s participation in the Capital Purchase Program (“CPP”), in March 2009, the Company issued and sold to the U.S. Treasury (i) 11,000 shares of its Fixed Rate Cumulative Perpetual Preferred Stock, Series A (Series A), par value $1.00 per share, with a liquidation value of $1,000 per share, and (ii) a warrant to purchase 550 shares of the Company’s Fixed Rate Cumulative Perpetual Preferred Stock, Series B (Series B), par value $1.00 per share, with a liquidation value of $1,000 per share, for an aggregate purchase price of $11,000,000. The U.S. Treasury exercised the warrants immediately with an exercise price of $1 per share, in exchange for a net number of 550 shares of the Series B. The liquidation value of the Series B was funded out of retained earnings upon exercise of the warrants.
Dividends Payable—Commencing May 2009, the Series A calls for cumulative dividends to be paid quarterly at a rate of 5% for the first five years and at 9% for the remaining years. The Series B calls for cumulative dividends to be paid quarterly at a rate of 9% beginning May 2009. If dividends are not paid in full for six
(Continued)
F-110
Table of Contents
FARMERS & MERCHANTS BANCSHARES, INC.
NOTES TO CONSOLIDATED FINANCIAL STATEMENTS
FOR THE YEARS ENDED DECEMBER 31, 2014 AND 2013
NOTE P PREFERRED STOCK (Continued)
dividend periods, the holder has the right to elect two of the Company’s Directors. In 2013, the Company paid dividends for only two quarters amounting to $299,750. In 2014, the Company paid all current year dividends and those dividends accrued but not paid through December 31, 2014 in an aggregate amount of $1,797,884.
Redemption—The Series A and Series B may not be redeemed for three years from the date of investment, except with proceeds from a qualified equity offering. Additionally, the Series B may not be redeemed until all of the Series A has been redeemed.
NOTE Q STOCK OPTIONS
Stock Option Plan
A summary of changes in stock options outstanding during the years ending December 31, 2014 and 2013 are as follows:
| 2014 | 2013 | |||||||||||||||
| Options summary |
Number of shares underlying options |
Weighted average exercise price |
Number of shares underlying options |
Weighted average exercise price |
||||||||||||
| Outstanding at beginning of year |
34,778 | $ | 120.08 | 36,922 | $ | 118.66 | ||||||||||
| Granted |
— | — | — | — | ||||||||||||
| Exercised |
(14,982 | ) | $ | 93.80 | (2,069 | ) | $ | 93.80 | ||||||||
| Forfeited |
(245 | ) | $ | 144.00 | (75 | ) | $ | 144.00 | ||||||||
| Cancelled/Called |
(19,551 | ) | $ | 126.62 | — | — | ||||||||||
|
|
|
|
|
|||||||||||||
| Outstanding and exercisable |
— | — | 34,778 | $ | 120.08 | |||||||||||
|
|
|
|
|
|||||||||||||
Stock Option Plan Amendment
In October 2013, the Board of Directors of the Company approved an amendment to the Stock Option Plan to extend the term of options granted in 2003 that are under current per share market value of the Company’s common stock as determined by a third party appraisal. The expiration of these options has been extended 10 years as a result of this amendment.
Cancellation Options
On December 30, 2014, all outstanding options were called and cancelled and the holders of the options were paid the intrinsic value of the shares underlying their options in the form of a bonus, the amount of which aggregated $2,216,659. The intrinsic value of the shares underlying the options was determined based upon the $240.00 per share consideration offered under the terms of the merger with Allegiance Bancshares, Inc.
NOTE R EMPLOYEE BENEFIT PLAN
The Company maintains a 401(k) employee benefit plan in which substantially all employees may participate. Participants may elect to contribute a portion of their salary to the plan, subject to certain Federal Tax Code
(Continued)
F-111
Table of Contents
FARMERS & MERCHANTS BANCSHARES, INC.
NOTES TO CONSOLIDATED FINANCIAL STATEMENTS
FOR THE YEARS ENDED DECEMBER 31, 2014 AND 2013
NOTE R EMPLOYEE BENEFIT PLAN (Continued)
limitations. The plan allows contributions by the Company on a discretionary basis. For the years ending December 31, 2014 and 2013, the Company elected to make no matching contributions into the plan.
NOTE S REGULATORY MATTERS
Regulatory Capital
The Company and the Bank are subject to various regulatory capital requirements administered by state and federal banking agencies. Capital adequacy guidelines and, additionally for banks, prompt corrective action regulations, involve quantitative measures and risk weighting of assets, liabilities, and certain off-balance sheet items calculated under regulatory accounting practices. Capital amounts and classifications are also subject to qualitative judgments by regulators about components, risk weighting, and other factors.
Failure to meet the minimum regulatory capital requirements can initiate certain mandatory and possible additional discretionary actions by regulators that if undertaken, could have a direct material effect on the Company’s consolidated financial statements. Management believes, as of December 31, 2014, that the Company and the Bank meet all the capital adequacy requirements to which they are subject.
The Bank was categorized as well capitalized under the regulatory framework for prompt corrective action by the Texas Department of Banking in their most recent examination report dated May 12, 2014. At December 31, 2014, the Bank is considered well capitalized under the regulatory framework. To remain well capitalized, the Bank will have to maintain minimum total risk-based, Tier I risk-based, and Tier I leverage and capital ratios as disclosed in the following table. There are no conditions or events since the most recent notification that management believes have changed the Bank’s prompt corrective action category.
(Continued)
F-112
Table of Contents
FARMERS & MERCHANTS BANCSHARES, INC.
NOTES TO CONSOLIDATED FINANCIAL STATEMENTS
FOR THE YEARS ENDED DECEMBER 31, 2014 AND 2013
NOTE S REGULATORY MATTERS (Continued)
The following is a summary of capital ratios for the Company and the Bank at December 31, 2014 and 2013:
| Actual | For Capital Adequacy Purposes |
To Be Well Capitalized | ||||||||||||||||||||||||||||
| Amount | Ratio | Amount | Ratio | Amount | Ratio | |||||||||||||||||||||||||
| 2014 | ||||||||||||||||||||||||||||||
| Total risk based capital ratio |
||||||||||||||||||||||||||||||
| Farmers & Merchants Bancshares, Inc. |
$ | 46,114,000 | 10.7 | % | $ | 34,448,720 | 8.0 | % | N/A | N/A | ||||||||||||||||||||
| Enterprise Bank |
$ | 63,685,000 | 14.8 | % | $ | 34,457,760 | 8.0 | % | $ | 43,072,200 | 10.0 | % | ||||||||||||||||||
| Tier I capital risk based ratio |
||||||||||||||||||||||||||||||
| Farmers & Merchants Bancshares, Inc. |
$ | 41,560,000 | 9.7 | % | $ | 17,224,360 | 4.0 | % | N/A | N/A | ||||||||||||||||||||
| Enterprise Bank |
$ | 59,131,000 | 13.7 | % | $ | 17,228,880 | 4.0 | % | $ | 25,843,320 | 6.0 | % | ||||||||||||||||||
| Tier I capital leverage ratio |
||||||||||||||||||||||||||||||
| Farmers & Merchants Bancshares, Inc. |
$ | 41,560,000 | 6.5 | % | $ | 25,419,160 | 4.0 | % | N/A | N/A | ||||||||||||||||||||
| Enterprise Bank |
$ | 59,131,000 | 10.7 | % | $ | 22,156,440 | 4.0 | % | $ | 27,695,550 | 5.0 | % | ||||||||||||||||||
| 2013 | ||||||||||||||||||||||||||||||
| Total risk based capital ratio |
||||||||||||||||||||||||||||||
| Farmers & Merchants Bancshares, Inc. |
$ | 43,431,000 | 10.7 | % | $ | 32,583,200 | 8.0 | % | N/A | N/A | ||||||||||||||||||||
| Enterprise Bank |
$ | 61,249,000 | 15.1 | % | $ | 32,466,160 | 8.0 | % | $ | 40,582,700 | 10.0 | % | ||||||||||||||||||
| Tier I capital risk based ratio |
||||||||||||||||||||||||||||||
| Farmers & Merchants Bancshares, Inc. |
$ | 38,459,000 | 9.4 | % | $ | 16,291,600 | 4.0 | % | N/A | N/A | ||||||||||||||||||||
| Enterprise Bank |
$ | 56,277,000 | 13.9 | % | $ | 16,233,080 | 4.0 | % | $ | 24,349,620 | 6.0 | % | ||||||||||||||||||
| Tier I capital leverage ratio |
||||||||||||||||||||||||||||||
| Farmers & Merchants Bancshares, Inc. |
$ | 38,459,000 | 7.8 | % | $ | 19,667,200 | 4.0 | % | N/A | N/A | ||||||||||||||||||||
| Enterprise Bank |
$ | 56,277,000 | 11.4 | % | $ | 19,667,200 | 4.0 | % | $ | 24,584,000 | 5.0 | % | ||||||||||||||||||
Dividend Restrictions
In the ordinary course of business, the Company is dependent upon dividends from the Bank to provide funds for the payment of dividends to shareholders and to provide for other cash requirements. Banking regulations may limit the amount of dividends that may be paid. Approval by regulatory authorities is required if the effect of dividends declared would cause the regulatory capital of the Bank to fall below specified minimum levels.
NOTE T FAIR VALUE DISCLOSURES
The fair value of an asset or liability is the price that would be received to sell that asset or paid to transfer that liability in an orderly transaction occurring in the principal market (or most advantageous market in the absence of a principal market) for such asset or liability. In estimating fair value, the Company utilizes valuation techniques that are consistent with the market approach, the income approach, and or/the cost approach. Such valuation techniques are consistently applied. Inputs to valuation techniques include the assumptions that market participants would use in pricing an asset or liability.
(Continued)
F-113
Table of Contents
FARMERS & MERCHANTS BANCSHARES, INC.
NOTES TO CONSOLIDATED FINANCIAL STATEMENTS
FOR THE YEARS ENDED DECEMBER 31, 2014 AND 2013
NOTE T FAIR VALUE DISCLOSURES (Continued)
Fair Value Hierarchy
U.S. GAAP specifies a hierarchy of valuation techniques based upon whether the inputs to those valuation techniques are observable or unobservable. These inputs are summarized in the three broad levels listed below.
Level 1—Level 1 inputs are based upon quoted prices in active markets for identical assets and liabilities. The fair values for the Company’s U.S. Government agency bonds were measured using Level 1 inputs at December 31, 2014 and 2013.
Level 2—Level 2 inputs are based upon other significant observable inputs (including quoted prices in active and inactive markets for similar assets and liabilities), or other inputs that are observable or can be corroborated by observable market data for substantially the full term of the assets or liabilities. The fair values for the Company’s U.S. Government agency mortgage-backed securities, impaired loans, other real estate owned and intangible assets were measured using Level 2 inputs at December 31, 2014 and 2013.
Level 3—Level 3 inputs are based upon unobservable inputs that are supported by little or no market activity and that are significant to the fair value of the assets and liabilities. Level 3 measurements are determined using pricing models, discounted cash flow methodologies, or similar techniques, as well as instruments for which the determination of fair value requires significant management judgment or estimation. The Company had no assets or liabilities measured using Level 3 inputs at December 31, 2014 and 2013.
During the year ended December 31, 2014 and 2013, there were no transfers of financial assets or liabilities within the fair value hierarchy.
In general, fair value is based upon quoted market prices, where available. If such quoted market prices are not available, fair value is based upon internally developed models that primarily use observable market-based parameters as inputs. Valuation adjustments may be made to ensure that assets and liabilities are recorded at fair value. These adjustments may include amounts to reflect counterparty credit quality and creditworthiness, among other things, as well as unobservable parameters. Any such valuation adjustments are applied consistently over time.
The Company’s valuation methodologies may produce a fair value calculation that may not be indicative of net realizable value or reflective of future fair values. While management believes the Company’s valuation methodologies are appropriate and consistent with other market participants, the use of different methodologies or assumptions to determine the fair value of certain financial instruments could result in a different estimate of fair value at the reporting date.
Financial Instruments Recorded at Fair Value
Recurring—At December 31, 2014 and 2013, there were no financial assets measured at fair value on a recurring basis.
Nonrecurring—Certain financial assets are measured at fair value on a nonrecurring basis; that is, the instruments are not measured at fair value on an ongoing basis but are subject to fair value adjustments in certain circumstances (for example, when there is evidence of impairment). At December 31, 2014 and 2013, the
(Continued)
F-114
Table of Contents
FARMERS & MERCHANTS BANCSHARES, INC.
NOTES TO CONSOLIDATED FINANCIAL STATEMENTS
FOR THE YEARS ENDED DECEMBER 31, 2014 AND 2013
NOTE T FAIR VALUE DISCLOSURES (Continued)
Company held no financial instruments measured at fair value on a nonrecurring basis with Level 1 or Level 3 valuation inputs. The fair value of impaired loans disclosed in Note D are measured on a nonrecurring basis using Level 2 inputs.
Nonfinancial Assets and Nonfinancial Liabilities Recorded as Fair Value
Recurring—The Company has no nonfinancial assets or nonfinancial liabilities measured at fair value on a recurring basis.
Nonrecurring—The Company has certain nonfinancial assets that are measured at fair value on a nonrecurring basis to include real estate acquired through foreclosure. Upon initial foreclosure or subsequent impairment these assets will be valued using level 2 inputs. The following nonfinancial assets were subject to write down during the reporting period and thereby measured at fair value. The related write down has been disclosed at Note G.
| 2014 | 2013 | |||||||
| Level 2: |
||||||||
| Other real estate owned, net |
$ | — | $ | 2,035,252 | ||||
|
|
|
|
|
|||||
In addition, while goodwill is not carried at fair value, the determination of impairment is performed by management using Level 3 inputs.
Fair Value Disclosure for all Financial Instruments
The Company is subject to the requirements under ASC Topic 820—Disclosures about Fair Value of Financial Instruments, to disclose the fair value of all financial instruments, including those financial assets and financial liabilities not recorded at fair value in its consolidated balance sheets, for which it is practicable to estimate fair value. Below is a table that summarizes the fair values of all financial instruments of the Company at December 31, 2014 and 2013, followed by methods and assumptions that were used by the Company in estimating the fair value of the classes of financial instruments.
(Continued)
F-115
Table of Contents
FARMERS & MERCHANTS BANCSHARES, INC.
NOTES TO CONSOLIDATED FINANCIAL STATEMENTS
FOR THE YEARS ENDED DECEMBER 31, 2014 AND 2013
NOTE T FAIR VALUE DISCLOSURES (Continued)
The estimated fair values of the Company’s financial instruments are as follows (in thousands):
| 2014 | 2013 | |||||||||||||||
| Carrying Amount |
Estimated Fair Values |
Carrying Amount |
Estimated Fair Values |
|||||||||||||
| Financial Assets |
||||||||||||||||
| Cash and cash equivalents |
$ | 107,128 | $ | 107,128 | $ | 61,800 | $ | 61,800 | ||||||||
| Securities held to maturity |
15,102 | 14,515 | 15,237 | 13,688 | ||||||||||||
| Loans, net |
405,647 | 405,820 | 395,095 | 400,436 | ||||||||||||
| Bank owned life insurance |
10,607 | 10,607 | 189 | 189 | ||||||||||||
|
|
|
|
|
|
|
|
|
|||||||||
| $ | 538,484 | $ | 538,070 | $ | 472,321 | $ | 476,113 | |||||||||
|
|
|
|
|
|
|
|
|
|||||||||
| Financial Liabilities |
||||||||||||||||
| Deposits |
$ | 488,923 | $ | 500,259 | $ | 427,074 | $ | 426,822 | ||||||||
| Borrowings |
18,000 | 18,000 | 18,000 | 18,011 | ||||||||||||
| Debentures |
11,341 | 11,341 | 11,341 | 11,347 | ||||||||||||
|
|
|
|
|
|
|
|
|
|||||||||
| $ | 518,264 | $ | 529,600 | $ | 456,415 | $ | 456,180 | |||||||||
|
|
|
|
|
|
|
|
|
|||||||||
The estimated fair value amounts of financial instruments have been determined by the Company using available market information and appropriate valuation methodologies. However, considerable judgment is required to interpret data to develop the estimates of fair value. Accordingly, the estimates presented herein are not necessarily indicative of the amounts the Company could realize in a current market exchange. The use of different market assumptions and/or estimation methodologies may have a material effect on the estimated fair value amounts. The fair values of all financial instruments have been determined as follows:
Cash and Cash Equivalents—For these short term instruments, the carrying amount is a reasonable estimate of fair value.
Securities Held to Maturity—For securities held as investments, fair value equals quoted market price, if available. If a quoted market price is not available, fair value is estimated using the quoted market price for similar securities as previously indicated for Level 1 and Level 2 inputs.
Loans—For variable-rate loans that re-price frequently and with no significant change in credit risk, fair values are based on carrying values. Fair values for other loans are estimated using discounted cash flow analyses, using interest rates currently being offered for loans with similar terms to borrowers of similar credit quality. Fair values for impaired loans are estimated using discounted cash flow analyses or underlying collateral values, where applicable, as indicated in the description of Level 2 inputs above.
Bank Owned Life Insurance—For these financial instruments, the carrying value is considered a reasonable estimate of fair value.
(Continued)
F-116
Table of Contents
FARMERS & MERCHANTS BANCSHARES, INC.
NOTES TO CONSOLIDATED FINANCIAL STATEMENTS
FOR THE YEARS ENDED DECEMBER 31, 2014 AND 2013
NOTE T FAIR VALUE DISCLOSURES (Continued)
Deposits—The fair values disclosed for demand deposits are, by definition, equal to the amount payable on demand at the reporting date (i.e., their carrying amounts). Fair values for savings and money market accounts and fixed-rate certificates of deposit are estimated using a discounted cash flow calculation that applies interest rates currently being offered on certificates to a schedule of aggregated expected monthly maturities on time deposits.
Borrowings and Debentures—For these liabilities, the fair value is estimated using the rates currently offered for borrowings of a similar term.
F-117
Table of Contents
Common Stock
2,600,000 Shares
PROSPECTUS
| Baird | Stephens Inc. | |
| Keefe, Bruyette & Woods | Sandler O’Neill + Partners, L.P. | |
| A Stifel Company | ||
Until , 2015, all dealers that effect transactions in our common stock, whether or not participating in this offering, may be required to deliver a prospectus. This is in addition to the dealers’ obligation to deliver a prospectus when acting as underwriters and with respect to any unsold allotments or subscriptions.
The date of this prospectus is , 2015
Table of Contents
PART II
INFORMATION NOT REQUIRED IN PROSPECTUS
| ITEM 13. | Other Expenses of Issuance and Distribution |
The following table sets forth the costs and expenses, other than underwriting discounts and commissions, payable by Allegiance Bancshares, Inc. (the “Registrant”) in connection with the issuance and distribution of the securities being registered. All amounts shown are estimates, except the SEC registration fee, the FINRA filing fee and the stock exchange listing fees. All fees below are payable by the Registrant.
| SEC registration fee |
$ | 9,000 | ||
| FINRA filing fee |
9,500 | |||
| NASDAQ listing fee |
25,000 | |||
| Printing and engraving costs |
250,000 | |||
| Legal fees and expenses |
500,000 | |||
| Accountants’ fees and expenses |
325,000 | |||
| Transfer agent fees |
10,000 | |||
| Miscellaneous |
100,000 | |||
|
|
|
|||
| Total |
$ | 1,228,500 | ||
|
|
|
| * | To be furnished by amendment |
| ITEM 14. | Indemnification of Directors and Officers |
The Registrant’s amended and restated certificate of formation provides that the Registrant’s directors and officers will be indemnified by the Registrant to the fullest extent permitted by the Texas Business Organizations Code and applicable federal law and regulation against all expenses incurred in connection with their service for or on behalf of the Registrant.
The Registrant’s amended and restated certificate of formation provides that the personal liability of the directors and officers of the Registrant for monetary damages shall be eliminated to the fullest extent permitted by the Texas Business Organizations Code and applicable federal laws and regulations.
At the time of this offering, the Registrant will have entered into indemnification agreements with the members of its board of directors and officers (each an “indemnitee”). Each indemnification agreement requires the Registrant to indemnify each indemnitee as described above. The Registrant will also, among other things, advance costs and expenses subject to the condition that an indemnitee shall reimburse the indemnitor for all amounts paid if a final judicial determination is made that the indemnitee is not entitled to be so indemnified under applicable law.
The Registrant also maintains directors’ and officers’ liability insurance.
The form of Underwriting Agreement to be filed as Exhibit 1.1 hereto obligates the underwriters to indemnify our directors, officers and controlling persons under limited circumstances against certain liabilities under the Securities Act of 1933, as amended (the “Securities Act”).
II-1
Table of Contents
| ITEM 15. | Recent Sales of Unregistered Securities |
In the three years preceding the filing of this registration statement, the Registrant has issued the following securities:
| • | On January 1, 2015 and in connection with the Registrant’s acquisition of F&M Bancshares, the Registrant issued an aggregate of 2,338,520 shares of its common stock to former shareholders of F&M Bancshares in a Texas intrastate transaction; |
| • | On December 1, 2014, the Registrant issued an aggregate of 476,192 shares of its common stock for aggregate consideration of $10.5 million in a private placement transaction; |
| • | On November 15, 2013 and in connection with the Registrant’s acquisition of Independence Bank, NA, the Registrant issued an aggregate of 861,473 shares of its common stock to former shareholders of Independence Bank, NA in a Texas intrastate transaction; |
| • | On October 7, 2013, the Registrant issued an aggregate of 894,894 shares of its common stock for aggregate consideration of $17.9 million in a private placement transaction; |
| • | On June 8, 2012, the Registrant issued an aggregate of 540,668 shares of its common stock for aggregate consideration of $9.5 million in a private placement transaction; |
| • | The Registrant periodically issues grants of certain equity based awards to its executive officers, directors and other key employees pursuant to its Amended and Restated Equity Plan. Since April 30, 2012, the Registrant has granted options to purchase an aggregate of 315,750 shares of its common stock at exercise prices ranging from $11.24 to $22.00 per share pursuant to its Amended and Restated Equity Plan. |
The issuances of securities described in the preceding paragraphs were made in reliance upon the exemption from registration under Section 4(2) or its successor 4(a)(2) of the Securities Act, Section 3(a)(11) of the Securities Act and Rule 147 promulgated thereunder, or Rule 701 promulgated under Section 3(b) of the Securities Act as transactions by an issuer not involving any public offering, as transactions by an issuer in an intrastate offering, or pursuant to benefit plans and contracts relating to compensation. All of the foregoing securities are deemed restricted securities for purposes of the Securities Act. The recipients of securities in the transactions exempt under Section 4(2) or its successor 4(a)(2) and under Section 3(a)(11) of the Securities Act represented their intention to acquire the securities for investment purposes only and not with a view to or for sale in connection with any distribution thereof and appropriate legends were affixed to the stock certificates and instruments issued in such transactions.
| ITEM 16. | Exhibits and Financial Statements Schedules |
(a) Exhibits
See the Exhibit Index on the page immediately following the signature page for a list of exhibits filed as part of this Registration Statement on Form S-1, which Exhibit Index is incorporated herein by reference.
(b) Financial Statement Schedules
All schedules are omitted because the required information is either not present, not present in material amounts or is presented within the consolidated financial statements included in the prospectus that is part of this Registration Statement.
| ITEM 17. | Undertakings |
The undersigned Registrant hereby undertakes to provide to the underwriters at the closing specified in the underwriting agreement, certificates in such denominations and registered in such names as required by the underwriters to permit prompt delivery to each purchaser.
II-2
Table of Contents
Insofar as indemnification for liabilities arising under the Securities Act may be permitted to the directors, officers and controlling persons of the Registrant pursuant to the foregoing provisions, or otherwise, the Registrant has been advised that in the opinion of the SEC such indemnification is against public policy as expressed in the Securities Act and is, therefore, unenforceable. In the event that a claim for indemnification against such liabilities (other than the payment by the Registrant of expenses incurred or paid by a director, officer or controlling person of the Registrant in the successful defense of any action, suit or proceeding) is asserted by such director, officer or controlling person in connection with the securities being registered, the Registrant will, unless in the opinion of its counsel the matter has been settled by controlling precedent, submit to a court of appropriate jurisdiction the question whether such indemnification by it is against public policy as expressed in the Securities Act and will be governed by the final adjudication of such issue.
The undersigned Registrant hereby undertakes that:
(i) for purposes of determining any liability under the Securities Act, the information omitted from the form of prospectus filed as part of this Registration Statement in reliance upon Rule 430A and contained in a form of prospectus filed by the Registrant pursuant to Rule 424(b)(1) or (4) or 497(h) under the Securities Act shall be deemed to be part of this Registration Statement as of the time it was declared effective.
(ii) for the purpose of determining any liability under the Securities Act, each post-effective amendment that contains a form of prospectus shall be deemed to be a new Registration Statement relating to the securities offered therein, and the offering of such securities at that time shall be deemed to be the initial bona fide offering thereof.
II-3
Table of Contents
SIGNATURES
Pursuant to the requirements of the Securities Act of 1933, as amended, the Registrant has duly caused this Amendment to the Registration Statement on Form S-1 to be signed on its behalf by the undersigned, thereunto duly authorized, in the City of Houston, State of Texas, on September 28, 2015.
| Allegiance Bancshares, Inc. | ||
| By: | /s/ George Martinez | |
| Name: | George Martinez | |
| Title: | Chairman and Chief Executive Officer | |
Pursuant to the requirements of the Securities Act, this Amendment to the Registration Statement has been signed below by the following persons in the capacities and on the dates indicated below.
| Name |
Title |
Date | ||
| /s/ George Martinez George Martinez |
Chairman and Chief Executive (Principal Executive Officer) |
September 28, 2015 | ||
| * Steven F. Retzloff |
President and Director | September 28, 2015 | ||
| * Laurence L. Lehman, III |
Chief Financial Officer (Principal Financial and Principal Accounting Officer) |
September 28, 2015 | ||
| * Ramon A. Vitulli, III |
Director and Executive Vice President |
September 28, 2015 | ||
| * Daryl D. Bohls |
Director and Executive Vice President |
September 28, 2015 | ||
| * John Beckworth |
Director | September 28, 2015 | ||
| * Lawrence G. Fraser |
Director | September 28, 2015 | ||
| * Matthew H. Hartzell |
Director | September 28, 2015 | ||
| * Frances H. Jeter |
Director | September 28, 2015 | ||
| * James J. Kearney |
Director | September 28, 2015 | ||
S-1
Table of Contents
| Name |
Title |
Date | ||
| .* P. Michael Mann, M.D. |
Director | September 28, 2015 | ||
| * David B. Moulton |
Director | September 28, 2015 | ||
| * William S. Nichols, III |
Director | September 28, 2015 | ||
| * Thomas A. Reiser |
Director | September 28, 2015 | ||
| * Raimundo Riojas E. |
Director | September 28, 2015 | ||
| * Fred S. Robertson |
Director | September 28, 2015 | ||
| *By: | /s/ George Martinez | |
| George Martinez | ||
| Attorney-in-Fact | ||
S-2
Table of Contents
EXHIBIT INDEX
| Exhibit Number |
Description | |
| 1.1 | Form of Underwriting Agreement | |
| 3.1* | Amended and Restated Certificate of Formation of Allegiance Bancshares, Inc. | |
| 3.2* | Amended and Restated Bylaws of Allegiance Bancshares, Inc. | |
| 4.1* | Specimen Common Stock Certificate | |
| 4.2 | The other instruments defining rights of holders of the long-term debt securities of the Registrant and its subsidiaries are omitted pursuant to section (b)(4)(iii)(A) of Item 601 of Regulation S-K. The Registrant hereby agrees to furnish copies of these instruments to the SEC upon request. | |
| 5.1 | Opinion of Bracewell & Giuliani LLP | |
| 10.1* | Tax Allocation Agreement dated April 1, 2013, by and between Allegiance Bancshares, Inc. and Allegiance Bank (f/k/a Allegiance Bank Texas). | |
| 10.2* | Amended and Restated Equity Incentive Plan of Allegiance Bancshares, Inc. (including form of awards) | |
| 10.3* | Credit Agreement dated as of December 22, 2014 by and among Allegiance Bancshares, Inc. and Prosperity Bank. | |
| 10.4 | Form of Director and Officer Indemnification Agreement | |
| 10.5* | Consulting Agreement dated August 5, 2013 by and between Allegiance Bank (f/k/a Allegiance Bank Texas) and Lawrence G. Fraser | |
| 21.1* | Subsidiaries of Allegiance Bancshares, Inc. | |
| 23.1 | Consent of Crowe Horwath LLP | |
| 23.2 | Consent of Seidel Schroeder (formerly Seidel, Schroeder & Company) | |
| 23.3 | Consent of Harper & Pearson Company, P.C. | |
| 23.4 | Consent of Bracewell & Giuliani LLP (contained in its opinion filed as Exhibit 5.1 hereto) | |
| 24.1* | Powers of Attorney (included on the signature page to the Registration Statement) | |
| * | Previously filed |