Attached files
| file | filename |
|---|---|
| 8-K - 8-K - Bellerophon Therapeutics, Inc. | a15-20212_18k.htm |
| EX-99.1 - EX-99.1 - Bellerophon Therapeutics, Inc. | a15-20212_1ex99d1.htm |
Exhibit 99.2
|
|
Interim Analysis of INOpulse Pulmonary Arterial Hypertension Long-Term Extension Study (PAH-201) September, 2015 |
|
|
Forward Looking Statements This presentation contains forward-looking statements that involve substantial risks and uncertainties. All statements, other than statements of historical facts, contained in this presentation, including statements regarding our strategy, future operations, future financial position, future revenues, projected costs, prospects, plans and objectives of management, are forward-looking statements. The words “anticipate,” “believe,” “estimate,” “expect,” “intend,” “may,” “plan,” “predict,” “project,” “target,” “potential,” “will,” “would,” “could,” “should,” “continue,” and similar expressions are intended to identify forward-looking statements, although not all forward-looking statements contain these identifying words. We may not actually achieve the plans, intentions or expectations disclosed in our forward-looking statements, and you should not place undue reliance on our forward-looking statements. Actual results or events could differ materially from the plans, intentions and expectations disclosed in the forward-looking statements we make due to a number of important factors, including risks and uncertainties relating to: the timing and outcomes of our ongoing and expected clinical trials for our product candidates; our ability to successfully develop, commercialize and market any of our product candidates; our ability to obtain, maintain and enforce intellectual property rights; competition; our reliance on third parties; our ability to obtain necessary financing; and those risk factors discussed in the “Risk Factors” section and elsewhere in our most recent Form 10-K and other periodic filings we make with the SEC. All forward-looking statements contained in this presentation reflect our current views with respect to future events. We assume no obligation, except as required by applicable law, to update any forward-looking statements publicly, or to update the reasons why actual results could differ materially from those anticipated in the forward-looking statements, even if new information becomes available in the future. |
|
|
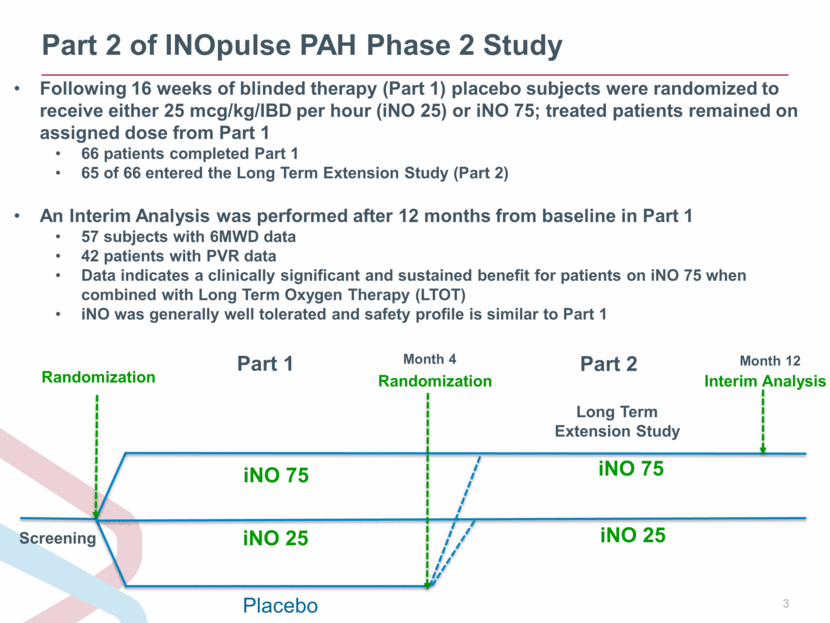
Part 2 of INOpulse PAH Phase 2 Study Month 4 iNO 75 Screening Randomization iNO 25 Placebo iNO 75 iNO 25 Randomization Long Term Extension Study Following 16 weeks of blinded therapy (Part 1) placebo subjects were randomized to receive either 25 mcg/kg/IBD per hour (iNO 25) or iNO 75; treated patients remained on assigned dose from Part 1 66 patients completed Part 1 65 of 66 entered the Long Term Extension Study (Part 2) An Interim Analysis was performed after 12 months from baseline in Part 1 57 subjects with 6MWD data 42 patients with PVR data Data indicates a clinically significant and sustained benefit for patients on iNO 75 when combined with Long Term Oxygen Therapy (LTOT) iNO was generally well tolerated and safety profile is similar to Part 1 Part 1 Part 2 Month 12 Interim Analysis |
|
|
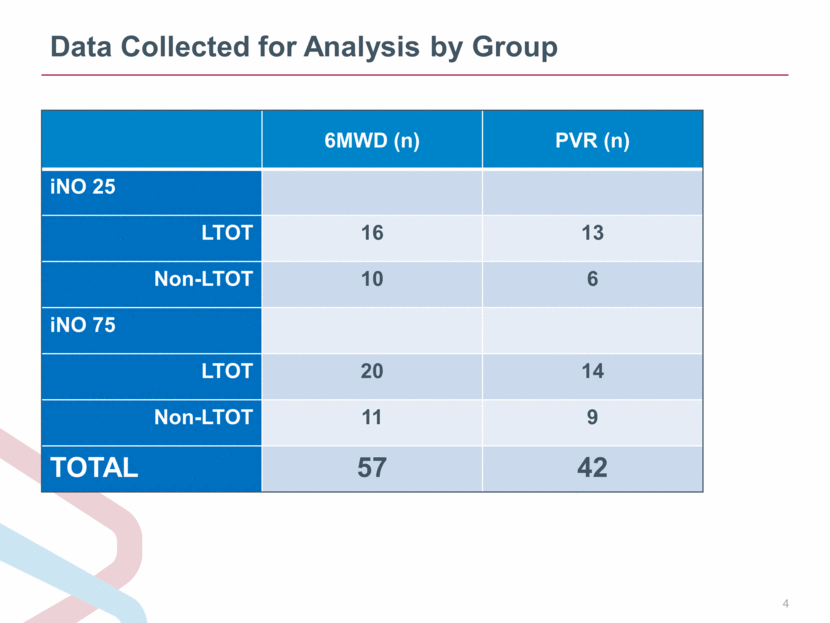
Data Collected for Analysis by Group 6MWD (n) PVR (n) iNO 25 LTOT 16 13 Non-LTOT 10 6 iNO 75 LTOT 20 14 Non-LTOT 11 9 TOTAL 57 42 |
|
|
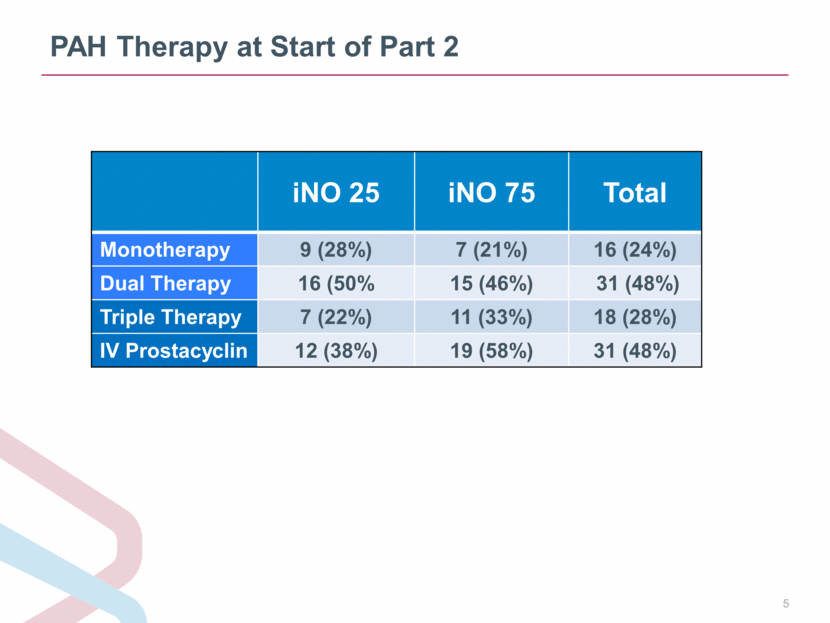
PAH Therapy at Start of Part 2 iNO 25 iNO 75 Total Monotherapy 9 (28%) 7 (21%) 16 (24%) Dual Therapy 16 (50% 15 (46%) 31 (48%) Triple Therapy 7 (22%) 11 (33%) 18 (28%) IV Prostacyclin 12 (38%) 19 (58%) 31 (48%) |
|
|
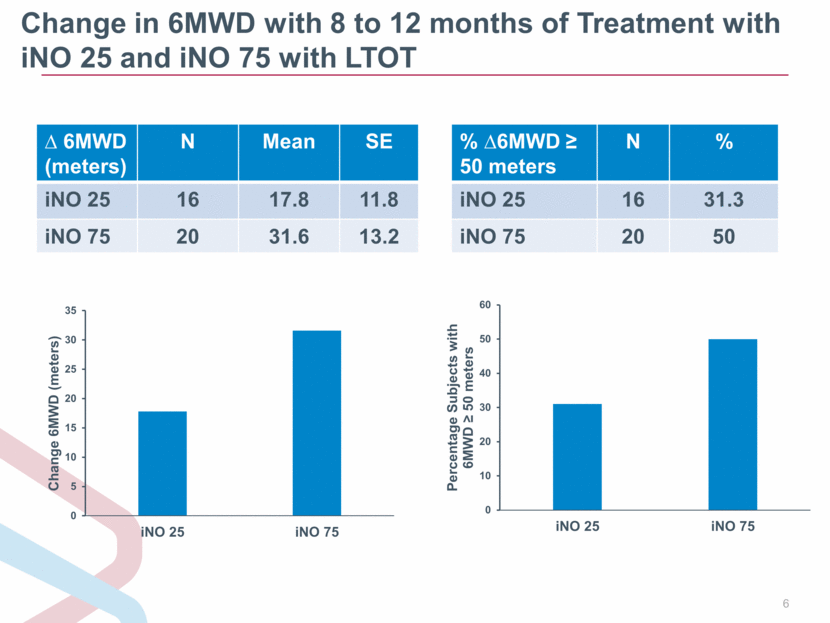
Change in 6MWD with 8 to 12 months of Treatment with iNO 25 and iNO 75 with LTOT 6MWD (meters) N Mean SE iNO 25 16 17.8 11.8 iNO 75 20 31.6 13.2 % 6MWD 50 meters N % iNO 25 16 31.3 iNO 75 20 50 0 5 10 15 20 25 30 35 iNO 25 iNO 75 Change 6MWD (meters) 0 10 20 30 40 50 60 iNO 25 iNO 75 Percentage Subjects with 6MWD ? 50 meters |
|
|
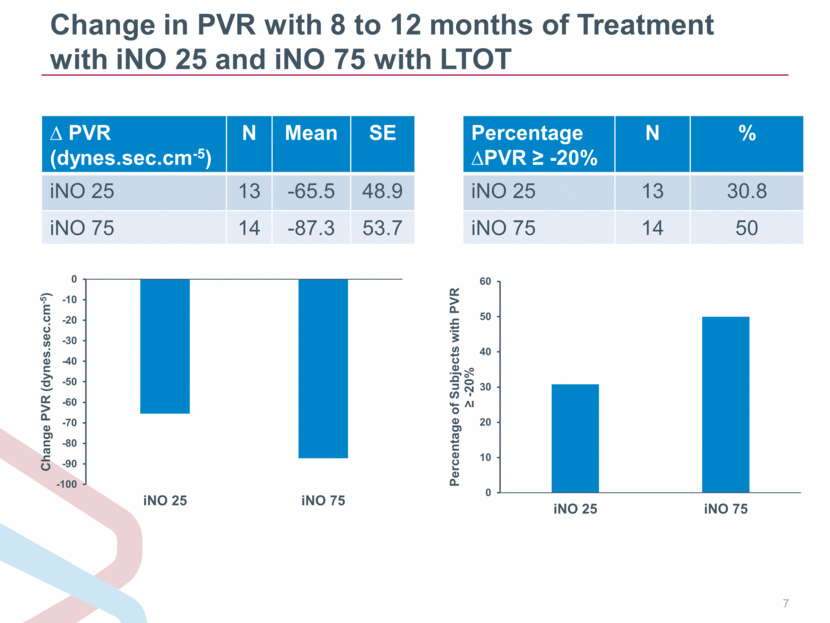
Change in PVR with 8 to 12 months of Treatment with iNO 25 and iNO 75 with LTOT PVR (dynes.sec.cm-5) N Mean SE iNO 25 13 -65.5 48.9 iNO 75 14 -87.3 53.7 Percentage PVR -20% N % iNO 25 13 30.8 iNO 75 14 50 -100 -90 -80 -70 -60 -50 -40 -30 -20 -10 0 iNO 25 iNO 75 Change PVR (dynes.sec.cm - 5 ) 0 10 20 30 40 50 60 iNO 25 iNO 75 Percentage of Subjects with PVR ? - 20 % |
|
|
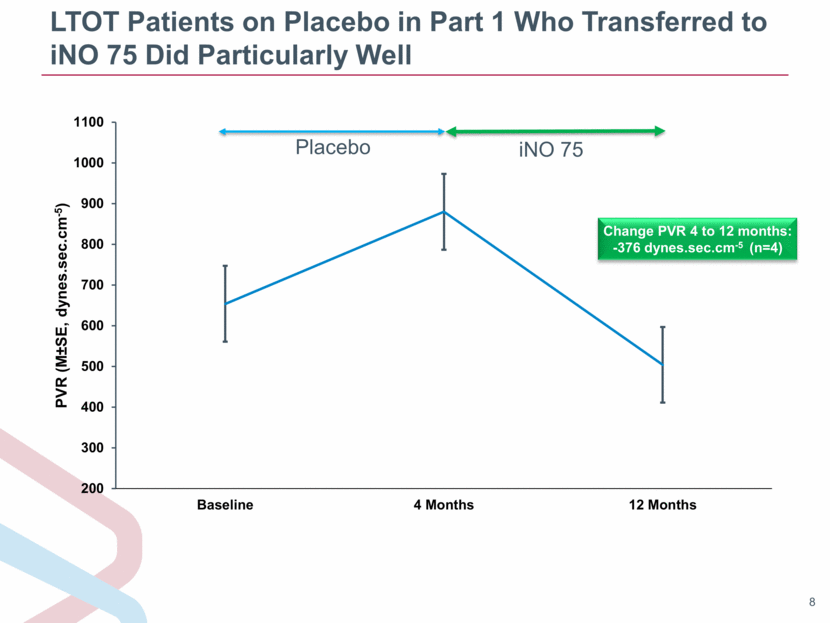
LTOT Patients on Placebo in Part 1 Who Transferred to iNO 75 Did Particularly Well Change PVR 4 to 12 months: -376 dynes.sec.cm-5 (n=4) |
|
|
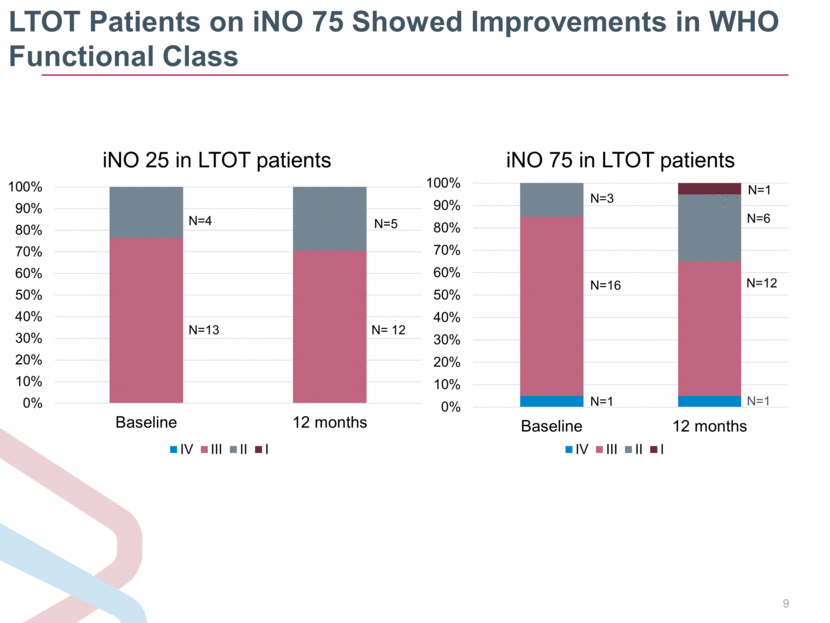
LTOT Patients on iNO 75 Showed Improvements in WHO Functional Class N=1 0% 10% 20% 30% 40% 50% 60% 70% 80% 90% 100% Baseline 12 months iNO 75 in LTOT patients IV III II I N=3 N=16 N=1 N=1 N=6 N=12 0% 10% 20% 30% 40% 50% 60% 70% 80% 90% 100% Baseline 12 months iNO 25 in LTOT patients IV III II I N=4 N=13 N=5 N= 12 |
|
|
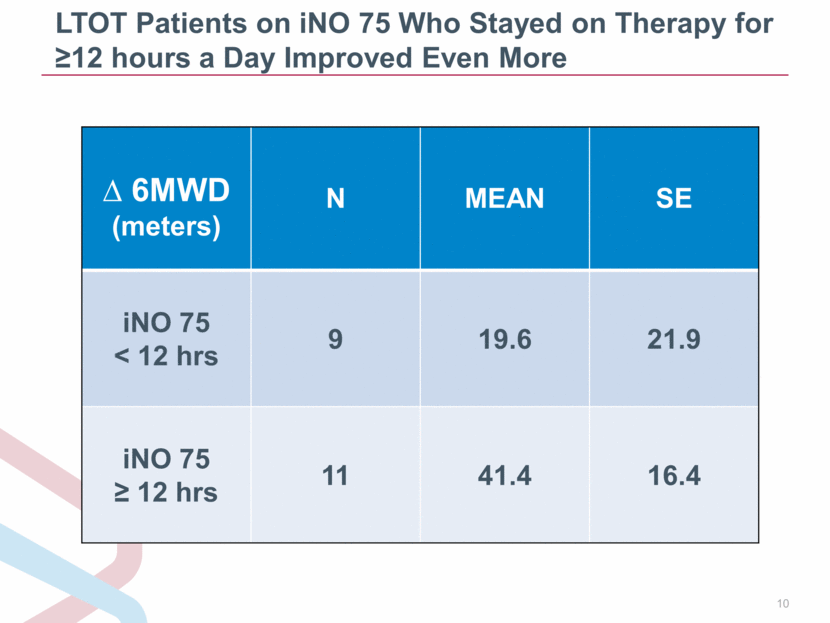
LTOT Patients on iNO 75 Who Stayed on Therapy for 12 hours a Day Improved Even More 6MWD (meters) N MEAN SE iNO 75 < 12 hrs 9 19.6 21.9 iNO 75 12 hrs 11 41.4 16.4 |
|
|
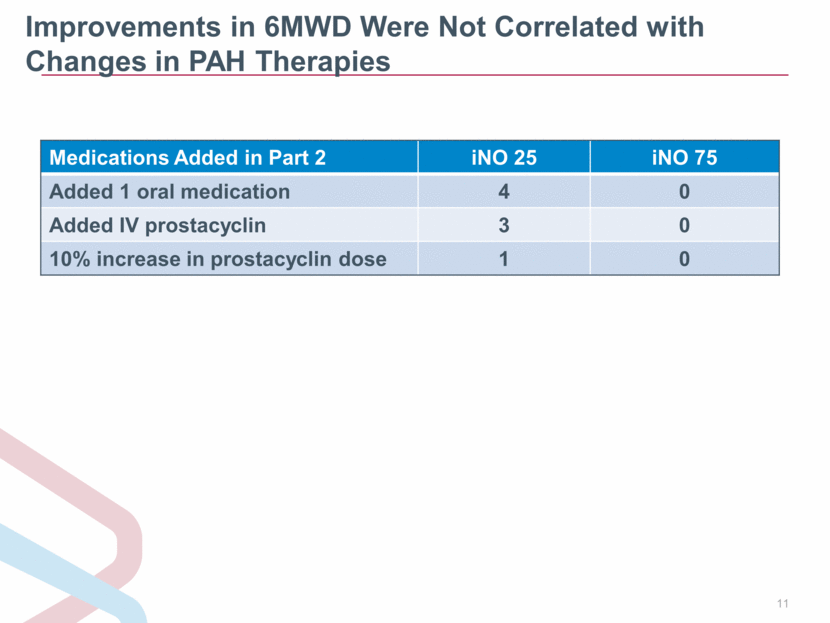
Improvements in 6MWD Were Not Correlated with Changes in PAH Therapies Medications Added in Part 2 iNO 25 iNO 75 Added 1 oral medication 4 0 Added IV prostacyclin 3 0 10% increase in prostacyclin dose 1 0 |
|
|
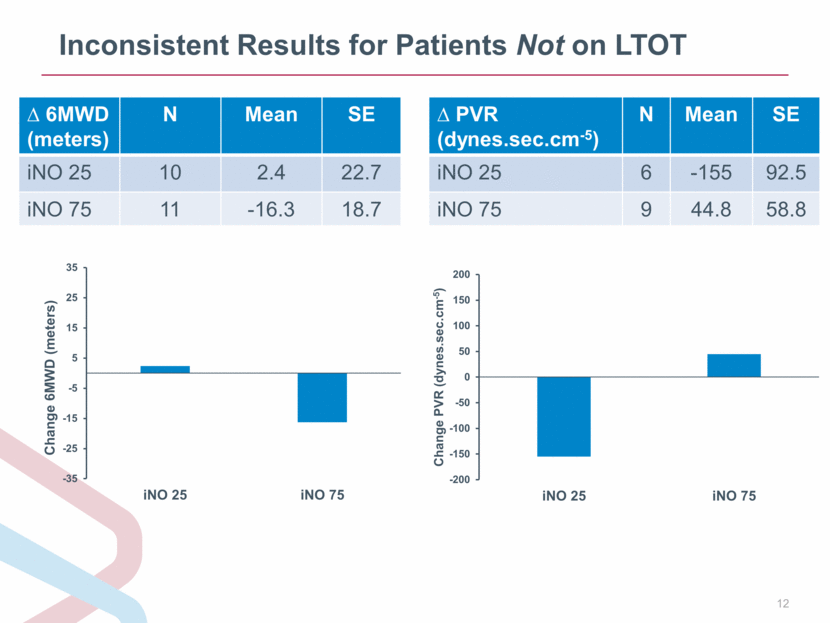
Inconsistent Results for Patients Not on LTOT 6MWD (meters) N Mean SE iNO 25 10 2.4 22.7 iNO 75 11 -16.3 18.7 PVR (dynes.sec.cm-5) N Mean SE iNO 25 6 -155 92.5 iNO 75 9 44.8 58.8 -200 -150 -100 -50 0 50 100 150 200 iNO 25 iNO 75 Change PVR ( dynes.sec.cm - 5 ) -35 -25 -15 -5 5 15 25 35 iNO 25 iNO 75 Change 6MWD (meters) |
|
|
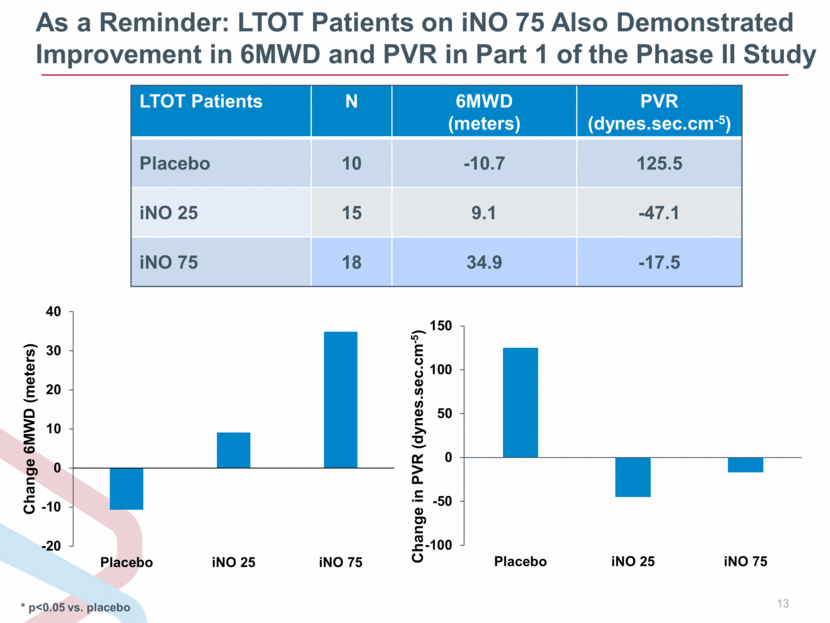
As a Reminder: LTOT Patients on iNO 75 Also Demonstrated Improvement in 6MWD and PVR in Part 1 of the Phase II Study * p<0.05 vs. placebo LTOT Patients N 6MWD (meters) PVR (dynes.sec.cm-5) Placebo 10 -10.7 125.5 iNO 25 15 9.1 -47.1 iNO 75 18 34.9 -17.5 -100 -50 0 50 100 150 Placebo iNO 25 iNO 75 Change in PVR (dynes.sec.cm - 5 ) -20 -10 0 10 20 30 40 Placebo iNO 25 iNO 75 Change 6MWD (meters) |
|
|
Hypothesis for Phase III Trial The outcome of this interim analysis supports the hypothesis generated in Part 1 of the Phase 2 study The optimal benefit of iNOpulse is with the iNO 75 dose in patients on LTOT who stay on the therapy for at least 12 hours each day This is the population that will be studied in the Phase III program for which the FDA recently issued a Special Protocol Assessment (SPA) The European Medicines Agency (EMA) has also agreed to the protocol, through a Scientific Advice Working Party (SAWP) |
|
|
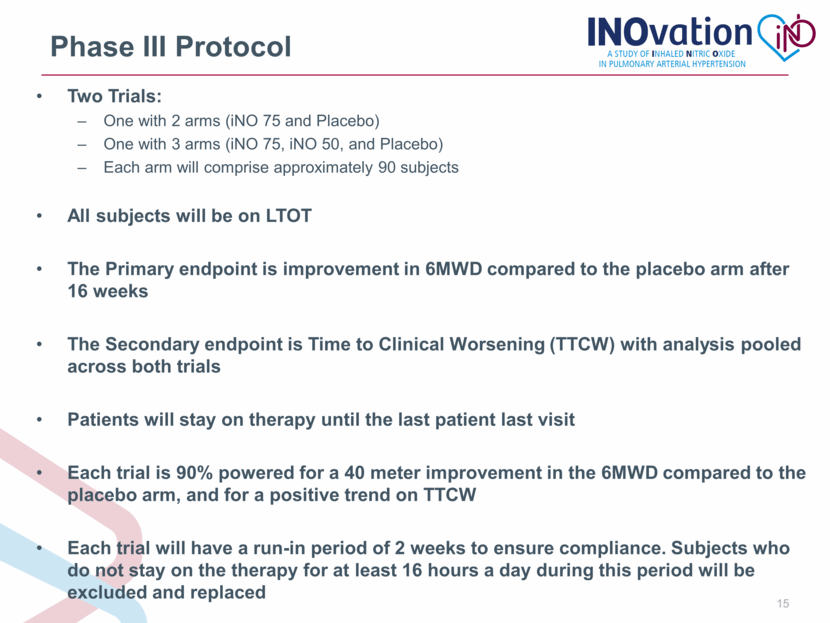
Phase III Protocol Two Trials: One with 2 arms (iNO 75 and Placebo) One with 3 arms (iNO 75, iNO 50, and Placebo) Each arm will comprise approximately 90 subjects All subjects will be on LTOT The Primary endpoint is improvement in 6MWD compared to the placebo arm after 16 weeks The Secondary endpoint is Time to Clinical Worsening (TTCW) with analysis pooled across both trials Patients will stay on therapy until the last patient last visit Each trial is 90% powered for a 40 meter improvement in the 6MWD compared to the placebo arm, and for a positive trend on TTCW Each trial will have a run-in period of 2 weeks to ensure compliance. Subjects who do not stay on the therapy for at least 16 hours a day during this period will be excluded and replaced |
|
|
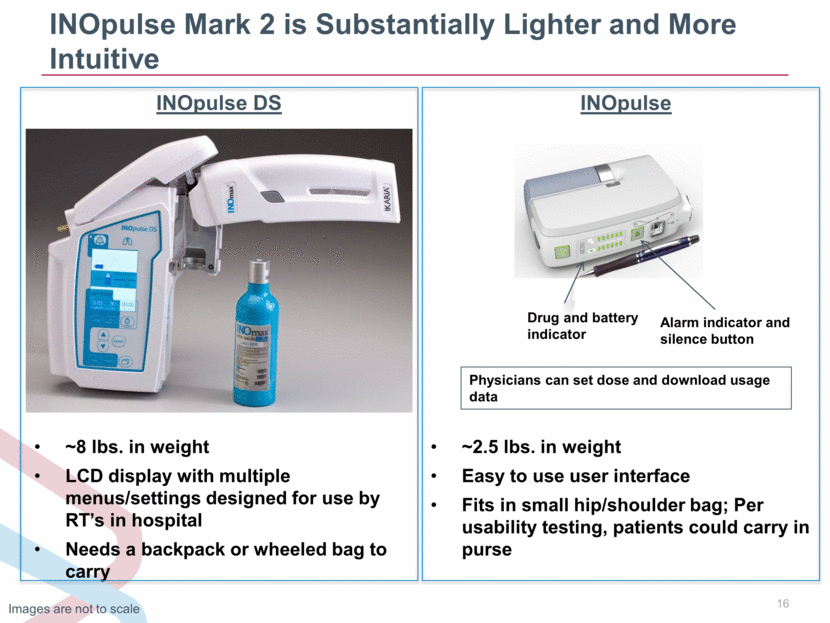
INOpulse Mark 2 is Substantially Lighter and More Intuitive ~8 lbs. in weight LCD display with multiple menus/settings designed for use by RT’s in hospital Needs a backpack or wheeled bag to carry ~2.5 lbs. in weight Easy to use user interface Fits in small hip/shoulder bag; Per usability testing, patients could carry in purse Images are not to scale Drug and battery indicator Alarm indicator and silence button Physicians can set dose and download usage data INOpulse DS INOpulse |
|
|
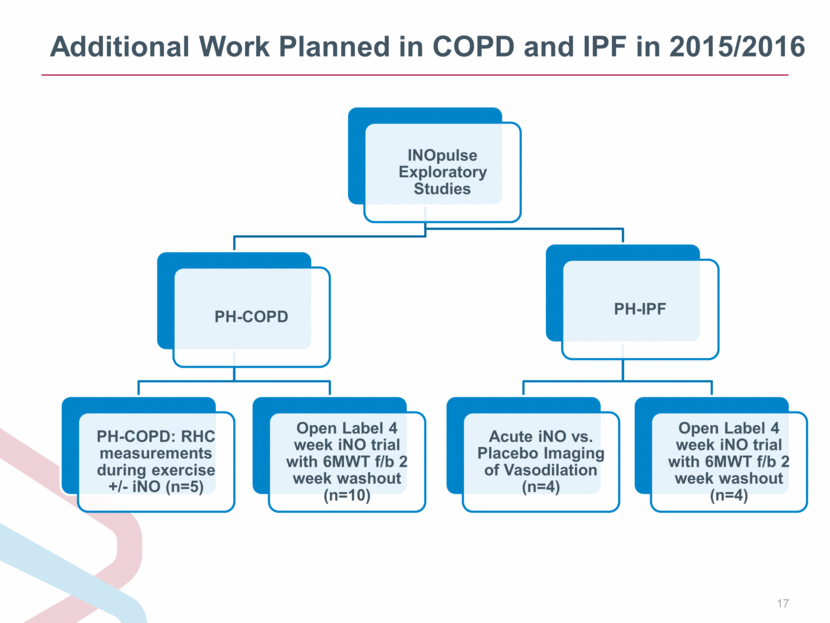
Additional Work Planned in COPD and IPF in 2015/2016 INOpulse Exploratory Studies PH-COPD PH-COPD: RHC measurements during exercise +/- iNO (n=5) Open Label 4 week iNO trial with 6MWT f/b 2 week washout (n=10) PH-IPF Acute iNO vs. Placebo Imaging of Vasodilation (n=4) Open Label 4 week iNO trial with 6MWT f/b 2 week washout (n=4) |
|
|
THANK YOU |
|
|
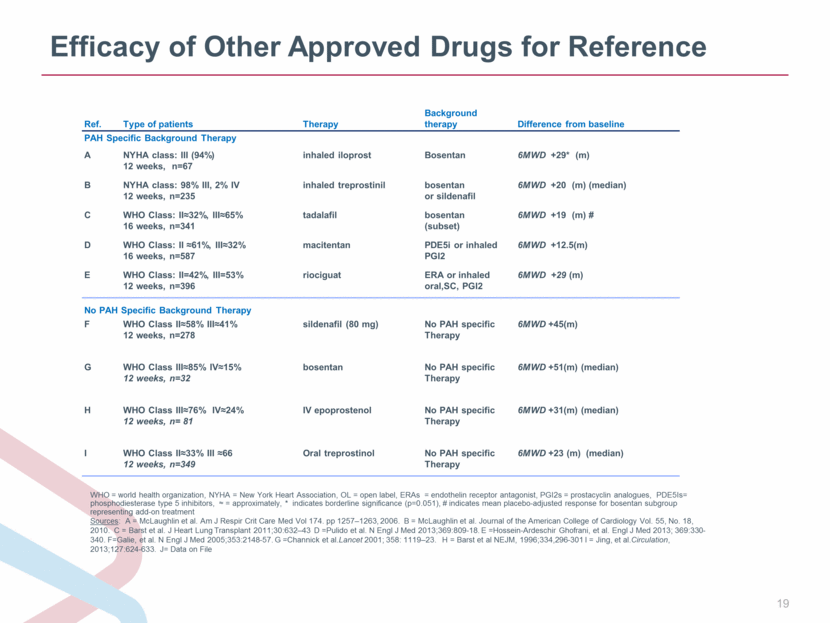
Efficacy of Other Approved Drugs for Reference WHO = world health organization, NYHA = New York Heart Association, OL = open label, ERAs = endothelin receptor antagonist, PGI2s = prostacyclin analogues, PDE5Is= phosphodiesterase type 5 inhibitors, = approximately, * indicates borderline significance (p=0.051), # indicates mean placebo-adjusted response for bosentan subgroup representing add-on treatment Sources: A = McLaughlin et al. Am J Respir Crit Care Med Vol 174. pp 1257–1263, 2006. B = McLaughlin et al. Journal of the American College of Cardiology Vol. 55, No. 18, 2010. C = Barst et al. J Heart Lung Transplant 2011;30:632–43 D =Pulido et al. N Engl J Med 2013;369:809-18. E =Hossein-Ardeschir Ghofrani, et al. Engl J Med 2013; 369:330-340. F=Galie, et al. N Engl J Med 2005;353:2148-57. G =Channick et al.Lancet 2001; 358: 1119–23. H = Barst et al NEJM, 1996;334,296-301 I = Jing, et al.Circulation, 2013;127:624-633. J= Data on File Ref. Type of patients Therapy Background therapy Difference from baseline PAH Specific Background Therapy A NYHA class: III (94%) 12 weeks, n=67 inhaled iloprost Bosentan 6MWD +29* (m) B NYHA class: 98% III, 2% IV 12 weeks, n=235 inhaled treprostinil bosentan or sildenafil 6MWD +20 (m) (median) C WHO Class: II32%, III65% 16 weeks, n=341 tadalafil bosentan (subset) 6MWD +19 (m) # D WHO Class: II 61%, III32% 16 weeks, n=587 macitentan PDE5i or inhaled PGI2 6MWD +12.5(m) E WHO Class: II=42%, III=53% 12 weeks, n=396 riociguat ERA or inhaled oral,SC, PGI2 6MWD +29 (m) No PAH Specific Background Therapy F WHO Class II58% III41% 12 weeks, n=278 sildenafil (80 mg) No PAH specific Therapy 6MWD +45(m) G WHO Class III85% IV15% 12 weeks, n=32 bosentan No PAH specific Therapy 6MWD +51(m) (median) H WHO Class III76% IV24% 12 weeks, n= 81 IV epoprostenol No PAH specific Therapy 6MWD +31(m) (median) I WHO Class II33% III 66 12 weeks, n=349 Oral treprostinol No PAH specific Therapy 6MWD +23 (m) (median) |

