Attached files
| file | filename |
|---|---|
| EX-99.1 - EXHIBIT 99.1 - CASEYS GENERAL STORES INC | annualmeetingscript2015fil.htm |
| 8-K - 8-K - CASEYS GENERAL STORES INC | form8-kseptember2015annual.htm |

Exhibit 99.2 Fiscal Year Ended April 30, 2015


• Increase same-store grocery & other merchandise sales 6.2% with a margin of 32.1% • Increase same-store prepared food & fountain sales 10.4% with a margin of 60.8% • Increase same-store fuel gallons 2% with a margin of 16.7¢ per gallon • Build or acquire 75 to 113 stores. Replace 10 stores and remodel 100 existing stores


FY2014 FY2015 Gallons sold 1.7 billion 1.8 billion Margin 16.1¢ 19.3¢ Gross profit $268 million $351 million

Same Store Gallons Gallons Sold Margin Gross Profit 3.4% 501 million 17.5¢ $88 million

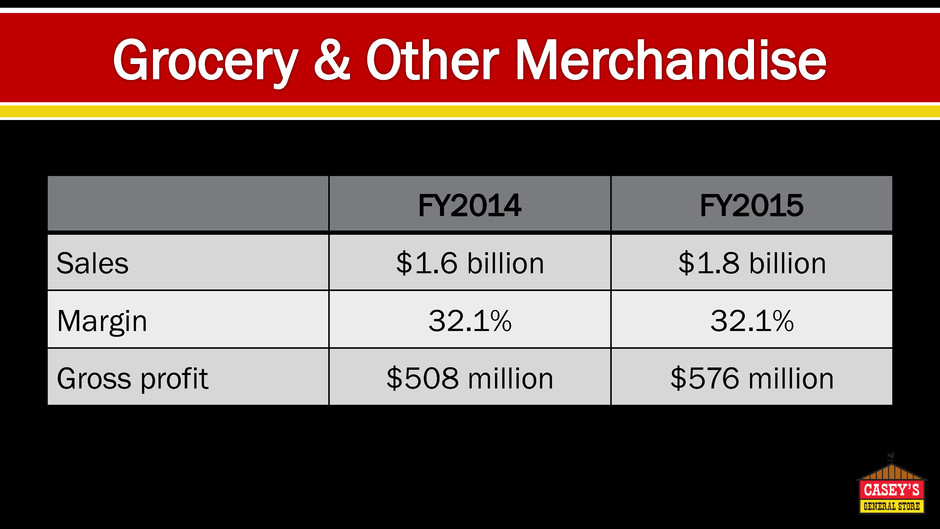
FY2014 FY2015 Sales $1.6 billion $1.8 billion Margin 32.1% 32.1% Gross profit $508 million $576 million

Same Store Sales Sales Margin Gross Profit 7% $527 million 32.6% $172 million

FY2014 FY2015 Sales $659 million $781 million Margin 61.1% 59.7% Gross profit $403 million $466 million

Same Store Sales Sales Margin Gross Profit 10.3% $223 million 62.5% $140 million


Cash & cash equivalents $49 million Long-term debt $838 million Shareholders’ equity $875 million

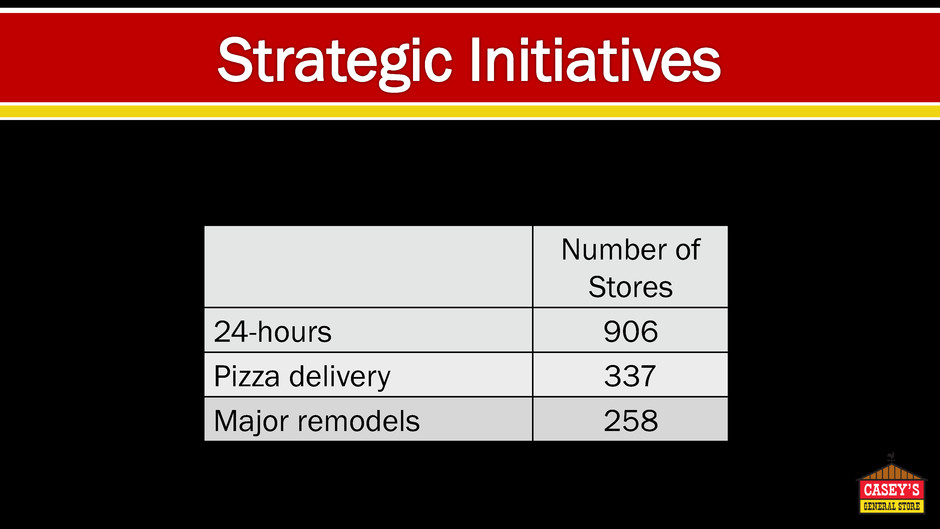
Number of Stores 24-hours 906 Pizza delivery 337 Major remodels 258

New store construction & acquisitions $208 - $300 million Replacements $28 million Maintenance & remodeling $125 million Distribution center projects $40 million Transportation & information systems $35 million Total $436 - $528 million

$38.02 $38.90 $46.93 $57.99 $68.45 $82.18 $109.09 $0.00 $20.00 $40.00 $60.00 $80.00 $100.00 $120.00 04/30/10 04/30/11 04/30/12 04/30/13 04/30/14 04/30/15 Current

0.34 0.505 0.60 0.66 0.72 0.80 0.88 0.00 0.10 0.20 0.30 0.40 0.50 0.60 0.70 0.80 0.90 1.00 04/30/10 04/30/11 04/30/12 04/30/13 04/30/14 04/30/15 2016 Projected

