Attached files
| file | filename |
|---|---|
| EX-10.1 - EX-10.1 - Starwood Waypoint Homes | d12677dex101.htm |
| 8-K - 8-K - Starwood Waypoint Homes | d12677d8k.htm |
| EX-99.1 - EX-99.1 - Starwood Waypoint Homes | d12677dex991.htm |
| EX-2.1 - EX-2.1 - Starwood Waypoint Homes | d12677dex21.htm |
| EX-2.2 - EX-2.2 - Starwood Waypoint Homes | d12677dex22.htm |
| EX-99.3 - EX-99.3 - Starwood Waypoint Homes | d12677dex993.htm |
Exhibit 99.2
|
|
Merger to Create the New Standard in
Single Family Rental REITs
September 2015
|
|
Forward Looking Statements
This presentation may include “forward-looking statements” within the meaning of Section 27A of the Securities Act of 1933, as amended, and Section 21E of the Securities Exchange Act of 1934, as amended. These forward-looking statements, which are based on current expectations, estimates and projections about the industry and markets in which Starwood Waypoint Residential Trust (“SWAY”) and Colony American Homes (“CAH”) operate and beliefs of and assumptions made by SWAY management and CAH management, involve uncertainties that could significantly affect the financial results of SWAY or CAH or the Combined Company. Words such as “may,” “will,” “should,” “might,” “could,” “expects,”
“anticipates,” “intends,” “plans,” “believes,” “seeks,” “estimates,” “potential,” “predicts,” variations of such words, the negative of such words and similar expressions are intended to identify such forward-looking statements, which generally are not historical in nature. Such forward-looking statements include, but are not limited to, statements about the anticipated benefits of the business combination transaction involving SWAY and CAH, including future financial and operating results (such as core funds from operations, “Core FFO”), and the Combined Company’s plans, objectives, expectations and intentions. All statements that address operating performance, events or developments that we expect or anticipate will occur in the future — including statements relating to expected synergies, improved liquidity and balance sheet strength — are forward-looking statements. These statements are not guarantees of future performance and involve certain risks, uncertainties and assumptions that are difficult to predict. Although we believe the expectations reflected in any forward-looking statements are based on reasonable assumptions, we can give no assurance that our expectations will be attained and therefore, actual outcomes and results may differ materially from what is expressed or forecasted in such forward-looking statements. Some of the factors that may affect outcomes and results include, but are not limited to: (i) national, regional and local economic climates, (ii) changes in financial markets and interest rates, or to the business or financial condition of either company or business, (iii) changes in market demand for rental single family homes and competitive pricing, (iv) risks associated with acquisitions, including the integration of the combined companies’ businesses, (v) maintenance of real estate investment trust (“REIT”) status, (vi) availability of financing and capital, (vii) risks associated with achieving expected revenue synergies or cost savings, (viii) risks associated with the companies’ ability to consummate the merger on the terms described or at all and the timing of the closing of the merger, and (ix) those additional risks and factors discussed in reports filed with the Securities and Exchange Commission (“SEC”) by SWAY from time to time, including those discussed under the heading “Risk Factors” in its most recently filed reports on Forms 10-K and 10-Q. There can be no assurance that the proposed combination will in fact be consummated. Neither SWAY, CAH nor any other person assumes responsibility for the accuracy or completeness of any of these forward-looking statements. You should not rely upon forward-looking statements as predictions of future events. The forward-looking statements speak only as of the date of this communication. Neither SWAY nor CAH undertakes any duty to update any forward-looking statements appearing in this presentation, nor to confirm SWAY or CAH’s prior statements to actual results or revised expectations, and neither SWAY nor CAH intend to do so.
| 2 |
|
|
|
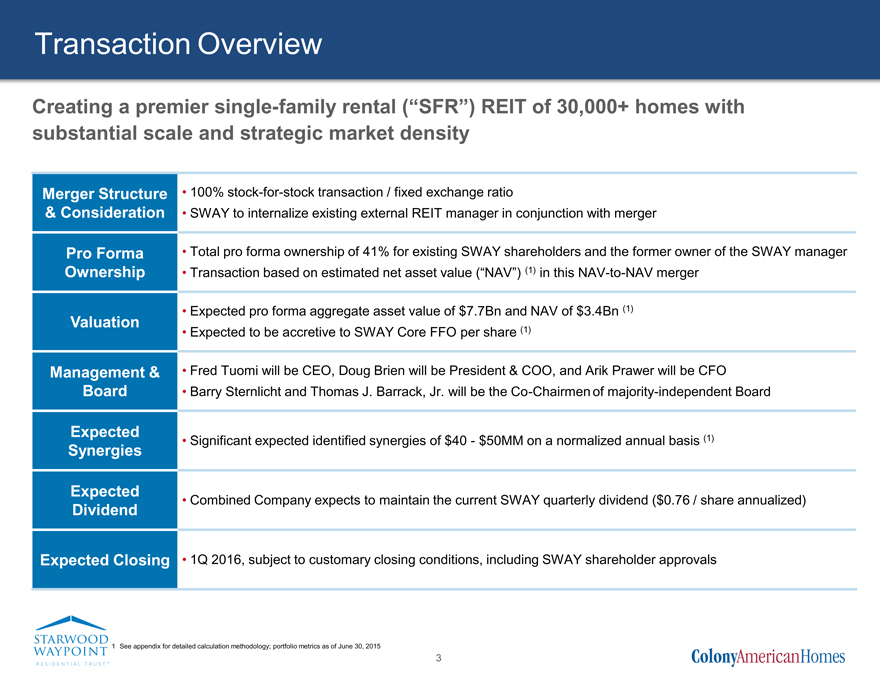
Transaction Overview
Creating a premier single-family rental (“SFR”) REIT of 30,000+ homes with substantial scale and strategic market density
Merger Structure • 100% stock-for-stock transaction / fixed exchange ratio
& Consideration • SWAY to internalize existing external REIT manager in conjunction with merger
Pro Forma • Total pro forma ownership of 41% for existing SWAY shareholders and the former owner of the SWAY manager
Ownership • Transaction based on estimated net asset value (“NAV”) (1) in this NAV-to-NAV merger
Expected pro forma aggregate asset value of $7.7Bn and NAV of $3.4Bn (1)
Valuation
Expected to be accretive to SWAY Core FFO per share (1)
Management & • Fred Tuomi will be CEO, Doug Brien will be President & COO, and Arik Prawer will be CFO
Board • Barry Sternlicht and Thomas J. Barrack, Jr. will be the Co-Chairmen of majority-independent Board
Expected (1)
Significant expected identified synergies of $40—$50MM on a normalized annual basis
Synergies
Expected
Combined Company expects to maintain the current SWAY quarterly dividend ($0.76 / share annualized)
Dividend
Expected Closing • 1Q 2016, subject to customary closing conditions, including SWAY shareholder approvals
1 See appendix for detailed calculation methodology; portfolio metrics as of June 30, 2015
3
|
|
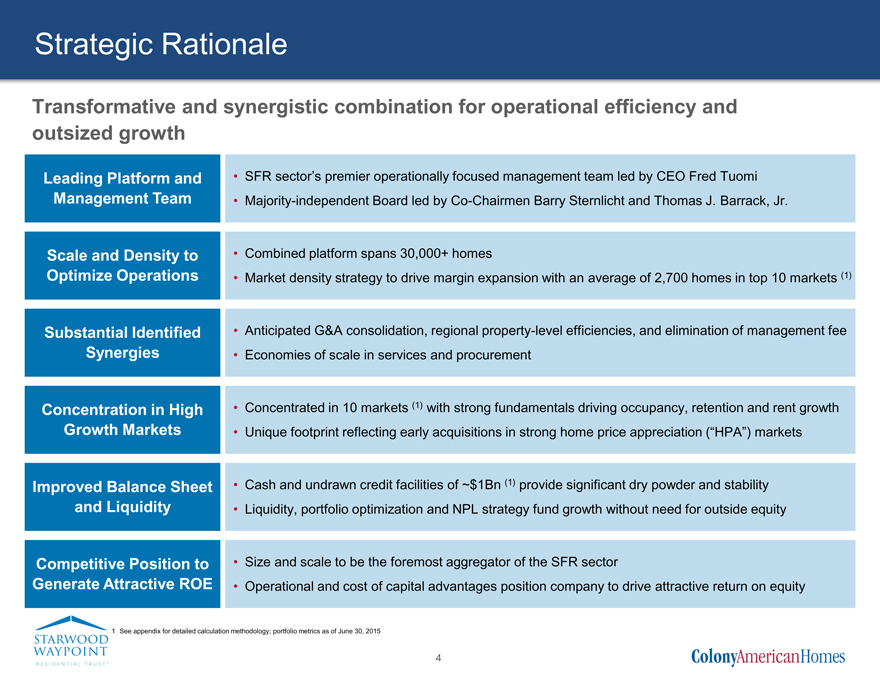
Strategic Rationale
Transformative and synergistic combination for operational efficiency and outsized growth
Leading Platform and • SFR sector’s premier operationally focused management team led by CEO Fred Tuomi Management Team • Majority-independent Board led by Co-Chairmen Barry Sternlicht and Thomas J. Barrack, Jr.
Scale and Density to • Combined platform spans 30,000+ homes
Optimize Operations • Market density strategy to drive margin expansion with an average of 2,700 homes in top 10 markets (1)
Substantial Identified • Anticipated G&A consolidation, regional property-level efficiencies, and elimination of management fee Synergies • Economies of scale in services and procurement
Concentration in High • Concentrated in 10 markets (1) with strong fundamentals driving occupancy, retention and rent growth Growth Markets • Unique footprint reflecting early acquisitions in strong home price appreciation (“HPA”) markets
Improved Balance Sheet • Cash and undrawn credit facilities of ~$1Bn (1) provide significant dry powder and stability and Liquidity • Liquidity, portfolio optimization and NPL strategy fund growth without need for outside equity
Competitive Position to • Size and scale to be the foremost aggregator of the SFR sector
Generate Attractive ROE • Operational and cost of capital advantages position company to drive attractive return on equity
1 See appendix for detailed calculation methodology; portfolio metrics as of June 30, 2015
4
|
|
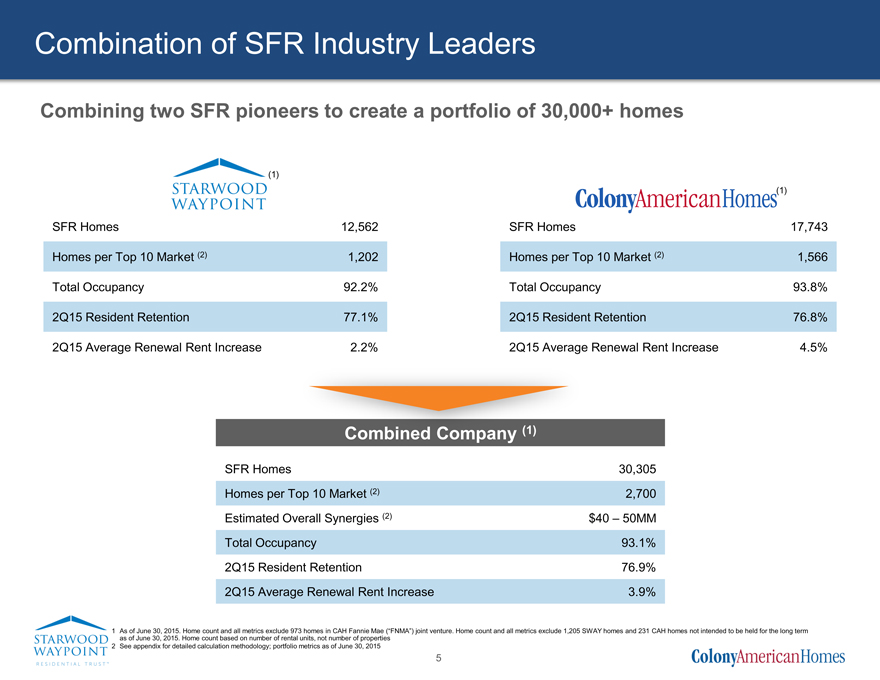
Combination of SFR Industry Leaders
Combining two SFR pioneers to create a portfolio of 30,000+ homes
STARWOOD WAYPOINT (1)
SFR Homes 12,562 Homes per Top 10 Market (2) 1,202 Total Occupancy 92.2% 2Q15 Resident Retention 77.1% 2Q15 Average Renewal Rent Increase 2.2%
ColonyAmericanHomes(1)
SFR Homes 17,743 Homes per Top 10 Market (2) 1,566 Total Occupancy 93.8% 2Q15 Resident Retention 76.8% 2Q15 Average Renewal Rent Increase 4.5%
Combined Company (1)
SFR Homes 30,305
Homes per Top 10 Market (2) 2,700 Estimated Overall Synergies (2) $40 – 50MM
Total Occupancy 93.1% 2Q15 Resident Retention 76.9% 2Q15 Average Renewal Rent Increase 3.9%
1 As of June 30, 2015. Home count and all metrics exclude 973 homes in CAH Fannie Mae (“FNMA”) joint venture. Home count and all metrics exclude 1,205 SWAY homes and 231 CAH homes not intended to be held for the long term as of June 30, 2015. Home count based on number of rental units, not number of properties
2 See appendix for detailed calculation methodology; portfolio metrics as of June 30, 2015
5
|
|
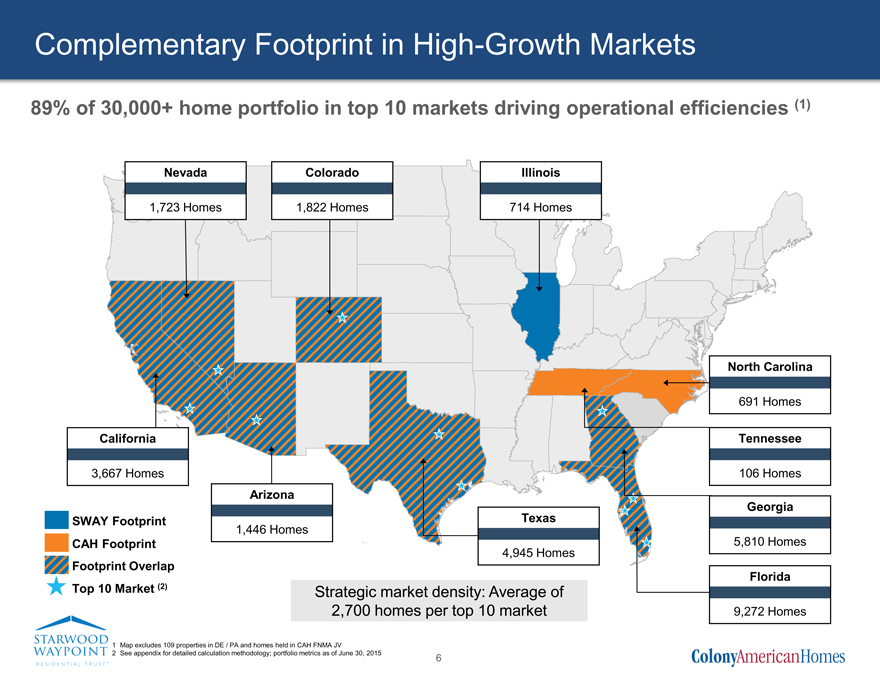
Complementary Footprint in High-Growth Markets
89% of 30,000+ home portfolio in top 10 markets driving operational efficiencies (1)
Nevada
1,723 Homes
Colorado
1,822 Homes
Illinois
714 Homes
California
3,667 Homes
Arizona
1,446 Homes
Texas
4,945 Homes
North Carolina
691 Homes
Tennessee
106 Homes
Georgia
5,810 Homes
Florida
9,272 Homes
Strategic market density: Average of 2,700 homes per top 10 market
SWAY Footprint
CAH Footprint
Footprint Overlap
Top 10 Market (2)
1 Map excludes 109 properties in DE / PA and homes held in CAH FNMA JV
2 See appendix for detailed calculation methodology; portfolio metrics as of June 30, 2015
6
|
|
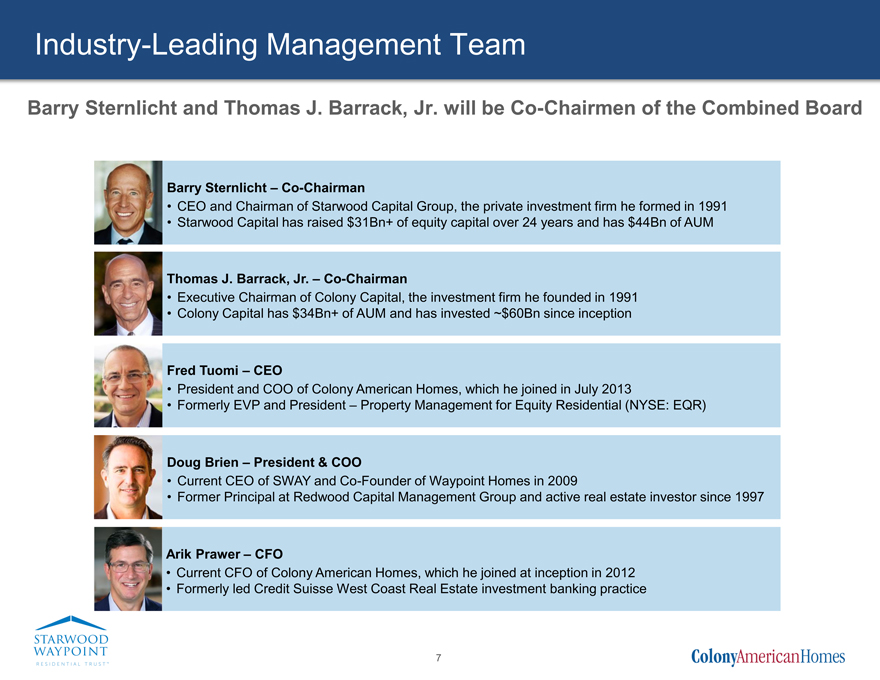
Industry-Leading Management Team
Barry Sternlicht and Thomas J. Barrack, Jr. will be Co-Chairmen of the Combined Board
Barry Sternlicht – Co-Chairman
CEO and Chairman of Starwood Capital Group, the private investment firm he formed in 1991
Starwood Capital has raised $31Bn+ of equity capital over 24 years and has $44Bn of AUM
Thomas J. Barrack, Jr. – Co-Chairman
Executive Chairman of Colony Capital, the investment firm he founded in 1991
Colony Capital has $34Bn+ of AUM and has invested ~$60Bn since inception
Fred Tuomi – CEO
President and COO of Colony American Homes, which he joined in July 2013
Formerly EVP and President – Property Management for Equity Residential (NYSE: EQR)
Doug Brien – President & COO
Current CEO of SWAY and Co-Founder of Waypoint Homes in 2009
Former Principal at Redwood Capital Management Group and active real estate investor since 1997
Arik Prawer – CFO
Current CFO of Colony American Homes, which he joined at inception in 2012
Formerly led Credit Suisse West Coast Real Estate investment banking practice
7
|
|
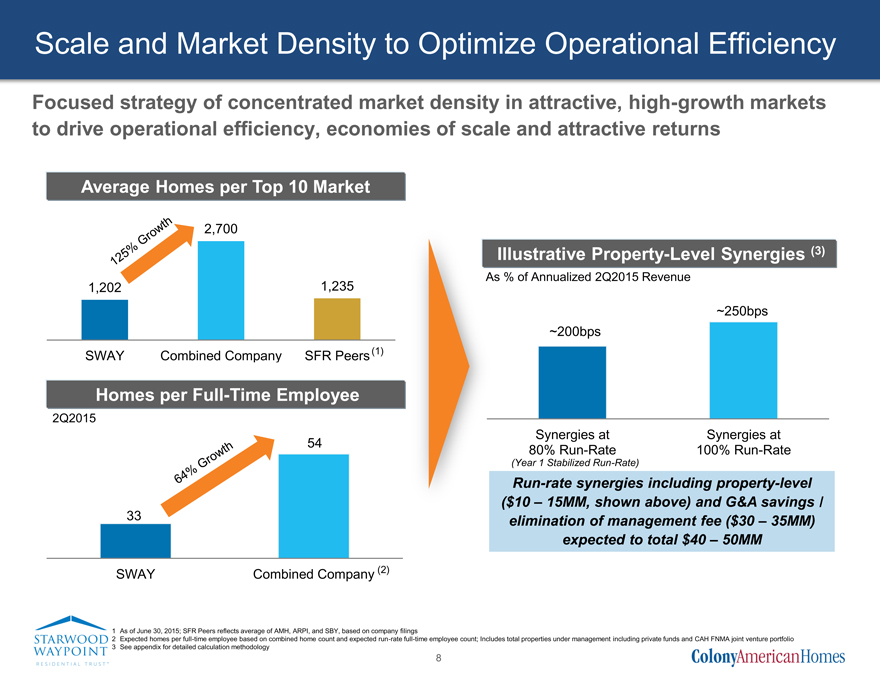
Scale and Market Density to Optimize Operational Efficiency
Focused strategy of concentrated market density in attractive, high-growth markets to drive operational efficiency, economies of scale and attractive returns
Average Homes per Top 10 Market
125% Growth
1,202 2,700 1,235 SWAY Combined Company SFR Peers (1)
Homes per Full-Time Employee
2Q2015 33 54
SWAY Combined Company (2)
64% Growth
Illustrative Property-Level Synergies (3)
As % of Annualized 2Q2015 Revenue
~200bps
~250bps
Run-rate synergies including property-level ($10 – 15MM, shown above) and G&A savings / elimination of management fee ($30 – 35MM) expected to total $40 – 50MM
(Year 1 Stabilized Run-Rate)
Synergies at. .
Synergies at. .
1 As of June 30, 2015; SFR Peers reflects average of AMH, ARPI, and SBY, based on company filings
2 Expected homes per full-time employee based on combined home count and expected run-rate full-time employee count; Includes total properties under management including private funds and CAH FNMA joint venture portfolio
3 See appendix for detailed calculation methodology
8
|
|
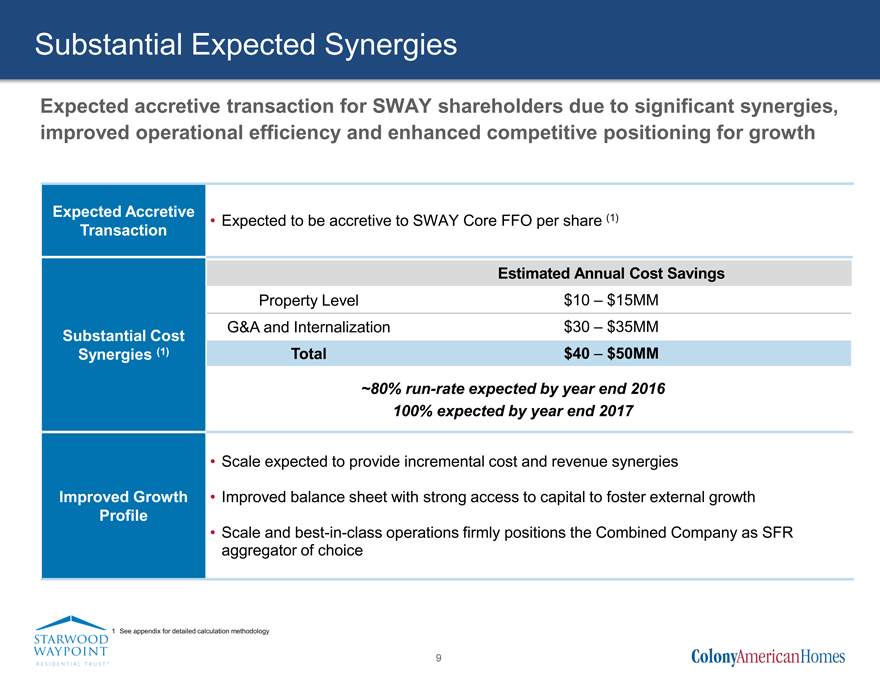
Substantial Expected Synergies
Expected accretive transaction for SWAY shareholders due to significant synergies, improved operational efficiency and enhanced competitive positioning for growth
Expected Accretive Transaction
Expected to be accretive to SWAY Core FFO per share (1)
Substantial Cost Synergies (1)
Estimated Annual Cost Savings
Property Level $ 10 – $ 15MM
G&A and Internalization $ 30 – $ 35MM
Total $ 40 – $ 50MM
~80% run-rate expected by year end 2016
100% expected by year end 2017
Improved Growth Profile
Scale expected to provide incremental cost and revenue synergies
Improved balance sheet with strong access to capital to foster external growth
Scale and best-in-class operations firmly positions the Combined Company as SFR aggregator of choice
1 See appendix for detailed calculation methodology
9
|
|
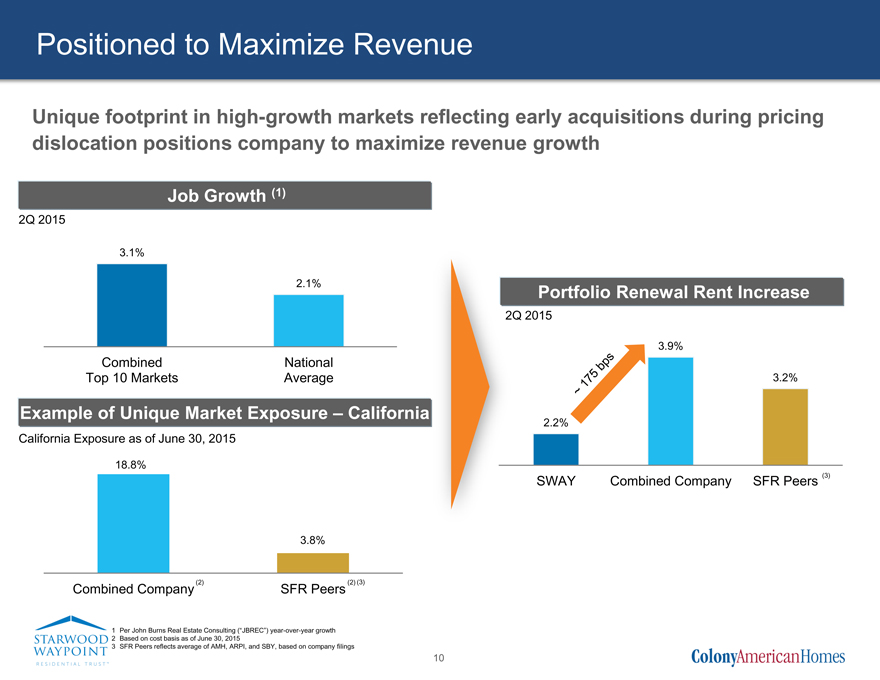
Positioned to Maximize Revenue
Unique footprint in high-growth markets reflecting early acquisitions during pricing dislocation positions company to maximize revenue growth
Job Growth (1)
2Q 2015
3.1%
2.1%
Combined National
Top 10 Markets Average
Example of Unique Market Exposure – California
California Exposure as of June 30, 2015
18.8%
3.8%
(2) (2) (3)
Combined Company SFR Peers
Per John Burns Real Estate Consulting (“JBREC”) year-over-year growth
Based on cost basis as of June 30, 2015
SFR Peers reflects average of AMH, ARPI, and SBY, based on company filings
Portfolio Renewal Rent Increase
2Q 2015
3.9%
3.2%
2.2%
SWAY Combined Company SFR Peers (3)
10
|
|
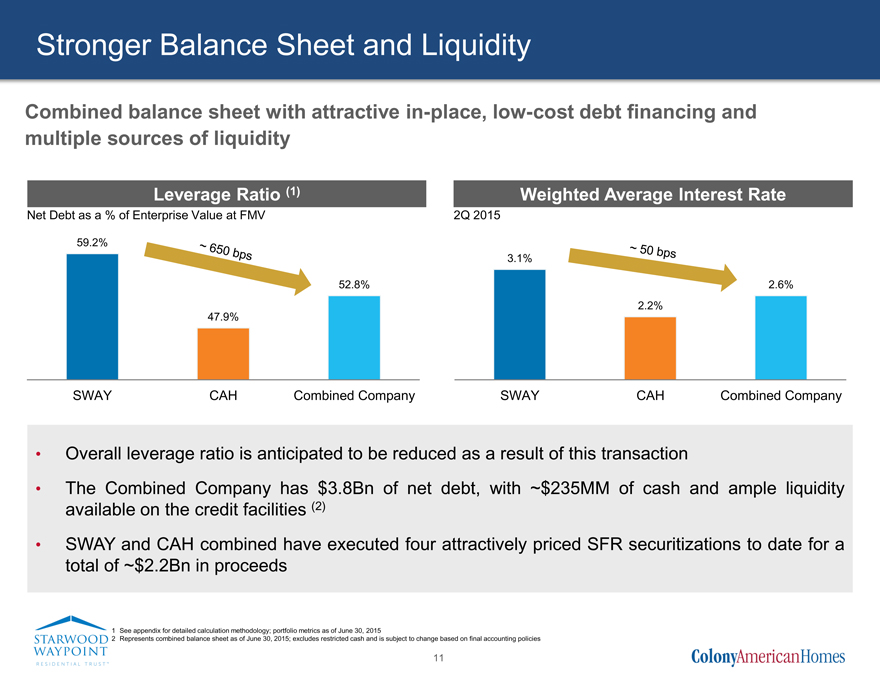
Stronger Balance Sheet and Liquidity
Combined balance sheet with attractive in-place, low-cost debt financing and multiple sources of liquidity
Leverage Ratio (1)
Net Debt as a % of Enterprise Value at FMV
59.2%
52.8%
47.9%
SWAY CAH Combined Company
Overall leverage ratio is anticipated to be reduced as a result of this transaction
The Combined Company has $3.8Bn of net debt, with ~$235MM of cash and ample liquidity available on the credit facilities (2)
SWAY and CAH combined have executed four attractively priced SFR securitizations to date for a total of ~$2.2Bn in proceeds
Weighted Average Interest Rate
2Q 2015
3.1%
2.6%
2.2%
SWAY CAH Combined Company
See appendix for detailed calculation methodology; portfolio metrics as of June 30, 2015
Represents combined balance sheet as of June 30, 2015; excludes restricted cash and is subject to change based on final accounting policies
11
|
|
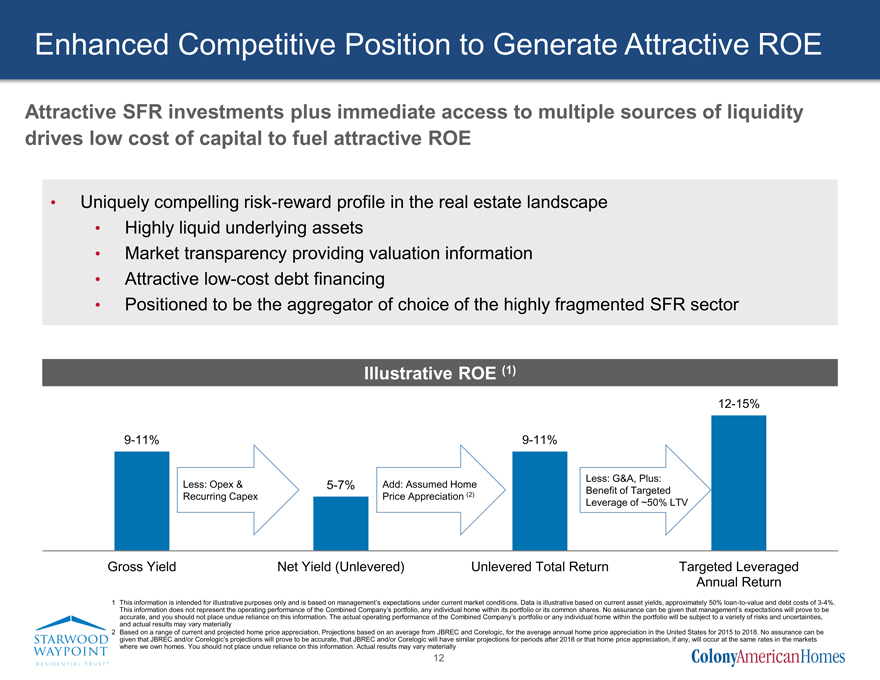
Enhanced Competitive Position to Generate Attractive ROE
Attractive SFR investments plus immediate access to multiple sources of liquidity drives low cost of capital to fuel attractive ROE
Uniquely compelling risk-reward profile in the real estate landscape
Highly liquid underlying assets
Market transparency providing valuation information
Attractive low-cost debt financing
Positioned to be the aggregator of choice of the highly fragmented SFR sector
Illustrative ROE (1)
12-15%
9-11% 9-11%
Less: G&A, Plus:
Less: Opex & 5-7% Add: Assumed Home Benefit of Targeted
Recurring Capex Price Appreciation (2) Leverage of ~50% LTV
Gross Yield Net Yield (Unlevered) Unlevered Total Return Targeted Leveraged…
This information is intended for illustrative purposes only and is based on management’s expectations under current market conditi ons. Data is illustrative based on current asset yields, approximately 50% loan-to-value and debt costs of 3-4%. This information does not represent the operating performance of the Combined Company’s portfolio, any individual home within its portfolio or its common shares. No assurance can be given that management’s expectations will prove to be accurate, and you should not place undue reliance on this information. The actual operating performance of the Combined Company’s portfolio or any individual home within the portfolio will be subject to a variety of risks and uncertainties, and actual results may vary materially
Based on a range of current and projected home price appreciation. Projections based on an average from JBREC and Corelogic, for the average annual home price appreciation in the United States for 2015 to 2018. No assurance can be given that JBREC and/or Corelogic’s projections will prove to be accurate, that JBREC and/or Corelogic will have similar projections for periods after 2018 or that home price appreciation, if any, will occur at the same rates in the markets where we own homes. You should not place undue reliance on this information. Actual results may vary materially
12
|
|
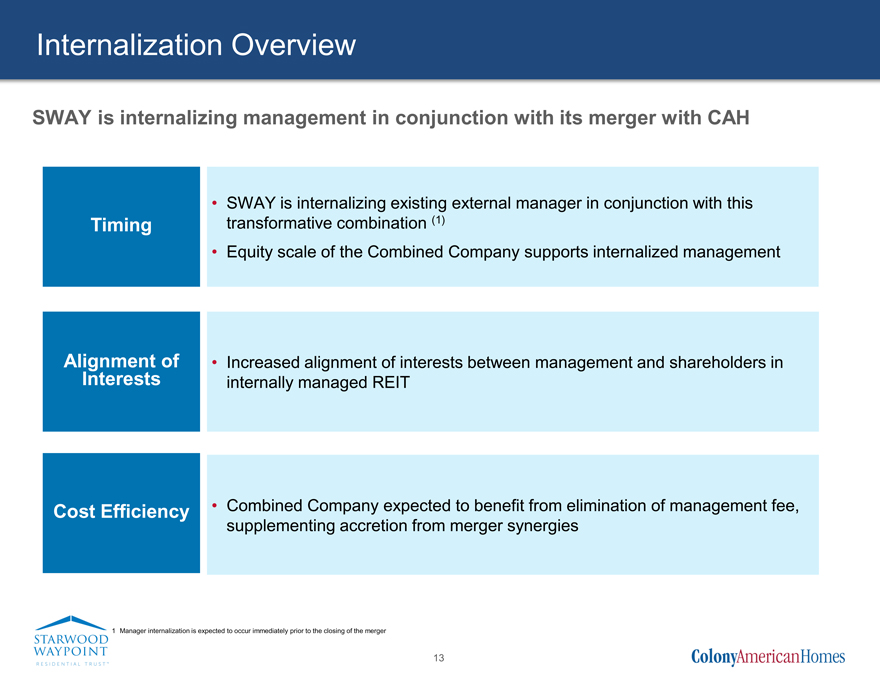
Internalization Overview
SWAY is internalizing management in conjunction with its merger with CAH
Timing
SWAY is internalizing existing external manager in conjunction with this transformative combination (1)
Equity scale of the Combined Company supports internalized management
Alignment of Interests
Increased alignment of interests between management and shareholders in internally managed REIT
Cost Efficiency
Combined Company expected to benefit from elimination of management fee, supplementing accretion from merger synergies
1 Manager internalization is expected to occur immediately prior to the closing of the merger
13
|
|
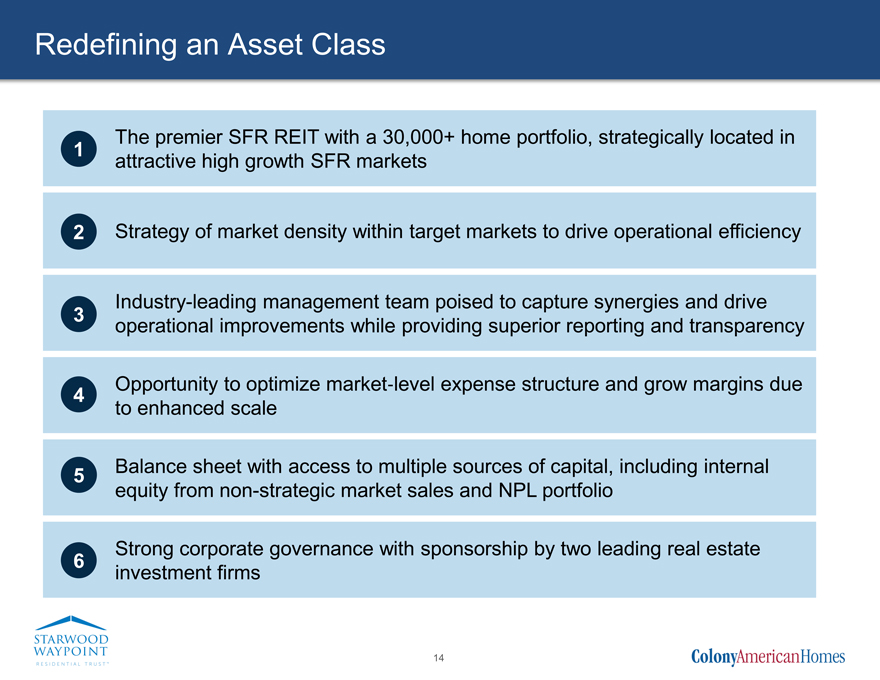
Redefining an Asset Class
The premier SFR REIT with a 30,000+ home portfolio, strategically located in
attractive high growth SFR markets
Strategy of market density within target markets to drive operational efficiency
Industry-leading management team poised to capture synergies and drive
operational improvements while providing superior reporting and transparency
Opportunity to optimize market?level expense structure and grow margins due to enhanced scale
Balance sheet with access to multiple sources of capital, including internal equity from non-strategic market sales and NPL portfolio
Strong corporate governance with sponsorship by two leading real estate
investment firms
14
|
|
Appendix
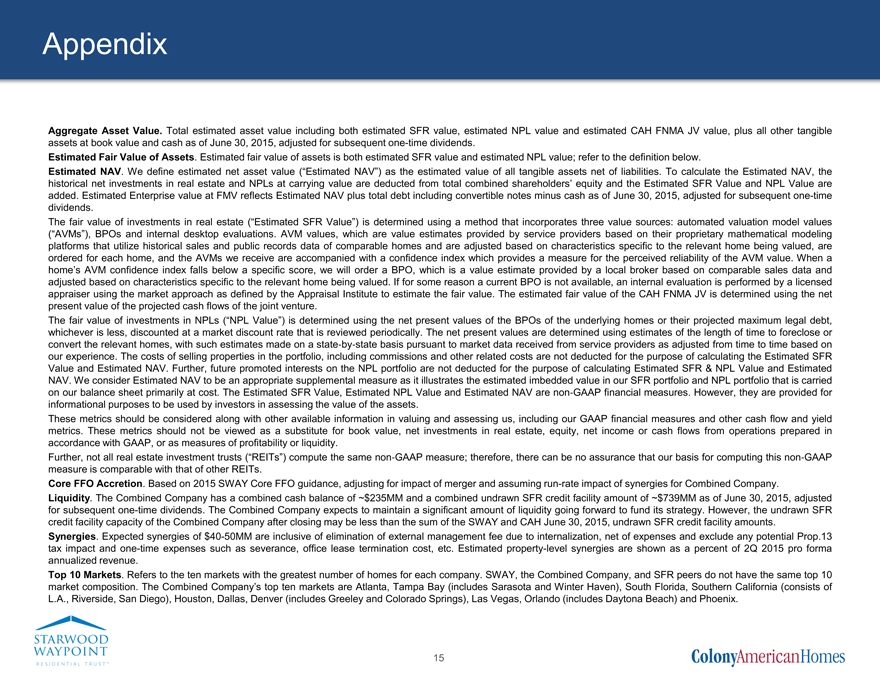
Aggregate Asset Value. Total estimated asset value including both estimated SFR value, estimated NPL value and estimated CAH FNMA JV value, plus all other tangible assets at book value and cash as of June 30, 2015, adjusted for subsequent one-time dividends.
Estimated Fair Value of Assets. Estimated fair value of assets is both estimated SFR value and estimated NPL value; refer to the definition below.
Estimated NAV. We define estimated net asset value (“Estimated NAV”) as the estimated value of all tangible assets net of liabilities. To calculate the Estimated NAV, the historical net investments in real estate and NPLs at carrying value are deducted from total combined shareholders’ equity and the Estimated SFR Value and NPL Value are added. Estimated Enterprise value at FMV reflects Estimated NAV plus total debt including convertible notes minus cash as of June 30, 2015, adjusted for subsequent one-time dividends.
The fair value of investments in real estate (“Estimated SFR Value”) is determined using a method that incorporates three value sources: automated valuation model values (“AVMs”), BPOs and internal desktop evaluations. AVM values, which are value estimates provided by service providers based on their proprietary mathematical modeling platforms that utilize historical sales and public records data of comparable homes and are adjusted based on characteristics specific to the relevant home being valued, are ordered for each home, and the AVMs we receive are accompanied with a confidence index which provides a measure for the perceived reliability of the AVM value. When a home’s AVM confidence index falls below a specific score, we will order a BPO, which is a value estimate provided by a local broker based on comparable sales data and adjusted based on characteristics specific to the relevant home being valued. If for some reason a current BPO is not available, an internal evaluation is performed by a licensed appraiser using the market approach as defined by the Appraisal Institute to estimate the fair value. The estimated fair value of the CAH FNMA JV is determined using the net present value of the projected cash flows of the joint venture.
The fair value of investments in NPLs (“NPL Value”) is determined using the net present values of the BPOs of the underlying homes or their projected maximum legal debt, whichever is less, discounted at a market discount rate that is reviewed periodically. The net present values are determined using estimates of the length of time to foreclose or convert the relevant homes, with such estimates made on a state?by?state basis pursuant to market data received from service providers as adjusted from time to time based on our experience. The costs of selling properties in the portfolio, including commissions and other related costs are not deducted for the purpose of calculating the Estimated SFR Value and Estimated NAV. Further, future promoted interests on the NPL portfolio are not deducted for the purpose of calculating Estimated SFR & NPL Value and Estimated NAV. We consider Estimated NAV to be an appropriate supplemental measure as it illustrates the estimated imbedded value in our SFR portfolio and NPL portfolio that is carried on our balance sheet primarily at cost. The Estimated SFR Value, Estimated NPL Value and Estimated NAV are non?GAAP financial measures. However, they are provided for informational purposes to be used by investors in assessing the value of the assets.
These metrics should be considered along with other available information in valuing and assessing us, including our GAAP financial measures and other cash flow and yield metrics. These metrics should not be viewed as a substitute for book value, net investments in real estate, equity, net income or cash flows from operations prepared in accordance with GAAP, or as measures of profitability or liquidity.
Further, not all real estate investment trusts (“REITs”) compute the same non?GAAP measure; therefore, there can be no assurance that our basis for computing this non?GAAP measure is comparable with that of other REITs.
Core FFO Accretion. Based on 2015 SWAY Core FFO guidance, adjusting for impact of merger and assuming run-rate impact of synergies for Combined Company.
Liquidity. The Combined Company has a combined cash balance of ~$235MM and a combined undrawn SFR credit facility amount of ~$739MM as of June 30, 2015, adjusted for subsequent one-time dividends. The Combined Company expects to maintain a significant amount of liquidity going forward to fund its strategy. However, the undrawn SFR credit facility capacity of the Combined Company after closing may be less than the sum of the SWAY and CAH June 30, 2015, undrawn SFR credit facility amounts.
Synergies. Expected synergies of $40-50MM are inclusive of elimination of external management fee due to internalization, net of expenses and exclude any potential Prop.13 tax impact and one-time expenses such as severance, office lease termination cost, etc. Estimated property-level synergies are shown as a percent of 2Q 2015 pro forma annualized revenue.
Top 10 Markets. Refers to the ten markets with the greatest number of homes for each company. SWAY, the Combined Company, and SFR peers do not have the same top 10 market composition. The Combined Company’s top ten markets are Atlanta, Tampa Bay (includes Sarasota and Winter Haven), South Florida, Southern California (consists of L.A., Riverside, San Diego), Houston, Dallas, Denver (includes Greeley and Colorado Springs), Las Vegas, Orlando (includes Daytona Beach) and Phoenix.
15
|
|
Legal References
In connection with the proposed transaction, SWAY expects to file a proxy statement with the SEC. SWAY also plans to file other relevant documents with the SEC regarding the proposed transaction. INVESTORS ARE URGED TO READ THE PROXY STATEMENT AND OTHER RELEVANT DOCUMENTS FILED WITH THE SEC IF AND WHEN THEY BECOME AVAILABLE, BECAUSE THEY WILL CONTAIN IMPORTANT INFORMATION. You may obtain a free copy of the proxy statement (if and when it becomes available) and other relevant documents filed by SWAY with the SEC at the SEC’s website at www.sec.gov. Copies of the documents filed by SWAY with the SEC will be available free of charge on SWAY’s website at www.starwoodwaypoint.com or by contacting SWAY Investor Relations at 510-987-8308.
SWAY and CAH and their respective trustees and executive officers and other members of management and employees may be deemed to be participants in the solicitation of proxies in respect of the proposed transaction. You can find information about SWAY’s executive officers and trustees in SWAY’s definitive annual proxy statement filed with the SEC on April 3, 2015. Additional information regarding the interests of such potential participants will be included in the proxy statement and other relevant documents filed with the SEC if and when they become available. You may obtain free copies of these documents from SWAY using the sources indicated above.
This document shall not constitute an offer to sell or the solicitation of an offer to buy any securities, nor shall there be any sale of securities in any jurisdiction in which such offer, solicitation or sale would be unlawful prior to registration or qualification under the securities laws of any such jurisdiction. No offering of securities shall be made except by means of a prospectus meeting the requirements of Section 10 of the U.S. Securities Act of 1933, as amended.
16