Attached files
| file | filename |
|---|---|
| 8-K - 8-K - STIFEL FINANCIAL CORP | d13175d8k.htm |
 Stifel Financial Corp. September 2015 Exhibit 99.1 |
 2 Disclaimer Forward-Looking Statements This presentation may contain “forward-looking statements” within the meaning of the Private Securities Litigation Reform Act of 1995 that involve significant risks, assumptions, and uncertainties, including statements relating to the market opportunity and future business prospects of Stifel Financial Corp., as well as Stifel, Nicolaus & Company, Incorporated and its subsidiaries (collectively, “SF” or the “Company”). These statements can be identified by the use of the words “may,” “will,” “should,” “could,” “would,” “plan,” “potential,” “estimate,” “project,” “believe,” “intend,” “anticipate,” “expect,” and similar expressions. In particular, these statements may refer to our goals, intentions, and expectations, our business plans and growth strategies, our ability to integrate and manage our acquired businesses, estimates of our risks and future costs and benefits, and forecasted demographic and economic trends relating to our industry. You should not place undue reliance on any forward-looking statements, which speak only as of the date they were made. We will not update these forward-looking statements, even though our situation may change in the future, unless we are obligated to do so under federal securities laws. Actual results may differ materially and reported results should not be considered as an indication of future performance. Factors that could cause actual results to differ are included in the Company’s annual and quarterly reports and from time to time in other reports filed by the Company with the Securities and Exchange Commission and include, among other things, changes in general economic and business conditions, actions of competitors, regulatory and legal actions, changes in legislation, and technology changes. Use of Non-GAAP Financial Measures The Company utilized non-GAAP calculations of presented net revenues, compensation and benefits, non-compensation operating expenses, income before income taxes, provision for income taxes, net income, compensation and non-compensation operating expense ratios, pre-tax margin and diluted earnings per share as an additional measure to aid in understanding and analyzing the Company’s financial results for the three and six months ended June 30, 2015. Specifically, the Company believes that the non-GAAP measures provide useful information by excluding certain items that may not be indicative of the Company’s operating results and business outlook. The Company believes that these non-GAAP measures will allow for a better evaluation of the operating performance of the business and facilitate a meaningful comparison of the Company’s results in the current period to those in prior periods and future periods. Reference to these non-GAAP measures should not be considered as a substitute for results that are presented in a manner consistent with GAAP. These non-GAAP measures are provided to enhance investors' overall understanding of the Company’s financial performance. |
 Stifel Overview |
 4 Stifel – Premier Investment Bank and Full-Service Investment Firm
Stifel
at a Glance
Core Net Revenue -
$2,213 million (2014)
Global Wealth Management (GWM)
Net Revenue -
$1,233 million (2014)
Private Client
Stifel Bank & Trust
Margin and Securities-based Lending
Asset Management
Institutional Group (IG)
Net Revenue -
$994 million (2014)
Equity & Fixed Income Capital Raising
M&A Advisory / Restructuring
Institutional Equity and Fixed Income
Brokerage Independent Research
Low leverage (3.3x)
(1) (2)
,
$2.5 billion stockholders’ equity
(2)
and $3.2 billion market capitalization
(3)
34% Insider ownership aligns employees' interests with
other shareholders (4)
Over 6,900 associates
(2)
Balanced business mix (55% GWM / 45% IG) (2014 net
revenues) National
presence
with
over
2,800
financial
advisors
(2)
Largest
U.S.
equity
research
platforms
with
1,500
stocks
under
coverage
(3)
Broad
investment
banking
and
institutional
sales
and
trading
capabilities
–
domestic
and
international
(1)
Assets / equity (as adjusted).
(2)
As of 6/30/2015.
(3)
As of 9/15/2015.
(4)
Insider ownership percentage includes all fully diluted
shares, units outstanding and options outstanding, as of 12/31/2014. |
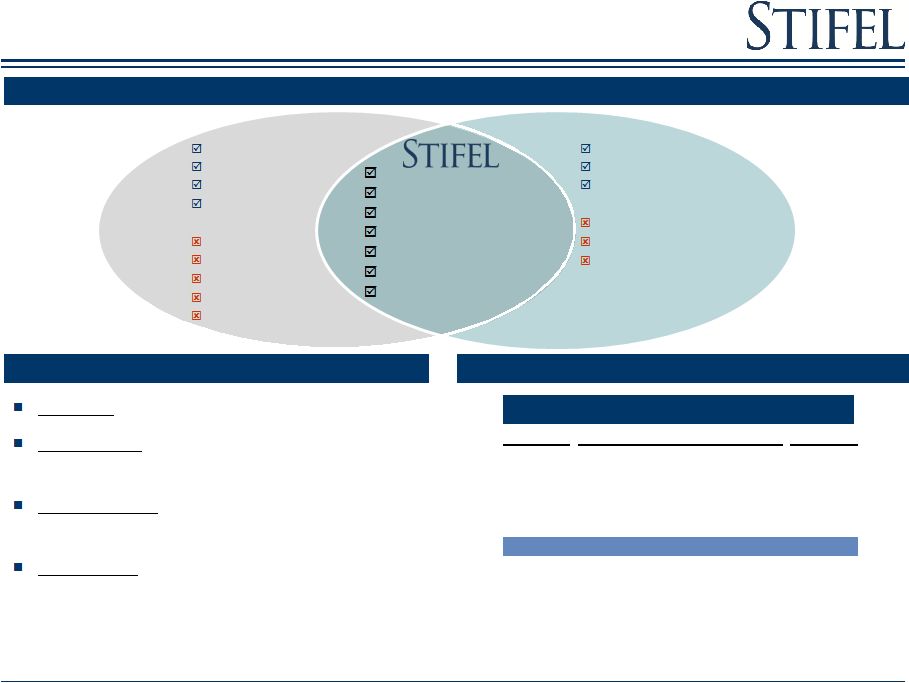 5 Bulge Bracket Boutique Leading broker-dealer providing wealth management and
institutional services to consumers and companies
Stifel’s Differentiated Value Proposition: Growth, Scale
and Stability Institutional
Wealth Management
#6 Largest Retail Brokerage Network
(2)
Size / scale
Large distribution
Trading
Retail
Issues
Lack of focus
Banker turnover
Lack of commitment
Research indifference
Lack of growth investors
Firm focus
Good research
Growth investor access
Issues
Financial / firm stability
Trading support
Few with retail
Size / scale
Firm focus
Stability (financial & personnel)
Large distribution
Trading
Outstanding research
Retail
LARGEST
provider of U.S. equity research
2
nd
LARGEST
Equity
trading
platform
in
the
U.S.
outside of the Bulge Bracket firms
(1)
FULL SERVICE
investment banking with
expertise across products and industry sectors
ACCESS TO top ten private client platform (1) Based on 2014 U.S. trading volume per Bloomberg. (2) Source: SIFMA and publicly available information for U.S. brokerage networks. Includes investment banks only.
Represents Wealth Management Americas segment
only. Rank
Firm
Brokers
1
Bank of America Merrill Lynch
19,417
2
Morgan Stanley Wealth Management
16,316
3
Wells Fargo Securities
15,212
4
UBS
7,119
5
Raymond James
5,700
6
Stifel
2,823
7
RBC Capital Markets
2,000
8
JPMorgan
1,506
9
Oppenheimer & Co Inc
1,390
10
Janney Montgomery Scott
738 |
 6 Well-diversified, low risk business model with balanced retail
and institutional exposure
6
Unburdened by capital constraints
Low leverage business model and conservative risk
management Limited balance sheet
risk Stable wealth management business is
augmented by profitable and growing institutional business Drive revenue synergies by leveraging the wealth management and institutional business
Net Revenues
6M 2014
6M 2015
Core Operating Contribution
6M 2014
6M 2015
Balanced business model facilitates growth in all market
environments Note: Net revenues and operating
contribution percentages excludes the Other segment. Refer to slide 30 for additional segment information. |
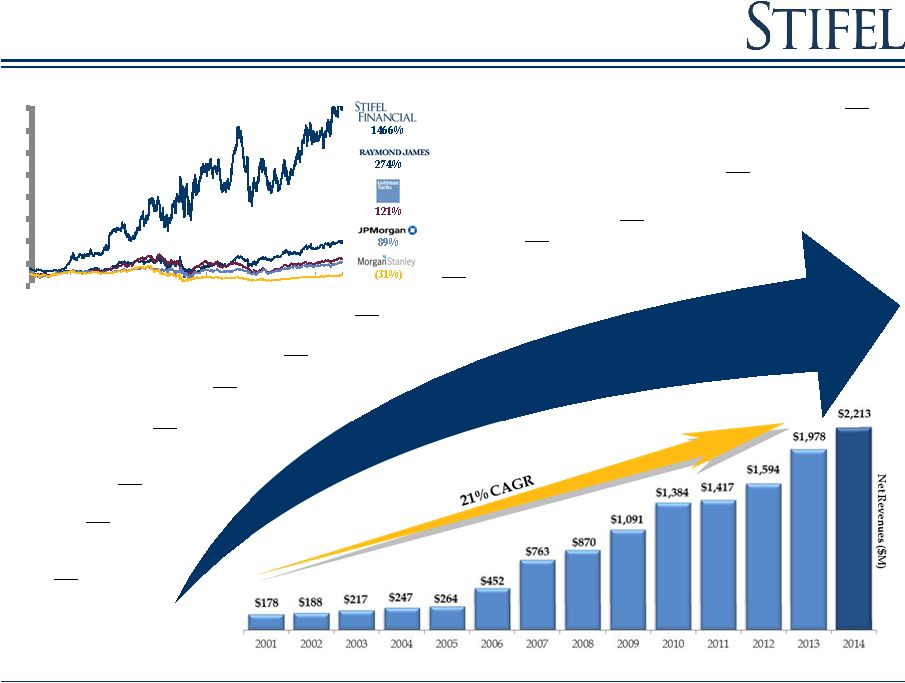
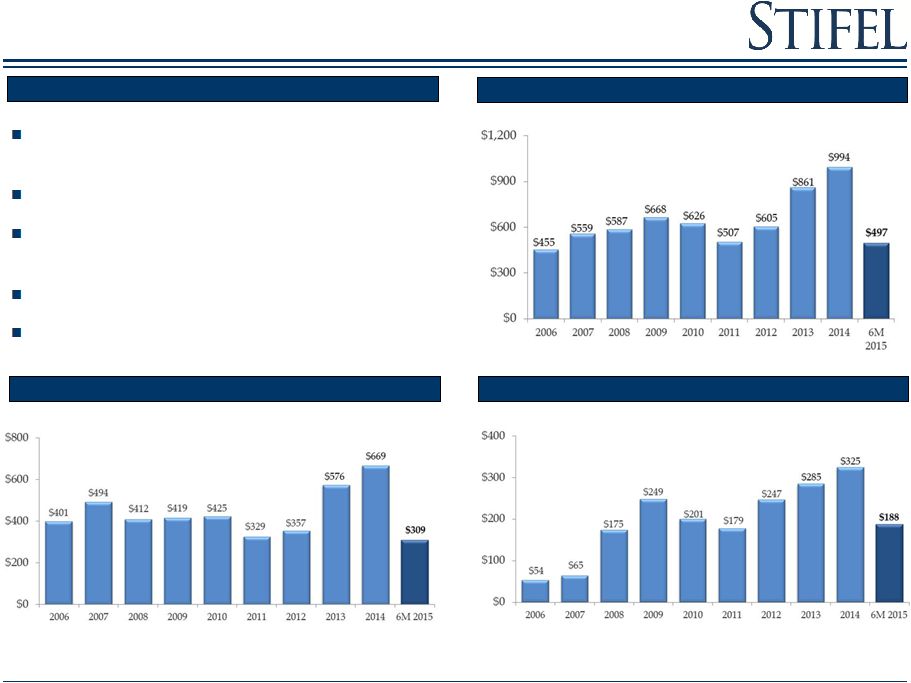
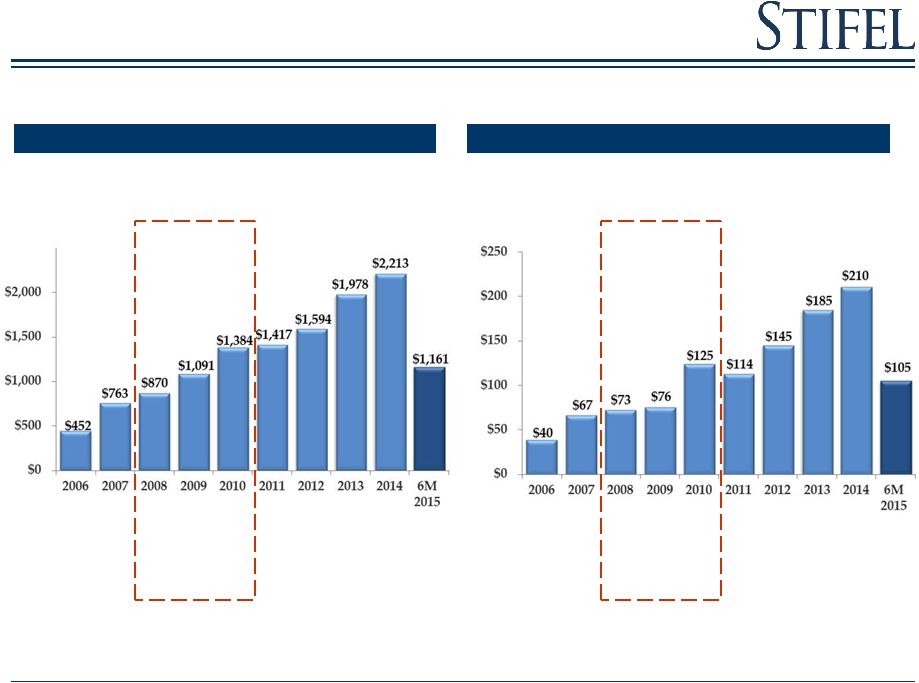 7 Demonstrated ability to grow through all market environments
while maintaining solid profitability
CAGR: 22%
Non-GAAP Net Revenues ($MM)
Non-GAAP Net Income ($MM)
Financial Crisis
Financial Crisis
CAGR: 23% |
 Strategic Vision |
 9 Strategic Vision To build the premier wealth management and investment banking firm
Over 2,800
financial
advisors in 349
branches with
over $200B in
client assets
Private
Client
Asset
Management
Bank
$22B in total
assets
managed
through
various
strategies
Equities
Sales +
Trading
$4.8B in assets
funded by
client deposits
Global Wealth Management
Institutional
Fixed
Income
Sales +
Trading
Investment
Banking
Research
Experienced
sales force with
extensive
distribution
capabilities
Comprehensive
platform
including
research,
strategy and
DCM teams
Over 350
professionals
with extensive
experience
across all
products and
industry
verticals
Largest
research
platform with
over 1,400 U.S.
and 250
European
stocks covered |
 10 How We Look at Strategic Opportunities Strategic combinations need to be accretive to: Shareholders Expected revenue and EPS growth in a reasonable timeframe
Associates
Add additional capabilities and new geographies
Clients
Be more relevant and expand product offerings
New partners
Retain
authority
coupled
with
the
stability
of
Stifel’s
size
and
scale |
 11 (100%) 100% 300% 500% 700% 900% 1100% 1300% 1500% Jul-15 Aug-13 Aug-11 Aug-09 Aug-07 Aug-05 Aug-03 Significant Growth As of 6/30/15. 2005 Legg Mason’s Capital Markets Division Acquired 2008 Butler Wick 2009 56 UBS Private Client Branches Acquired 2010 Thomas Weisel Partners 2007 Ryan Beck Acquisition Stifel Bank & Trust 2011 Stone & Youngberg 2012 Miller Buckfire 2013 Knight Capital Group’s Fixed Income Division 2014 De La Rosa, Oriel Securities, 1919 Investment Counsel, Merchant Capital 2013 Keefe, Bruyette & Woods Acquisition 2013 Acacia Bank & Ziegler Lotsoff 2015 Barclays Wealth & Investment Management (Pending), Sterne Agee, Sidoti Joint Venture, Leumi Partners Collaboration Agreement |
 12 Stifel to Acquire Barclays' Wealth and Investment Management,
Americas
A Powerful Combination of Breadth and Depth
Barclays Wealth Americas brings a highly focused
organization with deep, high conviction,
investment capabilities Stifel brings
significant breadth of product and service
capabilities that are complementary to Barclays Wealth
Americas This combination of depth and breadth,
joined with a culture of meritocracy and
entrepreneurial, client first thinking =
Premier Wealth Management Franchise
Unique transaction structure whereby
Stifel’s
investment
will match the business and professionals who join the firm |
 13 Combining Breadth and Depth Stifel - Breadth 12-office footprint covers all major wealth centers in the U.S. Full suite of high-conviction investment capabilities including: Investment advisory and managed money Alternative Investment Capabilities Capital Markets Custom Credit and Reg T (margin) National Delaware Trust services charter Barclays - Depth National presence in over 340 offices Broad Investment Advisory Platform offers new investment managers and strategies to Barclays IRs Stifel has extensive Asset Management capabilities including 19/19 Investment Counsel, Ziegler Capital, Thomas Weisel Partners, EquityCompass, and Washington Crossing Advisors New Trading and Performance Reporting Technologies Broad Stifel and KBW Research Platforms Broad Stifel/KBW Investment Banking Capabilities Nationally recognized municipal finance franchise This combination of depth and breadth, joined with a culture of meritocracy and entrepreneurial, client first
thinking
=
Premier Wealth Management Franchise
|
 Segment Overview – Global Wealth Management |
 15 Global Wealth Management Private Client – 350 financial advisors and support Revenue production has exceeded expectations October 2009 Bank holding company Grown assets from ~ $100M to $5.2B April 2007 Private Client – 75 financial advisors Public Finance December 2008 56 UBS Branches Private Client – 400 financial advisors Capital Markets February 2007 Asset Management Over $4 billion in assets November 2013 Clean portfolio of 1-4 family residential mortgages
October 2013
Acquisitions and hiring have grown GWM to a $1.3 billion
segment Customized investment advisory and
trust services November 2014
Private Client
Asset Management
Bank |
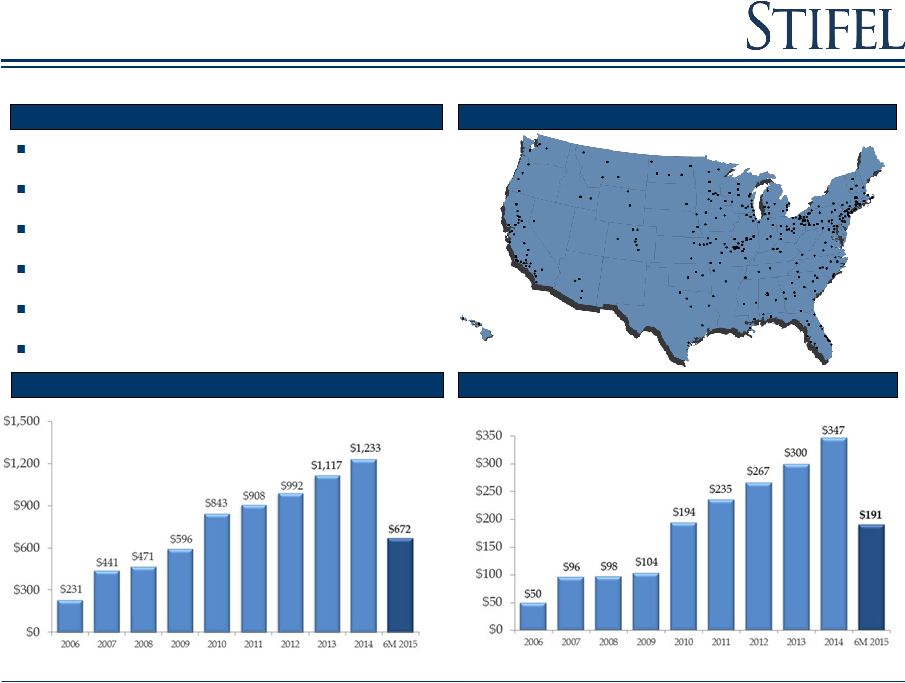 16 (1) Includes Independent Contractors. Global Wealth Management Provides Securities Brokerage Services and Stifel Bank Products
Net Revenues ($MM)
Core Operating Contribution ($MM)
Overview
National Presence
Grown from 600+ financial advisors in 2005 to over
2,800
(1)
financial advisors currently
Proven organic growth and acquirer of private client
business
Individual
investors
are
generally
mid-
to
long-term
buyers
Goal of providing price stability and support to the
institutional order book
Strategy of recruiting experienced advisors with
established client relationships
Expanding U.S. footprint
|
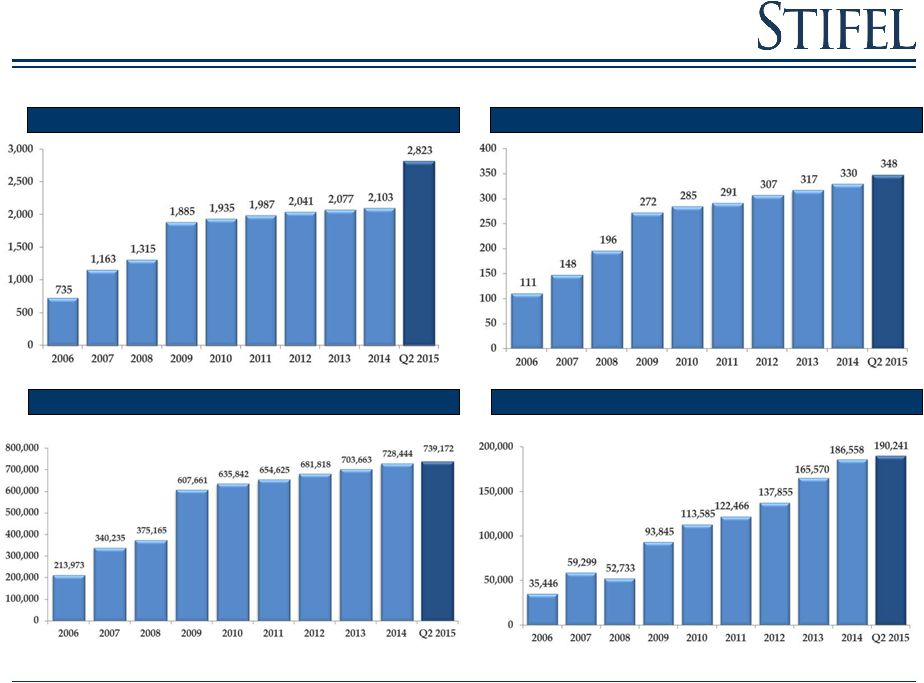 17 (1) Includes Independent Contractors. (2) Q2 2015 total client assets does not include Sterne Agee client assets.
Global Wealth Management
Key Operating Metrics
Accounts
Financial Advisors
(1)
Total Client Assets
(2)
($MM)
Branches |
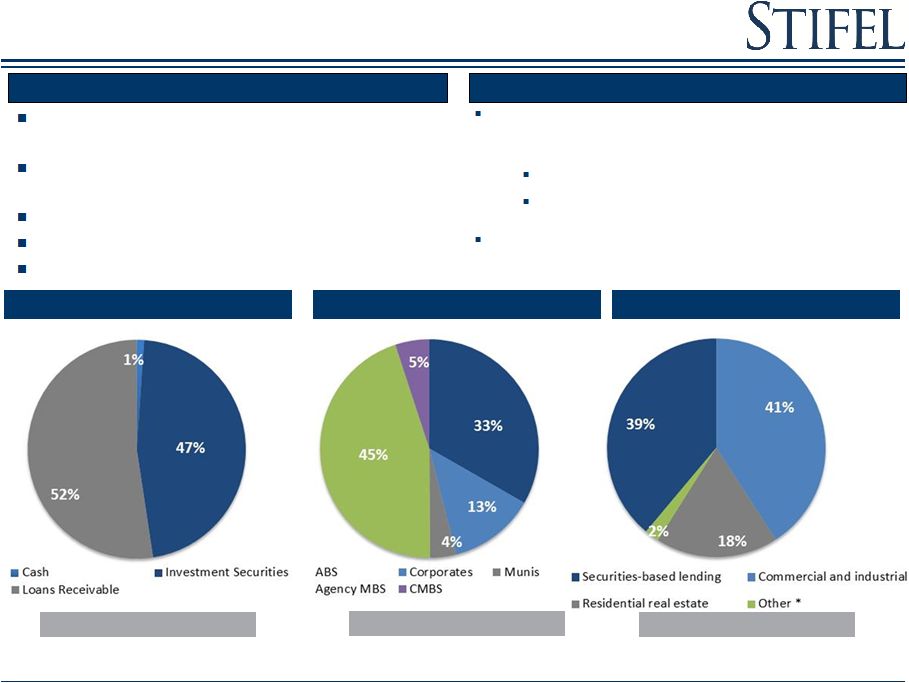 18 18 Interest Earnings Assets (1) Investment Portfolio Total: $5.1 Billion Total: $1.9 Billion (2) Stifel Bank and Trust Total: $2.5 Billion (3) Loan Portfolio (Gross) Acquired FirstService Bank, a St. Louis-based, Missouri-chartered commercial bank, in April 2007
Stifel Financial became a bank holding company and
financial services holding company
Balance sheet growth with low-risk
assets Funded by Stifel Nicolaus client
deposits Maintain high levels of
liquidity Overview
Strength of Brokerage Position
Offers banking products (securities based loans and
mortgage loans) within the GWM client base,
including establishing trust
services Built-in source of
business High net worth clients
Highly efficient due to lack of “brick and
mortar” deposit focused facilities
Note: Data as of 6/30/15.
(1)
Average interest earning assets for the three months ended
6/30/15. (2)
Non-agency
MBS,
Commercial
MBS,
and
Munis
make
up
less
than
10%
of
Investment
Portfolio.
(3)
*Other includes commercial real estate, consumer loans, and
home equity lines of credit. |
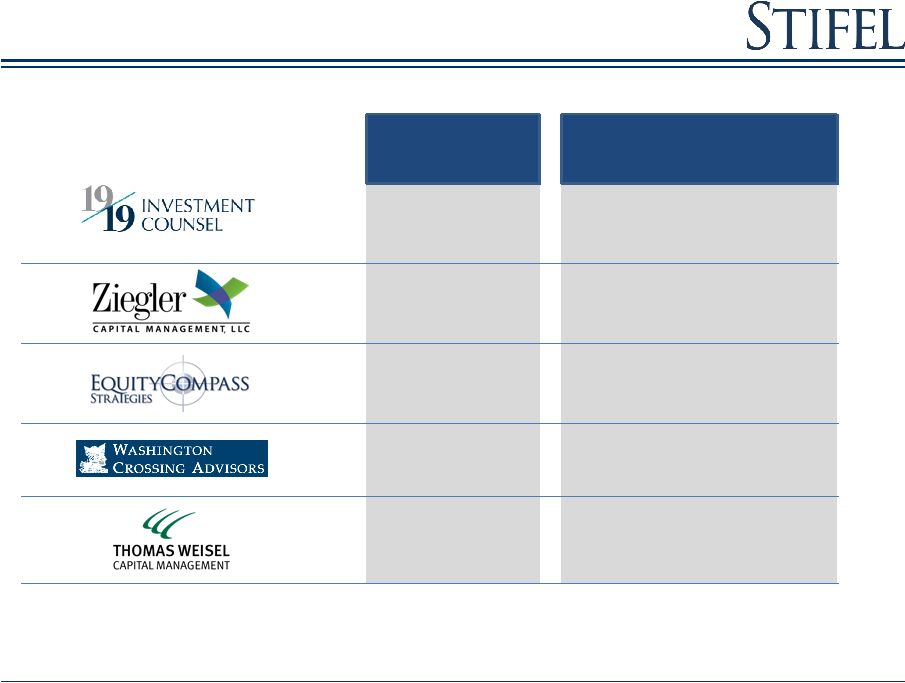 $10.1 Billion $9.2 Billion $2.2 Billion $850 Million $330 Million Assets¹ Location Growing Asset Management Capabilities 19 ¹Assets as of June 30, 2015. Includes assets under advisement and assets under management. Excludes private equity funds. EquityCompass Strategies is a research and investment advisory unit of Choice Financial Partners, Inc. (“Choice”). Choice and Ziegler Capital Management LLC are wholly owned subsidiaries and affiliated SEC Registered Investment Advisers of Stifel Financial Corp. (“Stifel”). 1919 Investment Counsel consists of 1919 Investment Counsel & Trust Company, N.A. (“1919 IC&T”) and 1919 Investment Counsel, LLC (“1919ic”). 1919ic and Thomas Weisel Capital Management LLC are SEC Registered Investment Advisers and indirect subsidiaries of Stifel. 1919 IC&T is an OCC-regulated national trust company that is a wholly owned subsidiary of Stifel. Washington Crossing Advisors is a Stifel investment advisory program. Total Assets: $22.68 Billion¹ Baltimore, New York, Cincinnati, Philadelphia Chicago, Milwaukee, St. Louis Baltimore, MD Florham Park, NJ San Francisco, CA |
 Segment Overview – Institutional Group |
 21 Building Scale and Capabilities into a $1.0 billion Segment
Growth Focused
Investment Banking, Research, Sales and
Trading July 2010
Core of our Institutional sales, trading and research
group December 2005
Fixed Income IB, Sales and Trading
Private Client
October 2011
FIG Investment Banking
FIG Sales and Trading / Research
February 2013
Restructuring advisory
December 2012
Fixed
Income
Sales
and
Trading
–
U.S.
&
Europe
Fixed Income Research
July 2013
California-based investment bank and bond
underwriter April 2014
UK-based full service investment bank
July 2014
Expands Public Finance in Southeast
December 2014
Equities
Fixed Income
Investment
Banking
Highly complementary fixed income platforms
June 2015
Knight |
 22 (1) Based on 2014 U.S. trading volume per Bloomberg. (2) Includes Thomas Weisel historical investment banking revenues for years 2006 through September 30, 2010. (3) 2012 includes realized and unrealized gains on the Company’s investment in Knight Capital Group, Inc. of
$39.0 million. Institutional
Group Net Revenues ($MM)
(2)(3)
Fixed Income Brokerage + Investment Banking
Overview
Provides securities brokerage, trading, research,
underwriting and corporate advisory
services Largest provider of U.S. Equity
Research 2
nd
largest Equity trading platform in the U.S.
outside of the Bulge Bracket
(1)
Full-service Investment Bank
Comprehensive Fixed Income platform
Equity Brokerage + Investment Banking
(2) |
 23 Institutional Equity Sales Equity Trading Institutional Group – Equity Sales and Trading 23 Extensive Distribution Network Powerful Platform Spanning North America and Europe 80 person sales force, commission based Experts in small and mid cap growth and value Team based sales model with 2-4 sales people per
account
Team leaders have an average of 15 years
experience Offices in all major institutional
markets in North America &
Europe Accounts range from large mutual funds
to small industry focused
investors Managed over 712 non-deal
roadshow days in 2014 Extensive experience
with traditional and overnight corporate
finance transactions Relationships with over
3,500 institutional accounts globally Active
daily market maker in over 3,700 stocks
Traded over 11.76 billion shares in 2014
Complete coverage of North America and Europe for North
American listed equities Major liquidity
provider to largest equity money management complexes Multi-execution venues: high-touch, algorithms, program trading, and direct market access
Dedicated convertible sales, trading, and research
desk 53 sales traders located in
Baltimore, New York, Boston, Dallas, San
Francisco, and London
24 position traders covering each major
industry 8 specialized traders focused on:
Option Trading, Convertible and ETF
Trading Profitable model with advantages of
scale |
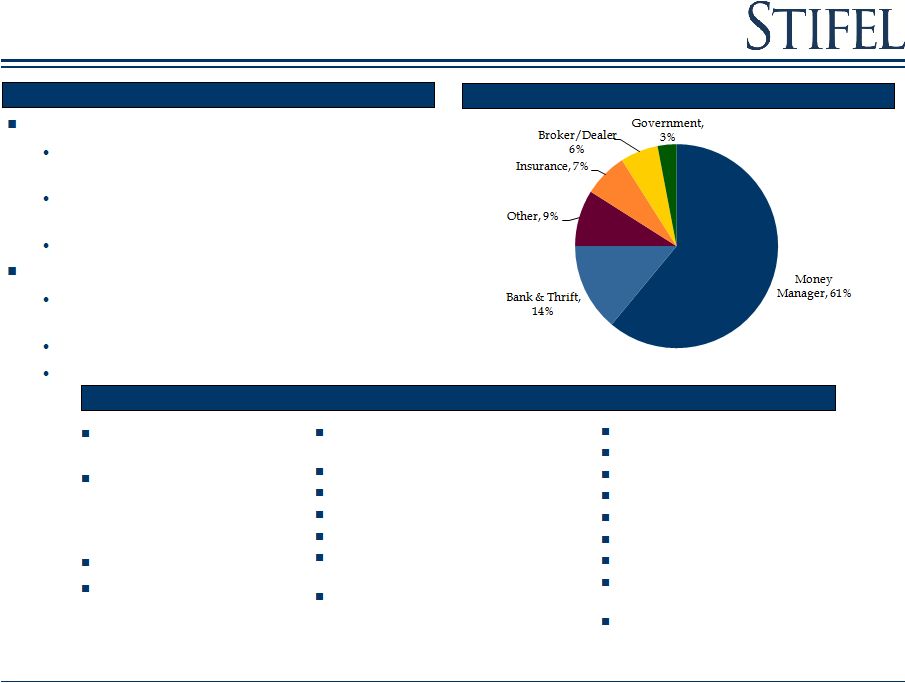 Overview Institutional Group – Fixed Income Capital Markets Client Distribution (1)(2) Platform & Products (1) Client Distribution is as of 06/30/2015 (2) Other category includes: Credit Union, Corporation, Hedge Fund, Pension Fund, Trust Company, Foundation,
Endowment, University & Non-Profit.
24
Comprehensive platform
96 traders with annual client trade volume
approaching $500 billion
69-person Fixed Income Research and Strategy
Group
8
person US Corporate Debt Capital Markets Group
Widespread distribution
More than 250 Institutional sales professionals
covering over 7,750 accounts
42 institutional fixed income offices
nationwide European offices in London, Zurich
and Madrid Customer-driven,
non- proprietary
Focus on long-only money
managers and income funds,
depositories, and hedge
funds
Consistency of execution
Identification of relative
value through asset
class/security selection
US Government and Agency
Securities
Mortgage-Backed Securities (MBS)
Whole Loans
Government-Guaranteed Loans
Asset-Backed Securities (ABS)
Commercial Mortgage-Backed
Securities (CMBS)
Certificates of Deposit
High Yield and Distressed Credit
Loan Trading Group
Aircraft Finance & Credit Solutions
Hybrid Securities
Emerging Markets
Structured Products
Investment Grade Credit
Municipal Sales and Trading and
Public Finance
UK Sales and Trading (former
Knight Capital team) |
 Overview Institutional Group – Public Finance 25 Stifel has ranked in the top ten nationally for senior
managed negotiated underwritings for the past three
years, and Stifel has ranked #1nationally for
senior managed K-12 negotiated
underwritings since 2011.
Stifel’s
Public Finance Group ranked #1 in municipal
negotiated issues in 2014
Total of 21 Public Finance offices
100 Public Finance professionals
Source: Thomson Reuters: SDC (True Economics to Book) Ranked
by number of transactions. Public Finance
Underwritings Negotiated
Number
Par Amount
Number
Par Amount
Number
Par Amount
Number
Par Amount
Senior Manager/
Private Placement
570
$12,932,649,112
630
$11,859,513,756
598
$9,928,173,963
559
$9,989,033,787
Co-Manager
126
$18,304,320,000
174
$34,775,092,051
151
$41,793,904,000
162
$53,169,398,000
Total
696
$31,236,969,112
804
$46,634,605,807
749
$51,722,077,963
721
$63,158,431,787
Competitive
Number
Par Amount
Number
Par Amount
Number
Par Amount
Number
Par Amount
Senior Manager
47
$1,128,624,997
65
$3,357,904,999
73
$587,723,000
114
$803,240,000
Co-Manager
283
$17,618,886,508
345
$9,258,771,169
268
$3,138,960,000
299
$4,586,264,000
Total
330
$18,747,511,505
410
$12,616,676,168
341
$3,726,683,000
413
$5,389,504,000
6M 2015
2014 Full Year
2013
2012
6M 2015
2014 Full Year
2013
2012
Specialty sectors:
Education
Local Government/Municipal
Healthcare
Public-Private Partnerships/Development
Housing |
 Accomplished U.S. Equity Underwriting Franchise – All Equity Transactions Investment Banking Bookrun Equity Deals Since 2010 All Managed Equity Deals Since 2010 26 Source: Dealogic. Rank eligible SEC registered IPOs and Follow-On offerings since 2010. Includes
demutualizations. As of 7/31/15. Overlapping deals between Stifel and its acquired firms have been removed. Note: $ Volume represents full credit to underwriter for All Managed Equity Deals and apportioned credit to
bookrunner for Bookrun Equity Deals. Bold font indicates middle-market firms. ($ in billions) # of $ Rank Firm Deals Volume 1 Bank of America Merrill Lynch 1,293 $722.5 2 JPMorgan 1,266 $722.6 3 Citi 1,176 $720.2 4 Morgan Stanley 1,148 $703.7 5 Barclays 1,062 $609.7 6 Credit Suisse 1,026 $597.5 7 Wells Fargo 1,018 $537.3 8 Deutsche Bank 979 $586.7 9 Stifel/KBW 956 $345.3 10 Goldman Sachs 937 $619.4 11 RBC Capital Markets 916 $438.3 12 UBS 739 $414.6 13 Raymond James 670 $325.6 14 Jefferies 528 $127.0 15 Robert W Baird 509 $142.8 16 Piper Jaffray 506 $204.4 17 JMP Securities 458 $85.5 18 Oppenheimer 441 $112.6 19 Cowen & Co 423 $82.6 20 William Blair & Co 402 $106.4 ($ in billions) # of $ Rank Firm Deals Volume 1 Bank of America Merrill Lynch 1,192 $136.9 2 JPMorgan 1,139 $145.8 3 Morgan Stanley 1,060 $152.6 4 Citi 1,043 $140.5 5 Barclays 896 $121.5 6 Goldman Sachs 855 $135.9 7 Credit Suisse 850 $107.2 8 Deutsche Bank 789 $89.3 9 Wells Fargo 720 $55.6 10 UBS 534 $52.6 11 RBC Capital Markets 440 $32.2 12 Jefferies 432 $23.8 13 Stifel/KBW 322 $15.9 14 Raymond James 210 $10.1 15 Piper Jaffray 199 $8.1 16 Cowen & Co 193 $6.8 17 Leerink Partners 143 $6.2 18 Roth Capital Partners 126 $2.3 19 Robert W Baird 126 $5.1 20 BMO Capital Markets 102 $6.0 |
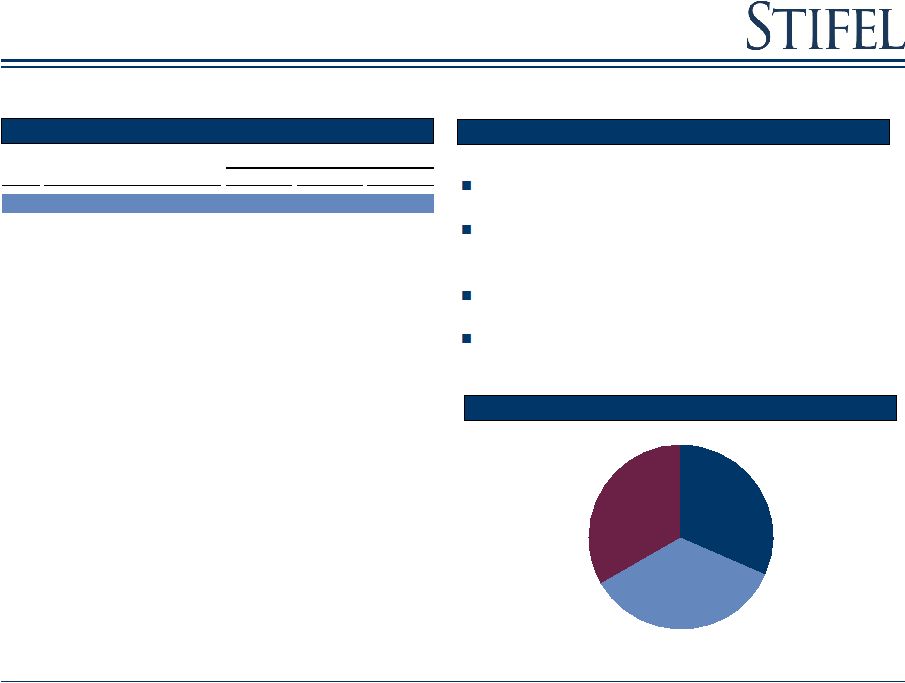 27 Companies Under Coverage Rank Firm Overall Mid Cap Small Cap 1 Stifel/KBW 1388 488 438 2 BofA Merrill Lynch 1139 438 155 3 JPMorgan 1074 380 149 4 Goldman Sachs 1024 362 68 5 Wells Fargo 990 377 173 6 Raymond James 977 368 273 7 Morgan Stanley 961 312 114 8 RBC Capital Markets 959 337 154 9 Barclays 936 298 115 10 Jefferies 933 310 194 11 Credit Suisse 925 282 166 12 Deutsche Bank 918 297 125 13 Citi 813 268 106 14 UBS 791 225 90 15 Robert W. Baird & Co 697 245 149 16 Cowen 672 213 182 17 Piper Jaffray 641 215 200 18 Morningstar 601 117 22 19 William Blair & Co 600 214 163 20 Keybanc 573 269 116 U.S. Equity Research Coverage (1) Coverage Balanced Across All Market Caps (1) Institutional Group – Research Stifel Research Highlights 27 Largest U.S. Equity Research Platform Largest provider of U.S. Equity Research Third largest provider of global small cap coverage 130 analysts globally across 12 sectors Largest provider of Financial Services coverage Small Cap 32% Mid Cap 35% Large Cap 33% (1) Source: StarMine rankings as of 7/31/15. Does not include Closed End Funds. Small Cap includes market
caps less than $1 billion; Mid Cap includes market caps less
than $5 billion. U.S. coverage distribution.
Note: Bold font indicates middle-market
firms. |
 Financial Overview |
 Stifel Financial Results Six months ended June 30, 2015 29 ($ in thousands, except per share amounts) Non-GAAP Adjustments GAAP 6/30/14 % Change Total revenues 1,181,850 $ - $
1,181,850 $ 1,127,890 $ 4.8% Interest expense 20,405 2,712 23,117 17,991 13.4% Net revenues 1,161,445 (2,712) 1,158,733 1,109,899 4.6% Compensation and benefits 722,640 43,051 765,691 698,459 3.5% Non-comp operating expenses 265,201 19,704 284,905 245,739 7.9% Total non-interest expenses 987,841 62,755 1,050,596 944,198 4.6% Income before income taxes 173,604 (65,467) 108,137 165,701 4.8% Provision for income taxes 68,573 (24,421) 44,152 64,973 5.5% Net income 105,031 $ (41,046) $ 63,985 $ 100,728 $ 4.3% Earnings per diluted common share 1.35 $
(0.53) $
0.82 $
1.33 $
1.5% Weighted average number of shares outstanding: Diluted 77,624 75,665 2.6% Ratios to net revenues: Compensation and benefits 62.2% 66.1% 62.9% Non-comp operating expenses 22.9% 24.6% 22.2% Income before income taxes 14.9% 9.3% 14.9% Six Months Ended June 30, 2015 Six Months Ended (1) (2) (1) Adjustments consist primarily of acquisition related expenses, which management believes are duplicative and will be eliminated, stock-based compensation and other expenses which in managements view are not representative of ongoing business. (2) Results presented for the six months ended June 30, 2014 are non-GAAP. |
 30 Sources of Revenues ($ in thousands) 6/30/15 6/30/14 % Change 3/31/15 % Change 6/30/15 6/30/14 % Change Commissions 183,770 $ 164,371 $ 11.8% 180,302 $ 1.9% 364,073 $ 336,614 $ 8.2% Principal transactions 85,543 110,717 (22.7%) 100,205 (14.6%) 186,275 221,399 (15.9%) Brokerage revenues 269,313 275,088 (2.1%) 280,507 (4.0%) 550,348 558,013 (1.4%) Capital raising 97,368 84,459 15.3% 75,646 28.7% 172,485 160,948 7.2% Advisory 63,639 60,356 5.4% 49,443 28.7% 113,083 119,129 (5.1%) Investment banking 161,007 144,815 11.2% 125,089 28.7% 285,568 280,077 2.0% Asset mgt and service fees 119,936 94,230 27.3% 113,869 5.3% 233,805 183,401 27.5% Other 13,742 8,745 57.1% 11,800 16.5% 25,541 13,983 82.7% Total operating revenues 563,998 522,878 7.9% 531,265 6.2% 1,095,262 1,035,474 5.8% Interest revenue 43,851 46,115 (4.9%) 42,736 2.6% 86,588 88,950 (2.7%) Total revenues 607,849 568,993 6.8% 574,001 5.9% 1,181,850 1,124,424 5.1% Interest expense 10,098 8,888 13.6% 13,019 (22.4%) 23,117 17,562 31.6% Net revenues 597,751 $ 560,105 $ 6.7% 560,982 $ 6.6% 1,158,733 $ 1,106,862 $ 4.7% Three Months Ended Six Months Ended |
 31 Brokerage & Investment Banking Revenues ($ in thousands) 6/30/15 6/30/14 % Change 3/31/15 % Change 6/30/15 6/30/14 % Change Global Wealth Management 158,803 $ 160,540 $ (1.1%) 157,995 $ 0.5% 317,024 $ 320,840 $ (1.2%) Institutional Group Equity brokerage 58,551 60,865 (3.8%) 61,803 (5.3%) 120,548 125,439 (3.9%) Fixed income brokerage 51,959 53,683 (3.2%) 60,708 (14.4%) 112,777 111,734 0.9% Total Institutional Group 110,510 114,548 (3.5%) 122,511 (9.8%) 233,325 237,173 (1.6%) Total brokerage revenues 269,313 275,088 (2.1%) 280,506 (4.0%) 550,349 558,013 (1.4%) Investment Banking: Capital raising Equity 55,423 65,751 (15.7%) 48,931 13.3% 104,354 126,180 (17.3%) Fixed income 41,945 18,708 124.2% 26,715 57.0% 68,132 34,768 96.0% Total capital raising 97,368 84,459 15.3% 75,646 28.7% 172,486 160,948 7.2% Advisory fees 63,639 60,356 5.4% 49,443 28.7% 113,082 119,129 (5.1%) Total Investment banking 161,007 144,815 11.2% 125,089 28.7% 285,568 280,077 2.0% Three Months Ended Six Months Ended |
 Non-GAAP Non-Interest Expenses 32 Six months ended June 30, 2015 ($ in thousands) 6/30/15 (1) 6/30/14 % Change 6/30/15 (1) 6/30/14 Net revenues 1,161,445 $ 1,109,899 $ 4.6% 100.0% 100.0% Compensation and benefits 674,693 649,633 3.9% 58.1% 58.6% Transitional pay (2) 47,947 48,826 (1.8%) 4.1% 4.4% Total compensation and benefits 722,640 698,459 3.5% 62.2% 62.9% Occupancy and equipment rental 89,072 80,582 10.5% 7.7% 7.3% Communication and office supplies 58,861 50,501 16.6% 5.1% 4.6% Commissions and floor brokerage 18,351 18,277 0.4% 1.6% 1.6% Other operating expenses 98,917 96,379 2.6% 8.5% 8.8% Total non-comp operating expenses 265,201 245,739 7.9% 22.8% 22.1% Total non-interest expense 987,841 944,198 4.6% 85.1% 85.1% Income before income taxes 173,604 165,701 4.8% 14.9% 14.9% Provision for income taxes 68,573 64,973 5.5% 5.9% 5.9% Non-GAAP net income 105,031 $ 100,728 $ 4.3% 9.0% 9.1% Non-GAAP expenses (after-tax) (41,046) (9,745) GAAP net income
63,985 $ 90,983 $ Six Months Ended % of Net revenues (1) Excludes adjustments for duplicative items associated with the integration of acquired businesses (merger-related
expenses). (2)
Transition pay includes amortization of retention awards, signing bonuses, and
upfront notes. |
 Non-GAAP Segment Comparison 33 Three and six months ended June 30, 2015 (1) Excludes the other segment. ($ in thousands) 6/30/15 6/30/14 % Change 3/31/15 % Change 6/30/15 6/30/14 % Change Net revenues: Global Wealth Management 343,382 $ 307,247 $ 11.8% 329,410 $ 4.2% 672,792 $ 604,430 $ 11.3% Institutional Group 258,538 255,669 1.1% 238,607 8.4% 497,145 505,647 (1.7%) Other (4,169) (1,462) (185.2%) (4,323) (3.6%) (8,492) (178) nm 597,751 $ 561,454 $ 6.5% 563,694 $ 6.0% 1,161,445 $ 1,109,899 $ 4.6% Operating contribution: Global Wealth Management 93,976 $ 89,098 $ 5.5% 98,847 $ (4.9%) 192,823 $ 168,774 $ 14.2% Institutional Group 41,942 42,312 (0.9%) 32,331 29.7% 74,273 87,222 (14.8%) Other (43,123) (49,583) 13.0% (50,369) 14.4% (93,492) (90,295) (3.5%) 92,795 $ 81,827 $ 13.4% 80,809 $ 14.8% 173,604 $ 165,701 $ 4.8% Operating contribution Global Wealth Management 27.4 29.0 30.0 28.7 27.9 Institutional Group 16.2 16.5 13.6 14.9 17.2 15.5 14.6 14.3 14.9 14.9 As a percentage of net revenues: (1) Three Months Ended Six Months Ended |
 Global Wealth Management 34 ($ in thousands) 6/30/15 6/30/14 % Change 3/31/15 % Change 6/30/15 6/30/14 % Change Commissions 125,121 $ 112,205 $ 11.5% 116,214 $ 7.7% 241,335 $ 225,202 $ 7.2% Principal transactions 33,682 48,335 (30.3%) 41,781 (19.4%) 75,689 95,638 (20.9%) Asset management & service fees 119,734 94,187 27.1% 113,666 5.3% 233,400 183,317 27.3% Net interest 37,454 35,839 4.4% 37,924 (1.2%) 75,378 71,101 6.0% Investment banking 15,128 11,132 35.9% 10,326 46.5% 25,228 22,263 13.3% Other income 12,263 5,549 121.0% 9,499 29.0% 21,762 6,909 215.0% Net revenues 343,382 307,247 11.8% 329,410 4.2% 672,792 604,430 11.3% Compensation and benefits 196,234 171,724 14.3% 183,243 7.1% 379,477 345,892 9.7% Non-comp operating expenses 53,173 46,425 14.5% 47,320 12.4% 100,492 89,764 12.0% Total non-interest expenses 249,407 218,149 14.3% 230,563 8.2% 479,969 435,656 10.2% Income before income taxes 93,975 $ 89,098 $ 5.5% 98,847 $ (4.9%) 192,823 $ 168,774 $ 14.2% Ratios to net revenues : Compensation and benefits 57.1% 55.9% 55.6% 56.4% 57.2% Non-comp operating expenses 15.5% 15.1% 14.4% 14.9% 14.9% Income before income taxes 27.4% 29.0% 30.0% 28.7% 27.9% Three Months Ended Six Months Ended |
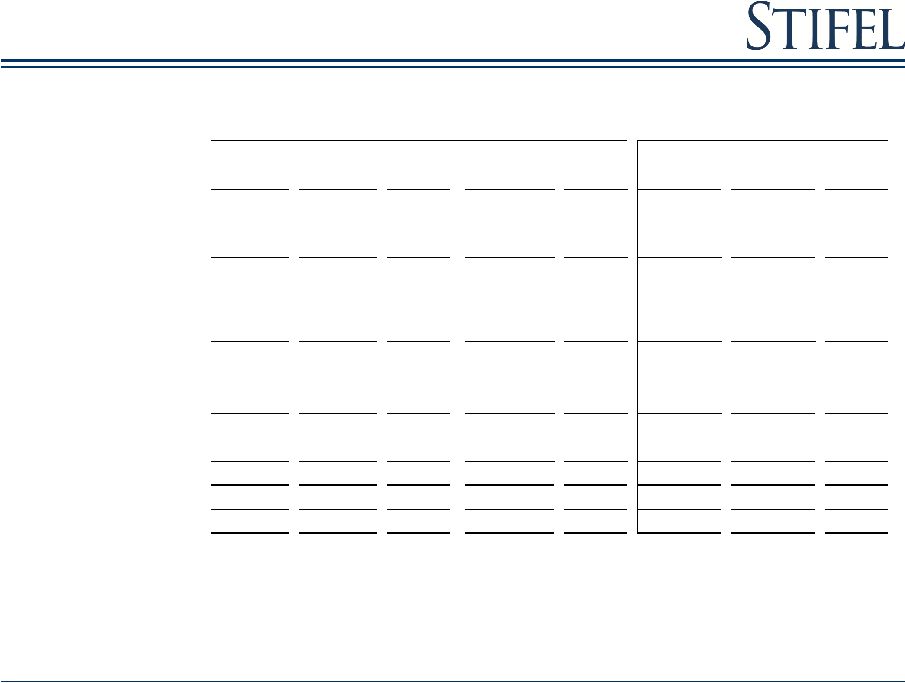
 Stifel Bank & Trust An Operating Unit of GWM 35 Actual ($) Yield (%) Actual ($) Yield (%) Actual ($) Yield (%) Q215 v Q214 Q215 v Q115 Assets Cash 116,387 0.19 132,843 0.37 48,131 0.24 (12.4) 141.8
Investment
securities 1,907,282
2.26 2,915,236 2.47 2,599,854 2.24 (34.6) (26.6)
Bank
loans 2,626,508
3.11 1,893,330 3.38 2,505,007 3.14 38.7 4.9
Total interest earning assets 4,650,177 2.68 4,941,409 2.73 5,152,992 2.67 (5.9) (9.8)
Other assets (non-interest earning)
136,070 98,147 136,357 38.6 (0.2)
Total assets 4,786,248 5,039,556 5,289,349 (5.0) (9.5)
Liabilities Deposits 4,313,940 0.17 4,654,937 0.14 4,834,042 0.18 (7.3) (10.8)
Other liabilities
(non-interest bearing) 58,553
41,574 59,938 40.8 (2.3)
Total liabilites
4,372,493 4,696,511 4,893,980 (6.9) (10.7)
Net interest
margin 2.52
2.59
2.46
Allowance for loan losses
23,923 17,104 22,567 $
39.9 6.0
Allowance as a percentage of loans 0.98 % 0.97 %
0.96 % Non-performing assets as a percentage of total assets 0.13 % 0.10 %
0.13 % % Change As of 6/30/15 As of 6/30/14 As of 3/31/15 Note: Actual amounts presented above are as of period-end and yields are based off of quarter-to-date
averages. (1)
Investment securities includes available-for-sale and
held-to-maturity securities. (2)
Includes loans held for sale.
(1) (2) |
 Institutional Group 36 ($ in thousands) 6/30/15 6/30/14 % Change 3/31/15 % Change 6/30/15 6/30/14 % Change Net revenues 258,538 $ 255,670 $ 1.1% 238,607 $ 8.4% 497,145 $ 505,647 $ (1.7%) Compensation and benefits 160,077 157,500 1.6% 149,411 7.1% 309,488 311,734 (0.7%) Non-comp operating expenses 56,519 55,858 1.2% 56,865 (0.6%) 113,384 106,691 6.3% Total non-interest expenses 216,596 213,358 1.5% 206,276 5.0% 422,872 418,425 1.1% Income before income taxes 41,942 $ 42,312 $ (0.9%) 32,331 $ 29.7% 74,273 $ 87,222 $ (14.8%) Ratios to net revenues : Compensation and benefits 61.9% 61.6% 62.6% 62.3% 61.7% Non-comp operating expenses 21.9% 21.9% 23.8% 22.8% 21.1% Income before income taxes 16.2% 16.5% 13.6% 14.9% 17.2% Three Months Ended Six Months Ended |
 As of June 30, 2015 Capital Structure 37 As of ($ in thousands) 6/30/15 6/30/14 3/31/15 Total Assets 10,139,542 $ 9,575,012 $ 9,373,137 $ Stockholders' Equity 2,520,251 2,173,191 2,363,244 4.250% senior notes, due 2024 300,000 $ - $ 300,000 $ 5.375% senior notes, due 2022 150,000 150,000 150,000 6.70% senior notes, due 2022 - 175,000 - Debentures to Stifel Financial Capital Trusts II, III, & IV
82,500 82,500 82,500 Total Capitalization 3,052,751 $ 2,580,691 $ 2,895,744 $ Ratios: Debt to Equity (1) 21.1% 18.8% 22.5% Tier 1 Leverage Ratio 18.3% 15.4% 17.5% Tier 1 Risk Based Capital Ratio 29.4% 25.5% 29.9% As of (1) Debt to equity ratio includes the debentures to Stifel Financial Capital Trusts and Senior Notes divided by stockholders’equity. |
 Other Financial Data 38 As of 6/30/15 6/30/14 % Change 3/31/15 % Change Total assets (000s): Stifel Nicolaus & Stifel Financial 5,353,294 $ 4,535,016 $ 18.0% 4,083,788 $ 31.1% Stifel Bank 4,786,248 5,039,996 (5.0%) 5,289,349 (9.5%) Total assets 10,139,542 9,575,012 $ 5.9% 9,373,137 8.2% Total shareholders' equity (000s): Stifel Nicolaus & Stifel Financial 2,106,497 $ 1,829,706 $ 15.1% 1,967,874 $ 7.0% Stifel Bank 413,754 343,485 20.5% 395,370 4.6% Total shareholders' equity 2,520,251 2,173,191 $ 16.0% 2,363,244 6.6% Leverage ratio: Stifel Nicolaus & Stifel Financial 2.0 2.0
(0.9%) 1.6 24.3%
Stifel Bank
11.6 14.7
(21.2%)
13.4 (13.5%) Total leverage ratio 3.3 3.7
(11.2%) 3.2 2.7%
Book value per share
36.35 $
33.18 $
9.6% 34.83 $
4.4% Financial advisors 2,823 2,085 35.4% 2,097 34.6% Full-time associates 6,952 5,881 18.2% 6,274 10.8% Locations 398 361
10.2%
368 8.2%
As of (1) Includes 736, 140, and 134 independent contractors as of June 30, 2015, June 30, 2014, and March 31, 2015, respectively.
|
 Non-GAAP Deal Integration Expenses 39 ($ in thousands) Actual Estimate 9/30/15 12/31/15 3/31/16 6/30/16 Existing acquisitions Sterne Agee - Stock-based compensation 22,837 32,000 4,000 Duplicative operating expenses: Acacia Federal Savings Bank - - - - - - De La Rosa & Co., Inc. 9 120 120 - - - Keefe, Bruyette & Woods, Inc. - - - - - - Knight Fixed Income 2,443 2,600 2,600 2,600 2,600 - 1919 Investment Counsel 661 300 200 200 - - Miller Buckfire & Co., LLC 1,133 1,400 - - - - Oriel Securities Holding Limited 1,242 1,000 500 - - - Ziegler Capital Management - - - - - - Merchant Capital 217 - - - - - Sterne Agee 23,834 20,000 20,000 15,000 12,000 8,000 Barclays 398 - - - - - Debt issuance cost write-off - - - - - - Intangible amortization 1,950 2,200 2,200 2,200 2,200 2,200 31,887 27,620 - - - - Total Deal Costs (pre-tax) 54,724 59,620 29,620 20,000 16,800 10,200 Total Deal Costs (after-tax) (1) 34,203 $ 35,772 $ 17,772 $ 12,000 $ 10,080 $ 6,120 $ Three months ended Estimate 6/30/15 (1) Assumes an effective income tax rate of 40.0%. |