Attached files
| file | filename |
|---|---|
| 8-K - CHINA FUND INC | fp0016095_8k.htm |

Data as of 8/31/15
Manager's Commentary
Market Review
August was a turbulent month for the Chinese equity markets. The Shanghai Composite index lost 12.5% (in local terms) and 14.9% (in USD terms). The market rose during the first two weeks of the month but declined sharply during the latter half of the month, culminating in successive 8.5% and 7.6% day-drops towards the end of the month. The rout, known as 'Black Monday', triggered heavy sell offs around the globe. The Chinese government's inconsistent communication around its level of market support perpetuated the panicked sell-off, as investors became increasingly insecure over the intervention plan. For example, on August 11, the People's Bank of China (PBoC) unexpectedly devalued the Renminbi (RMB) daily reference rate by 1.9%. This went against market expectations of a widening floating band. The devaluation triggered speculation of a currency war, and the PBoC issued a statement that confirmed the cut was a one-time adjustment to more closely align the RMB with market forces.
On a monetary basis, the PBoC cut the interest rate on August 25 by 25 basis points to 4.6% and the Reserve Requirement Ratio by 50 basis points to 18.0%, the latter to be effective in early September. We believe that these moves were primarily designed to shore up confidence in the economy, by increasing corporate access to funding and reducing financing costs, rather than to support the equity market directly. The macro data from China was concerning and indicated a slowdown in the economy. The official Purchasing Managers' Index ticked down to 49.7 in August from 50.0 in July.
This negative market sentiment also affected the Hong Kong equity markets, however not to the same level of volatility. Overall, the Hang Seng Index fell by 12.0% in USD terms, however the index declined steadily over the month. With respect to sectors, the financial and real estate sectors were the most negative, however in terms of individual stocks, consumer names were hit the hardest. Of the three markets, The Taiwan Stock Exchange Weighted Index was least affected, falling 5.7% in local terms (8.1% in USD terms). Deteriorating economic conditions continued with soft foreign and domestic demand being blamed for declining output and price levels. Employment levels have continued to increase, but at a slower pace.
Fund Review
The volatile Chinese equity market meant August was a difficult month for the Fund. Portfolio activity was limited during the month and our key positions remain the same. Our focus remains on companies which we believe will deliver sustained growth, either because of supportive macro factors, such as the ongoing development of the services sector, or because of favorable government policy.
With the volatility in the Chinese market, the Chinese names within the portfolio have been the largest detractors. Beijing Enterprise Holdings, a diversified company whose main services include natural gas distribution, water supply and waste water services, was one of our top detractors. This stock price struggled and fell with the broader China market, but its fundamentals remain positive and its latest revenue announcement beat market expectations, driven mainly by high gas volume growth. This name remains our top pick in the utilities and alternative energy space. We look for companies with good fundamentals in order to weather short-term volatility like we have seen this month.
Key Transactions
Our key positioning remains largely unchanged. The key transaction for August was the initiation of a position in CK Hutchinson Holdings. After the restructuring of Hutchinson and CK Holdings in June, our view is that shareholder interests are aligned and CK Hutchinson shares should continue to re-rate. The blue-chip position should also help stabilize the portfolio under the current market volatility.
Outlook
While most investors continue to remain fearful of Greater China equities, we believe that the recent market corrections in China do not represent a rapid economic deterioration of its economy, just like the sharp rally in the first half of 2015 had nothing to do with an economic boom. We believe that China / Hong Kong stock markets tend to overshoot and undershoot the fundamentals of the corporates; and therefore provide us with opportunities to find stocks with attractive valuations.
Admittedly, China is clearly going through a weak economic period. The recent rate cut is an attempt to stabilize the situation and there is likely more to come. The ongoing deceleration in economic growth will inevitably translate into profit pressure for certain sectors, particularly the cyclical and macro-sensitive industries such as materials, traditional energy and banking. In contrast, we believe there are good reasons to be more optimistic about the potential for sustainable growth in a number of other sectors, such as consumer companies that are underpinned by a strong job market and wage growth. We also like 'Policy winners', including railway related stocks and new energy companies in China. In Taiwan, we continue to focus on picking stocks that are less sensitive to the China slowdown, for example, exporters with a diversified international client base.
We believe the current valuation is on the low end. The MSCI China Index is now trading at 1.3x PB, which is a historical low. Comparing this to the 10 year average of 2.2x and 10 year high at 5.3x, we believe it is a matter of time before we see a rebound in the market. Of course, with the current market volatility, it is difficult to predict how the market will move in the near term. We do however believe the current market offers an attractive entry point for long term investors.
In Brief
|
Fund Data
|
|
|
Description
|
Seeks to achieve longterm capital appreciation through investments in China companies.
|
|
Listing Date (NYSE)
|
July 10, 1992
|
|
Total Fund Assets (millions)
|
$294.6
|
|
Median Market Cap (in billions)
|
$5.9
|
|
Distribution Frequency
|
Annual
|
|
Management Firm
|
Allianz Global Investors U.S. LLC
|
|
Portfolio Management
|
Christina Chung, CFA Lead Portfolio Manager
|
|
Performance (US$ Returns)
(as of 8/31/15)
|
||
|
Fund
|
Benchmark1
|
|
|
One Month
|
-10.35%
|
-10.94%
|
|
Three Month
|
-25.88%
|
-21.33%
|
|
One Year
|
-8.86%
|
-10.71%
|
|
Three Year
|
8.50%
|
6.97%
|
|
Net Asset Value / Market Price
|
|
|
Net Asset Value (NAV) / Market Price at Inception
|
$13.15 / $14.26
|
|
NAV / Market Price (as of 8/31/15)
|
$18.79 / $15.81
|
|
High / Low Ranges (52-Week)
|
|
|
High / Low NAV
|
$26.04 / $17.64
|
|
High / Low Market Price
|
$22.46 / $14.64
|
|
Premium/Discount to NAV (as of 8/31/15)
|
-15.86%
|
|
Fund Data (Common Shares)
|
|
|
Shares Outstanding
|
15,682,028
|
|
Average Daily Volume
|
52,285
|
|
Expense Ratio
|
1.30%
|
Fund Manager

Christina Chung, CFA
Lead Portfolio
Manager
|
1
|
MSCI Golden Dragon Index.
|

The China Fund, Inc.
Investment Objective
The investment objective of the Fund is to achieve long-term capital appreciation. The Fund seeks to achieve its objective through investment in the equity securities of companies and other entities with significant assets, investments, production activities, trading or other business interests in China or which derive a significant part of their revenue from China.
The Fund has an operating policy that the Fund will invest at least 80% of its assets in China companies. For this purpose, 'China companies' are (i) companies for which the principal securities trading market is in China; (ii) companies for which the principal securities trading market is outside of China or in companies organized outside of China, that in both cases derive at least 50% of their revenues from goods or services sold or produced, or have a least 50% of their assets in China; or (iii) companies organized in China. Under the policy, China means the People's Republic of China, including Hong Kong, and Taiwan. The Fund will provide its stockholders with at least 60 days' prior notice of any change to this policy.
|
Average Annual Returns
|
||||||||
|
1 Month
|
3 Month
|
YTD
|
1 Year
|
3 Year
|
5 Year
|
10 Year Inception
|
||
|
NAV
|
-10.35%
|
-25.88%
|
-9.10%
|
-8.86%
|
8.50%
|
3.37%
|
13.31%
|
10.16%
|
|
Market Price
|
-10.93%
|
-26.94%
|
-13.27%
|
-14.29%
|
6.08%
|
1.39%
|
11.16%
|
8.96%
|
|
MSCI Golden Dragon Index
|
-10.94%
|
-21.33%
|
-8.48%
|
-10.71%
|
6.97%
|
4.55%
|
7.56%
|
—
|
|
Calendar Year Returns
|
||||||||
|
2007
|
2008
|
2009
|
2010
|
2011
|
2012
|
2013
|
2014
|
|
|
NAV
|
86.20%
|
-46.95%
|
72.83%
|
27.26%
|
-24.37%
|
12.12%
|
18.31%
|
7.82%
|
|
Market Price
|
50.24%
|
-40.65%
|
72.19%
|
23.60%
|
-27.51%
|
20.52%
|
12.70%
|
5.29%
|
|
MSCI Golden Dragon Index
|
37.97%
|
-49.37%
|
67.12%
|
13.60%
|
-18.35%
|
22.65%
|
7.25%
|
8.06%
|
Past performance is not a guide to future returns.
Returns are annualized, except for periods of less than one year.
Source: State Street Bank and Trust Company. Source for index data: MSCI as at August 31, 2015. Investment returns are historical and do not guarantee future results. Investment returns reflect changes in net asset value and market price per share during each period and assumes that dividends and capital gains distributions, if any, were reinvested. The net asset value (NAV) percentages are not an indication of the performance of a shareholder's investment in the Fund, which is based on market price. NAV performance includes the deduction of management fees and other expenses. Market price performance does not include the deduction of brokerage commissions and other expenses of trading shares and would be lower had such commissions and expenses been deducted. It is not possible to invest directly in an index.
Premium Discount

|
Sector Allocation
|
||
|
Fund
|
Benchmark1
|
|
|
Financials
|
31.17%
|
39.79%
|
|
Information Technology
|
26.65%
|
22.01%
|
|
Industrials
|
12.78%
|
7.95%
|
|
Consumer Discretionary
|
9.69%
|
5.47%
|
|
Consumer Staples
|
7.20%
|
2.97%
|
|
Telecom Services
|
4.57%
|
7.47%
|
|
Health Care
|
2.89%
|
1.15%
|
|
Materials
|
0.47%
|
3.33%
|
|
Utilities
|
0.00%
|
5.28%
|
|
Energy
|
0.00%
|
4.58%
|
|
Other assets & liabilities
|
4.57%
|
0.00%
|
Source: IDS GmbH - Analysis and Reporting Services, a subsidiary of Allianz SE.
|
Country Allocation
|
||
|
Fund
|
Benchmark1
|
|
|
China
|
73.49%
|
73.09%
|
|
Hong Kong Red Chips
|
19.43%
|
13.50%
|
|
Hong Kong 'H' shares
|
20.61%
|
26.36%
|
|
Equity linked securities ('A' shares)
|
5.06%
|
0.00%
|
|
China 'A' & 'B' shares
|
0.00%
|
0.14%
|
|
Other Hong Kong securities
|
28.39%
|
33.08%
|
|
Taiwan
|
21.88%
|
26.91%
|
|
Other assets & liabilities
|
4.63%
|
0.00%
|
|
Top 10 Holdings
|
|
|
PING AN INSURANCE (China)
|
5.99%
|
|
ICBC LTD (China)
|
5.88%
|
|
TAIWAN SEMIC CO LTD (Taiwan)
|
4.80%
|
|
CHINA MOBILE LTD (China)
|
4.65%
|
|
TENCENT HOLDINGS LTD (China)
|
4.38%
|
|
HONG KONG EXCHANGES AND CLEARING LTD (H.K.)
|
3.97%
|
|
QINGLING MOTORS CO LTD (China)
|
3.20%
|
|
DELTA ELECTRONICS INC (Taiwan)
|
3.13%
|
|
WANT WANT CHINA HOLDINGS LTD (China)
|
3.08%
|
|
CHINA MERCHANTS BANK CO LTD (China)
|
3.04%
|
|
Portfolio Characteristics
|
||
|
Fund
|
Benchmark1
|
|
|
P/E Ratio
|
11.44
|
10.76
|
|
P/B Ratio
|
1.61
|
1.28
|
|
Issues in Portfolio
|
43
|
279
|
|
Foreign Holdings (%)
|
95.43
|
100.00
|
|
Other assets & liabilities (%)
|
4.57
|
0.00
|
|
Yield (%)
|
3.12
|
3.47
|
|
1.
|
MSCI Golden Dragon Index.
|
The China Fund, Inc.
|
Distribution History (10 Year)
|
|||||||
|
Declaration Date
|
Ex-dividend Date
|
Record Date
|
Payable Date
|
Distribution/
Share
|
Income
|
Long-term
Capital Gain
|
Short-term Capital Gain
|
|
12/9/05
|
12/19/05
|
12/21/05
|
12/29/05
|
$2.51190
|
$0.21720
|
$2.29470
|
—
|
|
12/8/06
|
12/19/06
|
12/21/06
|
12/29/06
|
$4.01170
|
$0.29960
|
$2.73090
|
$0.98120
|
|
12/7/07
|
12/19/07
|
12/21/07
|
1/25/08
|
$12.12000
|
$0.28000
|
$9.00000
|
$2.84000
|
|
12/8/08
|
12/22/08
|
12/24/08
|
1/23/09
|
$5.81740
|
$0.48130
|
$5.33610
|
—
|
|
12/9/09
|
12/22/09
|
12/24/09
|
12/29/09
|
$0.25570
|
$0.25570
|
—
|
—
|
|
12/8/10
|
12/21/10
|
12/24/10
|
12/29/10
|
$2.27420
|
$0.37460
|
$1.89960
|
—
|
|
12/8/11
|
12/21/11
|
12/23/11
|
12/29/11
|
$2.99640
|
$0.17420
|
$2.82220
|
—
|
|
12/10/12
|
12/20/12
|
12/24/12
|
12/28/12
|
$3.25170
|
$0.34730
|
$2.90440
|
—
|
|
12/13/13
|
12/19/13
|
12/23/13
|
12/27/13
|
$3.31400
|
$0.43870
|
$2.87530
|
—
|
|
12/8/14
|
12/18/14
|
12/22/14
|
1/5/15
|
$3.76510
|
$0.29820
|
$3.46690
|
—
|
Distribution/Share includes Income, Long-term Capital gains and Short-term Capital gains.
The China Fund NAV Performance of $10,000 since inception
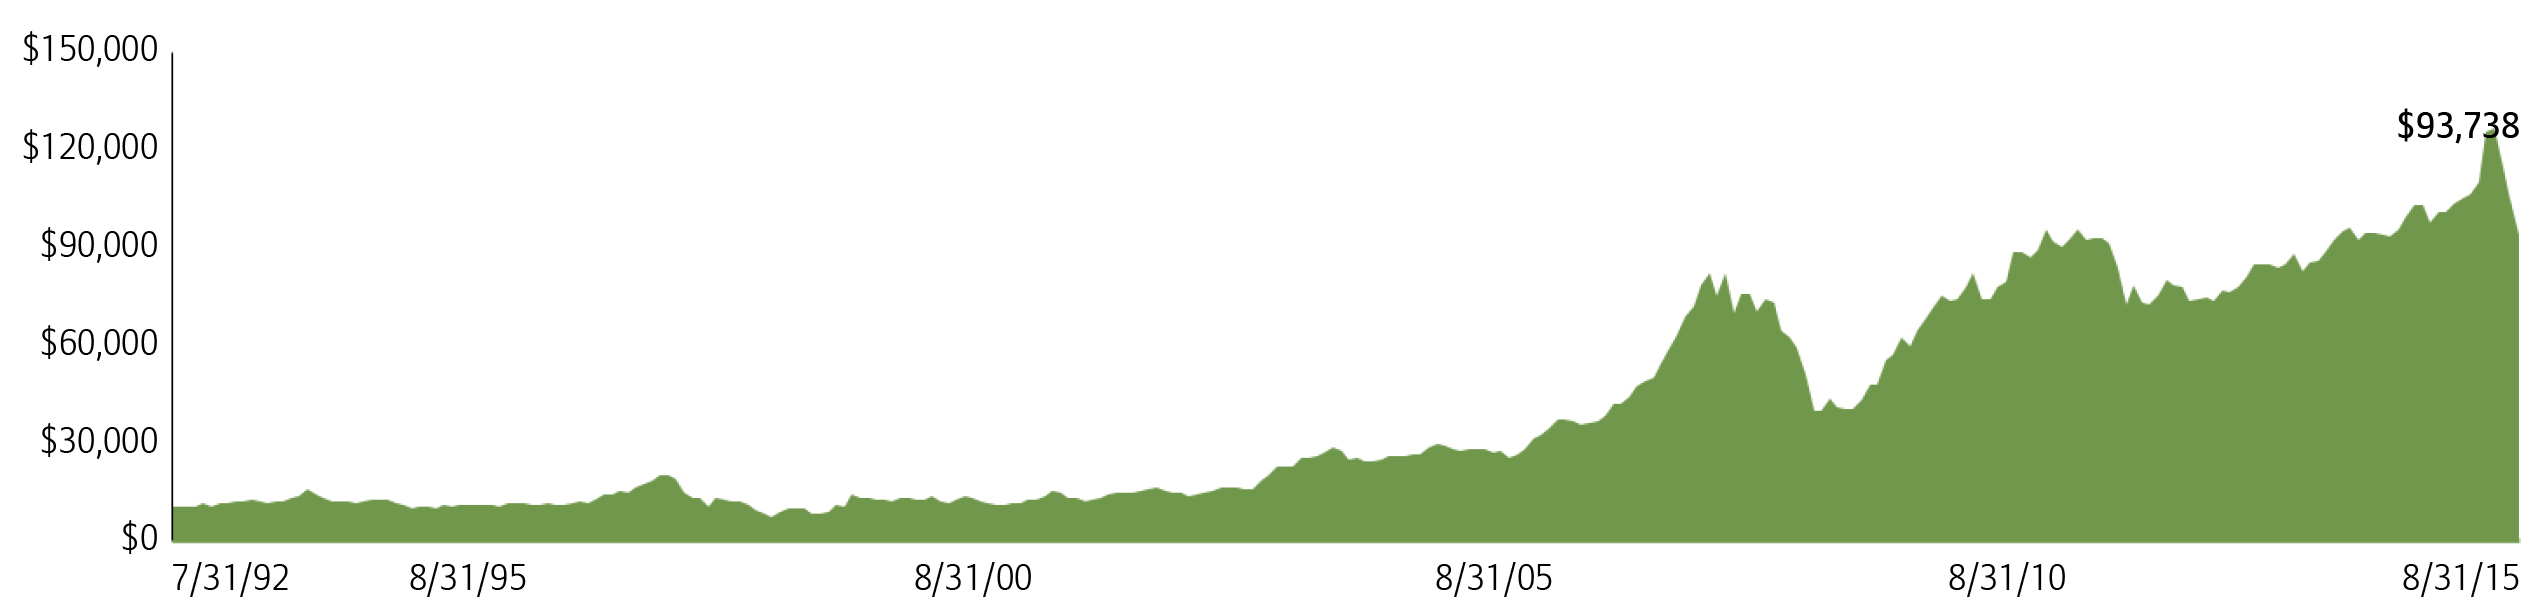
Past performance is not a guide to future returns.
Index Description
MSCI Golden Dragon Index
The MSCI Golden Dragon Index captures the equity market performance of large and mid cap China securities (H shares, B shares, Red-Chips and P-Chips) and non-domestic China securities listed in Hong Kong and Taiwan.
It is not possible to invest directly in an index.
The China Fund, Inc.
Portfolio in Full
|
Sector
|
Company
(exchange ticker)
|
Market Price
|
Holding
|
Value US$
|
% of net assets
|
|
Financials
|
31.17
|
||||
|
PING AN INSURANCE GROUP CO OF CHINA LTD
|
2318
|
37.95
|
3,594,000
|
17,598,893
|
5.99
|
|
INDUSTRIAL & COMMERCIAL BANK OF CHINA LTD
|
1398
|
4.58
|
29,244,000
|
17,282,149
|
5.88
|
|
HONG KONG EXCHANGES AND CLEARING LTD
|
388
|
182.40
|
495,300
|
11,657,050
|
3.97
|
|
CHINA MERCHANTS BANK CO LTD
|
3968
|
18.48
|
3,743,000
|
8,925,186
|
3.04
|
|
SUN HUNG KAI PROPERTIES LTD
|
16
|
98.10
|
688,000
|
8,708,692
|
2.96
|
|
CATHAY FINANCIAL HOLDING CO LTD
|
2882
|
46.90
|
5,305,000
|
7,647,053
|
2.60
|
|
FUBON FINANCIAL HOLDING CO LTD
|
2881
|
55.90
|
3,548,000
|
6,095,808
|
2.07
|
|
CHINA LIFE INSURANCE CO LTD
|
2628
|
26.75
|
1,612,000
|
5,563,964
|
1.89
|
|
CHINA OVERSEAS LAND & INVESTMENT LTD
|
688
|
22.70
|
1,610,000
|
4,715,712
|
1.60
|
|
HONGKONG LAND HOLDINGS LTD
|
H78
|
6.92
|
497,000
|
3,439,240
|
1.17
|
|
Information Technology
|
26.67
|
||||
|
TAIWAN SEMICONDUCTOR MANUFACTURING CO LTD
|
2330
|
129.00
|
3,562,000
|
14,122,756
|
4.80
|
|
TENCENT HOLDINGS LTD
|
700
|
131.80
|
757,500
|
12,882,304
|
4.38
|
|
DELTA ELECTRONICS INC
|
2308
|
163.00
|
1,835,000
|
9,193,048
|
3.13
|
|
DIGITAL CHINA HOLDINGS LTD
|
861
|
6.82
|
9,391,000
|
8,264,027
|
2.81
|
|
LARGAN PRECISION CO LTD
|
3008
|
3,020.00
|
88,000
|
8,168,183
|
2.78
|
|
ADVANTECH CO LTD
|
2395
|
207.00
|
1,203,841
|
7,659,057
|
2.61
|
|
HERMES MICROVISION INC
|
3658
|
1,380.00
|
170,000
|
7,210,475
|
2.45
|
|
SEMICONDUCTOR MANUFACTURING INTERNATIONAL CORP
|
981
|
0.68
|
37,480,000
|
3,288,547
|
1.12
|
|
GOLDPAC GROUP LTD
|
3315
|
4.19
|
5,521,000
|
2,984,883
|
1.02
|
|
BAIDU INC
|
BIDU
|
147.25
|
15,821
|
2,329,642
|
0.79
|
|
ASM PACIFIC TECHNOLOGY LTD
|
522
|
60.45
|
295,700
|
2,306,445
|
0.78
|
|
Industrials
|
12.81
|
||||
|
CHINA EVERBRIGHT INTERNATIONAL LTD
|
257
|
10.20
|
6,140,000
|
8,080,980
|
2.75
|
|
BEIJING ENTERPRISES HOLDINGS LTD
|
392
|
45.30
|
1,327,000
|
7,756,479
|
2.64
|
|
ZHUZHOU CSR TIMES ELECTRIC CO LTD
|
3898
|
51.50
|
732,000
|
4,864,227
|
1.65
|
|
CRRC CORP LTD
|
1766
|
9.10
|
3,697,000
|
4,340,966
|
1.48
|
|
QINGDAO PORT INTERNATIONAL CO LTD
|
6198
|
3.70
|
6,596,000
|
3,149,038
|
1.07
|
|
CK HUTCHISON HOLDINGS LTD
|
1
|
103.20
|
216,500
|
2,882,923
|
0.98
|
|
CN STATE CONSTRUCTION INTERNATIONAL HOLDINGS LTD
|
3311
|
10.36
|
2,110,000
|
2,820,575
|
0.96
|
|
HSBC BANK PLC (exch. for XJ ELECTRIC CO)
|
N/A
|
2.93
|
864,000
|
2,534,112
|
0.86
|
|
CITIGROUP GLOBAL MARKETS HOLD (exch. for XJ ELECTRIC CO)
|
N/A
|
2.93
|
419,748
|
1,229,862
|
0.42
|
|
Consumer Discretionary
|
9.69
|
||||
|
QINGLING MOTORS CO LTD
|
1122
|
2.52
|
28,960,000
|
9,416,610
|
3.20
|
|
LI & FUNG LTD
|
494
|
5.11
|
9,798,000
|
6,460,317
|
2.20
|
|
MERIDA INDUSTRY CO LTD
|
9914
|
177.00
|
805,000
|
4,379,303
|
1.49
|
|
CITIGROUP GLOBAL MARKETS HOLD (exch. for CHINA CYTS TOURS HOLDIN)
|
N/A
|
2.99
|
1,143,908
|
3,420,285
|
1.16
|
|
CLSA GLOBAL MARKETS PTE LTD (exch. for CHONG QING CHANGAN AUTO)
|
N/A
|
2.26
|
739,970
|
1,672,332
|
0.57
|
|
CITIGROUP GLOBAL MKTS HLDGS IN (exch. for CHONG QING CHANGAN AUTO)
|
N/A
|
2.26
|
558,897
|
1,263,107
|
0.43
|
|
WAR HSBC BANK PLC (exch. for CHONG QING CHANGAN AUTO)
|
N/A
|
2.26
|
487,000
|
1,102,568
|
0.38
|
|
ZHONGSHENG GROUP HOLDINGS LTD
|
881
|
3.25
|
1,844,500
|
773,495
|
0.26
|
|
Consumer Staples
|
7.22
|
||||
|
WANT WANT CHINA HOLDINGS LTD
|
151
|
6.27
|
11,207,000
|
9,066,766
|
3.08
|
|
NATURAL BEAUTY BIO-TECHNOLOGY LTD
|
157
|
0.66
|
50,320,000
|
4,285,288
|
1.46
|
|
HENGAN INTERNATIONAL GROUP CO LTD
|
1044
|
76.55
|
425,500
|
4,202,815
|
1.43
|
|
CITIGROUP GLOBAL MARKETS HOLD (exch. for SHANGHAI JAHWA UNITED)
|
N/A
|
5.35
|
371,242
|
1,986,145
|
0.68
|
|
CLSA GLOBAL MARKETS PTE LTD (exch. for SHANGHAI JAHWA UNITED)
|
N/A
|
5.34
|
315,651
|
1,686,523
|
0.57
|
|
Telecom Services
|
4.65
|
||||
|
CHINA MOBILE LTD
|
941
|
95.55
|
1,108,000
|
13,660,480
|
4.65
|
|
Health Care
|
2.90
|
||||
|
CSPC PHARMACEUTICAL GROUP LTD
|
1093
|
7.13
|
5,804,000
|
5,339,646
|
1.82
|
|
3SBIO INC
|
1530
|
7.79
|
3,175,500
|
3,191,869
|
1.09
|
The China Fund, Inc
Portfolio in Full
|
Sector
|
Company
(exchange ticker)
|
Market Price
|
Holding
|
Value US$
|
% of net assets
|
|
Materials
|
0.47
|
||||
|
TIANGONG INTERNATIONAL CO LTD
|
826
|
0.70
|
15,318,000
|
1,383,552
|
0.47
|
Source: State Street Bank and Trust Company, IDS GmbH - Analysis and Reporting Services, a subsidiary of Allianz SE.
Important Information:
Holdings are subject to change daily. The Fund seeks to achieve its objective through investment in the equity securities of companies and other entities with significant assets, investments, production activities, trading or other business interests in China or which derive a significant part of their revenue from China. Investing in non-U.S. securities entails additional risks, including political and economic risk and the risk of currency fluctuations, as well as lower liquidity. These risks, which can result in greater price volatility, will generally be enhanced in less diversified funds that concentrate investments in a particular geographic region.
The information contained herein has been obtained from sources believed to be reliable but Allianz Global Investors U.S. LLC and its affiliates do not warrant the information to be accurate, complete or reliable. The opinions expressed herein are subject to change at any time and without notice. Past performance is not indicative of future results. This material is not intended as an offer or solicitation for the purchase or sale of any financial instrument. Investors should consider the investment objectives, risks, charges and expenses of any mutual fund carefully before investing. This and other information is contained in the fund's annual and semiannual reports, proxy statement and other fund information, which may be obtained by contacting your financial advisor or visiting the fund's website at www.chinafundinc.com. This information is unaudited and is intended for informational purposes only. It is presented only to provide information on the Fund's holdings, performance and strategies. The Fund is a closed-end exchange traded management investment company. This material is presented only to provide information and is not intended for trading purposes. Closed-end funds, unlike open-end funds, are not continuously offered. After the initial public offering by a closed-end fund, its shares can be purchased and sold on the open market through a stock exchange, where shares may trade at a premium or a discount. The market price of holdings is subject to change daily.
P/E is a ratio of security price to earnings per share. Typically, an undervalued security is characterized by a low P/E ratio, while an overvalued security is characterized by a high P/E ratio. P/B is a ratio of the current stock price to the book value. This is used to identify undervalued stocks. Dividend yield is the annual percentage of return earned by an investor on a common or preferred stock. The average dividend yield is the dividend rate divided by current share price.
©2015 Allianz Global Investors Distributors LLC.
|
Investment Products: Not FDIC Insured | May Lose Value | Not Bank Guaranteed
|
FS-CHN-0815
|