Attached files
| file | filename |
|---|---|
| 8-K - 8-K - BASIC ENERGY SERVICES, INC. | bas-20150921x8k.htm |
 BAS_Logo 2008NYSE: BAS Investor Presentation September 2015 OUR LIFE’S WORK IS THE LIFE OF THE WELLTM
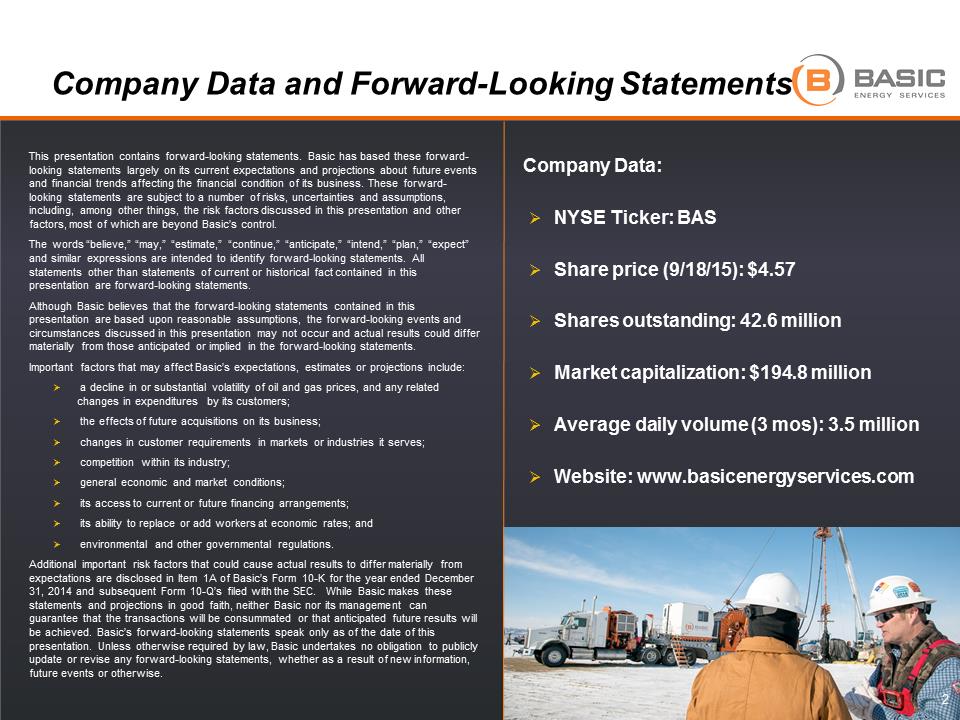 This presentation contains forward-looking statements. Basic has based these forward-looking statements largely on its current expectations and projections about future events and financial trends affecting the financial condition of its business. These forward-looking statements are subject to a number of risks, uncertainties and assumptions, including, among other things, the risk factors discussed in this presentation and other factors, most of which are beyond Basic’s control. The words “believe,” “may,” “estimate,” “continue,” “anticipate,” “intend,” “plan,” “expect” and similar expressions are intended to identify forward-looking statements. All statements other than statements of current or historical fact contained in this presentation are forward-looking statements. Although Basic believes that the forward-looking statements contained in this presentation are based upon reasonable assumptions, the forward-looking events and circumstances discussed in this presentation may not occur and actual results could differ materially from those anticipated or implied in the forward-looking statements. Important factors that may affect Basic’s expectations, estimates or projections include: . a decline in or substantial volatility of oil and gas prices, and any related changes in expenditures by its customers; . the effects of future acquisitions on its business; . changes in customer requirements in markets or industries it serves; . competition within its industry; . general economic and market conditions; . its access to current or future financing arrangements; . its ability to replace or add workers at economic rates; and . environmental and other governmental regulations. Additional important risk factors that could cause actual results to differ materially from expectations are disclosed in Item 1A of Basic’s Form 10-K for the year ended December 31, 2014 and subsequent Form 10-Q’s filed with the SEC. While Basic makes these statements and projections in good faith, neither Basic nor its management can guarantee that the transactions will be consummated or that anticipated future results will be achieved. Basic’s forward-looking statements speak only as of the date of this presentation. Unless otherwise required by law, Basic undertakes no obligation to publicly update or revise any forward-looking statements, whether as a result of new information, future events or otherwise. Company Data: .NYSE Ticker: BAS .Share price (9/18/15): $4.57 .Shares outstanding: 42.6 million .Market capitalization: $194.8 million .Average daily volume (3 mos): 3.5 million .Website: www.basicenergyservices.com2
 BAS_Logo 2008Proven Growth Strategy 3 .Basic Energy Services supports its customers’ well site activities from cradle to grave .Diversified service offering poised for future growth opportunities .The right fleet, the right people and operations in the right basins to support long-term shareholder returns Our Life’s Work is the Life of the WellTM
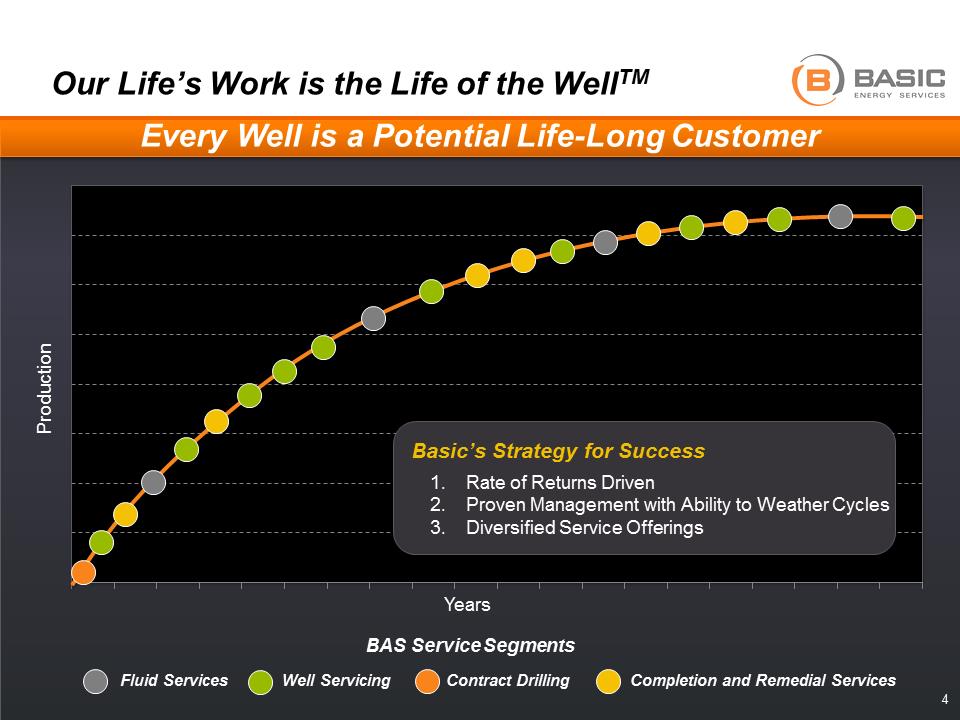 BAS_Logo 2008Years Production Our Life’s Work is the Life of the WellTM 4 Every Well is a Potential Life-Long Customer Basic’s Strategy for Success 1.Rate of Returns Driven 2.Proven Management with Ability to Weather Cycles 3.Diversified Service Offerings BAS Service Segments Fluid Services Well Servicing Contract Drilling Completion and Remedial Services
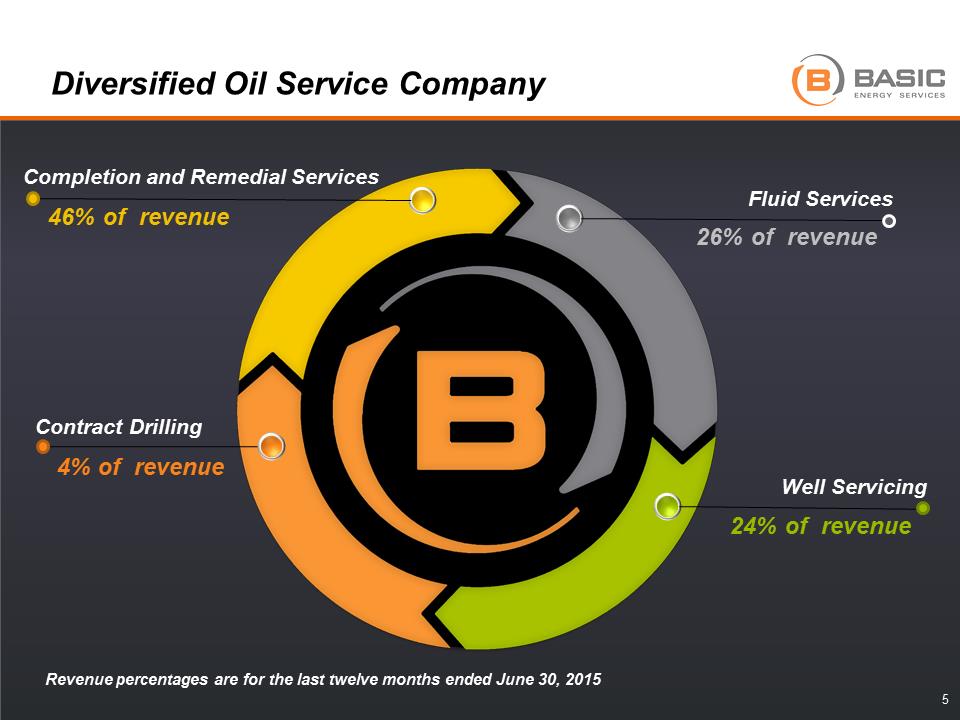 BAS_Logo 2008Life-Cycle.pngDiversified Oil Service Company Contract Drilling Completion and Remedial Services Well Servicing Fluid Services 46% of revenue 26% of revenue 24% of revenue 4% of revenue 5 Revenue percentages are for the last twelve months ended June 30, 2015
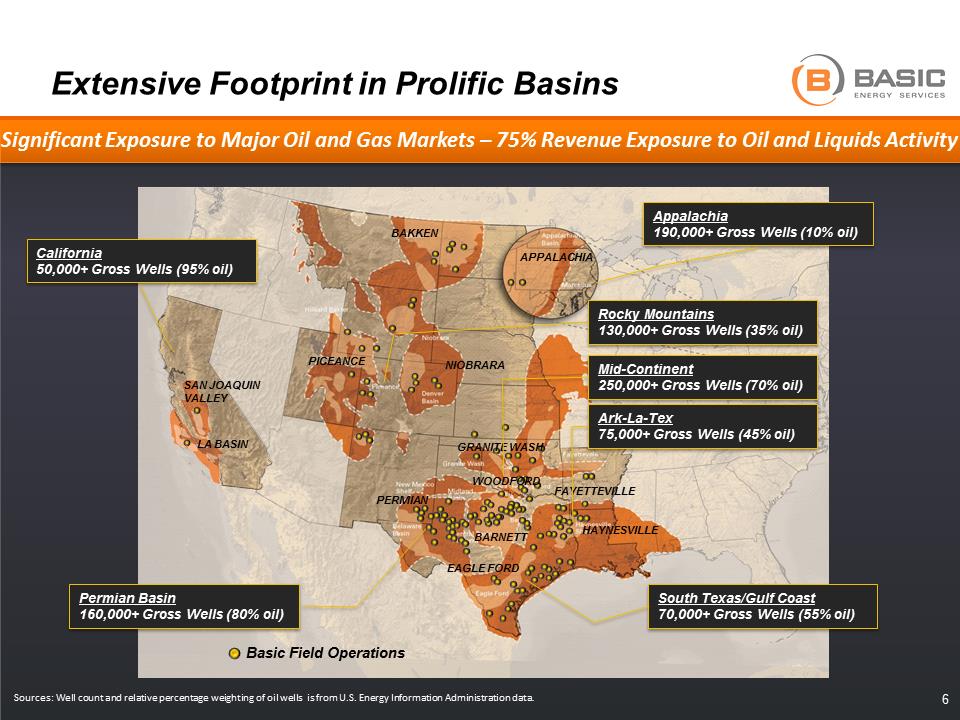 BAS_Logo 2008C:\Users\richardwe\Desktop\MAP.jpgSources: Well count and relative percentage weighting of oil wells is from U.S. Energy Information Administration data. Significant Exposure to Major Oil and Gas Markets – 75% Revenue Exposure to Oil and Liquids Activity Rocky Mountains 130,000+ Gross Wells (35% oil) Appalachia 190,000+ Gross Wells (10% oil) South Texas/Gulf Coast 70,000+ Gross Wells (55% oil) Permian Basin 160,000+ Gross Wells (80% oil) Extensive Footprint in Prolific Basins 6 BAKKEN Basic Field Operations NIOBRARA PICEANCE PERMIAN APPALACHIA EAGLE FORD BARNETT HAYNESVILLE FAYETTEVILLE GRANITE WASH WOODFORD Mid-Continent 250,000+ Gross Wells (70% oil) Ark-La-Tex 75,000+ Gross Wells (45% oil) california-shale-plays.pngLA BASIN SAN JOAQUIN VALLEY California 50,000+ Gross Wells (95% oil)
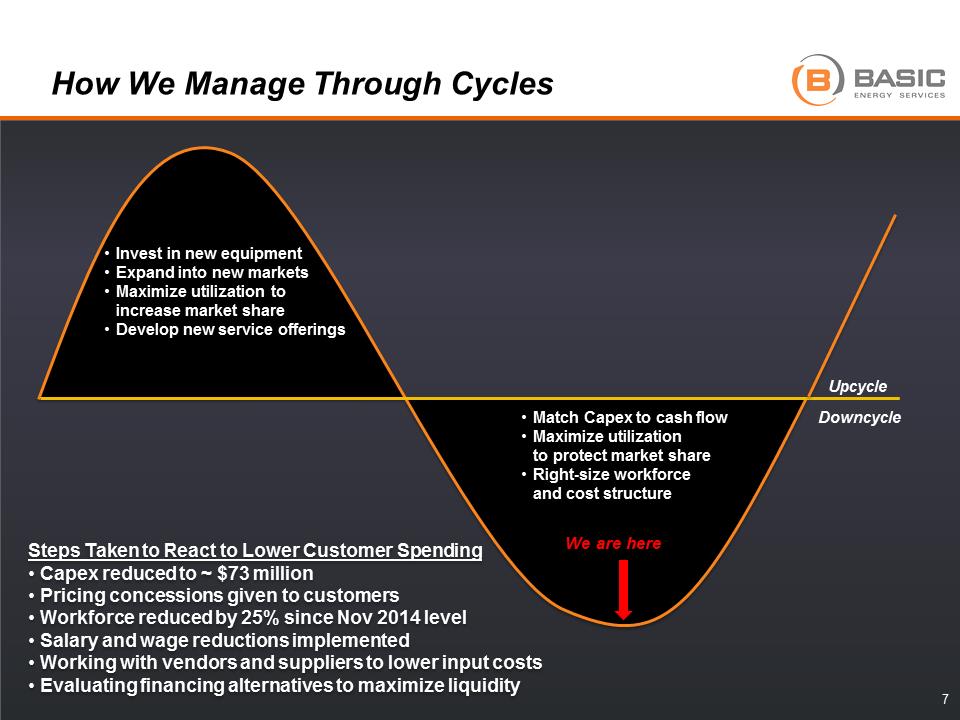 BAS_Logo 2008How We Manage Through Cycles 7 Upcycle Downcycle •Invest in new equipment •Expand into new markets •Maximize utilization to increase market share •Develop new service offerings •Match Capex to cash flow •Maximize utilization to protect market share •Right-size workforce and cost structure Steps Taken to React to Lower Customer Spending •Capex reduced to ~ $73 million •Pricing concessions given to customers •Workforce reduced by 25% since Nov 2014 level •Salary and wage reductions implemented •Working with vendors and suppliers to lower input costs •Evaluating financing alternatives to maximize liquidity We are here
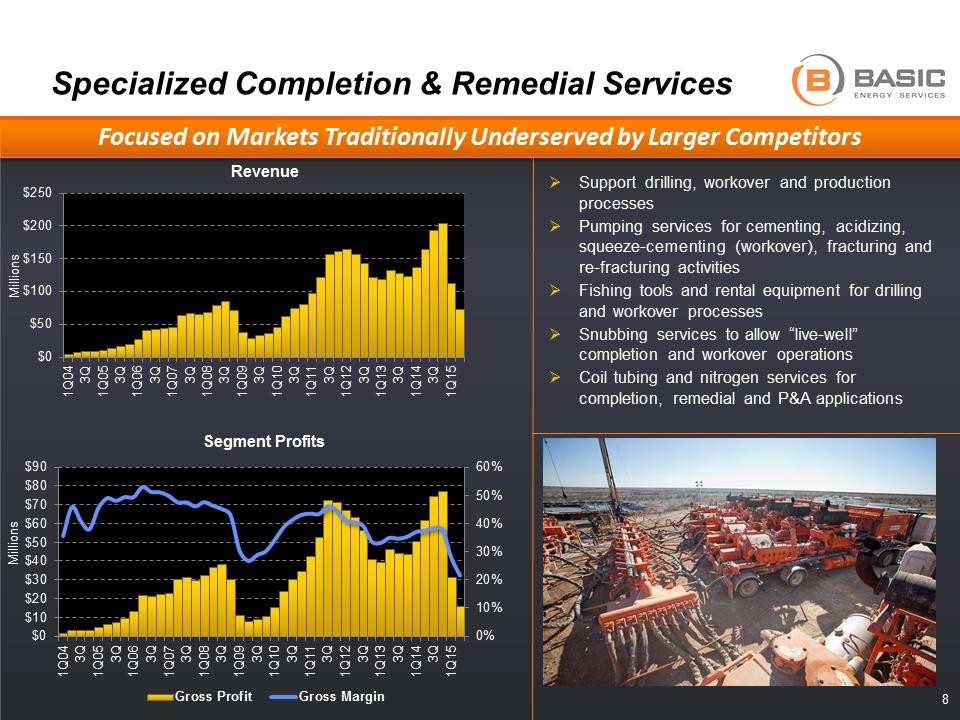 BAS_Logo 20080%10%20%30%40%50%60%$0$10$20$30$40$50$60$70$80$901Q043Q1Q053Q1Q063Q1Q073Q1Q083Q1Q093Q1Q103Q1Q113Q1Q123Q1Q133Q1Q143Q1Q15Segment Profits Gross ProfitGross MarginSpecialized Completion & Remedial Services .Support drilling, workover and production processes .Pumping services for cementing, acidizing, squeeze-cementing (workover), fracturing and re-fracturing activities .Fishing tools and rental equipment for drilling and workover processes .Snubbing services to allow “live-well” completion and workover operations .Coil tubing and nitrogen services for completion, remedial and P&A applications $0$50$100$150$200$2501Q043Q1Q053Q1Q063Q1Q073Q1Q083Q1Q093Q1Q103Q1Q113Q1Q123Q1Q133Q1Q143Q1Q15Revenue 8 Millions Millions Focused on Markets Traditionally Underserved by Larger Competitors C:\Users\richardwe\Desktop\Investor Day Info\Photos\Photo Request_042914\C&R\Frac Spread 4.jpg
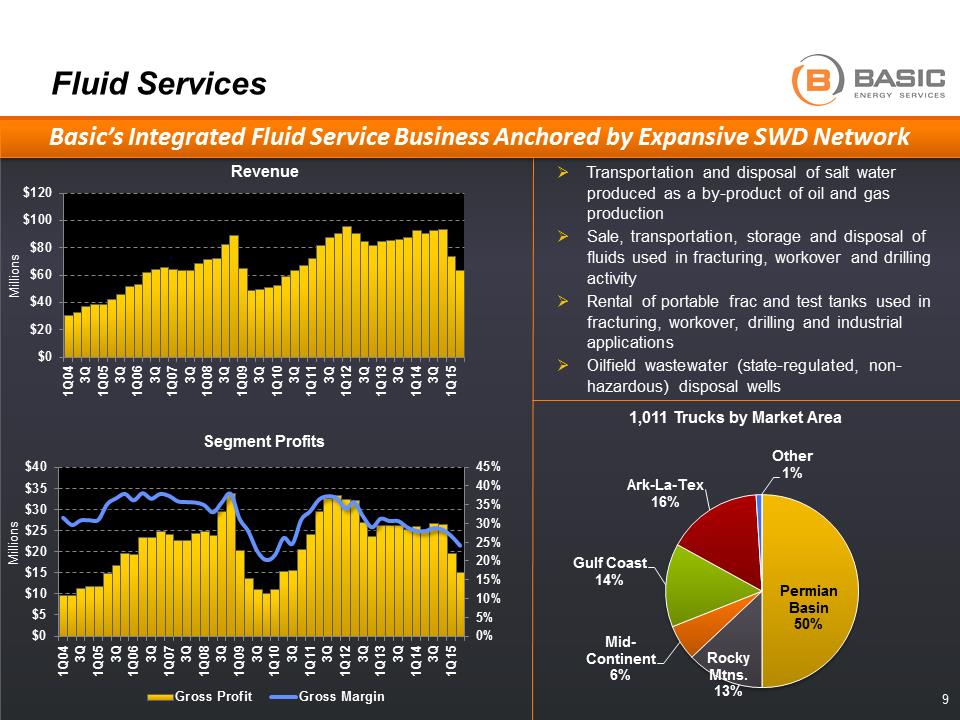 BAS_Logo 20080%5%10%15%20%25%30%35%40%45%$0$5$10$15$20$25$30$35$401Q043Q1Q053Q1Q063Q1Q073Q1Q083Q1Q093Q1Q103Q1Q113Q1Q123Q1Q133Q1Q143Q1Q15Segment Profits Gross ProfitGross MarginFluid Services .Transportation and disposal of salt water produced as a by-product of oil and gas production .Sale, transportation, storage and disposal of fluids used in fracturing, workover and drilling activity .Rental of portable frac and test tanks used in fracturing, workover, drilling and industrial applications .Oilfield wastewater (state-regulated, non-hazardous) disposal wells $0$20$40$60$80$100$1201Q043Q1Q053Q1Q063Q1Q073Q1Q083Q1Q093Q1Q103Q1Q113Q1Q123Q1Q133Q1Q143Q1Q15Revenue Basic’s Integrated Fluid Service Business Anchored by Expansive SWD Network 9 Millions Millions Permian Basin 50% Rocky Mtns. 13% Mid-Continent 6% Gulf Coast 14% Ark-La-Tex 16% Other 1% 1,011 Trucks by Market Area
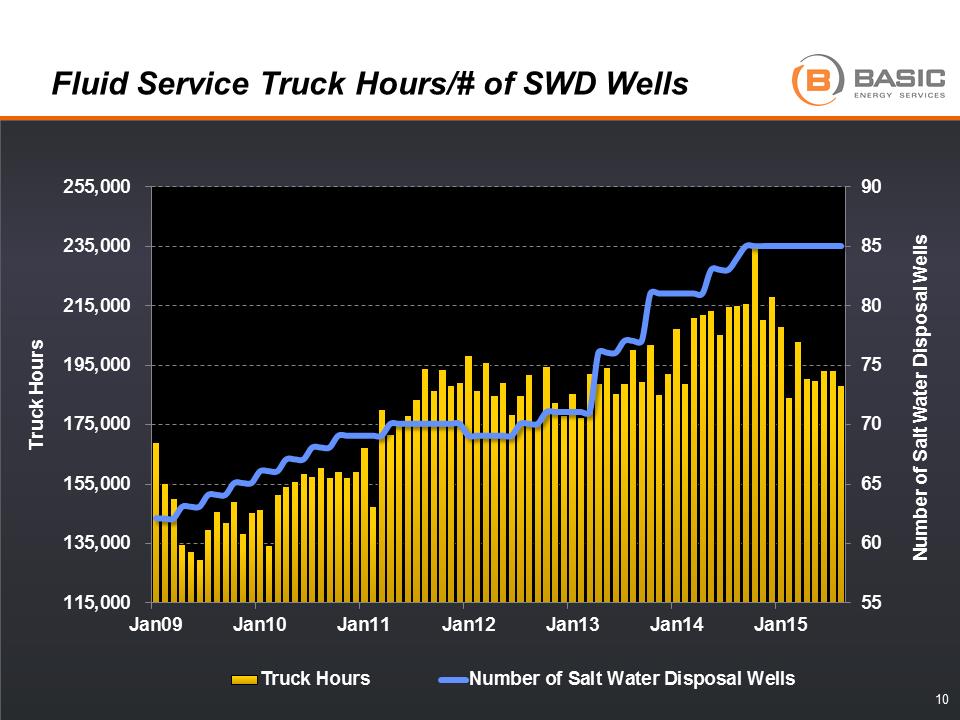 BAS_Logo 2008Fluid Service Truck Hours/# of SWD Wells 115,000 135,000 155,000 175,000 195,000 215,000 235,000 255,000Jan09Jan10Jan11Jan12Jan13Jan14Jan155560657075808590Truck Hours Number of Salt Water Disposal Wells Truck HoursNumber of Salt Water Disposal Wells10
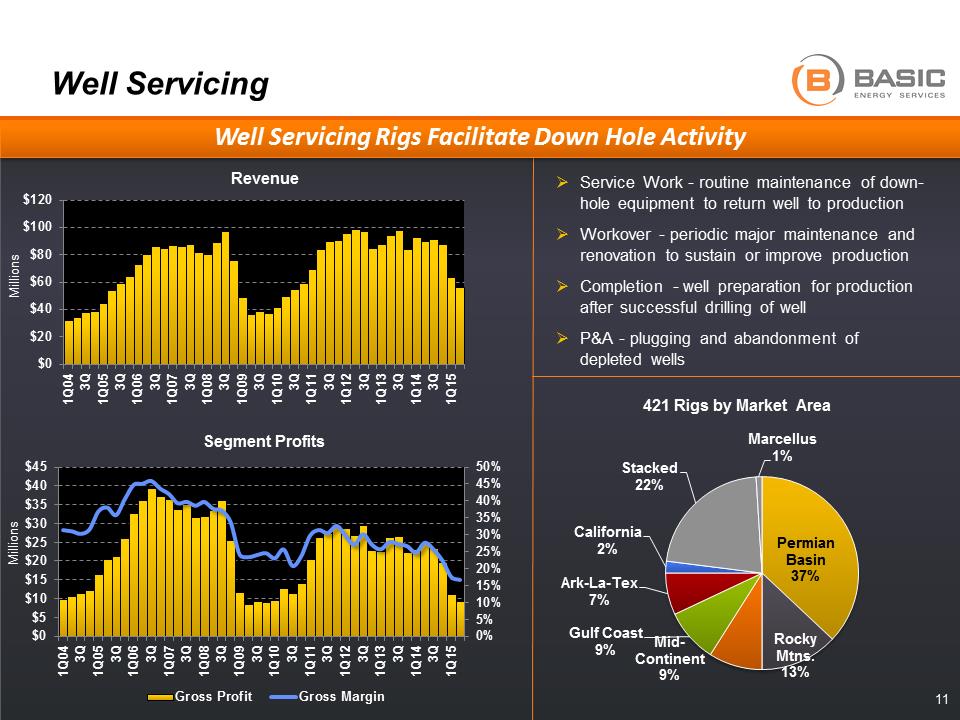
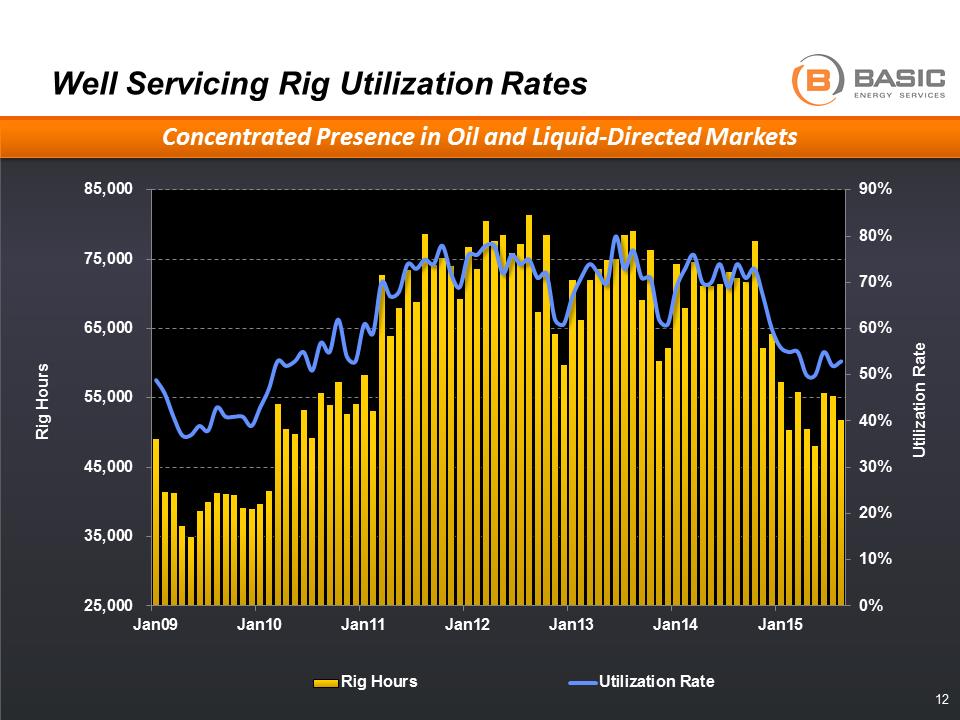 BAS_Logo 2008Permian Basin 37% Rocky Mtns. 13% Mid-Continent 9% Gulf Coast 9% Ark-La-Tex 7% California 2% Stacked 22% Marcellus 1% 421 Rigs by Market Area Well Servicing .Service Work - routine maintenance of down-hole equipment to return well to production .Workover - periodic major maintenance and renovation to sustain or improve production .Completion - well preparation for production after successful drilling of well .P&A - plugging and abandonment of depleted wells $0$20$40$60$80$100$1201Q043Q1Q053Q1Q063Q1Q073Q1Q083Q1Q093Q1Q103Q1Q113Q1Q123Q1Q133Q1Q143Q1Q15Revenue 0%5%10%15%20%25%30%35%40%45%50%$0$5$10$15$20$25$30$35$40$451Q043Q1Q053Q1Q063Q1Q073Q1Q083Q1Q093Q1Q103Q1Q113Q1Q123Q1Q133Q1Q143Q1Q15Segment Profits Gross ProfitGross MarginWell Servicing Rigs Facilitate Down Hole Activity 11 Millions Millions BAS_Logo 2008Well Servicing Rig Utilization Rates Concentrated Presence in Oil and Liquid-Directed Markets 25,000 35,000 45,000 55,000 65,000 75,000 85,000Jan09Jan10Jan11Jan12Jan13Jan14Jan150%10%20%30%40%50%60%70%80%90%Rig Hours Utilization Rate Rig HoursUtilization Rate12
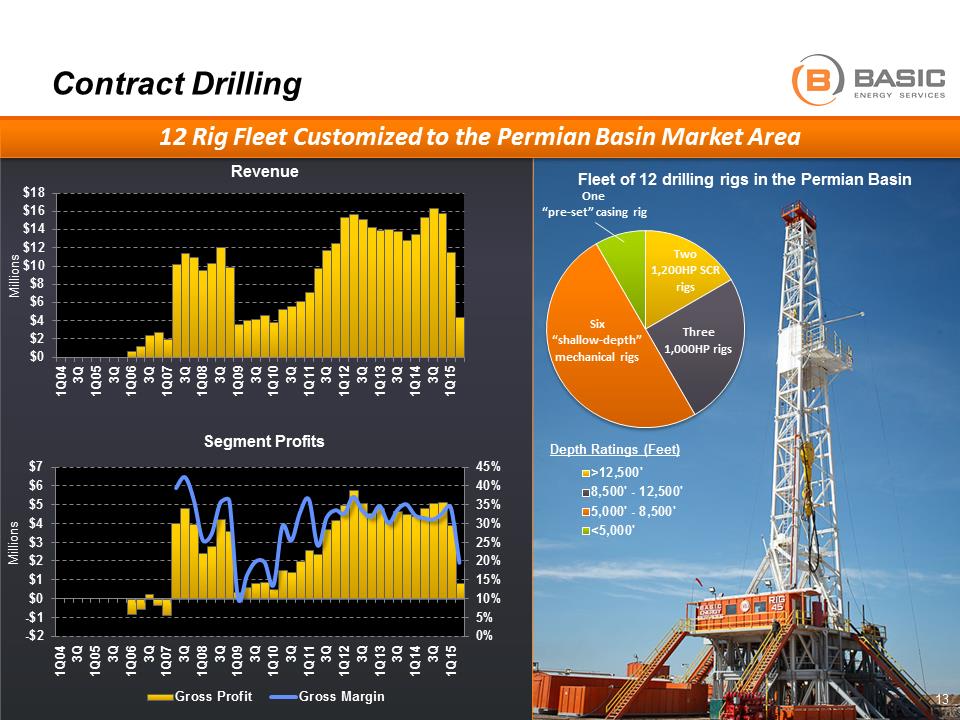 BAS_Logo 2008$0$2$4$6$8$10$12$14$16$181Q043Q1Q053Q1Q063Q1Q073Q1Q083Q1Q093Q1Q103Q1Q113Q1Q123Q1Q133Q1Q143Q1Q15Revenue Fleet of 12 drilling rigs in the Permian Basin Contract Drilling >12,500'8,500' - 12,500'5,000' - 8,500'<5,000'One “pre-set” casing rig Six “shallow-depth” mechanical rigs Three 1,000HP rigs Two 1,200HP SCR rigs Depth Ratings (Feet) 0%5%10%15%20%25%30%35%40%45%-$2-$1$0$1$2$3$4$5$6$71Q043Q1Q053Q1Q063Q1Q073Q1Q083Q1Q093Q1Q103Q1Q113Q1Q123Q1Q133Q1Q143Q1Q15Segment Profits Gross ProfitGross Margin12 Rig Fleet Customized to the Permian Basin Market Area Millions Millions 13
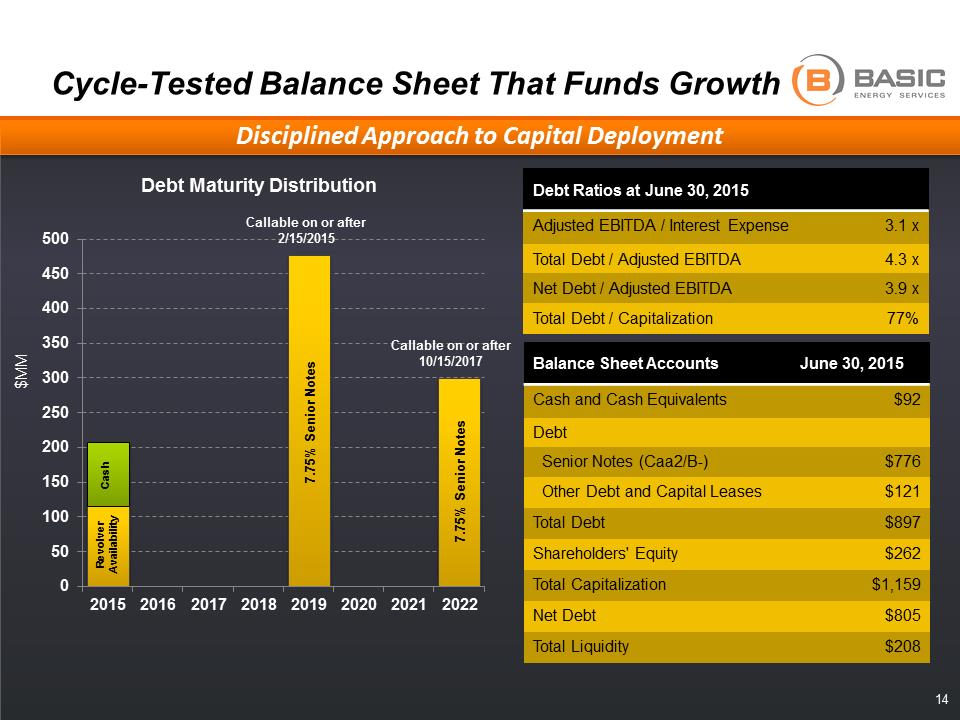 BAS_Logo 2008Cycle-Tested Balance Sheet That Funds Growth 14 05010015020025030035040045050020152016201720182019202020212022Debt Maturity Distribution Debt Ratios at June 30, 2015 Adjusted EBITDA / Interest Expense 3.1 x Total Debt / Adjusted EBITDA 4.3 x Net Debt / Adjusted EBITDA 3.9 x Total Debt / Capitalization 77% 7.75% Senior Notes $MM Revolver Availability Disciplined Approach to Capital Deployment Balance Sheet Accounts June 30, 2015 Cash and Cash Equivalents $92 Debt Senior Notes (Caa2/B-) $776 Other Debt and Capital Leases $121 Total Debt $897 Shareholders' Equity $262 Total Capitalization $1,159 Net Debt $805 Total Liquidity $208 7.75% Senior Notes Callable on or after 2/15/2015 Callable on or after 10/15/2017 Cash
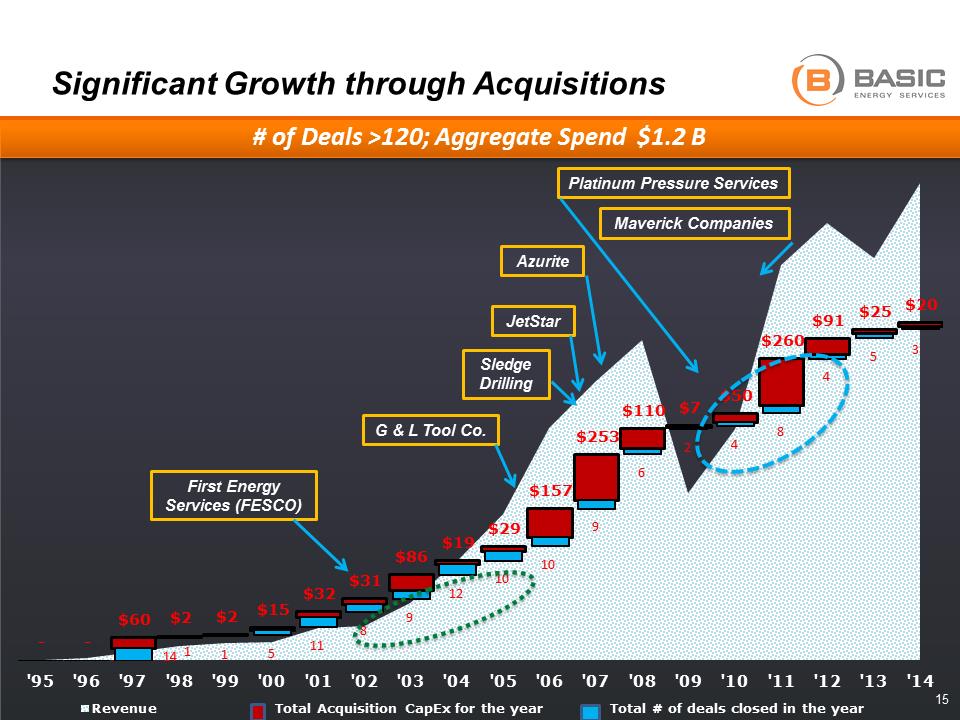 BAS_Logo 2008Significant Growth through Acquisitions 15 # of Deals >120; Aggregate Spend $1.2 B - - $60 $2 $2 $15 $32 $31 $86 $19 $29 $157 $253 $110 $7 $50 $260 $91 $25 $20 14 1 1 5 11 8 9 12 10 10 9 6 2 4 8 4 5 3 '95'96'97'98'99'00'01'02'03'04'05'06'07'08'09'10'11'12'13'14RevenueTotal Acquisition CapEx for the year Total # of deals closed in the year G & L Tool Co. JetStar Sledge Drilling Azurite Platinum Pressure Services Maverick Companies First Energy Services (FESCO)
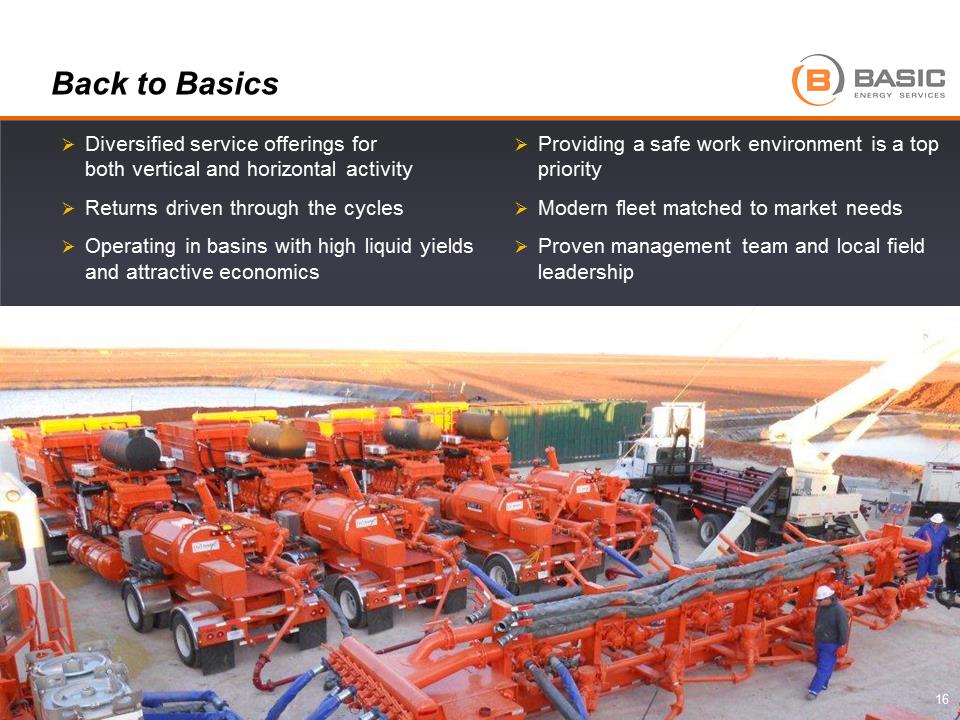 BAS_Logo 2008Back to Basics .Diversified service offerings for both vertical and horizontal activity .Returns driven through the cycles .Operating in basins with high liquid yields and attractive economics .Providing a safe work environment is a top priority .Modern fleet matched to market needs .Proven management team and local field leadership 16
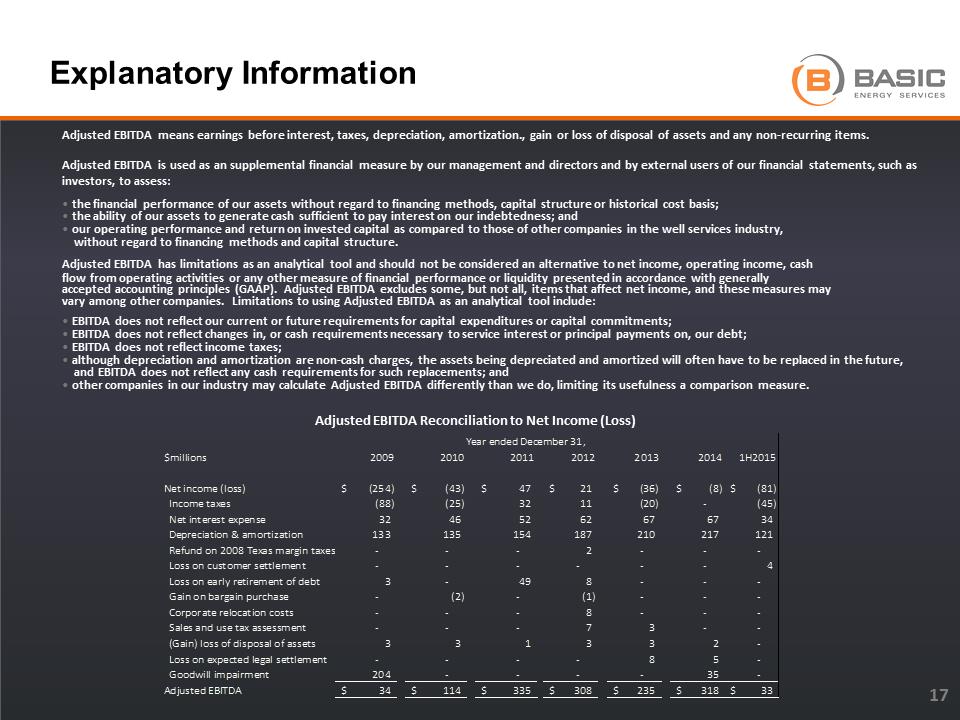 BAS_Logo 200817 Explanatory Information Adjusted EBITDA means earnings before interest, taxes, depreciation, amortization., gain or loss of disposal of assets and any non-recurring items. Adjusted EBITDA is used as an supplemental financial measure by our management and directors and by external users of our financial statements, such as investors, to assess: • the financial performance of our assets without regard to financing methods, capital structure or historical cost basis; • the ability of our assets to generate cash sufficient to pay interest on our indebtedness; and • our operating performance and return on invested capital as compared to those of other companies in the well services industry, without regard to financing methods and capital structure. Adjusted EBITDA has limitations as an analytical tool and should not be considered an alternative to net income, operating income, cash flow from operating activities or any other measure of financial performance or liquidity presented in accordance with generally accepted accounting principles (GAAP). Adjusted EBITDA excludes some, but not all, items that affect net income, and these measures may vary among other companies. Limitations to using Adjusted EBITDA as an analytical tool include: • EBITDA does not reflect our current or future requirements for capital expenditures or capital commitments; • EBITDA does not reflect changes in, or cash requirements necessary to service interest or principal payments on, our debt; • EBITDA does not reflect income taxes; • although depreciation and amortization are non-cash charges, the assets being depreciated and amortized will often have to be replaced in the future, and EBITDA does not reflect any cash requirements for such replacements; and • other companies in our industry may calculate Adjusted EBITDA differently than we do, limiting its usefulness a comparison measure. Adjusted EBITDA Reconciliation to Net Income (Loss) $millions2009201020112012201320141H2015Net income (loss)(254)$ (43)$ 47$ 21$ (36)$ (8)$ (81)$ Income taxes(88) (25) 32 11 (20) - (45) Net interest expense32 46 52 62 67 67 34 Depreciation & amortization133 135 154 187 210 217 121 Refund on 2008 Texas margin taxes- - - 2 - - - Loss on customer settlement- - - - - - 4 Loss on early retirement of debt3 - 49 8 - - - Gain on bargain purchase- (2) - (1) - - - Corporate relocation costs- - - 8 - - - Sales and use tax assessment - - - 7 3 - - (Gain) loss of disposal of assets3 3 1 3 3 2 - Loss on expected legal settlement- - - - 8 5 - Goodwill impairment204 - - - - 35 - Adjusted EBITDA34$ 114$ 335$ 308$ 235$ 318$ 33$ Year ended December 31,