Attached files
| file | filename |
|---|---|
| 8-K - 8-K - WESTMORELAND COAL Co | f8k_091815i701.htm |

WESTMORELAND COAL COMPANY September 17, 2015 Imperial Capital: Global Opportunities Conference NASDAQ:WLB NYSE:WMLP westmoreland.com westmorelandmlp.com

1 WESTMORELAND COAL COMPANY This presentation contains “forward-looking statements.” Forward-looking statements can be identified by words such as “anticipates,” “intends,” “plans,” “seeks,” “believes,” “estimates,” “expects” and similar references to future periods. Examples of forward-looking statements include, but are not limited to, statements we make throughout this presentation regarding recent acquisitions and their anticipated effects on us. Forward-looking statements are based on our current expectations and assumptions regarding our business, the economy and other future conditions. Because forward-looking statements relate to the future, they are subject to inherent uncertainties, risks and changes in circumstances that are difficult to predict. Our actual results may differ materially from those contemplated by the forward-looking statements. We therefore caution you against relying on any of these forward-looking statements. They are statements neither of historical fact nor guarantees or assurances of future performance. Important factors that could cause actual results to differ materially from those in the forward-looking statements include political, economic, business, competitive, market, weather and regulatory conditions and the following: Our ability to manage Westmoreland Resource Partners, LP (“WMLP”); Our efforts to effectively integrate recently acquired operations (including Canadian and Ohio operations) with our existing business and our ability to manage our expanded operations following the acquisition; Our ability to realize growth opportunities and cost synergies as a result of the addition of operations and across our existing operations; Our substantial level of indebtedness; The ability of our hedging arrangement with respect to our Roanoke Valley Power Facility (“ROVA”) to generate free cash flow due to the fully hedged position through March 2019; Changes in our post-retirement medical benefit and pension obligations and the impact of the recently enacted healthcare legislation on our employee health benefit costs; Inaccuracies in our estimates of our coal reserves; Our potential inability to expand or continue current coal operations due to limitations in obtaining bonding capacity for new mining permits, or increases in our mining costs as a result of increased bonding expenses; The effect of prolonged maintenance or unplanned outages at our operations or those of our major power generating customers; The inability to control costs, recognize favorable tax credits or receive adequate train traffic at our open market mine operations; Competition within our industry and with producers of competing energy sources; Existing and future laws including legislation, regulations and court judgments or orders affecting both our coal mining operations and our customers’ coal usage, governmental policies and taxes, including those aimed at reducing emissions of elements such as mercury, sulfur dioxides, nitrogen oxides, particulate matter or greenhouse gases; The effect of the Environmental Protection Agency’s and Canadian and provincial governments’ inquiries and regulations on the operations of the power plants to which we provide coal; and Other factors that are described under the heading “Risk Factors” in our reports filed with the Securities and Exchange Commission, including our Annual Reports on Form 10-K and our Quarterly Reports on Form 10-Q. Unless otherwise specified, the forward-looking statements in this presentation speak as of the date of this presentation. Factors or events that could cause our actual results to differ may emerge from time-to-time, and it is not possible for us to predict all of them. We undertake no obligation to publicly update any forward-looking statements, whether because of new information, future developments or otherwise, except as may be required by law. Reserve engineering is a process of estimating underground accumulations of coal that cannot be measured in an exact way. The accuracy of any reserve estimate depends on the quality of available data, the interpretation of such data and price and cost assumptions made by our reserve engineers. In addition, the results of mining, testing and production activities may justify revision of estimates that were made previously. If significant, such revisions would change the schedule of any further production and development of reserves. Accordingly, reserve estimates may differ from the quantities of coal that are ultimately recovered. Forward Looking Statements

2 WESTMORELAND COAL COMPANY Proven Management Team Positioned for Growth Operates in Favorable Markets The Westmoreland Difference Unique and Predictable Operating Model The Westmoreland Difference Safety The Westmoreland Difference The Westmoreland Model Positioned to Drive Shareholder Value

3 WESTMORELAND COAL COMPANY The Westmoreland Difference Westmoreland Others in the Industry Contract Length Average of 10 years 6 months - 2 years Committed Sales Fully committed long-term sales at most mines Partial sales commitments beyond 1 year Spot Price Exposure Cost protected contracts insulate price volatility Highly exposed to coal and commodity pricing Rail Not reliant on rail Heavily reliant on rail Reserve Acquisition Pay royalties when we sell coal Large, up-front bonus payments Reclamation Customers share in obligation Fully responsible Self Bonding Risk Bonds secured by cash collateral Self-bonding risk Transportation Mine-mouth position reduces transport costs Significant transport costs Natural Gas Cost per MBtu significantly below natural gas Subject to natural gas displacement Customers Base load customers with high capacity factors Exposed customer plants Stability Consistent long-term deliveries Fuel switching volatility Performance 5 years straight of record EBITDA Eroding cash flows Leverage Prudent leverage for business model Highly levered, facing restructuring / bankruptcy Credit Rating Upgraded by Moody's and S&P Trend of downgrades Access to Capital Strong track record accessing capital markets Increasing cost of capital Operating Philosophy Lean flexible organization High overhead M&A Track Record Disciplined acquisition record High multiple, high leverage acquisitions Corporate Focus Long-term cash generation Minimizing cash burn Safety Strong safety history Operates in Favorable Markets Proven Management Team Positioned for Growth Unique and Predictable Operating Model The Westmoreland Difference The Westmoreland Model Positioned to Drive Shareholder Value

4 WESTMORELAND COAL COMPANY 1. On a consolidated basis including WMLP. 2. Includes subsequent $75 million upsize. Recent Accomplishments Westmoreland guided to record 2015 Adjusted EBITDA of $235 - $270 million(1) Transformational acquisitions Closed acquisition of Canadian operations Created an MLP platform through acquisition of Westmoreland Resource Partners Acquired Buckingham Coal Company Agreed in principal to acquire San Juan Mine Closed first drop down with sale of Kemmerer Mine to WMLP Improved balance sheet strength and enhanced liquidity profile Extinguished existing debt eliminating restrictive covenants Issued $350 million Senior Secured Notes and $425 million Term Loan(2) Completed ~$60 million common share offering Monetized port capacity for proceeds of $37 million Increased revolving line of credit Received credit rating upgrade from both Moody’s and S&P Signed significant contract extensions and agreements Extended Estevan Mine contract through 2024 Extended Kemmerer Mine contracts with FMC and Tata Successfully negotiated four key labor contracts Reorganized and streamlined executive team The Westmoreland Difference The Westmoreland Model Positioned to Drive Shareholder Value

5 WESTMORELAND COAL COMPANY Pro Forma 2014A WESTMORELAND COAL COMPANY WESTMORELAND RESOURCE PARTNERS Coal Sales (Mst) 54.7 5.6 60.3 Revenue (US$ mm) $1,392 $328 $1,720 Adjusted EBITDA (US$ mm) $230 $39 $270 Operating Mines (Qty) 13 6 19 Reserves (Mst) 1,232 76 1,308 Source: Company filings Note: Shown pro forma for a full year of the Canadian operations and Buckingham acquisition with restructured contract. Includes a qualified/non-conforming estimate of proven & probable reserve for Buckingham; a formal study, including economic analysis per SEC Section 7 guidelines will be completed for the 2016 reserve filing. Building a Diversified North American Coal Leader Formed in 1854, the oldest independent coal company in the United States Operations include: Surface mine operations in U.S. and Canada An underground mine in Ohio Char and activated carbon production facilities Two-unit ROVA coal-fired power plant Owns general partner and majority interest in Westmoreland Resource Partners (WMLP) Well positioned to deliver shareholder value: Leading market position with low-cost operating model Generating consistent cash flows Cost-protected contract pricing Strong management with a track record of delivering growth Award-winning safety and environmental performance The Westmoreland Difference The Westmoreland Model Positioned to Drive Shareholder Value

6 WESTMORELAND COAL COMPANY WESTMORELAND COAL COMPANY WMLP C-Corp General Partner Sponsored MLP Ticker NASDAQ:WLB NYSE:WMLP Share / Unit Price (US$) $14.72 $7.45 Basic Shares / Units (mm) 18.0 21.0 Market Cap (US$ mm) $265 $156 Enterprise Value (US$ mm) $857 $451 Annual Distribution (US$) n.a. $0.80 Yield (%) n.a. 10.7% Credit Rating B3, B n.a. Source: Company filings, FactSet Note: Balance sheet data as of 30-Jun-15 and adjusted for subsequent events; Market data as of 10-Sep-15. Two Ways to Invest in Westmoreland Coal Legend Westmoreland Coal Westmoreland Resource Partners, LP Power Two Public Companies Location of Operations Headquarters Estevan Coal Valley Paintearth Sheerness Genesee Poplar River Savage Rosebud Absaloka Beulah Jewett Kemmerer ROVA Power Facility Cadiz Belmont Noble OHIO New Lexington Buckingham Plainfield Tuscarawas The Westmoreland Difference The Westmoreland Model Positioned to Drive Shareholder Value

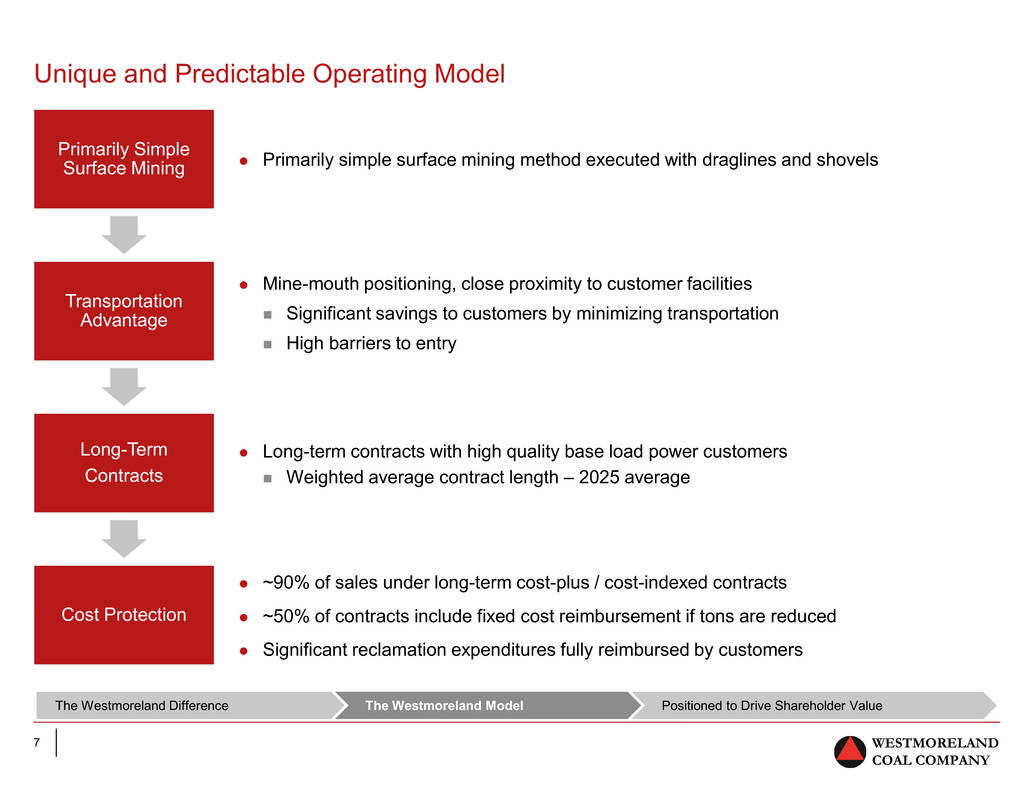
7 WESTMORELAND COAL COMPANY Unique and Predictable Operating Model Primarily simple surface mining method executed with draglines and shovels Primarily Simple Surface Mining Transportation Advantage Long-Term Contracts Cost Protection Mine-mouth positioning, close proximity to customer facilities Significant savings to customers by minimizing transportation High barriers to entry Long-term contracts with high quality base load power customers Weighted average contract length – 2025 average ~90% of sales under long-term cost-plus / cost-indexed contracts ~50% of contracts include fixed cost reimbursement if tons are reduced Significant reclamation expenditures fully reimbursed by customers The Westmoreland Difference The Westmoreland Model Positioned to Drive Shareholder Value

8 WESTMORELAND COAL COMPANY Mine Primary Power Plant Power Generation Units Served(1) Contract Life Environmental Controls Genesee Genesee 3 Scrubbed, PM, NOx, Mercury Poplar River Poplar River 2 PM, Mercury Sheerness Sheerness 2 PM, Mercury Estevan Boundary Dam / Shand 5 Carbon Capture, PM, NOx Paintearth Battle River 3 PM, Mercury Kemmerer (WMLP) Naughton 3 Scrubbed, PM, NOx, Mercury Colstrip Colstrip 4 Scrubbed, PM, NOx, Mercury Absaloka Sherco 9 Scrubbed, PM, NOx, Mercury Buckingham, WMLP Conesville 1 Scrubbed, PM, NOx Jewett Limestone 2 Scrubbed, PM, NOx Savage Lewis & Clark 2 Scrubbed, PM, NOx, Mercury 36 2029 2026 2024 2022 2022 2020 2020 2019 2018 2017 2055 (2) Source: Company filings, SNL 1. Total power plant units served for each mine. 2. Poplar River contract renewal currently in negotiations and expected to be extended to 2029. Long-Term Cost-Protected Contracts Provide Stable Predictable Cash Flows Customer plants have (i) modern environmental controls, (ii) attractive heat rates, and (iii) adjacent fuel from WCC Supplier to a significant number of power units, minimizing downtime risk Canadian plants have strong regulatory protection The Westmoreland Difference The Westmoreland Model Positioned to Drive Shareholder Value

9 WESTMORELAND COAL COMPANY Proximity to Captive Customer Base with Export Opportunity Mine Competitive Advantage Mine-Mouth Operations (11) Beulah Buckingham Jewett Kemmerer (WMLP) Colstrip Estevan Genesee Paintearth Poplar River Savage Sheerness Mines located adjacent or in close proximity to customers Delivery by conveyor and short haul truck – the most economical methods Significant cost advantage even against low natural gas prices Stable predictable cash flow from long-term, cost-protected contracts Performance and deliveries not reliant on rail service Transportation Advantaged Operations (8) Absaloka Coal Valley Ohio Surface Operations (WMLP’s 6 complexes) Absaloka has 300+ mile rail advantage over other PRB competitors Recent increases in rail rates have improved Absaloka’s competitive position Coal Valley has strategic access to port facilities and premium thermal coal Ohio operations have significant transport advantages to key plants Mine-mouth positioning and shortened transportation routes make Westmoreland a preferred supplier The Westmoreland Difference The Westmoreland Model Positioned to Drive Shareholder Value

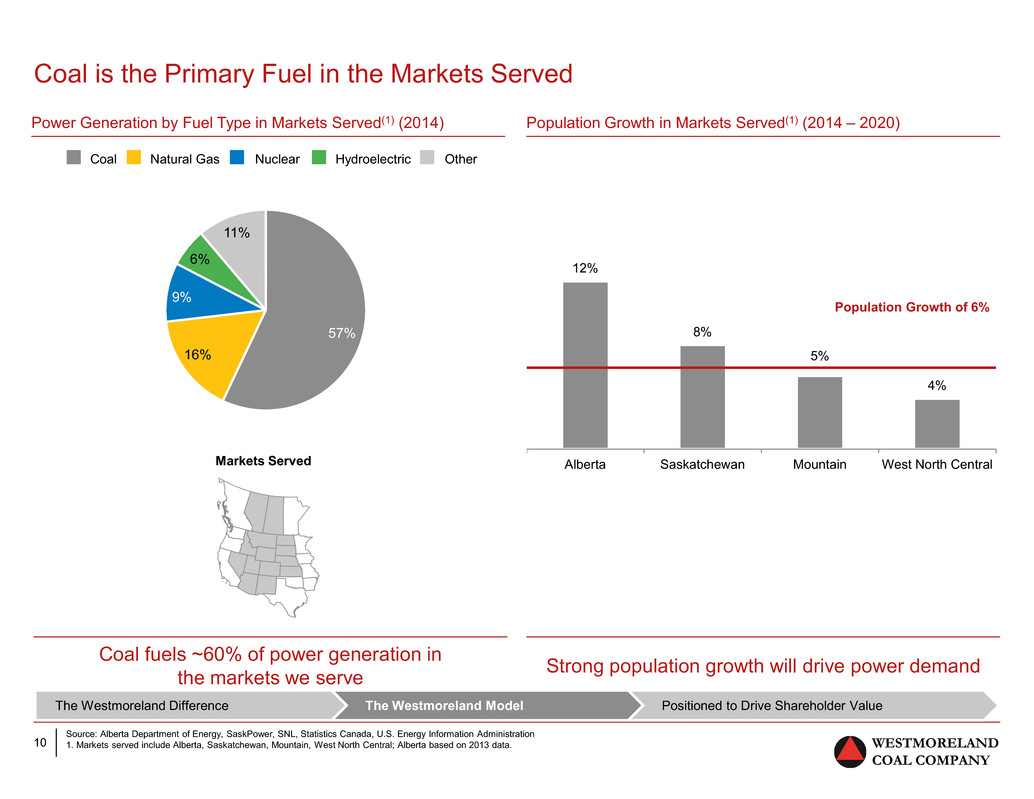
10 WESTMORELAND COAL COMPANY 12% 8% 5% 4% Alberta Saskatchewan Mountain West North Central Population Growth of 6% 57% 16% 9% 6% 11% Source: Alberta Department of Energy, SaskPower, SNL, Statistics Canada, U.S. Energy Information Administration 1. Markets served include Alberta, Saskatchewan, Mountain, West North Central; Alberta based on 2013 data. Coal is the Primary Fuel in the Markets Served Power Generation by Fuel Type in Markets Served(1) (2014) Coal Natural Gas Nuclear Hydroelectric Other Markets Served Population Growth in Markets Served(1) (2014 – 2020) Coal fuels ~60% of power generation in the markets we serve Strong population growth will drive power demand The Westmoreland Difference The Westmoreland Model Positioned to Drive Shareholder Value

11 WESTMORELAND COAL COMPANY 368 1,308 2011 2014 Source: Company filings, SNL 1. Westmoreland shown pro forma for the acquisition of the Buckingham Mine (restructured contract), the Canadian and WMLP operations, and 2016E San Juan production. 2. Includes WMLP and a qualified/non-conforming estimate of proven & probable reserve for Buckingham; a formal study, including economic analysis per SEC Section 7 guidelines will be completed for the 2016 reserve filing. Significant Scale with Built-in Resource Growth Significant Reserve Growth(2) Top North American Coal Producers (2014 Production)(1) (Millions of short tons) (Millions of short tons) 2 bn tons of additional resources to be proven Demonstrated reserve growth at minimal upfront cost; Average reserve life extends beyond 2035 190 131 86 80 66 63 41 32 32 30 P ea bo dy A rc h C oa l C lo ud P ea k A lp ha W es tm or el an d M ur ra y E ne rg y A lli an ce R P C O N S O L N A C C O E ne rg y Fu tu re H ol di gn s Proven & Probable Reserves The Westmoreland Difference The Westmoreland Model Positioned to Drive Shareholder Value

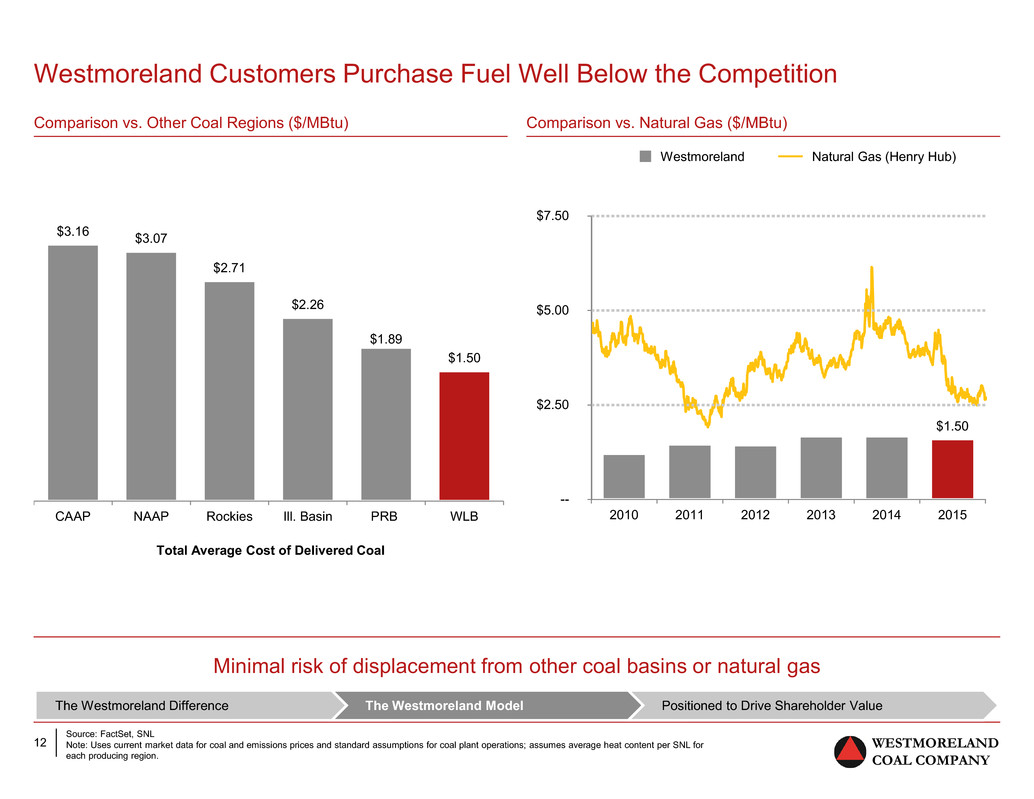
12 WESTMORELAND COAL COMPANY -- $2.50 $5.00 $7.50 $3.16 $3.07 $2.71 $2.26 $1.89 $1.50 CAAP NAAP Rockies Ill. Basin PRB WLB Source: FactSet, SNL Note: Uses current market data for coal and emissions prices and standard assumptions for coal plant operations; assumes average heat content per SNL for each producing region. Westmoreland Customers Purchase Fuel Well Below the Competition Minimal risk of displacement from other coal basins or natural gas Total Average Cost of Delivered Coal Westmoreland Natural Gas (Henry Hub) Comparison vs. Natural Gas ($/MBtu) Comparison vs. Other Coal Regions ($/MBtu) $1.50 2010 2011 2012 2013 2014 2015 The Westmoreland Difference The Westmoreland Model Positioned to Drive Shareholder Value

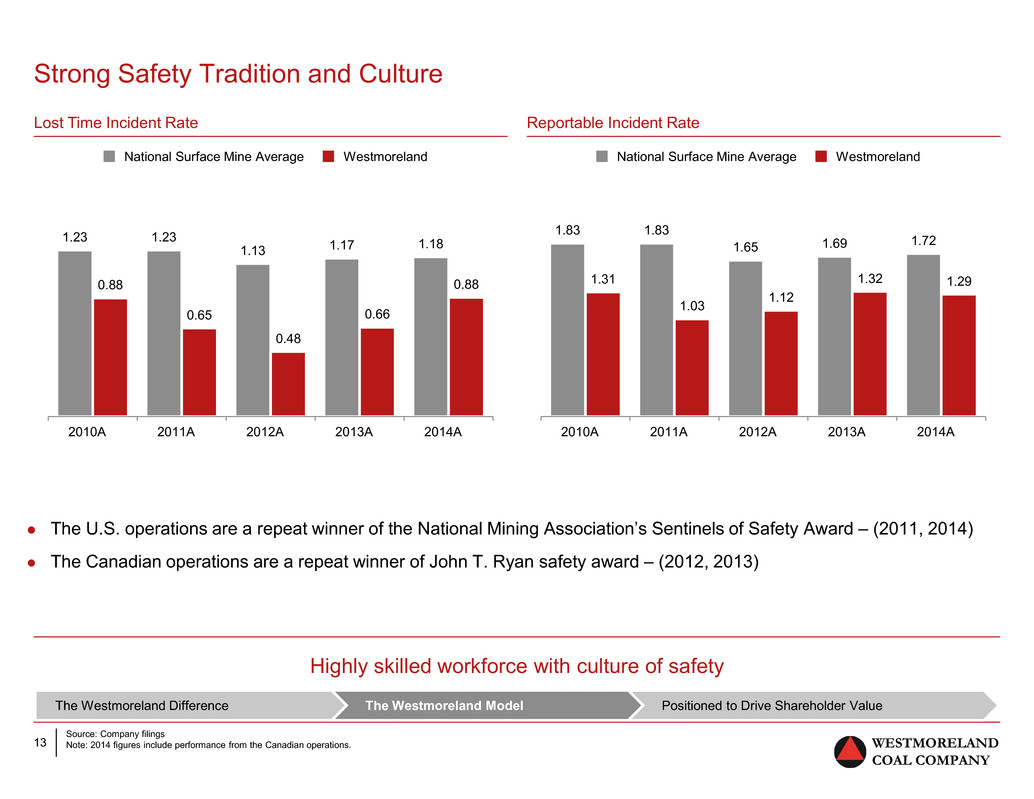
13 WESTMORELAND COAL COMPANY 1.83 1.83 1.65 1.69 1.72 1.31 1.03 1.12 1.32 1.29 2010A 2011A 2012A 2013A 2014A 1.23 1.23 1.13 1.17 1.18 0.88 0.65 0.48 0.66 0.88 2010A 2011A 2012A 2013A 2014A Source: Company filings Note: 2014 figures include performance from the Canadian operations. Strong Safety Tradition and Culture The U.S. operations are a repeat winner of the National Mining Association’s Sentinels of Safety Award – (2011, 2014) The Canadian operations are a repeat winner of John T. Ryan safety award – (2012, 2013) National Surface Mine Average Westmoreland Highly skilled workforce with culture of safety National Surface Mine Average Westmoreland Reportable Incident Rate Lost Time Incident Rate The Westmoreland Difference The Westmoreland Model Positioned to Drive Shareholder Value

14 WESTMORELAND COAL COMPANY Proven Management Team Management incentives based on a combination of free cash flow and total shareholder return Keith Alessi Chief Executive Officer Joined Westmoreland as Chief Executive Officer and President in May 2007 Prior Chief Executive Officer of numerous private and public companies with a deep background in integrating large acquisitions Extensive experience as a director of public and private companies MBA from the University of Michigan and a BS from Wayne State University; Certified Public Accountant Kevin Paprzycki Chief Financial Officer and Treasurer Joined Westmoreland as Controller and Principal Accounting Officer in June 2006 and was named Chief Financial Officer in April 2008 Previously Chief Financial Officer of Evans and Sutherland Computer Corporation and held senior level positions at Applied Films Corporation, Baker Hughes and Ernst and Young Bachelor of Science in Accountancy from Case Western Reserve University, MBA from the University of Utah; Certified Public Accountant, Certified Financial Manager and Certified Management Accountant Jennifer Grafton SVP and Chief Administrative Officer Joined Westmoreland as Associate General Counsel in December 2008 and was named General Counsel and Secretary in February 2011 before becoming SVP and Chief Administrative Officer in October 2014 Oversees human resources, legal, insurance, business development and power operations MBA from the University of Michigan, University of Denver Sturm College of Law, BA from the University of Puget Sound John Schadan President, Canada Operations Joined Westmoreland in April 2014 as Senior Vice President, Canada Operations and was promoted to Executive Vice President in August 2014 Career has encompassed both the western Canadian coal business as well as engineering and construction for a major international firm Degree in mining engineering from Queen’s University, Registered Professional Engineer in the Province of Alberta Joseph Micheletti Executive Vice President Joined Westmoreland in August 1998 and has held several key leadership positions at several Westmoreland mining projects, including Senior Vice President of Coal Operations since 2011, before becoming Executive Vice President in August 2014 Bachelor of Science in Mineral Processing Engineering from Montana College of Mineral Science and Technology Jason Veenstra Treasurer Joined Westmoreland in April 2014 through Westmoreland’s acquisition of its Canadian operations from Sherritt International where he held roles which included Director of Business Development and Chief Financial Officer for the coal division Currently Chief Financial Officer of Westmoreland’s Canadian operations Bachelor of Commerce degree with a major in Accounting from the University of Alberta; articled at Ernst & Young to complete his Chartered Accountant designation The Westmoreland Difference The Westmoreland Model Positioned to Drive Shareholder Value

15 WESTMORELAND COAL COMPANY Source: Management Note: Metrics based on improvements attained in the year following the acquisition; Productivity based on tons per man hour. Proven Record of Successful Acquisition Integration Acquired the Kemmerer Mine from Chevron in January 2012 Westmoreland management significantly enhanced financial performance, exceeding guidance Signed new labor agreement driving operational and productivity improvements Integration exceeded expectations with strong improvements in productivity, costs, and safety Acquired the Canadian operations from Sherritt in April 2014 Centralized and integrated all functions as of August 2015 Combined Boundary Dam and Bienfait mines into Estevan Implemented Westmoreland operating, capital and management philosophy Initiated dragline productivity program Integration of WMLP and Buckingham is underway with San Juan expected to follow in 2016 Productivity 18% Reportable Incidents 55% Labor Grievances 74% Mine Citations 51% Mining Cost per Ton 5% Westmoreland Improvements at the Kemmerer Mine Westmoreland Improvements at the Canadian Operations Dragline Productivity 17% Inventory Reduction 7% G&A Costs 34% Capex/Ton 22% Mining Cost per Ton 14% The Westmoreland Difference The Westmoreland Model Positioned to Drive Shareholder Value

16 WESTMORELAND COAL COMPANY 3.3x 3.7x 2.3x 3.5x 3.0x 3.8x 3.6x 2011 Kemmerer Acquisition 2013 Sherritt Coal Acquisition Pre-WMLP Acq. (30-Sep-14) Post-WMLP Acq. (30-Sep-14) 2014 Strong Cash Flow Generation Leads to Reduced Leverage Consistent cash flow generation due to long-term, cost-protected contracts Rapid delevering following acquisitions to targeted 2.5x - 3.0x levels Predictable cash flows allow acquisition leverage Improved capital structure flexibility in 2014 will reduce interest expenses by ~$20 million Rigorous internal budgeting process to minimize capital and operating costs Westmoreland delevering from future drop-downs Strong cash flow generation drives reduction in net leverage following acquisitions 1. As of 31-Jan-12. 2. Calculated using net debt figure pro forma for Sherritt transaction and pro forma LTM Adj. EBITDA figure as at 30-Sept-13. 3. Excludes impact of cash and debt held at WMLP; pro forma for $75 mm term loan upsize and Buckingham acquisition. 4. 2014 shown pro forma for a full year of Canada operations, $75 mm term loan upsize and Buckingham acquisition. (1) (2) (3) (4) Proven Record of Reducing Net Leverage Following Acquisitions (Net Debt / EBITDA) The Westmoreland Difference The Westmoreland Model Positioned to Drive Shareholder Value

17 WESTMORELAND COAL COMPANY EBITDA $215 Cash Adjustments - Historical Averages(2) ($22) Operating Cash Flow $194 Less: Maintenance Capex ($68) Unlevered FCF $126 Less: Interest Expense ($61) Levered FCF $65 Distribution from WMLP $4 Total FCF $69 Share Price $14.72 Unlevered FCF per Share $6.98 Levered FCF per Share $3.59 FCF Yield - Unlevered 47% FCF Yield - Levered 24% Source: Bloomberg, company filings, FactSet, Westmoreland Management Guidance Note: Westmoreland metrics based on midpoint of management guidance ranges. 1. Pre Kemmerer drop, WMLP not consolidated; cash generation reflected as dividend back to parent. 2. Includes pension, postretirement medical, reclamation and deferred revenue based on historical pro forma averages. Attractively Valued Investment Opportunities Westmoreland represents highly attractive value propositions Strong Free Cash Flow Yield at WLB(1) In US$ millions except per share amounts WMLP Yield (2015 Guidance) Distribution Per Unit $0.80 Unit Price $7.45 Current Yield 10.7% Currently impacted by cash flow drags: - Coal Valley (through 2017) - ROVA (through 2018) The Westmoreland Difference The Westmoreland Model Positioned to Drive Shareholder Value

18 WESTMORELAND COAL COMPANY Identified Value Drivers and Growth Projects 15-25 potential M&A opportunities that fit Westmoreland model Contract mining opportunities Continued procurement savings from consolidated buying power San Juan mine acquisition and integration Execution of MLP drop down strategy Export market potential Potential Indian Coal Tax Credit monetization Delevering benefit The Westmoreland Difference The Westmoreland Model Positioned to Drive Shareholder Value

19 WESTMORELAND COAL COMPANY WESTMORELAND COAL COMPANY WESTMORELAND RESOURCE PARTNERS Coal Sales (Mst) 52.5 - 56.0 3.5 - 4.0 56.0 - 60.0 Adjusted EBITDA (US$ mm) $200 - $230 $35 - $40 $235 - $270 Capex(1) (US$ mm) $66.0 - $82.0 $8.0 - $10.0 $74.0 - $92.0 Capex per Ton(1) (US$/ton) $1.26 - $1.46 $2.29 - $2.50 $1.32 - $1.53 Cash Reclamation (US$ mm) $4.5 - $7.0 Cash Interest (US$ mm) $16.4 - $16.4 Distributable Cash Flow (US$ mm) $6.1 - $6.6 Distributions (US$ mm) $5.0 - $5.0 Cash Flow After Distributions (US$ mm) $1.1 - $1.6 Pro Forma Distributions (US$ mm) 1.22x - 1.32x 1. Includes $7.5 million of capital expenditures related to the expansion of the activated carbon facility. 2015 Guidance Expect record coal sales and Adjusted EBITDA in 2015 Guidance reflects: Canadian dollar exchange rate of 0.80 (CAD:USD) Newcastle coal pricing of $65.00/metric ton Average 2015 PJM power prices of $45/MWh The Westmoreland Difference The Westmoreland Model Positioned to Drive Shareholder Value
