Attached files
| file | filename |
|---|---|
| 8-K - CURRENT REPORT - PennyMac Mortgage Investment Trust | pmt_8k.htm |
Exhibit 99.1

PennyMac Mortgage Investment Trust September 17, 2015 2015 Barclays Global Financial Services Conference
2015 Barclays Global Financial Services Conference 2 This presentation contains forward - looking statements within the meaning of Section 21 E of the Securities Exchange Act of 1934 , as amended, regarding management’s beliefs, estimates, projections and assumptions with respect to, among other things, the Company’s financial results, future operations, business plans and investment strategies, as well as industry and market conditions, all of which are subject to change . Words like “believe,” “expect,” “anticipate,” “promise,” “plan,” and other expressions or words of similar meanings, as well as future or conditional verbs such as “will,” “would,” “should,” “could,” or “may” are generally intended to identify forward - looking statements . Actual results and operations for any future period may vary materially from those projected herein, from past results discussed herein, or illustrative examples provided herein . Factors which could cause actual results to differ materially from historical results or those anticipated include, but are not limited to : changes in our investment objectives or investment or operational strategies ; volatility in our industry, the debt or equity markets, the general economy or the residential finance and real estate markets ; changes in general business, economic, market, employment and political conditions or in consumer confidence ; declines in residential real estate or significant changes in U . S . housing prices or activity in the U . S . housing market ; availability of, and level of competition for, attractive risk - adjusted investment opportunities in residential mortgage loans and mortgage - related assets that satisfy our investment objectives ; concentration of credit risks to which we are exposed ; the degree and nature of our competition ; our dependence on our manager and servicer, potential conflicts of interest with such entities, and the performance of such entities ; availability, terms and deployment of short - term and long - term capital ; unanticipated increases or volatility in financing and other costs ; the performance, financial condition and liquidity of borrowers ; incomplete or inaccurate information or documentation provided by customers or counterparties, or adverse changes in the financial condition of our customers and counterparties ; the quality and enforceability of the collateral documentation evidencing our ownership and rights in the assets in which we invest ; increased rates of delinquency, default and/or decreased recovery rates on our investments ; increased prepayments of the mortgages and other loans underlying our mortgage - backed securities and other investments ; the degree to which our hedging strategies may protect us from interest rate volatility ; our failure to maintain appropriate internal controls over financial reporting ; our ability to comply with various federal, state and local laws and regulations that govern our business ; changes in legislation or regulations or the occurrence of other events that impact the business, operations or prospects of government agencies, mortgage lenders and/or publicly - traded companies ; the creation of the Consumer Financial Protection Bureau, or CFPB, and enforcement of its rules ; changes in government support of homeownership ; changes in government or government - sponsored home affordability programs ; changes in governmental regulations, accounting treatment, tax rates and similar matters (including changes to laws governing the taxation of real estate investment trusts, or REITs ; limitations imposed on our business and our ability to satisfy complex rules for us to qualify as a REIT for U . S . federal income tax purposes and qualify for an exclusion from the Investment Company Act of 1940 and the ability of certain of our subsidiaries to qualify as REITs or as taxable REIT subsidiaries for U . S . federal income tax purposes and our ability and the ability of our subsidiaries to operate effectively within the limitations imposed by these rules ; and the effect of public opinion on our reputation . You should not place undue reliance on any forward - looking statement and should consider all of the uncertainties and risks described above, as well as those more fully discussed in reports and other documents filed by the Company with the Securities and Exchange Commission from time to time . The Company undertakes no obligation to publicly update or revise any forward - looking statements or any other information contained herein, and the statements made in this presentation are current as of the date of this presentation only . Forward - Looking Statements

PennyMac Mortgage Investment Trust Is a Unique Mortgage REIT 3 • Initial public offering in 2009 (NYSE: PMT); demonstrated track record of profitability and dividends to shareholders • PMT’s objective is to deliver superior investment returns over time from multiple mortgage - related strategies • Strategies enabled by our relationship with PennyMac Financial Services, Inc. (NYSE: PFSI) and its specialized operations and expertise • Originally focused on opportunistic investments in distressed whole loans • Recent capital deployment has favored newer strategies, e.g., – Interest rate sensitive strategies including Mortgage Servicing Rights (MSRs), Excess Servicing Spread (ESS) – GSE risk transfer on PMT’s loan production and small balance Commercial Real Estate Finance • Recently announced a share repurchase program as the market price of our common shares represents an attractive investment opportunity for PMT 2015 Barclays Global Financial Services Conference
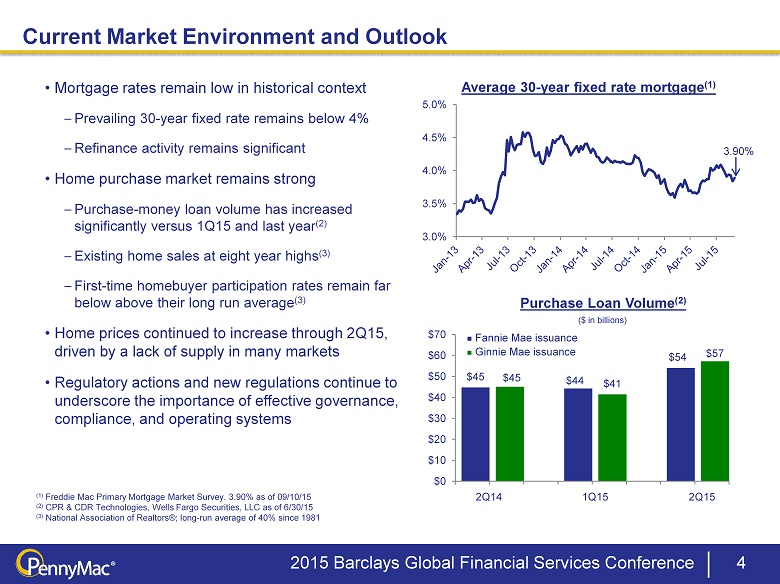
4 Current Market Environment and Outlook 2015 Barclays Global Financial Services Conference 3.0% 3.5% 4.0% 4.5% 5.0% Average 30 - year fixed rate mortgage (1) (1) Freddie Mac Primary Mortgage Market Survey. 3.90% as of 09/10/15 (2) CPR & CDR Technologies, Wells Fargo Securities, LLC as of 6/30/15 ( 3 ) National Association of Realtors®; long - run average of 40% since 1981 Purchase Loan Volume (2) 3.90% $45 $45 $44 $41 $54 $57 $0 $10 $20 $30 $40 $50 $60 $70 2Q14 2Q15 1Q15 ($ in billions) Ŷ Fannie Mae issuance Ŷ Ginnie Mae issuance • Mortgage rates remain low in historical context – Prevailing 30 - year fixed rate remains below 4% – Refinance activity remains significant • Home purchase market remains strong – Purchase - money loan volume has increased significantly versus 1Q15 and last year (2) – Existing home sales at eight year highs (3) – First - time homebuyer participation rates remain far below above their long run average (3 ) • Home prices continued to increase through 2Q15, driven by a lack of supply in many markets • Regulatory actions and new regulations continue to underscore the importance of effective governance, compliance, and operating systems
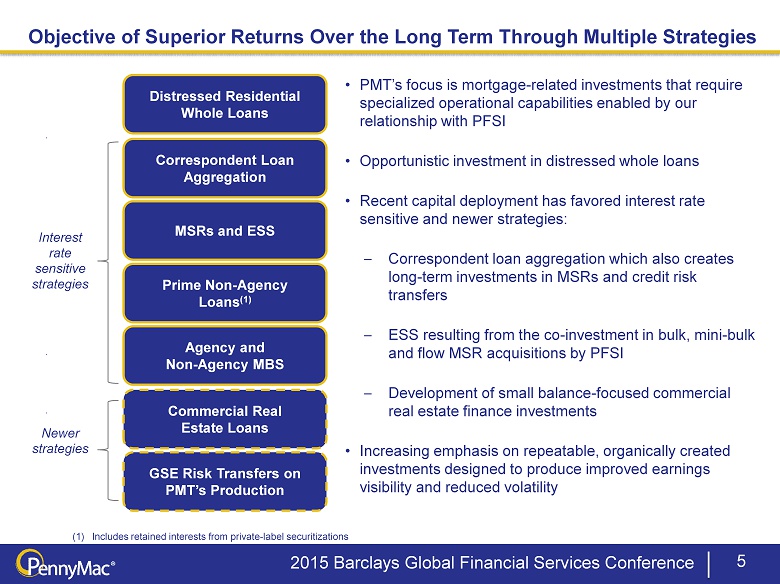
Objective of Superior Returns Over the Long Term Through Multiple Strategies 5 Correspondent Loan Aggregation MSRs and ESS Prime Non - Agency Loans (1) Commercial Real Estate Loans Distressed Residential Whole Loans • PMT’s focus is mortgage - related investments that require specialized operational capabilities enabled by our relationship with PFSI • Opportunistic investment in distressed whole loans • Recent capital deployment has favored interest rate sensitive and newer strategies: – Correspondent loan aggregation which also creates long - term investments in MSRs and credit risk transfers – ESS resulting from the co - investment in bulk, mini - bulk and flow MSR acquisitions by PFSI – Development of small balance - focused commercial real estate finance investments • Increasing emphasis on repeatable, organically created investments designed to produce improved earnings visibility and reduced volatility GSE Risk Transfers on PMT’s Production Agency and Non - Agency MBS Interest rate s ensitive strategies Newer strategies (1) Includes retained interests from private - label securitizations 2015 Barclays Global Financial Services Conference
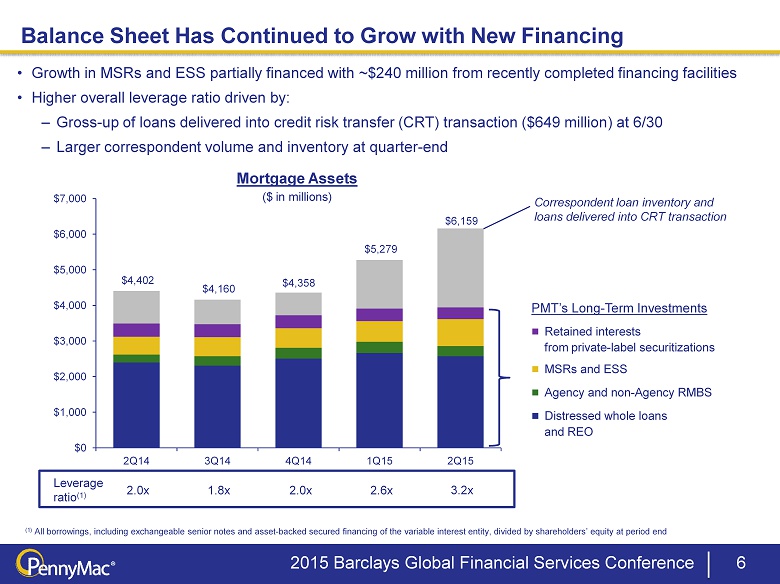
2015 Barclays Global Financial Services Conference Correspondent loan inventory and loans delivered into CRT transaction PMT’s L ong - Term Investments Ŷ Retained interests from private - label securitizations Ŷ MSRs and ESS Ŷ Agency and non - Agency RMBS Ŷ Distressed whole loans and REO 6 Balance Sheet Has Continued to Grow with New Financing Leverage ratio (1) 2.0x 1.8x 2 .0x 2.6x 3.2x (1) All borrowings, including exchangeable senior notes and asset - backed secured financing of the variable interest entity, divided by shareholders’ equity at period end Mortgage Assets ($ in millions) • Growth in MSRs and ESS partially financed with ~$240 million from recently completed financing facilities • Higher overall leverage ratio driven by: – Gross - up of loans delivered into credit risk transfer (CRT) transaction ($649 million) at 6/30 – Larger correspondent volume and inventory at quarter - end $4,402 $4,160 $4,358 $5,279 $6,159 $0 $1,000 $2,000 $3,000 $4,000 $5,000 $6,000 $7,000 2Q14 3Q14 4Q14 1Q15 2Q15
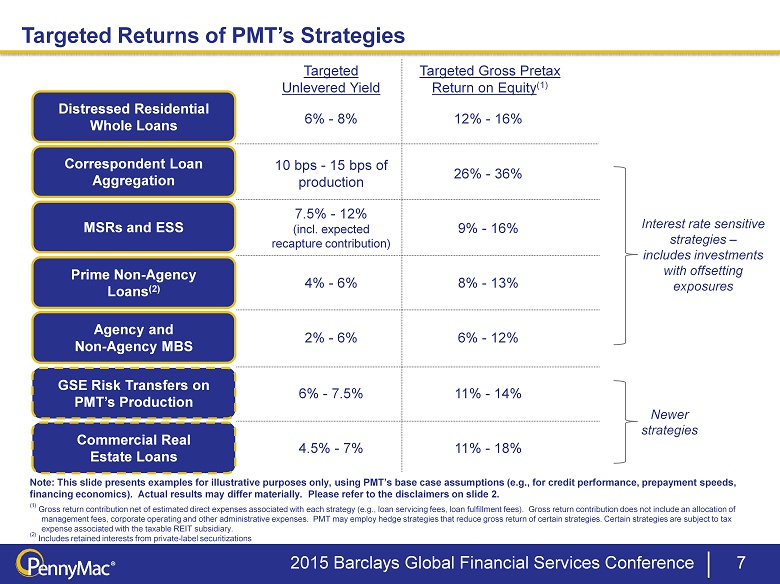
Targeted Returns of PMT’s Strategies 7 MSRs and ESS Prime Non - Agency Loans (2) Agency and Non - Agency MBS Distressed Residential Whole Loans Correspondent Loan Aggregation GSE Risk Transfers on PMT’s Production Commercial Real Estate Loans Targeted Unlevered Yield Targeted Gross Pretax Return on Equity (1) 6% - 8% 10 bps - 15 bps of production 4% - 6% 2% - 6% 7.5% - 12% (incl. expected recapture contribution) 6% - 7.5% 4.5% - 7% Note: This slide presents examples for illustrative purposes only, using PMT’s base case assumptions (e.g., for credit perfor man ce, prepayment speeds, financing economics). Actual results may differ materially. Please refer to the disclaimers on slide 2. (1) Gross return contribution net of estimated direct expenses associated with each strategy (e.g., loan servicing fees, loan ful fi llment fees). Gross return contribution does not include an allocation of management fees, corporate operating and other administrative expenses. PMT may employ hedge strategies that reduce gross retur n of certain strategies. Certain strategies are subject to tax expense associated with the taxable REIT subsidiary. (2) Includes retained interests from private - label securitizations 12% - 16% 26% - 36% 8% - 13% 6% - 12% 9% - 16% 11% - 14% 11% - 18% Newer strategies Interest rate sensitive strategies – i ncludes investments with offsetting exposures 2015 Barclays Global Financial Services Conference
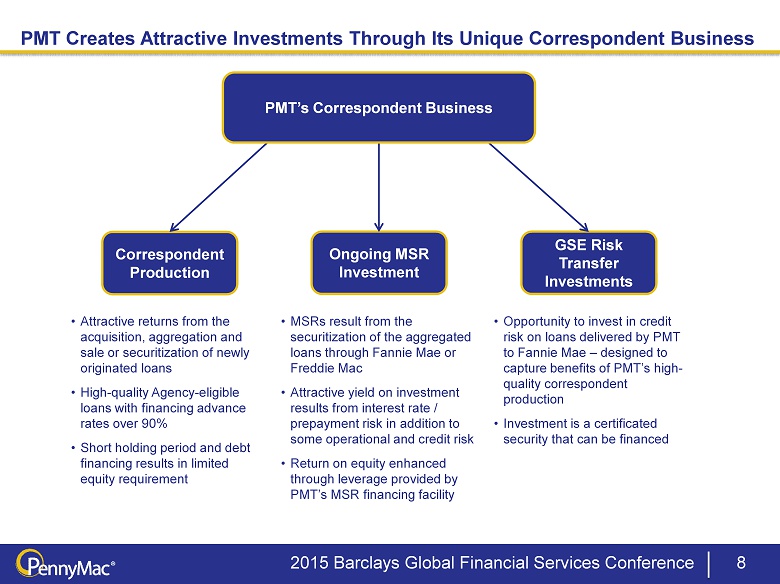
GSE Risk Transfer Investments Ongoing MSR Investment Correspondent Production PMT Creates Attractive Investments Through Its Unique Correspondent Business 8 • Opportunity to invest in credit risk on loans delivered by PMT to Fannie Mae – designed to capture benefits of PMT’s high - quality correspondent production • Investment is a certificated security that can be financed PMT’s Correspondent Business • Attractive returns from the acquisition, aggregation and sale or securitization of newly originated loans • High - quality Agency - eligible loans with financing advance rates over 90 % • Short holding period and debt financing results in limited equity requirement • MSRs result from the securitization of the aggregated loans through Fannie Mae or Freddie Mac • Attractive yield on investment results from interest rate / prepayment risk in addition to some operational and credit risk • Return on equity enhanced through leverage provided by PMT’s MSR financing facility 2015 Barclays Global Financial Services Conference
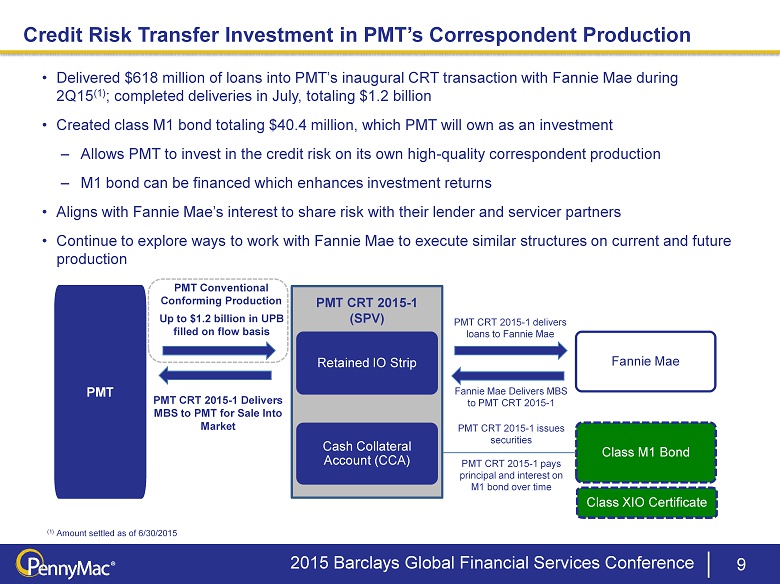
Credit Risk Transfer Investment in PMT’s Correspondent Production 9 • Delivered $618 million of loans into PMT’s inaugural CRT transaction with Fannie Mae during 2Q15 (1) ; completed deliveries in July, totaling $1.2 billion • Created class M1 bond totaling $40.4 million, which PMT will own as an investment – Allows PMT to invest in the credit risk on its own high - quality correspondent production – M1 bond can be financed which enhances investment returns • Aligns with Fannie Mae’s interest to share risk with their lender and servicer partners • Continue to explore ways to work with Fannie Mae to execute similar structures on current and future production (1) Amount settled as of 6/30/2015 PMT CRT 2015 - 1 (SPV) PMT Conventional Conforming Production Retained IO Strip Fannie Mae Cash Collateral Account (CCA) Class M1 Bond PMT CRT 2015 - 1 delivers loans to Fannie Mae PMT CRT 2015 - 1 pays principal and interest on M1 bond over time PMT CRT 2015 - 1 issues securities Up to $1.2 billion in UPB filled on flow basis PMT CRT 2015 - 1 Delivers MBS to PMT for Sale Into Market PMT Fannie Mae Delivers MBS to PMT CRT 2015 - 1 Class XIO Certificate 2015 Barclays Global Financial Services Conference
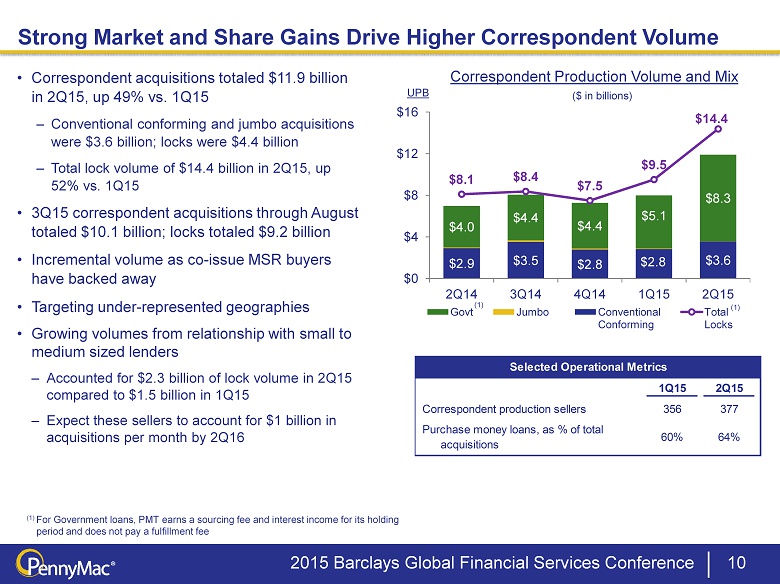
$2.9 $3.5 $2.8 $2.8 $3.6 $4.0 $4.4 $4.4 $5.1 $8.3 $8.1 $8.4 $7.5 $9.5 $14.4 $0 $4 $8 $12 $16 2Q14 3Q14 4Q14 1Q15 2Q15 Govt Jumbo Conventional Conforming Total Locks • Correspondent acquisitions totaled $11.9 billion in 2Q15, up 49% vs. 1Q15 – Conventional conforming and jumbo acquisitions were $3.6 billion; locks were $4.4 billion – Total lock volume of $14.4 billion in 2Q15, up 52% vs. 1Q15 • 3Q15 correspondent acquisitions through August totaled $10.1 billion ; locks totaled $9.2 billion • Incremental volume as co - issue MSR buyers have backed away • Targeting under - represented geographies • Growing volumes from relationship with small to medium sized lenders – Accounted for $2.3 billion of lock volume in 2Q15 compared to $1.5 b illion in 1Q15 – Expect these sellers to account for $ 1 billion in acquisitions per month by 2Q16 Correspondent Production Volume and Mix Strong Market and Share Gains Drive Higher Correspondent Volume (1) For Government loans, PMT earns a sourcing fee and interest income for its holding period and does not pay a fulfillment fee ($ in billions) UPB (1) (1) 10 Correspondent production sellers Selected Operational Metrics 2Q15 377 1Q15 356 Purchase money loans, as % of total acquisitions 60% 64% 2015 Barclays Global Financial Services Conference
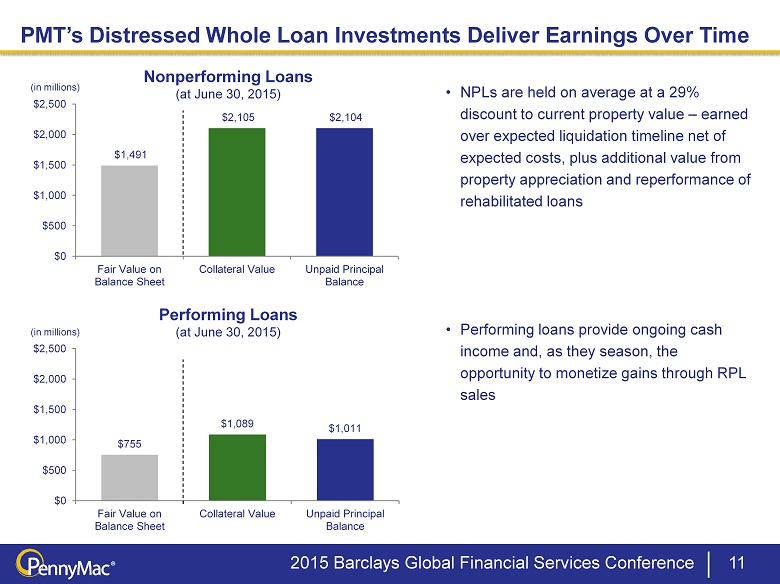
$755 $1,089 $1,011 $0 $500 $1,000 $1,500 $2,000 $2,500 Fair Value on Balance Sheet Collateral Value Unpaid Principal Balance $1,491 $2,105 $2,104 $0 $500 $1,000 $1,500 $2,000 $2,500 Fair Value on Balance Sheet Collateral Value Unpaid Principal Balance 11 Nonperforming Loans (at June 30, 2015) Performing Loans (at June 30, 2015) • NPLs are held on average at a 29% discount to current property value – earned over expected liquidation timeline net of expected costs, plus additional value from property appreciation and reperformance of rehabilitated loans • Performing loans provide ongoing cash income and, as they season, the opportunity to monetize gains through RPL sales PMT’s Distressed Whole Loan Investments Deliver Earnings Over Time (in millions) (in millions) 2015 Barclays Global Financial Services Conference

Significant Growth in MSR and ESS Investments 12 ($ in millions) • Continued portfolio growth as investments in MSR and ESS reached $754 million, related to underlying loans with a UPB of $82.7 billion, at June 30, 2015 – Organic MSR investments resulting from correspondent production activity reached $395 million, up from $359 million at March 31, 2015 – ESS investments resulting from bulk, mini - bulk and flow MSR acquisitions by PFSI reached $359 million, up from $222 million at March 31, 2015 MSR and ESS Assets at Period End Carrying value on balance sheet Related UPB Ŷ MSRs Ŷ Excess servicing spread (ESS) Ŷ UPB (right axis) $506 $533 $549 $581 $754 $40,000 $50,000 $60,000 $70,000 $80,000 $90,000 $0 $100 $200 $300 $400 $500 $600 $700 $800 2Q14 3Q14 4Q14 1Q15 2Q15 2015 Barclays Global Financial Services Conference

PennyMac Mortgage Investment Trust September 17, 2015 2015 Barclays Global Financial Services Conference