Attached files
| file | filename |
|---|---|
| 8-K - FORM 8-K - PUBLIC SERVICE ENTERPRISE GROUP INC | d98518d8k.htm |
 Forward-Looking Statement Certain of the matters discussed in this report about our and our subsidiaries' future performance, including, without limitation, future revenues, earnings, strategies, prospects, consequences and all other statements that are not purely historical constitute “forward-looking statements” within the meaning of the Private Securities Litigation Reform Act of 1995. Such forward-looking statements are subject to risks and uncertainties, which could cause actual results to differ materially from those anticipated. Such statements are based on management's beliefs as well as assumptions made by and information currently available to management. When used herein, the words “anticipate,” “intend,” “estimate,” “believe,” “expect,” “plan,” “should,” “hypothetical,” “potential,” “forecast,” “project,” variations of such words and similar expressions are intended to identify forward-looking statements. Factors that may cause actual results to differ are often presented with the forward-looking statements themselves. Other factors that could cause actual results to differ materially from those contemplated in any forward-looking statements made by us herein are discussed in filings we make with the United States Securities and Exchange Commission (SEC), including our Annual Report on Form 10-K and subsequent reports on Form 10-Q and Form 8-K and available on our website: http://www.pseg.com. These factors include, but are not limited to: • adverse changes in the demand for or the price of the capacity and energy that we sell into wholesale electricity
markets, •
adverse changes in energy industry law, policies and regulation,
including market structures and transmission planning, • any inability of our transmission and distribution businesses to obtain adequate and timely rate relief and regulatory
approvals from federal and state regulators,
•
changes in federal and state environmental regulations and
enforcement that could increase our costs or limit our operations, • changes in nuclear regulation and/or general developments in the nuclear power industry, including various impacts from
any accidents or incidents experienced at our facilities or by others in the industry, that could limit operations of our nuclear generating units,
•
actions or activities at one of our nuclear units located on a
multi-unit site that might adversely affect our ability to continue to operate that unit or other units located at the same site, • any inability to manage our energy obligations, available supply and risks,
• adverse outcomes of any legal, regulatory or other proceeding, settlement, investigation or claim applicable to us and/or the energy industry, • any deterioration in our credit quality or the credit quality of our counterparties,
•
availability of capital and credit at commercially reasonable
terms and conditions and our ability to meet cash needs, • changes in the cost of, or interruption in the supply of, fuel and other commodities necessary to the operation of our
generating units, •
delays in receipt of necessary permits and approvals for our
construction and development activities,
•
delays or unforeseen cost escalations in our construction and
development activities, •
any inability to achieve, or continue to sustain, our expected
levels of operating performance,
•
any equipment failures, accidents, severe weather events or
other incidents that impact our ability to provide safe and reliable service to our customers, and any inability to obtain sufficient insurance coverage or recover proceeds of insurance with respect to such events,
•
acts of terrorism, cybersecurity attacks or intrusions that
could adversely impact our businesses,
•
increases in competition in energy supply markets as well as for
transmission projects, •
any inability to realize anticipated tax benefits or retain tax
credits, •
challenges associated with recruitment and/or retention of a
qualified workforce, •
adverse performance of our decommissioning and defined benefit
plan trust fund investments and changes in funding requirements, • changes in technology, such as distributed generation and micro grids, and greater reliance on these technologies, and
•
changes in customer behaviors, including increases in energy
efficiency, net-metering and demand response.
All of the forward-looking statements made in this report
are qualified by these cautionary statements and we cannot assure you that the results or developments anticipated by management will be realized or even if realized, will have the expected consequences to, or effects on, us or our business prospects,
financial condition or results of operations. Readers are cautioned not to place undue reliance on these forward-looking statements in making any investment decision. Forward-looking statements made in
this report apply only as of the date of this report. While we may elect to update forward-looking statements from time to time, we specifically disclaim any obligation to do so, even if internal
estimates change, unless otherwise required by applicable securities laws. The forward-looking statements contained in this report are intended to qualify for the safe harbor provisions of Section 27A of the Securities Act of 1933, as amended, and Section 21E of the Securities Exchange Act of 1934, as amended. 2 EXHIBIT 99 |
 GAAP Disclaimer These materials and other financial releases can be found on the pseg.com
website under the investor tab, or at
http://investor.pseg.com/ PSEG presents Operating
Earnings and Adjusted Earnings Before Interest, Taxes, Depreciation and Amortization (EBITDA) in addition to its Income from Continuing Operations/Net Income reported in
accordance with accounting principles generally accepted in the
United States (GAAP). Operating Earnings and
Adjusted EBITDA are non-GAAP financial measures that differ from Income from Continuing Operations/Net Income. Operating Earnings exclude gains or losses associated with Nuclear
Decommissioning Trust (NDT), Mark-to-Market (MTM)
accounting, and other material one-time items. PSEG presents Operating Earnings because management believes that it is appropriate for investors to consider
results excluding these items in addition to the results
reported in accordance with GAAP. PSEG believes
that the non-GAAP financial measure of Operating Earnings provides a consistent and comparable measure of performance of its businesses to help shareholders understand performance trends.
PSEG is presenting Adjusted EBITDA because it provides investors
with additional information to compare our
business performance to other companies and understand
performance trends. Adjusted EBITDA excludes the
same items as our Operating Earnings measure as well as income tax expense, interest expense, depreciation and amortization and major maintenance expense costs at Power’s fossil generation facilities.
This
information
is
not
intended
to
be
viewed
as
an
alternative
to
GAAP
information.
The
last
three
slides
in
this presentation (Slides A, B and C) include a list of items
excluded from Income from Continuing
Operations/Net Income to reconcile to Operating Earnings and
Adjusted EBITDA with a reference to that slide
included on each of the slides where the non-GAAP
information appears. 3
|
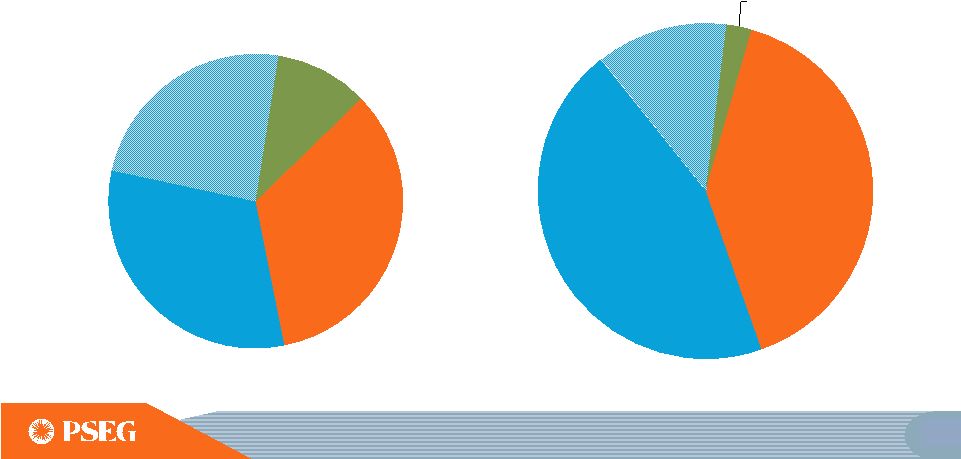
 Two complementary businesses A stable platform, each with growth opportunities Strategy: Investment program enhances competitive position with addition of efficient CCGT capacity Value Proposition: Provides substantial free cash flow in current environment and upside from market rule improvements Assets $12B Operating Earnings $642M Regional Competitive Generation Strategy: Investments aligned with public policy and customer needs Value Proposition: A $12 billion infrastructure program – focused on transmission – produces double-digit rate base growth through 2019 Assets $22B Operating Earnings $725M Electric & Gas Delivery and Transmission 2014 2014 ASSETS AND OPERATING EARNINGS ARE FOR THE YEAR ENDED 12/31/2014. PSE&G AND POWER DO NOT ADD TO TOTAL DUE TO PARENT AND PSEG LONG ISLAND ACTIVITY. SEE SLIDE A FOR ITEMS EXCLUDED FROM INCOME FROM CONTINUING OPERATIONS/NET INCOME TO RECONCILE TO OPERATING EARNINGS. 6 |
 Delivering on commitments and realizing growth Operational Excellence • PSE&G: Mid-Atlantic Reliability Award (13 th consecutive year), top ranked among eastern electric and gas utilities in business customer satisfaction • PSEG Power: Record output from combined cycle units • PSEG Long Island: Demonstrated management and integration capability through a successful transition in first year • PSEG: Cost-control benefits continue Financial Strength • Updated operating earnings guidance for 2015 to $2.80-$2.95 per share from $2.75-$2.95 per share • Cash flows and business mix support strong credit ratings and ability to fully fund robust investment pipeline without issuing new equity
• Increased rate of dividend growth in 2015 Disciplined Investment • PSE&G Capital program = rate base growth of 11% over 5 years with increased
investment in Transmission; Electric and Gas distribution; and
Gas System Modernization
Program •
Power: Keys & Sewaren CCGTs, uprates, PennEast
Pipeline, and Solar Source 7
|
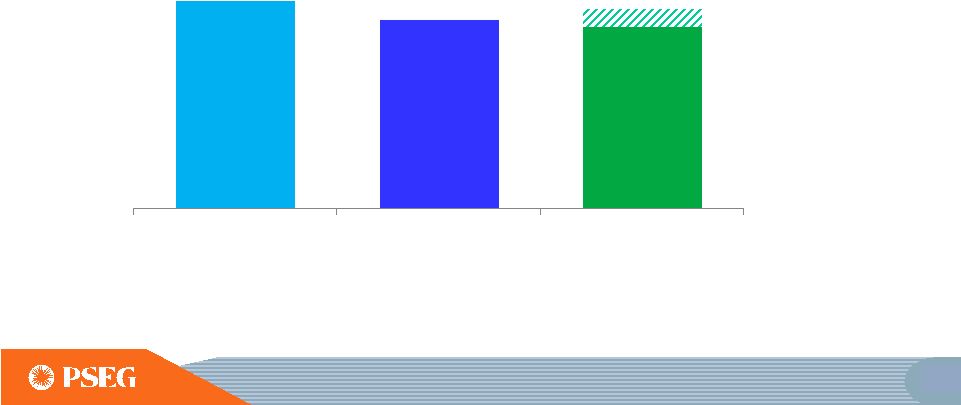
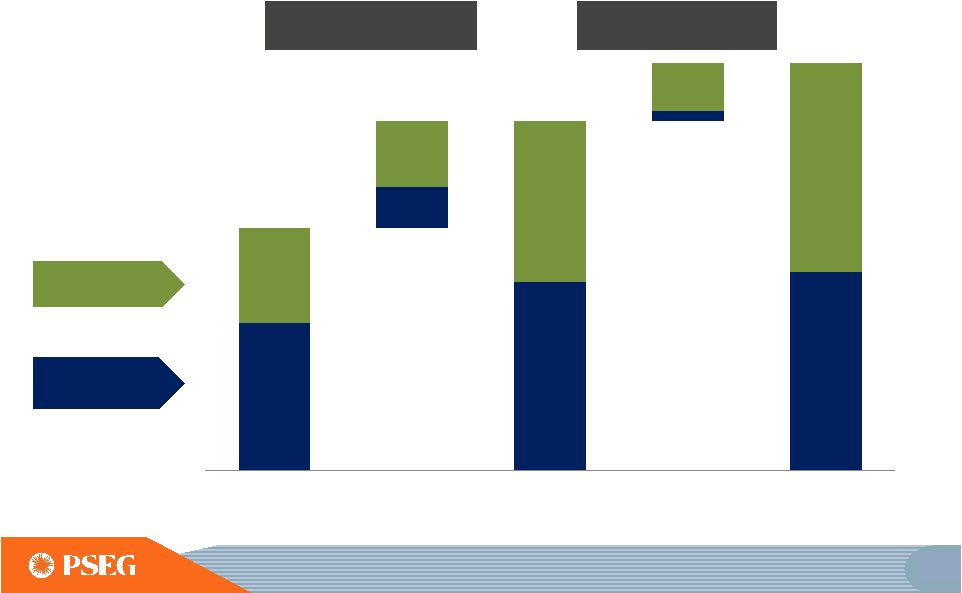
 Robust pipeline of investment opportunities supports >20% growth in capital spending over the period
2015E -
2019E*: $15.6Billion
2010 –
2014: $12.6 Billion
Power Total***
$2.7B
PSE&G Total
$9.8B
PSE&G Total
$11.8B
PSEG Capital Spending
Power Total***
$3.6B
*INCLUDES
ALL
PLANNED
SPENDING.
**ENERGY
STRONG
EXCLUDES
RISK
AND
CONTINGENCY.
***POWER
CAPITAL
SPENDING
EXCLUDES
NUCLEAR
FUEL.
****INCLUDES
PENNEAST
PIPELINE
EQUITY
INVESTMENT
OF
$0.1B.
E=ESTIMATE.
DATA
AS
OF
SEPTEMBER
2015.
8 |
 Balance sheet strength supports capital allocation Timeframe Actions taken 2010 – 2014: Transformed business mix • Applied $16 billion towards investments and dividends • Improved credit ratings • Monetized Energy Holdings’ portfolio • Strong balance sheet sustained during period of low power
prices, while increasing the dividend
2015 –
Forward:
Strong financial
position supports
continued growth
• Increased rate of dividend growth in 2015 • $15.5 billion+ investment program through 2019 • Gas System Modernization Program settlement of ~ $900 million of capital investment through 2019 • Financial capability supports further expansion of the current capital plan 9 |
 PSE&G’s robust capital investment pipeline drives double-digit rate base growth through 2019 E=ESTIMATE PSE&G Capital Projects • Planned capital spend supports high single digit earnings growth at PSE&G through 2017 • Transmission expected to grow to >50% of rate base in 2019 • Seeking to broaden platform to expand energy efficiency and other investments 12 |
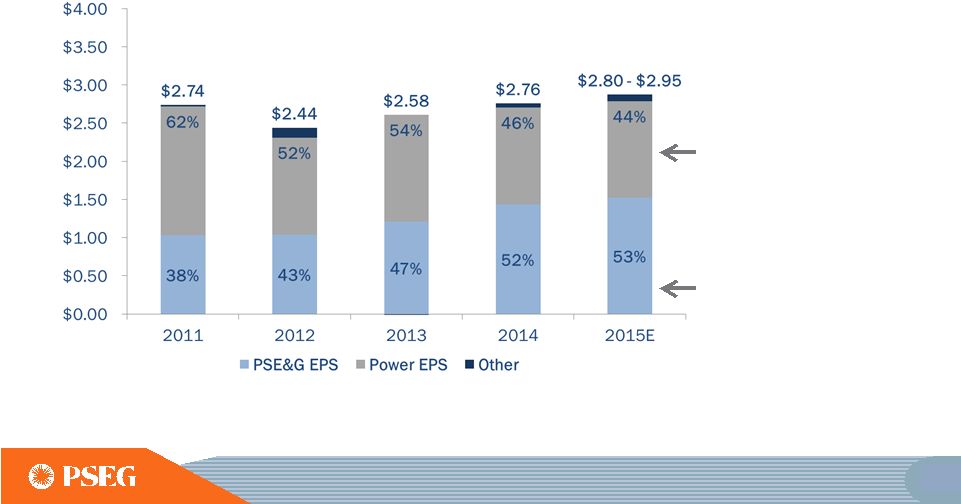 Operating Earnings Disciplined investment program and focus on operational excellence have supported growth Power’s diverse fuel mix and dispatch flexibility continue to generate strong earnings and free cash flow in low price environment PSE&G’s investment program has driven double digit compound annual earnings growth since 2010 Operating Earnings* Contribution by Subsidiary *SEE SLIDE A FOR
ITEMS EXCLUDED FROM INCOME FROM CONTINUING OPERATIONS/ NET INCOME TO RECONCILE TO OPERATING EARNINGS. E=ESTIMATE
** 2015 PERCENTS USE MIDPOINT OF UPDATED EARNINGS
GUIDANCE. **
**
15 |
 PSE&G plans to invest $11.8B over the
next five years
Distribution
34%
Other
Transmission
32%
Major
Transmission
Incentive
Projects
24%
Solar/Energy
Efficiency
10%
2010-2014
$9.8B
PSE&G’s Capital Expenditures*
Distribution
40%
Other
Transmission
45%
Major
Transmission
Incentive
Projects
13%
Solar/Energy
Efficiency
2%
2015-2019E
$11.8B
*INCLUDES AFUDC.
E=ESTIMATE. 25
|
 PSE&G has successfully worked with regulators to develop multiple solutions for New
Jersey’s energy and economic
development goals •
Solar Loan I
–
2008
• Solar Loan II – 2009 • Solar 4 All – 2009 • Solar Loan III – 2013 • Solar 4 All Ext – 2013 RENEWABLES creative solutions to install solar generation • Carbon Abatement – 2008 • Demand Response – 2009 • Energy Efficiency (EE) – 2009 • EE Extension – 2011 • EE Extension II – 2015 ENERGY EFFICIENCY assisting customers with controlling energy usage • NJ Capital Infrastructure Program 1 (CIP 1) – 2009 • NJ Capital Infrastructure Program 2 (CIP 2) – 2011 • Energy Strong – 2014 DISTRIBUTION improving electric and gas delivery infrastructure To date we have invested over $2B in the above programs Over $1B ahead in Energy Strong, Energy Efficiency Ext II and Solar programs Gas System (GSMP) settlement increases investment by ~$900M through 2019 30 |
 Settlement reached on Gas System Modernization Program for ~$900 million over three years • Agreement in principle reached with Staff of the NJBPU and the Division of Rate Counsel • GSMP is the next phase of a long-term, cast iron and unprotected steel replacement strategy • Three-year program with total capital investment of $905 million, beginning January 2016 The program provides for investment of $650M recovered through a clause similar to the Energy Strong program – with a 9.75% ROE Additional capital investment of $255M to be recovered in rate case scheduled to be filed November 2017 32 |
 Traditional Recovery Mechanisms Distribution Base Rates FERC Formula Rates Transmission PSE&G continues to receive contemporaneous/ formula rate recovery on ~70% of its investment program 20% 56% 24% 2010-2014 PSE&G Capital Spending by Recovery Method $9.8B Clause Recovery Mechanisms Energy Strong / GSMP / Infrastructure / Solar / Energy Efficiency 15% 57% 28% 2015-2019E PSE&G Capital by Recovery Method $11.8B E = ESTIMATE. DATA AS OF SEPTEMBER 2015. 33 |
 PSE&G’s 2015 operating earnings expected to benefit from increased investment in Transmission
$612
$725
2013
2014
2015 Guidance
PSE&G Operating Earnings*
($ Millions)
$760 --
$775E**
*SEE SLIDE A FOR ITEMS EXCLUDED
FROM NET INCOME TO RECONCILE TO OPERATING EARNINGS. E =ESTIMATE. **UPDATED GUIDANCE ON JULY 31, 2015.
35 |
 Power’s 2015 operating earnings maintain solid performance Power Operating Earnings* ($ Millions) 2013 2014 2015 Guidance $710 $642 $620 – $680E 2015 Observations • Increase in average hedge price for energy helps mitigate reset in capacity price and volume * SEE SLIDE A FOR ITEMS EXCLUDED FROM NET INCOME TO RECONCILE TO OPERATING EARNINGS. E
= ESTIMATE. 61
|
 … Recent capacity auctions provide for growth in capacity revenue into 2019
Capacity Market Pricing:
~98% of Power’s PJM fleet that cleared the 2018/2019 RPM auction met the new
CP standards RPM – Auction Results Delivery Year 2015 / 2016* 2016 / 2017*+ 2017 / 2018+ 2018 / 2019 Power’s Average Prices*($/MW-day) $168 $172 $177 $215 RTO Prices ($/MW-day) $136 $59 $120 $165/$150 (CP/Base) Power’s Cleared Capacity (MW) 8,750 8,700 8,700 8,650 PJM Capacity Revenues ($ Millions) Calendar Year 2016 2017 2018 Through 5/31/19 Capacity Revenues $542 $555 $631 $281 *PSEG POWER’S AVERAGE PRICES AND CLEARED CAPACITY (MW) REFLECT BASE AND INCREMENTAL AUCTIONS.
DELIVERY YEAR RUNS FROM JUNE 1 TO MAY 31 OF THE NEXT CALENDAR
YEAR. + INCLUDES CP TRANSITION AUCTION RESULTS FOR
‘16/’17 AND ‘17/’18 AS OF
SEPTEMBER 10, 2015. 2018/2019 RPM Auction
Highlights • Cleared new 540 MW
Sewaren 7 CCGT • EMAAC
separated • CP reflects cost to
meet new performance obligation •
CP construct favors portfolio approach
69 |
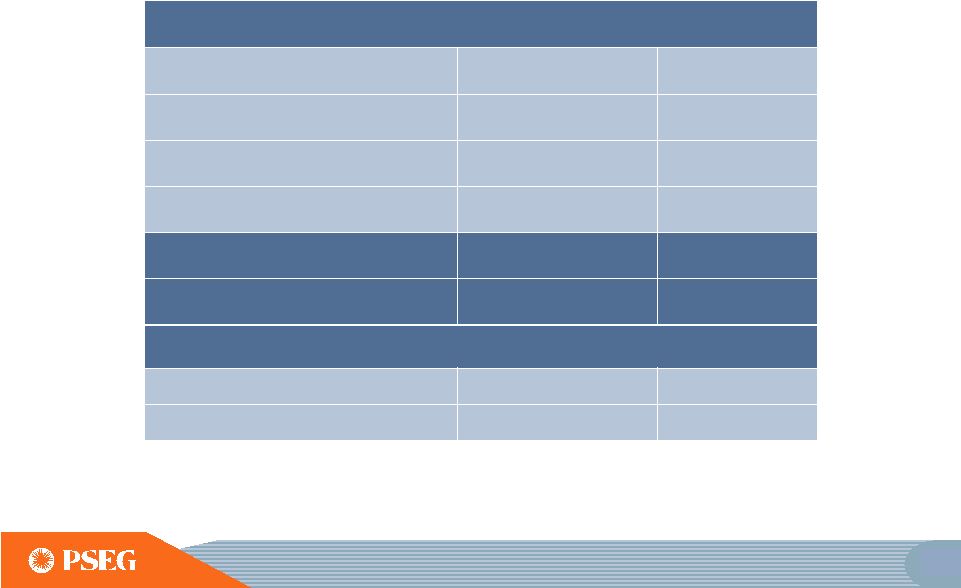 PSEG 2015 Updated Guidance for Operating Income – by Subsidiary, and PSEG Power Adjusted EBITDA Anticipates Another Year of Growth in Operating Earnings $ millions (except EPS) 2015E 2014 PSE&G $760 - $775 $725 PSEG Power $620 - $680 $642 PSEG Enterprise/Other $40 - $45 $33 Operating Earnings*
$1,420 -
$1,500
$1,400
Earnings per Share
$2.80 -
$2.95E
$2.76
PSEG Power Adjusted EBITDA**
$ millions (except EPS)
2015E
2014
PSEG Power
$1,545 -
$1,645
$1,584
* SEE SLIDE A FOR ITEMS EXCLUDED FROM NET INCOME TO
RECONCILE TO OPERATING EARNINGS; INCLUDES THE FINANCIAL IMPACT FROM MARK-TO-MARKET POSITIONS WITH FORWARD DELIVERY MONTHS.
** SEE SLIDE B FOR A RECONCILIATION OF ADJUSTED EBITDA TO
OPERATING EARNINGS AND NET INCOME. E = ESTIMATE. 75 |
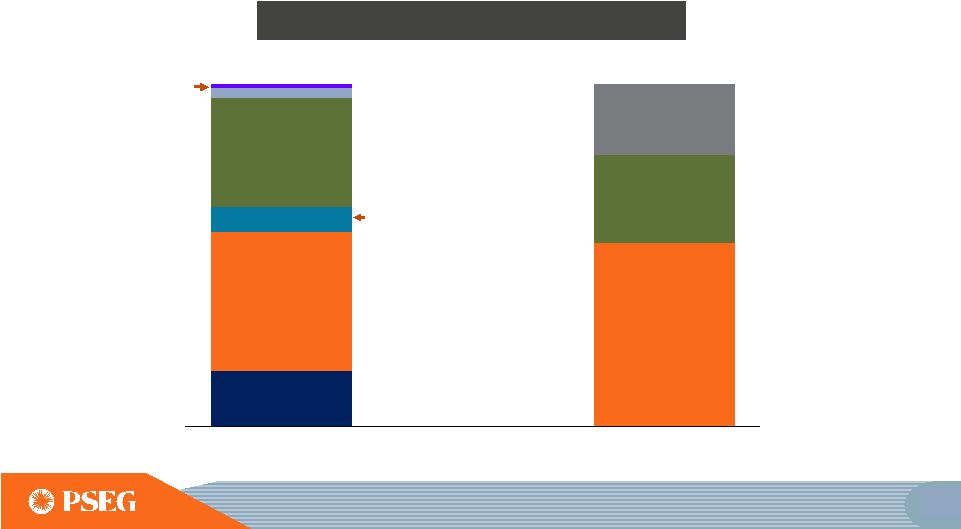
 ~$1.6B ~$2.2B ~$2.2B ~$2.8B ~$6.8B ~$15.6B PSEG 2015– 2019E Capital Expenditures (1) PSEG growth spend
represents ~75% of total investment Power & Other Maintenance PSE&G Distribution Maintenance Power Growth PSE&G Transmission Growth PSE&G Distribution Growth Planned Growth Investment ~$11.8B PSEG Planned Spend Maintenance ~$3.8B (1) INCLUDES AFUDC AND IDC, GAS SYSTEM MODERNIZATION PROGRAM, KEYS ENERGY CENTER, SEWAREN, PENNEAST
PIPELINE EQUITY INVESTMENT OF~$0.1B IS INCLUDED IN POWER
GROWTH. E = ESTIMATE.
76 |
 2014 – 2017E Rate Base CAGR Growth of ~13% Distribution Transmission PSE&G’s Capital Program drives
double-digit growth in rate base through 2019 ~$11.4B ~$16.5B ~$6.9B ~$4.5B ~$2.2B ~$9.8B ~$3.1B ~$9.4B Rate Base Growth ~$0.5B 2014 Rate Base Planned 2017E Rate Base Planned 2019E Rate Base ~$2.0B ~$8.9B ~$7.6B ~$19.2B 2014 – 2019E Rate Base CAGR Growth of ~11% Rate Base Growth E = ESTIMATE INCLUDES GAS SYSTEM MODERNIZATION PROGRAM 77 |
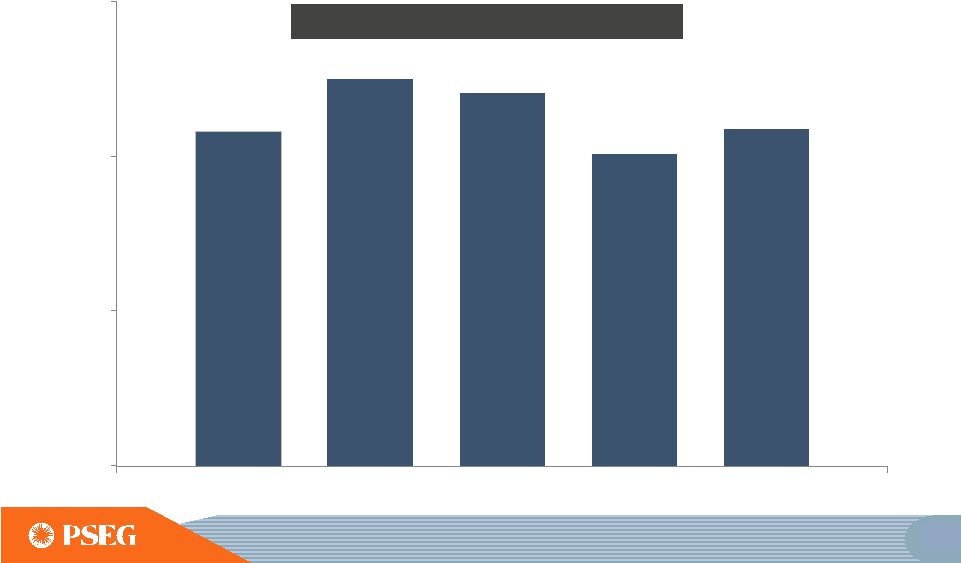 0% 5% 10% 15% Continuing our track record of 5 year double digit rate base growth leading to high single-digit growth in
earnings through 2017
2010 –
2015E
PSE&G 5 Year Rate Base CAGR
2011 –
2016E
2012 –
2017E
2013 –
2018E
2014 –
2019E
~11%
~13%
~12%
~10%
~11%
E = ESTIMATE
INCLUDES GAS SYSTEM MODERNIZATION PROGRAM
78 |
 PSEG 2015 - 2019E Sources and Uses Sources Uses PSE&G Cash from Ops (1) PSE&G Cash Investment PSE&G Net Debt Shareholder Dividend Power Cash from Ops Power Net Debt Other Cash Flow (2) Parent Long-Term Debt Power Cash Investment (3) Utilizing financial strength to issue debt
at the parent level in support of regulated growth
79
INCLUDES KEYS ENERGY CENTER, SEWAREN, GAS SYSTEM MODERNIZATION
PROGRAM (1) PSE&G CASH
FROM OPERATIONS ADJUSTS FOR SECURITIZATION PRINCIPAL REPAYMENTS OF ~$260M FROM 2015-2019 (2) OTHER CASH FLOW INCLUDES PSEG LI, HOLDINGS NET CASH FLOW, INVESTED CASH, AND PARENT SHORT-TERM DEBT (3)
POWER CASH INVESTMENT INCLUDES NUCLEAR FUEL AND EMISSION
PURCHASES E = ESTIMATES. |
 Total Incremental Investment Capacity through 2017 Substantial Investment Capacity to pursue
additional growth without the need for equity*
$0.0
$3.0
Power
Parent
Total
($ Billions)
Power
PSEG
Estimate
~ 50%
~27%
Minimum
Threshold
30%
~20%
Average Funds from Operations /Debt
2015 -
2017
*INCLUDES KEYS ENERGY CENTER, SEWAREN, GAS SYSTEM MODERNIZATION
PROGRAM. E= ESTIMATE Our incremental
investment capacity can support growth at both
PSE&G and Power
81 |
 PSEG Summary • Continued third year of anticipated positive earnings trend in 2015 with
updated operating earnings guidance of $2.80 to $2.95 per
share •
Continued 5
th
straight year of expected double digit, 5-year growth in
rate base •
Anticipated high single digit earnings growth at PSE&G on a
three-year basis from 2014 to 2017, driven by
transmission investments and planned programs •
Power’s continued focus on operational excellence, market
expertise and financial strength delivers value in
current price environment •
Power realigning its portfolio with new, efficient CCGT
investments in MD and NJ •
Strong Balance Sheet and Cash Flow support PSE&G’s
capital program and Power’s new investment
opportunities without the need for equity •
Our $0.08 per share dividend increase for 2015 is consistent
with our long history of returning cash to the
shareholder through the common dividend, with
potential for consistent and sustainable growth
84 |
 PSEG Power’s Adjusted EBITDA - Q2 2015, YTD and Full-Year 2015 Guidance Three Months
Ended June 30,
Six Months (YTD)
Ended June 30,
Full-Year 2015
Guidance
($ in millions)
2015
2014
2015
2014
Low
High
Operating Earnings**
$110
$87
$388
$380
$620
$680
Add:
Fossil Major Maintenance, pre-tax
52
49
101
107
115
115
Depreciation & Amortization, pre-tax
75
73
152
146
305
305
Interest Expense, pre-tax
32
29
63
60
125
125
Income Taxes
32
38
223
234
380
420
Adjusted EBITDA
$301
$276
$927
$927
$1,545E
$1,645E
PSEG Power - Adjusted EBITDA* * SEE SLIDE B FOR A RECONCILIATION OF ADJUSTED EBITDA TO OPERATING EARNINGS AND NET INCOME.
E = ESTIMATE. ** SEE
SLIDE
A
FOR
ITEMS
EXCLUDED
FROM
NET
INCOME
TO
RECONCILE
TO
OPERATING
EARNINGS;
INCLUDES
THE
FINANCIAL
IMPACT
FROM
MARK-TO-MARKET POSITIONS WITH FORWARD DELIVERY
MONTHS. 94 |
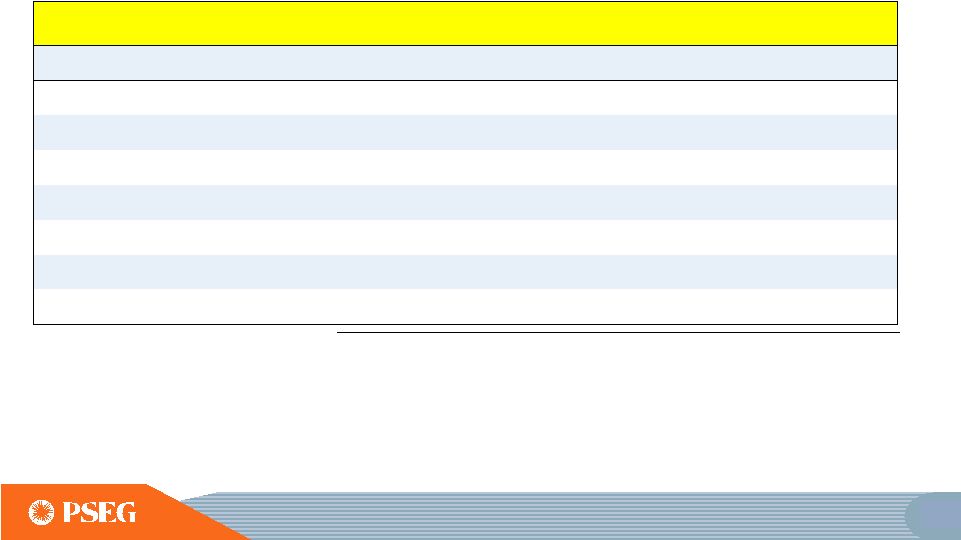
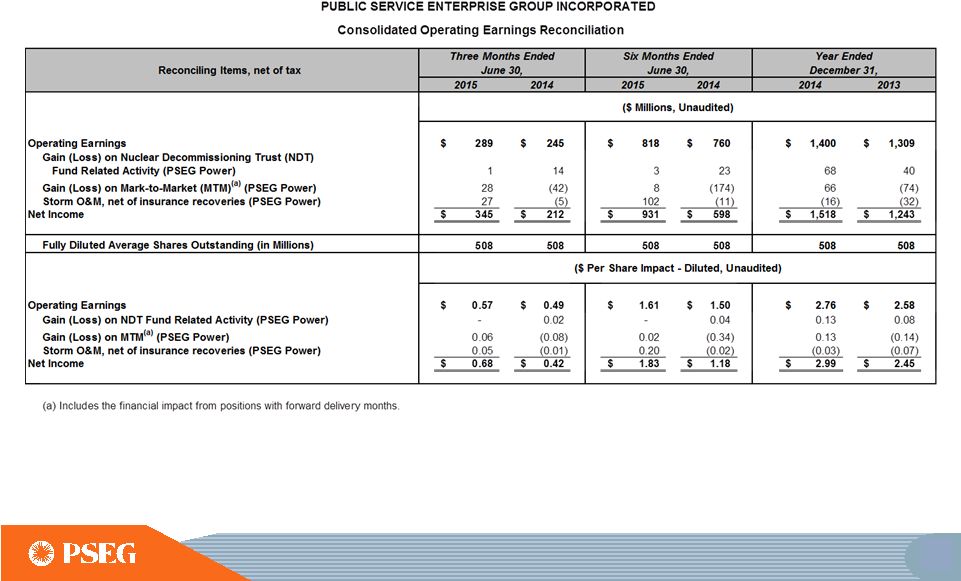
 Items Excluded from Income from Continuing Operations/Net Income to Reconcile to Operating Earnings PLEASE SEE PAGE 3 FOR AN EXPLANATION OF PSEG’S USE OF OPERATING EARNINGS AS A NON-GAAP FINANCIAL MEASURE AND HOW
IT DIFFERS FROM NET INCOME.
2014 2013 2012 2011 2010 2009 Earnings Impact ($ Millions) Operating Earnings 1,400 $ 1,309 $ 1,236 $ 1,389 $ 1,584 $ 1,567 $ Gain (Loss) on Nuclear Decommissioning Trust (NDT) Fund Related Activity (PSEG Power) 68 40 52 50 46 9 Gain (Loss) on Mark-to-Market (MTM) (a) (PSEG Power) 66 (74) (10) 107 (1) (11) Lease Transaction Activity (PSEG Enterprise/Other) - - 36 (173) - 29 Storm O&M (PSEG Power) (16) (32) (39) - - - Market Transition Charge Refund (PSE&G) - - - - (72) - Gain (Loss) on Asset Sales and Impairments (PSEG Enterprise/Other) - - - 34 - - Income from Continuing Operations 1,518 $ 1,243 $ 1,275 $ 1,407 $ 1,557 $ 1,594 $ Discontinued Operations - - - 96 7 (2) Net Income 1,518 $ 1,243 $ 1,275 $ 1,503 $ 1,564 $ 1,592 $ Fully Diluted Average Shares Outstanding (in Millions) 508 508 507 507 507 507 Per Share Impact (Diluted) Operating Earnings 2.76 $ 2.58 $ 2.44 $ 2.74 $ 3.12 $ 3.09 $ Gain (Loss) on NDT Fund Related Activity (PSEG Power) 0.13 0.08 0.10 0.10 0.09 0.02 Gain (Loss) on MTM (a) (PSEG Power) 0.13 (0.14) (0.02) 0.21 - (0.02) Lease Transaction Activity (PSEG Enterprise/Other) - - 0.07 (0.34) - 0.05 Storm O&M (PSEG Power) (0.03) (0.07) (0.08) - - - Market Transition Charge Refund (PSE&G) - - - - (0.14) - Gain (Loss) on Asset Sales and Impairments (PSEG Enterprise/Other) - - - 0.06 - - Income from Continuing Operations 2.99 $ 2.45 $ 2.51 $ 2.77 $ 3.07 $ 3.14 $ Discontinued Operations - - - 0.19 0.01 - Net Income 2.99 $ 2.45 $ 2.51 $ 2.96 $ 3.08 $ 3.14 $ (Unaudited) For the Year Ended December 31, PUBLIC SERVICE ENTERPRISE GROUP INCORPORATED Reconciling Items, net of tax (a) Includes the financial impact from positions with forward delivery months.
A |
 Items Excluded from Net Income to Reconcile to Operating Earnings and Adjusted EBITDA PLEASE SEE PAGE 3 FOR AN EXPLANATION OF PSEG’S USE OF OPERATING EARNINGS AND ADJUSTED EBITDA AS NON-GAAP
FINANCIAL MEASURES AND HOW THEY DIFFER FROM NET
INCOME. B |
 Items Excluded from Income from Continuing Operations/Net Income to Reconcile to Operating Earnings PLEASE SEE PAGE 3 FOR AN EXPLANATION OF PSEG’S USE OF OPERATING EARNINGS AS A NON-GAAP FINANCIAL MEASURE AND HOW
IT DIFFERS FROM NET INCOME.
C |