Attached files
| file | filename |
|---|---|
| 8-K - FORM 8-K - PNC FINANCIAL SERVICES GROUP, INC. | d50603d8k.htm |
 The PNC Financial Services Group, Inc.
Barclays Global Investor Conference
September 17, 2015
Exhibit 99.1 |
 2 Cautionary Statement Regarding Forward-Looking Information and Adjusted Information Our presentation is not intended as a full business or financial review and should be viewed in the context of all of the information
made available by PNC in its SEC filings and on its corporate
website. The presentation contains forward-looking statements
regarding our outlook for earnings, revenues, expenses, capital and liquidity levels and ratios, asset levels, asset quality, financial position, and other matters regarding or affecting PNC and its future
business and operations. Forward-looking statements are
necessarily subject to numerous assumptions, risks and uncertainties, which change over time. The forward-looking statements in this presentation are qualified by the factors affecting
forward-looking statements
identified in the more detailed Cautionary Statement included in the Appendix, which is included in the version of the presentation materials posted on our corporate website, and in our SEC filings. We provide greater detail regarding these as well
as other factors in our 2014 Form 10-K and our 2015 Form
10-Qs, and in our subsequent SEC filings. Our forward-looking statements may also be subject to other risks and uncertainties, including those we may discuss in this presentation or in our SEC
filings. Future events or circumstances may change our outlook
and may also affect the nature of the assumptions, risks and
uncertainties to which our forward-looking statements are subject.
Forward-looking statements in this presentation speak only as
of the date of this presentation. We do not assume any duty and do not
undertake to update those statements. Actual results or future
events could differ, possibly materially, from those anticipated in forward-looking statements, as well as from historical performance. In this presentation, we may sometimes include non-GAAP financial information. Non-GAAP financial information includes metrics
such as pre-tax provision earnings, tangible book value, and
taxable equivalent net interest income, as well as adjusted results
and certain information used to review components of reported information. When
we do so, we provide GAAP reconciliations for such information.
Such reconciliations may be found in our presentation, in these slides, including the Appendix, in other materials on our corporate website, and in our SEC filings. This information supplements our results as reported in accordance with GAAP
and should not be viewed in isolation from, or as a substitute
for, our GAAP results. We believe that this information and the
related reconciliations may be useful to investors, analysts, regulators and
others to help understand and evaluate our financial results. We
may also use annualized, pro forma, estimated or third party numbers for illustrative or comparative purposes only. These may not reflect actual results. References to our corporate website are to www.pnc.com under “About Us–Investor Relations.” Our SEC filings are available both on our corporate website and on the SEC’s website at www.sec.gov. We include web addresses here as inactive textual references only. Information on these websites is not part of this presentation. |
 3 Agenda Executing our strategic priorities Balance sheet well-positioned for rising rates Focused on revenue/expense relationship Achieving our capital objectives |
 4 Southeast +11% CAGR (’12 -’15) Drive growth in acquired & underpenetrated markets Capture more investable assets Redefine the Retail Banking business Build a stronger Residential Mortgage business Bolster infrastructure & streamline processes Significant Progress on our Strategic Priorities Strategic Priorities Update Total client investment assets (2) : $306B +6% CAGR (6/30/13 – 6/30/15) On track; essentially half-way completed Enhanced compliance and operational framework; focused on continuing progress Over 300 branches under universal model Fee income (3) +5% CAGR (2Q13 - 2Q15) (1) Southeast markets defined as Alabama, Georgia, North Carolina, South Carolina and Florida. AMG refers to Asset Management Group. 2015 annualized. (2) Total client assets includes both AMG client assets under administration and brokerage account client assets from Retail Banking Brokerage business. (3) Retail Banking fee income refers to noninterest income in the following categories: service charges on deposits, brokerage, and consumer services. Results for the three months ended June 2013 through three months ended June 2015. See Reconcilement in Appendix. Corporate Banking and AMG sales (1) |
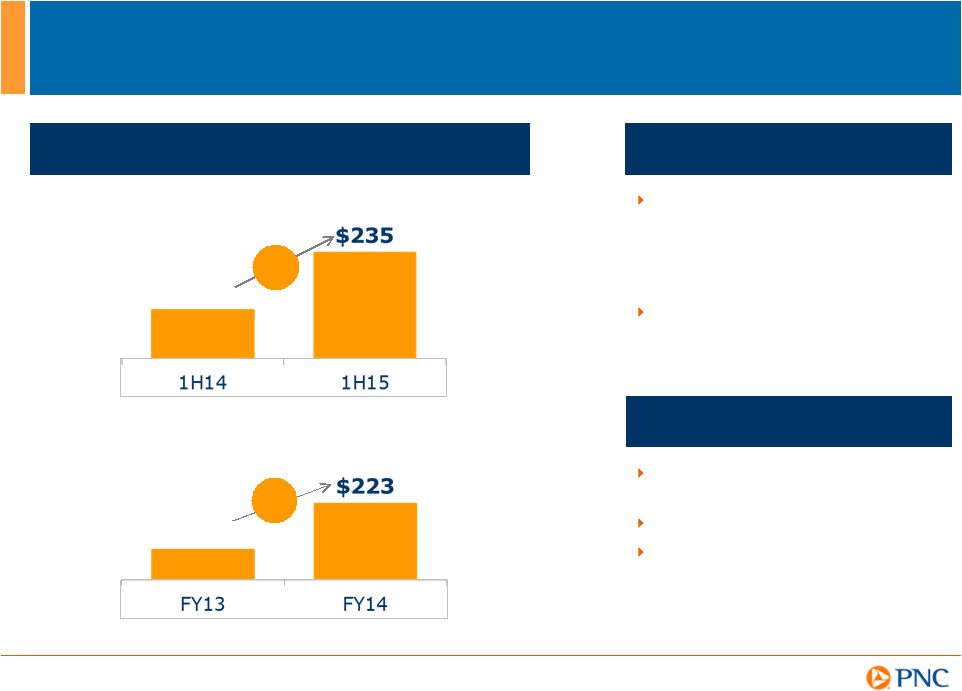
 5 Achieving Our Long-Term Potential Strategic Priorities Long-Term Potential (1) Incremental annual revenue of $500M Total client investment assets growth of $100 billion+ Fee income (2) growth of mid to upper single digits Increase product penetration to 8%-10% (3) Drive growth in acquired & underpenetrated markets Capture more investable assets Redefine the Retail Banking business Build a stronger Residential Mortgage business (1) Refer to Cautionary Statement in Appendix, including economic and other assumptions. Does not take into account the impact of potential legal and regulatory contingencies. (2) See Note 3 on slide 4. (3) Residential Mortgage product penetration based on cross-sales to existing Retail Banking households with current penetration of 6.8%. (4) See Reconcilement in Appendix. Long-Term Potential (1) (3-5 years) (3-5 years) $1 Billion Revenue Potential Fee Income Growth of $158 million 1H14 - 1H15 (4) |
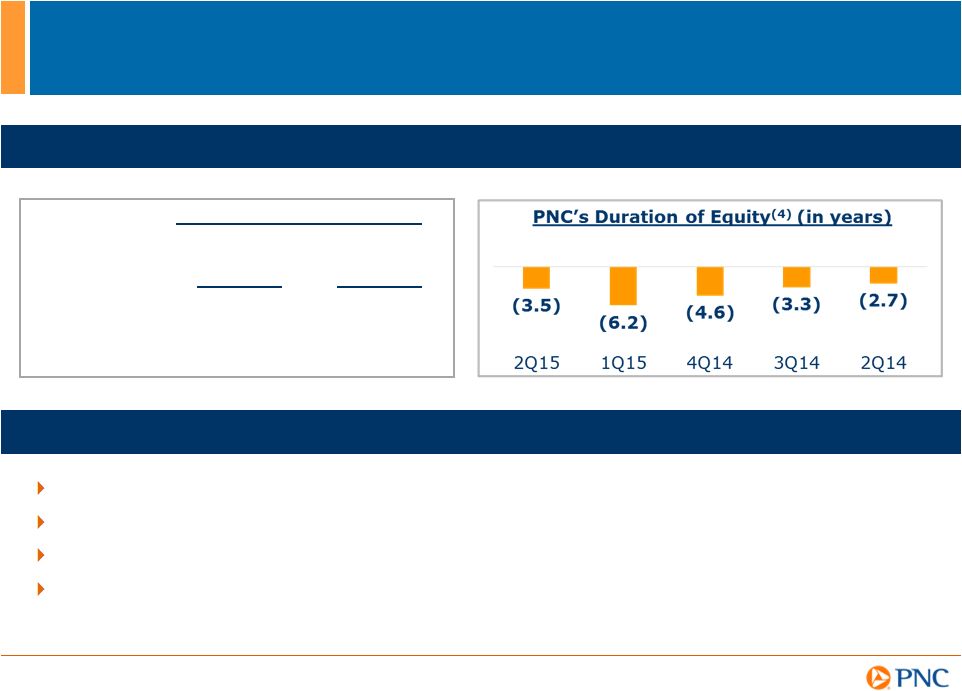 6 Year 1 (2) Year 2 (3) 2Q15 10-Q 1.7% 5.7% Balance Sheet Positioned for Rising Rates Strategies Grow loans within our risk appetite Maintain strong liquidity position Maintain investment securities portfolio flexibility Maintain strong capital position Net Interest Income Sensitivity 2Q15 (1) 100 Bps Parallel Increase (1) Second Quarter 2015 Sensitivity Simulation reflects the interest rate risk exposure on PNC’s net interest income. See PNC’s 2Q15 Form 10-Q for further details on interest rate exposure and sensitivity. Given the inherent limitations in certain of these measurement tools and techniques, results become less meaningful as interest rates approach zero. (2) Reflects the percentage change in net interest income in first year as a result of gradual 100 bps interest rate increase over following twelve months. (3) Reflects the percentage change in net interest income in second year as a result of gradual 100bps interest rate increase over preceding twelve months. (4) Reflects base case model. Asset Sensitive |
 7 Deposit Growth - Focus on Deepening and Retaining Relationships Strong Deposit Growth Retail Banking Highlights Leverage multi-channel programs to reach select customers, drive additional cross-sell and build deeper, more loyal relationships Specialized customer offers growing share of wallet within existing checking accounts $212 Total average balances in $ billions +5% C&IB Highlights Focus on products with more favorable LCR treatment More granular pricing approach Anticipate shift to interest- bearing demand and money market deposits $219 +7% |
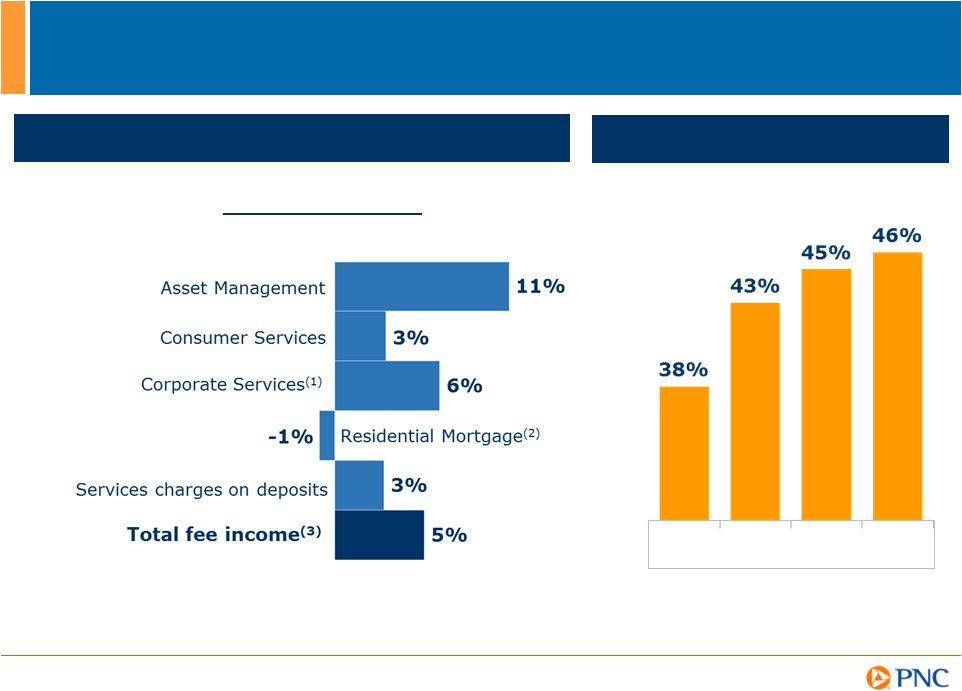 8 Executing our Strategies - Focused on Growing Fee Income Diverse and Strong Fee Income Growth (1) Includes net commercial mortgage servicing rights valuation gains. (2) Includes benefit/provision for residential mortgage repurchase
obligations. (3) See Reconcilement section of Appendix. Fee
income consists of income in the five categories listed above total fee income. Higher Percentage of Noninterest Income to Total Revenue (3) FY12 FY14 FY13 1H15 2Q13 - 2Q15 CAGR (3) |
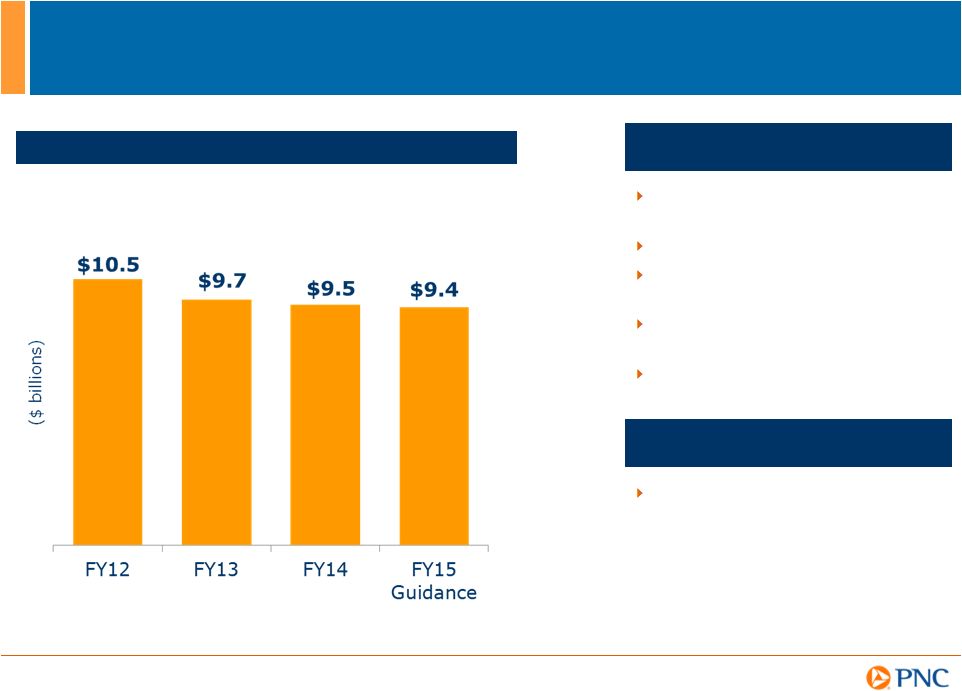 9 Ongoing CIP (3) initiatives including cost savings from additional efficiencies should help fund future investments – Infrastructure – Product and technology – Underpenetrated markets Continued Expense Management While Investing for Future Growth Improve efficiency of branch networks in acquired markets Branch reconfiguration Transaction migration and lower cost alternative channels Lowering costs and focused on efficiencies in mortgage business Increased FY15 CIP (3) target by $100 million to $500 million Managing Expenses (1) Expense Management Opportunities (1) Prior period amounts have been updated to reflect the first quarter 2014 adoption of Accounting Standards Update (ASU) 2014-01 related to investments in low income housing tax credits. (2) Refer to Cautionary Statement in the Appendix, including economic and other
assumptions. Does not take into account impact of potential legal
and regulatory contingencies. (3) CIP refers to PNC’s Continuous Improvement Program. Investing for Future Growth (2) |
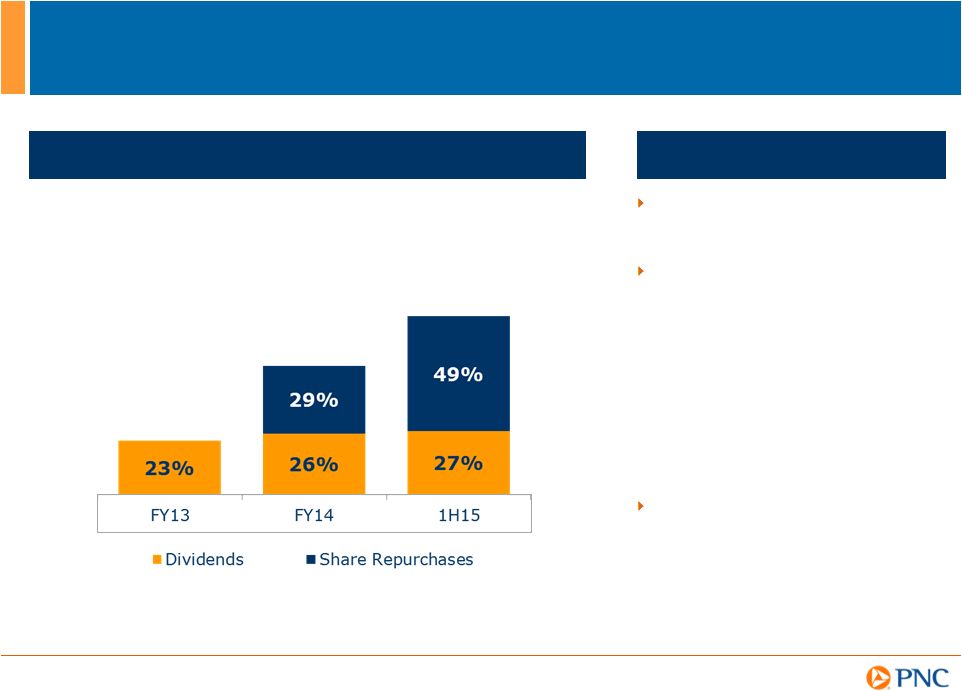 10 Achieving Our Capital Objectives Strong Capital Return Highlights Strong pro forma fully phased- in Basel III common equity Tier I capital ratio of 10% (2) Capital priorities: – Build capital to support client growth and business investment – Maintain appropriate capital in light of economic uncertainty – Return excess capital to shareholders, subject to the CCAR process Repurchased 5.9 million common shares for approximately $0.6 billion in 2Q15 under our capital plan authorization (3) (1)
Payout ratio refers to amount used to fund common stock dividends and share repurchases as a percentage of net income attributable to diluted common shares. (2) June 30, 2015 ratio. See Transitional Basel III and Pro forma Fully Phased-In Basel III Common Equity Tier 1 Capital Ratios slides and related information in the Appendix for further details. Calculated on a pro forma basis without the benefit of the Basel III phase-in provisions. (3) Repurchased under our 2015 capital plan authorization of up to $2.875 billion of common stock over the five quarter period starting in 2Q15 through 2Q16. Ability to purchase full amount is subject to factors such as market and general economic conditions, economic capital and regulatory capital conditions, alternative uses of capital, regulatory and contractual limitations, issuances related to employee benefit plans and the potential impact on credit ratings. Payout Ratio (1) 23% 76% 55% |
 11 Well-Positioned for the Future Opportunity to grow share in underpenetrated markets and deepen product penetration Continued focus on growing fee income and managing expenses Stronger relative capital position provides opportunity to return more capital to shareholders |
 12 Cautionary Statement Regarding Forward-Looking Information Appendix This presentation includes “snapshot” information about PNC used by way of illustration and is not intended as a full business
or financial review. It should not be viewed in isolation but
rather in the context of all of the information made available by PNC in its SEC filings. We also make statements in this presentation, and we may from time to time make other statements, regarding our outlook for earnings,
revenues, expenses, capital and liquidity levels and ratios,
asset levels, asset quality, financial position, and other matters regarding or affecting PNC and its future business and operations that are forward-looking statements within the meaning of the Private Securities Litigation Reform Act.
Forward-looking statements are typically identified by words
such as “believe,” “plan,” “expect,” “anticipate,” “see,” “look,” “intend,” “outlook,” “project,” “forecast,” “estimate,” “goal,”
“will,” “should” and other similar words and
expressions. Forward-looking
statements are subject to numerous assumptions, risks and uncertainties, which change over time. Forward-looking statements speak only as of the date made. We do not assume any duty and do not undertake to update forward-looking statements. Actual results or future events
could differ, possibly materially, from those anticipated in
forward-looking statements, as well as from historical performance. Our forward-looking statements are subject to the following principal risks and uncertainties.
Our businesses, financial results and balance sheet values are affected by
business and economic conditions, including the following:
– Changes in interest rates and valuations in debt, equity and other financial markets.
– Disruptions in the U.S. and global financial markets. – The impact on financial markets and the economy of any changes in the credit ratings of U.S. Treasury obligations and other U.S. government- backed debt, as well as issues surrounding the levels of U.S. and European government debt and concerns regarding the creditworthiness of
certain sovereign governments, supranationals and financial
institutions in Europe. –
Actions by the Federal Reserve, U.S. Treasury and other government agencies, including those that impact money supply and market interest rates. – Changes in customers’, suppliers’ and other counterparties’ performance and creditworthiness.
– Slowing or reversal of the current U.S. economic expansion. – Continued residual effects of recessionary conditions and uneven spread of positive impacts of recovery on the economy and our
counterparties, including
adverse impacts on levels of unemployment, loan utilization rates, delinquencies, defaults and counterparty ability to meet credit and other obligations. – Changes in customer preferences and behavior, whether due to changing business and economic conditions, legislative and regulatory
initiatives, or other factors.
• Our forward-looking financial statements are subject to the risk that economic and financial market conditions will be substantially
different than we are currently expecting. These statements are
based on our current view that the U.S. economic expansion will speed up to an above trend growth rate near 3.0 percent in the second half of 2015, boosted by lower oil/energy prices and solid job gains, and that short-term interest rates and
bond yields will rise slowly during the remainder 2015. These
forward-looking statements also do not, unless otherwise indicated, take into account the impact of potential legal and regulatory contingencies. |
 13 Cautionary Statement Regarding Forward-Looking Information (continued) Appendix PNC’s ability to take certain capital actions, including paying dividends and any plans to increase common stock dividends,
repurchase common stock under current or future programs, or
issue or redeem preferred stock or other regulatory capital instruments, is subject to the review of such proposed actions by the Federal Reserve as part of PNC’s comprehensive capital plan for the applicable period in connection with the regulators’ Comprehensive Capital Analysis and Review (CCAR) process and to the acceptance of such capital plan and non-objection to such capital
actions by the Federal Reserve.
PNC’s regulatory capital ratios in the future will depend on, among other things, the company’s financial performance, the scope and terms of final capital regulations then in effect (particularly those implementing the Basel Capital Accords), and management actions affecting the composition of PNC’s balance sheet. In addition, PNC’s ability to determine, evaluate and forecast regulatory capital ratios, and to take actions (such as capital distributions) based on actual or forecasted capital ratios, will be dependent at least in part on the development, validation and
regulatory approval of related models.
Legal and regulatory developments could have an impact on our ability to operate our businesses, financial condition, results of operations, competitive position, reputation, or pursuit of attractive acquisition opportunities. Reputational impacts could affect matters such as
business generation and retention, liquidity, funding, and
ability to attract and retain management. These developments could include:
– Changes resulting from legislative and regulatory reforms, including major reform of the regulatory oversight structure of the financial
services industry and changes to laws and regulations involving
tax, pension, bankruptcy, consumer protection, and other industry aspects, and changes in accounting policies and principles. We will be impacted by extensive reforms provided for in the Dodd-Frank Wall
Street Reform and Consumer Protection Act (the
“Dodd-Frank Act”) and otherwise growing out of the most recent financial crisis, the precise nature, extent and timing of which, and their impact on us, remains uncertain.
– Changes to regulations governing bank capital and liquidity standards, including due to the Dodd-Frank Act and to Basel-related
initiatives. –
Unfavorable resolution of legal proceedings or other claims and regulatory and
other governmental investigations or other inquiries. In
addition to matters relating to PNC’s current and historical business and
activities, such matters may include proceedings, claims,
investigations, or inquiries relating to pre-acquisition business and
activities of acquired companies, such as National City. These matters may result in monetary judgments or settlements or other remedies, including fines, penalties, restitution or alterations in our business practices, and in additional expenses and collateral costs, and may cause reputational harm to PNC.
– Results of the regulatory examination and supervision process, including our failure to satisfy requirements of agreements with
governmental agencies.
– Impact on business and operating results of any costs associated with obtaining rights in intellectual property claimed by others and of
adequacy of our intellectual property protection in
general. |
 14 Cautionary Statement Regarding Forward-Looking Information (continued) Appendix Business and operating results are affected by our ability to identify and effectively manage risks inherent in our businesses,
including, where appropriate, through effective use of
third-party insurance, derivatives, and capital management techniques, and to meet evolving regulatory capital and liquidity standards. In particular, our results currently depend on our ability to manage elevated levels of impaired assets.
Business
and operating results also include impacts relating to our equity interest in BlackRock, Inc. and rely to a significant extent on information provided to us by BlackRock. Risks and uncertainties that could affect BlackRock are discussed in more detail by BlackRock in
its SEC filings.
We grow our business in part by acquiring from time to time other financial services companies, financial services assets and related deposits and other liabilities. Acquisition risks and uncertainties include those presented by the nature of the business acquired, including in some cases those associated with our entry into new businesses or new geographic or other markets and risks resulting from our inexperience in those new areas, as well as risks and uncertainties related to the acquisition transactions themselves, regulatory issues, and the integration of the acquired businesses into PNC after closing. Competition can have an impact on customer acquisition, growth and retention and on credit spreads and product pricing, which can affect market share, deposits and revenues. Industry restructuring in the current environment could also impact our business and financial performance through changes in counterparty creditworthiness and performance and in the competitive and regulatory landscape. Our ability to anticipate and respond to technological changes can also impact our ability to respond to customer needs and meet competitive demands.
Business and operating results can also be affected by widespread natural and
other disasters, pandemics, dislocations, terrorist activities,
cyberattacks or international hostilities through impacts on the economy and
financial markets generally or on us or our counterparties
specifically.
We provide greater detail regarding these as well as other factors in our 2014
Form 10-K and our 2015 Form 10-Qs, including in the Risk Factors and Risk Management sections and the Legal Proceedings and Commitments and Guarantees Notes of the Notes To Consolidated Financial Statements
in those reports, and in our subsequent SEC filings. Our
forward-looking statements may also be subject to other risks and uncertainties, including those we may discuss elsewhere in this presentation or in our SEC filings, accessible on the SEC’s website at www.sec.gov and on our
corporate website at www.pnc.com/secfilings. We have included
these web addresses as inactive textual references only. Information on these websites is not part of this document. Any annualized, pro forma, estimated, third party or consensus numbers in this presentation are used for illustrative or comparative
purposes only and may not reflect actual results. Any consensus
earnings estimates are calculated based on the earnings projections made by analysts who cover that company. The analysts’ opinions, estimates or forecasts (and therefore the consensus earnings estimates) are theirs alone, are not
those of PNC or its management, and may not reflect PNC’s or
other company’s actual or anticipated results. |
 15 Transitional Basel III and Pro forma Fully Phased-In Basel III Common Equity Tier 1 Capital Ratios Appendix As a result of the staggered effective dates of the final U.S. Basel III regulatory capital rules (Basel III rules),
as well as the fact that PNC remains in the parallel run qualification phase
for the advanced approaches, PNC’s regulatory
risk-based capital ratios in 2015 will be calculated using the standardized approach for determining risk-weighted assets, and the definitions of, and deductions from, regulatory capital under the
Basel III rules (as such definitions and deductions are phased-in for
2015). We refer to the capital ratios calculated using the
phased-in Basel III provisions in effect for 2015 and the standardized approach risk- weighted assets as the 2015 Transitional Basel III ratios. Under the standardized approach for determining
credit risk-weighted assets, exposures are generally assigned a predefined
risk weight. Exposures to high volatility commercial real
estate, past due exposures, equity exposures and securitization exposures are generally subject to higher risk weights than other types of exposures.
We provide information on the next slide regarding PNC’s estimated 2015
and 2014 Transitional Basel III common equity Tier 1 ratios and
PNC’s estimated pro forma fully phased-in Basel III common equity Tier 1 ratio. Under the Basel III rules adopted by the U.S. banking agencies, significant
common stock investments in unconsolidated financial institutions, mortgage
servicing rights and deferred tax assets must be deducted from
capital (subject to a phase-in schedule) to the extent they
individually exceed 10%, or in the aggregate exceed 15%, of the institution's adjusted common equity Tier 1 capital. Also, Basel III regulatory capital includes (subject to a phase-in schedule)
accumulated other comprehensive income related to securities currently and
previously held as available for sale, as well as pension and
other postretirement plans. PNC's regulatory risk-based
capital ratios in 2014 were based on the definitions of, and deductions from, regulatory capital under the Basel III rules (as such definitions and deductions were phased-in
for 2014) and Basel I risk-weighted assets (but subject to certain
adjustments as defined by the Basel III rules). We refer to the
2014 capital ratios calculated using these phased-in Basel III
provisions and Basel I risk-weighted assets as the 2014 Transitional Basel
III ratios. |
 16 Transitional Basel III and Pro forma Fully Phased-In Basel III Common Equity Tier 1 Capital Ratios 2014 Transitional Basel III Dollars in millions Jun. 30, 2015 Mar. 31, 2015 Jun. 30, 2014 Jun. 30, 2015 Mar. 31, 2015 Jun. 30, 2014 Common stock, related surplus, and retained earnings, net of treasury stock $40,688 $40,374 $39,380 $40,688 $40,374 $39,380 Less regulatory capital adjustments: Goodwill and disallowed intangibles, net of deferred tax liabilities (8,999) (9,011) (8,923) (9,223) (9,249) (9,262) Basel III total threshold deductions (430) (414) (216) (1,159) (1,045) (1,075) Accumulated other comprehensive income (a) 22 115 115 53 288 576 All other adjustments (101) (112) (5) (148) (150) (74) Basel III Common equity Tier 1 capital 31,180 $ 30,952 $
30,351 $
30,211
$
30,218 $ 29,545 $ Basel I risk-weighted assets calculated in accordance with transition rules (b) N/A N/A 277,126 $
N/A N/A N/A Basel III standardized approach risk-weighted assets (c) 293,862 $ 295,114 $ N/A 301,688 $ 302,784 $ 295,217 $ Estimated Basel III advanced approaches risk-weighted assets (d) N/A N/A N/A 286,277 $ 287,293 $ 290,063 $ Basel III Common equity Tier 1 capital ratio 10.6% 10.5% 11.0% 10.0% 10.0% 10.0% Risk-weight and associated rules utilized Basel I (with 2014 transition adjustments) (a) Represents net adjustments related to accumulated other comprehensive income for securities currently and previously held as available for sale, as well as pension and other postretirement plans. (b) Includes credit and market risk-weighted assets. (c) Basel III standardized approach risk-weighted assets were estimated based on the Basel III standardized approach rules and include
credit and market risk-weighted assets. (d) Basel III advanced
approaches risk-weighted assets were estimated based on the Basel III advanced approaches rules, and include credit, market and operational risk-weighted assets. 2015 Transitional Basel III Pro forma Fully Phased-In Basel III Standardized (with 2015 transition adjustments) Standardized PNC utilizes the pro forma fully phased-in Basel III capital ratios to assess its capital position (without the benefit of
phase-ins), including comparison to similar estimates made by other financial institutions. Our Basel III capital ratios and estimates may be impacted by additional regulatory guidance or analysis, and, in the case
of those ratios calculated using the advanced approaches, the
ongoing evolution, validation and regulatory approval of PNC’s models
integral to the calculation of advanced approaches risk-weighted assets. |
 17 Non-GAAP to GAAP Reconcilement Appendix Retail Banking $ in millions June 30, 2015 June 30, 2013 CAGR Service charges on deposits $148 $141 Brokerage $71 $58 Consumer Services $254 $229 Total fee income, Retail Banking $473 $428 5% Other $117 $114 Total noninterest income, Retail Banking $590 $542 For the three months ended $ in millions June 30, 2015 June 30, 2013 Total revenue, as reported $7,597 $8,019 Non-market revenue (a) $2,433 $2,850 Total market revenue $5,164 $5,169 Southeast market revenue $548 $482 Southeast market revenue, as % of total market revenue 11% 9% Southeast market revenue, as % of total revenue 7% 6% For the six months ended (a) Non-market revenue is the portion of total revenue derived from businesses or activities that are not tied to particular
markets (such as asset and liability management and our BlackRock
stake) or that are managed financially on a nationwide basis
(most significantly the secured lending businesses in Corporate & Institutional Banking). |
 18 Non-GAAP to GAAP Reconcilement Appendix For the three months ended $ in millions June 30, 2015 June 30, 2013 CAGR Asset management $416 $340 11% Consumer services $334 $314 3% Corporate services $369 $326 6% Residential mortgage $164 $167 -1% Service charges on deposits $156 $147 3% Total fee income $1,439 $1,294 5% Total other $375 $512 -14% Total noninterest income, as reported $1,814 $1,806 0% For the six months ended $ in millions June 30, 2015 June 30, 2014 $ Change Asset management $792 $726 Consumer services $645 $613 Corporate services $713 $644 Residential mortgage $328 $343 Service charges on deposits $309 $303 Total fee income $2,787 $2,629 $158 Total other $686 $634 Total noninterest income, as reported $3,473 $3,263 $210 |