Attached files
| file | filename |
|---|---|
| 8-K - FORM 8-K - NAUTILUS, INC. | d61660d8k.htm |
Exhibit 99.1

September 2015 Marketing Trip SEPTEMBER 17-18 2015
Safe Harbor Statement This presentation includes forward-looking statements (statements which are not historical facts) within the meaning of the Private Securities Litigation Reform Act of 1995, including statements concerning the Company’s prospects, resources, capabilities, current or future financial trends or operating results, demand for the Company‘s products, future plans for introduction of new products and the anticipated outcome of new business initiatives, estimates of market size and growth, planned capital expenditures and potential uses of our capital resources, including statements regarding potential share repurchases, acquisitions or dividend programs. Factors that could cause Nautilus, Inc.‘s actual results to differ materially from these forward-looking statements include our ability to acquire inventory from sole source foreign manufacturers at acceptable costs, within timely delivery schedules and that meet our quality control standards, availability and price of media time consistent with our cost and audience profile parameters, a decline in consumer spending due to unfavorable economic conditions in one or more of our current or target markets, an adverse change in the availability of credit for our customers who finance their purchases, our ability to pass along vendor raw material price increases and increased shipping costs, our ability to effectively develop, market and sell future products, our ability to protect our intellectual property, and the introduction of competing products. Additional assumptions, risks and uncertainties are described in detail in our registration statements, reports and other filings with the Securities and Exchange Commission, including the “Risk Factors” set forth in our Annual Report on Form 10-K, as supplemented by our quarterly reports on Form 10-Q. Such filings are available on our website or at www.sec.gov. You are cautioned that such statements are not guarantees of future performance and that actual results or developments may differ materially from those set forth in the forward-looking statements. We undertake no obligation to publicly update or revise forward-looking statements to reflect subsequent events or circumstances. Unless otherwise indicated, all information regarding our operating results pertain to continuing operations. Twelve Trailing Months (TTM) data reflects results through Q2 2015. © Nautilus, Inc. 2015
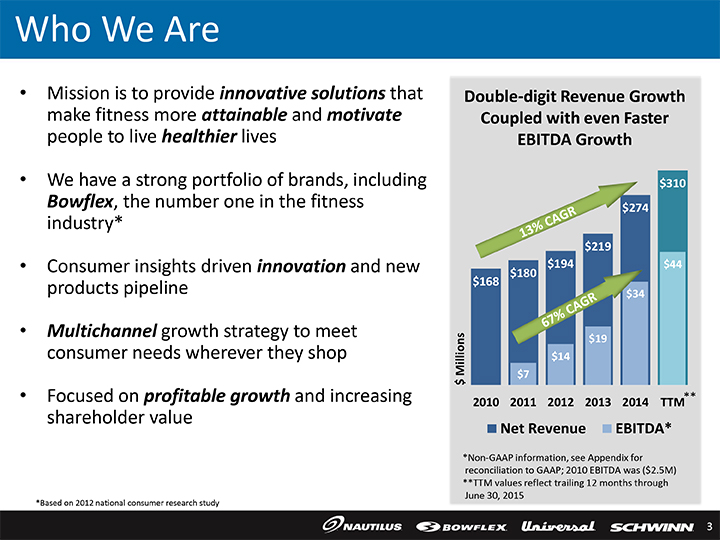
Who We Are • Mission is to provide innovative solutions that make fitness more attainable and motivate people to live healthier lives • We have a strong portfolio of brands, including Bowflex, the number one in the fitness industry* • Consumer insights driven innovation and new products pipeline • Multichannel growth strategy to meet consumer needs wherever they shop • Focused on profitable growth and increasing shareholder value *Based on 2012 national consumer research study Double-digit Revenue Growth Coupled with even Faster EBITDA Growth $310 $274 $219 $180 $194 $44 $168 $34 ions $19 l $14 $ Mil $7 ** 2010 2011 2012 2013 2014 TTM Net Revenue EBITDA* *Non-GAAP information, see Appendix for reconciliation to GAAP; 2010 EBITDA was ($2.5M) **TTM values reflect trailing 12 months through June 30, 2015
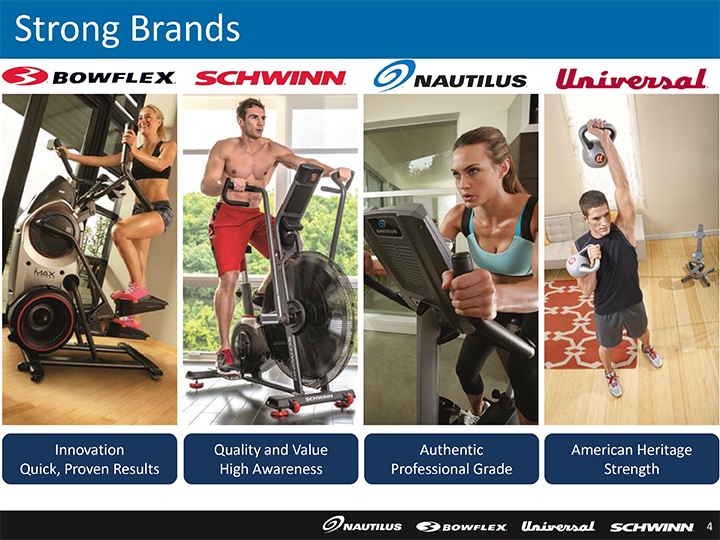
Strong Brands Innovation Quick, Proven Results Quality and Value High Awareness Authentic Professional Grade American Heritage Strength
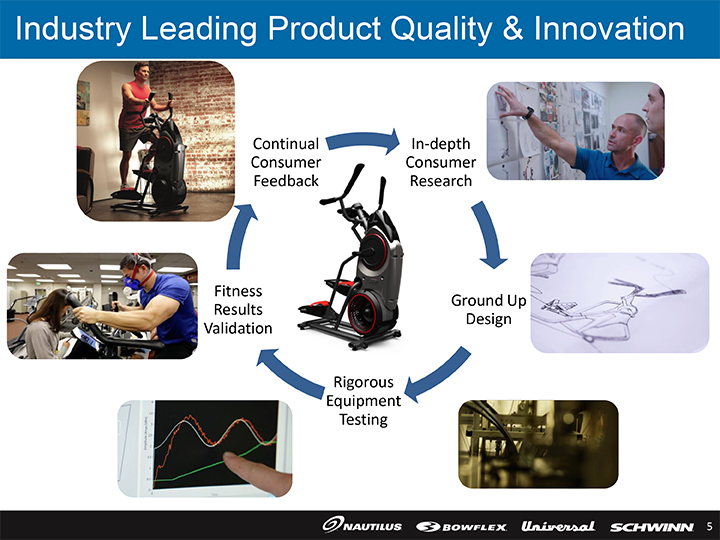
Industry Leading Product Quality & Innovation Continual In-depth Consumer Consumer Feedback Research Fitness Ground Up Results Design Validation Rigorous Equipment Testing
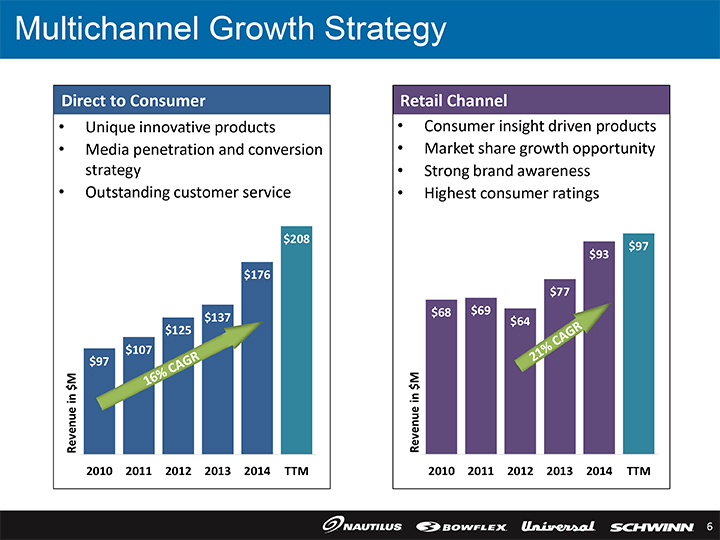
Multichannel Growth Strategy Direct to Consumer • Unique innovative products • Media penetration and conversion strategy • Outstanding customer service $208 $176 $137 $125 $107 $97 Revenue in $M 2010 2011 2012 2013 2014 TTM Retail Channel • Consumer insight driven products • Market share growth opportunity • Strong brand awareness • Highest consumer ratings $97 $93 $77 $68 $69 $64 Revenue in $M 2010 2011 2012 2013 2014 TTM
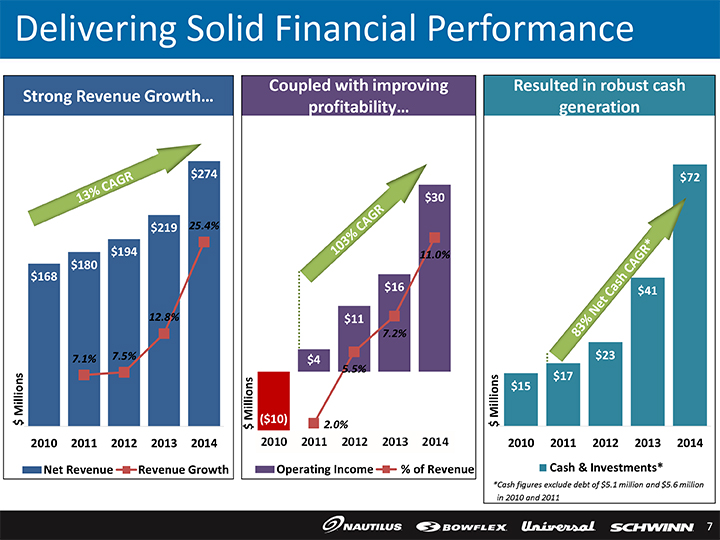
Delivering Solid Financial Performance Strong Revenue Growth… $274 4% 12.8% 7.1% 7.5% ll ions i $ M 2010 2011 2012 2013 2014 Net Revenue Revenue Growth Coupled with improving profitability… $30 11.0% $16 $11 7.2% $4 5.5% ll ions i ($10) $ M 2.0% Operating Income % of Revenue Resulted in robust cash generation $72 $41 $23 ions $15 $17 i ll $ M 2010 2011 2012 2013 2014 Cash & Investments* *Cash figures exclude debt of $5.1 million and $5.6 million in 2010 and 2011

Focused on Increasing Shareholder Value Leading Active S&P 500 Lifestyle Consumer NLS Brands* Discretionary Russell 2000 1-year 80.1% 0.5% 8.0% 3.5% 3-year 767.4% 101.5% 85.6% 62.6% 5-year 647.8% 254.3% 143.6% 92.6% 7-year 213.0% 183.1% 120.7% 57.3% Source: Factset; cumulative returns calculated through 12/31/14 *Average return for BC, BDE, CAB, COLM, DECK, DKS, ELY, JAH, JOUT, LULU, NKE, PII, UA, VFC, ZQK Increasing shareholder value drivenby superior operating results NLS stock consistently outperforming benchmarks $1.27 Pretax EPS** $0.95 $0.51 $0.34 $0.10 ($0.30) **Non-GAAP Information, see Appendix for a reconciliation to GAAP
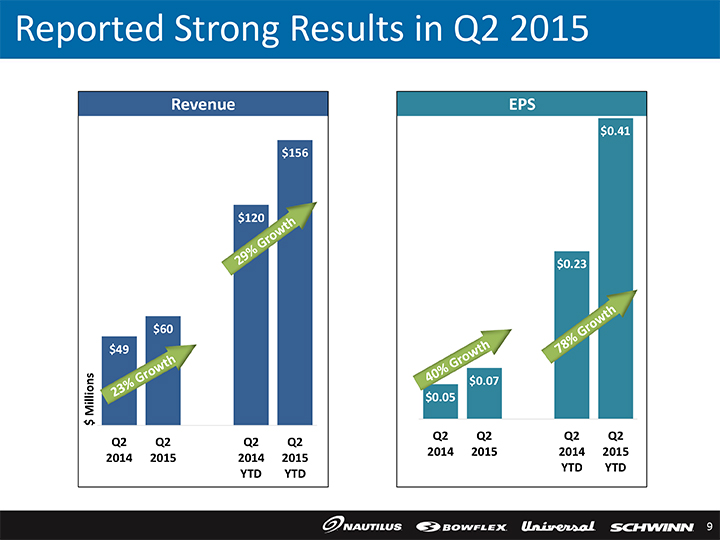
Reported Strong Results in Q2 2015 Revenue $156 $120 $60 $49 ions Q2 Q2 Q2 2014 2015 2014 2015 YTD YTD EPS $0.41 $0.23 $0.07 $0.05 Q2 Q2 Q2 Q2 2014 2015 2014 2015 YTD YTD

Growth Drivers
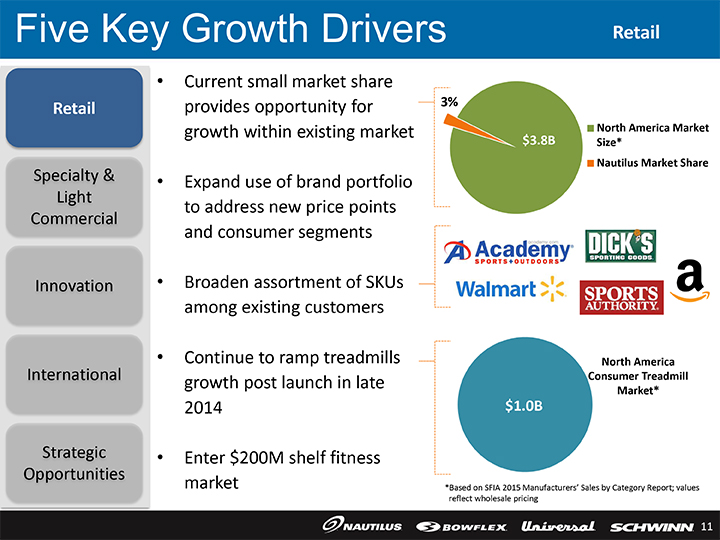
Five Key Growth Drivers Retail Retail Specialty & Light Commercial Innovation International Strategic Opportunities • Current small market share provides opportunity for growth within existing market • Expand use of brand portfolio to address new price points and consumer segments • Broaden assortment of SKUs among existing customers • Continue to ramp treadmills growth post launch in late 2014 • Enter $200M shelf fitness market 3% North America Market $3.8B Size* Nautilus Market Share North America Consumer Treadmill Market* $1.0B *Based on SFIA 2015 Manufacturers’ Sales by Category Report; values reflect wholesale pricing
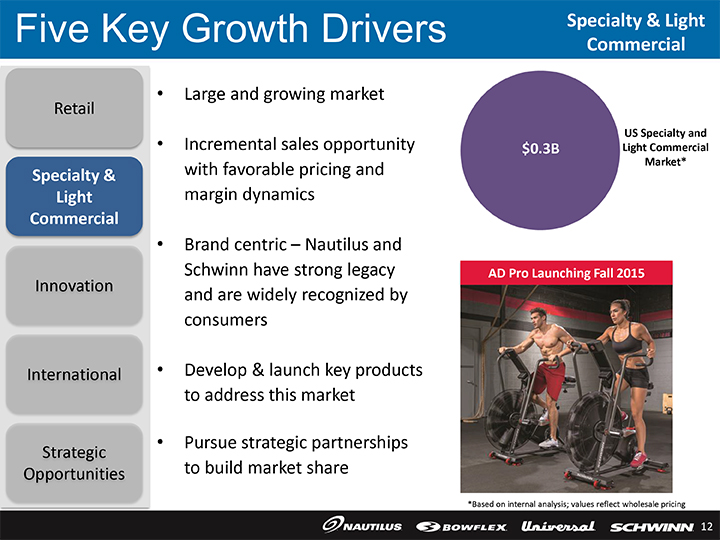
Five Key Growth Drivers Specialty & Light Commercial Retail Specialty & Light Commercial Innovation International Strategic Opportunities • Large and growing market • Incremental sales opportunity with favorable pricing and margin dynamics • Brand centric – Nautilus and Schwinn have strong legacy and are widely recognized by consumers • Develop & launch key products to address this market • Pursue strategic partnerships to build market share US Specialty and $0.3B Light Commercial Market* AD Pro Launching Fall 2015 *Based on internal analysis; values reflect wholesale pricing
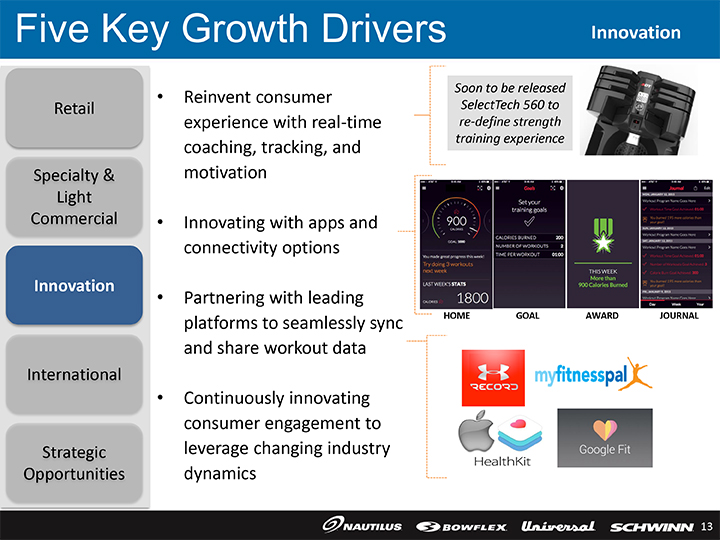
Five Key Growth Drivers Innovation Retail Specialty & Light Commercial Innovation International Strategic Opportunities • Reinvent consumer experience with real-time coaching, tracking, and motivation • Innovating with apps and connectivity options • Partnering with leading platforms to seamlessly sync and share workout data • Continuously innovating consumer engagement to leverage changing industry dynamics Soon to be released SelectTech560 to re-define strength training experience HOME GOAL AWARD JOURNAL
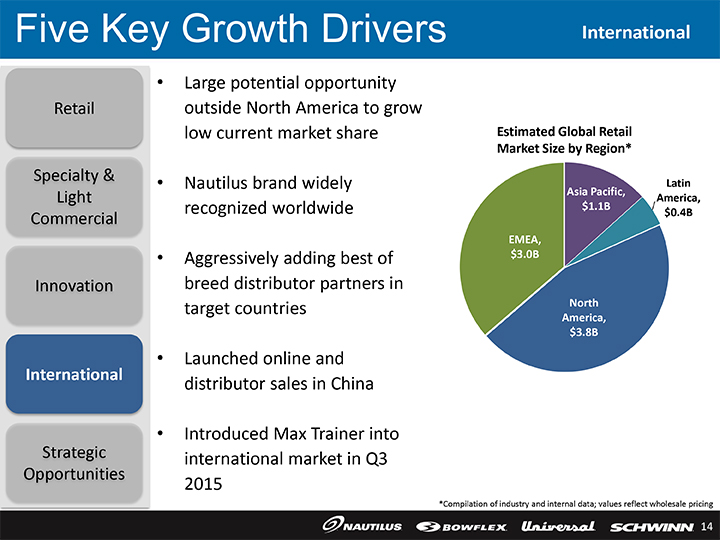
Five Key Growth Drivers International Retail Specialty & Light Commercial Innovation International Strategic Opportunities • Large potential opportunity outside North America to grow low current market share • Nautilus brand widely recognized worldwide • Aggressively adding best of breed distributor partners in target countries • Launched online and distributor sales in China • Introduced Max Trainer into international market in Q3 2015 Estimated Global Retail Market Size by Region* Latin Asia Pacific, America, $1.1B $0.4B EMEA, $3.0B North America, $3.8B *Compilation of industry and internal data; values reflect wholesale pricing
Five Key Growth Drivers Strategic Opportunities Retail Specialty & Light Commercial Innovation International Strategic Opportunities • Company in solid position to expand n Strong balance sheet with >$70M in cash and no debtn Significant free cash flown Leverageable infrastructure to capture synergies • Opportunities to accelerate existing strategies through acquisitions n Specialty & vertical markets n International n Retail growth via shelf fitness • Invest in intellectual property portfolio to drive new product innovation and potentially increase royalty stream • Explore opportunities in incremental adjacent categories (e.g. nutrition)

Long-term Goals
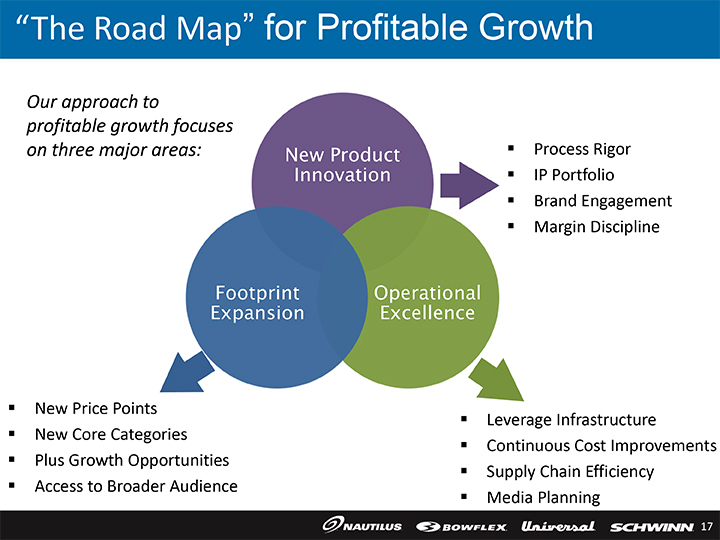
“The Road Map” for Profitable Growth Our approach to profitable growth focuses on three major areas: n New Price Points n New Core Categories n Plus Growth Opportunities n Access to Broader Audience n Process Rigor n IP Portfolio n Brand Engagement n Margin Discipline n Leverage Infrastructure n Continuous Cost Improvements n Supply Chain Efficiency n Media Planning
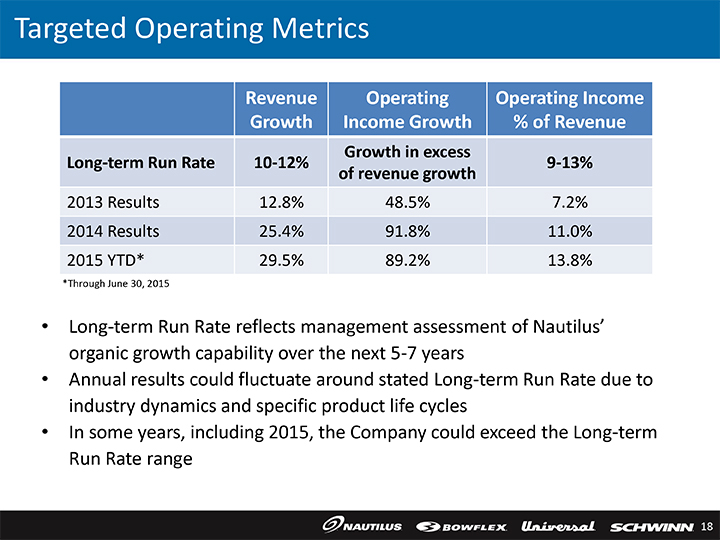
Targeted Operating Metrics Revenue Operating Operating Income Growth Income Growth % of Revenue Growth in excess Long-term Run Rate 10-12% 9-13% of revenue growth 2013 Results 12.8% 48.5% 7.2% 2014 Results 25.4% 91.8% 11.0% 2015 YTD* 29.5% 89.2% 13.8% *Through June 30, 2015 • Long-term Run Rate reflects management assessment of Nautilus’ organic growth capability over the next 5-7 years • Annual results could fluctuate around stated Long-term Run Rate due to industry dynamics and specific product life cycles • In some years, including 2015, the Company could exceed the Long-term Run Rate range
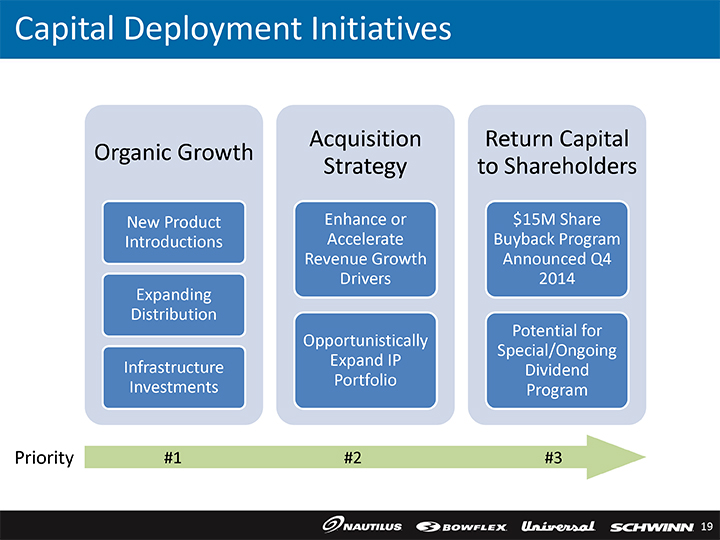
Capital Deployment Initiatives Organic Growth New Product Introductions Expanding Distribution Infrastructure Investments Acquisition Strategy Enhance or Accelerate Revenue Growth Drivers Opportunistically Expand IP Portfolio Return Capital to Shareholders $15M Share Buyback Program Announced Q4 2014 Potential for Special/Ongoing Dividend Program Priority #1 #2 #3
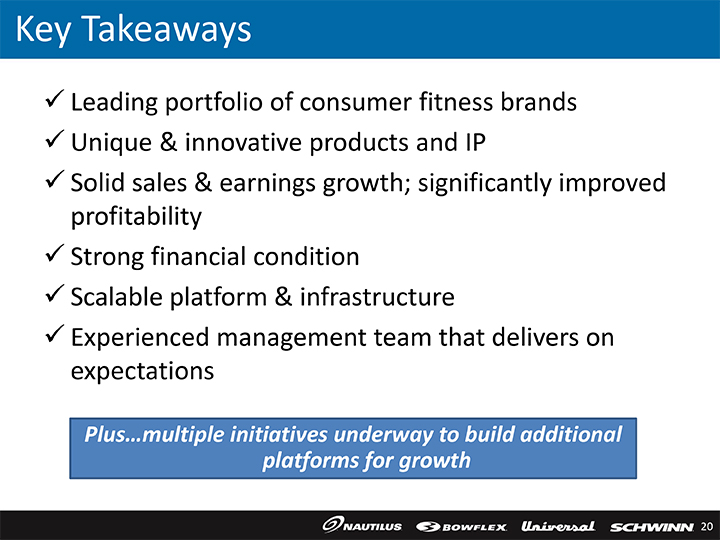
Key Takeaways üLeading portfolio of consumer fitness brands üUnique & innovative products and IP üSolid sales & earnings growth; significantly improved profitability üStrong financial condition üScalable platform & infrastructure üExperienced management team that delivers on expectations Plus…multiple initiatives underway to build additional platforms for growth

THANK YOU
Appendix
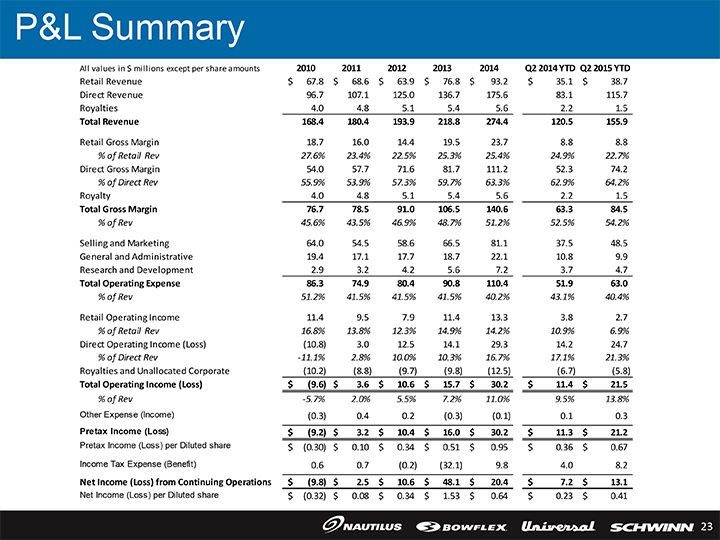
P&L Summary All values in $ millions except per share amounts 2010 2011 2012 2013 2014 Q2 2014 YTD Q2 2015 YTD Retail Revenue $ 67.8 $ 68.6 $ 63.9 $ 76.8 $ 93.2 $ 35.1 $ 38.7 Direct Revenue 96.7 107.1 125.0 136.7 175.6 83.1 115.7 Royalties 4.0 4.8 5.1 5.4 5.6 2.2 1.5 Total Revenue 168.4 180.4 193.9 218.8 274.4 120.5 155.9 Retail Gross Margin 18.7 16.0 14.4 19.5 23.7 8.8 8.8 % of Retail Rev 27.6% 23.4% 22.5% 25.3% 25.4% 24.9% 22.7% Direct Gross Margin 54.0 57.7 71.6 81.7 111.2 52.3 74.2 % of Direct Rev 55.9% 53.9% 57.3% 59.7% 63.3% 62.9% 64.2% Royalty 4.0 4.8 5.1 5.4 5.6 2.2 1.5 Total Gross Margin 76.7 78.5 91.0 106.5 140.6 63.3 84.5 % of Rev 45.6% 43.5% 46.9% 48.7% 51.2% 52.5% 54.2% Selling and Marketing 64.0 54.5 58.6 66.5 81.1 37.5 48.5 General and Administrative 19.4 17.1 17.7 18.7 22.1 10.8 9.9 Research and Development 2.9 3.2 4.2 5.6 7.2 3.7 4.7 Total Operating Expense 86.3 74.9 80.4 90.8 110.4 51.9 63.0 % of Rev 51.2% 41.5% 41.5% 41.5% 40.2% 43.1% 40.4% Retail Operating Income 11.4 9.5 7.9 11.4 13.3 3.8 2.7 % of Retail Rev 16.8% 13.8% 12.3% 14.9% 14.2% 10.9% 6.9% Direct Operating Income (Loss) (10.8) 3.0 12.5 14.1 29.3 14.2 24.7 % of Direct Rev -11.1% 2.8% 10.0% 10.3% 16.7% 17.1% 21.3% Royalties and Unallocated Corporate (10.2) (8.8) (9.7) (9.8) (12.5) (6.7) (5.8) Total Operating Income (Loss) $ (9.6) $ 3.6 $ 10.6 $ 15.7 $ 30.2 $ 11.4 $ 21.5 % of Rev -5.7% 2.0% 5.5% 7.2% 11.0% 9.5% 13.8% Other Expense (Income) (0.3) 0.4 0.2 (0.3) (0.1) 0.1 0.3 Pretax Income (Loss) $ (9.2) $ 3.2 $ 10.4 $ 16.0 $ 30.2 $ 11.3 $ 21.2 Pretax Income (Loss) per Diluted share $ (0.30) $ 0.10 $ 0.34 $ 0.51 $ 0.95 $ 0.36 $ 0.67 Income Tax Expense (Benefit) 0.6 0.7 (0.2) (32.1) 9.8 4.0 8.2 Net Income (Loss) from Continuing Operations $ (9.8) $ 2.5 $ 10.6 $ 48.1 $ 20.4 $ 7.2 $ 13.1 Net Income (Loss) per Diluted share $ (0.32) $ 0.08 $ 0.34 $ 1.53 $ 0.64 $ 0.23 $ 0.41
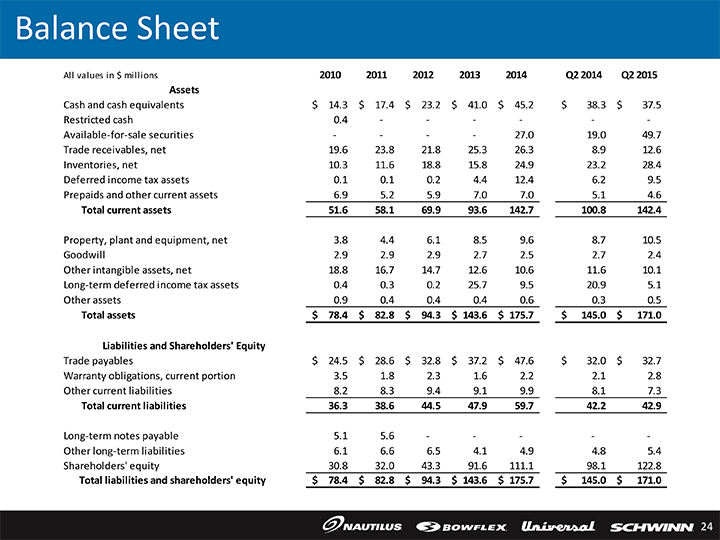
Balance Sheet All values in $ millions 2010 2011 2012 2013 2014 Q2 2014 Q2 2015 Assets Cash and cash equivalents $ 14.3 $ 17.4 $ 23.2 $ 41.0 $ 45.2 $ 38.3 $ 37.5 Restricted cash 0.4 — — — Available-for-sale securities — — 27.0 19.0 49.7 Trade receivables, net 19.6 23.8 21.8 25.3 26.3 8.9 12.6 Inventories, net 10.3 11.6 18.8 15.8 24.9 23.2 28.4 Deferred income tax assets 0.1 0.1 0.2 4.4 12.4 6.2 9.5 Prepaids and other current assets 6.9 5.2 5.9 7.0 7.0 5.1 4.6 Total current assets 51.6 58.1 69.9 93.6 142.7 100.8 142.4 Property, plant and equipment, net 3.8 4.4 6.1 8.5 9.6 8.7 10.5 Goodwill 2.9 2.9 2.9 2.7 2.5 2.7 2.4 Other intangible assets, net 18.8 16.7 14.7 12.6 10.6 11.6 10.1 Long-term deferred income tax assets 0.4 0.3 0.2 25.7 9.5 20.9 5.1 Other assets 0.9 0.4 0.4 0.4 0.6 0.3 0.5 Total assets $ 78.4 $ 82.8 $ 94.3 $ 143.6 $ 175.7 $ 145.0 $ 171.0 Liabilities and Shareholders’ Equity Trade payables $ 24.5 $ 28.6 $ 32.8 $ 37.2 $ 47.6 $ 32.0 $ 32.7 Warranty obligations, current portion 3.5 1.8 2.3 1.6 2.2 2.1 2.8 Other current liabilities 8.2 8.3 9.4 9.1 9.9 8.1 7.3 Total current liabilities 36.3 38.6 44.5 47.9 59.7 42.2 42.9 Long-term notes payable 5.1 5.6 — ——Other long-term liabilities 6.1 6.6 6.5 4.1 4.9 4.8 5.4 Shareholders’ equity 30.8 32.0 43.3 91.6 111.1 98.1 122.8 Total liabilities and shareholders’ equity $ 78.4 $ 82.8 $ 94.3 $ 143.6 $ 175.7 $ 145.0 $ 171.0
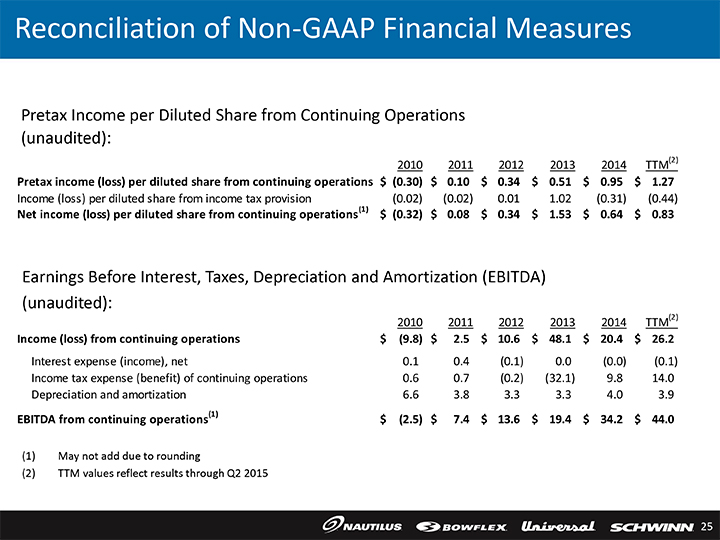
Reconciliation of Non-GAAP Financial Measures Pretax Income per Diluted Share from Continuing Operations (unaudited): 2010 2011 2012 2013 2014 TTM(2) Pretax income (loss) per diluted share from continuing operations $ (0.30) $ 0.10 $ 0.34 $ 0.51 $ 0.95 $ 1.27 Income (loss) per diluted share from income tax provision (0.02) (0.02) 0.01 1.02 (0.31) (0.44) Net income (loss) per diluted share from continuing operations(1) $ (0.32) $ 0.08 $ 0.34 $ 1.53 $ 0.64 $ 0.83 Earnings Before Interest, Taxes, Depreciation and Amortization (EBITDA) (unaudited): 2010 2011 2012 2013 2014 TTM(2) Income (loss) from continuing operations $ (9.8) $ 2.5 $ 10.6 $ 48.1 $ 20.4 $ 26.2 Interest expense (income), net 0.1 0.4 (0.1) 0.0 (0.0) (0.1) Income tax expense (benefit) of continuing operations 0.6 0.7 (0.2) (32.1) 9.8 14.0 Depreciation and amortization 6.6 3.8 3.3 3.3 4.0 3.9 EBITDA from continuing operations(1) $ (2.5) $ 7.4 $ 13.6 $ 19.4 $ 34.2 $ 44.0 (1) May not add due to rounding (2) TTM values reflect results through Q2 2015