Attached files
| file | filename |
|---|---|
| 8-K - FORM 8-K - Discover Financial Services | d64883d8k.htm |
 Barclays 2015 Global Financial Services Conference
Mark Graf EVP & Chief Financial Officer September 17, 2015 ©2015 DISCOVER FINANCIAL SERVICES Exhibit 99.1 |
 Notice The following slides are part of a presentation by Discover Financial Services (the "Company") and are intended to be viewed as part of
that presentation. No representation is made that the information in these
slides is complete. Throughout these materials,
direct-to-consumer deposits are referred to as DTC deposits. DTC deposits include deposit products that we offer to customers through direct marketing, internet origination and affinity relationships. DTC deposits include certificates of deposits, money market accounts, online savings and checking accounts, and IRA certificates of deposit.
The information provided herein includes certain non-GAAP financial measures. The
reconciliations of such measures to the comparable GAAP figures are
included at the end of this presentation. The presentation contains
forward-looking statements. You are cautioned not to place undue reliance on forward-looking statements, which speak only as of the date on which they are made, which reflect management’s estimates, projections, expectations or beliefs at that time,
and which are subject to risks and uncertainties that may cause actual
results to differ materially. For a discussion of certain risks and uncertainties that may affect the future results of the Company, please see "Special Note Regarding Forward-Looking Statements," "Risk
Factors," "Business –
Competition," "Business –
Supervision and Regulation" and "Management’s Discussion and Analysis of
Financial Condition and Results of Operations" in the Company’s
Annual Report on Form 10-K for the year ended December 31, 2014 and "Management’s Discussion and Analysis of Financial Condition and Results of Operations" in the Company’s Quarterly Report on Form 10-Q for the quarter ended June 30,
2015, which are
filed with the SEC and available at the SEC's website (www.sec.gov). The Company does not undertake to update or revise forward-looking statements as more information becomes available. We own or have rights to use the trademarks, trade names and service marks that we use in conjunction with the operation of our business,
including,
but not limited to: Discover®, PULSE®, Cashback Bonus®, Discover Cashback Checking®, Discover it®, Freeze It , Discover® Network and Diners Club International®. All other trademarks, trade names and service marks included in this presentation are the property of their respective owners. 2 SM |
 3 Executive Summary Attractive business model with a solid record of success • Delivering solid card growth Driven by more new accounts, wallet share gain, low attrition rate and great credit results Aided by proprietary network impact on brand, acceptance and rewards • Utilizing consumer unsecured lending and marketing capabilities to grow non-
card assets • Leveraging a payments partnership strategy to position the business for growth • Creating shareholder value through effective capital management |
 Positioned as the leading U.S. direct bank & payments partner
Note(s) Balances as of June 30, 2015; pre-tax profit and volume based on the trailing four quarters ending 2Q15; direct-to-consumer deposits
includes affinity deposits Direct Banking
(98% of DFS Pre-Tax Profit)
Payment Services (2% of DFS Pre-Tax Profit) U.S. Card Issuing • $55Bn in card receivables • $117Bn card sales volume • Leading cash rewards program • 1 in 4 U.S. households Deposits and Lending • $29Bn direct-to-consumer deposits • Cashback checking • $9Bn private student loans • $5Bn personal loans • Home equity installment loans • $11Bn volume • 10+ network alliances • $160Bn volume • 3,700+ issuers • $27Bn volume • 80+ licensees • 185+ countries / territories Network Partners 4 |
 U.S. Card
- Recognized leader in customer satisfaction and loyalty
2015 J.D.
Power Overall Satisfaction (1) Note(s) 1. Includes general purpose consumer credit cards only; excludes charge, corporate, private label, small business and debit
2. Discover received the highest numerical score among credit card issuers in the proprietary J.D. Power 2014-2015 Credit Card Satisfaction Studies , tied in 2014. 2015 study based on responses from 20,730 consumers measuring 10 card issuers and measures opinions of consumers about the issuer of their
primary credit card. Proprietary study results are based on experiences
and perceptions of consumers surveyed in September 2014-May 2015. Your experiences may vary. Visit jdpower.com “Highest in Customer Satisfaction with Credit Card Companies, Two Years in a Row” by J.D. Power (2) #1 or tied for #1 19 years in a row 743 765 776 777 779 788 790 792 820 828 GE C USB BAC WFC BCS COF JPM AXP DFS 5 SM |
 U.S. Card
- Strong card loan growth and credit performance
3-Year Average Quarterly
Card Loan Growth (%) (1) Note(s) 1. Average of quarterly rate from 3Q12 through 2Q15 2. Includes weighted average card loan growth for American Express (U.S. Card), Bank of America (U.S. Card), Capital One (U.S. Card adjusted for
portfolio acquisitions and divestitures and excludes installment loans),
Citi (Citi-branded Cards N.A.), JPMorgan Chase (Card Services) and Wells Fargo (Consumer Credit Card) 3. Weighted average rate; includes U.S. card net charge-off rates for American Express (U.S. Card), Bank of America (U.S. Card), Capital One (U.S. Card), Citi (Citi-branded Cards N.A.), JPMorgan Chase (Card Services) and Wells Fargo (Consumer Credit Card)
(2) 3-Year Average Quarterly Card Net Charge-off Rate (%) (1) (3) Source Public company data 2.3% 3.1% Discover Peer Group 5.1% 0.1% Discover Peer Group 6 |
 U.S. Card
- Delivering strong returns
U.S. Card Issuers Net Interest Margin (NIM) (1,2,3) U.S. Card Issuers Pre-tax, Pre-Reserve ROA (1,4) Note(s) 1. Based on the trailing four quarters ending 2Q15 2. American Express (U.S. Card), Capital One (U.S. Card), Citi (Citi-branded Cards N.A. based on segment tax rate) and JPMorgan Chase (Card
Services) 3.
Capital One, Citi, and JPMorgan Chase net interest margins include late fees, whereas American Express and Discover exclude late fees; Discover card net interest margin represents credit card interest yield less total company average funding cost (total company interest expense divided by total company average
receivables) 4.
Pre-tax income excluding the impact of changes in loan loss reserves divided by
average card receivables; Discover pre-tax income excludes 4Q14 charges related to the elimination of the credit card rewards estimated forfeiture reserve. This is a non-GAAP measure; see appendix for GAAP reconciliation
Source Public company data; Discover 6.7% 6.6% 5.2% 4.7% 4.7% AXP DFS COF C JPM 13.0% 10.3% 10.1% 9.2% 9.0% COF DFS C JPM AXP 7 |
 Other
Lending - Growing non-card loan balances with strong credit
profile Non-Card Loan Products
Non-Card Loans ($Bn)
(2) Note(s) 1. FICO is the higher of either the borrower or cosigner, weighted by loan balance 2. Excludes federal student loans, majority of which were sold in 2010 with a subsequent sale of the remaining portfolio in 2012
20% of total loans at 6/30/15 Private Student Loans (ex PCI) • 19% YOY receivables growth in 2Q15 • On track for record originations in 2015 • Average FICO greater than 750 at acquisition (1) • Cosigner rate approximately 90% Personal Loans • 13% YOY receivables growth in 2Q15 • On track for record originations in 2015 • Average FICO ~750 • ~65% cross-sell $0 $2 $4 $6 $8 $10 $12 $14 $16 Personal Loans Private Student Loans 8 |
 Payments
- Sources of value
Discover Network Diners / Global Partnerships Debit / PULSE Payments Assets Significant Value to Card • Brand recognition • Merchant funded rewards • Emerging technologies • Flexibility and control Independent Value Creation • Traditional third-party transaction processing • Nontraditional partnerships • Business-to-business 9 |
 Payments
Value to Card - Network drives brand awareness and enhances
rewards Average Unaided Card
Brand Awareness 2014 Indexed Merchant-Funded Rewards (1) Note(s) 1. Rewards value divided by Discover card sales volume indexed to 100; includes Discover Deals, estimated point-of-sale coupons, CBB offers,
statement credits and gift card redemptions
Source 2014 Millward Brown Brand Tracking Study 100 12 112 Discover Funded Partner Funded Customer Cash Reward 59 56 28 28 18 13 DFS AXP COF JPM C BAC 10 |
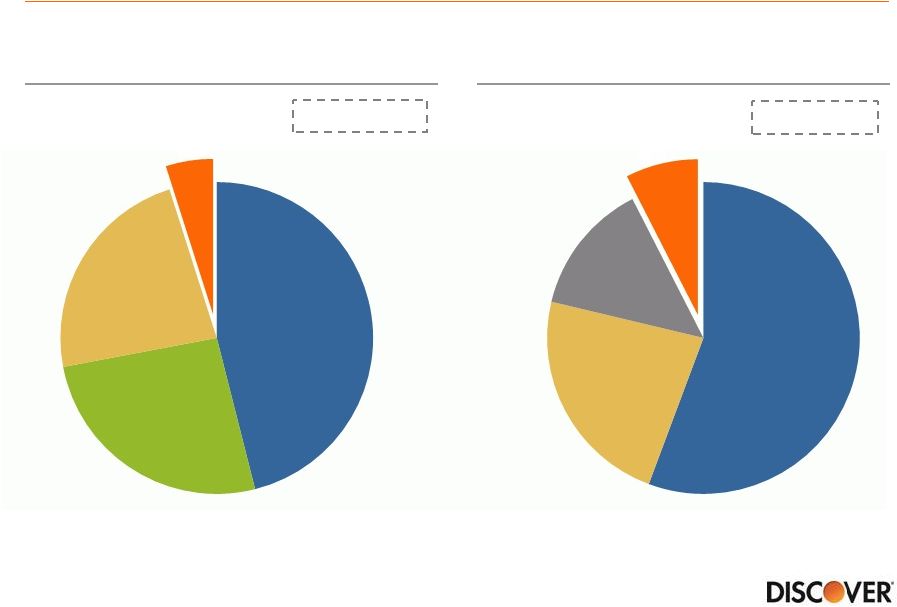 11 Payments Independent Value Creation - Competing against large incumbent networks… Source The Nilson Report 2013 Debit market excluding prepaid and ACH; Discover estimates 2014 U.S. General Purpose Credit Volume Share (%) U.S. Debit Volume Share (%) Source 2015 Nilson Report Size: $2.6Tr Size: $2.1Tr Visa 46% American Express 26% MasterCard 23% Discover 5% Visa 56% MasterCard 21% Other 14% Discover 8% |
 12 Payments Independent Value Creation - ...requires partnerships that leverage flexibility Acquirers Networks Emerging Payments Issuers |
 13 Direct-to-Consumer Deposits - Funding asset growth with high quality deposits Direct-to-Consumer Deposits ($Bn) (1) DTC Balances
by Life of Relationship
Note(s) 1. Includes affinity deposits +39% $21 $29 2010 2Q15 9% 53% 16% 26% 75% 21% 2010 2015 YTD 4+ Years 2 - 4 Years < 2 Years |
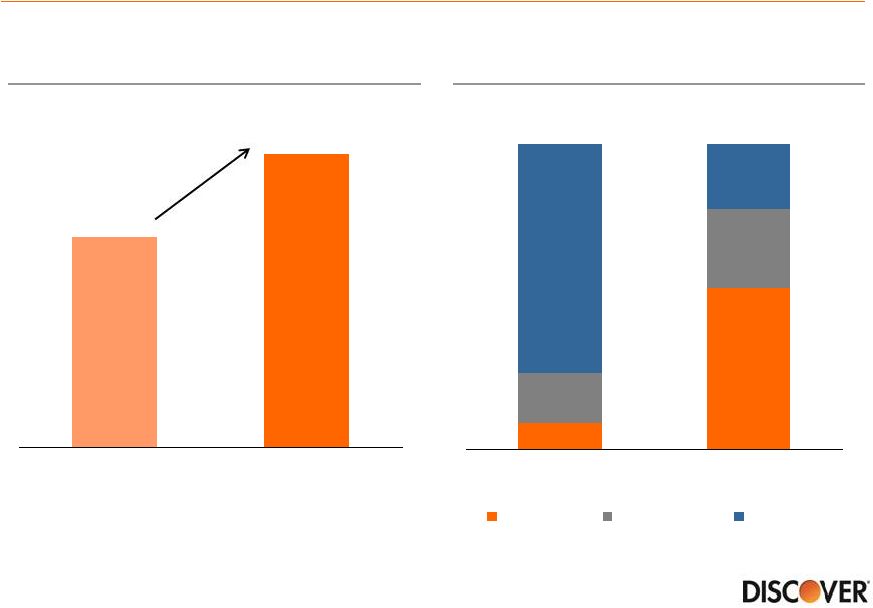
 Funding
Profile - Prepared for a rising rate environment
Average Months to Liability Repricing (1) Net Interest Income Impact from 100bp Parallel Shift ($MM) (2) Note(s) 1. Excludes all indeterminate maturity deposits (savings and money market) and preferred stock; includes derivatives and hedging
activities 2.
1-year net interest income impact from 100bps parallel shift estimated at a point
in time as disclosed in the 10-Q for each period 14
16 28 4Q12 2Q15 $42 $200 4Q12 2Q15 |
 Net
Interest Margin -
Preparation for rising rates drove modest NIM compression
Cost of Funds Trend (1) Net Interest Margin Trend Note(s) 1. Rate on total interest-bearing liabilities 15 0.0% 0.5% 1.0% 1.5% 2.0% 2.5% 4Q12 4Q13 2Q15 0.0% 1.0% 2.0% 3.0% 4.0% 5.0% 6.0% 7.0% 8.0% 9.0% 10.0% 4Q12 4Q13 2Q15 > 9.5% on full year basis through 2016 |
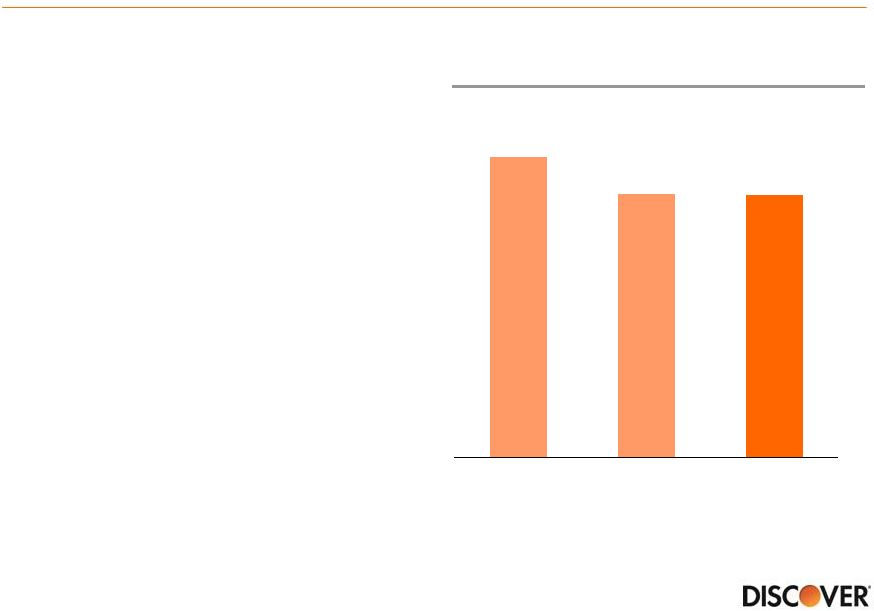 16 Recent Themes - Fee income outlook • Exited mortgage originations in 2015 ($109MM in revenue for the trailing twelve month period ending June 30, 2015) • Stopped selling Protection Products in 2012; expect attrition to continue • Full year impact of lost volume in Pulse • Expect non-interchange fee revenue to be lower in 2016 Other Non-Interchange Fee Revenue ($MM) (1) Note(s) $1,180 $1,036 $1,034 2013 2014 2Q15 TTM 1. Other Non-Interchange Fee Revenue, which is derived by subtracting Net Discount and Interchange Revenue from Total Other Income, is a
non-GAAP measure which should be viewed in addition to, and not as a
substitute for the Company's reported results. Management believes this information helps investors understand the impact of the components of Total Other Income on reported results; see appendix for the GAAP to non-GAAP reconciliation schedule.
|
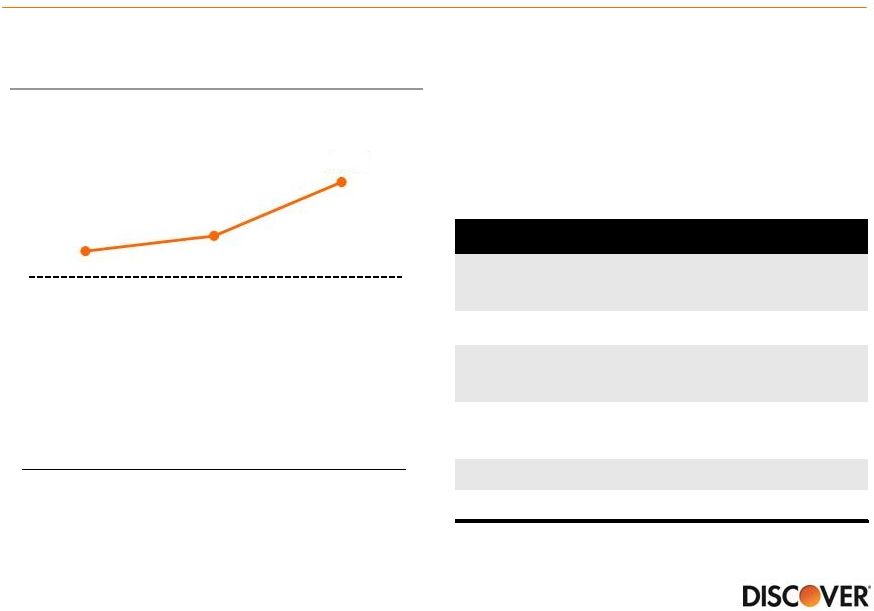 17 Recent Themes - Elevated efficiency ratio in 2015 Efficiency Ratio (1) • Despite recent elevated levels, our efficiency ratio remains lower than most large banks • Currently expect improvement in 2016 38% Long-term Target Note(s) 1. Defined as reported total operating expense divided by revenue net of interest expense
2. Revenue from gain on origination and sale of mortgage loans in the first half of 2015 was $66MM
38.8% 39.4% 41.5% 2013 2014 2Q15 TTM Select 2015 expense items 1H15 AML/BSA program remediation (Lookback) $34MM Home Loans operating expense (2) ~$70MM Home Loans restructuring charges $23MM 1Q15 legal reserve related to CFPB consent order $20MM EMV implementation $9MM Lack of postal rebate $17MM |
 18 Recent Themes - Seasoning of newer vintages produces reserve requirements Card Vintage Gross Loss Rate (1) New Account Bookings (MM) Note(s) 1. Blended vintage 6-month moving average gross principal charge-off rate (excludes recoveries)
2010 2011 2012 2013 2014 0 4 8 12 16 20 24 2002-2006 Historical Benchmark 2010-2013 |
 19 Recent Themes – Well seasoned loan performance is exceeding expectations Reserve Release/(Build) ($MM) (2) Note(s) 1. Monthly figures through July 2015 2. Reserve Release/(Build) for total company including all loan products Card 30+ Delinquency Rate (1) 1H 2015 0.0% 1.0% 2.0% 3.0% 4.0% 5.0% $457 $1,033 $552 $140 $(98) 11 2010 2011 2012 2013 2014 |
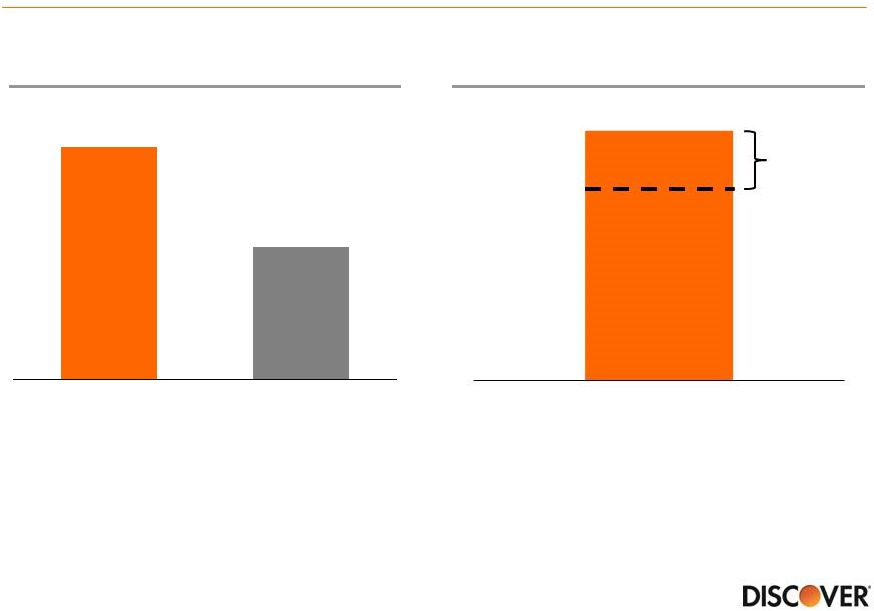 20 Capital Position - Strong capital level enables capital returns… DFS Common Equity Tier 1 Ratio (3) Min. Common Equity Tier 1 Capital Ratio (1) Note(s) 1. Minimum Common Equity Tier 1 Capital Ratio under the severely adverse scenario 2. Average of 31 participating bank holding companies as reported by the Federal Reserve
3. Common Equity Tier 1 Capital Ratio (Basel III fully phased-in) is calculated using Basel III fully phased-in common equity tier 1
capital, a non-GAAP measure. The Company believes that the
common equity tier 1 capital ratio based on fully phased-in Basel III rules is an important complement to the existing capital ratios and for comparability to other financial institutions. For the corresponding reconciliation of common equity tier 1 capital and risk weighted assets calculated under
fully phased-in Basel III rules to common equity tier 1 capital and
risk weighted assets calculated under Basel III transition rules, see appendix
Source Federal Reserve Dodd-Frank Act Stress Test 2015: Supervisory Stress Test Methodology and Results, Table 3 11% Target $2.5Bn+/- 13.3% 7.6% DFS DFAST Average (2) 14.4% 2Q15 |
 Capital
Deployment - …With highest total yield
Source Public Company Disclosures and Market Data as of 8/31/15 Note(s) 1. CCAR announced capital actions (buybacks and dividends) pro-rated for 3Q15 through 2Q16 based on company press releases 2. CCAR capital actions as stated in Note 1 divided by market capitalization Estimated Dividend and Buyback Yield (1,2) 21 10% 8% 8% 5% 4% 3% DFS AXP COF JPM C BAC Dividend Buyback |
 • Attractive business model with strong returns • 98% of profit from Direct Banking segment which is largely a U.S. consumer driven business – Limited direct exposure to changes in global macro environment – Efficiency ratio is lower than most large banks and expected to improve in 2016 • Management team focused on: • Balancing business investments across the organization • Profitable loan growth • Consistent capital priorities with strong payout • Driving long-term shareholder value ROE 15%+ Conclusion 22 |
 Appendix |
 24 Reconciliation of GAAP to non-GAAP data Note(s) 1. Credit card pre-tax income excluding forfeiture reserve and reserve changes is a non-GAAP measure and represents pre-tax earnings of Discover's credit card business excluding the impact of the elimination of the credit card rewards program forfeiture reserve and changes to the allowance for card loan loss reserve. This is a meaningful measure to investors because it provides a competitive performance benchmark Trailing Twelve Months Ended (unaudited, $ in millions) June 30, 2015 Dec. 31, 2014 Dec. 31, 2013 GAAP Total Other Income $1,998 $2,015 $2,306 Less: Discount and Interchange Revenue, Net (964) (979) (1,126) Total Other Income Excluding Net Discount and Interchange Revenue $1,034 $1,036 $1,180 (unaudited, $ in millions) Trailing Twelve Months Ended June 30, 2015 GAAP Direct Banking pre-tax income $3,422 Excluding elimination of credit card rewards program forfeiture reserve 178 Excluding non-credit card pre-tax income (105) Credit card pre-tax income excluding forfeiture reserve change $3,495 Excluding credit card reserve changes 82 Credit card pre-tax income excluding forfeiture reserve and reserve changes
$3,577 GAAP average credit card receivables $53,831 Credit card pre-tax return on assets (excluding forfeiture reserve and reserve changes) (1) 6.6% |
 25 Reconciliation of GAAP to non-GAAP data (cont’d) Note(s) 1. Tangible common equity ("TCE"), a non-GAAP financial measure, represents common equity less goodwill and intangibles. A reconciliation of TCE to common equity, a GAAP financial measure, is shown above. Other financial services companies may also use TCE and definitions may vary, so users of this information are advised to exercise caution in comparing TCE of different companies. TCE is included because management believes that common equity excluding goodwill and intangibles is a more meaningful measure to investors of the true net asset value of the Company 2. Adjustments related to capital components for fully phased-in Basel III include the phase-in of the intangible asset
exclusion 3.
Key differences under fully phased-in Basel III rules in the calculation of
risk-weighted assets include higher risk weighting for past due loans and unfunded commitments 4. As of January 1, 2015 regulatory capital ratios are calculated under Basel III rules subject to transition provisions
5. Common equity tier 1 capital ratio (Basel III fully phased-in) is calculated using common equity tier 1 capital (Basel III fully
phased-in), a non-GAAP measure, divided by risk weighted assets
(Basel III fully phased-in) Quarter Ended
(unaudited, in millions)
June 30, 2015 GAAP total common equity $10,703 Less: Goodwill (255) Less: Intangibles (170) Tangible common equity (1) $10,278 Common equity Tier 1 capital (Basel III transition) $10,552 Adjustments related to capital components during transition (2) (83) Common equity Tier 1 capital (Basel III fully phased-in) $10,469 Risk weighted assets (Basel III transition) $72,658 Risk weighted assets (Basel III fully phased-in) (3) $72,555 Common equity Tier 1 capital ratio (Basel III transition) (4) 14.5% Common equity Tier 1 capital ratio (Basel III fully phased-in) (4,5) 14.4% |