Attached files
| file | filename |
|---|---|
| 8-K - 8-K - CYS Investments, Inc. | d54256d8k.htm |
| Exhibit 99.1
|

Investment Outlook
September 2015
Kevin E. Grant, CFA Chief Executive Officer and President
Barclays Global Financial Services Conference September 17, 2015
|
|
Forward -Looking Statements
This presentation contains forward -looking statements, within the meaning of Section 27A of the Securities Act of 1933, as amended, and Section 21E of the Securities Exchange Act of 1934, as amended, that are based on management’s beliefs and assumptions, current expectations, estimates and projections. Such statements, including information relating to the Company’s expectations for distributions, financing from the Federal Home Loan Bank, availability and cost of financing, liquidity, counterparty risk, hedging, market conditions, monetary policy, return on equity, the yield curve, the economy, interest expense, affordability, availability and valuation of housing and mortgages, movements in interest rates, actions by the U.S. Government, the Federal Reserve and other government entities, the performance of the Company’s target assets, the impact of current Federal Reserve voters on certain policies of the Federal Reserve, the policy views of central banks, the size of the mortgage market, haircuts, borrowing capacity, and lending counterparties are not considered historical facts and are considered forward -looking information under the federal securities laws. This information may contain words such as “believes,” “plans,” “expects,” “intends,” “estimates” orsimilar expressions.
This information is not a guarantee of the Company’s future performance and is subject to risks, uncertainties and other important factors that could cause the Company’s actual performance or achievements to differ materially from those expressed or implied by this forward -looking information and include, without limitation, changes in the market value and yield of our assets, changes in interest rates and the yield curve, net interest margin, return on equity, availability and terms of financing and hedging, the likelihood that proposed legislation is madelawandthe anticipated impact thereof, actionsbytheU.S. government oranyagency thereof, including the Federal Reserve, and the effects of such actions and various other risks and uncertainties related to our business and the economy, some of which are described in our filings with the SEC. Given these uncertainties, you should not rely on forward -looking information. The Company undertakes no obligations toupdateany forward -looking information, whether asaresultofnew information, futureeventsor otherwise.
| 2 |
|
|
|
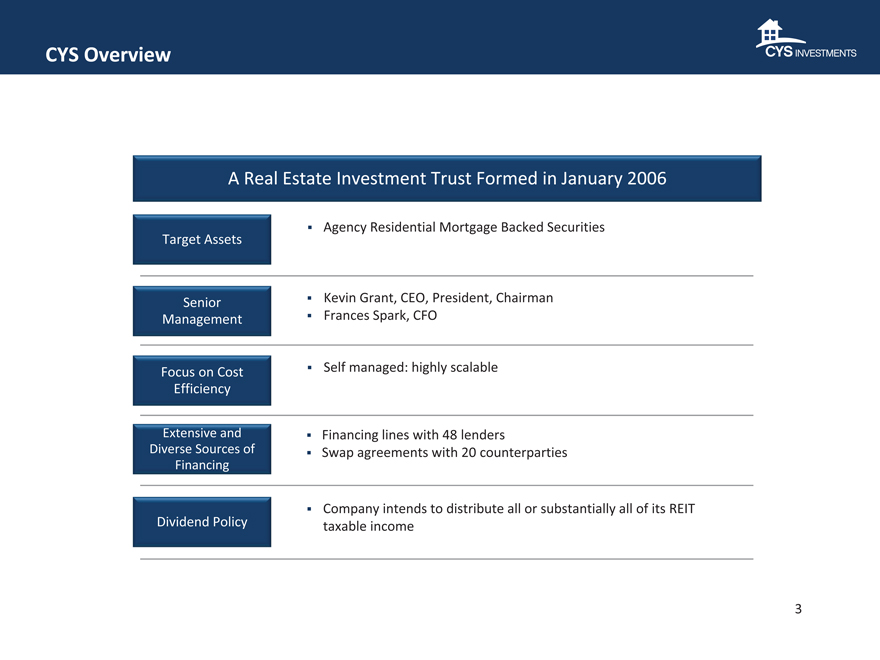
CYS Overview
A Real Estate Investment Trust Formed in January 2006
Agency Residential Mortgage Backed Securities Target Assets
Senior Kevin Grant, CEO, President, Chairman Management Frances Spark, CFO
Focus on Cost Self managed: highly scalable Efficiency
Extensive and Financing lines with 48lenders Diverse Sources of Swap agreements with 20 counterparties
Financing
Company intends to distribute all or substantially all of its REIT Dividend Policy taxable income
| 3 |
|
|
|
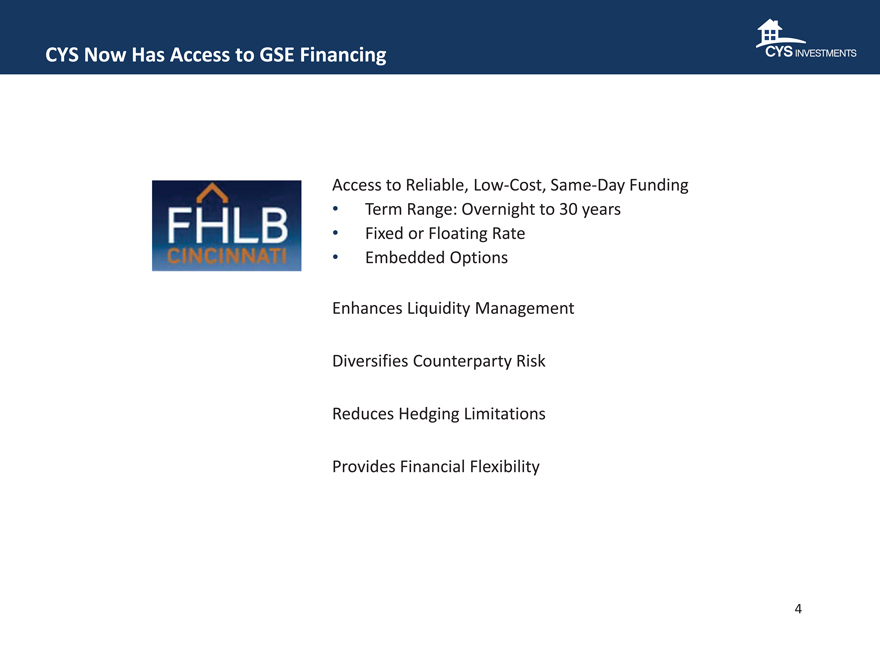
CYS Now Has Access to GSE Financing
Access to Reliable, Low-Cost, Same-Day Funding
Term Range: Overnight to 30 years
Fixed or Floating Rate
Embedded Options
Enhances Liquidity Management Diversifies Counterparty Risk Reduces Hedging Limitations Provides Financial Flexibility
| 4 |
|
|
|
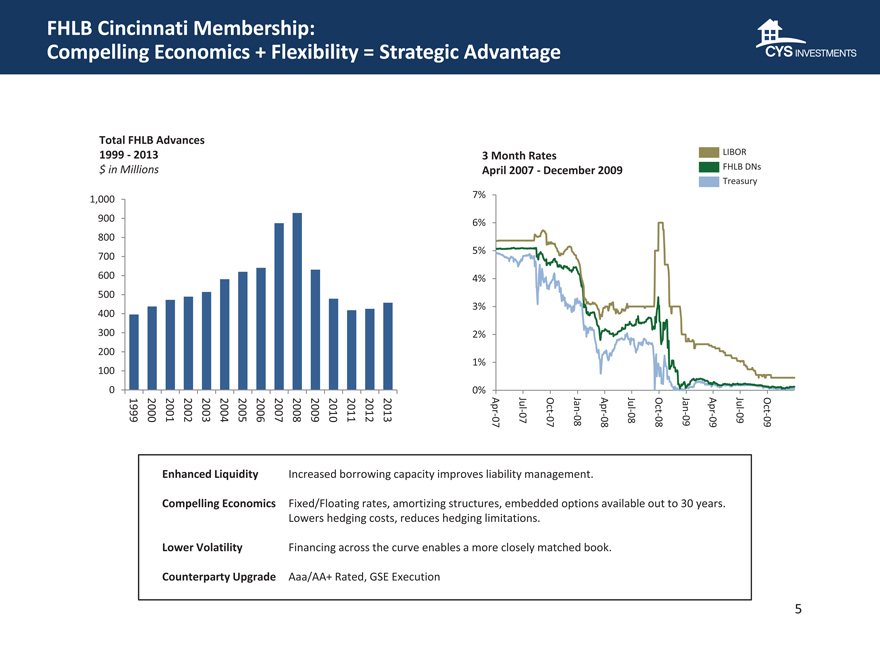
FHLB Cincinnati Membership:
Compelling Economics + Flexibility = Strategic Advantage
Total FHLB Advances
1999 -2013 3 Month Rates LIBOR $ in Millions April 2007 -December 2009 FHLBDNs
Treasury
7% 1,000
900
6% 800 5% 700
600 4% 500 3% 400
300 2% 200 100 1%
0 0%
Apr Jul - Oct Jan Apr - Jul Oct Jan Apr - Jul Oct
1999 2000 2001 2002 2003 2004 2005 2006 2007 2008 2009 2010 2011 2012 2013 - 07 - - 08 - 08 - - 09 - 09 -
07 07 08 08 09 09
Enhanced Liquidity Increased borrowing capacity improves liability management.
Compelling Economics Fixed/Floating rates, amortizing structures, embedded options available out to 30 years. Lowers hedging costs, reduces hedging limitations.
Lower Volatility Financing across the curve enables a more closely matched book.
Counterparty Upgrade Aaa/AA+ Rated, GSE Execution
| 5 |
|
|
|
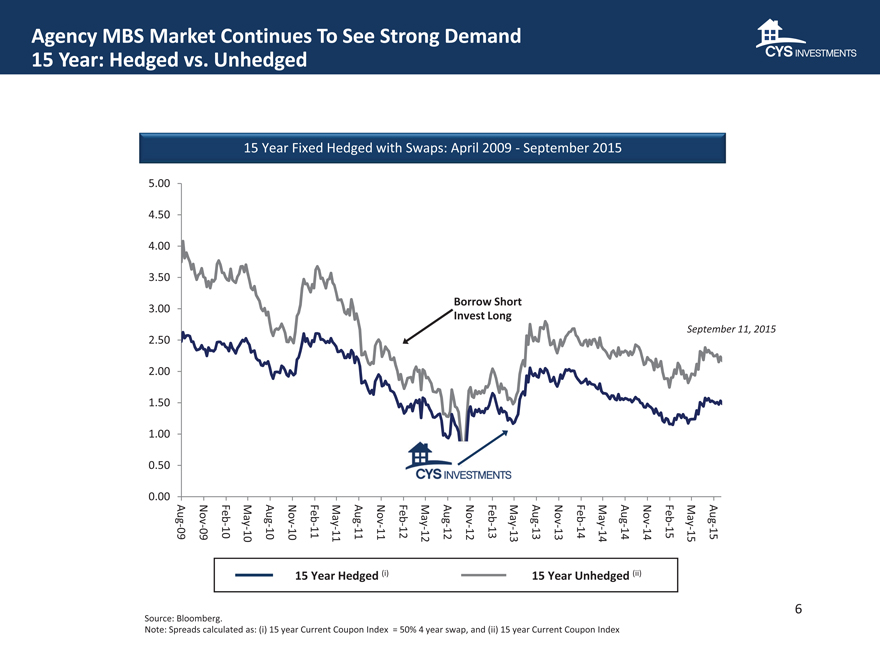
Agency MBS Market Continues To See Strong Demand
15 Year: Hedged vs. Unhedged
15 Year Fixed Hedged with Swaps: April 2009 -September 2015
5.00 4.50 4.00
3.50
Borrow Short
3.00
Invest Long
September 11, 2015
2.50 2.00 1.50 1.00 0.50 0.00
Aug Nov - Feb May Aug Nov - Feb May Aug Nov - Feb May Aug Nov Feb - May Aug Nov - Feb May Aug Nov Feb - May Aug
- - - - - - - - - - - - -
09 09 10 10 - 10 10 11 11 - 11 11 12 - 12 12 12 13 - 13 13 13 14 14 - 14 14 15 15 - 15
15 Year Hedged (i) 15 Year Unhedged (ii)
| 6 |
|
Source: Bloomberg.
Note: Spreads calculated as: (i) 15 year Current Coupon Index = 50% 4 year swap, and (ii) 15 year Current Coupon Index
|
|
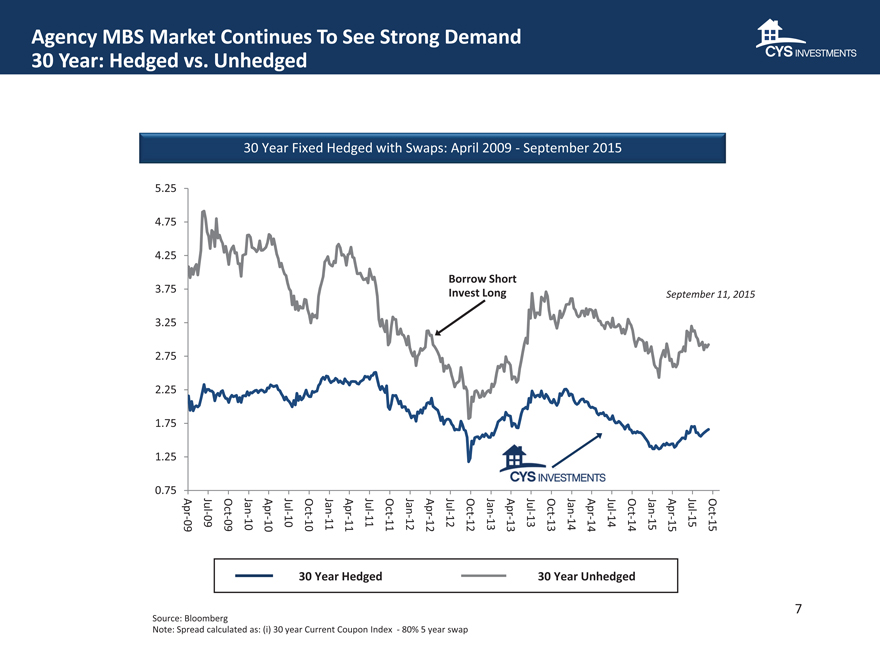
Agency MBS Market Continues To See Strong Demand
30 Year: Hedged vs. Unhedged
30 Year Fixed Hedged with Swaps: April 2009 -September 2015
5.25
4.75
4.25
Borrow Short 3.75 Invest Long
September 11, 2015
3.25 2.75 2.25 1.75 1.25 0.75
Apr 09 - Jul Oct Jan Apr 10 - Jul Oct Jan Apr Jul - 11 Oct Jan Apr Jul - 12 Oct Jan Apr 13 - Jul Oct Jan Apr 14 - Jul Oct Jan Apr - Jul 15 Oct
- - - 10 - - 11 - - - - 12 - - - 13 - - 14 - - - 15 - - -
09 09 10 10 11 11 12 12 13 13 14 14 15 15
30Year Hedged
30Year Unhedged
| 7 |
|
Source: Bloomberg
Note: Spread calculated as: (i) 30 year Current Coupon Index -80% 5 year swap
|
|
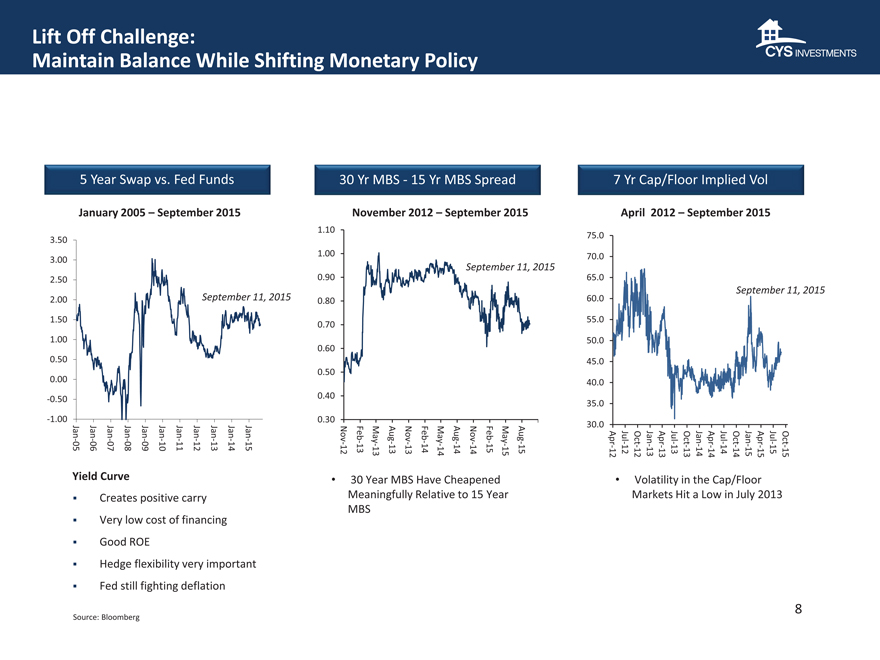
Lift Off Challenge:
Maintain Balance While Shifting Monetary Policy
| 5 |
|
Year Swap vs. Fed Funds |
January 2005 – September 2015
3.50 3.00 2.50
2.00 September 11, 2015
1.50
1.00 0.50 0.00 -0.50
-1.00
- Jan Jan - Jan - - Jan Jan - - Jan - Jan - Jan Jan - Jan - Jan -
05 06 07 08 09 10 11 12 13 14 15
Yield Curve
Creates positive carry Very low cost of financing Good ROE
Hedge flexibility very important
Fed still fighting deflation
Source: Bloomberg
30 YrMBS -15 YrMBS Spread
November 2012 – September 2015
1.10
1.00
September 11, 2015
0.90 0.80 0.70 0.60 0.50 0.40 0.30
Nov - Feb May Aug Nov Feb - May Aug Nov - Feb May Aug
- - - - - -
12 13 13 - 13 13 14 - 14 14 14 15 - 15 15
| 7 |
|
Yr Cap/Floor Implied Vol |
April 2012 – September 2015
75.0
70.0
65.0
60.0 September 11, 2015
55.0 50.0 45.0 40.0 35.0 30.0
Apr Jul 12 - Oct Jan Apr - 13 Jul Oct Jan Apr - 14 Jul Oct Jan Apr - Jul 15 Oct
- - - 13 - - - 14 - - 15 - - -
12 12 13 13 14 14 15 15
30 Year MBSHave Cheapened Volatility in the Cap/Floor Meaningfully Relative to 15 Year Markets Hit a Low in July 2013 MBS
| 8 |
|
|
|
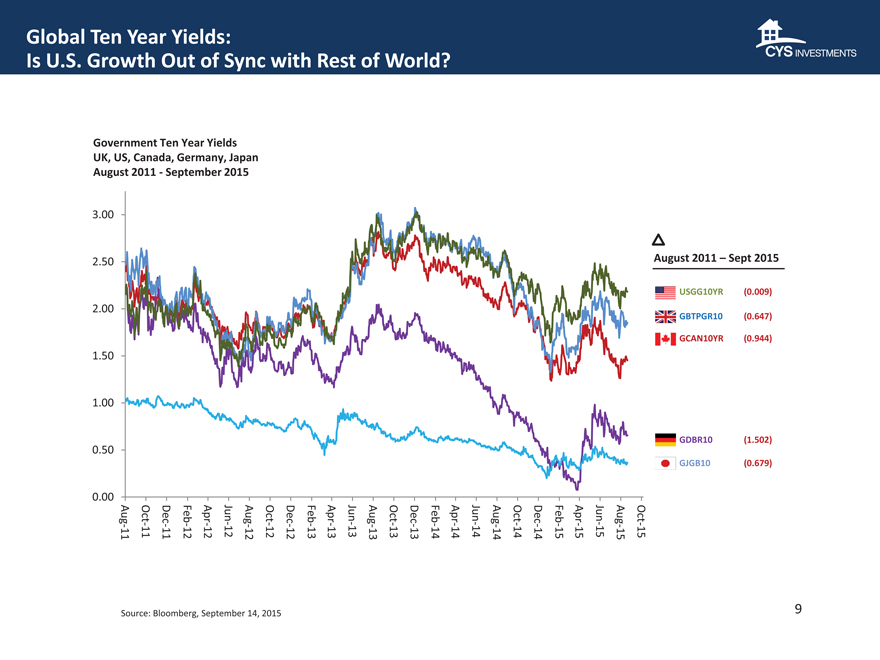
Global Ten Year Yields:
Is U.S. Growth Out of Sync with Rest of World-
Government Ten Year Yields
UK, US, Canada, Germany, Japan
August 2011 -September 2015
3.00 2.50 2.00 1.50 1.00 0.50 0.00
Aug Oct - Dec Feb Apr Jun - Aug Oct Dec Feb Apr - Jun Aug Oct Dec Feb Apr Jun - Aug Oct Dec Feb Apr Jun - Aug Oct
- - - - - - - - - - - - - - - - - - - - -
11 11 11 12 12 12 12 12 12 13 13 13 13 13 13 14 14 14 14 14 14 15 15 15 15 15
August 2011 –Sept 2015
USGG10YR (0.009) GBTPGR10 (0.647) GCAN10YR (0.944)
GDBR10 (1.502)
GJGB10 (0.679)
Source: Bloomberg, September 14, 2015
9
|
|
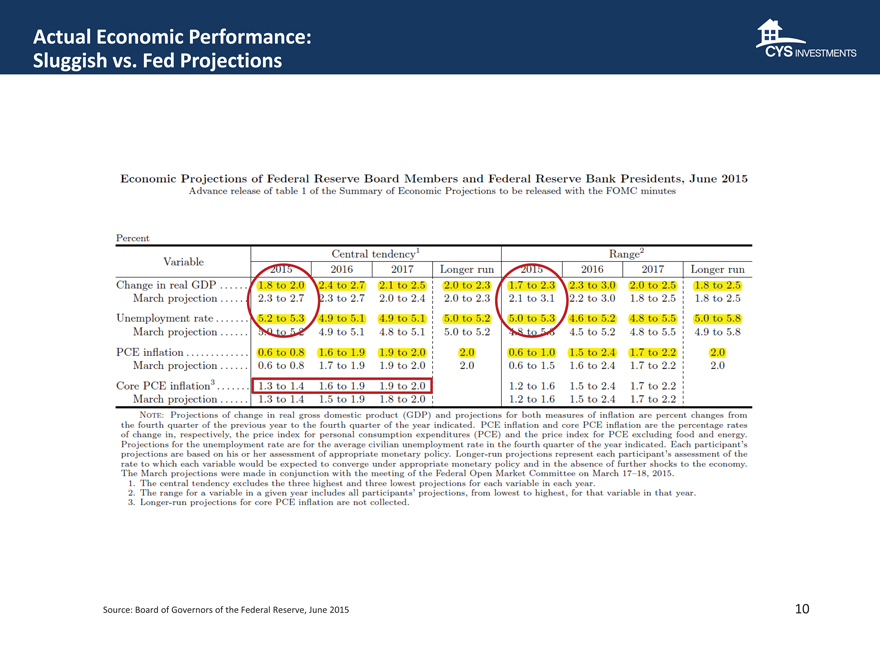
Actual Economic Performance: Sluggish vs. Fed Projections
Source: Board of Governors of the Federal Reserve, June 2015 10
|
|
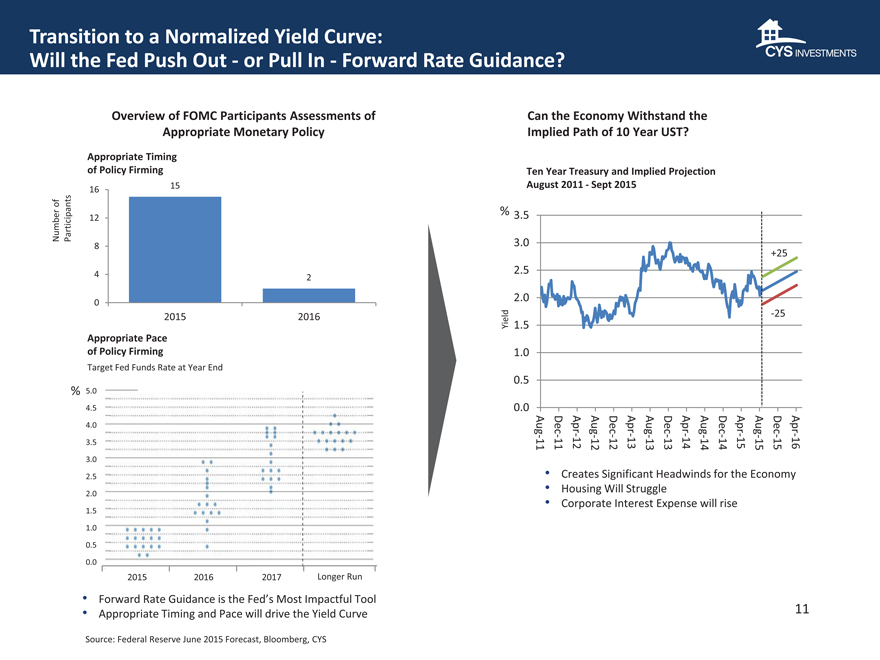
Transition to a Normalized Yield Curve:
Will the Fed Push Out -or Pull In -Forward Rate Guidance-
Overview of FOMC Participants Assessments of Appropriate Monetary Policy
Appropriate Timing of Policy Firming
15 16 of Number Participants 12 8
| 4 |
|
2 |
0
2015 2016
Appropriate Pace of Policy Firming
Target Fed Funds Rate at Year End
% 5.0 4.5
4.0 3.5 3.0 2.5 2.0 1.5 1.0 0.5
0.0
2015 2016 2017 Longer Run
Forward Rate Guidance is the Fed’s Most Impactful Tool
Appropriate Timing and Pace will drive the Yield Curve
Source: Federal Reserve June 2015 Forecast, Bloomberg, CYS
Can the Economy Withstand the Implied Path of 10 Year UST-
Ten Year Treasury and Implied Projection August 2011 -Sept 2015
% 3.5
3.0
+25
2.5
2.0
-25
Yield 1.5
1.0 0.5 0.0
Aug Dec Apr - Aug Dec Apr - Aug Dec Apr - Aug Dec Apr - Aug Dec - Apr
- - - - - - - - - -
11 11 12 12 12 13 13 13 14 14 14 15 15 15 16
Creates Significant Headwinds for the Economy
Housing Will Struggle
Corporate Interest Expense will rise
11
|
|
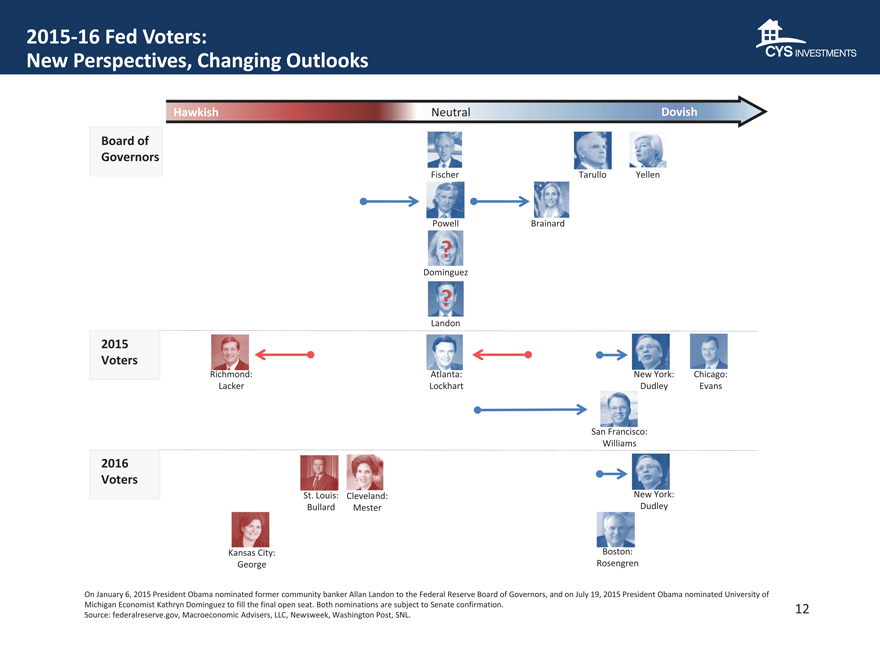
2015 -16 Fed Voters:
New Perspectives, Changing Outlooks
Hawkish Neutral Dovish
Board of Governors
Fischer Tarullo Yellen
Powell Brainard
-
Dominguez
-
Landon
2015 Voters
Richmond: Atlanta: New York: Chicago: Lacker Lockhart Dudley Evans
San Francisco: Williams
2016 Voters
St. Louis: Cleveland: New York: Bullard Mester Dudley
Kansas City: Boston: George Rosengren
On January 6, 2015 President Obama nominated former community banker Allan Landon to the Federal Reserve Board of Governors, and on July 19, 2015 President Obama nominated University of
Michigan Economist Kathryn Dominguez to fill the final open seat. Both nominations are subject to Senate confirmation. 12 Source: federalreserve. gov, Macroeconomic Advisers, LLC, Newsweek, Washington Post, SNL.
|
|
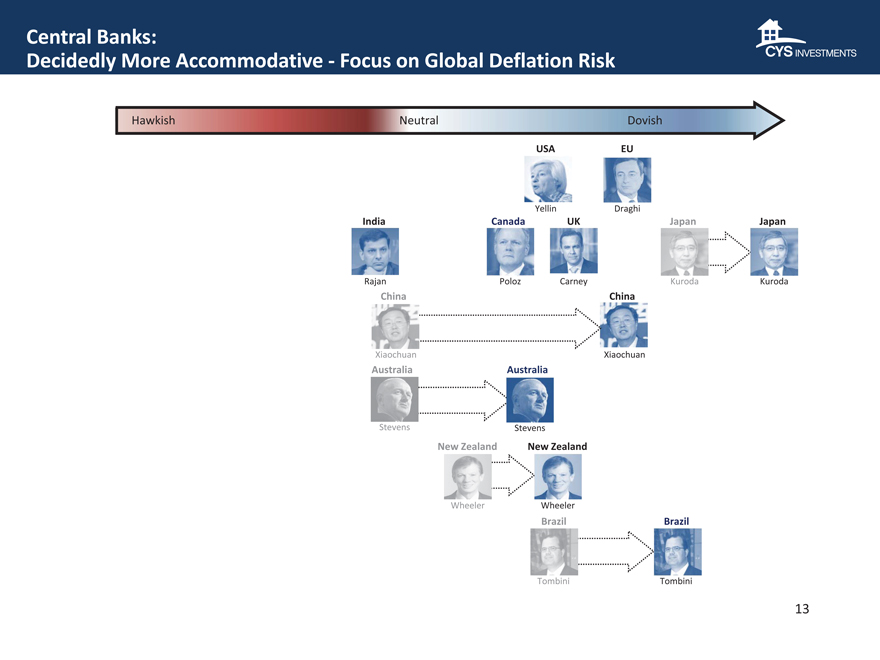
Central Banks:
Decidedly More Accommodative -Focus on Global Deflation Risk
Hawkish Neutral Dovish
USA EU
Yellin Draghi
India Canada UK Japan Japan
Rajan Poloz Carney Kuroda Kuroda
China China
Xiaochuan Xiaochuan
Australia Australia
Stevens Stevens
New Zealand New Zealand
Wheeler Wheeler
Brazil Brazil
Tombini Tombini
13
|
|
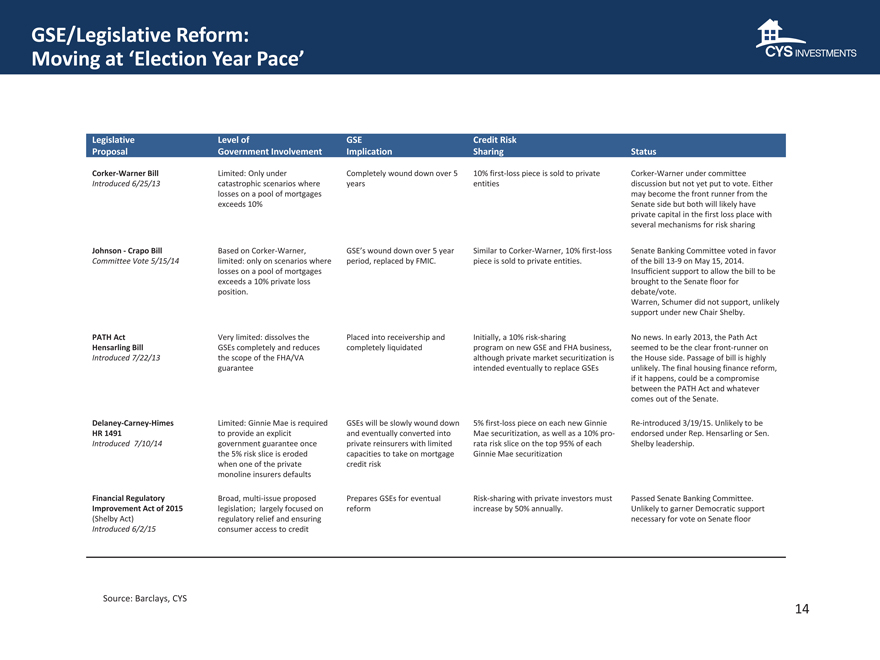
GSE/Legislative Reform:
Moving at ‘Election Year Pace’
Legislative Level of GSE Credit Risk
Proposal Government Involvement Implication Sharing Status
Corker-Warner Bill Limited: Only under Completely wound down over 5 10% first-loss piece is sold to private Corker-Warner under committee Introduced 6/25/13 catastrophic scenarios where years entities discussion but not yet put to vote. Either losses on a pool of mortgages may become the front runner from the exceeds 10% Senate side but both will likely have private capital in the first loss place with several mechanisms for risk sharing
Johnson -Crapo Bill Based on Corker-Warner, GSE’s wound down over 5 year Similar to Corker-Warner, 10% first-loss Senate Banking Committee voted in favor Committee Vote 5/15/14 limited: only on scenarios where period, replaced by FMIC. piece is sold to private entities. of the bill 13-9 on May 15, 2014. losses on a pool of mortgages Insufficient support to allow the bill to be exceeds a 10% private loss brought to the Senate floor for position. debate/vote.
Warren, Schumer did not support, unlikely support under new Chair Shelby.
PATH Act Very limited: dissolves the Placed into receivership and Initially, a 10% risk-sharing No news. In early 2013, the Path Act Hensarling Bill GSEs completely and reduces completely liquidated program on new GSE and FHA business, seemed to be the clear front-runner on Introduced 7/22/13 the scope of the FHA/VA although private market securitization is the House side. Passage of bill is highly guarantee intended eventually to replace GSEs unlikely. The final housing finance reform, if it happens, could be a compromise between the PATH Act and whatever comes out of the Senate.
Delaney -Carney-Himes Limited: Ginnie Mae is required GSEs will be slowly wound down 5% first-loss piece on each new Ginnie Re-introduced 3/19/15. Unlikely to be HR 1491 to provide an explicit and eventually converted into Mae securitization, as well as a 10% pro- endorsed under Rep. Hensarling or Sen. Introduced 7/10/14 government guarantee once private reinsurers with limited rata risk slice on the top 95% of each Shelby leadership. the 5% risk slice is eroded capacities to take on mortgage Ginnie Mae securitization when one of the private credit risk monoline insurers defaults
Financial Regulatory Broad, multi-issue proposed Prepares GSEs for eventual Risk-sharing with private investors must Passed Senate Banking Committee. Improvement Act of 2015 legislation; largely focused on reform increase by 50% annually. Unlikely to garner Democratic support (Shelby Act) regulatory relief and ensuring necessary for vote on Senate floor Introduced 6/2/15 consumer access to credit
Source: Barclays, CYS
14
|
|
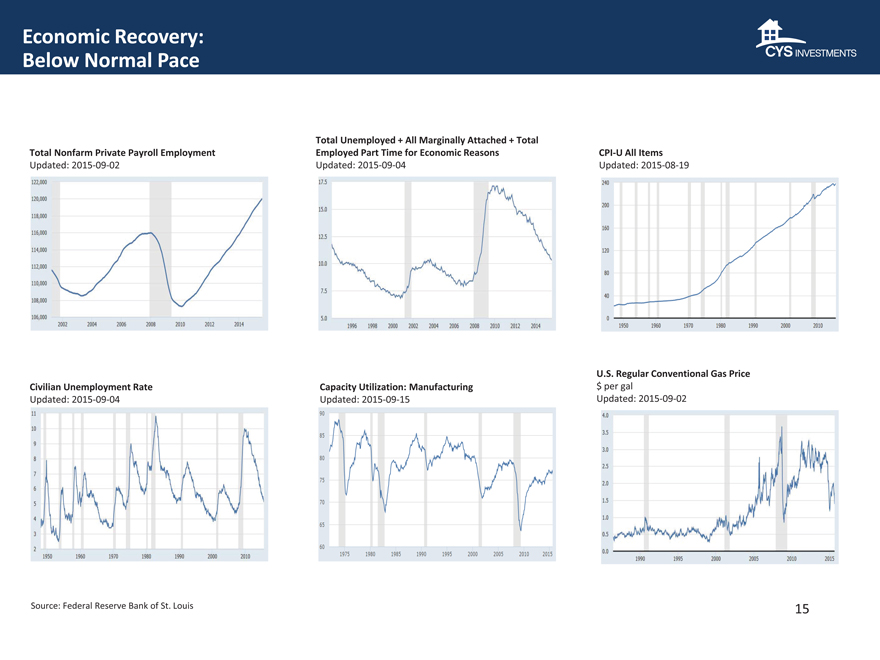
Economic Recovery: Below Normal Pace
Total Unemployed + All Marginally Attached + Total
Total Nonfarm Private Payroll Employment Employed Part Time for Economic Reasons CPI-U All Items
Updated: 2015-09-02 Updated: 2015-09-04 Updated: 2015-08-19
U.S. Regular Conventional Gas Price Civilian Unemployment Rate Capacity Utilization: Manufacturing $ per gal Updated: 2015-09-04 Updated: 2015-09-15 Updated: 2015-09-02
Source: Federal Reserve Bank of St. Louis 15
|
|
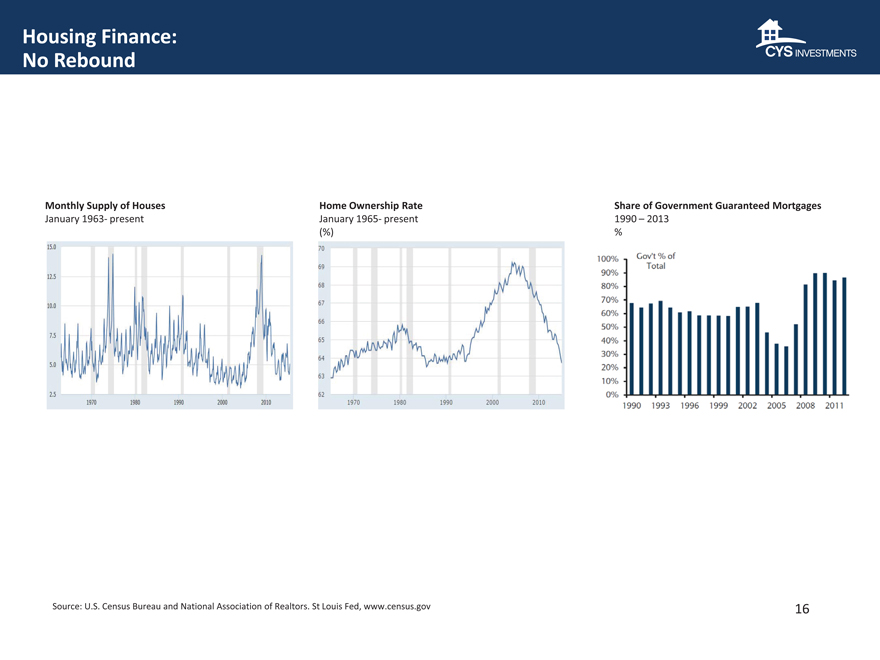
Housing Finance: No Rebound
Monthly Supply of Houses Home Ownership Rate Share of Government Guaranteed Mortgages
January 1963-present January 1965-present 1990 –2013 (%) %
Source: U.S. Census Bureau and National Association of Realtors. St Louis Fed, www.census.gov
16
|
|
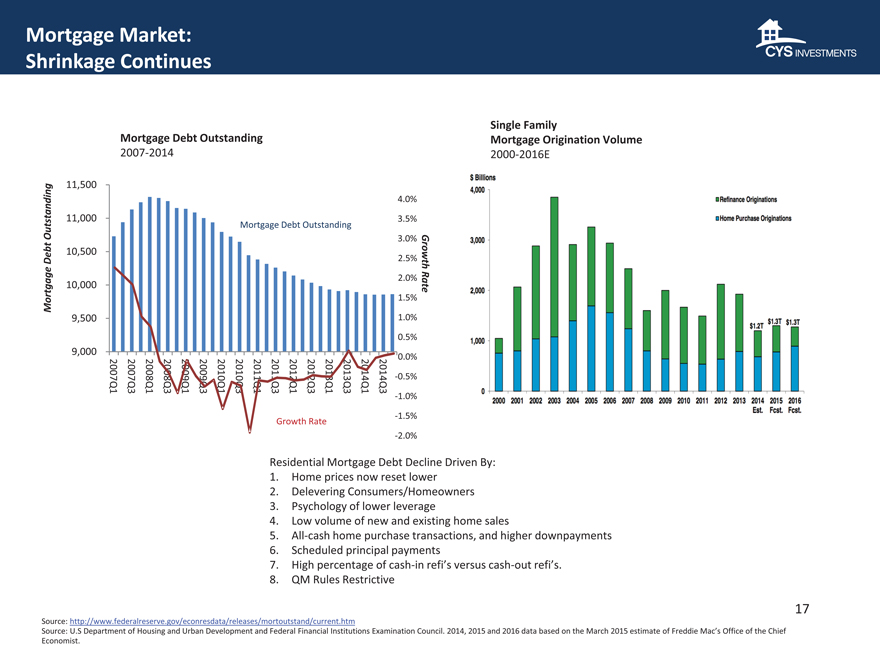
Mortgage Market: Shrinkage Continues
Single Family
Mortgage Debt Outstanding Mortgage Origination Volume
2007-2014 2000-2016E
11,500
4.0%
11,000 3.5%
Outstanding Mortgage Debt Outstanding
3.0%
10,500
Debt 2.5%
Growth
2.0%
10,000 Rate Mortgage 1.5%
9,500 1.0%
0.5%
9,000
0.0%
2007Q1 2007Q3 2008Q1 2008Q3 2009Q1 2009Q3 2010Q1 2010Q3 2011Q1 2011Q3 2012Q1 2012Q3 2013Q1 2013Q3 2014Q1 2014Q3 -0.5%
-1.0%
-1.5% Growth Rate -2.0%
Residential Mortgage Debt Decline Driven By:
1. Home prices now reset lower
2. Delevering Consumers/Homeowners
3. Psychology of lower leverage
4. Low volume of new and existing home sales
5. All-cash home purchase transactions, and higher downpayments
6. Scheduled principal payments
7. High percentage of cash-in refi’sversus cash-out refi’s.
8. QM Rules Restrictive
17
Source: http://www. federalreserve. gov/econresdata/releases/mortoutstand/current. htm
Source: U.S Department of Housing and Urban Development and Federal Financial Institutions Examination Council. 2014, 2015 and 2016 data based on the March 2015 estimate of Freddie Mac’s Office of the Chief Economist.
|
|
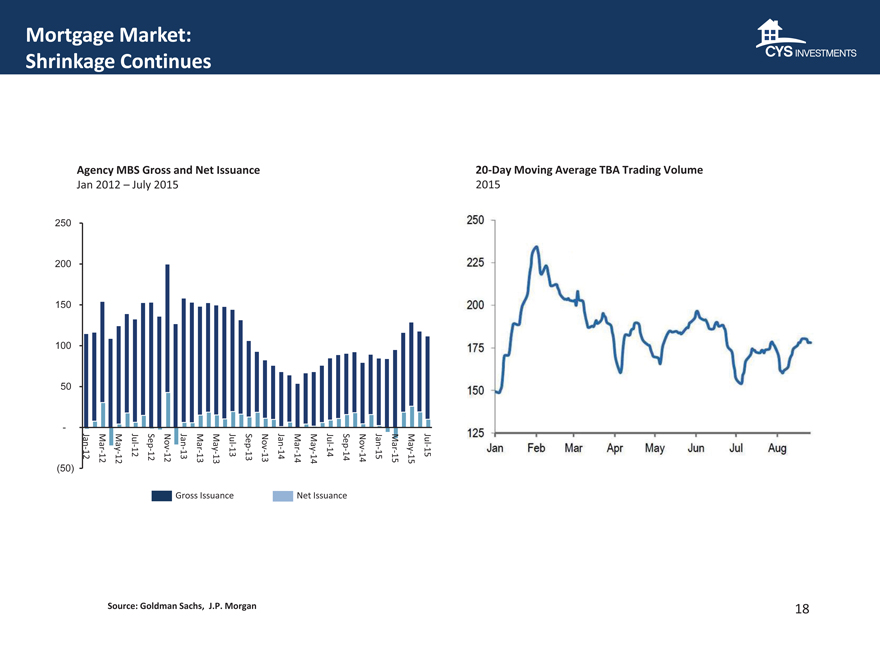
Mortgage Market:
Shrinkage Continues
Agency MBSGross and Net Issuance 20-Day Moving Average TBA Trading Volume
Jan 2012 –July 2015 2015
250 200 150 100 50
—
Jan - 12 Jul Sep Nov Jan Jul - 13 Sep Nov Jan Jul - 14 Sep Nov Jan Jul -- 12 Mar May 13 - Mar May 14 - Mar May - 15 Mar May
- - - - - -
12 - - 12 12 13 - - 13 13 14 - - 14 14 - 15 - 15
12 13 14 15
| (50) |
|
Gross Issuance Net Issuance
Source: Goldman Sachs, J.P. Morgan
18
|
|
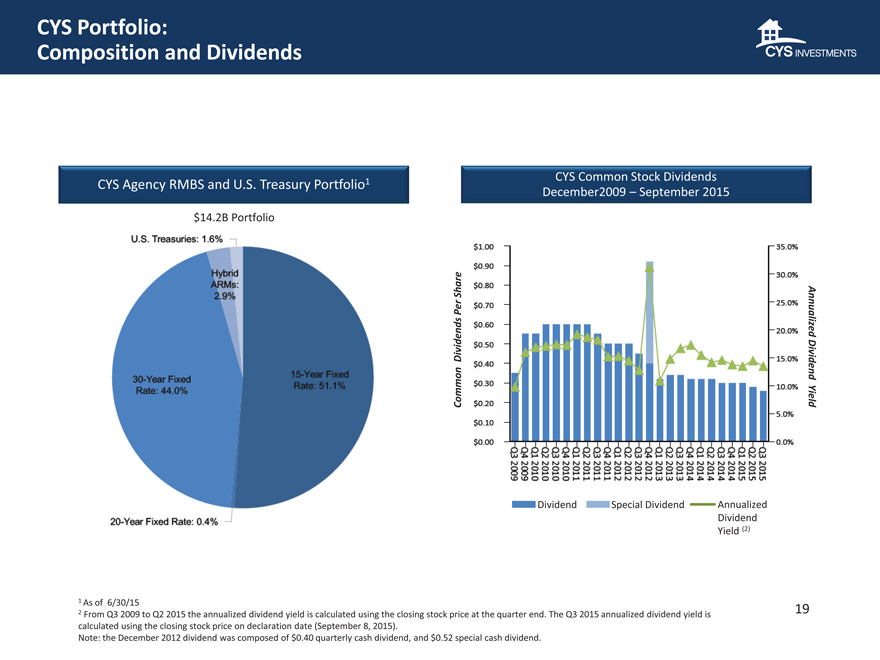
CYS Portfolio:
Composition and Dividends
CYS Common Stock Dividends
CYS Agency RMBS and U.S. Treasury Portfolio 1
December2009 – September 2015
$14.2B Portfolio
Share
Per Annualized
Dividends
Dividend
Common Yield
Dividend
Special Dividend
Annualized
Dividend
Yield (2)
| 1 |
|
As of 6/30/15 19 |
2 From Q3 2009 to Q2 2015 the annualized dividend yield is calculated using the closing stock price at the quarter end. The Q3 2015 annualized dividend yield is calculated using the closing stock price on declaration date (September 8, 2015).
Note: the December 2012 dividend was composed of $0.40 quarterly cash dividend, and $0.52 special cash dividend.
|
|
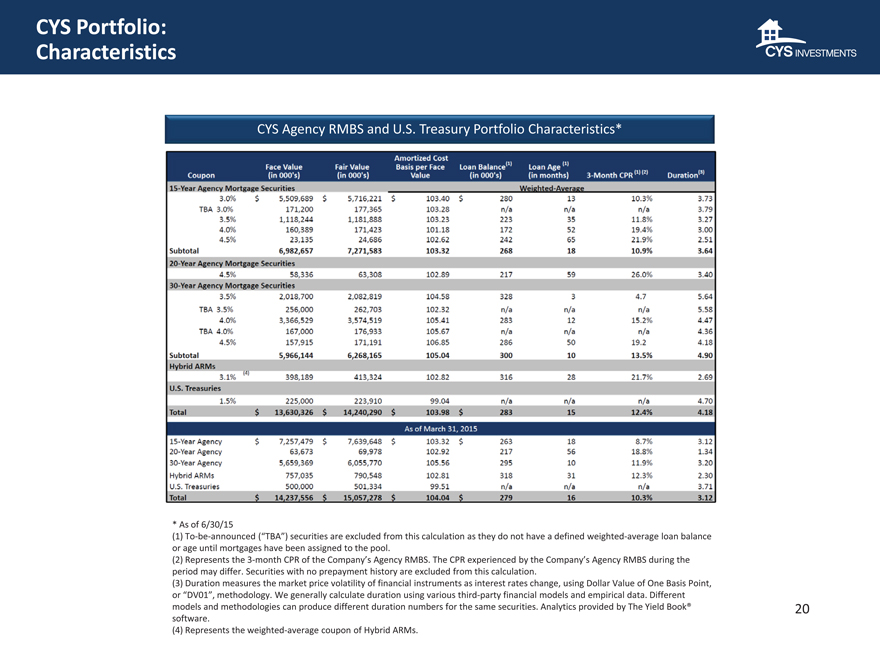
CYS Portfolio: Characteristics
CYS Agency RMBS and U.S. Treasury Portfolio Characteristics*
| * |
|
As of 6/30/15 |
(1) To-be-announced (“TBA”) securities are excluded from this calculation as they do not have a defined weighted -average loan balance or age until mortgages have been assigned to the pool.
(2) Represents the 3-month CPR of the Company’s Agency RMBS. The CPR experienced by the Company’s Agency RMBS during the period may differ. Securities with no prepayment history are excluded from this calculation.
(3) Duration measures the market price volatility of financial instruments as interest rates change, using Dollar Value of One Basis Point, or “DV01”, methodology. We generally calculate duration using various third-party financial models and empirical data. Different models and methodologies can produce different duration numbers for the same securities. Analytics provided by The Yield Book® 20 software.
| (4) |
|
Represents the weighted -average coupon of Hybrid ARMs. |
|
|
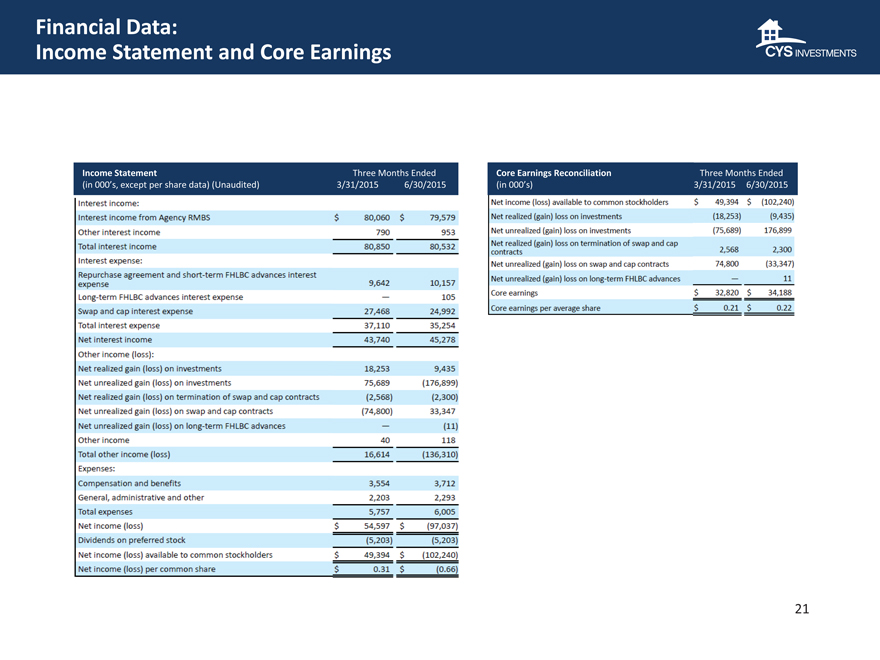
Financial Data:
Income Statement and Core Earnings
Income Statement Three Months Ended Core Earnings Reconciliation Three Months Ended (in 000’s, except per share data) (Unaudited) 3/31/2015 6/30/2015 (in 000’s) 3/31/2015 6/30/2015
21
|
|
Financial Data:
Key Balance Sheet and Performance Metrics
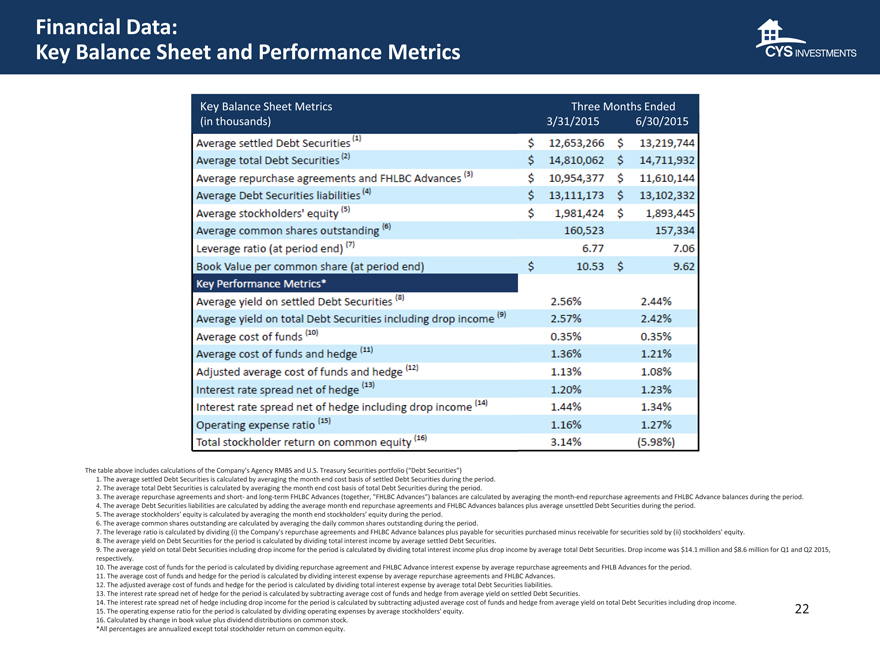
Key Balance Sheet Metrics Three Months Ended (in thousands) 3/31/2015 6/30/2015
The table above includes calculations of the Company’s Agency RMBS and U.S. Treasury Securities portfolio (“Debt Securities”)
1. The average settled Debt Securities is calculated by averaging the month end cost basis of settled Debt Securities during the period. 2. The average total Debt Securities is calculated by averaging the month end cost basis of total Debt Securities during the period.
3. The average repurchase agreements and short-and long-term FHLBC Advances (together, “FHLBC Advances”) balances are calculated by averaging the month-end repurchase agreements and FHLBC Advance balances during the period. 4. The average Debt Securities liabilities are calculated by adding the average month end repurchase agreements and FHLBC Advances balances plus average unsettled Debt Securities during the period.
5. The average stockholders’ equity is calculated by averaging the month end stockholders’ equity during the period.
6. The average common shares outstanding are calculated by averaging the daily common shares outstanding during the period.
7. The leverage ratio is calculated by dividing (i) the Company’s repurchase agreements and FHLBC Advance balances plus payable for securities purchased minus receivable for securities sold by (ii) stockholders’ equity. 8. The average yield on Debt Securities for the period is calculated by dividing total interest income by average settled Debt Securities.
9. The average yield on total Debt Securities including drop income for the period is calculated by dividing total interest income plus drop income by average total Debt Securities. Drop income was $14.1 million and $8.6 million for Q1 and Q2 2015,
respectively.
10. The average cost of funds for the period is calculated by dividing repurchase agreement and FHLBC Advance interest expense by average repurchase agreements and FHLB Advances for the period. 11. The average cost of funds and hedge for the period is calculated by dividing interest expense by average repurchase agreements and FHLBC Advances.
12. The adjusted average cost of funds and hedge for the period is calculated by dividing total interest expense by average total Debt Securities liabilities.
13. The interest rate spread net of hedge for the period is calculated by subtracting average cost of funds and hedge from average yieldon settled Debt Securities.
14. The interest rate spread net of hedge including drop income for the period is calculated by subtracting adjusted average cost of funds and hedge from average yield on total Debt Securities including drop income.
15. The operating expense ratio for the period is calculated by dividing operating expenses by average stockholders’ equity. 22 16. Calculated by change in book value plus dividend distributions on common stock.
*All percentages are annualized except total stockholder return on common equity.
|
|
Investment Outlook
September 2015
Kevin E. Grant, CFA Chief Executive Officer and President
Barclays Global Financial Services Conference September 17, 2015