Attached files
| file | filename |
|---|---|
| 8-K - 8-K - CITIZENS FINANCIAL GROUP INC/RI | d76001d8k.htm |
 Barclays Global Financial Services Conference
Bruce Van Saun
Chief Executive Officer
September 16, 2015
Exhibit 99.1 |
 Important Information and GAAP/Non-GAAP Information
1 This document contains forward-looking statements within the Private Securities Litigation Reform Act of 1995. Any statement that does not describe historical or current facts is a forward-looking statement. These statements often include the words “believes,” “expects,” “anticipates,” “estimates,” “intends,” “plans,” “goals,” “targets,” “initiatives,” “potentially,” “probably,” “projects,” “outlook” or similar expressions or future conditional verbs such as “may,” “will,” “should,” “would,” and “could.” Forward-looking statements are based upon the current beliefs and expectations of management, and on information currently available to management. Our statements speak as of the date hereof, and we do not assume any obligation to update these statements or to update the reasons why actual results could differ from those contained in such statements in light of new information or future events. We caution you, therefore, against relying on any of these forward-looking statements. They are neither statements of historical fact nor guarantees or assurances of future performance. While there is no assurance that any list of risks and uncertainties or risk factors is complete, important factors that could cause actual results to differ materially from those in the forward-looking statements include the following, without limitation: negative economic conditions that adversely affect the general economy, housing prices, the job market, consumer confidence and spending habits which may affect, among other things, the level of nonperforming assets, charge-offs and provision expense; the rate of growth in the economy and employment levels, as well as general business and economic conditions; our ability to implement our strategic plan, including the cost savings and efficiency components, and achieve our indicative performance targets; our ability to remedy regulatory deficiencies and meet supervisory requirements and expectations; liabilities resulting from litigation and regulatory investigations; our capital and liquidity requirements (including under regulatory capital standards, such as the Basel III capital standards) and our ability to generate capital internally or raise capital on favorable terms; the effect of the current low interest rate environment or changes in interest rates on our net interest income, net interest margin and our mortgage originations, mortgage servicing rights and mortgages held for sale; changes in interest rates and market liquidity, as well as the magnitude of such changes, which may reduce interest margins, impact funding sources and affect the ability to originate and distribute financial products in the primary and secondary markets; the effect of changes in the level of checking or savings account deposits on our funding costs and net interest margin; financial services reform and other current, pending or future legislation or regulation that could have a negative effect on our revenue and businesses, including the Dodd-Frank Act and other legislation and regulation relating to bank products and services; a failure in or breach of our operational or security systems or infrastructure, or those of our third party vendors or other service providers, including as a result of cyber attacks; management’s ability to identify and manage these and other risks; and any failure by us to successfully replicate or replace certain functions, systems and infrastructure provided by The Royal Bank of Scotland Group plc (RBS). In addition to the above factors, we also caution that the amount and timing of any future common stock dividends or share repurchases will depend on our financial condition, earnings, cash needs, regulatory constraints, capital requirements (including requirements of our subsidiaries), and any other factors that our board of directors deems relevant in making such a determination. Therefore, there can be no assurance that we will pay any dividends to holders of our common stock, or as to the amount of any such dividends. In addition, the timing and manner of the sale of RBS’s remaining ownership of our common stock remains uncertain, and we have no control over the manner in which RBS may seek to divest such remaining shares. Any such sale could impact the price of our shares of common stock. More information about factors that could cause actual results to differ materially from those described in the forward-looking statements can be found under “Risk Factors” in Part I, Item 1A in our Annual Report on Form 10-K for the year ended December 31, 2014, filed with the United States Securities and Exchange Commission on March 3, 2015. Note: Percentage changes, per share amounts, and ratios presented in this document are calculated using whole dollars. Non-GAAP Financial Measures This document contains non-GAAP financial measures. The Appendix hereto presents reconciliations of certain non-GAAP financial measures to the most directly comparable GAAP measures. These non-GAAP measures include “core revenue”, “core noninterest income”, “core noninterest expense”, “core net income”, “total average deposits”, “interest-bearing deposits”, “core expense to core earning assets”, and “core net interest margin”. In addition, we present computations for "tangible book value per common share", “return on average tangible common equity”, “return on average total tangible assets”, “efficiency ratio”, “core return on average tangible common equity”, and “core efficiency ratio” as part of our non-GAAP measures. Additionally, "pro forma Basel III fully phased-in common equity tier 1 capital" computations for applicable periods are presented as part of our non-GAAP measures. We believe these non-GAAP measures provide useful information to investors because these are among the measures used by our management team to evaluate our operating performance and to make day-to-day operating decisions. We believe this presentation also increases comparability of period-to-period results. We also consider pro forma capital ratios defined by banking regulators but not effective at each period end to be non-GAAP financial measures. Since analysts and banking regulators may assess our capital adequacy using these pro forma ratios, we believe they are useful to provide investors the ability to assess our capital adequacy on the same basis. Other companies may use similarly titled non-GAAP financial measures that are calculated differently from the way we calculate such measures. Accordingly, our non-GAAP financial measures may not be comparable to similar measures used by other companies. We caution investors not to place undue reliance on such non-GAAP measures, but instead to consider them with the most directly comparable GAAP measure. Non-GAAP financial measures have limitations as analytical tools, and should not be considered in isolation, or as a substitute for our results as reported under GAAP. |
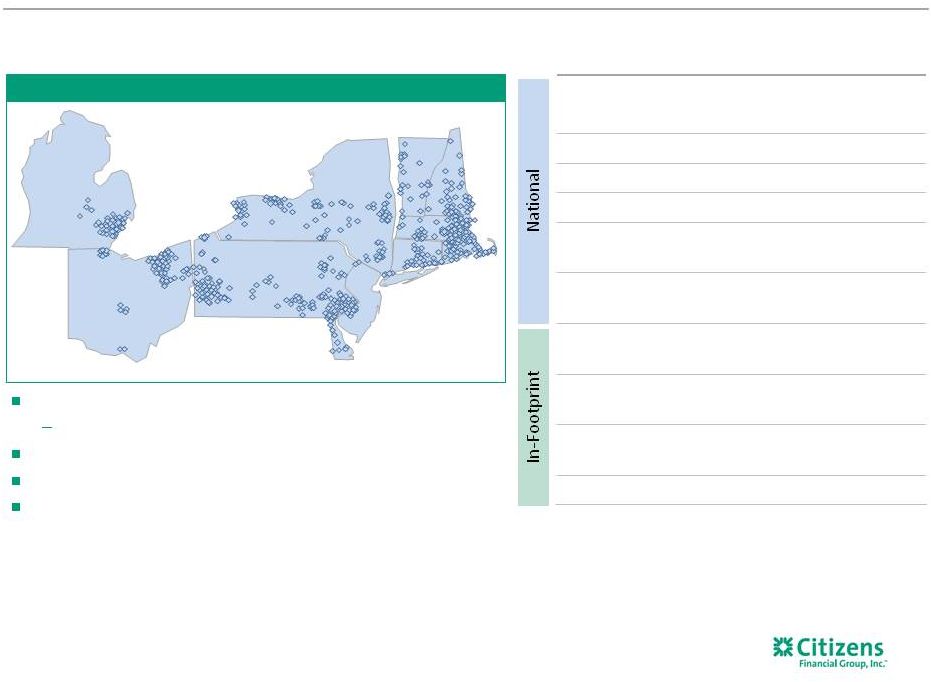 Dimension (2) Rank (3) Assets - $137.3 billion #13 Loans - $96.5 billion #12 Deposits - $100.6 billion #13 Branches - ~1,200 #12 ATM network - ~3,200 #7 Lead/joint lead bookrunner #9 (4) Student - $ 3.4 billion Top 4 rank nationally (5) Deposits - $100.6 billion Top 5 rank: 9/10 markets (1) HELOC - $15.4 billion Top 5 rank: 8/9 markets (6) Mortgage - $12.3 billion Top 5 rank: 2/9 markets (7) Middle-market lending #5 (8) Leading deposit market share of 9.1% in top 10 MSAs (1) #2 deposit market share in New England Relatively diverse economies/affluent demographics Serve 5 million+ individuals, institutions and companies ~17,900 colleagues Retail presence in 11 states Top 5 deposit market share in 9 of 10 largest MSAs (1) Buffalo, NY: #4 Albany, NY: #2 Pittsburgh, PA: #2 Cleveland, OH: #4 Manchester, NH: #1 Boston, MA: #2 Rochester, NY: #4 Philadelphia, PA: #5 Detroit, MI: #8 Providence, RI: #1 Solid franchise with leading positions in attractive markets 2 Source: SNL Financial, unless otherwise noted.
1) Updated
annually, as of 6/30/2014, excludes non-retail branches and banks with limited retail operations.
2) Data as of 6/30/2015, unless
otherwise noted. 3) Ranking based on 6/30/2015 data , unless otherwise noted; excludes non-retail depository
institutions, includes U.S. subsidiaries of foreign banks. 4) Thomson Reuters LPC, 2Q15 data based on number of deals for Overall Middle Market (defined as
Borrower Revenues < $500MM and Deal Size < $500MM). 5) CFG estimate, based on published company reports, where available, private student loan
origination data as of 12/31/2014. 6) According to Equifax; origination volume as of 6/30/2015. 7) According to Equifax; origination volume as of 3/31/2015. 8) Based on market penetration, according to Greenwich Associates 2Q15 rolling four-quarter
data (Citizens – Footprint - $25-500MM). |
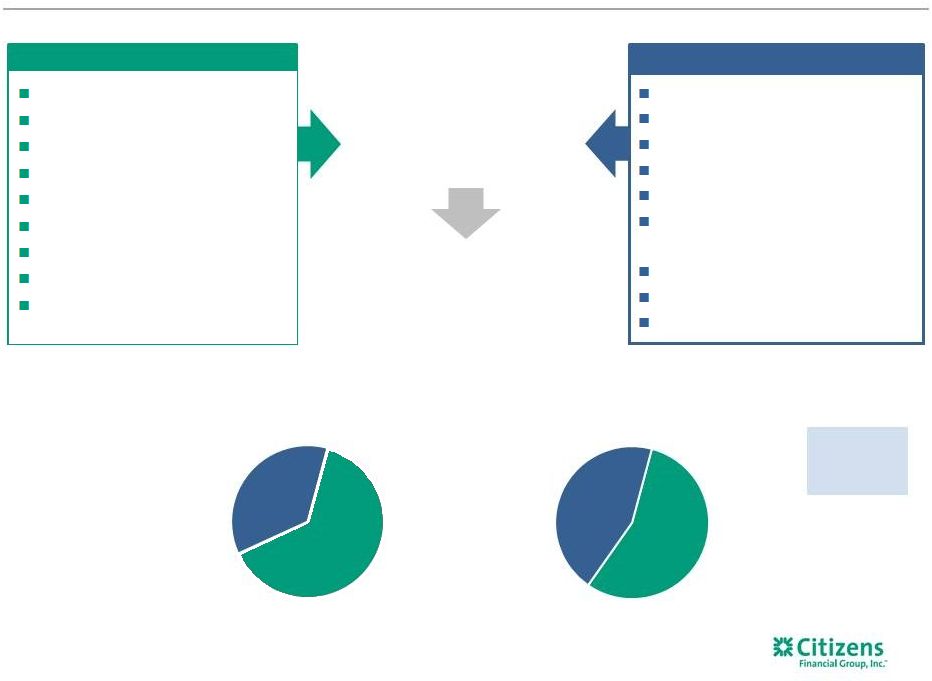 Corporate Banking
Commercial Real Estate
Franchise Finance
Asset Finance
PE/Sponsor Finance
Healthcare/Technology/Not
for Profit verticals
Capital Markets
Treasury Solutions
Commercial Deposit Services
Retail Deposit Services
Mobile/Online Banking
Credit/Debit Card
Wealth Management
Home Equity loans/lines
Mortgage Auto Education Finance Business Banking Consumer Commercial Deep client relationships + Extensive product set 3 Robust product offerings and balanced business mix Targeting 50/50 Mix Period-end loans and leases (1) $94 billion 2Q15 $74 billion 2009 1) Reflects loans and leases and loans and leases held for sale in our operating segments (Consumer and Commercial Banking). Excludes
loans held in Other/Non-core loans. Drive cross-sell and
wallet share
55% 45% Commercial Consumer 64% 36% Commercial Consumer |
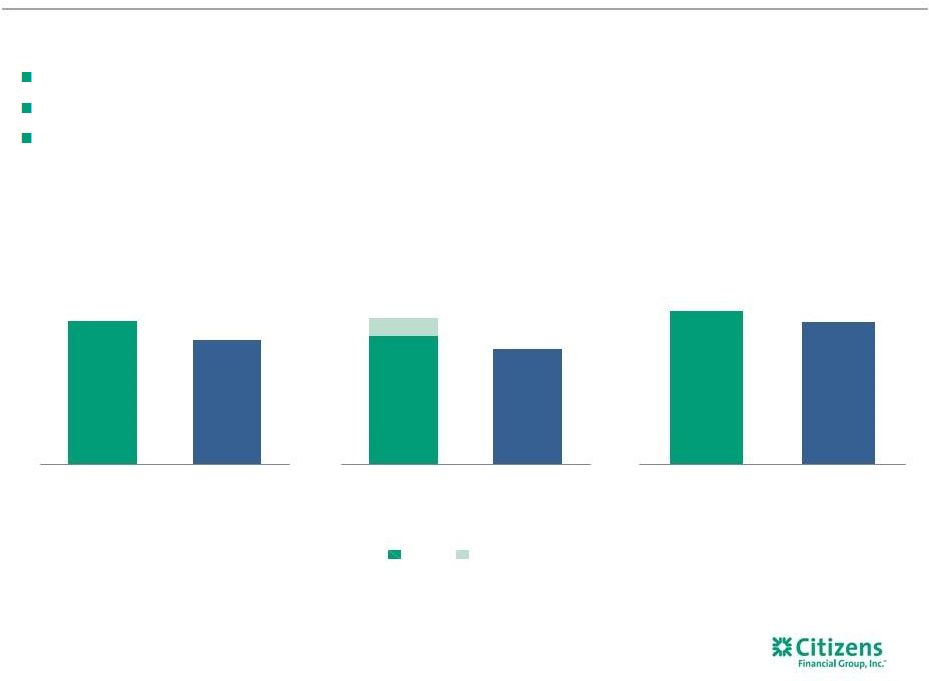 Well capitalized with a Common equity tier 1 capital ratio of 11.8% (1) on a fully phased-in Basel III basis Solid asset quality performance with core net charge-offs of 29 bps in 2Q15
Strong deposit franchise with $81.4 billion of core deposits (2) , or 83% of average total deposits, and a total deposit cost of 24 bps and strong liquidity coverage Source: SNL Financial, Company filings. 1) Non-GAAP item. See Appendix for a reconciliation of non-GAAP items.
2) Excludes term and brokered deposits. 3) Peer banks include BBT, CMA, FITB, KEY, MTB, PNC, RF, STI and USB. 4) Non-core peer charge-offs reflects data from quarterly filings where non-core data disclosed.
5) Peer average includes reported numbers from BBT, CMA, FITB, and guidance from KEY, PNC, STI, and USB.
2Q15 period-end
Common equity tier 1 ratio
(Basel III transitional basis Common equity tier 1 ratios)
2Q15 liquidity coverage ratio
(3,5) (3) Strong, clean balance sheet funded with low-cost deposits 4 2Q15 net charge-offs/ average loans and leases (4) Core Non-Core Peer Average (3) 108% 101% CFG Peer Average 0.29% 0.33% 0.26% CFG 11.8% 10.2% CFG Peer Average |
 Aspire to be a top-performing regional bank, delivering well for all
stakeholders 5
Colleagues Regulators Investors Communities & Society Customer-centric culture Customers |
 Where we’ve come from
Lagging revenue productivity
Under-levered balance sheet
Lack of scale in key businesses
Sub-optimal asset mix/risk
appetite Product and customer proposition behind peers Under investment in brand Where we are now Developed and implemented a plan to address underlying issues and grow revenues Just entering “middle innings” Making steady progress Target meaningful operating leverage during the turnaround phase Where we’re going Well-balanced Commercial and Consumer business mix Leading customer service and value proposition Capital deployment that delivers optimal risk-adjusted returns, NIM, cross sell Organic growth focus Powerful, respected brand Building a top-performing regional bank Have invested $500 million above natural technology spend level over past 5 years Efficiency initiatives are self- funding growth initiatives Lagging technology investment and sub-optimal expense investment Technology platform that is customer-centric, reliable, resilient and efficient Inconsistent and non- comprehensive risk framework Significant efforts in progress to advance risk/regulatory capabilities Fully capable of meeting rising regulatory expectations; strong embedded risk culture Immature governance and reporting capabilities Fully developed reporting capabilities; well-functioning Board and executive team Commitment to leadership excellence; widely respected, transparent reporting Need for greater accountability and sense of urgency Preserving “3C” historical culture while improving execution effectiveness Top quartile rank – Organizational Health Index, employee engagement 6 |
 Our strategy to achieve this is
to: Offer our customers a differentiated customer experience through the quality of our colleagues, products and services – Foster a culture around customer-centricity, commitment to excellence, leadership, teamwork and
integrity Build a great brand that invokes trust from our customers and reinforces our value
proposition –
Consumer: Simple. Clear. Personal.
– Commercial: Thought Leadership Strive to deliver attractive risk-adjusted returns by making good capital and resource allocation decisions, being good stewards of our resources, and rigorously evaluating our execution
Operate with a strong balance sheet with
regards to capital, liquidity and funding, coupled with a well-
defined and prudent risk appetite
Maintain a balanced business mix between
Commercial Banking and Consumer Banking Position the bank as a ‘community leader’ that makes a positive impact on the communities and local economies we serve Our objective is to be a top-performing regional bank that delivers well for our stakeholders
Our vision is to deliver the best possible banking experience
7 Our vision and strategy |
 Reenergize Household growth
Grow Auto Grow Education Finance Expand Business Banking Expand Mortgage sales force Expand Wealth sales force Build out Mid-Corporate & Specialty verticals Continued development of Capital Markets Build out Treasury Solutions Grow Franchise Finance Core Commercial growth Target 7 – 8% loan growth Complete $250 million remaining capital conversion transactions (1) Target $200 million expense savings by end of 2016 Continue significant technology investment CCAR progress Regulatory issue remediation New Vision & Credo Organization Health Index / Leadership standards Improved Consumer Bank Continued Commercial Momentum Balance Sheet Growth/ Capital Mix Normalization Enhanced Efficiency & Infrastructure Embed Robust Risk/Regulatory Framework High-Performing, Customer- Centric Culture 1) Subject to regulatory approval. 8 These priorities have been mapped to specific initiatives |
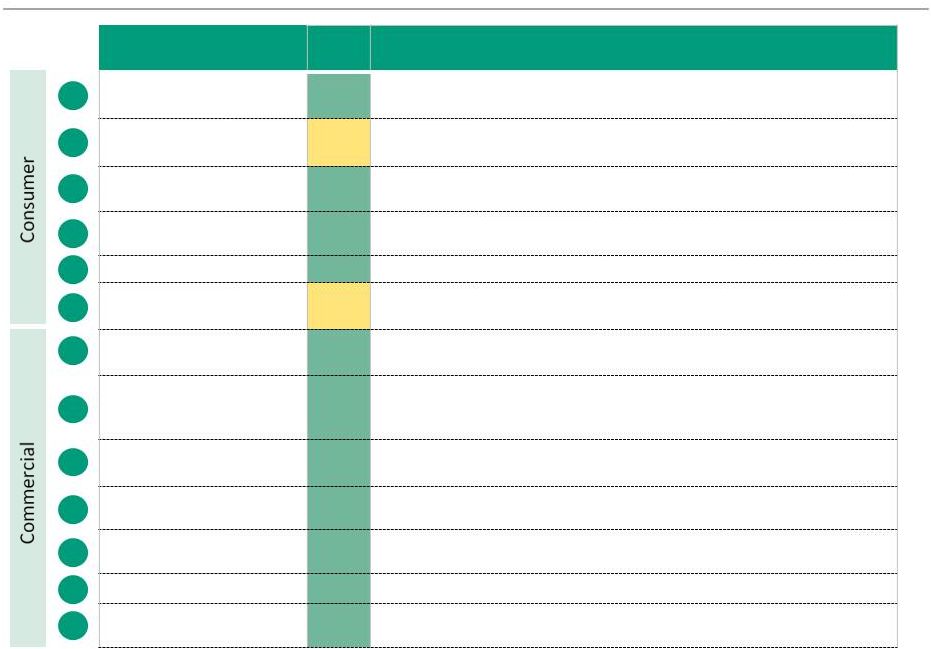 Summary of progress on strategic initiatives
9 1 2 3 4 5 6 7 8 9 10 11a 11b 11c Initiative 2Q15 Status Commentary Reenergize household growth 2Q15 YoY checking household growth of 2%; new customer cross-sell rate improved to 3.28 vs. 2.98 in 2Q14 Expand Mortgage sales force LOs up 86, or 23%, from 2Q14; Origination volume up 68% over 2Q14 given strong activity in both refinance and purchase originations Grow Auto Strong growth in organic originations which accounted for approximately 80% of origination volume in 2Q15 Grow Student Strong new refinance product originations of $363 million in 2Q15; new
Parent loan product launched in mid-April
Expand Business Banking
Origination volume of $160 million in 2Q15 up 25% vs. 2Q14
Expand Wealth sales
force Added 44 wealth managers and 169 licensed bankers over the past year (overall growth 33%); competitive hiring environment continues Build out Mid-Corp & Verticals Mid-Corp and specialty verticals grew YoY outstanding balances by 14%
and 38%, respectively
Continue development of
Capital Markets
Fee income growth of 15% YoY in 2Q15 driven by strong lead left
transactions, hiring efforts and continued build out of products and
capabilities
Build out Treasury
Solutions Continued investment in technology and focus on hiring specialists Grow Franchise Finance Strong client acquisition efforts with a 12% increase in customers in 2Q15 vs. 2Q14 Core: Middle Market Originations up 28% in 2Q15 vs. 2Q14, with commitment pipeline up over 10% YoY; continue to see competitive pricing environment Core: CRE CRE loans up 15% YoY to $7.7 billion at 2Q15 Core: Asset Finance New business initiatives progressing with portfolio balance increasing by 4% YoY |
 Spotlight: Current focus areas for Consumer Banking
Customer segmentation strategies
Improve customer satisfaction
Drive loyalty and profitability
Optimization of branch network and remote channels
Transform branches via multi-year initiative
Enhance digital capabilities to accelerate adoption rates
Invest in data capabilities
Build out targeting capabilities
Streamline fulfillment
Fine tune balance sheet growth
Optimize asset growth across mix, risk appetite, pricing
Arrest increase in deposit funding costs
Improve progress on Wealth and Mortgage initiatives
New leadership in Wealth: John Bahnken
Orienting model towards conforming/reviewing correspondent channel in
Mortgage 10 |
 Spotlight: Current focus areas for Commercial Banking
Continue to smartly grow deposits to improve segment LDR
Involves choices on how and where we play
Requires improved planning and disciplines
Tap full potential of Cash Management business
Continue technology investments to enhance capabilities
Further leverage investments in sales/product specialists
Evaluate opportunities for broader capital markets capabilities post
RBS Over time build capacity to do bond and equity underwriting,
middle-market M&A Drive originate/distribute model in CRE
and Asset Finance Sharpen “where we play”, grow Industry
Verticals Leverage new leadership structure
Fully build key verticals (technology, health care, energy) while investing in
others (insurance, government contractors)
11 |
    Incremental revenue and efficiency initiatives (Top 2)
12 Category Name Description Revenue Expense Operations $25-$30 Procurement $15-$20 Commercial Lending/ $20-$25 Treasury Services Consumer distribution channel effectiveness Launch effort to improve branch and contact center sales effectiveness, with the goal of deepening customer relationships $15-$20 $15-$20 Total $50-$65 $40-$50 $90-$115 2016 Targeted Pre-tax Benefit Efficiency Pricing Revenue Enhancement Improve customer pricing methodology to better align with competitive landscape, utilizing enhanced client segmentation Refine operating model to simplify organization, reduce costs, improve service levels and enhance controls Achieve cost reduction opportunities through further vendor management consolidation and tighter standards Develop improved high-value customer retention programs, and enhanced tools and analytics to improve cross-sell efforts ($s in millions) Commercial and Consumer |
 We
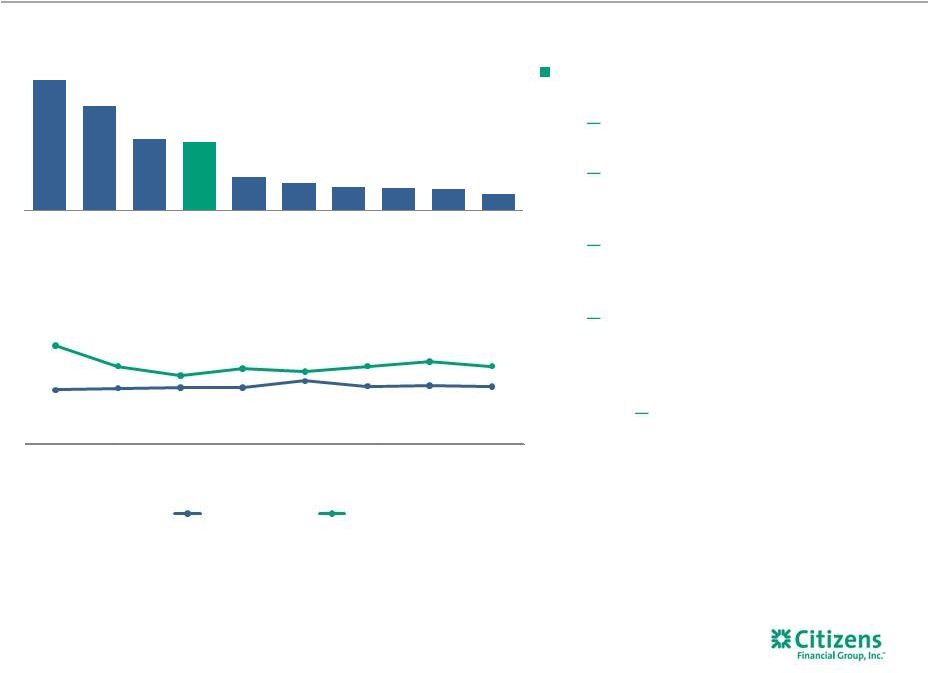
remain positioned for rising rates… 13
…but see plenty of opportunity to drive performance
by executing well on our initiatives
Interest-rate sensitivity trend
1) Peer banks include BBT, CMA, FITB, KEY, MTB, PNC, RF, STI and USB. Note: peer estimate based on public disclosures and utilizes 200 basis
point gradual increase above 12-month forward curve, except
for PNC and STI. 2)
PNC and STI disclose sensitivity for a 100 basis point gradual increase and 100
and 200 basis point shock, respectively. Utilized assumptions based on these disclosures to approximate sensitivity for a 200 basis point gradual increase.
(1) Net interest income poised to benefit from rising rates ~75% of asset sensitivity is centered around the short end of the yield curve ~82% of the commercial loan portfolio and half of home lending portfolio is floating rate Fixed-rate assets amortize more quickly than the various sources of fixed-rate funding Assume interest-bearing deposit betas of approximately 60% with total deposit betas just under 50% through a tightening cycle ~5 percentage points higher than CFG experience in last rate cycle (1,2) 13.0% 10.4% 7.2% 6.8% 3.4% 2.8% 2.4% 2.2% 2.2% 1.6% CMA MTB RF CFG PNC KEY USB BBT STI FITB Interest-rate sensitivity ranking (200 bps gradual increase) (1,2) 4.7% 4.9% 4.9% 4.9% 5.5% 5.0% 5.1% 5.0% 8.6% 6.8% 6.0% 6.6% 6.3% 6.8% 7.2% 6.8% 3Q13 4Q13 1Q14 2Q14 3Q14 4Q14 1Q15 2Q15 Peer Average CFG |
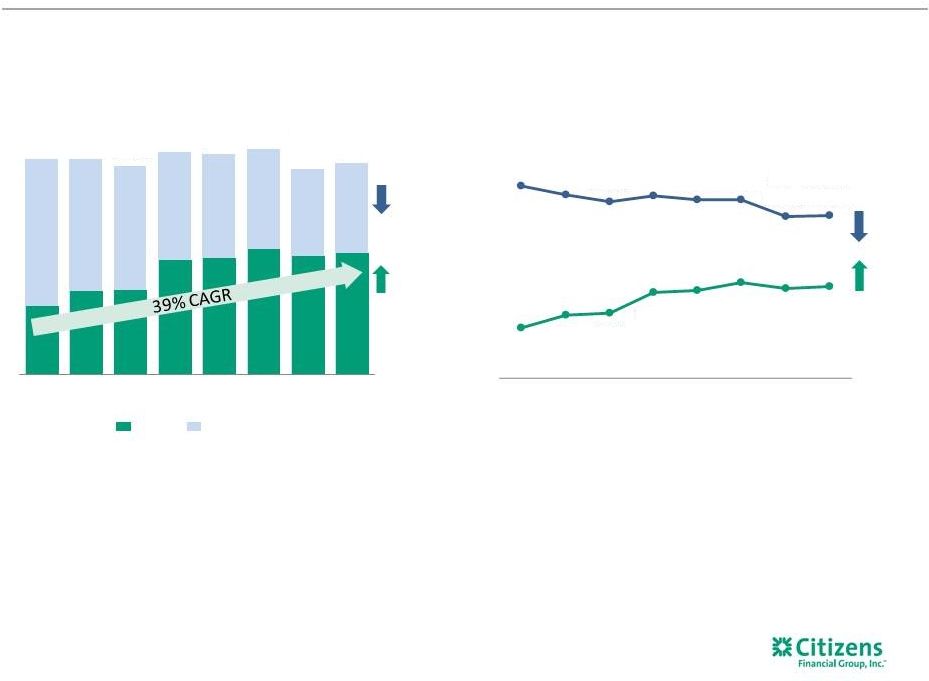
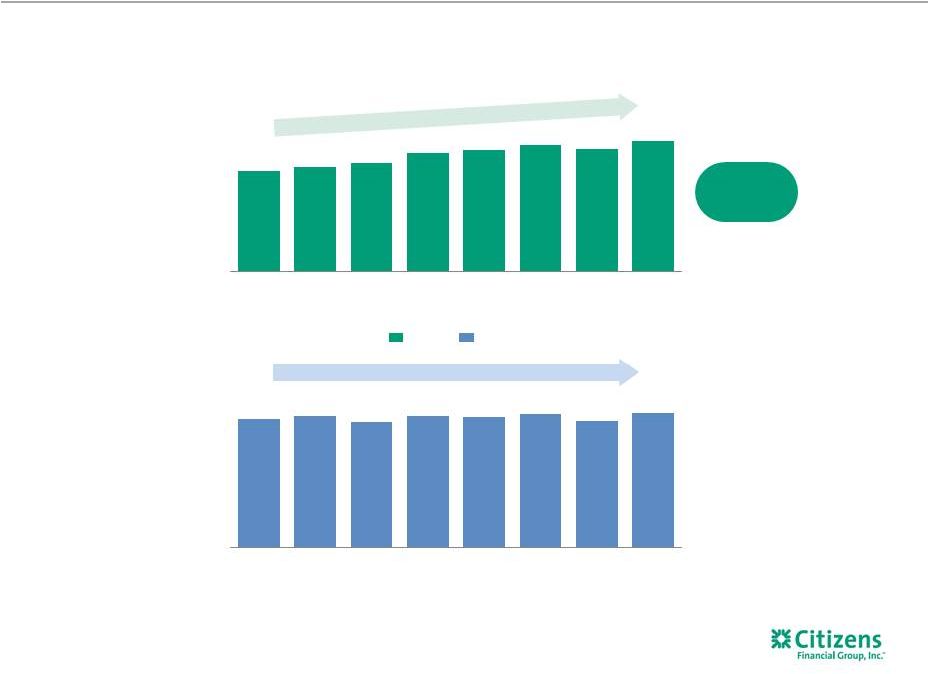 CFG core revenue vs. peers
14 Growing revenues faster (Core revenue (1) ) $s in millions CFG delivering solid core revenue growth as initiatives gain traction CFG Peer average (2) $2,053 $2,078 $2,024 $2,074 $2,063 $2,089 $2,035 $2,099 3Q13 4Q13 1Q14 2Q14 3Q14 4Q14 1Q15 2Q15 1% CAGR CAGR 396 bps better than peers 5% CAGR $1,090 $1,103 $1,116 $1,151 $1,159 $1,178 $1,165 $1,191 3Q13 4Q13 1Q14 2Q14 3Q14 4Q14 1Q15 2Q15 1) Non-GAAP item. See appendix for a reconciliation of non-GAAP items. Core CFG results
exclude, as applicable, restructuring charges and special items, and securities gains. Results prior to 3Q14 also adjusted for the following estimated impact of the Chicago Divestiture: Net interest income
- $13 million, Noninterest income - $12 million, and
Noninterest expense - $21 million, and the associated loans and deposits. 3Q13 and 4Q13 results also exclude the estimated effect of a change in ACH/Debit posting order of $13 million and $5 million, respectively. 2Q14 results also exclude $288 million Chicago Divestiture
gain, and $9 million FFELP sale gain, 1Q15 excludes gain on
sale of mortgage portfolio of $10 million, respectively. Peer results adjusted for similar unusual or special revenue and expense items where available.
2) Peer banks include BBT, CMA, FITB,
KEY, MTB, PNC, RF, STI and USB. Source: SNL Financial, Bloomberg, and Company filings. |
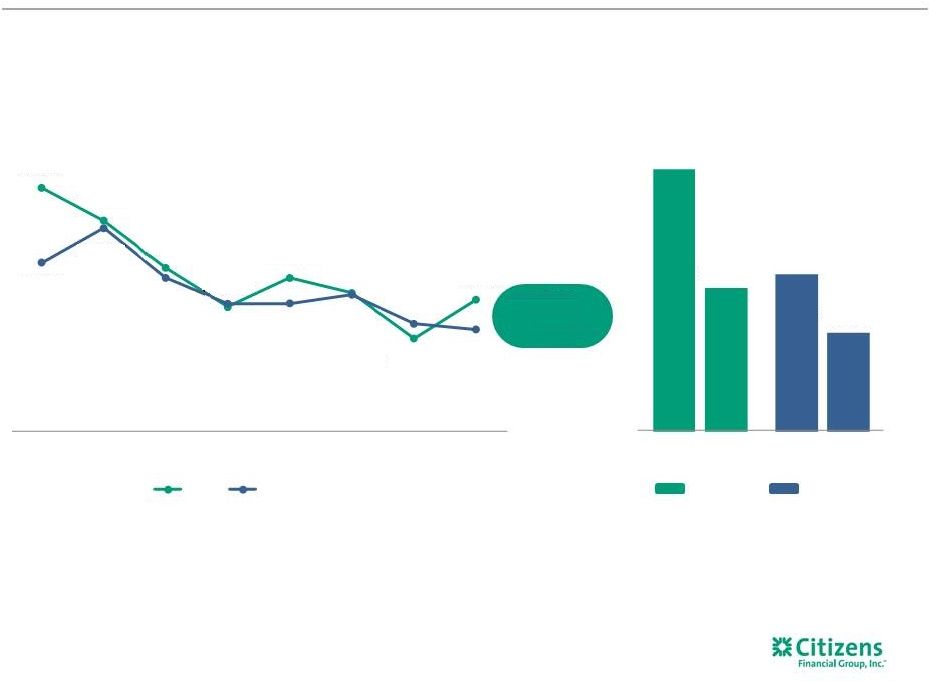
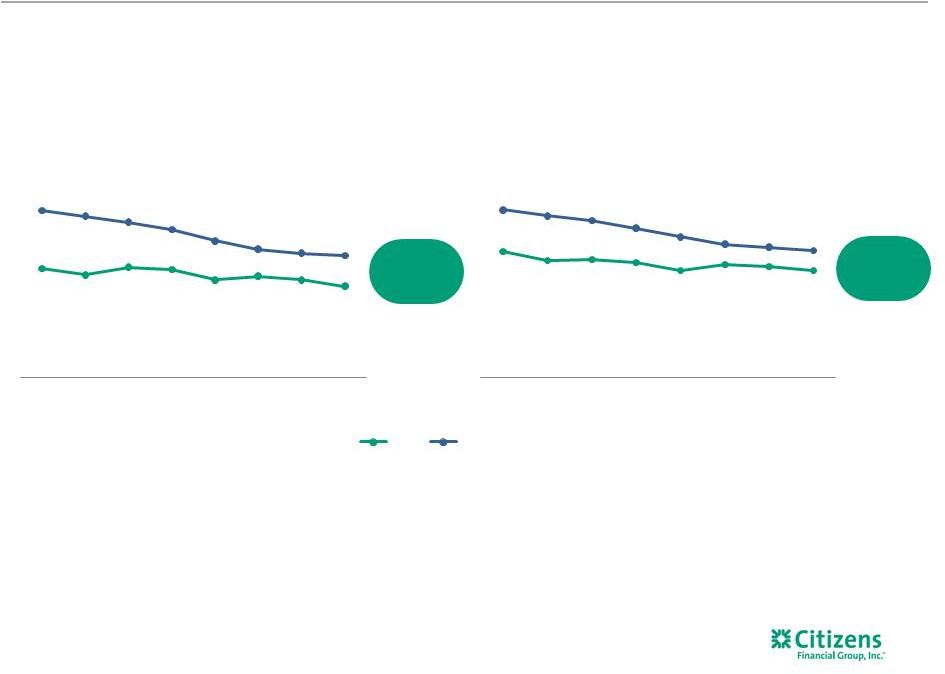 CFG core net interest margin vs. peers
15 21 bps better than peers Lower core net interest margin compression (1) Continued efforts to optimize asset growth and minimize cost of deposits …current expectation is that this may be the bottom Lower yield compression (Earning asset yield) 22 bps better than peers CFG Peers (2) 2.86% 2.81% 2.87% 2.85% 2.77% 2.80% 2.77% 2.72% 3.31% 3.27% 3.22% 3.16% 3.08% 3.01% 2.98% 2.96% 3Q13 4Q13 1Q14 2Q14 3Q14 4Q14 1Q15 2Q15 3.27% 3.18% 3.19% 3.16% 3.08% 3.14% 3.12% 3.08% 3.69% 3.63% 3.58% 3.51% 3.42% 3.34% 3.32% 3.28% 3Q13 4Q13 1Q14 2Q14 3Q14 4Q14 1Q15 2Q15 Source: SNL Financial, Bloomberg, and Company filings. 1) Non-GAAP item. See appendix for a reconciliation of non-GAAP items. Core CFG results
exclude, as applicable, restructuring charges and special items, and securities gains. Results prior to 3Q14 also adjusted for the following estimated impact of the Chicago Divestiture: Net interest income
- $13 million, Noninterest income - $12 million, and
Noninterest expense - $21 million, and the associated loans and deposits. 3Q13 and 4Q13 results also exclude the estimated effect of a change in ACH/Debit posting order of $13 million and $5 million, respectively. 2Q14 results also exclude $288
million Chicago Divestiture gain, and $9 million FFELP sale gain,
1Q15 excludes gain on sale of mortgage portfolio of $10 million, respectively. Peer results adjusted for similar unusual or special revenue and expense items where available.
2) Peer banks
include BBT, CMA, FITB, KEY, MTB, PNC, RF, STI and USB. |
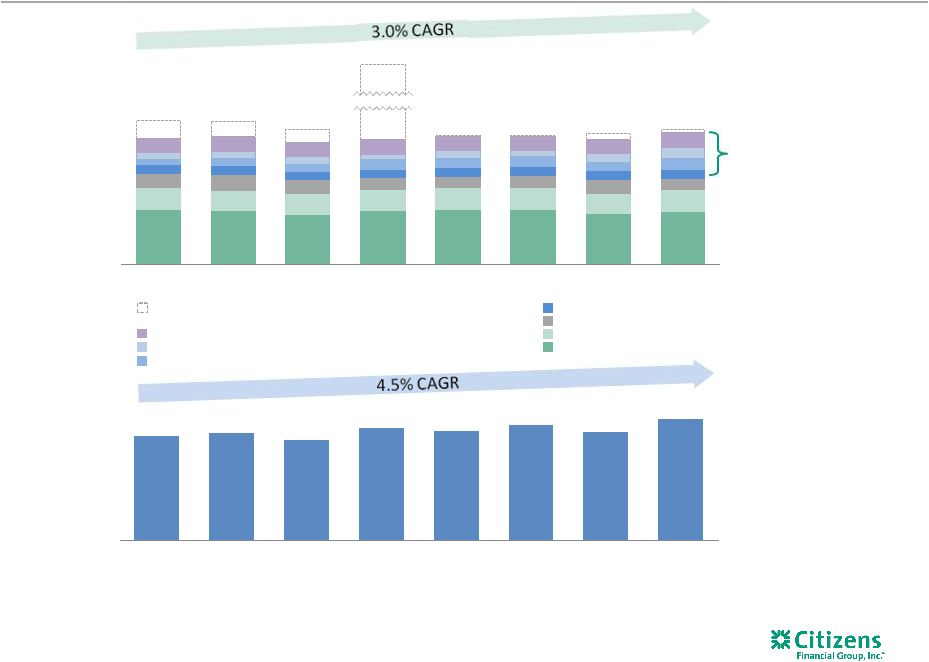 $843 $852 $824 $873 $863 $886 $859 $911 3Q13 4Q13 1Q14 2Q14 3Q14 4Q14 1Q15 2Q15 $383 $379 $358 $640 $341 $339 $347 $360 $333 $337 $321 $331 $339 $338 $329 $351 3Q13 4Q13 1Q14 2Q14 3Q14 4Q14 1Q15 2Q15 $s in millions CFG core noninterest income (1) vs. peers 16 Peer average core noninterest income (1,2) CFG core noninterest income (1) Securities gains, estimated Chicago Divestiture fees, and estimated posting order change fees (1) Core trust and investment service fees (1) Mortgage banking fees Capital markets fees Foreign exchange and trade finance fees Core other income (1) Core card fees (1) Core service charges and fees (1) 17% CAGR since 3Q13 in capital markets, trust and investment, mortgage banking and FX/trade finance fees 1) Non-GAAP item. See appendix for a reconciliation of non-GAAP items. Prior to 3Q14,
Core CFG results exclude, as applicable, the following estimated impact of the Chicago Divestiture: $6 million in service charges and fees, $3 million in card fees, $2 million in trust and investment services fees
and $1 million of Other fee income; these amounts have been
included in the Securities gains, estimated Chicago Divestiture fees, and estimated posting order change fees category. 3Q13 and 4Q13 results also exclude the estimated effect of a change in ACH/Debit posting order of $13 million and $5 million, respectively. 2Q14
results also exclude $288 million Chicago Divestiture gain, and
$9 million FFELP sale gain, 1Q15 excludes gain on sale of mortgage portfolio of $10 million, respectively. Peer results adjusted for similar unusual or special revenue and expense items where available. 2) Peer banks include BBT, CMA, FITB, KEY, MTB, PNC, RF, STI and USB. Peer average does not
include estimated impact of posting order change. Source: SNL
Financial, Bloomberg, and Company filings. |
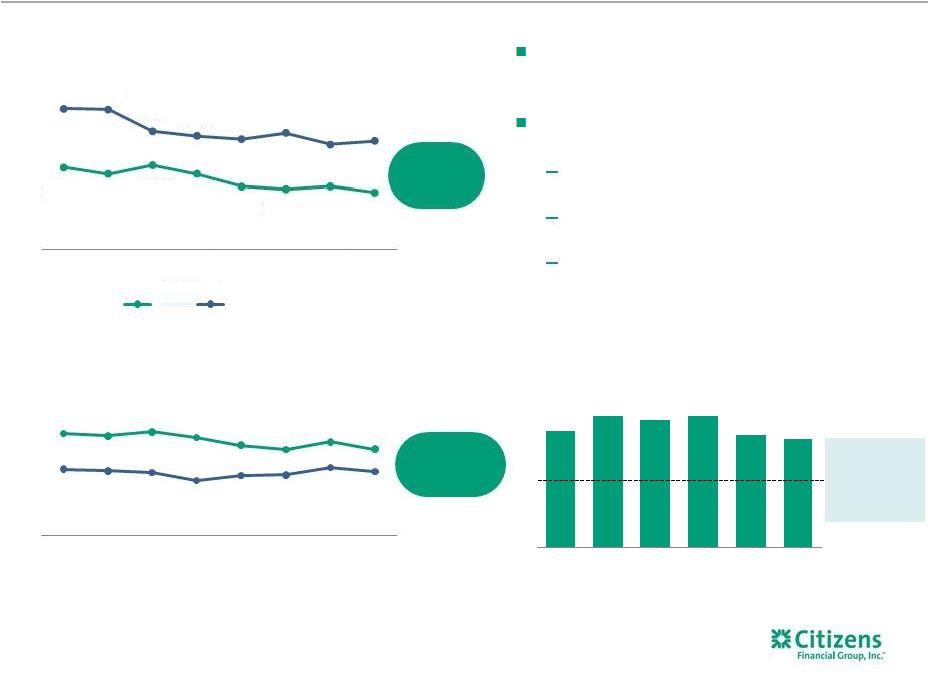 $256 $290 $281 $290 $247 $240 2010 2011 2012 2013 2014 2015E 17 Efficiency improvement (Core efficiency ratio (1) ) Expense/earning assets 259 bps improvement vs. peers Operating expenses as a percent of earning assets have declined from 2.9% to 2.6%; #3 ranking among peers Core efficiency improvement reflects benefit of revenue and expense initiatives Real estate square footage down 21.3% from 9/30/2013 Non customer-facing FTEs down 12.5% from 9/30/2013 Investing heavily in technology to improve customer experience, enhance risk & controls, and deliver greater efficiency CFG core efficiency improving vs. peers Technology spending $s in millions 56 bps better than peers (2) ~$150 million estimated normalized annual spend 2.9% 2.8% 2.9% 2.8% 2.7% 2.6% 2.7% 2.6% 3.5% 3.5% 3.3% 3.2% 3.2% 3.2% 3.1% 3.2% 3Q13 4Q13 1Q14 2Q14 3Q14 4Q14 1Q15 2Q15 70% 70% 71% 70% 68% 67% 69% 67% 63% 63% 63% 61% 62% 62% 64% 63% CFG Peer average Source: SNL Financial, Bloomberg, and Company filings. 1) Non-GAAP item. See appendix for a reconciliation of non-GAAP items. Core CFG results
exclude, as applicable, restructuring charges and special items, and securities gains. Results prior to 3Q14 also adjusted for the following estimated impact of the Chicago Divestiture: Net interest income
- $13 million, Noninterest income - $12 million, and
Noninterest expense - $21 million, and the associated loans and deposits. 3Q13 and 4Q13 results also exclude the estimated effect of a change in ACH/Debit posting order of $13 million and $5 million, respectively. 2Q14 results also exclude $288
million Chicago Divestiture gain, and $9 million FFELP sale gain,
1Q15 excludes gain on sale of mortgage portfolio of $10 million, respectively. Peer results adjusted for similar unusual or special revenue and expense items where available.
2) Peer banks
include BBT, CMA, FITB, KEY, MTB, PNC, RF, STI and USB. (Core expense/core earning assets ratio (1) ) 3Q13 4Q13 1Q14 2Q14 3Q14 4Q14 1Q15 2Q15 |
 18 CFG asset quality performance vs. peers CFG Peer average (1) NPAs/Assets Improving credit quality 3Q13 2Q15 3Q13 2Q15 Considerable progress in cleaning up non-core issues and moving back towards peer averages Source: Company filings. 1) Peer banks include BBT, CMA, FITB, KEY, MTB, PNC, RF, STI and USB. Net charge-offs/average loans and leases Favorable charge-off trends (1) 0.61% 0.53% 0.41% 0.38% 0.35% 0.23% 0.33% 0.42% 0.51% 0.38% 0.32% 0.32% 0.34% 0.27% 0.26% 3Q13 4Q13 1Q14 2Q14 3Q14 4Q14 1Q15 2Q15 CFG Peer average 1.45% 0.87% 0.79% 0.54% 12 bps improvement vs. peers 0.31% |
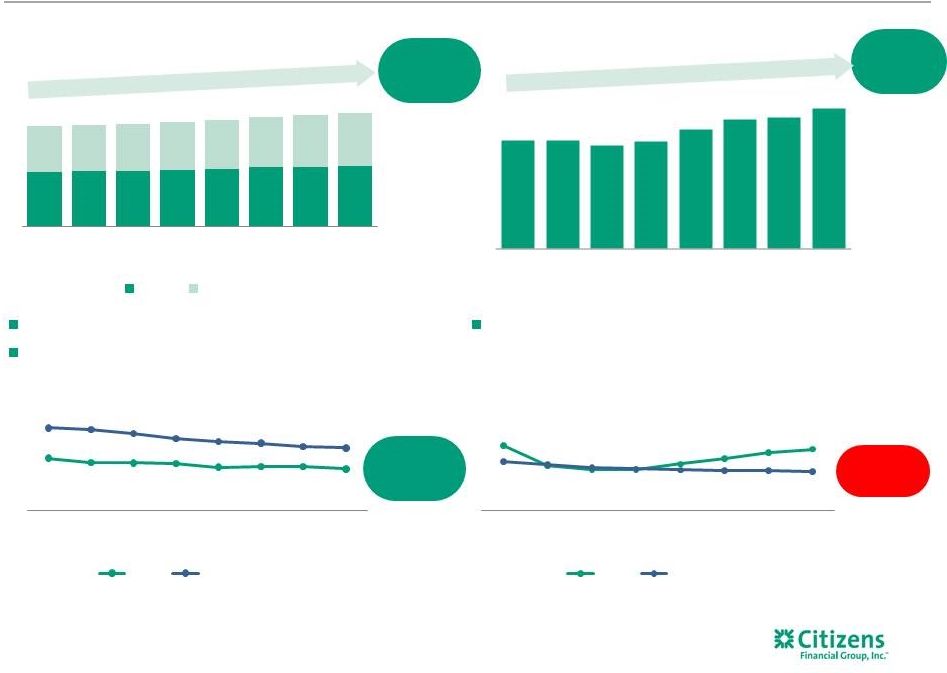 Loan and deposit growth tracking well vs. peers
19 $s in billions Total average loans and leases Total average deposits (1) 6% Retail loan CAGR vs. Peer average of (1)% 9% Commercial loan CAGR vs. Peer average of 7% Loan yield change Interest-bearing deposit costs (1) Accelerated deposit growth to compensate for 2Q14 Chicago Divestiture, now focused on cost optimizations (2) (2) $46.0 $46.3 $46.4 $47.5 $48.5 $49.8 $50.4 $50.9 $38.5 $39.5 $39.7 $40.5 $41.2 $42.3 $43.5 $44.7 $84.5 $85.8 $86.1 $88.0 $89.7 $92.0 $94.0 $95.6 3Q13 4Q13 1Q14 2Q14 3Q14 4Q14 1Q15 2Q15 Retail Commercial 330 bps better than peers 18 bps less contraction than peers 3.50% 3.42% 3.41% 3.40% 3.33% 3.34% 3.34% 3.30% 4.08% 4.05% 3.98% 3.88% 3.82% 3.79% 3.73% 3.70% 3Q13 4Q13 1Q14 2Q14 3Q14 4Q14 1Q15 2Q15 CFG Peer average 6 bps worse than peers 0.35% 0.24% 0.22% 0.22% 0.25% 0.28% 0.31% 0.33% 0.26% 0.25% 0.23% 0.22% 0.22% 0.22% 0.21% 0.21% 3Q13 4Q13 1Q14 2Q14 3Q14 4Q14 1Q15 2Q15 CFG Peer average $87.9 $88.0 $86.4 $87.6 $91.7 $94.8 $95.6 $98.5 3Q13 4Q13 1Q14 2Q14 3Q14 4Q14 1Q15 2Q15 6.7% CAGR 112 bps better than peers Source: SNL Financial, Bloomberg, and Company filings.
1)
Non-GAAP item. See appendix for a reconciliation of non-GAAP items.
Core CFG results exclude, as applicable, restructuring charges and special items, and securities gains. Results prior to 3Q14 also adjusted for the following estimated impact of the Chicago Divestiture: Net interest income
- $13 million, Noninterest income - $12 million, and
Noninterest expense - $21 million, and the associated loans and deposits. 3Q13 and 4Q13 results also exclude the estimated effect of a change in ACH/Debit posting order of $13 million and $5 million, respectively. 2Q14 results also exclude $288 million Chicago
Divestiture gain, and $9 million FFELP sale gain, 1Q15
excludes gain on sale of mortgage portfolio of $10 million, respectively. Peer results adjusted for similar unusual or special revenue and expense items where available.
2)
Peer banks include BBT, CMA, FITB, KEY, MTB, PNC, RF, STI and USB. 7% CAGR |
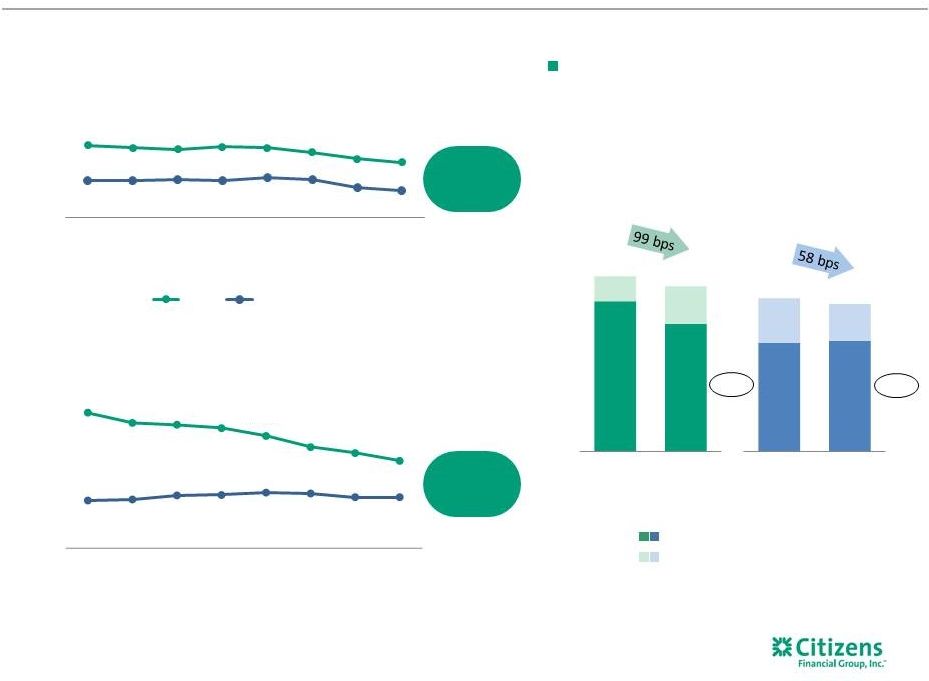 Capital and liquidity strong vs. peers
20 Executed $2.2 billion in capital exchange transactions since 6/30/2013, mix of capital now broadly aligned with peers Common equity tier 1 ratio Total capital ratio 1.7% points better than peers 1.6% points better than peers CFG Peers Common equity tier 1 ratio All other capital 16.3% 15.3% 2.3% 3.4% 13.9% 11.8% 14.2% 13.6% 4.1% 3.4% 10.1% 10.2% Capital mix (1) 77% 75% 23% 25% 15% 85% 29% 71% Source: SNL Financial. 1) Peer banks include BBT, CMA, FITB, KEY, MTB, PNC, RF, STI and USB. 2) Common equity tier 1 capital under Basel III replaced tier 1 common capital under Basel I effective January 1, 2015.
(2) (2) (2) (1) 16.3% 16.1% 16.0% 16.2% 16.1% 15.8% 15.5% 15.3% 14.2% 14.2% 14.2% 14.2% 14.4% 14.2% 13.8% 13.6% 3Q13 4Q13 1Q14 2Q14 3Q14 4Q14 1Q15 2Q15 CFG Peer average 13.9% 13.5% 13.4% 13.3% 12.9% 12.4% 12.2% 11.8% 10.1% 10.1% 10.3% 10.3% 10.4% 10.4% 10.2% 10.2% 3Q13 4Q13 1Q14 2Q14 3Q14 4Q14 1Q15 2Q15 3Q13 2Q15 3Q13 2Q15 |
 $s in millions Accelerating profitability (Core net income (1) ) Improving return on equity (Core return on average tangible common equity (1) ) CFG core profitability vs. peers CFG Peer average (2) Peers 203 bps CFG 296 bps Peers 2% CFG 79% Consistent record of improving profitability and returns, narrowing gap vs. peers 3.5% 4.5% 4.6% 6.0% 6.2% 6.7% 6.3% 6.5% 13.6% 13.0% 12.5% 12.9% 12.6%12.6% 11.4% 11.5% 3Q13 4Q13 1Q14 2Q14 3Q14 4Q14 1Q15 2Q15 $501 $500 $485 $516 $513 $523 $478 $491 $117 $144 $146 $197 $201 $216 $203 $209 3Q13 4Q13 1Q14 2Q14 3Q14 4Q14 1Q15 2Q15 Source: SNL Financial, Bloomberg, and Company filings. 1) Non-GAAP item. See appendix for a reconciliation of non-GAAP items. Core CFG results
exclude, as applicable, restructuring charges and special items, and securities gains. Results prior to 3Q14 also adjusted for the following estimated impact of the Chicago Divestiture: Net interest income - $13
million, Noninterest income - $12 million, and Noninterest
expense - $21 million, and the associated loans and deposits. 3Q13 and 4Q13 results also exclude the estimated effect of a change in ACH/Debit posting order of $13 million and $5 million, respectively. 2Q14 results also exclude $288 million Chicago Divestiture gain, and
$9 million FFELP sale gain, 1Q15 excludes gain on sale of
mortgage portfolio of $10 million, respectively. Peer results adjusted for similar unusual or special revenue and expense items where available.
2) Peer banks include BBT, CMA, FITB,
KEY, MTB, PNC, RF, STI and USB. 21 |
 Key messages 22 We are executing well against our agenda; delivering near-term financial progress
towards ambitious medium-term goals
We have the foundation for a great franchise, though much to do to tap full
potential Our turnaround plan addresses gaps/weaknesses on both a
tactical and strategic level While an increase in short-term
rates will be beneficial, we can continue to drive business and
financial progress by executing well To date, our performance
gap with peers is steadily closing |
 23 |
 Appendix 24 |
 Summary GAAP Financial Information
25 1 Includes held for sale. 2 Non-GAAP item. See important information on use of Non-GAAP items in the Appendix.
3 Return on average tangible common equity. 4 Return on average total tangible assets. 5 Full-time equivalent employees. 2Q15 change from $s in millions 3Q13 4Q13 1Q14 2Q14 3Q14 4Q14 1Q15 2Q15 3Q13 $ % Net interest income 770 $ 779 $ 808 $ 833 $ 820 $ 840 $ 836 $ 840 $ 70 $ 9 % Noninterest income 383 379 358 640 341 339 347 360 (23) (6) Total revenue 1,153 1,158 1,166 1,473 1,161 1,179 1,183 1,200 47 4 Noninterest expense 788 818 810 948 810 824 810 841 53 7 Pre-provision profit 365 340 356 525 351 355 373 359 (6) (2) Provision for credit losses 145 132 121 49 77 72 58 77 (68) (47) Income before income tax expense 220 208 235 476 274 283 315 282 62 28 Income tax expense 76 56 69 163 85 86 106 92 16 21 Net income 144 $ 152 $ 166 $ 313 $ 189 $ 197 $ 209 $ 190 $ 46 $ 32 % $s in billions Average interest earning assets 105.9 $ 109.0 $ 112.5 $ 116.0 $ 117.2 $ 118.7 $ 121.3 $ 123.2 $ 17.3 $ 16 % Average deposits 1 93.1 $ 93.2 $ 91.6 $ 92.2 $ 91.7 $ 94.8 $ 95.6 $ 98.5 $ 5.4 $ 6 % Key metrics Net interest margin 2.88 % 2.83 % 2.89 % 2.87 % 2.77 % 2.80 % 2.77 % 2.72 % (16) bps Loan-to-deposit ratio (period-end) 1 91.3 % 94.5 % 95.5 % 97.2 % 97.3 % 97.9 % 95.8 % 96.6 % 530 bps ROTCE 2,3 4.3 % 4.7 % 5.2 % 9.6 % 5.8 % 6.1 % 6.5 % 5.9 % 156 bps ROTA 2,4 0.5 % 0.5 % 0.6 % 1.0 % 0.6 % 0.6 % 0.7 % 0.6 % 7 bps Efficiency ratio 2 68 % 71 % 69 % 64 % 70 % 70 % 68 % 70 % 153 bps FTEs 5 18,961 19,152 18,856 18,049 17,852 17,677 17,792 17,903 (1,058) (6) % Per common share Diluted earnings 0.26 $ 0.27 $ 0.30 $ 0.56 $ 0.34 $ 0.36 $ 0.38 $ 0.35 $ 0.09 $ 35 % Tangible book value 2 22.97 $ 22.61 $ 23.08 $ 23.39 $ 23.04 $ 23.46 $ 23.96 $ 24.03 $ 1.06 $ 5 Average diluted shares outstanding (in millions) 560.0 560.0 560.0 560.0 560.2 550.7 549.8 539.9 (20.1) (4) % |
 Non-GAAP Reconciliation Table
26 (Excluding restructuring charges and special items) $s in millions, except per share data 2Q15 1Q15 4Q14 3Q14 2Q14 1Q14 4Q13 3Q13 2015 Change from 2013 Noninterest income, excluding special items: Noninterest income (GAAP) A $360 $347 $339 $341 $640 $358 $379 $383 Less: Special items - Chicago gain - - - - 288 - - - REPORTED NON-GAAP Noninterest income, excluding special items B 360 347 339 341 352 358 379 383 Less: Securities gains 9 8 1 2 - 25 25 25 Less: FFELP sale gain - Net interest Income - - - - 9 - - - Less: Mortgage portfolio - 10 - - - - - - Less: Estimated - Chicago sale gain - - - - 12 12 12 12 Less: Estimated- Posting order change - - - - - - 5 13 CORE noninterest income, excluding special items C $351 $329 $338 $339 $331 $321 $337 $333 Total revenue, excluding special items: Total revenue (GAAP) D $1,200 $1,183 $1,179 $1,161 $1,473 $1,166 $1,158 $1,153 Less: Special items - Chicago gain - - - - 288 - - - REPORTED NON-GAAP Total revenues, excluding special items E 1,200 1,183 1,179 1,161 1,185 1,166 1,158 1,153 Less: Securities gains 9 8 1 2 - 25 25 25 Less: FFELP sale gain - - - - 9 - - - Less: Mortgage portfolio - 10 - - - - - - Less: Estimated - Chicago sale gain - Net interest income - - - - 13 13 13 13 Less: Estimated - Chicago sale gain - Noninterest income - - - - 12 12 12 12 Less: Estimated - Posting order change - - - - - - 5 13 Total revenue, excluding special items (core revenue) F $1,191 $1,165 $1,178 $1,159 $1,151 $1,116 $1,103 $1,090 Noninterest expense, excluding restructuring charges and special items: Noninterest expense (GAAP) G $841 $810 $824 $810 $948 $810 $818 $788 Less: Restructuring charges and special items 40 10 33 21 115 - 26 - REPORTED NON-GAAP Noninterest expense, excluding special items H 801 800 791 789 833 810 792 788 Less: Estimated - Chicago Adjustment - - - - 21 21 21 21 Noninterest expense, excluding restructuring charges and special items (core
expense) I $801 $800 $791 $789 $812 $789 $771 $767 Net Income, excluding restructuring charges and special items: Net income (GAAP) J $190 $209 $197 $189 $313 $166 $152 $144 Add: Restructuring charges and special items, net of income tax expense (benefit) 25 6 20 13 (108) - 17 - REPORTED NON-GAAP Net Income K 215 215 217 202 205 166 169 144 Add: Restructuring charges and special items, net of income tax expense (benefit) (6) (12) (1) (1) (8) (20) (25) (27) Net income, excluding special items (core net income) L $209 $203 $216 $201 $197 $146 $144 $117 79% Effective Tax Rate 32.69% 33.68% 30.56% 30.81% 34.27% 29.45% 26.87% 34.57% QUARTERLY TRENDS |
 Non-GAAP Reconciliation Table
27 (Excluding restructuring charges and special items) $s in millions, except per share data 2Q15 1Q15 4Q14 3Q14 2Q14 1Q14 4Q13 3Q13 2015 Change from 2013 Return on average tangible common equity and return on average tangible common equity, excluding restructuring charges and special items: Average common equity (GAAP) M $19,391 $19,407 $19,209 $19,411 $19,607 $19,370 $19,364 $19,627 Less: Average goodwill (GAAP) 6,876 6,876 6,876 6,876 6,876 6,876 6,876 6,876 Less: Average other intangibles (GAAP) 5 5 6 6 7 7 8 9 Add: Average deferred tax liabilities related to goodwill (GAAP) 437 422 403 384 369 351 342 325 Average tangible common equity (non-GAAP) N $12,947 $12,948 $12,730 $12,913 $13,093 $12,838 $12,822 $13,067 Return on average tangible common equity (non-GAAP) J/N 5.9 % 6.5 % 6.1 % 5.8 % 9.6 % 5.2 % 4.7 % 4.3 % 156 bps REPORTED NON-GAAP Return on average tangible common equity, excluding
restructuring charges and special items
6.7 % 6.7 % 6.8 % 6.2 % 6.3 % 5.2 % 5.2 % 4.3 % 233 bps Core - Return on average tangible common equity, excluding restructuring charges and special items L/N 6.5 % 6.3 % 6.7 % 6.2 % 6.0% 4.6 % 4.5 % 3.5 % 296 bps Return on average total tangible assets and return on average total tangible
assets, excluding restructuring charges and special items:
Average total assets (GAAP)
O $135,521 $133,325 $130,671 $128,691 $127,148 $123,904 $120,393 $117,386 Less: Average goodwill (GAAP) 6,876 6,876 6,876 6,876 6,876 6,876 6,876 6,876 Less: Average other intangibles (GAAP) 5 5 6 6 7 7 8 9 Add: Average deferred tax liabilities related to goodwill (GAAP) 437 422 403 384 369 351 342 325 Average tangible assets (non-GAAP) P $129,077 $126,866 $124,192 $122,193 $120,634 $117,372 $113,851 $110,826 Return on average total tangible assets (non-GAAP) J/P 0.6% 0.7% 0.6% 0.6% 1.0% 0.6% 0.5% 0.5% 7 bps 2Q15 1Q15 4Q14 3Q14 2Q14 1Q14 4Q13 3Q13 2015 Change from 2013 Efficiency ratio: Net interest income (GAAP) Q $840 $836 $840 $820 $833 $808 $779 $770 Add: Noninterest income (GAAP) R 360 347 339 341 640 358 379 383 Total revenue (GAAP) D $1,200 $1,183 $1,179 $1,161 $1,473 $1,166 $1,158 $1,153 Efficiency ratio (non-GAAP) G/D 70% 68% 70% 70% 64% 69% 71% 68% 153 bps REPORTED NON-GAAP Efficiency ratio, excluding restructuring charges and
special items 67% 68% 67% 68% 70% 69% 68% 68% (179) bps Core - Efficiency ratio, excluding restructuring charges and special items I/F 67% 69% 67% 68% 70% 71% 70% 70% (327) bps Tangible book value per common share: Common shares - at end of period (GAAP) S 537,149,717 547,490,812 545,884,519 559,998,324 559,998,324 559,998,324 559,998,324 559,998,324 Stockholders' equity (GAAP) $19,339 $19,564 $19,268 $19,383 $19,597 $19,442 $19,196 $19,413 Less: Goodwill (GAAP) 6,876 6,876 6,876 6,876 6,876 6,876 6,876 6,876 Less: Other intangible assets (GAAP) 4 5 6 6 7 7 8 9 Add: Deferred tax liabilities related to goodwill (GAAP) 450 434 420 399 384 366 350 333 Tangible common equity (non-GAAP) T $12,909 $13,117 $12,806 $12,900 $13,098 $12,925 $12,662 $12,861 Tangible book value per common share (non-GAAP) T/S $24.03 $23.96 $23.46 $23.04 $23.39 $23.08 $22.61 $22.97 $1.06 Pro forma Basel III fully phased-in common equity tier 1 capital ratio 1 Common equity tier 1 (regulatory) $13,270 Less: Change in DTA and other threshold deductions (GAAP) 3 Pro forma Basel III fully phased-in common equity tier 1 (non-GAAP)
U $13,267 Risk-weighted assets (regulatory general risk weight approach) $112,131 Add: Net change in credit and other risk-weighted assets (regulatory)
247 Basel III standardized approach risk-weighted assets (non-GAAP) V $112,378 Pro forma Basel III fully phased-in common equity tier 1 capital ratio (non-GAAP)
U/V 11.8% QUARTERLY TRENDS QUARTERLY TRENDS 1 Periods prior to 1Q15 reported on a Basel I basis. Basel III ratios assume certain definitions impacting qualifying Basel III
capital, which otherwise will phase in through 2018, are fully phased-in.
Ratios also reflect the required US Standardized methodology for
calculating RWAs, effective January 1, 2015. :
: |
 Non-GAAP Reconciliation Table
28 (Excluding restructuring charges and special items) $s in millions, except per share data 2Q15 1Q15 4Q14 3Q14 2Q14 1Q14 4Q13 3Q13 2015 Change from 2013 Total Average Deposits Total Average Depostis $98,533 $95,645 $94,798 $91,676 $92,166 $91,596 $93,184 $93,143 Less: Special items - Chicago Divestiture - - - - 4,543 5,229 5,229 5,229 Average Deposits, excluding special items $98,533 $95,645 $94,798 $91,676 $87,623 $86,367 $87,955 $87,914 Total interest bearing deposits $72,114 $69,889 $68,466 $65,847 $61,639 $61,570 $67,017 $67,545 Interest Bearing Deposits Held for Sale - - - - - - 4,233 4,233 Interest bearing deposits W $72,114 $69,889 $68,466 $65,847 $61,639 $61,570 $62,784 $63,312 Total Interest expense - deposits 60 52 48 41 34 33 40 58 Interest expense - related to Chicago divestiture - - - - - - 2 2 Interest expense - deposits X $60 $52 $48 $41 $34 $33 $38 $56 Interest-bearing deposit costs (CORE) X/W 0.33% 0.31% 0.28% 0.25% 0.22% 0.22% 0.24% 0.35% Average Interest Earning Assets $123,205 $121,342 $118,730 $117,196 $115,992 $112,505 $108,972 $105,857 Less: Estimated - Chicago adjustment - - - - 1,031 1,031 1,031 1,031 Earning Assets Y $123,205 $121,342 $118,730 $117,196 $114,961 $111,474 $107,941 $104,826 Core expense to earning assets ratio I/Y 2.6% 2.7% 2.6% 2.7% 2.8% 2.9% 2.8% 2.9% 2Q15 1Q15 4Q14 3Q14 2Q14 1Q14 4Q13 3Q13 2015 Change from 2013 CORE NIM: Average Interest Earning Assets Z $123,205 $121,342 $118,730 $117,196 $115,992 $112,505 $108,972 $105,857 Less: Estimated - Chicago adjustment - - - - 1,031 1,031 1,031 1,031 Earning Assets AA $123,205 $121,342 $118,730 $117,196 $114,961 $111,474 $107,941 $104,826 Earning Asset Yield BB 3.08% 3.12% 3.14% 3.08% 3.16% 3.19% 3.18% 3.27% Calculated Int. Income Z*BB $3,799 $3,790 $3,731 $3,615 $3,662 $3,590 $3,466 $3,458 Less: Estimated - Chicago adjustment (annualized) - - - - 42 42 42 42 Annualized interest income excluding Chicago adjustment CC $3,799 $3,790 $3,731 $3,615 $3,620 $3,548 $3,424 $3,416 Total Int. Bearing Liabilities Balance DD $86,886 $85,395 $82,494 $80,843 $78,469 $76,552 $72,687 $69,916 Less: Estimated - Chicago adjustment - - - - 3,675 4,233 4,233 4,233 Less: Estimated replacement funding - deposits - - - - (2,644) (3,202) (3,202) (3,202) Int. Bearing Liabilities $86,886 $85,395 $82,494 $80,843 $77,438 $75,521 $71,656 $68,885 Int. Bearing Liabilities Yield EE 0.51% 0.50% 0.49% 0.45% 0.42% 0.45% 0.52% 0.58% Calculated interest expense DD*EE $444 $429 $406 $366 $333 $341 $381 $405 Add: Estimated - Chicago adjustment (annualized) - - - - 9 9 9 9 Annualized interest expense excluding Chicago adjustment FF $444 $429 $406 $366 $342 $350 $390 $414 Annualized net interest income excluding Chicago adjustment GG=CC-FF $3,355 $3,361 $3,325 $3,249 $3,278 $3,198 $3,034 $3,002 NIM excluding Chicago Adjustment GG/AA 2.72% 2.77% 2.80% 2.77% 2.85% 2.87% 2.81% 2.86% NIM REPORTED 2.72% 2.77% 2.80% 2.77% 2.87% 2.89% 2.83% 2.88% QUARTERLY TRENDS QUARTERLY TRENDS |
 29 |