Attached files
| file | filename |
|---|---|
| 8-K - CHIMERA INVESTMENT CORPORATION 8-K - CHIMERA INVESTMENT CORP | a51179621.htm |
| EX-99.1 - EXHIBIT 99.1 - CHIMERA INVESTMENT CORP | a51179621ex99_1.htm |
Exhibit 99.2
WWW.CHIMERAREIT.COM Investor Presentations | Second Quarter 2015 September 2015
CIOnNfFoErmREaNtCioEn N iAsM uEn GaOuEdSit HeEdR, Eestimated and subject to change. 1 This material is not intended to be exhaustive, is preliminary in nature and may be subject to change. In addition, much of the information contained herein is based on various assumptions (some of which are beyond the control of Chimera Investment Corporation, the “Company”) and may be identified by reference to a future period or periods or by the use of forward-looking terminology, such as “believe,” “expect,” “anticipate,” “estimate,” “plan,” “continue,” “intend,” “should,” “may,” “would,” “projected,” “will” or similar expressions, or variations on those terms or the negative of those terms. The Company’s forward-looking statements are subject to numerous risks, uncertainties and other factors. Furthermore, none of the financial information contained in this material has been audited or approved by the Company’s independent registered public accounting firm. Disclaimer
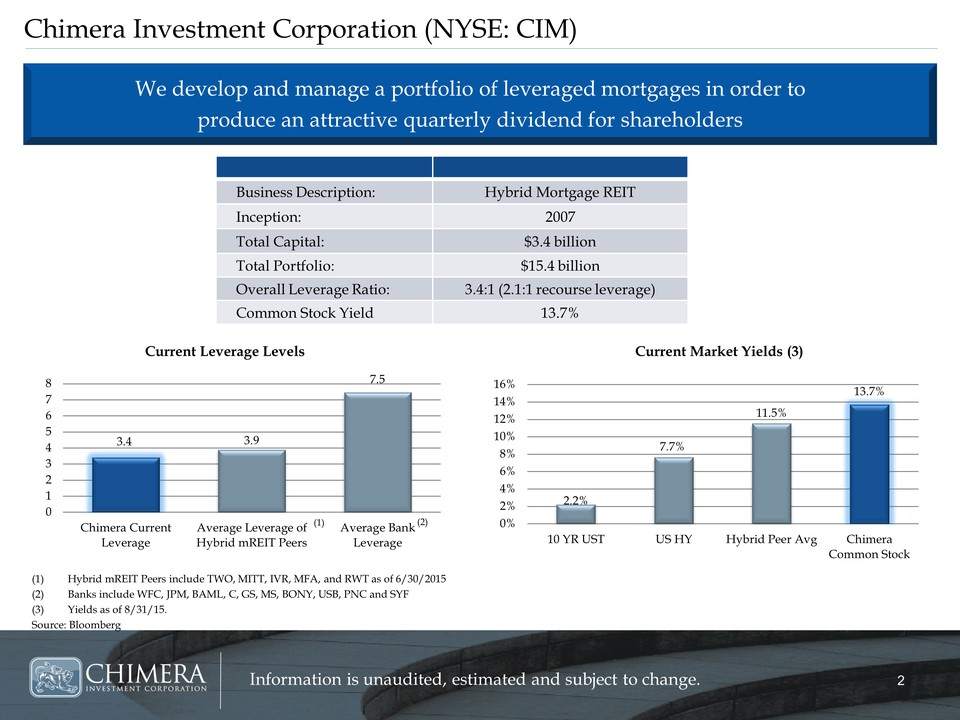
CIOnNfFoErmREaNtCioEn N iAsM uEn GaOuEdSit HeEdR, Eestimated and subject to change. 2 Chimera Investment Corporation (NYSE: CIM) (1)Hybrid mREIT Peers include TWO, MITT, IVR, MFA, and RWT as of 6/30/2015 (2)Banks include WFC, JPM, BAML, C, GS, MS, BONY, USB, PNC and SYF (3)Yields as of 8/31/15. Source: Bloomberg We develop and manage a portfolio of leveraged mortgages in order to produce an attractive quarterly dividend for shareholders Business Description: Hybrid Mortgage REIT Inception: 2007 Total Capital: $3.4 billion Total Portfolio: $15.4 billion Overall Leverage Ratio: 3.4:1 (2.1:1 recourse leverage) Common Stock Yield 13.7% 3.4 3.9 7.5 0 1 2 3 4 5 6 7 8 Chimera Current Leverage Average Leverage of Hybrid mREIT Peers Average Bank Leverage Current Leverage Levels 2.2% 7.7% 11.5% 13.7% 0% 2% 4% 6% 8% 10% 12% 14% 16% 10 YR UST US HY Hybrid Peer Avg Chimera Common Stock Current Market Yields (3) (1) (2)
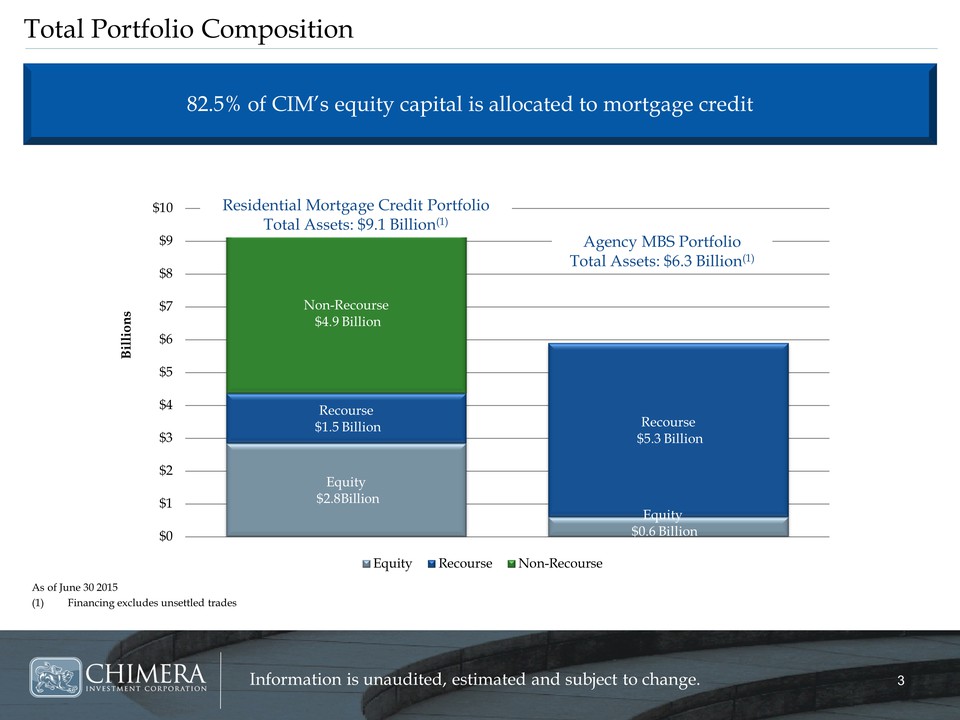
CIOnNfFoErmREaNtCioEn N iAsM uEn GaOuEdSit HeEdR, Eestimated and subject to change. 3 Total Portfolio Composition As of June 30 2015 (1) Financing excludes unsettled trades 82.5% of CIM’s equity capital is allocated to mortgage credit Equity $2.8Billion Equity $0.6 Billion Recourse $1.5 Billion Recourse $5.3 Billion Non-Recourse $4.9 Billion $0 $1 $2 $3 $4 $5 $6 $7 $8 $9 $10 Billions Equity Recourse Non-Recourse Agency MBS Portfolio Total Assets: $6.3 Billion(1) Residential Mortgage Credit Portfolio Total Assets: $9.1 Billion(1)
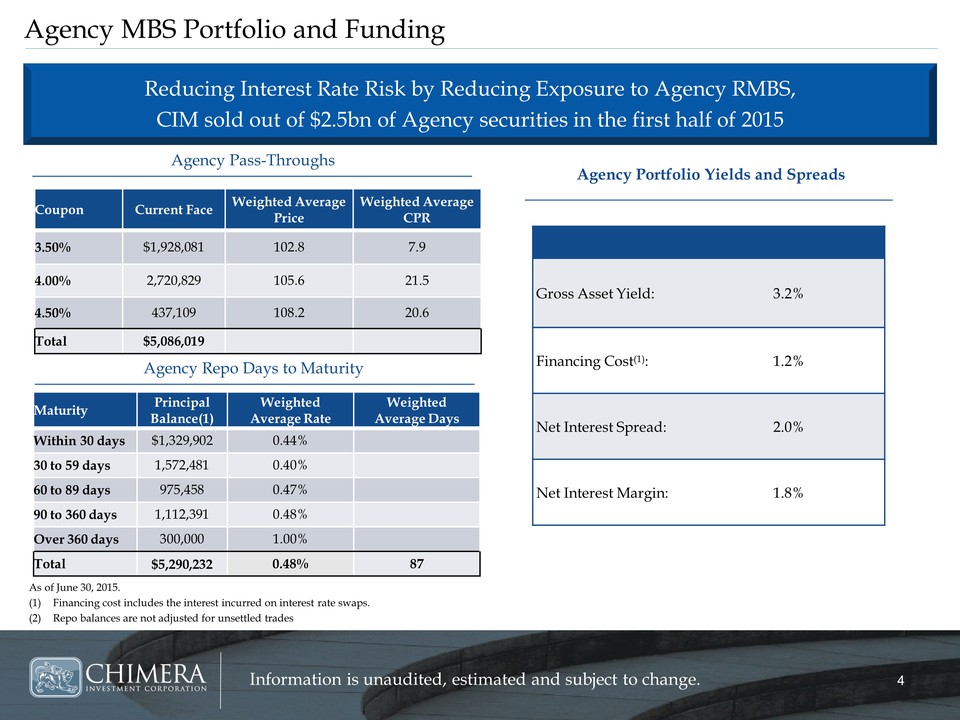
CIOnNfFoErmREaNtCioEn N iAsM uEn GaOuEdSit HeEdR, Eestimated and subject to change. 4 Agency MBS Portfolio and Funding As of June 30, 2015. (1) Financing cost includes the interest incurred on interest rate swaps. (2) Repo balances are not adjusted for unsettled trades Reducing Interest Rate Risk by Reducing Exposure to Agency RMBS, CIM sold out of $2.5bn of Agency securities in the first half of 2015 Agency Pass-Throughs Agency Repo Days to Maturity Agency Portfolio Yields and Spreads Gross Asset Yield: 3.2% Financing Cost(1): 1.2% Net Interest Spread: 2.0% Net Interest Margin: 1.8% Coupon Current Face Weighted Average Price Weighted Average CPR 3.50% $1,928,081 102.8 7.9 4.00% 2,720,829 105.6 21.5 4.50% 437,109 108.2 20.6 Total $5,086,019 Maturity Principal Balance(1) Weighted Average Rate Weighted Average Days Within 30 days $1,329,902 0.44% 30 to 59 days 1,572,481 0.40% 60 to 89 days 975,458 0.47% 90 to 360 days 1,112,391 0.48% Over 360 days 300,000 1.00% Total $5,290,232 0.48% 87
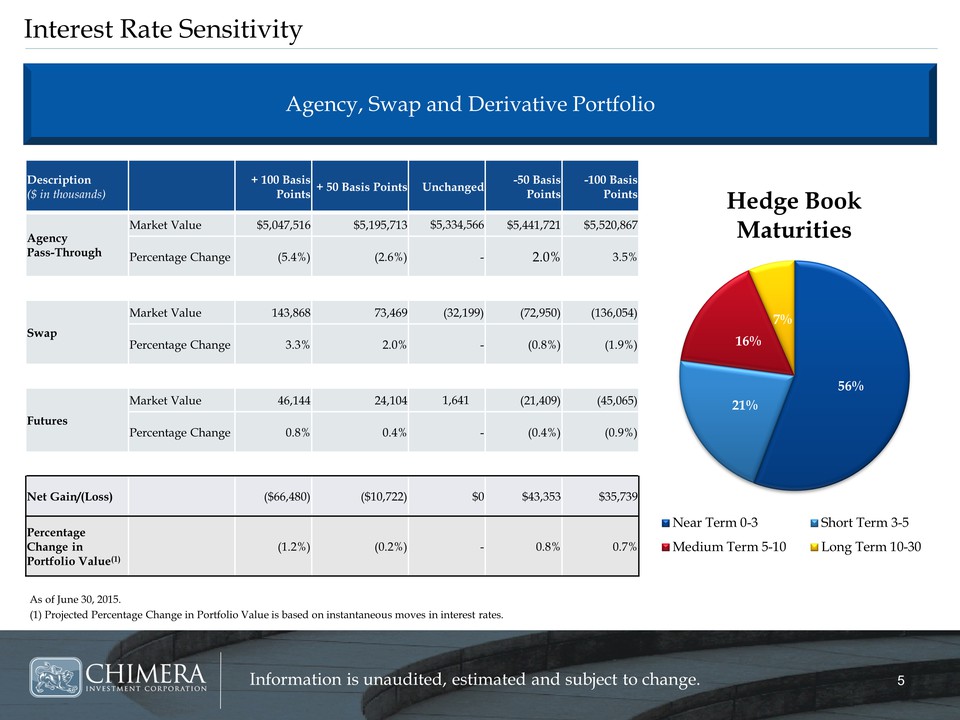
CIOnNfFoErmREaNtCioEn N iAsM uEn GaOuEdSit HeEdR, Eestimated and subject to change. 5 Interest Rate Sensitivity As of June 30, 2015. (1) Projected Percentage Change in Portfolio Value is based on instantaneous moves in interest rates. Agency, Swap and Derivative Portfolio Description ($ in thousands) + 100 Basis Points + 50 Basis Points Unchanged -50 Basis Points -100 Basis Points Agency Pass-Through Market Value $5,047,516 $5,195,713 $5,334,566 $5,441,721 $5,520,867 Percentage Change (5.4%) (2.6%) - 2.0% 3.5% Swap Market Value 143,868 73,469 (32,199) (72,950) (136,054) Percentage Change 3.3% 2.0% - (0.8%) (1.9%) Futures Market Value 46,144 24,104 1,641 (21,409) (45,065) Percentage Change 0.8% 0.4% - (0.4%) (0.9%) Net Gain/(Loss) ($66,480) ($10,722) $0 $43,353 $35,739 Percentage Change in Portfolio Value(1) (1.2%) (0.2%) - 0.8% 0.7% 56% 21% 16% 7% Hedge Book Maturities Near Term 0-3 Short Term 3-5 Medium Term 5-10 Long Term 10-30
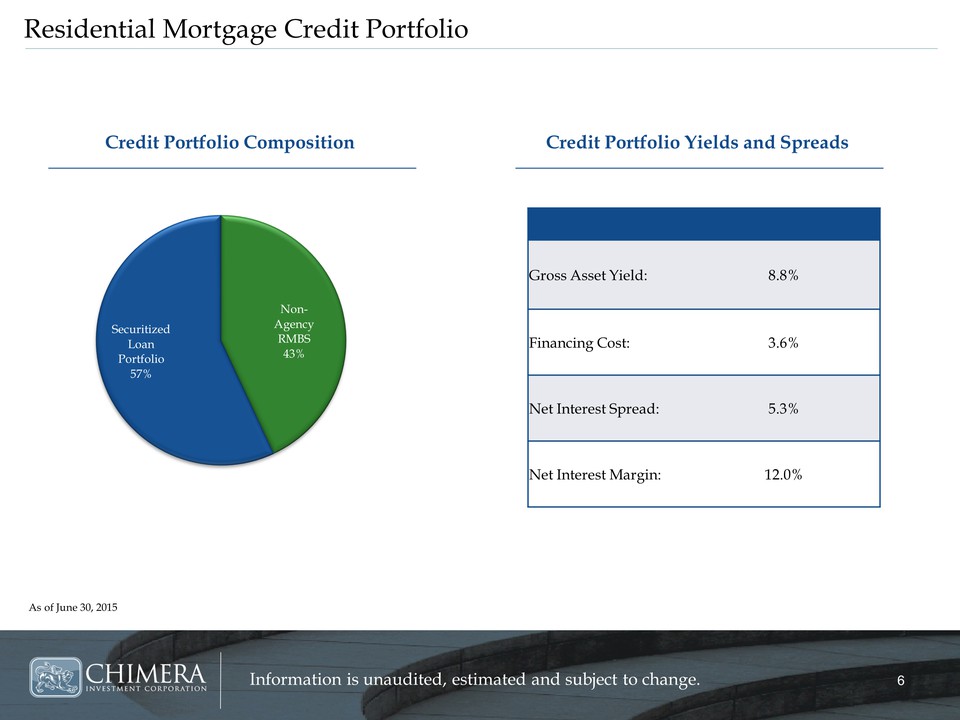
CIOnNfFoErmREaNtCioEn N iAsM uEn GaOuEdSit HeEdR, Eestimated and subject to change. 6 Residential Mortgage Credit Portfolio Credit Portfolio Composition As of June 30, 2015 Non-Agency RMBS 43% Securitized Loan Portfolio 57% Gross Asset Yield: 8.8% Financing Cost: 3.6% Net Interest Spread: 5.3% Net Interest Margin: 12.0% Credit Portfolio Yields and Spreads
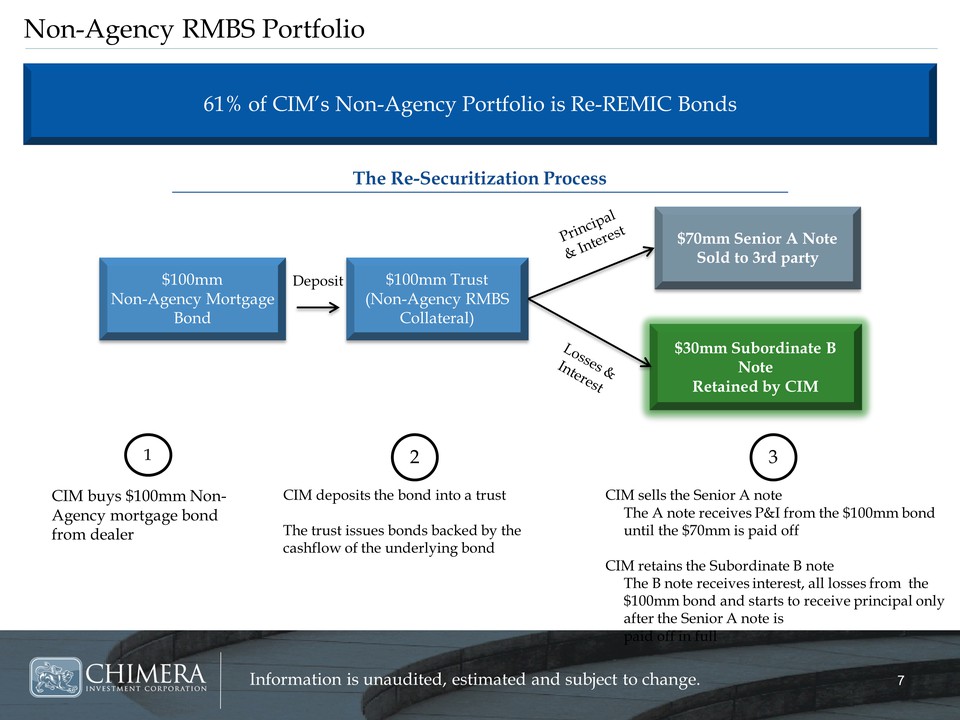
CIOnNfFoErmREaNtCioEn N iAsM uEn GaOuEdSit HeEdR, Eestimated and subject to change. 7 Non-Agency RMBS Portfolio 61% of CIM’s Non-Agency Portfolio is Re-REMIC Bonds The Re-Securitization Process $30mm Subordinate B Note Retained by CIM $100mm Non-Agency Mortgage Bond $100mm Trust (Non-Agency RMBS Collateral) $70mm Senior A Note Sold to 3rd party Deposit CIM buys $100mm Non-Agency mortgage bond from dealer CIM deposits the bond into a trust The trust issues bonds backed by the cashflow of the underlying bond CIM sells the Senior A note The A note receives P&I from the $100mm bond until the $70mm is paid off CIM retains the Subordinate B note The B note receives interest, all losses from the $100mm bond and starts to receive principal only after the Senior A note is paid off in full 1 2 3
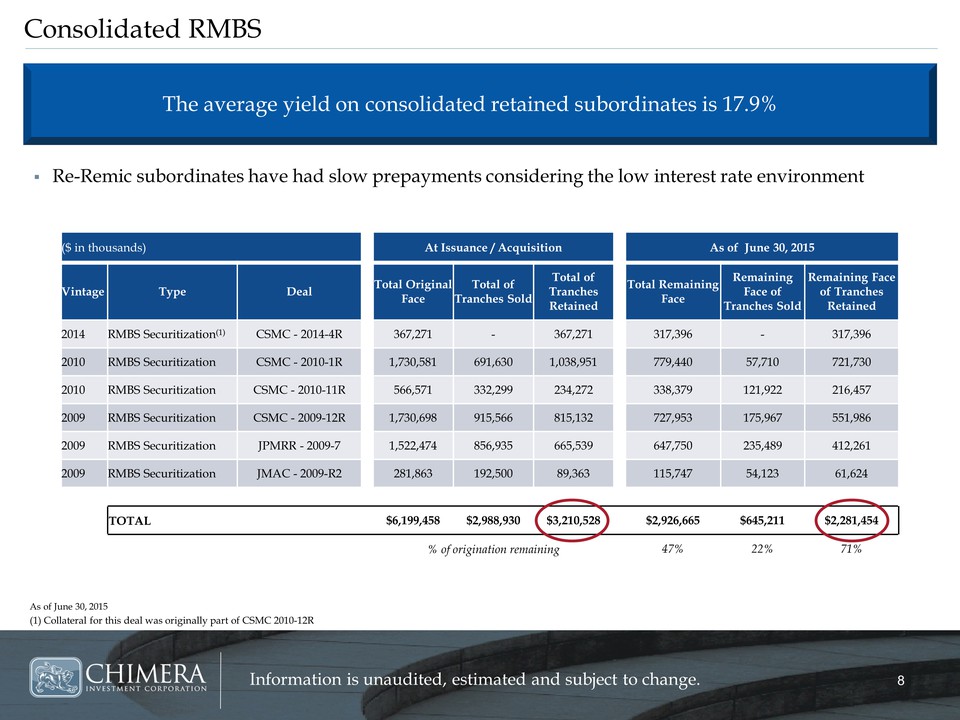
CIOnNfFoErmREaNtCioEn N iAsM uEn GaOuEdSit HeEdR, Eestimated and subject to change. 8 Re-Remic subordinates have had slow prepayments considering the low interest rate environment ($ in thousands) At Issuance / Acquisition As of June 30, 2015 Vintage Type Deal Total Original Face Total of Tranches Sold Total of Tranches Retained Total Remaining Face Remaining Face of Tranches Sold Remaining Face of Tranches Retained 2014 RMBS Securitization(1) CSMC - 2014-4R 367,271 - 367,271 317,396 - 317,396 2010 RMBS Securitization CSMC - 2010-1R 1,730,581 691,630 1,038,951 779,440 57,710 721,730 2010 RMBS Securitization CSMC - 2010-11R 566,571 332,299 234,272 338,379 121,922 216,457 2009 RMBS Securitization CSMC - 2009-12R 1,730,698 915,566 815,132 727,953 175,967 551,986 2009 RMBS Securitization JPMRR - 2009-7 1,522,474 856,935 665,539 647,750 235,489 412,261 2009 RMBS Securitization JMAC - 2009-R2 281,863 192,500 89,363 115,747 54,123 61,624 TOTAL $6,199,458 $2,988,930 $3,210,528 $2,926,665 $645,211 $2,281,454 % of origination remaining 47% 22% 71% Consolidated RMBS As of June 30, 2015 (1) Collateral for this deal was originally part of CSMC 2010-12R The average yield on consolidated retained subordinates is 17.9%
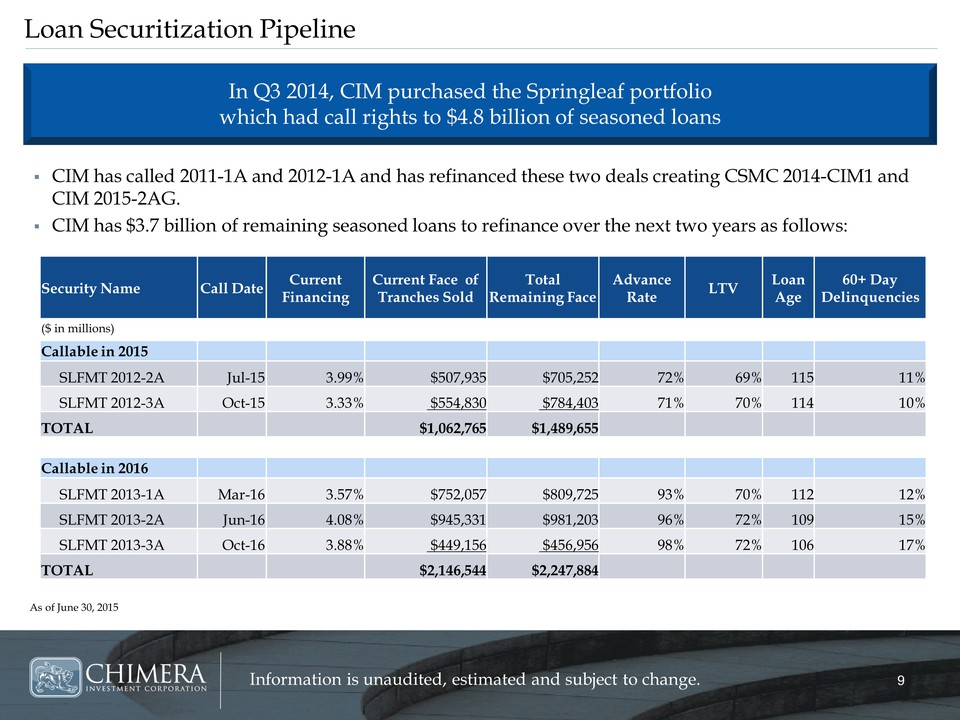
CIOnNfFoErmREaNtCioEn N iAsM uEn GaOuEdSit HeEdR, Eestimated and subject to change. 9 CIM has called 2011-1A and 2012-1A and has refinanced these two deals creating CSMC 2014-CIM1 and CIM 2015-2AG. CIM has $3.7 billion of remaining seasoned loans to refinance over the next two years as follows: Loan Securitization Pipeline As of June 30, 2015 In Q3 2014, CIM purchased the Springleaf portfolio which had call rights to $4.8 billion of seasoned loans Security Name Call Date Current Financing Current Face of Tranches Sold Total Remaining Face Advance Rate LTV Loan Age 60+ Day Delinquencies ($ in millions) Callable in 2015 SLFMT 2012-2A Jul-15 3.99% $507,935 $705,252 72% 69% 115 11% SLFMT 2012-3A Oct-15 3.33% $554,830 $784,403 71% 70% 114 10% TOTAL $1,062,765 $1,489,655 Callable in 2016 SLFMT 2013-1A Mar-16 3.57% $752,057 $809,725 93% 70% 112 12% SLFMT 2013-2A Jun-16 4.08% $945,331 $981,203 96% 72% 109 15% SLFMT 2013-3A Oct-16 3.88% $449,156 $456,956 98% 72% 106 17% TOTAL $2,146,544 $2,247,884
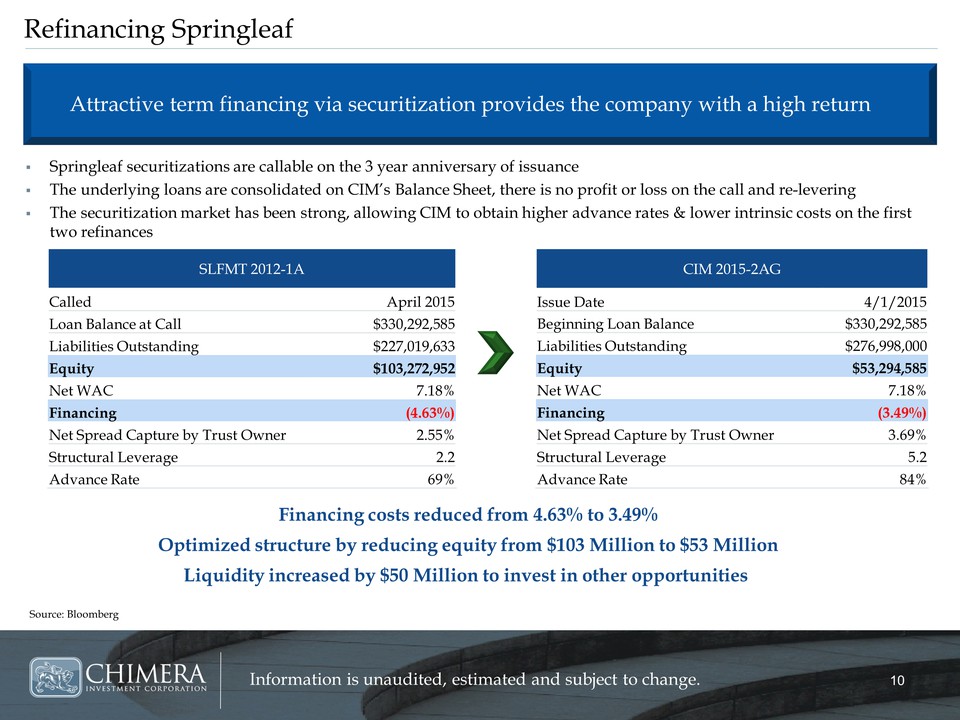
CIOnNfFoErmREaNtCioEn N iAsM uEn GaOuEdSit HeEdR, Eestimated and subject to change. 10 Springleaf securitizations are callable on the 3 year anniversary of issuance The underlying loans are consolidated on CIM’s Balance Sheet, there is no profit or loss on the call and re-levering The securitization market has been strong, allowing CIM to obtain higher advance rates & lower intrinsic costs on the first two refinances Refinancing Springleaf Attractive term financing via securitization provides the company with a high return Financing costs reduced from 4.63% to 3.49% Optimized structure by reducing equity from $103 Million to $53 Million Liquidity increased by $50 Million to invest in other opportunities SLFMT 2012-1A Called April 2015 Loan Balance at Call $330,292,585 Liabilities Outstanding $227,019,633 Equity $103,272,952 Net WAC 7.18% Financing (4.63%) Net Spread Capture by Trust Owner 2.55% Structural Leverage 2.2 Advance Rate 69% CIM 2015-2AG Issue Date 4/1/2015 Beginning Loan Balance $330,292,585 Liabilities Outstanding $276,998,000 Equity $53,294,585 Net WAC 7.18% Financing (3.49%) Net Spread Capture by Trust Owner 3.69% Structural Leverage 5.2 Advance Rate 84% Source: Bloomberg
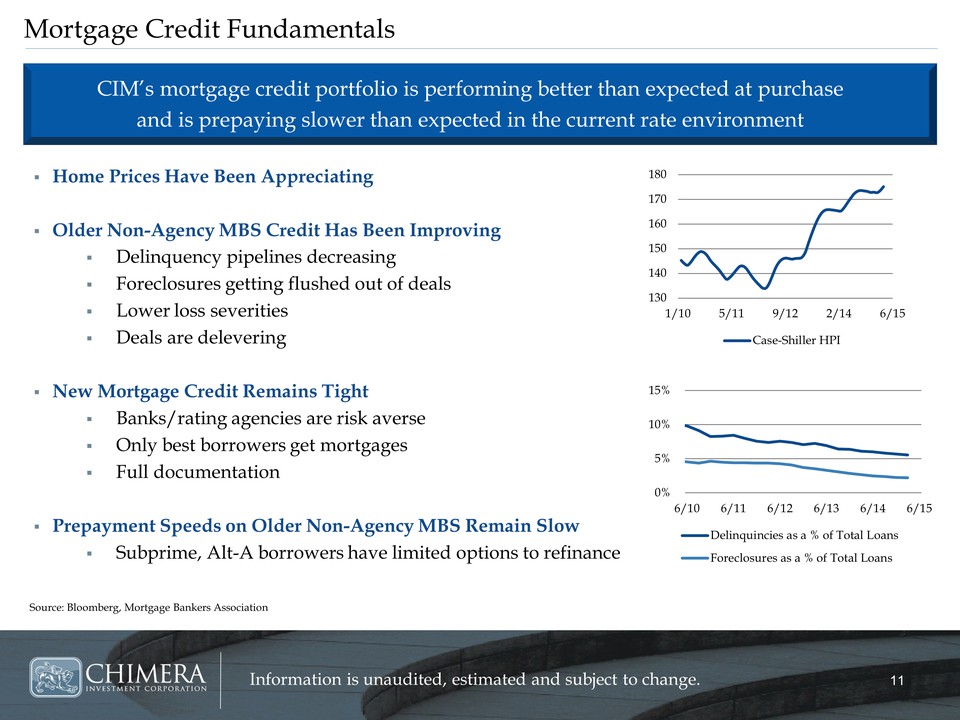
CIOnNfFoErmREaNtCioEn N iAsM uEn GaOuEdSit HeEdR, Eestimated and subject to change. 11 Home Prices Have Been Appreciating Older Non-Agency MBS Credit Has Been Improving Delinquency pipelines decreasing Foreclosures getting flushed out of deals Lower loss severities Deals are delevering New Mortgage Credit Remains Tight Banks/rating agencies are risk averse Only best borrowers get mortgages Full documentation Prepayment Speeds on Older Non-Agency MBS Remain Slow Subprime, Alt-A borrowers have limited options to refinance Mortgage Credit Fundamentals Source: Bloomberg, Mortgage Bankers Association CIM’s mortgage credit portfolio is performing better than expected at purchase and is prepaying slower than expected in the current rate environment 130 140 150 160 170 180 1/10 5/11 9/12 2/14 6/15 Case-Shiller HPI 0% 5% 10% 15% 6/10 6/11 6/12 6/13 6/14 6/15 Delinquincies as a % of Total Loans Foreclosures as a % of Total Loans
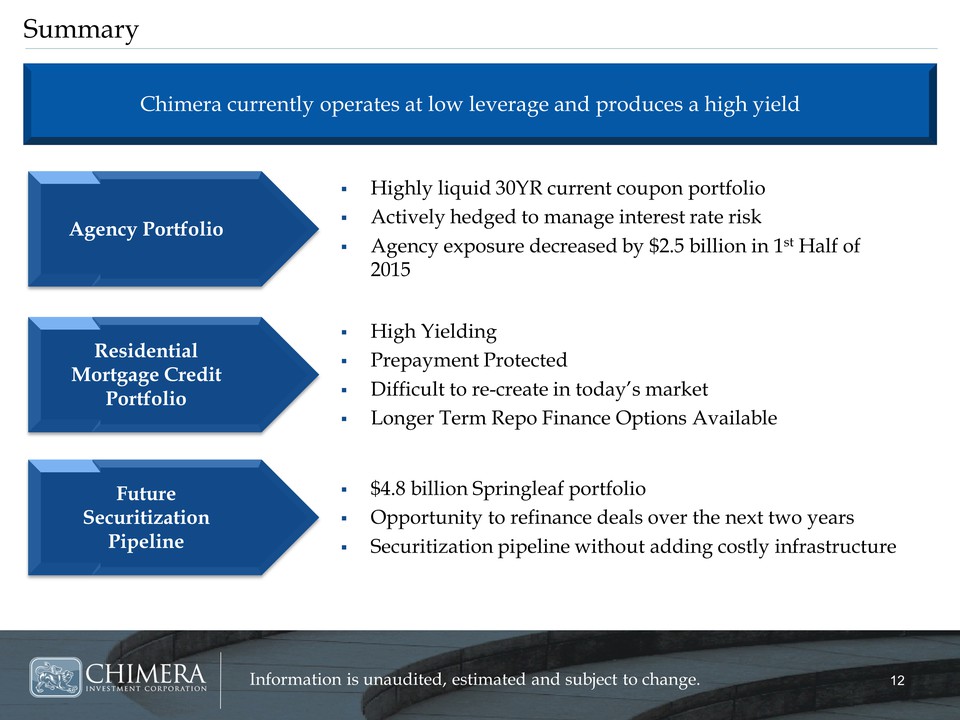
CIOnNfFoErmREaNtCioEn N iAsM uEn GaOuEdSit HeEdR, Eestimated and subject to change. 12 Summary Chimera currently operates at low leverage and produces a high yield Highly liquid 30YR current coupon portfolio Actively hedged to manage interest rate risk Agency exposure decreased by $2.5 billion in 1st Half of 2015 Agency Portfolio High Yielding Prepayment Protected Difficult to re-create in today’s market Longer Term Repo Finance Options Available $4.8 billion Springleaf portfolio Opportunity to refinance deals over the next two years Securitization pipeline without adding costly infrastructure Residential Mortgage Credit Portfolio Future Securitization Pipeline
CIOnNfFoErmREaNtCioEn N iAsM uEn GaOuEdSit HeEdR, Eestimated and subject to change. 12 Summary Chimera currently operates at low leverage and produces a high yield Highly liquid 30YR current coupon portfolio Actively hedged to manage interest rate risk Agency exposure decreased by $2.5 billion in 1st Half of 2015 Agency Portfolio High Yielding Prepayment Protected Difficult to re-create in today’s market Longer Term Repo Finance Options Available $4.8 billion Springleaf portfolio Opportunity to refinance deals over the next two years Securitization pipeline without adding costly infrastructure Residential Mortgage Credit Portfolio Future Securitization Pipeline

WWW.CHIMERAREIT.COM