Attached files
| file | filename |
|---|---|
| EX-32.2 - EXHIBIT 32.2 - PROSPECT CAPITAL CORP | psec10-kaq42015ex322.htm |
| EX-32.1 - EXHIBIT 32.1 - PROSPECT CAPITAL CORP | psec10-kaq42015ex321.htm |
| EX-31.1 - EXHIBIT 31.1 - PROSPECT CAPITAL CORP | psec10-kaq42015ex311.htm |
| EX-23.1 - EXHIBIT 23.1 - PROSPECT CAPITAL CORP | psec10-kaq42015ex231.htm |
| EX-99.1 - EXHIBIT 99.1 - PROSPECT CAPITAL CORP | psec10-kaq42015ex991.htm |
| EX-99.2 - EXHIBIT 99.2 - PROSPECT CAPITAL CORP | psec10-kaq42015ex992.htm |
| EX-31.2 - EXHIBIT 31.2 - PROSPECT CAPITAL CORP | psec10-kaq42015ex312.htm |
UNITED STATES
SECURITIES AND EXCHANGE COMMISSION
Washington, D.C. 20549
FORM 10-K/A
Amendment No. 1
ý | ANNUAL REPORT PURSUANT TO SECTION 13 OR 15(d) OF THE SECURITIES EXCHANGE ACT OF 1934 |
For the fiscal year ended June 30, 2015 OR | |
o | TRANSITION REPORT PURSUANT TO SECTION 13 OR 15(d) OF THE SECURITIES EXCHANGE ACT OF 1934 |
Commission File Number: 814-00659
PROSPECT CAPITAL CORPORATION
(Exact name of Registrant as specified in its charter)
Maryland | 43-2048643 |
(State or other jurisdiction of incorporation or organization) | (I.R.S. Employer Identification No.) |
10 East 40th Street, 42nd Floor | |
New York, New York | 10016 |
(Address of principal executive offices) | (Zip Code) |
Registrant’s telephone number, including area code: (212) 448-0702 | |
Securities registered pursuant to Section 12(b) of the Act:
Title of each class | Name of each exchange on which registered |
Common Stock, par value $0.001 per share | NASDAQ Global Select Market |
Securities registered pursuant to Section 12(g) of the Act: None
Indicate by check mark if the Registrant is a well-known seasoned issuer, as defined in Rule 405 of the Securities Act. Yes o No ý
Indicate by check mark if the Registrant is not required to file reports pursuant to Section 13 or Section 15(d) of the Act. Yes o No ý
Indicate by check mark whether the Registrant (1) has filed all reports required to be filed by Section 13 or 15(d) of the Securities Exchange Act of 1934 during the preceding 12 months (or for such shorter period that the Registrant was required to file such reports), and (2) has been subject to such filing requirements for the past 90 days. Yes ý No o
Indicate by check mark whether the Registrant has submitted electronically and posted on its corporate Website, if any, every Interactive Data File required to be submitted and posted pursuant to Rule 405 of Regulation S-T (§232.405 of this chapter) during the preceding 12 months (or for such shorter period that the Registrant was required to submit and post such files). Yes o No o
Indicate by check mark if disclosure of delinquent filers pursuant to Item 405 of Regulation S-K (§229.405 of this chapter) is not contained herein, and will not be contained, to the best of Registrant’s knowledge, in definitive proxy or information statements incorporated by reference in Part III of this Form 10-K or any amendment to this Form 10-K. o
Indicate by check mark whether the Registrant is a large accelerated filer, an accelerated filer, a non-accelerated filer, or a smaller reporting company. See the definitions of “large accelerated filer,” “accelerated filer” and “smaller reporting company” in Rule 12b-2 of the Exchange Act.
Large accelerated filer ý | Accelerated filer o | Non-accelerated filer o | Smaller reporting company o |
(Do not check if a smaller reporting company) | |||
Indicate by check mark whether the Registrant is a shell company (as defined in Rule 12b-2 of the Act). Yes o No ý
The aggregate market value of the common equity held by non-affiliates of the Registrant as of December 31, 2014 was $2.913 billion (based on the closing price on that date of $8.26 on the NASDAQ Global Select Market). For the purposes of calculating this amount only, all executive officers and Directors are “affiliates” of the Registrant.
As of August 25, 2015, there were 355,278,797 shares of the Registrant’s common stock outstanding.
Documents Incorporated by Reference
Portions of the Registrant’s definitive Proxy Statement relating to the 2015 Annual Meeting of Stockholders, to be filed with the Securities and Exchange Commission, are incorporated by reference in Part III of this Annual Report on Form 10-K to the extent described therein.
EXPLANATORY NOTE
Prospect Capital Corporation (the “Company”) is filing this Amendment No. 1 on Form 10-K/A (this “Amendment”) to amend its Annual Report on Form 10-K for the fiscal year ended June 30, 2015, as filed with the Securities and Exchange Commission (the “SEC”) on August 26, 2015 (the “Original 10-K”). The primary purpose of this Amendment is to amend Item 15 to include the separate financial statements of First Tower Finance Company LLC (“First Tower Finance”) and Harbortouch Payments, LLC (“Harbortouch”) pursuant to Rule 3-09 of Regulation S-X (the “Rule 3-09 financial statements”). This Amendment also amends the following disclosures in the Original 10-K related to the Rule 3-09 financial statements:
• | Note 3 to the Company’s consolidated financial statements in Part II, “Item 8. Financial Statements and Supplementary Data” to correctly reference the Rule 3-09 financial statements being filed by this Amendment and to explain ambiguity in the application of the calculations for Rule 3-09 of Regulation S-X; |
• | Item 15 to provide the audited financial statements of First Tower Finance including the independent auditor’s report by McGladrey LLP (“McGladrey”), First Tower Finance’s independent accountants, and to file McGladrey’s consent related to the financial statements contained in this filing; and |
• | Item 15 to provide the unaudited financial statements of Harbortouch. Harbortouch’s independent accountants do not have the proper insurance coverage to allow them to consent to the inclusion of their independent auditor’s report in this filing, and we have removed the reference to their consent related to the financial statements contained in this filing. Audited financial statements of Harbortouch for the year ending December 31, 2015 will be provided in our Form 10-K for the year ending June 30, 2016. |
In accordance with Rule 12b-15 under the Securities Exchange Act of 1934, this Amendment also includes currently dated certifications from the Company’s Chief Executive Officer and Chief Financial Officer as required by Sections 302 and 906 of the Sarbanes-Oxley Act of 2002. The certification exhibits have been revised accordingly.
This Amendment should be read in conjunction with the Original 10-K and the Company’s other filings made with the SEC subsequent to the filing of the Original 10-K on August 26, 2015. This Amendment is not intended to, nor does it, reflect events occurring after the filing of the Original 10-K, and does not modify or update the disclosures therein in any way other than as required to reflect the changes described above.
Table of Contents
Page | ||
PART I | ||
PART II | ||
PART III | ||
PART IV | ||
FORWARD-LOOKING STATEMENTS
This report contains information that may constitute “forward-looking statements.” Generally, the words “believe,” “expect,” “intend,” “estimate,” “anticipate,” “project,” “will” and similar expressions identify forward-looking statements, which generally are not historical in nature. However, the absence of these words or similar expressions does not mean that a statement is not forward-looking. All statements that address operating performance, events or developments that we expect or anticipate will occur in the future—including statements relating to volume growth, share of sales and earnings per share growth, and statements expressing general views about future operating results—are forward-looking statements. Management believes that these forward-looking statements are reasonable as and when made. However, caution should be taken not to place undue reliance on any such forward-looking statements because such statements speak only as of the date when made. We undertake no obligation to publicly update or revise any forward-looking statements, whether as a result of new information, future events or otherwise, except as required by law. In addition, forward-looking statements are subject to certain risks and uncertainties that could cause actual results to differ materially from our historical experience and our present expectations or projections. These risks and uncertainties include, but are not limited to, those described in Part I, “Item 1A. Risk Factors” and elsewhere in this report and those described from time to time in our future reports filed with the Securities and Exchange Commission.
The forward-looking statements contained in this report involve a number of risks and uncertainties, including statements concerning:
• | our future operating results; |
• | our business prospects and the prospects of our portfolio companies; |
• | the impact of investments that we expect to make; |
• | our contractual arrangements and relationships with third parties; |
• | the dependence of our future success on the general economy and its impact on the industries in which we invest; |
• | the ability of our portfolio companies to achieve their objectives; |
• | difficulty in obtaining financing or raising capital, especially in the current credit and equity environment; |
• | the level and volatility of prevailing interest rates and credit spreads, magnified by the current turmoil in the credit markets; |
• | adverse developments in the availability of desirable loan and investment opportunities whether they are due to competition, regulation or otherwise; |
• | a compression of the yield on our investments and the cost of our liabilities, as well as the level of leverage available to us; |
• | our regulatory structure and tax treatment, including our ability to operate as a business development company and a regulated investment company; |
• | the adequacy of our cash resources and working capital; |
• | the timing of cash flows, if any, from the operations of our portfolio companies; |
• | the ability of the Investment Adviser to locate suitable investments for us and to monitor and administer our investments; and |
• | authoritative generally accepted accounting principles or policy changes from such standard-setting bodies as the Financial Accounting Standards Board, the Securities and Exchange Commission, Internal Revenue Service, the NASDAQ Global Select Market, and other authorities that we are subject to, as well as their counterparts in any foreign jurisdictions where we might do business. |
1
PART I
Item 1. Business
In this report, the terms “Prospect,” “we,” “us” and “our” mean Prospect Capital Corporation and all entities included in our consolidated financial statements, unless the context specifically requires otherwise.
General
Prospect Capital Corporation is a financial services company that primarily lends to and invests in middle market privately-held companies. We are a closed-end investment company incorporated in Maryland. We have elected to be regulated as a business development company (“BDC”) under the Investment Company Act of 1940 (the “1940 Act”). As a BDC, we have elected to be treated as a regulated investment company (“RIC”), under Subchapter M of the Internal Revenue Code of 1986 (the “Code”). We were organized on April 13, 2004 and were funded in an initial public offering completed on July 27, 2004. We are one of the largest BDCs with approximately $6.8 billion of total assets as of June 30, 2015.
We are externally managed by our investment adviser, Prospect Capital Management L.P. (“Prospect Capital Management” or the “Investment Adviser”). Prospect Administration LLC (“Prospect Administration” or the “Administrator”) provides administrative services and facilities necessary for us to operate.
Our investment objective is to generate both current income and long-term capital appreciation through debt and equity investments. We invest primarily in senior and subordinated debt and equity of private companies in need of capital for acquisitions, divestitures, growth, development, recapitalizations and other purposes. We work with the management teams or financial sponsors to seek investments with historical cash flows, asset collateral or contracted pro-forma cash flows.
We currently have nine origination strategies in which we make investments: (1) lending in private equity sponsored transactions, (2) lending directly to companies not owned by private equity firms, (3) control investments in corporate operating companies, (4) control investments in financial companies, (5) investments in structured credit, (6) real estate investments, (7) investments in syndicated debt, (8) aircraft leasing and (9) online lending. We continue to evaluate other origination strategies in the ordinary course of business with no specific tops-down allocation to any single origination strategy.
Lending in Private Equity Sponsored Transactions – We make loans to companies which are controlled by leading private equity firms. This debt can take the form of first lien, second lien, unitranche or unsecured loans. In making these investments, we look for a diversified customer base, recurring demand for the product or service, barriers to entry, strong historical cash flow and experienced management teams. These loans typically have significant equity subordinate to our loan position. Historically, this strategy has comprised approximately 50%-60% of our business, but more recently it is less than 50% of our business.
Lending Directly to Companies – We provide debt financing to companies owned by non-private equity firms, the company founder, a management team or a family. Here, in addition to the strengths we look for in a sponsored transaction, we also look for the alignment with the management team with significant invested capital. This strategy often has less competition than the private equity sponsor strategy because such company financing needs are not easily addressed by banks and often require more diligence preparation. Direct lending can result in higher returns and lower leverage than sponsor transactions and may include warrants or equity to us. Historically, this strategy has comprised approximately 5%-15% of our business, but more recently it is less than 5% of our business.
Control Investments in Corporate Operating Companies – This strategy involves acquiring controlling stakes in non-financial operating companies. Our investments in these companies are generally structured as a combination of yield-producing debt and equity. We provide certainty of closure to our counterparties, give the seller personal liquidity and generally look for management to continue on in their current roles. This strategy has comprised approximately 10%-15% of our business.
Control Investments in Financial Companies – This strategy involves acquiring controlling stakes in financial companies, including consumer direct lending, sub-prime auto lending and other strategies. Our investments in these companies are generally structured as a combination of yield-producing debt and equity. These investments are often structured in a tax-efficient RIC-compliant partnership, enhancing returns. This strategy has comprised approximately 5%-15% of our business.
Investments in Structured Credit – We make investments in collateralized loan obligations (“CLOs”), generally taking a significant position in the subordinated interests (equity) of the CLOs. The CLOs include a diversified portfolio of broadly syndicated loans and do not have direct exposure to real estate, mortgages, sub-prime debt or consumer based debt. The CLOs in which we invest are managed by top-tier collateral managers that have been thoroughly diligenced prior to investment. This strategy has comprised approximately 10%-20% of our business.
2
Real Estate Investments – We make investments in real estate through our three wholly-owned tax-efficient real estate investment trusts (“REITs”), American Property REIT Corp. (“APRC”), National Property REIT Corp. (“NPRC”) and United Property REIT Corp. (“UPRC” and collectively with APRC and NPRC, “our REITs”). Our real estate investments are in various classes of fully developed and occupied real estate properties that generate current yields. We seek to identify properties that have historically high occupancy and steady cash flow generation. Our REITs partner with established property managers with experience in managing the property type to manage such properties after acquisition. This is a more recent investment strategy that has comprised approximately 5%-10% of our business.
Investments in Syndicated Debt – On an opportunistic basis, we make investments in loans and high yield bonds that have been sold to a syndicate of buyers. Here we look for investments with attractive risk-adjusted returns after we have completed a fundamental credit analysis. These investments are purchased with a long term, buy-and-hold outlook and we look to provide significant structuring input by providing anchoring orders. This strategy has comprised approximately 5%-10% of our business.
Aircraft Leasing – We invest debt as well as equity in aircraft assets subject to commercial leases to credit-worthy airlines across the globe. These investments present attractive return opportunities due to cash flow consistency from long-lived assets coupled with hard asset collateral. We seek to deliver risk-adjusted returns with strong downside protection by analyzing relative value characteristics across the spectrum of aircraft types of all vintages. Our target portfolio includes both in-production and out-of-production jet and turboprop aircraft and engines, operated by airlines across the globe. This strategy comprised approximately 1.5% of our business in the fiscal year ended June 30, 2014 and approximately 1% as of June 30, 2015.
Online Lending – We make investments in loans originated by certain consumer loan and small and medium sized business (“SME”) originators. We purchase each loan in its entirety (i.e., a “whole loan”). The borrowers are consumers and SMEs. The loans are typically serviced by the originators of the loans. This strategy comprised approximately 1% of our business in the fiscal year ended June 30, 2014 and less than 5% as of June 30, 2015.
Typically, we concentrate on making investments in companies with annual revenues of less than $750 million and enterprise values of less than $1 billion. Our typical investment involves a secured loan of less than $250 million. We also acquire controlling interests in companies in conjunction with making secured debt investments in such companies. In most cases, companies in which we invest are privately held at the time we invest in them. We refer to these companies as “target” or “middle market” companies and these investments as “middle market investments.”
We seek to maximize total returns to our investors, including both current yield and equity upside, by applying rigorous credit analysis and asset-based and cash-flow based lending techniques to make and monitor our investments. We are constantly pursuing multiple investment opportunities, including purchases of portfolios from private and public companies, as well as originations and secondary purchases of particular securities. We also regularly evaluate control investment opportunities in a range of industries, and some of these investments could be material to us. There can be no assurance that we will successfully consummate any investment opportunity we are currently pursuing. If any of these opportunities are consummated, there can be no assurance that investors will share our view of valuation or that any assets acquired will not be subject to future write downs, each of which could have an adverse effect on our stock price.
“Spin-Offs” of Certain Business Strategies
We previously announced that we intend to unlock value by “spinning off” certain “pure play” business strategies to our shareholders. We desire through these transactions to (i) transform some of the business strategies we have successfully grown and developed inside Prospect into pure play public companies with the potential for increased earnings multiples, (ii) allow for continued revenue and earnings growth through more flexible non-BDC formats (which are expected to benefit from not having one or more of the (a) 30% basket, (b) leverage, and (c) control basket constraints with which BDCs must comply), and (iii) free up our 30% basket and leverage capacity for new originations at Prospect. The business strategies we intend to enable our shareholders to participate in on a “pure play” basis have grown faster than our overall growth rate in the past few years, with outlets in less constraining structures required to continue this strong growth. We anticipate these non-BDC companies will have tax efficient structures.
We initially intend on focusing these efforts on three separate companies consisting of portions of our (i) consumer online lending business, (ii) real estate business and (iii) structured credit business. We are seeking to divest these businesses in conjunction with rights offering capital raises in which existing Prospect shareholders could elect to participate in each offering or sell their rights. The goals of these dispositions include leverage and earnings neutrality for Prospect. Our primary objective is to maximize the valuation of each offering (declining to proceed with any offering if we find any valuation not to be attractive).
3
The sizes and likelihood of these dispositions, some of which are expected to be partial rather than complete spin-offs, remain to be determined, but we currently expect the collective size of these three dispositions to be approximately 10% of our asset base. We seek to complete the first of these dispositions late in calendar year 2015 and the others in 2016 in a sequential fashion. The consummation of any of the spin-offs depends upon, among other things: market conditions, regulatory and exchange listing approval, and sufficient investor demand, and there can be no guarantee that we will consummate any of these spin-offs.
On March 11, 2015, Prospect Yield Corporation, LLC (“Prospect Yield”), our wholly-owned subsidiary, filed a registration statement with the SEC in connection with our rights offering disposition of a portion of our structured credit business, and Prospect Yield filed an amendment on April 17, 2015. We are a selling stockholder under the registration statement. We seek but cannot guarantee consummation of this disposition, which is subject to regulatory review, during calendar year 2016.
On May 6, 2015, Prospect Finance Company, LLC (“Prospect Finance”), our indirect wholly-owned subsidiary, filed a confidential registration statement with the SEC in connection with our rights offering disposition of our online consumer lending business, and Prospect Finance filed confidential amendments on June 16, July 20 and August 12, 2015. We are a selling stockholder under the registration statement. We seek but cannot guarantee consummation of this disposition, which is subject to regulatory review, late in calendar year 2015.
On May 6, 2015, Prospect Realty Income Trust Corp. (“Prospect Realty”), our wholly-owned subsidiary, filed a confidential registration statement with the SEC in connection with our rights offering disposition of a portion of our real estate business, and Prospect Realty filed confidential amendments on June 30, July 27 and August 12, 2015. We are a selling stockholder under the registration statement. We seek but cannot guarantee consummation of this disposition, which is subject to regulatory review, during calendar year 2016.
On May 19, 2015, Prospect, Prospect Capital Management, Prospect Yield, Prospect Finance and Prospect Realty filed an application for an exemptive order authorizing a joint transaction that may otherwise be prohibited by Section 57(a)(4) of the 1940 Act in order to complete each of the rights offerings described above and are awaiting comments from the SEC.
We expect to continue as a BDC in the future to pursue our multi-line origination strategy (including continuing to invest in the businesses discussed above) as a value-added differentiating factor compared with other BDCs.
Our Investment Objective and Policies
Our investment objective is to generate both current income and long-term capital appreciation through debt and equity investments. We focus on making investments in private companies. We are a non-diversified company within the meaning of the 1940 Act.
We invest primarily in first and second lien secured loans and unsecured debt, which in some cases includes an equity component. First and second lien secured loans generally are senior debt instruments that rank ahead of unsecured debt of a given portfolio company. These loans also have the benefit of security interests on the assets of the portfolio company, which may rank ahead of or be junior to other security interests. Our investments in CLOs are subordinated to senior loans and are generally unsecured. We invest in debt and equity positions of CLOs which are a form of securitization in which the cash flows of a portfolio of loans are pooled and passed on to different classes of owners in various tranches. Our CLO investments are derived from portfolios of corporate debt securities which are generally risk rated from BB to B.
We also acquire controlling interests in companies in conjunction with making secured debt investments in such companies. These may be in several industries, including industrial, service, aircraft leasing, real estate and financial businesses.
4
We seek to maximize returns and minimize risk for our investors by applying rigorous analysis to make and monitor our investments. While the structure of our investments varies, we can invest in senior secured debt, senior unsecured debt, subordinated secured debt, subordinated unsecured debt, convertible debt, convertible preferred equity, preferred equity, common equity, warrants and other instruments, many of which generate current yield. While our primary focus is to seek current income through investment in the debt and/or dividend-paying equity securities of eligible privately-held, thinly-traded or distressed companies and long-term capital appreciation by acquiring accompanying warrants, options or other equity securities of such companies, we may invest up to 30% of the portfolio in opportunistic investments in order to seek enhanced returns for stockholders. Such investments may include investments in the debt and equity instruments of broadly-traded public companies. We expect that these public companies generally will have debt securities that are non-investment grade. Such investments may also include purchases (either in the primary or secondary markets) of the equity and junior debt tranches of a type of such pools known as CLOs. Structurally, CLOs are entities that are formed to hold a portfolio of senior secured loans made to companies whose debt is rated below investment grade or, in limited circumstances, unrated. The senior secured loans within a CLO are limited to senior secured loans which meet specified credit and diversity criteria and are subject to concentration limitations in order to create an investment portfolio that is diverse by senior secured loan, borrower, and industry, with limitations on non-U.S. borrowers. Within this 30% basket, we have and may make additional investments in debt and equity securities of financial companies and companies located outside of the United States.
Our investments may include other equity investments, such as warrants, options to buy a minority interest in a portfolio company, or contractual payment rights or rights to receive a proportional interest in the operating cash flow or net income of such company. When determined by the Investment Adviser to be in our best interest, we may acquire a controlling interest in a portfolio company. Any warrants we receive with our debt securities may require only a nominal cost to exercise, and thus, as a portfolio company appreciates in value, we may achieve additional investment return from this equity interest. We have structured, and will continue to structure, some warrants to include provisions protecting our rights as a minority-interest or, if applicable, controlling-interest holder, as well as puts, or rights to sell such securities back to the company, upon the occurrence of specified events. In many cases, we obtain registration rights in connection with these equity interests, which may include demand and “piggyback” registration rights.
We plan to hold many of our debt investments to maturity or repayment, but will sell a debt investment earlier if a liquidity event takes place, such as the sale or recapitalization of a portfolio company, or if we determine a sale of such debt investment to be in our best interest.
We have qualified and elected to be treated for U.S. federal income tax purposes as a RIC under Subchapter M of the Code. As a RIC, we generally do not have to pay corporate-level U.S. federal income taxes on any ordinary income or capital gains that we distribute to our stockholders as dividends. To continue to qualify as a RIC, we must, among other things, meet certain source-of-income and asset diversification requirements (as described below). In addition, to qualify for RIC tax treatment, we must distribute to our stockholders, for each taxable year, at least 90% of our “investment company taxable income,” which is generally our ordinary income plus the excess of our realized net short-term capital gains over our realized net long-term capital losses.
For a discussion of the risks inherent in our portfolio investments, see “Risk Factors – Risks Relating to Our Investments.”
Industry Sectors
Our portfolio is invested across 28 industry categories. Excluding our CLO investments, which do not have industry concentrations, no individual industry comprises more than 10.8% of the portfolio on either a cost or fair value basis.
5
Ongoing Relationships with Portfolio Companies
Monitoring
Prospect Capital Management monitors our portfolio companies on an ongoing basis. Prospect Capital Management will continue to monitor the financial trends of each portfolio company to determine if it is meeting its business plan and to assess the appropriate course of action for each company.
Prospect Capital Management employs several methods of evaluating and monitoring the performance and value of our investments, which may include, but are not limited to, the following:
• | Assessment of success in adhering to the portfolio company’s business plan and compliance with covenants; |
• | Regular contact with portfolio company management and, if appropriate, the financial or strategic sponsor to discuss financial position, requirements and accomplishments; |
• | Comparisons to other portfolio companies in the industry, if any; |
• | Attendance at and participation in board meetings of the portfolio company; and |
• | Review of monthly and quarterly financial statements and financial projections for the portfolio company. |
Investment Valuation
To value our investments, we follow the guidance of ASC 820, Fair Value Measurement (“ASC 820”), that defines fair value, establishes a framework for measuring fair value in conformity with GAAP, and requires disclosures about fair value measurements. In accordance with ASC 820, the fair value of our investments is defined as the price that we would receive upon selling an investment in an orderly transaction to an independent buyer in the principal or most advantageous market in which that investment is transacted.
ASC 820 classifies the inputs used to measure these fair values into the following hierarchy:
Level 1: Quoted prices in active markets for identical assets or liabilities, accessible by us at the measurement date.
Level 2: Quoted prices for similar assets or liabilities in active markets, or quoted prices for identical or similar assets or liabilities in markets that are not active, or other observable inputs other than quoted prices.
Level 3: Unobservable inputs for the asset or liability.
In all cases, the level in the fair value hierarchy within which the fair value measurement in its entirety falls has been determined based on the lowest level of input that is significant to the fair value measurement. Our assessment of the significance of a particular input to the fair value measurement in its entirety requires judgment and considers factors specific to each investment.
Our Board of Directors has established procedures for the valuation of our investment portfolio. These procedures are detailed below.
Investments for which market quotations are readily available are valued at such market quotations.
For most of our investments, market quotations are not available. With respect to investments for which market quotations are not readily available or when such market quotations are deemed not to represent fair value, our Board of Directors has approved a multi-step valuation process each quarter, as described below.
1. | Each portfolio company or investment is reviewed by our investment professionals with independent valuation firms engaged by our Board of Directors. |
2. | The independent valuation firms conduct independent valuations and make their own independent assessments. |
3. | The Audit Committee of our Board of Directors reviews and discusses the preliminary valuation of the Investment Adviser and that of the independent valuation firms. |
4. | The Board of Directors discusses valuations and determines the fair value of each investment in our portfolio in good faith based on the input of the Investment Adviser, the respective independent valuation firm and the Audit Committee. |
6
Our non-CLO investments are valued utilizing a yield analysis, enterprise value (“EV”) analysis, net asset value analysis, liquidation analysis, discounted cash flow analysis, or a combination of methods, as appropriate. The yield analysis uses loan spreads for loans, dividend yields for certain investments and other relevant information implied by market data involving identical or comparable assets or liabilities. Under the EV analysis, the EV of a portfolio company is first determined and allocated over the portfolio company’s securities in order of their preference relative to one another (i.e., “waterfall” allocation). To determine the EV, we typically use a market multiples approach that considers relevant and applicable market trading data of guideline public companies, transaction metrics from precedent M&A transactions and/or a discounted cash flow analysis. The net asset value analysis is used to derive a value of an underlying investment (such as real estate property) by dividing a relevant earnings stream by an appropriate capitalization rate. For this purpose, we consider capitalization rates for similar properties as may be obtained from guideline public companies and/or relevant transactions. The liquidation analysis is intended to approximate the net recovery value of an investment based on, among other things, assumptions regarding liquidation proceeds based on a hypothetical liquidation of a portfolio company’s assets. The discounted cash flow analysis uses valuation techniques to convert future cash flows or earnings to a range of fair values from which a single estimate may be derived utilizing an appropriate discount rate. The measurement is based on the net present value indicated by current market expectations about those future amounts.
In applying these methodologies, additional factors that we consider in valuing our investments may include, as we deem relevant: security covenants, call protection provisions, and information rights; the nature and realizable value of any collateral; the portfolio company’s ability to make payments; the principal markets in which the portfolio company does business; publicly available financial ratios of peer companies; the principal market; and enterprise values, among other factors.
Our investments in CLOs are classified as ASC 820 Level 3 securities and are valued using a discounted cash flow model. The valuations have been accomplished through the analysis of the CLO deal structures to identify the risk exposures from the modeling point of view as well as to determine an appropriate call date. For each CLO security, the most appropriate valuation approach has been chosen from alternative approaches to ensure the most accurate valuation for such security. To value a CLO, both the assets and the liabilities of the CLO capital structure are modeled. We use a waterfall engine to store the collateral data, generate collateral cash flows from the assets based on various assumptions for the risk factors, distribute the cash flows to the liability structure based on the payment priorities, and discount them back using current market discount rates. The main risk factors are: default risk, interest rate risk, downgrade risk, and credit spread risk.
For a discussion of the risks inherent in determining the value of securities for which readily available market values do not exist, see “Risk Factors – Risks Relating to Our Business – Most of our portfolio investments are recorded at fair value as determined in good faith under the direction of our Board of Directors and, as a result, there is uncertainty as to the value of our portfolio investments.”
Managerial Assistance
As a BDC, we are obligated under the 1940 Act to make available to certain of our portfolio companies significant managerial assistance. “Making available significant managerial assistance” refers to any arrangement whereby we provide significant guidance and counsel concerning the management, operations, or business objectives and policies of a portfolio company. We are also deemed to be providing managerial assistance to all portfolio companies that we control, either by ourselves or in conjunction with others. The nature and extent of significant managerial assistance provided by us to controlled and non-controlled portfolio companies will vary according to the particular needs of each portfolio company. Examples of such activities include (i) advice on recruiting, hiring, management and termination of employees, officers and directors, succession planning and other human resource matters; (ii) advice on capital raising, capital budgeting, and capital expenditures; (iii) advice on advertising, marketing, and sales; (iv) advice on fulfillment, operations, and execution; (v) advice on managing relationships with unions and other personnel organizations, financing sources, vendors, customers, lessors, lessees, lawyers, accountants, regulators and other important counterparties; (vi) evaluating acquisition and divestiture opportunities, plant expansions and closings, and market expansions; (vii) participating in audit committee, nominating committee, board and management meetings; (viii) consulting with and advising board members and officers of portfolio companies (on overall strategy and other matters); and (ix) providing other organizational, operational, managerial and financial guidance.
Prospect Administration, when performing a managerial assistance agreement executed with each portfolio company to which we provide managerial assistance, arranges for the provision of such managerial assistance on our behalf. When doing so, Prospect Administration utilizes personnel of our Investment Adviser. We, on behalf of Prospect Administration, invoice portfolio companies receiving and paying for managerial assistance, and we remit to Prospect Administration its cost of providing such services, including the charges deemed appropriate by our Investment Adviser for providing such managerial assistance. No income was recognized by Prospect.
7
Investment Adviser
Prospect Capital Management manages our investments as the Investment Adviser. Prospect Capital Management is a Delaware limited partnership that has been registered as an investment adviser under the Investment Advisers Act of 1940 (the “Advisers Act”) since March 31, 2004. Prospect Capital Management is led by John F. Barry III and M. Grier Eliasek, two senior executives with significant investment advisory and business experience. Both Messrs. Barry and Eliasek spend a significant amount of their time in their roles at Prospect Capital Management working on our behalf. The principal executive offices of Prospect Capital Management are 10 East 40th Street, 42nd Floor, New York, NY 10016. We depend on the due diligence, skill and network of business contacts of the senior management of the Investment Adviser. We also depend, to a significant extent, on the Investment Adviser’s investment professionals and the information and deal flow generated by those investment professionals in the course of their investment and portfolio management activities. The Investment Adviser’s senior management team evaluates, negotiates, structures, closes, monitors and services our investments. Our future success depends to a significant extent on the continued service of the senior management team, particularly John F. Barry III and M. Grier Eliasek. The departure of any of the senior managers of the Investment Adviser could have a materially adverse effect on our ability to achieve our investment objective. In addition, we can offer no assurance that Prospect Capital Management will remain the Investment Adviser or that we will continue to have access to its investment professionals or its information and deal flow. Under the Investment Advisory Agreement (as defined below), we pay Prospect Capital Management investment advisory fees, which consist of an annual base management fee based on our gross assets as well as a two-part incentive fee based on our performance. Mr. Barry currently controls Prospect Capital Management.
Investment Advisory Agreement
Terms
We have entered into an investment advisory and management agreement with Prospect Capital Management (the “Investment Advisory Agreement”) under which the Investment Adviser, subject to the overall supervision of our Board of Directors, manages our day-to-day operations and provides us with investment advisory services. Under the terms of the Investment Advisory Agreement, the Investment Adviser: (i) determines the composition of our portfolio, the nature and timing of the changes to our portfolio and the manner of implementing such changes, (ii) identifies, evaluates and negotiates the structure of the investments we make (including performing due diligence on our prospective portfolio companies); and (iii) closes and monitors investments we make.
Prospect Capital Management’s services under the Investment Advisory Agreement are not exclusive, and it is free to furnish similar services to other entities so long as its services to us are not impaired. For providing these services, the Investment Adviser receives a fee from us, consisting of two components: a base management fee and an incentive fee. The base management fee is calculated at an annual rate of 2.00% on our gross assets (including amounts borrowed). For services currently rendered under the Investment Advisory Agreement, the base management fee is payable quarterly in arrears. The base management fee is calculated based on the average value of our gross assets at the end of the two most recently completed calendar quarters and appropriately adjusted for any share issuances or repurchases during the current calendar quarter. Base management fees for any partial month or quarter are appropriately prorated.
The incentive fee has two parts. The first part, the income incentive fee, is calculated and payable quarterly in arrears based on our pre-incentive fee net investment income for the immediately preceding calendar quarter. For this purpose, pre-incentive fee net investment income means interest income, dividend income and any other income (including any other fees (other than fees for providing managerial assistance), such as commitment, origination, structuring, diligence and consulting fees and other fees that we receive from portfolio companies) accrued during the calendar quarter, minus our operating expenses for the quarter (including the base management fee, expenses payable under the Administration Agreement described below, and any interest expense and dividends paid on any issued and outstanding preferred stock, but excluding the incentive fee). Pre-incentive fee net investment income includes, in the case of investments with a deferred interest feature (such as original issue discount, debt instruments with payment in kind interest and zero coupon securities), accrued income that we have not yet received in cash. Pre-incentive fee net investment income does not include any realized capital gains, realized capital losses or unrealized capital appreciation or depreciation. Pre-incentive fee net investment income, expressed as a rate of return on the value of our net assets at the end of the immediately preceding calendar quarter, is compared to a “hurdle rate” of 1.75% per quarter (7.00% annualized).
8
The net investment income used to calculate this part of the incentive fee is also included in the amount of the gross assets used to calculate the 2.00% base management fee. We pay the Investment Adviser an income incentive fee with respect to our pre-incentive fee net investment income in each calendar quarter as follows:
• | No incentive fee in any calendar quarter in which our pre-incentive fee net investment income does not exceed the hurdle rate; |
• | 100.00% of our pre-incentive fee net investment income with respect to that portion of such pre-incentive fee net investment income, if any, that exceeds the hurdle rate but is less than 125.00% of the quarterly hurdle rate in any calendar quarter (8.75% annualized with a 7.00% annualized hurdle rate); and |
• | 20.00% of the amount of our pre-incentive fee net investment income, if any, that exceeds 125.00% of the quarterly hurdle rate in any calendar quarter (8.75% annualized with a 7.00% annualized hurdle rate). |
These calculations are appropriately prorated for any period of less than three months and adjusted for any share issuances or repurchases during the current quarter.
The second part of the incentive fee, the capital gains incentive fee, is determined and payable in arrears as of the end of each calendar year (or upon termination of the Investment Advisory Agreement, as of the termination date), and equals 20.00% of our realized capital gains for the calendar year, if any, computed net of all realized capital losses and unrealized capital depreciation at the end of such year. In determining the capital gains incentive fee payable to the Investment Adviser, we calculate the aggregate realized capital gains, aggregate realized capital losses and aggregate unrealized capital depreciation, as applicable, with respect to each investment that has been in our portfolio. For the purpose of this calculation, an “investment” is defined as the total of all rights and claims which may be asserted against a portfolio company arising out of our participation in the debt, equity, and other financial instruments issued by that company. Aggregate realized capital gains, if any, equals the sum of the differences between the aggregate net sales price of each investment and the aggregate cost basis of such investment when sold or otherwise disposed of. Aggregate realized capital losses equal the sum of the amounts by which the aggregate net sales price of each investment is less than the aggregate cost basis of such investment when sold or otherwise disposed. Aggregate unrealized capital depreciation equals the sum of the differences, if negative, between the aggregate valuation of each investment and the aggregate cost basis of such investment as of the applicable calendar year end. At the end of the applicable calendar year, the amount of capital gains that serves as the basis for our calculation of the capital gains incentive fee involves netting aggregate realized capital gains against aggregate realized capital losses on a since-inception basis and then reducing this amount by the aggregate unrealized capital depreciation. If this number is positive, then the capital gains incentive fee payable is equal to 20.00% of such amount, less the aggregate amount of any capital gains incentive fees paid since inception.
Examples of Quarterly Incentive Fee Calculation
Example 1: Income Incentive Fee*
*The hypothetical amount of pre-incentive fee net investment income shown is based on a percentage of total net assets.
Alternative 1
Assumptions
• | Investment income (including interest, dividends, fees, etc.) = 1.25% |
• | Hurdle rate(1) = 1.75% |
• | Base management fee(2) = 0.50% |
• | Other expenses (legal, accounting, custodian, transfer agent, etc.)(3) = 0.20% |
• | Pre-incentive fee net investment income (investment income – (base management fee + other expenses)) = 0.55% |
Pre-incentive net investment income does not exceed hurdle rate, therefore there is no income incentive fee.
9
Alternative 2
Assumptions
• | Investment income (including interest, dividends, fees, etc.) = 2.70% |
• | Hurdle rate(1) = 1.75% |
• | Base management fee(2) = 0.50% |
• | Other expenses (legal, accounting, custodian, transfer agent, etc.)(3) = 0.20% |
• | Pre-incentive fee net investment income (investment income – (base management fee + other expenses)) = 2.00% |
Pre-incentive net investment income exceeds hurdle rate, therefore there is an income incentive fee payable by us to the Investment Adviser. The Income Incentive Fee would be calculated as follows:
= 100% × “Catch Up” + the greater of 0% AND (20% × (pre-incentive fee net investment income – 2.1875%)
= (100% × (2.00% - 1.75%)) + 0%
= 100% × 0.25% + 0%
= 0.25%
Alternative 3
Assumptions
• | Investment income (including interest, dividends, fees, etc.) = 3.00% |
• | Hurdle rate(1) = 1.75% |
• | Base management fee(2) = 0.50% |
• | Other expenses (legal, accounting, custodian, transfer agent, etc.)(3) = 0.20% |
• | Pre-incentive fee net investment income (investment income – (base management fee + other expenses)) = 2.30% |
Pre-incentive net investment income exceeds hurdle rate, therefore there is an income incentive fee payable by us to the Investment Adviser. The Income Incentive Fee would be calculated as follows:
= 100% × “Catch Up” + the greater of 0% AND (20% × (pre-incentive fee net investment income – 2.1875%)
= (100% × (2.1875% – 1.75%)) + the greater of 0% AND (20% × (2.30% – 2.1875%))
= (100% × 0.4375%) + (20% × 0.1125%)
= 0.4375% + 0.0225%
= 0.46%
(1) | Represents 7% annualized hurdle rate. |
(2) | Represents 2% annualized base management fee. |
(3) | Excludes organizational and offering expenses. |
10
Example 2: Capital Gains Incentive Fee
Alternative 1
Assumptions
• | Year 1: $20 million investment made |
• | Year 2: Fair market value (“FMV”) of investment determined to be $22 million |
• | Year 3: FMV of investment determined to be $17 million |
• | Year 4: Investment sold for $21 million |
The impact, if any, on the capital gains portion of the incentive fee would be:
• | Year 1: No impact |
• | Year 2: No impact |
• | Year 3: Decrease base amount on which the second part of the incentive fee is calculated by $3 million (unrealized capital depreciation) |
• | Year 4: Increase base amount on which the second part of the incentive fee is calculated by $4 million ($1 million of realized capital gain and $3 million reversal in unrealized capital depreciation) |
Alternative 2
Assumptions
• | Year 1: $20 million investment made |
• | Year 2: FMV of investment determined to be $17 million |
• | Year 3: FMV of investment determined to be $17 million |
• | Year 4: FMV of investment determined to be $21 million |
• | Year 5: FMV of investment determined to be $18 million |
• | Year 6: Investment sold for $15 million |
The impact, if any, on the capital gains portion of the incentive fee would be:
• | Year 1: No impact |
• | Year 2: Decrease base amount on which the second part of the incentive fee is calculated by $3 million (unrealized capital depreciation) |
• | Year 3: No impact |
• | Year 4: Increase base amount on which the second part of the incentive fee is calculated by $3 million (reversal in unrealized capital depreciation) |
• | Year 5: Decrease base amount on which the second part of the incentive fee is calculated by $2 million (unrealized capital depreciation) |
• | Year 6: Decrease base amount on which the second part of the incentive fee is calculated by $3 million ($5 million of realized capital loss offset by a $2 million reversal in unrealized capital depreciation) |
11
Alternative 3
Assumptions
• | Year 1: $20 million investment made in company A (“Investment A”) and $20 million investment made in company B (“Investment B”) |
• | Year 2: FMV of Investment A is determined to be $21 million and Investment B is sold for $18 million |
• | Year 3: Investment A is sold for $23 million |
The impact, if any, on the capital gains portion of the incentive fee would be:
• | Year 1: No impact |
• | Year 2: Decrease base amount on which the second part of the incentive fee is calculated by $2 million (realized capital loss on Investment B) |
• | Year 3: Increase base amount on which the second part of the incentive fee is calculated by $3 million (realized capital gain on Investment A) |
Alternative 4
Assumptions
• | Year 1: $20 million investment made in company A (“Investment A”) and $20 million investment made in company B (“Investment B”) |
• | Year 2: FMV of Investment A is determined to be $21 million and FMV of Investment B is determined to be $17 million |
• | Year 3: FMV of Investment A is determined to be $18 million and FMV of Investment B is determined to be $18 million |
• | Year 4: FMV of Investment A is determined to be $19 million and FMV of Investment B is determined to be $21 million |
• | Year 5: Investment A is sold for $17 million and Investment B is sold for $23 million |
The impact, if any, on the capital gains portion of the incentive fee would be:
• | Year 1: No impact |
• | Year 2: Decrease base amount on which the second part of the incentive fee is calculated by $3 million (unrealized capital depreciation on Investment B) |
• | Year 3: Decrease base amount on which the second part of the incentive fee is calculated by $1 million ($2 million in unrealized capital depreciation on Investment A and $1 million recovery in unrealized capital depreciation on Investment B) |
• | Year 4: Increase base amount on which the second part of the incentive fee is calculated by $3 million ($1 million recovery in unrealized capital depreciation on Investment A and $2 million recovery in unrealized capital depreciation on Investment B) |
• | Year 5: Increase base amount on which the second part of the incentive fee is calculated by $1 million ($3 million realized capital gain on Investment B offset by $3 million realized capital loss on Investment A plus a $1 million reversal in unrealized capital depreciation on Investment A from Year 4) |
12
Duration and Termination
The Investment Advisory Agreement was originally approved by our Board of Directors on June 23, 2004 and was recently re-approved by the Board of Directors on May 5, 2015 for an additional one-year term expiring June 22, 2016. Unless terminated earlier as described below, it will remain in effect from year to year thereafter if approved annually by our Board of Directors or by the affirmative vote of the holders of a majority of our outstanding voting securities, including, in either case, approval by a majority of our directors who are not interested persons. The Investment Advisory Agreement will automatically terminate in the event of its assignment. The Investment Advisory Agreement may be terminated by either party without penalty upon not more than 60 days’ written notice to the other. See “Risk Factors – Risks Relating to Our Business – We are dependent upon Prospect Capital Management’s key management personnel for our future success.”
Indemnification
The Investment Advisory Agreement provides that, absent willful misfeasance, bad faith or gross negligence in the performance of its duties or by reason of the reckless disregard of its duties and obligations, Prospect Capital Management and its officers, managers, agents, employees, controlling persons, members and any other person or entity affiliated with it are entitled to indemnification from us for any damages, liabilities, costs and expenses (including reasonable attorneys’ fees and amounts reasonably paid in settlement) arising from the rendering of Prospect Capital Management’s services under the Investment Advisory Agreement or otherwise as the Investment Adviser.
Administration Agreement
We have also entered into an administration agreement with Prospect Administration (the “Administration Agreement”) under which Prospect Administration, among other things, provides (or arranges for the provision of) administrative services and facilities for us. For providing these services, we reimburse Prospect Administration for our allocable portion of overhead incurred by Prospect Administration in performing its obligations under the Administration Agreement, including rent and our allocable portion of the costs of Brian H. Oswald, our Chief Financial Officer and Chief Compliance Officer, and his staff, including the internal legal staff. Under this agreement, Prospect Administration furnishes us with office facilities, equipment and clerical, bookkeeping and record keeping services at such facilities. Prospect Administration also performs, or oversees the performance of, our required administrative services, which include, among other things, being responsible for the financial records that we are required to maintain and preparing reports to our stockholders and reports filed with the SEC. In addition, Prospect Administration assists us in determining and publishing our net asset value, overseeing the preparation and filing of our tax returns and the printing and dissemination of reports to our stockholders, and generally oversees the payment of our expenses and the performance of administrative and professional services rendered to us by others. Under the Administration Agreement, Prospect Administration also provides on our behalf managerial assistance to those portfolio companies to which we are required to provide such assistance (see “Ongoing Relationships with Portfolio Companies – Managerial Assistance”). The Administration Agreement may be terminated by either party without penalty upon 60 days’ written notice to the other party. Prospect Administration is a subsidiary of the Investment Adviser.
The Administration Agreement provides that, absent willful misfeasance, bad faith or negligence in the performance of its duties or by reason of the reckless disregard of its duties and obligations, Prospect Administration and its officers, managers, partners, agents, employees, controlling persons, members and any other person or entity affiliated with it are entitled to indemnification from us for any damages, liabilities, costs and expenses (including reasonable attorneys’ fees and amounts reasonably paid in settlement) arising from the rendering of Prospect Administration’s services under the Administration Agreement or otherwise as administrator for us. Our payments to Prospect Administration are periodically reviewed by our Board of Directors.
Payment of Our Expenses
All investment professionals of the Investment Adviser and its respective staff, when and to the extent engaged in providing investment advisory and management services, and the compensation and routine overhead expenses of such personnel allocable to such services, will be provided and paid for by the Investment Adviser. We bear all other costs and expenses of our operations and transactions, including those relating to: organization and offering; calculation of our net asset value (including the cost and expenses of any independent valuation firm); expenses incurred by Prospect Capital Management payable to third parties, including agents, consultants or other advisers (such as independent valuation firms, accountants and legal counsel), in monitoring our financial and legal affairs and in monitoring our investments and performing due diligence on our prospective portfolio companies; interest payable on debt, if any, and dividends payable on preferred stock, if any, incurred to finance our investments; offerings of our debt, our preferred shares, our common stock and other securities; investment advisory fees; fees payable to third parties, including agents, consultants or other advisors, relating to, or associated with, evaluating and making investments; transfer agent and custodial fees; registration fees; listing fees; taxes; independent directors’ fees and expenses; costs of preparing and filing reports or other documents with the SEC; the costs of any reports, proxy statements or other notices to stockholders, including
13
printing costs; our allocable portion of the fidelity bond, directors and officers/errors and omissions liability insurance, and any other insurance premiums; direct costs and expenses of administration, including auditor and legal costs; and all other expenses incurred by us, by the Investment Adviser or by Prospect Administration in connection with administering our business, such as our allocable portion of overhead under the Administration Agreement, including rent and our allocable portion of the costs of our Chief Financial Officer and Chief Compliance Officer and the respective staffs.
License Agreement
We entered into a license agreement with Prospect Capital Management pursuant to which Prospect Capital Management agreed to grant us a non-exclusive, royalty free license to use the name “Prospect Capital.” Under this agreement, we have a right to use the Prospect Capital name, for so long as Prospect Capital Management or one of its affiliates remains the Investment Adviser. Other than with respect to this limited license, we have no legal right to the Prospect Capital name. This license agreement will remain in effect for so long as the Investment Advisory Agreement with the Investment Adviser is in effect.
Determination of Net Asset Value
The net asset value per share of our outstanding shares of common stock will be determined quarterly by dividing the value of total assets minus liabilities by the total number of shares outstanding.
In calculating the value of our total assets, we will value investments for which market quotations are readily available at such market quotations. Short-term investments which mature in 60 days or less, such as U.S. Treasury bills, are valued at amortized cost, which approximates market value. The amortized cost method involves recording a security at its cost (i.e., principal amount plus any premium and less any discount) on the date of purchase and thereafter amortizing/accreting that difference between the principal amount due at maturity and cost assuming a constant yield to maturity as determined at the time of purchase. Short-term securities which mature in more than 60 days are valued at current market quotations by an independent pricing service or at the mean between the bid and ask prices obtained from at least two brokers or dealers (if available, or otherwise by a principal market maker or a primary market dealer). Investments in money market mutual funds are valued at their net asset value as of the close of business on the day of valuation.
Most of the investments in our portfolio do not have market quotations which are readily available, meaning the investments do not have actively traded markets. Debt and equity securities for which market quotations are not readily available are valued with the assistance of an independent valuation service using a documented valuation policy and a valuation process that is consistently applied under the direction of our Board of Directors. For a discussion of the risks inherent in determining the value of securities for which readily available market values do not exist, see “Risk Factors – Risks Relating to Our Business – Most of our portfolio investments are recorded at fair value as determined in good faith under the direction of our Board of Directors and, as a result, there is uncertainty as to the value of our portfolio investments.”
The factors that may be taken into account in valuing such investments include, as relevant, the portfolio company’s ability to make payments, its estimated earnings and projected discounted cash flows, the nature and realizable value of any collateral, the financial environment in which the portfolio company operates, comparisons to securities of similar publicly traded companies, changes in interest rates for similar debt instruments and other relevant factors. Due to the inherent uncertainty of determining the fair value of investments that do not have readily available market quotations, the fair value of these investments may differ significantly from the values that would have been used had such market quotations existed for such investments, and any such differences could be material.
As part of the fair valuation process, the independent valuation firms engaged by the Board of Directors perform a review of each debt and equity investment requiring fair valuation and provide a range of values for each investment, which, along with management’s valuation recommendations, is reviewed by our Audit Committee. Management and the independent valuation firms may adjust their preliminary evaluations to reflect comments provided by our Audit Committee. The Audit Committee reviews the final valuation reports and management’s valuation recommendations and makes a recommendation to the Board of Directors based on its analysis of the methodologies employed and the various weights that should be accorded to each portion of the valuation as well as factors that the independent valuation firms and management may not have included in their evaluation processes. The Board of Directors then evaluates the Audit Committee recommendations and undertakes a similar analysis to determine the fair value of each investment in the portfolio in good faith.
Determination of fair values involves subjective judgments and estimates not susceptible to substantiation by auditing procedures. Accordingly, under current accounting standards, the notes to our financial statements will refer to the uncertainty with respect to the possible effect of such valuations, and any change in such valuations, on our financial statements.
14
Dividend Reinvestment Plan
We have adopted a dividend reinvestment plan that provides for reinvestment of our distributions on behalf of our stockholders, unless a stockholder elects to receive cash as provided below. As a result, when our Board of Directors authorizes, and we declare, a cash dividend, then our stockholders who have not “opted out” of our dividend reinvestment plan will have their cash dividends automatically reinvested in additional shares of our common stock, rather than receiving the cash dividends.
No action is required on the part of a registered stockholder to have their cash dividend reinvested in shares of our common stock. A registered stockholder may elect to receive an entire dividend in cash by notifying the plan administrator and our transfer agent and registrar, in writing so that such notice is received by the plan administrator no later than the record date for dividends to stockholders. The plan administrator sets up an account for shares acquired through the plan for each stockholder who has not elected to receive dividends in cash and hold such shares in non-certificated form. Upon request by a stockholder participating in the plan, the plan administrator will, instead of crediting shares to the participant’s account, issue a certificate registered in the participant’s name for the number of whole shares of our common stock and a check for any fractional share. Such request by a stockholder must be received three days prior to the dividend payable date in order for that dividend to be paid in cash. If such request is received less than three days prior to the dividend payable date, then the dividends are reinvested and shares are repurchased for the stockholder’s account; however, future dividends are paid out in cash on all balances. Those stockholders whose shares are held by a broker or other financial intermediary may receive dividends in cash by notifying their broker or other financial intermediary of their election.
We primarily use newly-issued shares to implement the plan, whether our shares are trading at a premium or at a discount to net asset value. However, we reserve the right to purchase shares in the open market in connection with the implementation of the plan. The number of shares to be issued to a stockholder is determined by dividing the total dollar amount of the dividend payable to such stockholder by the market price per share of our common stock at the close of regular trading on the NASDAQ Global Select Market on the last business day before the payment date for such dividend. Market price per share on that date will be the closing price for such shares on the NASDAQ Global Select Market or, if no sale is reported for such day, at the average of their reported bid and asked prices. The number of shares of our common stock to be outstanding after giving effect to payment of the dividend cannot be established until the value per share at which additional shares will be issued has been determined and elections of our stockholders have been tabulated. Stockholders who do not elect to receive dividends in shares of common stock may experience accretion to the net asset value of their shares if our shares are trading at a premium at the time we issue new shares under the plan and dilution if our shares are trading at a discount. The level of accretion or discount would depend on various factors, including the proportion of our stockholders who participate in the plan, the level of premium or discount at which our shares are trading and the amount of the dividend payable to a stockholder.
There are no brokerage charges or other charges to stockholders who participate in the plan. The plan administrator’s fees under the plan are paid by us. If a participant elects by written notice to the plan administrator to have the plan administrator sell part or all of the shares held by the plan administrator in the participant’s account and remit the proceeds to the participant, the plan administrator is authorized to deduct a $15 transaction fee plus a $0.10 per share brokerage commissions from the proceeds.
Stockholders who receive dividends in the form of stock are subject to the same U.S. federal, state and local tax consequences as are stockholders who elect to receive their dividends in cash. A stockholder’s basis for determining gain or loss upon the sale of stock received in a dividend from us will be equal to the total dollar amount of the dividend payable to the stockholder. Any stock received in a dividend will have a new holding period for tax purposes commencing on the day following the day on which the shares are credited to the U.S. Stockholder’s account (as defined below).
Participants may terminate their accounts under the plan by notifying the plan administrator via its website at www.amstock.com or by filling out the transaction request form located at the bottom of their statement and sending it to the plan administrator at American Stock Transfer & Trust Company, P.O. Box 922, Wall Street Station, New York, NY 10269-0560 or by calling the plan administrator’s Interactive Voice Response System at (888) 888-0313.
The plan may be terminated by us upon notice in writing mailed to each participant at least 30 days prior to any payable date for the payment of any dividend by us. All correspondence concerning the plan should be directed to the plan administrator by mail at American Stock Transfer & Trust Company, 59 Maiden Lane, New York, NY 10007 or by telephone at (718) 921-8200.
Stockholders who purchased their shares through or hold their shares in the name of a broker or financial institution should consult with a representative of their broker or financial institution with respect to their participation in our dividend reinvestment plan. Such holders of our stock may not be identified as our registered stockholders with the plan administrator and may not automatically have their cash dividend reinvested in shares of our common stock by the administrator.
15
Material U.S. Federal Income Tax Considerations
The following discussion is a general summary of the material U.S. federal income tax considerations applicable to us and to an investment in our shares. This summary does not purport to be a complete description of the income tax considerations applicable to us or our investors on such an investment. For example, we have not described tax consequences that we assume to be generally known by investors or certain considerations that may be relevant to certain types of holders subject to special treatment under U.S. federal income tax laws, including stockholders subject to the alternative minimum tax, tax-exempt organizations, insurance companies, dealers in securities, pension plans and trusts, financial institutions, U.S. Stockholders (as defined below) whose functional currency is not the U.S. dollar, persons who mark-to-market our shares and persons who hold our shares as part of a “straddle,” “hedge” or “conversion” transaction. This summary assumes that investors hold our common stock as capital assets (within the meaning of the Code). The discussion is based upon the Code, Treasury regulations, and administrative and judicial interpretations, each as of the date of this report and all of which are subject to change, possibly retroactively, which could affect the continuing validity of this discussion. This summary does not discuss any aspects of U.S. estate or gift tax or foreign, state or local tax. It does not discuss the special treatment under U.S. federal income tax laws that could result if we invested in tax-exempt securities or certain other investment assets.
A “U.S. Stockholder” is a beneficial owner of shares of our common stock that is for U.S. federal income tax purposes:
• | A citizen or individual resident of the United States; |
• | A corporation, or other entity treated as a corporation for U.S. federal income tax purposes, created or organized in or under the laws of the United States or any state thereof or the District of Columbia; |
• | An estate, the income of which is subject to U.S. federal income taxation regardless of its source; or |
• | A trust if (1) a U.S. court is able to exercise primary supervision over the administration of such trust and one or more U.S. persons have the authority to control all substantial decisions of the trust or (2) it has a valid election in place to be treated as a U.S. person. |
A “Non-U.S. Stockholder” is a beneficial owner of shares of our common stock that is not a partnership and is not a U.S. Stockholder.
If a partnership (including an entity treated as a partnership for U.S. federal income tax purposes) holds shares of our common stock, the tax treatment of a partner in the partnership will generally depend upon the status of the partner and the activities of the partnership. A prospective stockholder that is a partner of a partnership holding shares of our common stock should consult its tax advisor with respect to the purchase, ownership and disposition of shares of our common stock.
Tax matters are very complicated and the tax consequences to an investor of an investment in our shares will depend on the facts of his, her or its particular situation. We encourage investors to consult their own tax advisors regarding the specific consequences of such an investment, including tax reporting requirements, the applicability of U.S. federal, state, local and foreign tax laws, eligibility for the benefits of any applicable tax treaty and the effect of any possible changes in the tax laws.
Election to be Taxed as a RIC
As a business development company, we have elected and intend to continue to qualify to be treated as a RIC under Subchapter M of the Code. As a RIC, we generally are not subject to corporate-level U.S. federal income taxes on any ordinary income or capital gains that we distribute to our stockholders as dividends. To qualify as a RIC, we must, among other things, meet certain source-of-income and asset diversification requirements (as described below). In addition, to obtain RIC tax treatment, we must distribute to our stockholders, for each taxable year, at least 90% of our “investment company taxable income,” which is generally our ordinary income plus the excess of realized net short-term capital gains over realized net long-term capital losses (the “Annual Distribution Requirement”).
16
Taxation as a RIC
In order to qualify as a RIC for U.S. federal income tax purposes, we must, among other things:
• | Qualify to be treated as a business development company or be registered as a management investment company under the 1940 Act at all times during each taxable year; |
• | Derive in each taxable year at least 90% of our gross income from dividends, interest, payments with respect to certain securities loans, gains from the sale or other disposition of stock or other securities or currencies or other income derived with respect to our business of investing in such stock, securities or currencies and net income derived from an interest in a “qualified publicly traded partnership” (as defined in the Code) (the “90% Income Test”); and |
• | Diversify our holdings so that at the end of each quarter of the taxable year: |
◦ | At least 50% of the value of our assets consists of cash, cash equivalents, U.S. government securities, securities of other RICs, and other securities if such other securities of any one issuer do not represent more than 5% of the value of our assets and more than 10% of the outstanding voting securities of the issuer (which for these purposes includes the equity securities of a “qualified publicly traded partnership”); and |
◦ | No more than 25% of the value of our assets is invested in the securities, other than U.S. government securities or securities of other RICs, (i) of one issuer (ii) of two or more issuers that are controlled, as determined under applicable tax rules, by us and that are engaged in the same or similar or related trades or businesses or (iii) of one or more “qualified publicly traded partnerships,” (the “Diversification Tests”). |
To the extent that we invest in entities treated as partnerships for U.S. federal income tax purposes (other than a “qualified publicly traded partnership”), we generally must include the items of gross income derived by the partnerships for purposes of the 90% Income Test, and the income that is derived from a partnership (other than a “qualified publicly traded partnership”) will be treated as qualifying income for purposes of the 90% Income Test only to the extent that such income is attributable to items of income of the partnership which would be qualifying income if realized by us directly. In addition, we generally must take into account our proportionate share of the assets held by partnerships (other than a “qualified publicly traded partnership”) in which we are a partner for purposes of the Diversification Tests. If the partnership is a “qualified publicly traded partnership,” the net income derived from such partnership will be qualifying income for purposes of the 90% Income Test, and interests in the partnership will be “securities” for purposes of the Diversification Tests. We monitor our investments in equity securities of entities that are treated as partnerships for U.S. federal income tax purposes to prevent our disqualification as a RIC.
In order to meet the 90% Income Test, we may establish one or more special purpose corporations to hold assets from which we do not anticipate earning dividend, interest or other qualifying income under the 90% Income Test. Any such special purpose corporation would generally be subject to U.S. federal income tax, and could result in a reduced after-tax yield on the portion of our assets held by such corporation.
Provided that we qualify as a RIC and satisfy the Annual Distribution Requirement, we will not be subject to U.S. federal income tax on the portion of our investment company taxable income and net capital gain (which we define as net long-term capital gains in excess of net short-term capital losses) we timely distribute to stockholders. We will be subject to U.S. federal income tax at the regular corporate rates on any income or capital gain not distributed (or deemed distributed) to our stockholders. Any undistributed taxable income is subject to U.S. federal income tax.
We will be subject to a 4% non-deductible U.S. federal excise tax on certain undistributed income of RICs unless we distribute in a timely manner an amount at least equal to the sum of (i) 98% of our ordinary income recognized during the calendar year, (ii) 98.2% of our capital gain net income, as defined by the Code, recognized for the one year period ending October 31 in that calendar year and (iii) any income recognized, but not distributed, in preceding years.
We may be required to recognize taxable income in circumstances in which we do not receive cash. For example, if we hold debt obligations that are treated under applicable tax rules as having original issue discount, we must include in income each year a portion of the original issue discount that accrues over the life of the obligation, regardless of whether cash representing such income is received by us in the same taxable year. Because any original issue discount accrued will be included in our investment company taxable income for the year of accrual, we may be required to make a distribution to our stockholders in order to satisfy the Annual Distribution Requirement, even though we will not have received any corresponding cash amount.
17
Gain or loss realized by us from warrants acquired by us as well as any loss attributable to the lapse of such warrants generally will be treated as capital gain or loss. Such gain or loss generally will be long-term or short-term, depending on how long we held a particular warrant. As a RIC, we are not allowed to carry forward or carry back a net operating loss for purposes of computing our investment company taxable income in other taxable years.
Although we do not presently expect to do so, we are authorized to borrow funds and to sell assets in order to satisfy distribution requirements. However, under the 1940 Act, we are not permitted to make distributions to our stockholders while our debt obligations and other senior securities are outstanding unless certain “asset coverage” tests are met. See “Regulation as a Business Development Company – Senior Securities.” Moreover, our ability to dispose of assets to meet our distribution requirements may be limited by (1) the illiquid nature of our portfolio and/or (2) other requirements relating to our status as a RIC, including the Diversification Tests. If we dispose of assets in order to meet the Annual Distribution Requirement or to avoid the excise tax, we may make such dispositions at times that, from an investment standpoint, are not advantageous.
On June 26, 2014, we received a private letter ruling from the Internal Revenue Service (the “IRS”) permitting us to pay up to 80% of our required dividends in stock for the tax years ending August 31, 2014 and August 31, 2015. We have filed an application for a similar private letter ruling for our taxable years ending August 31, 2016 and August 31, 2017. Any dividends paid in stock will be taxable to the shareholder as if the dividend had been paid in cash and we will receive a dividend paid deduction for such distribution.
If we fail to satisfy the Annual Distribution Requirement or otherwise fail to qualify as a RIC in any taxable year, we would be subject to tax on all of our taxable income at regular corporate rates. We would not be able to deduct distributions to stockholders, nor would we be required to make distributions. Distributions would generally be taxable to our individual and other non-corporate taxable stockholders as ordinary dividend income eligible for the reduced maximum rate applicable to qualified dividend income to the extent of our current and accumulated earnings and profits, provided certain holding period and other requirements are met. Subject to certain limitations under the Code, corporate distributees would be eligible for the dividends-received deduction. To qualify again to be taxed as a RIC in a subsequent year, we would be required to distribute to our shareholders our accumulated earnings and profits attributable to non-RIC years reduced by an interest charge on 50% of such earnings and profits payable by us as an additional tax. In addition, if we failed to qualify as a RIC for a period greater than two taxable years, then, in order to qualify as a RIC in a subsequent year, we would be required to elect to recognize and pay tax on any net built-in gain (the excess of aggregate gain, including items of income, over aggregate loss that would have been realized if we had been liquidated) or, alternatively, be subject to taxation on such built-in gain recognized for a period of ten years.
Certain of our investment practices may be subject to special and complex U.S. federal income tax provisions that may, among other things, (i) disallow, suspend or otherwise limit the allowance of certain losses or deductions, (ii) convert lower taxed long-term capital gain and qualified dividend income into higher taxed short-term capital gain or ordinary income, (iii) convert an ordinary loss or a deduction into a capital loss (the deductibility of which is more limited), (iv) cause us to recognize income or gain without a corresponding receipt of cash, (v) adversely affect the time as to when a purchase or sale of stock or securities is deemed to occur, (vi) adversely alter the characterization of certain complex financial transactions, and (vii) produce income that will not be qualifying income for purposes of the 90% Income Test. We will monitor our transactions and may make certain tax elections in order to mitigate the effect of these provisions.
We may invest in preferred securities or other securities the U.S. federal income tax treatment of which may be unclear or may be subject to recharacterization by the IRS. To the extent the tax treatment of such securities or the income from such securities differs from the expected tax treatment, it could affect the timing or character of income recognized, requiring us to purchase or sell securities, or otherwise change our portfolio, in order to comply with the tax rules applicable to RICs under the Code.
Taxation of U.S. Stockholders
Distributions by us generally are taxable to U.S. Stockholders as ordinary income or capital gains. Distributions of our “investment company taxable income” (which is, generally, our ordinary income plus realized net short-term capital gains in excess of realized net long-term capital losses) will be taxable as ordinary income to U.S. Stockholders to the extent of our current or accumulated earnings and profits, whether paid in cash or reinvested in additional common stock. Provided that certain holding period and other requirements are met, such distributions (if designated by us) may qualify (i) for the dividends received deduction available to corporations, but only to the extent that our income consists of dividend income from U.S. corporations and (ii) in the case of individual shareholders, as qualified dividend income eligible to be taxed at long-term capital gain rates to the extent that we receive qualified dividend income (generally, dividend income from taxable domestic corporations and certain qualified foreign corporations). There can be no assurance as to what portion, if any, of our distributions will qualify for favorable treatment as qualified dividend income.
18
Distributions of our net capital gain (which is generally our realized net long-term capital gains in excess of realized net short-term capital losses) properly designated by us as “capital gain dividends” will be taxable to a U.S. Stockholder as long-term capital gains, regardless of the U.S. Stockholder’s holding period for its common stock and regardless of whether paid in cash or reinvested in additional common stock. Distributions in excess of our current and accumulated earnings and profits first will reduce a U.S. Stockholder’s adjusted tax basis in such stockholder’s common stock and, after the adjusted basis is reduced to zero, will constitute capital gains to such U.S. Stockholder.
Although we currently intend to distribute any long-term capital gains at least annually, we may in the future decide to retain some or all of our long-term capital gains, and designate the retained amount as a “deemed distribution.” In that case, among other consequences, we will pay tax on the retained amount, each U.S. Stockholder will be required to include his, her or its proportionate share of the deemed distribution in income as if it had been actually distributed to the U.S. Stockholder, and the U.S. Stockholder will be entitled to claim a credit equal to its allocable share of the tax paid thereon by us. The amount of the deemed distribution net of such tax will be added to the U.S. Stockholder’s tax basis for his, her or its common stock. Since we expect to pay tax on any retained capital gains at our regular corporate tax rate, and since that rate is in excess of the maximum rate currently payable by individuals on long-term capital gains, the amount of tax that individual stockholders will be treated as having paid and for which they will receive a credit will exceed the tax they owe on the retained net capital gain. Such excess generally may be claimed as a credit against the U.S. Stockholder’s other U.S. federal income tax obligations or may be refunded to the extent it exceeds a stockholder’s liability for U.S. federal income tax. A stockholder that is not subject to U.S. federal income tax or otherwise required to file a U.S. federal income tax return would be required to file a U.S. federal income tax return on the appropriate form in order to claim a refund for the taxes we paid. In order to utilize the deemed distribution approach, we must provide written notice to our stockholders prior to the expiration of 60 days after the close of the relevant taxable year. We cannot treat any of our investment company taxable income as a “deemed distribution.”
For purposes of determining (1) whether the Annual Distribution Requirement is satisfied for any year and (2) the amount of capital gain dividends paid for that year, we may, under certain circumstances, elect to treat a dividend that is paid during the following taxable year as if it had been paid during the taxable year in question. If we make such an election, the U.S. Stockholder will still be treated as receiving the dividend in the taxable year in which the distribution is made. However, any dividend declared by us in October, November or December of any calendar year, payable to stockholders of record on a specified date in any such month and actually paid during January of the following year, will be treated as if it had been received by our U.S. Stockholders on December 31 of the year in which the dividend was declared.
If a U.S. Stockholder purchases shares of our common stock shortly before the record date of a distribution, the price of the shares will include the value of the distribution and the investor will be subject to tax on the distribution even though it represents a return of its investment.
A U.S. Stockholder generally will recognize taxable gain or loss if such U.S. Stockholder sells or otherwise disposes of its shares of our common stock. Any gain or loss arising from such sale or taxable disposition generally will be treated as long-term capital gain or loss if the U.S. Stockholder has held his, her or its shares for more than one year. Otherwise, it would be classified as short-term capital gain or loss. However, any capital loss arising from the sale or taxable disposition of shares of our common stock held for six months or less will be treated as long-term capital loss to the extent of the amount of capital gain dividends received, or undistributed capital gain deemed received, with respect to such shares. In addition, all or a portion of any loss recognized upon a taxable disposition of shares of our common stock may be disallowed if other substantially identical shares are purchased (whether through reinvestment of distributions or otherwise) within 30 days before or after the disposition. Capital losses are deductible only to the extent of capital gains (subject to an exception for individuals under which a limited amount of capital losses may be offset against ordinary income).
In general, individual U.S. Stockholders currently are subject to a preferential rate on their net capital gain, or the excess of realized net long-term capital gain over realized net short-term capital loss for a taxable year, including long-term capital gain derived from an investment in our shares. Such rate is lower than the maximum rate on ordinary income currently payable by individuals. Corporate U.S. Stockholders currently are subject to U.S. federal income tax on net capital gain at ordinary income rates.
Certain U.S. Stockholders who are individuals, estates or trusts and whose income exceeds certain thresholds will be required to pay a 3.8% Medicare tax on all or a portion of their “net investment income,” which includes dividends received from us and capital gains from the sale or other disposition of our stock.
We will make available to each of our U.S. Stockholders, as promptly as possible after the end of each calendar year, a notice detailing, on a per share basis, the amounts includible in such U.S. Stockholder’s taxable income for such year as ordinary income and as long-term capital gain. In addition, the amount and the U.S. federal tax status of each year’s distributions generally will be reported to the IRS. Distributions may also be subject to additional state, local and foreign taxes depending on a U.S. Stockholder’s particular situation.
19
Payments of dividends, including deemed payments of constructive dividends, or the proceeds of the sale or other taxable disposition of our common stock generally are subject to information reporting unless the U.S. Stockholder is an exempt recipient. Such payments may also be subject to U.S. federal backup withholding at the applicable rate if the recipient of such payment fails to supply a taxpayer identification number and otherwise comply with the rules for establishing an exemption from backup withholding. Backup withholding is not an additional tax, and any amounts withheld under the backup withholding rules generally will be allowed as a refund or credit against the holder’s U.S. federal income tax liability, provided that certain information is provided timely to the IRS.
Taxation of Non-U.S. Stockholders
Whether an investment in our common stock is appropriate for a Non-U.S. Stockholder will depend upon that person’s particular circumstances. An investment in our common stock by a Non-U.S. Stockholder may have adverse tax consequences. Non-U.S. Stockholders should consult their tax advisers before investing in our common stock.
Distributions of our “investment company taxable income” to Non-U.S. Stockholders that are not “effectively connected” with a U.S. trade or business conducted by the Non-U.S. Stockholder, will generally be subject to withholding of U.S. federal income tax at a rate of 30% (or lower applicable treaty rate) to the extent of our current and accumulated earnings and profits.
For our taxable years beginning before January 1, 2014 (and, if extended as has happened in the past, for taxable years covered by such extension), properly reported distributions to Non-U.S. Stockholders are generally exempt from U.S. federal withholding tax where they (i) are paid in respect of our “qualified net interest income” (generally, our U.S.-source interest income, other than certain contingent interest and interest from obligations of a corporation or partnership in which we are at least a 10% shareholder, reduced by expenses that are allocable to such income) or (ii) are paid in respect of our “qualified short-term capital gains” (generally, the excess of our net short-term capital gain over our long-term capital loss for such taxable year). There can be no assurance as to whether this provision will be extended. In addition, depending on our circumstances, we may report all, some or none of our potentially eligible dividends as such qualified net interest income or as qualified short-term capital gains, and/or treat such dividends, in whole or in part, as ineligible for this exemption from withholding. In order to qualify for this exemption from withholding, a Non-U.S. Stockholder needs to comply with applicable certification requirements relating to its non-U.S. status (including, in general, furnishing an IRS Form W-8BEN or substitute form). In the case of shares held through an intermediary, the intermediary may withhold even if we report the payment as qualified net interest income or qualified short-term capital gain. Non-U.S. Stockholders should contact their intermediaries with respect to the application of these rules to their accounts. There can be no assurance as to what portion of our distributions will qualify for favorable treatment as qualified net interest income or qualified short-term capital gains.
Actual or deemed distributions of our net capital gain to a Non-U.S. Stockholder, and gains recognized by a Non-U.S. Stockholder upon the sale of our common stock, that are not effectively connected with a U.S. trade or business conducted by the Non-U.S. Stockholder, will generally not be subject to U.S. federal withholding tax and generally will not be subject to U.S. federal income tax unless the Non-U.S. Stockholder is a nonresident alien individual and is physically present in the United States for 183 or more days during the taxable year and meets certain other requirements.
Distributions of our “investment company taxable income” and net capital gain (including deemed distributions) to Non-U.S. Stockholders, and gains realized by Non-U.S. Stockholders upon the sale of our common stock that are effectively connected with a U.S. trade or business conducted by the Non-U.S. Stockholder, will be subject to U.S. federal income tax at the graduated rates applicable to U.S. citizens, residents and domestic corporations. In addition, if such Non-U.S. Stockholder is a foreign corporation, it may also be subject to a 30% (or lower applicable treaty rate) branch profits tax on its effectively connected earnings and profits for the taxable year, subject to adjustments, if its investment in our common stock is effectively connected with its conduct of a U.S. trade or business.
If we distribute our net capital gain in the form of deemed rather than actual distributions (which we may do in the future), a Non-U.S. Stockholder will be entitled to a U.S. federal income tax credit or tax refund equal to the stockholder’s allocable share of the tax we pay on the capital gains deemed to have been distributed. In order to obtain the refund, the Non-U.S. Stockholder must obtain a U.S. taxpayer identification number and file a U.S. federal income tax return even if the Non-U.S. Stockholder would not otherwise be required to obtain a U.S. taxpayer identification number or file a U.S. federal income tax return.
20
In addition, after June 30, 2014, withholding at a rate of 30% will be required on dividends in respect of, and after December 31, 2016, withholding at a rate of 30% will be required on gross proceeds from the sale of, shares of our stock held by or through certain foreign financial institutions (including investment funds), unless such institution enters into an agreement with the Secretary of the Treasury to report, on an annual basis, information with respect to interests in, and accounts maintained by, the institution to the extent such interests or accounts are held by certain U.S. persons or by certain non-U.S. entities that are wholly or partially owned by U.S. persons and to withhold on certain payments. Accordingly, the entity through which our shares are held will affect the determination of whether such withholding is required. An intergovernmental agreement between the United States and an applicable foreign country, or future Treasury regulations or other guidance, may modify these requirements. Similarly, dividends in respect of, and gross proceeds from the sale of, our shares held by an investor that is a non-financial non-U.S. entity that does not qualify under certain exemptions will be subject to withholding at a rate of 30%, unless such entity either (i) certifies to us that such entity does not have any “substantial United States owners” or (ii) provides certain information regarding the entity’s “substantial United States owners,” which we will in turn provide to the IRS. We will not pay any additional amounts to stockholders in respect of any amounts withheld. Non-U.S. Stockholders are encouraged to consult their tax advisors regarding the possible implications of the legislation on their investment in our shares.
A Non-U.S. Stockholder generally will be required to comply with certain certification procedures to establish that such holder is not a U.S. person in order to avoid backup withholding with respect to payments of dividends, including deemed payments of constructive dividends, or the proceeds of a disposition of our common stock. In addition, we are required to annually report to the IRS and each Non-U.S. Stockholder the amount of any dividends or constructive dividends treated as paid to such Non-U.S. Stockholder, regardless of whether any tax was actually withheld. Copies of the information returns reporting such dividend or constructive dividend payments and the amount withheld may also be made available to the tax authorities in the country in which a Non-U.S. Stockholder resides under the provisions of an applicable income tax treaty. Backup withholding is not an additional tax, and any amounts withheld under the backup withholding rules generally will be allowed as a refund or credit against a Non-U.S. Stockholder’s U.S. federal income tax liability, if any, provided that certain required information is provided timely to the IRS.
Non-U.S. persons should consult their tax advisors with respect to the U.S. federal income tax and withholding tax, and state, local and foreign tax consequences of an investment in our common stock.
Failure to Obtain RIC Tax Treatment
If we were unable to obtain tax treatment as a RIC, we would be subject to tax on all of our taxable income at regular corporate rates. We would not be able to deduct distributions to stockholders, nor would they be required to be made. Distributions would generally be taxable to our stockholders as ordinary dividend income eligible for the reduced maximum rate applicable for qualified dividend income to the extent of our current and accumulated earnings and profits. Subject to certain limitations under the Code, corporate distributees would be eligible for the dividends-received deduction.
Distributions in excess of our current and accumulated earnings and profits would be treated first as a return of capital to the extent of the stockholder’s tax basis, and any remaining distributions would be treated as a capital gain.
The discussion set forth herein does not constitute tax advice, and potential investors should consult their own tax advisors concerning the tax considerations relevant to their particular situation.
Regulation as a Business Development Company
General
We are a closed-end, non-diversified investment company that has filed an election to be treated as a BDC under the 1940 Act and has elected to be treated as a RIC under Subchapter M of the Code. The 1940 Act contains prohibitions and restrictions relating to transactions between business development companies and their affiliates (including any investment advisers or sub-advisers), principal underwriters and affiliates of those affiliates or underwriters and requires that a majority of the directors be persons other than “interested persons,” as that term is defined in the 1940 Act. In addition, the 1940 Act provides that we may not change the nature of our business so as to cease to be, or to withdraw our election as, a business development company unless approved by a majority of our outstanding voting securities.
21
We may invest up to 100% of our assets in securities acquired directly from issuers in privately negotiated transactions. With respect to such securities, we may, for the purpose of public resale, be deemed an “underwriter” as that term is defined in the Securities Act of 1933. Our intention is to not write (sell) or buy put or call options to manage risks associated with the publicly traded securities of our portfolio companies, except that we may enter into hedging transactions to manage the risks associated with interest rate and other market fluctuations. However, in connection with an investment or acquisition financing of a portfolio company, we may purchase or otherwise receive warrants to purchase the common stock of the portfolio company. Similarly, in connection with an acquisition, we may acquire rights to require the issuers of acquired securities or their affiliates to repurchase them under certain circumstances. We also do not intend to acquire securities issued by any investment company that exceed the limits imposed by the 1940 Act. Under these limits, except with respect to money market funds, we generally cannot acquire more than 3% of the voting stock of any regulated investment company, invest more than 5% of the value of our total assets in the securities of one investment company or invest more than 10% of the value of our total assets in the securities of more than one investment company. With regard to that portion of our portfolio invested in securities issued by investment companies, it should be noted that such investments subject our stockholders indirectly to additional expenses. None of these policies are fundamental and may be changed without stockholder approval.
Qualifying Assets
Under the 1940 Act, a business development company may not acquire any asset other than assets of the type listed in Section 55(a) of the 1940 Act, which are referred to as qualifying assets, unless, at the time the acquisition is made, qualifying assets represent at least 70% of the company’s total assets. The principal categories of qualifying assets relevant to our business are the following:
1. | Securities purchased in transactions not involving any public offering from the issuer of such securities, which issuer (subject to certain limited exceptions) is an eligible portfolio company, or from any person who is, or has been during the preceding 13 months, an affiliated person of an eligible portfolio company, or from any other person, subject to such rules as may be prescribed by the SEC. An “eligible portfolio company” is defined in the 1940 Act and rules adopted pursuant thereto as any issuer which: |
a. | is organized under the laws of, and has its principal place of business in, the United States; |
b. | is not an investment company (other than a small business investment company wholly owned by the business development company) or a company that would be an investment company but for certain exclusions under the 1940 Act for certain financial companies such as banks, brokers, commercial finance companies, mortgage companies and insurance companies; and |
c. | satisfies any of the following: |
i. | does not have any class of securities with respect to which a broker or dealer may extend margin credit; |
ii. | is controlled by a business development company or a group of companies including a business development company and the business development company has an affiliated person who is a director of the eligible portfolio company; |
iii. | is a small and solvent company having total assets of not more than $4 million and capital and surplus of not less than $2 million; |
iv. | does not have any class of securities listed on a national securities exchange; or |
v. | has a class of securities listed on a national securities exchange, but has an aggregate market value of outstanding voting and non-voting common equity of less than $250 million. |
2. | Securities in companies that were eligible portfolio companies when we made our initial investment if certain other requirements are satisfied. |
3. | Securities of any eligible portfolio company which we control. |
4. | Securities purchased in a private transaction from a U.S. issuer that is not an investment company or from an affiliated person of the issuer, or in transactions incident thereto, if the issuer is in bankruptcy and subject to reorganization or if the issuer, immediately prior to the purchase of its securities was unable to meet its obligations as they came due without material assistance other than conventional lending or financing agreements. |
22
5. | Securities of an eligible portfolio company purchased from any person in a private transaction if there is no ready market for such securities and we already own 60% of the outstanding equity of the eligible portfolio company. |
6. | Securities received in exchange for or distributed on or with respect to securities described in (1) through (4) above, or pursuant to the exercise of warrants or rights relating to such securities. |
7. | Cash, cash equivalents, U.S. government securities or high-quality debt securities maturing in one year or less from the time of investment. |
In addition, a business development company must have been organized and have its principal place of business in the United States and must be operated for the purpose of making investments in the types of securities described in (1), (2), (3) or (4) above.
Managerial Assistance to Portfolio Companies
In order to count portfolio securities as qualifying assets for the purpose of the 70% test, a business development company must either control the issuer of the securities or must offer to make available to the issuer of the securities (other than small and solvent companies described above) significant managerial assistance; except that, where the business development company purchases such securities in conjunction with one or more other persons acting together, one of the other persons in the group may make available such managerial assistance. “Making available significant managerial assistance” refers to any arrangement whereby we provide significant guidance and counsel concerning the management, operations, or business objectives and policies of a portfolio company. We are also deemed to be providing managerial assistance to all portfolio companies that we control, either by ourselves or in conjunction with others. The nature and extent of significant managerial assistance provided by us will vary according to the particular needs of each portfolio company. Examples of such activities include advice on marketing, operations, fulfillment and overall strategy, capital budgeting, managing relationships with financing sources, recruiting management personnel, evaluating acquisition and divestiture opportunities, participating in board and management meetings, consulting with and advising officers of portfolio companies, and providing other organizational and financial guidance. We provide significant managerial assistance to all portfolio companies that we control, either by ourselves or in conjunction with others. Prospect Administration provides such managerial assistance on our behalf to portfolio companies, including controlled companies, when we are required to provide this assistance, utilizing personnel from Prospect Capital Management.
Temporary Investments
Pending investment in other types of “qualifying assets,” as described above, our investments may consist of cash, cash equivalents, including money market funds, U.S. government securities or high quality debt securities maturing in one year or less from the time of investment, which we refer to, collectively, as temporary investments, so that 70% of our assets are qualifying assets. Typically, we will invest in money market funds, U.S. Treasury bills or in repurchase agreements that are fully collateralized by cash or securities issued by the U.S. government or its agencies. A repurchase agreement involves the purchase by an investor, such as us, of a specified security and the simultaneous agreement by the seller to repurchase it at an agreed upon future date and at a price which is greater than the purchase price by an amount that reflects an agreed-upon interest rate. There is no percentage restriction on the proportion of our assets that may be invested in such repurchase agreements. However, if more than 25% of our total assets constitute repurchase agreements from a single counterparty, we would not meet the Diversification Tests in order to qualify as a RIC for U.S. federal income tax purposes. Thus, we do not intend to enter into repurchase agreements with a single counterparty in excess of this limit. The Investment Adviser will monitor the creditworthiness of the counterparties with which we enter into repurchase agreement transactions.
Senior Securities
We are permitted, under specified conditions, to issue multiple classes of indebtedness and one class of stock senior to our common stock if our asset coverage, as defined in the 1940 Act, is at least equal to 200% immediately after each such issuance. In addition, while any preferred stock or public debt securities remain outstanding, we must make provisions to prohibit any distribution to our stockholders or the repurchase of such securities or shares unless we meet the applicable asset coverage ratios after giving effect to such distribution or repurchase. We may also borrow amounts up to 5% of the value of our total assets for temporary or emergency purposes without regard to asset coverage. For a discussion of the risks associated with leverage, see “Risk Factors – Risks Relating to Our Securities.”
23
Code of Ethics
We, Prospect Capital Management and Prospect Administration have each adopted a code of ethics pursuant to Rule 17j-1 under the 1940 Act that establishes procedures for personal investments and restricts certain personal securities transactions. Personnel subject to each code may invest in securities for their personal investment accounts, including securities that may be purchased or held by us, so long as such investments are made in accordance with the code’s requirements. For information on how to obtain a copy of each code of ethics, see “Available Information.”
Compliance Policies and Procedures
We and the Investment Adviser have adopted and implemented written policies and procedures reasonably designed to prevent violation of the U.S. federal securities laws and are required to review these compliance policies and procedures annually for their adequacy and the effectiveness of their implementation and to designate a Chief Compliance Officer to be responsible for administering the policies and procedures. Brian H. Oswald serves as our Chief Compliance Officer.
Proxy Voting Policies and Procedures
We have delegated our proxy voting responsibility to Prospect Capital Management. The Proxy Voting Policies and Procedures of Prospect Capital Management are set forth below. The guidelines are reviewed periodically by Prospect Capital Management and our independent directors, and, accordingly, are subject to change.
Introduction. As an investment adviser registered under the Advisers Act, Prospect Capital Management has a fiduciary duty to act solely in the best interests of its clients. As part of this duty, Prospect Capital Management recognizes that it must vote client securities in a timely manner free of conflicts of interest and in the best interests of its clients.
These policies and procedures for voting proxies for Prospect Capital Management’s Investment Advisory clients are intended to comply with Section 206 of, and Rule 206(4)-6 under, the Advisers Act.
Proxy policies. These policies are designed to be responsive to the wide range of subjects that may be the subject of a proxy vote. These policies are not exhaustive due to the variety of proxy voting issues that Prospect Capital Management may be required to consider. In general, Prospect Capital Management will vote proxies in accordance with these guidelines unless: (1) Prospect Capital Management has determined to consider the matter on a case-by-case basis (as is stated in these guidelines), (2) the subject matter of the vote is not covered by these guidelines, (3) a material conflict of interest is present, or (4) Prospect Capital Management might find it necessary to vote contrary to its general guidelines to maximize stockholder value and vote in its clients’ best interests. In such cases, a decision on how to vote will be made by the Proxy Voting Committee (as described below). In reviewing proxy issues, Prospect Capital Management will apply the following general policies:
Elections of directors. In general, Prospect Capital Management will vote in favor of the management-proposed slate of directors. If there is a proxy fight for seats on the Board of Directors or Prospect Capital Management determines that there are other compelling reasons for withholding votes for directors, the Proxy Voting Committee will determine the appropriate vote on the matter. Prospect Capital Management believes that directors have a duty to respond to stockholder actions that have received significant stockholder support. Prospect Capital Management may withhold votes for directors that fail to act on key issues such as failure to implement proposals to declassify boards, failure to implement a majority vote requirement, failure to submit a rights plan to a stockholder vote and failure to act on tender offers where a majority of stockholders have tendered their shares. Finally, Prospect Capital Management may withhold votes for directors of non-U.S. issuers where there is insufficient information about the nominees disclosed in the proxy statement.
Appointment of auditors. Prospect Capital Management believes that the company remains in the best position to choose the auditors and will generally support management’s recommendation.
Changes in capital structure. Changes in a company’s charter, articles of incorporation or by-laws may be required by state or U.S. federal regulation. In general, Prospect Capital Management will cast its votes in accordance with the company’s management on such proposal. However, the Proxy Voting Committee will review and analyze on a case-by-case basis any proposals regarding changes in corporate structure that are not required by state or U.S. federal regulation.
Corporate restructurings, mergers and acquisitions. Prospect Capital Management believes proxy votes dealing with corporate reorganizations are an extension of the investment decision. Accordingly, the Proxy Voting Committee will analyze such proposals on a case-by-case basis.
24
Proposals affecting the rights of stockholders. Prospect Capital Management will generally vote in favor of proposals that give stockholders a greater voice in the affairs of the company and oppose any measure that seeks to limit those rights. However, when analyzing such proposals, Prospect Capital Management will weigh the financial impact of the proposal against the impairment of the rights of stockholders.
Corporate governance. Prospect Capital Management recognizes the importance of good corporate governance in ensuring that management and the Board of Directors fulfill their obligations to the stockholders. Prospect Capital Management favors proposals promoting transparency and accountability within a company.
Anti-takeover measures. The Proxy Voting Committee will evaluate, on a case-by-case basis, proposals regarding anti-takeover measures to determine the measure’s likely effect on stockholder value dilution.
Stock splits. Prospect Capital Management will generally vote with the management of the company on stock split matters.
Limited liability of directors. Prospect Capital Management will generally vote with management on matters that would affect the limited liability of directors.
Social and corporate responsibility. The Proxy Voting Committee may review and analyze on a case-by-case basis proposals relating to social, political and environmental issues to determine whether they will have a financial impact on stockholder value. Prospect Capital Management may abstain from voting on social proposals that do not have a readily determinable financial impact on stockholder value.
Proxy voting procedures. Prospect Capital Management will generally vote proxies in accordance with these guidelines. In circumstances in which (1) Prospect Capital Management has determined to consider the matter on a case-by-case basis (as is stated in these guidelines), (2) the subject matter of the vote is not covered by these guidelines, (3) a material conflict of interest is present, or (4) Prospect Capital Management might find it necessary to vote contrary to its general guidelines to maximize stockholder value and vote in its clients’ best interests, the Proxy Voting Committee will vote the proxy.
Proxy voting committee. Prospect Capital Management has formed a proxy voting committee to establish general proxy policies and consider specific proxy voting matters as necessary. In addition, members of the committee may contact the management of the company and interested stockholder groups as necessary to discuss proxy issues. Members of the committee will include relevant senior personnel. The committee may also evaluate proxies where we face a potential conflict of interest (as discussed below). Finally, the committee monitors adherence to guidelines, and reviews the policies contained in this statement from time to time.
Conflicts of interest. Prospect Capital Management recognizes that there may be a potential conflict of interest when it votes a proxy solicited by an issuer that is its advisory client or a client or customer of one of our affiliates or with whom it has another business or personal relationship that may affect how it votes on the issuer’s proxy. Prospect Capital Management believes that adherence to these policies and procedures ensures that proxies are voted with only its clients’ best interests in mind. To ensure that its votes are not the product of a conflict of interests, Prospect Capital Management requires that: (i) anyone involved in the decision making process (including members of the Proxy Voting Committee) disclose to the chairman of the Proxy Voting Committee any potential conflict that he or she is aware of and any contact that he or she has had with any interested party regarding a proxy vote; and (ii) employees involved in the decision making process or vote administration are prohibited from revealing how Prospect Capital Management intends to vote on a proposal in order to reduce any attempted influence from interested parties.
Proxy voting. Each account’s custodian will forward all relevant proxy materials to Prospect Capital Management, either electronically or in physical form to the address of record that Prospect Capital Management has provided to the custodian.
Proxy recordkeeping. Prospect Capital Management must retain the following documents pertaining to proxy voting:
• | copies of its proxy voting policies and procedures; |
• | copies of all proxy statements; |
• | records of all votes cast by Prospect Capital Management; |
• | copies of all documents created by Prospect Capital Management that were material to making a decision how to vote proxies or that memorializes the basis for that decision; and |
• | copies of all written client requests for information with regard to how Prospect Capital Management voted proxies on behalf of the client as well as any written responses provided. |
25
All of the above-referenced records will be maintained and preserved for a period of not less than five years from the end of the fiscal year during which the last entry was made. The first two years of records must be maintained at our office.
Proxy voting records. Clients may obtain information about how Prospect Capital Management voted proxies on their behalf by making a written request for proxy voting information to: Compliance Officer, Prospect Capital Management LLC, 10 East 40th Street, 42nd Floor, New York, NY 10016.
Sarbanes-Oxley Act of 2002
The Sarbanes-Oxley Act of 2002 imposes a variety of regulatory requirements on publicly-held companies. In addition to our Chief Executive and Chief Financial Officers’ required certifications as to the accuracy of our financial reporting, we are also required to disclose the effectiveness of our disclosure controls and procedures as well as report on our assessment of our internal controls over financial reporting, the latter of which must be audited by our independent registered public accounting firm.
The Sarbanes-Oxley Act of 2002 also requires us to continually review our policies and procedures to ensure that we remain in compliance with all rules promulgated thereunder.
Available Information
We file with or submit to the SEC annual, quarterly and current periodic reports, proxy statements and other information meeting the informational requirements of the Securities Exchange Act of 1934, as amended (the “Exchange Act”). This information is available free of charge by contacting us at (212) 448-0702 or on our website at www.prospectstreet.com. Information contained on our website is not incorporated into this Annual Report and you should not consider such information to be part of this Annual Report. You also may inspect and copy these reports, proxy statements and other information, as well as the Annual Report and related exhibits and schedules, at the Public Reference Room of the SEC at 100 F Street NE, Washington, D.C. 20549. Such information is also available from the EDGAR database on the SEC’s website at http://www.sec.gov. You also can obtain copies of such information, after paying a duplicating fee, by sending a request by e-mail to publicinfo@sec.gov or by writing the SEC’s Public Reference Branch, Office of Consumer Affairs and Information Services, Securities and Exchange Commission, Washington, D.C. 20549. You may obtain information on the operation of the SEC’s Public Reference Room by calling the SEC at (202) 551-8090 or (800) SEC-0330.
Item 1A. Risk Factors
You should carefully consider the risks described below, together with all of the other information included in this Annual Report, before you decide whether to make an investment in our securities. The risks set forth below are not the only risks we face. If any of the adverse events or conditions described below occurs, our business, financial condition and results of operations could be materially adversely affected. In such case, our NAV, and the trading price of our common stock could decline, or the value of our preferred stock, debt securities, and warrants, if any are outstanding, may decline, and you may lose all or part of your investment.
Our $150.0 million of 6.25% convertible notes due 2015 are referred to as the 2015 Notes. Our $167.5 million of 5.50% convertible notes due 2016 are referred to as the 2016 Notes. Our $130.0 million of 5.375% convertible notes due 2017 are referred to as the 2017 Notes. Our $200.0 million of 5.75% convertible notes due 2018 are referred to as the 2018 Notes. Our $200.0 million of 5.875% convertible notes due 2019 are referred to as the 2019 Notes. Our $392.0 million of 4.75% convertible notes due 2020 are referred to as the 2020 Notes, and collectively with the 2015 Notes, the 2016 Notes, the 2017 Notes, the 2018 Notes and the 2019 Notes, the Convertible Notes. Our recently called $100.0 million of 6.95% unsecured notes due 2022 are referred to as the 2022 Notes. Our $250.0 million of 5.875% unsecured notes due 2023 are referred to as the 2023 Notes. Our $300.0 million of 5.00% unsecured notes due 2019 are referred to as the 5.00% 2019 Notes, and collectively with the 2022 Notes and the 2023 Notes, the Public Notes. Any corporate notes issued pursuant to our medium term notes program with Incapital LLC are referred to as Prospect Capital InterNotes®, and together with the Convertible Notes and the Public Notes, the Unsecured Notes.
26
Risks Relating to Our Business
Capital markets may experience periods of disruption and instability. Such market conditions may materially and adversely affect debt and equity capital markets in the United States and abroad, which may have a negative impact on our business and operations.
From time to time, capital markets may experience periods of disruption and instability. For example, between 2007 and 2009, the global capital markets experienced an extended period of disruption as evidenced by a lack of liquidity in the debt capital markets, write-offs in the financial services sector, the re-pricing of credit risk and the failure of certain major financial institutions. Despite actions of the United States federal government and foreign governments, these events contributed to worsening general economic conditions that materially and adversely impacted the broader financial and credit markets and reduced the availability of debt and equity capital for the market as a whole and financial services firms in particular. While the adverse effects of these conditions have abated to a degree, global financial markets experienced significant volatility following the downgrade by Standard & Poor’s on August 5, 2011 of the long-term credit rating of U.S. Treasury debt from AAA to AA+. These market conditions have historically and could again have a material adverse effect on debt and equity capital markets in the United States and Europe, which could have a materially negative impact on our business, financial condition and results of operations. We and other companies in the financial services sector may have to access, if available, alternative markets for debt and equity capital. In such circumstances, equity capital may be difficult to raise because subject to some limited exceptions, as a BDC, we are generally not able to issue additional shares of our common stock at a price less than net asset value without general approval by our stockholders, which we currently have, and approval of the specific issuance by our Board of Directors. In addition, our ability to incur indebtedness or issue preferred stock is limited by applicable regulations such that our asset coverage, as defined in the 1940 Act, must equal at least 200% immediately after each time we incur indebtedness or issue preferred stock. The debt capital that may be available, if at all, may be at a higher cost and on less favorable terms and conditions in the future. Any inability to raise capital could have a negative effect on our business, financial condition and results of operations.
Market conditions may in the future make it difficult to extend the maturity of or refinance our existing indebtedness, including the final maturity of our credit facility in March 2019, and any failure to do so could have a material adverse effect on our business. The illiquidity of our investments may make it difficult for us to sell such investments if required. As a result, we may realize significantly less than the value at which we have recorded our investments.
Given the extreme volatility and dislocation that the capital markets have historically experienced, many BDCs have faced, and may in the future face, a challenging environment in which to raise capital. We may in the future have difficulty accessing debt and equity capital, and a severe disruption in the global financial markets or deterioration in credit and financing conditions could have a material adverse effect on our business, financial condition and results of operations. In addition, significant changes in the capital markets, including the extreme volatility and disruption, have had, and may in the future have, a negative effect on the valuations of our investments and on the potential for liquidity events involving our investments. An inability to raise capital, and any required sale of our investments for liquidity purposes, could have a material adverse impact on our business, financial condition or results of operations.
The Investment Adviser does not know how long the financial markets will continue to be affected by these events and cannot predict the effects of these or similar events in the future on the United States economy and securities markets or on our investments. The Investment Adviser monitors developments and seeks to manage our investments in a manner consistent with achieving our investment objective, but there can be no assurance that it will be successful in doing so; and the Investment Adviser may not timely anticipate or manage existing, new or additional risks, contingencies or developments, including regulatory developments in the current or future market environment.
We are required to record certain of our assets at fair value, as determined in good faith by our Board of Directors in accordance with our valuation policy. As a result, volatility in the capital markets may have a material adverse effect on our investment valuations and our net asset value, even if we plan to hold investments to maturity.
27
The downgrade of the U.S. credit rating and economic crisis in Europe could negatively impact our business, financial condition and earnings.
Although U.S. lawmakers passed legislation to raise the federal debt ceiling and Standard & Poor’s Ratings Services affirmed its AA+ long-term sovereign credit rating on the United States and revised the outlook on the long-term rating from negative to stable in June of 2013, U.S. debt ceiling and budget deficit concerns together with signs of deteriorating sovereign debt conditions in Europe continue to present the possibility of a credit-rating downgrade, economic slowdowns, or a recession for the United States. The impact of any further downgrades to the U.S. government’s sovereign credit rating or downgraded sovereign credit ratings of European countries or the Russian Federation, or their perceived creditworthiness could adversely affect the U.S. and global financial markets and economic conditions. These developments, along with any further European sovereign debt issues, could cause interest rates and borrowing costs to rise, which may negatively impact our ability to access the debt markets on favorable terms. Continued adverse economic conditions could have a material adverse effect on our business, financial condition and results of operations.
In October 2014, the Federal Reserve announced that it was concluding its bond-buying program. It is unknown what effect, if any, the conclusion of this program will have on credit markets and the value of our investments. These and any future developments and reactions of the credit markets toward these developments could cause interest rates and borrowing costs to rise, which may negatively impact our ability to obtain debt financing on favorable terms. Additionally, in January 2015, the Federal Reserve reaffirmed its view that the current target range for the federal funds rate was appropriate based on current economic conditions. However, if key economic indicators, such as the unemployment rate or inflation, do not progress at a rate consistent with the Federal Reserve’s objectives, the target range for the federal funds rate may increase and cause interest rates and borrowing costs to rise, which may negatively impact our ability to access the debt markets on favorable terms.
Rising interest rates may adversely affect the value of our portfolio investments which could have an adverse effect on our business, financial condition and results of operations.
Our debt investments may be based on floating rates, such as London Interbank Offer Rate (“LIBOR”), EURIBOR, the Federal Funds Rate or the Prime Rate. General interest rate fluctuations may have a substantial negative impact on our investments, the value of our common stock and our rate of return on invested capital. A reduction in the interest rates on new investments relative to interest rates on current investments could also have an adverse impact on our net interest income. An increase in interest rates could decrease the value of any investments we hold which earn fixed interest rates, including subordinated loans, senior and junior secured and unsecured debt securities and loans and high yield bonds, and also could increase our interest expense, thereby decreasing our net income. Also, an increase in interest rates available to investors could make investment in our common stock less attractive if we are not able to increase our dividend rate, which could reduce the value of our common stock.
Because we have borrowed money, and may issue preferred stock to finance investments, our net investment income depends, in part, upon the difference between the rate at which we borrow funds or pay distributions on preferred stock and the rate that our investments yield. As a result, we can offer no assurance that a significant change in market interest rates will not have a material adverse effect on our net investment income. In periods of rising interest rates, our cost of funds would increase except to the extent we have issued fixed rate debt or preferred stock, which could reduce our net investment income.
You should also be aware that a change in the general level of interest rates can be expected to lead to a change in the interest rate we receive on many of our debt investments. Accordingly, a change in the interest rate could make it easier for us to meet or exceed the performance threshold and may result in a substantial increase in the amount of incentive fees payable to our Investment Adviser with respect to the portion of the Incentive Fee based on income.
Changes relating to the LIBOR calculation process may adversely affect the value of our portfolio of LIBOR-indexed, floating-rate debt securities.
In the recent past, concerns have been publicized that some of the member banks surveyed by the British Bankers’ Association (“BBA”) in connection with the calculation of LIBOR across a range of maturities and currencies may have been under-reporting or otherwise manipulating the inter-bank lending rate applicable to them in order to profit on their derivatives positions or to avoid an appearance of capital insufficiency or adverse reputational or other consequences that may have resulted from reporting inter-bank lending rates higher than those they actually submitted. A number of BBA member banks entered into settlements with their regulators and law enforcement agencies with respect to alleged manipulation of LIBOR, and investigations by regulators and governmental authorities in various jurisdictions are ongoing.
28
Actions by the BBA, regulators or law enforcement agencies as a result of these or future events, may result in changes to the manner in which LIBOR is determined. Potential changes, or uncertainty related to such potential changes may adversely affect the market for LIBOR-based securities, including our portfolio of LIBOR-indexed, floating-rate debt securities. In addition, any further changes or reforms to the determination or supervision of LIBOR may result in a sudden or prolonged increase or decrease in reported LIBOR, which could have an adverse impact on the market for LIBOR-based securities or the value of our portfolio of LIBOR-indexed, floating-rate debt securities.
Volatility in the global financial markets resulting from relapse of the Eurozone crisis, geopolitical developments in Eastern Europe, turbulence in the Chinese stock markets and global commodity markets or otherwise could have a material adverse effect on our business, financial condition and results of operations.
Volatility in the global financial markets could have an adverse effect on the economic recovery in the United States and could result from a number of causes, including a relapse in the Eurozone crisis, geopolitical developments in Eastern Europe, turbulence in the Chinese stock markets and global commodity markets or otherwise. The effects of the Eurozone crisis, which began in late 2009 as part of the global economic and financial crisis, continued to impact the global financial markets through 2015. Numerous factors continued to fuel the Eurozone crisis, including continued high levels of government debt, the undercapitalization and liquidity problems of many banks in the Eurozone and relatively low levels of economic growth. These factors made it difficult or impossible for some countries in the Eurozone, including Greece, Ireland and Portugal, to repay or refinance their debt without the assistance of third parties. As a combination of austerity programs, debt write-downs and the European Central Bank’s commitment to restore financial stability to the Eurozone and the finalization of the primary European Stability Mechanism bailout fund, in 2013 and into 2014 interest rates began to fall and stock prices began to increase. Although these trends helped to stabilize the effects of the Eurozone crisis in the first half of 2014, the underlying causes of the crisis were not completely eliminated. As a result, the financial markets relapsed toward the end of 2014. In particular, Greece’s newly elected government, which campaigned against austerity measures, has been unable to reach an acceptable solution to the country’s debt crisis with the European Union, and in June 2015, Greece failed to make a scheduled debt repayment to the International Monetary Fund, falling into arrears. Following further unsuccessful negotiations between the government of Greece and the European Union to solve the Greek debt crisis, on July 5, 2015, Greek voters rejected a bailout package submitted by the European Commission, the European Central Bank and the International Monetary Fund, and while the European Central Bank continues to extend credit to Greece, it is uncertain how long such support will last, whether Greece will receive and accept any future bailout packages and whether Greece will default on future payments. The result of continued defaults and the removal of credit support for Greek banks may cause Greece to exit the European Union, which could lead to significant economic uncertainty and abandonment of the Euro common currency, resulting in destabilization in the financial markets. Continued financial instability in Greece and in other similarly situated Eurozone countries could have a continued contagion effect on the financial markets. Stock prices in China have experienced a significant drop in the second quarter of 2015, resulting primarily from continued sell-off of shares trading in Chinese markets. The volatility has been followed by volatility in stock markets around the world, including in the United States, as well as increased turbulence in commodity markets, such as reductions in prices of crude oil. Although the Chinese government has already taken steps to halt the collapse, it is uncertain what effect such measures will have, if any. Continued sell-off and price drops in the Chinese stock markets may have a contagion effect across the financial markets. In addition, Russian intervention in Ukraine during 2014 significantly increased regional geopolitical tensions. In response to Russian actions, U.S. and European governments have imposed sanctions on a limited number of Russian individuals and business entities. The situation remains fluid with potential for further escalation of geopolitical tensions, increased severity of sanctions against Russian interests, and possible Russian counter-measures. Further economic sanctions could destabilize the economic environment and result in increased volatility. Should the economic recovery in the United States be adversely impacted by increased volatility in the global financial markets caused by continued contagion from the Eurozone crisis, developments in respect of the Russian sanctions, further turbulence in Chinese stock markets and global commodity markets or for any other reason, loan and asset growth and liquidity conditions at U.S. financial institutions, including us, may deteriorate.
We may suffer credit losses.
Investment in small and middle-market companies is highly speculative and involves a high degree of risk of credit loss. These risks are likely to increase during volatile economic periods. See “Risks Related to Our Investments.”
29
Our financial condition and results of operations will depend on our ability to manage our future growth effectively.
Prospect Capital Management has been registered as an investment adviser since March 31, 2004, and we have been organized as a closed-end investment company since April 13, 2004. Our ability to achieve our investment objective depends on our ability to grow, which depends, in turn, on the Investment Adviser’s ability to continue to identify, analyze, invest in and monitor companies that meet our investment criteria. Accomplishing this result on a cost-effective basis is largely a function of the Investment Adviser’s structuring of investments, its ability to provide competent, attentive and efficient services to us and our access to financing on acceptable terms. As we continue to grow, Prospect Capital Management will need to continue to hire, train, supervise and manage new employees. Failure to manage our future growth effectively could have a materially adverse effect on our business, financial condition and results of operations.
We are dependent upon Prospect Capital Management’s key management personnel for our future success.
We depend on the diligence, skill and network of business contacts of the senior management of the Investment Adviser. We also depend, to a significant extent, on the Investment Adviser’s access to the investment professionals and the information and deal flow generated by these investment professionals in the course of their investment and portfolio management activities. The senior management team of the Investment Adviser evaluates, negotiates, structures, closes, monitors and services our investments. Our success depends to a significant extent on the continued service of the senior management team, particularly John F. Barry III and M. Grier Eliasek. The departure of any of the senior management team could have a materially adverse effect on our ability to achieve our investment objective. In addition, we can offer no assurance that Prospect Capital Management will remain the Investment Adviser or that we will continue to have access to its investment professionals or its information and deal flow.
We operate in a highly competitive market for investment opportunities.
A number of entities compete with us to make the types of investments that we make in middle-market companies. We compete with other BDCs, public and private funds, commercial and investment banks, commercial financing companies, insurance companies, hedge funds, and, to the extent they provide an alternative form of financing, private equity funds. Many of our competitors are substantially larger and have considerably greater financial, technical and marketing resources than we do. Some competitors may have a lower cost of funds and access to funding sources that are not available to us. In addition, some of our competitors may have higher risk tolerances or different risk assessments, which could allow them to consider a wider variety of investments and establish more relationships than us. Furthermore, many of our competitors are not subject to the regulatory restrictions that the 1940 Act imposes on us as a BDC and that the Code imposes on us as a RIC. We cannot assure you that the competitive pressures we face will not have a material adverse effect on our business, financial condition and results of operations. Also, as a result of this competition, we may not be able to pursue attractive investment opportunities from time to time.
We do not seek to compete primarily based on the interest rates we offer and we believe that some of our competitors may make loans with interest rates that are comparable to or lower than the rates we offer. Rather, we compete with our competitors based on our existing investment platform, seasoned investment professionals, experience and focus on middle-market companies, disciplined investment philosophy, extensive industry focus and flexible transaction structuring.
We may lose investment opportunities if we do not match our competitors’ pricing, terms and structure. If we match our competitors’ pricing, terms and structure, we may experience decreased net interest income and increased risk of credit loss. As a result of operating in such a competitive environment, we may make investments that are on less favorable terms than what we may have originally anticipated, which may impact our return on these investments.
We fund a portion of our investments with borrowed money, which magnifies the potential for gain or loss on amounts invested and may increase the risk of investing in us.
Borrowings and other types of financing, also known as leverage, magnify the potential for gain or loss on amounts invested and, therefore, increase the risks associated with investing in our securities. Our lenders have fixed dollar claims on our assets that are superior to the claims of our common stockholders or any preferred stockholders. If the value of our assets increases, then leveraging would cause the net asset value to increase more sharply than it would have had we not leveraged. Conversely, if the value of our assets decreases, leveraging would cause net asset value to decline more sharply than it otherwise would have had we not leveraged. Similarly, any increase in our income in excess of consolidated interest payable on the borrowed funds would cause our net income to increase more than it would without the leverage, while any decrease in our income would cause net income to decline more sharply than it would have had we not borrowed. Such a decline could negatively affect our ability to make common stock dividend payments. Leverage is generally considered a speculative investment technique.
30
Changes in interest rates may affect our cost of capital and net investment income.
A portion of the debt investments we make bears interest at fixed rates and other debt investments bear interest at variable rates with floors and the value of these investments could be negatively affected by increases in market interest rates. In addition, as the interest rate on our revolving credit facility is at a variable rate based on an index, an increase in interest rates would make it more expensive to use debt to finance our investments. As a result, an increase in market interest rates could both reduce the value of our portfolio investments and increase our cost of capital, which could reduce our net investment income or net increase in net assets resulting from operations.
We need to raise additional capital to grow because we must distribute most of our income.
We need additional capital to fund growth in our investments. A reduction in the availability of new capital could limit our ability to grow. We must distribute at least 90% of our ordinary income and realized net short-term capital gains in excess of realized net long-term capital losses, if any, to our stockholders to maintain our status as a regulated investment company, or RIC, for U.S. federal income tax purposes. As a result, such earnings are not available to fund investment originations. We have sought additional capital by borrowing from financial institutions and may issue debt securities or additional equity securities. If we fail to obtain funds from such sources or from other sources to fund our investments, we could be limited in our ability to grow, which may have an adverse effect on the value of our common stock. In addition, as a business development company, we generally may not borrow money or issue debt securities or issue preferred stock unless immediately thereafter our ratio of total assets to total borrowings and other senior securities is at least 200%. This may restrict our ability to obtain additional leverage in certain circumstances.
We may experience fluctuations in our quarterly results.
We could experience fluctuations in our quarterly operating results due to a number of factors, including the level of structuring fees received, the interest or dividend rates payable on the debt or equity securities we hold, the default rate on debt securities, the level of our expenses, variations in and the timing of the recognition of realized and unrealized gains or losses, the degree to which we encounter competition in our markets, and general economic conditions. As a result of these factors, results for any period should not be relied upon as being indicative of performance in future periods.
Our most recent NAV was calculated on June 30, 2015 and our NAV when calculated effective September 30, 2015 and thereafter may be higher or lower.
Our most recently estimated NAV per share is $10.35 on an adjusted basis solely to give effect to our issuance of 346,788 shares of our common stock since June 30, 2015 in connection with our dividend reinvestment plan and our repurchase of 4,158,750 shares of our common stock during the period from July 28, 2015 through August 14, 2015, $0.04 higher than the $10.31 determined by us as of June 30, 2015. NAV per share as of September 30, 2015 may be higher or lower than $10.35 based on potential changes in valuations, issuances of securities, repurchases of securities, dividends paid and earnings for the quarter then ended. Our Board of Directors has not yet determined the fair value of portfolio investments at any date subsequent to June 30, 2015. Our Board of Directors determines the fair value of our portfolio investments on a quarterly basis in connection with the preparation of quarterly financial statements and based on input from independent valuation firms, the Investment Adviser, the Administrator and the Audit Committee of our Board of Directors.
The Investment Adviser’s liability is limited under the Investment Advisory Agreement, and we are required to indemnify the Investment Adviser against certain liabilities, which may lead the Investment Adviser to act in a riskier manner on our behalf than it would when acting for its own account.
The Investment Adviser has not assumed any responsibility to us other than to render the services described in the Investment Advisory Agreement, and it will not be responsible for any action of our Board of Directors in declining to follow the Investment Adviser’s advice or recommendations. Pursuant to the Investment Advisory Agreement, the Investment Adviser and its members and their respective officers, managers, partners, agents, employees, controlling persons and members and any other person or entity affiliated with it will not be liable to us for their acts under the Investment Advisory Agreement, absent willful misfeasance, bad faith, gross negligence or reckless disregard in the performance of their duties. We have agreed to indemnify, defend and protect the Investment Adviser and its members and their respective officers, managers, partners, agents, employees, controlling persons and members and any other person or entity affiliated with it with respect to all damages, liabilities, costs and expenses resulting from acts of the Investment Adviser not arising out of willful misfeasance, bad faith, gross negligence or reckless disregard in the performance of their duties under the Investment Advisory Agreement. These protections may lead the Investment Adviser to act in a riskier manner when acting on our behalf than it would when acting for its own account.
31
Potential conflicts of interest could impact our investment returns.
Our executive officers and directors, and the executive officers of the Investment Adviser, may serve as officers, directors or principals of entities that operate in the same or related lines of business as we do or of investment funds managed by our affiliates. Accordingly, they may have obligations to investors in those entities, the fulfillment of which might not be in our best interests or those of our stockholders. Nevertheless, it is possible that new investment opportunities that meet our investment objective may come to the attention of one of these entities in connection with another investment advisory client or program, and, if so, such opportunity might not be offered, or otherwise made available, to us. However, as an investment adviser, Prospect Capital Management has a fiduciary obligation to act in the best interests of its clients, including us. To that end, if Prospect Capital Management or its affiliates manage any additional investment vehicles or client accounts in the future, Prospect Capital Management will endeavor to allocate investment opportunities in a fair and equitable manner over time so as not to discriminate unfairly against any client. If Prospect Capital Management chooses to establish another investment fund in the future, when the investment professionals of Prospect Capital Management identify an investment, they will have to choose which investment fund should make the investment.
In the course of our investing activities, under the Investment Advisory Agreement we pay base management and incentive fees to Prospect Capital Management and reimburse Prospect Capital Management for certain expenses it incurs. As a result of the Investment Advisory Agreement, there may be times when the senior management team of Prospect Capital Management has interests that differ from those of our stockholders, giving rise to a conflict.
The Investment Adviser receives a quarterly income incentive fee based, in part, on our pre-incentive fee net investment income, if any, for the immediately preceding calendar quarter. This income incentive fee is subject to a fixed quarterly hurdle rate before providing an income incentive fee return to Prospect Capital Management. This fixed hurdle rate was determined when then current interest rates were relatively low on a historical basis. Thus, if interest rates rise, it would become easier for our investment income to exceed the hurdle rate and, as a result, more likely that Prospect Capital Management will receive an income incentive fee than if interest rates on our investments remained constant or decreased. Subject to the receipt of any requisite stockholder approval under the 1940 Act, our Board of Directors may adjust the hurdle rate by amending the Investment Advisory Agreement.
The income incentive fee payable by us is computed and paid on income that may include interest that has been accrued but not yet received in cash. If a portfolio company defaults on a loan that has a deferred interest feature, it is possible that interest accrued under such loan that has previously been included in the calculation of the income incentive fee will become uncollectible. If this happens, we will reverse the interest that was recorded but Prospect Capital Management is not required to reimburse us for any such income incentive fee payments that were received in the past but would reduce the current period incentive fee for the effects of the reversal, if any. If we do not have sufficient liquid assets to pay this incentive fee or distributions to stockholders on such accrued income, we may be required to liquidate assets in order to do so. This fee structure could give rise to a conflict of interest for Prospect Capital Management to the extent that it may encourage Prospect Capital Management to favor debt financings that provide for deferred interest, rather than current cash payments of interest.
We have entered into a royalty-free license agreement with Prospect Capital Management. Under this agreement, Prospect Capital Management agrees to grant us a non-exclusive license to use the name “Prospect Capital.” Under the license agreement, we have the right to use the “Prospect Capital” name for so long as Prospect Capital Management or one of its affiliates remains our investment adviser. In addition, we rent office space from Prospect Administration, an affiliate of Prospect Capital Management, and pay Prospect Administration our allocable portion of overhead and other expenses incurred by Prospect Administration in performing its obligations as Administrator under the Administration Agreement, including rent and our allocable portion of the costs of our Chief Financial Officer and Chief Compliance Officer and their respective staffs. This may create conflicts of interest that our Board of Directors monitors.
Our incentive fee could induce Prospect Capital Management to make speculative investments.
The incentive fee payable by us to Prospect Capital Management may create an incentive for the Investment Adviser to make investments on our behalf that are more speculative or involve more risk than would be the case in the absence of such compensation arrangement. The way in which the incentive fee payable is determined (calculated as a percentage of the return on invested capital) may encourage the Investment Adviser to use leverage to increase the return on our investments. Increased use of leverage and this increased risk of replacement of that leverage at maturity would increase the likelihood of default, which would disfavor holders of our common stock. Similarly, because the Investment Adviser will receive an incentive fee based, in part, upon net capital gains realized on our investments, the Investment Adviser may invest more than would otherwise be appropriate in companies whose securities are likely to yield capital gains, as compared to income producing securities. Such a practice could result in our investing in more speculative securities than would otherwise be the case, which could result in higher investment losses, particularly during economic downturns.
32
The incentive fee payable by us to Prospect Capital Management could create an incentive for the Investment Adviser to invest on our behalf in instruments, such as zero coupon bonds, that have a deferred interest feature. Under these investments, we would accrue interest income over the life of the investment but would not receive payments in cash on the investment until the end of the term. Our net investment income used to calculate the income incentive fee, however, includes accrued interest. For example, accrued interest, if any, on our investments in zero coupon bonds will be included in the calculation of our incentive fee, even though we will not receive any cash interest payments in respect of payment on the bond until its maturity date. Thus, a portion of this incentive fee would be based on income that we may not have yet received in cash in the event of default may never receive.
We may be obligated to pay our Investment Adviser incentive compensation even if we incur a loss.
The Investment Adviser is entitled to incentive compensation for each fiscal quarter based, in part, on our pre-incentive fee net investment income if any, for the immediately preceding calendar quarter above a performance threshold for that quarter. Accordingly, since the performance threshold is based on a percentage of our net asset value, decreases in our net asset value make it easier to achieve the performance threshold. Our pre-incentive fee net investment income for incentive compensation purposes excludes realized and unrealized capital losses or depreciation that we may incur in the fiscal quarter, even if such capital losses or depreciation result in a net loss on our statement of operations for that quarter. Thus, we may be required to pay the Investment Adviser incentive compensation for a fiscal quarter even if there is a decline in the value of our portfolio or we incur a net loss for that quarter.
The Investment Adviser and Administrator have the right to resign on 60 days’ notice, and we may not be able to find a suitable replacement within that time, resulting in a disruption in our operations that could adversely affect our business, financial condition and results of operations.
The Investment Adviser and Administrator have the right, under the Investment Advisory Agreement and Administration Agreement, respectively, to resign at any time upon not less than 60 days’ written notice, whether we have found a replacement or not. If the Investment Adviser or Administrator resigns, we may not be able to find a replacement or hire internal management or administration with similar expertise and ability to provide the same or equivalent services on acceptable terms within 60 days, or at all. If we are unable to do so quickly, our operations are likely to experience a disruption, our business, financial condition and results of operations as well as our ability to pay distributions are likely to be adversely affected and the market price of our shares may decline. In addition, the coordination of our internal management and investment activities or our internal administration activities, as applicable, is likely to suffer if we are unable to identify and reach an agreement with a single institution or group of executives having the expertise possessed by the Investment Adviser and its affiliates or the Administrator and its affiliates. Even if we are able to retain comparable management or administration, whether internal or external, the integration of such management or administration and their lack of familiarity with our investment objective may result in additional costs and time delays that may adversely affect our business, financial condition and results of operations.
Changes in the laws or regulations governing our business or the businesses of our portfolio companies and any failure by us or our portfolio companies to comply with these laws or regulations could negatively affect the profitability of our operations or the profitability of our portfolio companies.
We are subject to changing rules and regulations of federal and state governments, as well as the stock exchange on which our common stock is listed. These entities, including the Public Company Accounting Oversight Board, the SEC and the NASDAQ Global Select Market, have issued a significant number of new and increasingly complex requirements and regulations over the course of the last several years and continue to develop additional regulations. In particular, changes in the laws or regulations or the interpretations of the laws and regulations that govern BDCs, RICs or non-depository commercial lenders could significantly affect our operations and our cost of doing business. We are subject to federal, state and local laws and regulations and are subject to judicial and administrative decisions that affect our operations, including our loan originations, maximum interest rates, fees and other charges, disclosures to portfolio companies, the terms of secured transactions, collection and foreclosure procedures and other trade practices. If these laws, regulations or decisions change, or if we expand our business into jurisdictions that have adopted more stringent requirements than those in which we currently conduct business, we may have to incur significant expenses in order to comply, or we might have to restrict our operations. In addition, if we do not comply with applicable laws, regulations and decisions, we may lose licenses needed for the conduct of our business and be subject to civil fines and criminal penalties, any of which could have a material adverse effect upon our business, financial condition and results of operations.
Foreign and domestic political risk may adversely affect our business.
We are exposed to political risk to the extent that Prospect Capital Management, on its behalf and subject to its investment guidelines, transacts in securities in the U.S. and foreign markets. The governments in any of these jurisdictions could impose restrictions, regulations or other measures, which may have a material adverse impact on our strategy.
33
If we fail to maintain an effective system of internal control over financial reporting, we may not be able to accurately report our financial results or prevent fraud. As a result, stockholders could lose confidence in our financial and other public reporting, which would harm our business and the trading price of our common stock.
Effective internal controls over financial reporting are necessary for us to provide reliable financial reports and, together with adequate disclosure controls and procedures, are designed to prevent fraud. Any failure to implement required new or improved controls, or difficulties encountered in their implementation could cause us to fail to meet our reporting obligations. In addition, any testing by us conducted in connection with Section 404 of the Sarbanes-Oxley Act, or the subsequent testing by our independent registered public accounting firm (when undertaken, as noted below), may reveal deficiencies in our internal controls over financial reporting that are deemed to be material weaknesses or that may require prospective or retroactive changes to our consolidated financial statements or identify other areas for further attention or improvement. Inferior internal controls could also cause investors and lenders to lose confidence in our reported financial information, which could have a negative effect on the trading price of our common stock.
We face cyber-security risks.
Our business operations rely upon secure information technology systems for data processing, storage and reporting. Despite careful security and controls design, implementation and updating, our information technology systems could become subject to cyber-attacks. Network, system, application and data breaches could result in operational disruptions or information misappropriation, which could have a material adverse effect on our business, results of operations and financial condition.
The failure in cyber-security systems, as well as the occurrence of events unanticipated in our disaster recovery systems and management continuity planning, could impair our ability to conduct business effectively.
The occurrence of a disaster such as a cyber-attack, a natural catastrophe, an industrial accident, a terrorist attack or war, events unanticipated in our disaster recovery systems, or a support failure from external providers, could have an adverse effect on our ability to conduct business and on our results of operations and financial condition, particularly if those events affect our computer-based data processing, transmission, storage, and retrieval systems or destroy data. If a significant number of our managers were unavailable in the event of a disaster, our ability to effectively conduct our business could be severely compromised.
We depend heavily upon computer systems to perform necessary business functions. Despite our implementation of a variety of security measures, our computer systems could be subject to cyber-attacks and unauthorized access, such as physical and electronic break-ins or unauthorized tampering. Like other companies, we may experience threats to our data and systems, including malware and computer virus attacks, unauthorized access, system failures and disruptions. If one or more of these events occurs, it could potentially jeopardize the confidential, proprietary and other information processed and stored in, and transmitted through, our computer systems and networks, or otherwise cause interruptions or malfunctions in our operations, which could result in damage to our reputation, financial losses, litigation, increased costs, regulatory penalties and/or customer dissatisfaction or loss.
We are dependent on information systems and systems failures could significantly disrupt our business, which may, in turn, negatively affect the market price of our common stock and our ability to pay dividends.
Our business is dependent on our and third parties’ communications and information systems. Any failure or interruption of those systems, including as a result of the termination of an agreement with any third-party service providers, could cause delays or other problems in our activities. Our financial, accounting, data processing, backup or other operating systems and facilities may fail to operate properly or become disabled or damaged as a result of a number of factors including events that are wholly or partially beyond our control and adversely affect our business. There could be:
• | sudden electrical or telecommunications outages; |
• | natural disasters such as earthquakes, tornadoes and hurricanes; |
• | disease pandemics; |
• | events arising from local or larger scale political or social matters, including terrorist acts; and |
• | cyber-attacks. |
These events, in turn, could have a material adverse effect on our operating results and negatively affect the market price of our common stock and our ability to pay dividends to our stockholders.
34
Risks Relating to Our Operation as a Business Development Company
If we do not invest a sufficient portion of our assets in qualifying assets, we could fail to qualify as a BDC or be precluded from investing according to our current business strategy.
As a BDC, we may not acquire any assets other than “qualifying assets” unless, at the time of and after giving effect to such acquisition, at least 70% of our total assets are qualifying assets. We may be precluded from investing in what we believe are attractive investments if such investments are not qualifying assets for purposes of the 1940 Act. If we do not invest a sufficient portion of our assets in qualifying assets, we could be found to be in violation of the 1940 Act provisions applicable to BDCs, which would have a material adverse effect on our business, financial condition and results of operations. Similarly, these rules could prevent us from making follow-on investments in existing portfolio companies (which could result in the dilution of our position) or could require us to dispose of investments at inappropriate times in order to come into compliance with the 1940 Act. Because most of our investments will be in private companies, and therefore will be relatively illiquid, any such dispositions could be made at disadvantageous prices and could result in substantial losses.
If we fail to qualify as a RIC, we will have to pay corporate-level taxes on our income, and our income available for distribution would be reduced.
To maintain our qualification for U.S. federal income tax purposes as a RIC under Subchapter M of the Code and obtain RIC tax treatment, we must meet certain source of income, annual distribution and asset diversification requirements.
The source of income requirement is satisfied if we derive at least 90% of our annual gross income from interest, dividends, payments with respect to certain securities loans, gains from the sale or other disposition of securities or options thereon or foreign currencies, or other income derived with respect to our business of investing in such securities or currencies, and net income from interests in “qualified publicly traded partnerships,” as defined in the Code.
The annual distribution requirement for a RIC is satisfied if we distribute at least 90% of our ordinary income and net short-term capital gains in excess of net long-term capital losses, if any, to our stockholders on an annual basis. Because we use debt financing, we are subject to certain asset coverage ratio requirements under the 1940 Act and financial covenants that could, under certain circumstances, restrict us from making distributions necessary to qualify for RIC tax treatment. If we are unable to obtain cash from other sources, we may fail to qualify for RIC tax treatment and, thus, may be subject to corporate-level income tax on all of our taxable income.
To maintain our qualification as a RIC, we must also meet certain asset diversification requirements at the end of each quarter of our taxable year. Failure to meet these tests may result in our having to dispose of certain investments quickly in order to prevent the loss of RIC status. Because most of our investments are in private companies, any such dispositions could be made at disadvantageous prices and may result in substantial losses.
If we fail to qualify as a RIC for any reason or become subject to corporate income tax, the resulting corporate taxes would substantially reduce our net assets, the amount of income available for distribution, and the actual amount of our distributions. Such a failure would have a materially adverse effect on us and our stockholders. For additional information regarding asset coverage ratio and RIC requirements, see “Business – Material U.S. Federal Income Tax Considerations” and “Business – Regulation as a Business Development Company.”
We may have difficulty paying our required distributions if we recognize income before or without receiving cash representing such income.
For U.S. federal income tax purposes, we include in income certain amounts that we have not yet received in cash, such as original issue discount or payment-in-kind interest, which represents contractual interest added to the loan balance and due at the end of the loan term. Such amounts could be significant relative to our overall investment activities. We also may be required to include in taxable income certain other amounts that we do not receive in cash. While we focus primarily on investments that will generate a current cash return, our investment portfolio currently includes, and we may continue to invest in, securities that do not pay some or all of their return in periodic current cash distributions.
35
Since in some cases we may recognize taxable income before or without receiving cash representing such income, we may have difficulty distributing at least 90% of our ordinary income and realized net short-term capital gains in excess of realized net long-term capital losses, if any, as required to maintain RIC tax treatment. Accordingly, we may have to sell some of our investments at times we would not consider advantageous, raise additional debt or equity capital or reduce new investment originations to meet these distribution requirements. If we are not able to obtain cash from other sources, we may fail to qualify for RIC treatment and thus become subject to corporate-level income tax. See “Business – Material U.S. Federal Income Tax Considerations” and “Business – Regulation as a Business Development Company.”
Regulations governing our operation as a business development company affect our ability to raise, and the way in which we raise, additional capital.
We have incurred indebtedness under our revolving credit facility and through the issuance of the Senior Notes and, in the future, may issue preferred stock or debt securities and/or borrow additional money from banks or other financial institutions, which we refer to collectively as “senior securities,” up to the maximum amount permitted by the 1940 Act. Under the provisions of the 1940 Act, we are permitted, as a BDC, to incur indebtedness or issue senior securities only in amounts such that our asset coverage, as defined in the 1940 Act, equals at least 200% after each issuance of senior securities. If the value of our assets declines, we may be unable to satisfy this test, which would prohibit us from paying dividends in cash or other property and could prohibit us from qualifying as a RIC. If we cannot satisfy this test, we may be required to sell a portion of our investments or sell additional shares of common stock at a time when such sales may be disadvantageous in order to repay a portion of our indebtedness or otherwise increase our net assets. In addition, issuance of additional common stock could dilute the percentage ownership of our current stockholders in us.
As a BDC regulated under provisions of the 1940 Act, we are not generally able to issue and sell our common stock at a price below the current net asset value per share without stockholder approval. If our common stock trades at a discount to net asset value, this restriction could adversely affect our ability to raise capital. We may, however, sell our common stock, or warrants, options or rights to acquire our common stock, at a price below the current net asset value of our common stock in certain circumstances, including if (i)(1) the holders of a majority of our shares (or, if less, at least 67% of a quorum consisting of a majority of our shares) and a similar majority of the holders of our shares who are not affiliated persons of us approve the sale of our common stock at a price that is less than the current net asset value, and (2) a majority of our Directors who have no financial interest in the transaction and a majority of our independent Directors (a) determine that such sale is in our and our stockholders’ best interests and (b) in consultation with any underwriter or underwriters of the offering, make a good faith determination as of a time either immediately prior to the first solicitation by us or on our behalf of firm commitments to purchase such shares, or immediately prior to the issuance of such shares, that the price at which such shares are to be sold is not less than a price which closely approximates the market value of such shares, less any distributing commission or discount or if (ii) a majority of the number of the beneficial holders of our common stock entitled to vote at our annual meeting, without regard to whether a majority of such shares are voted in favor of the proposal, approve the sale of our common stock at a price that is less than the current net asset value per share.
To generate cash for funding new investments, we pledged a substantial portion of our portfolio investments under our revolving credit facility. These assets are not available to secure other sources of funding or for securitization. Our ability to obtain additional secured or unsecured financing on attractive terms in the future is uncertain.
Alternatively, we may securitize our future loans to generate cash for funding new investments. See “Securitization of our assets subjects us to various risks.”
Securitization of our assets subjects us to various risks.
We may securitize assets to generate cash for funding new investments. We refer to the term securitize to describe a form of leverage under which a company such as us (sometimes referred to as an “originator” or “sponsor”) transfers income producing assets to a single-purpose, bankruptcy-remote subsidiary (also referred to as a “special purpose entity” or “SPE”), which is established solely for the purpose of holding such assets and entering into a structured finance transaction. The SPE then issues notes secured by such assets. The special purpose entity may issue the notes in the capital markets either publicly or privately to a variety of investors, including banks, non-bank financial institutions and other investors. There may be a single class of notes or multiple classes of notes, the most senior of which carries less credit risk and the most junior of which may carry substantially the same credit risk as the equity of the SPE.
36
An important aspect of most debt securitization transactions is that the sale and/or contribution of assets into the SPE be considered a true sale and/or contribution for accounting purposes and that a reviewing court would not consolidate the SPE with the operations of the originator in the event of the originator’s bankruptcy based on equitable principles. Viewed as a whole, a debt securitization seeks to lower risk to the note purchasers by isolating the assets collateralizing the securitization in an SPE that is not subject to the credit and bankruptcy risks of the originator. As a result of this perceived reduction of risk, debt securitization transactions frequently achieve lower overall leverage costs for originators as compared to traditional secured lending transactions.
In accordance with the above description, to securitize loans, we may create a wholly-owned subsidiary and contribute a pool of our assets to such subsidiary. The SPE may be funded with, among other things, whole loans or interests from other pools and such loans may or may not be rated. The SPE would then sell its notes to purchasers who we would expect to be willing to accept a lower interest rate and the absence of any recourse against us to invest in a pool of income producing assets to which none of our creditors would have access. We would retain all or a portion of the equity in the SPE. An inability to successfully securitize portions of our portfolio or otherwise leverage our portfolio through secured and unsecured borrowings could limit our ability to grow our business and fully execute our business strategy, and could decrease our earnings. However, the successful securitization of portions of our portfolio exposes us to a risk of loss for the equity we retain in the SPE and might expose us to greater risk on our remaining portfolio because the assets we retain may tend to be those that are riskier and more likely to generate losses. A successful securitization may also impose financial and operating covenants that restrict our business activities and may include limitations that could hinder our ability to finance additional loans and investments or to make the distributions required to maintain our status as a RIC under Subchapter M of the Code. The 1940 Act may also impose restrictions on the structure of any securitizations.
Interests we hold in the SPE, if any, will be subordinated to the other interests issued by the SPE. As such, we will only receive cash distributions on such interests if the SPE has made all cash interest and other required payments on all other interests it has issued. In addition, our subordinated interests will likely be unsecured and rank behind all of the secured creditors, known or unknown, of the SPE, including the holders of the senior interests it has issued. Consequently, to the extent that the value of the SPEs portfolio of assets has been reduced as a result of conditions in the credit markets, or as a result of defaults, the value of the subordinated interests we retain would be reduced. Securitization imposes on us the same risks as borrowing except that our risk in a securitization is limited to the amount of subordinated interests we retain, whereas in a borrowing or debt issuance by us directly we would be at risk for the entire amount of the borrowing or debt issuance.
If the SPE is not consolidated with us, our only interest will be the value of our retained subordinated interest and the income allocated to us, which may be more or less than the cash we receive from the SPE, and none of the SPEs liabilities will be reflected as our liabilities. If the assets of the SPE are not consolidated with our assets and liabilities, then our interest in the SPE may be deemed not to be a qualifying asset for purposes of determining whether 70% of our assets are qualifying assets and the leverage incurred by such SPE may or may not be treated as borrowings by us for purposes of the requirement that we not issue senior securities in an amount in excess of our net assets.
We may also engage in transactions utilizing SPEs and securitization techniques where the assets sold or contributed to the SPE remain on our balance sheet for accounting purposes. If, for example, we sell the assets to the SPE with recourse or provide a guarantee or other credit support to the SPE, its assets will remain on our balance sheet. Consolidation would also generally result if we, in consultation with the SEC, determine that consolidation would result in a more accurate reflection of our assets, liabilities and results of operations. In these structures, the risks will be essentially the same as in other securitization transactions but the assets will remain our assets for purposes of the limitations described above on investing in assets that are not qualifying assets and the leverage incurred by the SPE will be treated as borrowings incurred by us for purposes of our limitation on the issuance of senior securities.
The Investment Adviser may have conflicts of interest with respect to potential securitizations in as much as securitizations that are not consolidated may reduce our assets for purposes of determining its investment advisory fee although in some circumstances the Investment Adviser may be paid certain fees for managing the assets of the SPE so as to reduce or eliminate any potential bias against securitizations.
Our ability to invest in public companies may be limited in certain circumstances.
As a BDC, we must not acquire any assets other than “qualifying assets” specified in the 1940 Act unless, at the time the acquisition is made, at least 70% of our total assets are qualifying assets (with certain limited exceptions). Subject to certain exceptions for follow-on investments and distressed companies, an investment in an issuer that has outstanding securities listed on a national securities exchange may be treated as qualifying assets only if such issuer has a market capitalization that is less than $250 million at the time of such investment.
37
Risks Relating to Our Investments
We may not realize gains or income from our investments.
We seek to generate both current income and capital appreciation. However, the securities we invest in may not appreciate and, in fact, may decline in value, and the issuers of debt securities we invest in may default on interest and/or principal payments. Accordingly, we may not be able to realize gains from our investments, and any gains that we do realize may not be sufficient to offset any losses we experience. See “Business – Our Investment Objective and Policies.”
Most of our portfolio investments are recorded at fair value as determined in good faith under the direction of our Board of Directors and, as a result, there is uncertainty as to the value of our portfolio investments.
A large percentage of our portfolio investments consist of securities of privately held companies. Hence, market quotations are generally not readily available for determining the fair values of such investments. The determination of fair value, and thus the amount of unrealized losses we may incur in any year, is to a degree subjective, and the Investment Adviser has a conflict of interest in making the determination. We value these securities quarterly at fair value as determined in good faith by our Board of Directors based on input from the Investment Adviser, our Administrator, a third party independent valuation firm and our Audit Committee. Our Board of Directors utilizes the services of an independent valuation firm to aid it in determining the fair value of any securities. The types of factors that may be considered in determining the fair values of our investments include the nature and realizable value of any collateral, the portfolio company’s ability to make payments and its earnings, the markets in which the portfolio company does business, comparison to publicly traded companies, discounted cash flow, current market interest rates and other relevant factors.
Because such valuations, and particularly valuations of private securities and private companies, are inherently uncertain, the valuations may fluctuate significantly over short periods of time due to changes in current market conditions. The determinations of fair value by our Board of Directors may differ materially from the values that would have been used if an active market and market quotations existed for these investments. Our net asset value could be adversely affected if the determinations regarding the fair value of our investments were materially higher than the values that we ultimately realize upon the disposal of such securities.
In addition, decreases in the market values or fair values of our investments are recorded as unrealized depreciation. Declines in prices and liquidity in the corporate debt markets experienced during a financial crisis will result in significant net unrealized depreciation in our portfolio. The effect of all of these factors on our portfolio will reduce our NAV by increasing net unrealized depreciation in our portfolio. Depending on market conditions, we could incur substantial realized losses which could have a material adverse impact on our business, financial condition and results of operations. We have no policy regarding holding a minimum level of liquid assets. As such, a high percentage of our portfolio generally is not liquid at any given point in time. See “The lack of liquidity may adversely affect our business.”
Price declines and illiquidity in the corporate debt markets have adversely affected, and may in the future adversely affect, the fair value of our portfolio investments, reducing our net asset value through increased net unrealized depreciation.
As a BDC, we are required to carry our investments at market value or, if no market value is ascertainable, at fair value as determined in good faith by or under the direction of our Board of Directors. As part of the valuation process, the types of factors that we may take into account in determining the fair value of our investments include, as relevant and among other factors: available current market data, including relevant and applicable market trading and transaction comparables, applicable market yields and multiples, security covenants, call protection provisions, information rights, the nature and realizable value of any collateral, the portfolio company’s ability to make payments, its earnings and discounted cash flows, the markets in which the portfolio company does business, comparisons of financial ratios of peer companies that are public, merger and acquisition comparables, our principal market (as the reporting entity) and enterprise values. Decreases in the market values or fair values of our investments are recorded as unrealized depreciation. The effect of all of these factors on our portfolio can reduce our net asset value by increasing net unrealized depreciation in our portfolio. Depending on market conditions, we could incur substantial realized losses and may suffer additional unrealized losses in future periods, which could have a material adverse impact on our business, financial condition and results of operations.
38
Our investments in prospective portfolio companies may be risky and we could lose all or part of our investment.
Some of our portfolio companies have relatively short or no operating histories. These companies are and will be subject to all of the business risk and uncertainties associated with any new business enterprise, including the risk that these companies may not reach their investment objective and the value of our investment in them may decline substantially or fall to zero. In addition, investment in the middle market companies that we are targeting involves a number of other significant risks, including:
• | These companies may have limited financial resources and may be unable to meet their obligations under their securities that we hold, which may be accompanied by a deterioration in the value of their securities or of any collateral with respect to any securities and a reduction in the likelihood of our realizing on any guarantees we may have obtained in connection with our investment. |
• | They may have shorter operating histories, narrower product lines and smaller market shares than larger businesses, which tend to render them more vulnerable to competitors’ actions and market conditions, as well as general economic downturns. |
• | Because many of these companies are privately held companies, public information is generally not available about these companies. As a result, we will depend on the ability of the Investment Adviser to obtain adequate information to evaluate these companies in making investment decisions. If the Investment Adviser is unable to uncover all material information about these companies, it may not make a fully informed investment decision, and we may lose money on our investments. |
• | They are more likely to depend on the management talents and efforts of a small group of persons; therefore, the death, disability, resignation or termination of one or more of these persons could have a materially adverse impact on our portfolio company and, in turn, on us. |
• | They may have less predictable operating results, may from time to time be parties to litigation, may be engaged in changing businesses with products subject to a risk of obsolescence and may require substantial additional capital to support their operations, finance expansion or maintain their competitive position. |
• | They may have difficulty accessing the capital markets to meet future capital needs. |
• | Changes in laws and regulations, as well as their interpretations, may adversely affect their business, financial structure or prospects. |
• | Increased taxes, regulatory expense or the costs of changes to the way they conduct business due to the effects of climate change may adversely affect their business, financial structure or prospects. |
We acquire majority interests in operating companies engaged in a variety of industries. When we acquire these companies we generally seek to apply financial leverage to them in the form of debt. In most cases all or a portion of this debt is held by us, with the obligor being either the operating company itself, a holding company through which we own our majority interest or both. The level of debt leverage utilized by these companies makes them susceptible to the risks identified above.
In addition, our executive officers, directors and the Investment Adviser could, in the ordinary course of business, be named as defendants in litigation arising from proposed investments or from our investments in the portfolio companies.
The lack of liquidity in our investments may adversely affect our business.
We make investments in private companies. A portion of these investments may be subject to legal and other restrictions on resale, transfer, pledge or other disposition or will otherwise be less liquid than publicly traded securities. The illiquidity of our investments may make it difficult for us to sell such investments if the need arises. In addition, if we are required to liquidate all or a portion of our portfolio quickly, we may realize significantly less than the value at which we have previously recorded our investments. In addition, we face other restrictions on our ability to liquidate an investment in a business entity to the extent that we or the Investment Adviser has or could be deemed to have material non-public information regarding such business entity.
39
Economic recessions or downturns could impair our portfolio companies and harm our operating results.
Many of our portfolio companies may be susceptible to economic slowdowns or recessions and may be unable to repay our loans or meet other obligations during these periods. Therefore, our non-performing assets are likely to increase, and the value of our portfolio is likely to decrease, during these periods. Adverse economic conditions also may decrease the value of collateral securing some of our loans and the value of our equity investments. Economic slowdowns or recessions could lead to financial losses in our portfolio and a decrease in revenues, net income and assets. Unfavorable economic conditions also could increase our funding costs, limit our access to the capital markets or result in a decision by lenders not to extend credit to us. These events could prevent us from increasing investments and harm our operating results.
A portfolio company’s failure to satisfy financial or operating covenants imposed by us or other lenders could lead to defaults and, potentially, termination of its loans and foreclosure on its secured assets, which could trigger cross-defaults under other agreements and jeopardize a portfolio company’s ability to meet its obligations under the debt or equity securities that we hold. We may incur expenses to the extent necessary to seek recovery upon default or to negotiate new terms, which may include the waiver of certain financial covenants, with a defaulting portfolio company. In addition, if one of our portfolio companies were to go bankrupt, even though we may have structured our interest as senior debt or preferred equity, depending on the facts and circumstances, including the extent to which we actually provided managerial assistance to that portfolio company, a bankruptcy court might re-characterize our debt or equity holding and subordinate all or a portion of our claim to those of other creditors.
Investments in equity securities, many of which are illiquid with no readily available market, involve a substantial degree of risk.
We may purchase common and other equity securities. Although common stock has historically generated higher average total returns than fixed income securities over the long-term, common stock has significantly more volatility in those returns and may significantly underperform relative to fixed income securities. The equity securities we acquire may fail to appreciate and may decline in value or become worthless and our ability to recover our investment will depend on our portfolio company’s success. Investments in equity securities involve a number of significant risks, including:
• | Any equity investment we make in a portfolio company could be subject to further dilution as a result of the issuance of additional equity interests and to serious risks as a junior security that will be subordinate to all indebtedness (including trade creditors) or senior securities in the event that the issuer is unable to meet its obligations or becomes subject to a bankruptcy process. |
• | To the extent that the portfolio company requires additional capital and is unable to obtain it, we may not recover our investment. |
• | In some cases, equity securities in which we invest will not pay current dividends, and our ability to realize a return on our investment, as well as to recover our investment, will be dependent on the success of the portfolio company. Even if the portfolio company is successful, our ability to realize the value of our investment may be dependent on the occurrence of a liquidity event, such as a public offering or the sale of the portfolio company. It is likely to take a significant amount of time before a liquidity event occurs or we can otherwise sell our investment. In addition, the equity securities we receive or invest in may be subject to restrictions on resale during periods in which it could be advantageous to sell them. |
There are special risks associated with investing in preferred securities, including:
• | Preferred securities may include provisions that permit the issuer, at its discretion, to defer distributions for a stated period without any adverse consequences to the issuer. If we own a preferred security that is deferring its distributions, we may be required to report income for tax purposes before we receive such distributions. |
• | Preferred securities are subordinated to debt in terms of priority to income and liquidation payments, and therefore will be subject to greater credit risk than debt. |
• | Preferred securities may be substantially less liquid than many other securities, such as common stock or U.S. government securities. |
• | Generally, preferred security holders have no voting rights with respect to the issuing company, subject to limited exceptions. |
40
Additionally, when we invest in first lien senior secured loans (including unitranche loans), second lien senior secured loans or unsecured debt, we may acquire warrants or other equity securities as well. Our goal is ultimately to dispose of such equity interests and realize gains upon our disposition of such interests. However, the equity interests we receive may not appreciate in value and, in fact, may decline in value. Accordingly, we may not be able to realize gains from our equity interests and any gains that we do realize on the disposition of any equity interests may not be sufficient to offset any other losses we experience.
We may invest, to the extent permitted by law, in the equity securities of investment funds that are operating pursuant to certain exceptions to the 1940 Act and in advisers to similar investment funds and, to the extent we so invest, will bear our ratable share of any such company’s expenses, including management and performance fees. We will also remain obligated to pay management and incentive fees to Prospect Capital Management with respect to the assets invested in the securities and instruments of such companies. With respect to each of these investments, each of our common stockholders will bear his or her share of the management and incentive fee of Prospect Capital Management as well as indirectly bearing the management and performance fees and other expenses of any such investment funds or advisers.
There may be circumstances where our debt investments could be subordinated to claims of other creditors or we could be subject to lender liability claims.
If one of our portfolio companies were to go bankrupt, even though we may have structured our interest as senior debt, depending on the facts and circumstances, a bankruptcy court might recharacterize our debt holding as an equity investment and subordinate all or a portion of our claim to that of other creditors. In addition, lenders can be subject to lender liability claims for actions taken by them where they become too involved in the borrower’s business or exercise control over the borrower. For example, we could become subject to a lender’s liability claim, if, among other things, we actually render significant managerial assistance.
Our portfolio companies may incur debt or issue equity securities that rank equally with, or senior to, our investments in such companies.
Our portfolio companies may have, or may be permitted to incur, other debt or issue other equity securities that rank equally with or senior to our investments. By their terms, such instruments may provide that the holders are entitled to receive payment of dividends, interest or principal on or before the dates on which we are entitled to receive payments in respect of our investments. These debt instruments would usually prohibit the portfolio companies from paying interest on or repaying our investments in the event and during the continuance of a default under such debt. Also, in the event of insolvency, liquidation, dissolution, reorganization or bankruptcy of a portfolio company, holders of securities ranking senior to our investment in that portfolio company typically are entitled to receive payment in full before we receive any distribution in respect of our investment. After repaying such holders, the portfolio company may not have any remaining assets to use for repaying its obligation to us. In the case of securities ranking equally with our investments, we would have to share on an equal basis any distributions with other security holders in the event of an insolvency, liquidation, dissolution, reorganization or bankruptcy of the relevant portfolio company.
The rights we may have with respect to the collateral securing any junior priority loans we make to our portfolio companies may also be limited pursuant to the terms of one or more intercreditor agreements (including agreements governing “first out” and “last out” structures) that we enter into with the holders of senior debt. Under such an intercreditor agreement, at any time that senior obligations are outstanding, we may forfeit certain rights with respect to the collateral to the holders of the senior obligations. These rights may include the right to commence enforcement proceedings against the collateral, the right to control the conduct of such enforcement proceedings, the right to approve amendments to collateral documents, the right to release liens on the collateral and the right to waive past defaults under collateral documents. We may not have the ability to control or direct such actions, even if as a result our rights as junior lenders are adversely affected.
This risk is characteristic of many of the majority-owned operating companies in our portfolio in that any debt to us from a holding company and the holding company’s substantial equity investments in the related operating company are subordinated to any creditors of the operating company.
When we are a debt or minority equity investor in a portfolio company, we are often not in a position to exert influence on the entity, and other debt holders, other equity holders and portfolio company management may make decisions that could decrease the value of our portfolio holdings.
When we make debt or minority equity investments, we are subject to the risk that a portfolio company may make business decisions with which we disagree and the other equity holders and management of such company may take risks or otherwise act in ways that do not serve our interests. As a result, a portfolio company may make decisions that could decrease the value of our investment. In addition, when we hold a subordinate debt position, other more senior debt holders may make decisions that could decrease the value of our investment.
41
Our portfolio companies may be highly leveraged.
Some of our portfolio companies may be highly leveraged, which may have adverse consequences to these companies and to us as an investor. These companies may be subject to restrictive financial and operating covenants and the leverage may impair these companies’ ability to finance their future operations and capital needs. As a result, these companies’ flexibility to respond to changing business and economic conditions and to take advantage of business opportunities may be limited. Further, a leveraged company’s income and net assets will tend to increase or decrease at a greater rate than if borrowed money were not used.
Our portfolio contains a limited number of portfolio companies, some of which comprise a substantial percentage of our portfolio, which subjects us to a greater risk of significant loss if any of these companies defaults on its obligations under any of its debt securities.
A consequence of the limited number of investments in our portfolio is that the aggregate returns we realize may be significantly adversely affected if one or more of our significant portfolio company investments perform poorly or if we need to write down the value of any one significant investment. Beyond our income tax diversification requirements, we do not have fixed guidelines for diversification, and our portfolio could contain relatively few portfolio companies.
Our failure to make follow-on investments in our existing portfolio companies could impair the value of our portfolio.
Following an initial investment in a portfolio company, we may make additional investments in that portfolio company as “follow-on” investments, in order to: (1) increase or maintain in whole or in part our equity ownership percentage; (2) exercise warrants, options or convertible securities that were acquired in the original or subsequent financing or (3) attempt to preserve or enhance the value of our investment.
We may elect not to make follow-on investments, may be constrained in our ability to employ available funds, or otherwise may lack sufficient funds to make those investments. We have the discretion to make any follow-on investments, subject to the availability of capital resources. The failure to make follow-on investments may, in some circumstances, jeopardize the continued viability of a portfolio company and our initial investment, or may result in a missed opportunity for us to increase our participation in a successful operation. Even if we have sufficient capital to make a desired follow-on investment, we may elect not to make a follow-on investment because we may not want to increase our concentration of risk, because we prefer other opportunities, or because we are inhibited by compliance with BDC requirements or the desire to maintain our tax status.
We may be unable to invest the net proceeds raised from offerings and repayments from investments on acceptable terms, which would harm our financial condition and operating results.
Until we identify new investment opportunities, we intend to either invest the net proceeds of future offerings and repayments from investments in interest-bearing deposits or other short-term instruments or use the net proceeds from such offerings to reduce then-outstanding obligations under our credit facility. We cannot assure you that we will be able to find enough appropriate investments that meet our investment criteria or that any investment we complete using the proceeds from an offering or repayments will produce a sufficient return.
We may have limited access to information about privately-held companies in which we invest.
We invest primarily in privately-held companies. Generally, little public information exists about these companies, and we are required to rely on the ability of the Investment Adviser’s investment professionals to obtain adequate information to evaluate the potential returns from investing in these companies. These companies and their financial information are not subject to the Sarbanes-Oxley Act of 2002 and other rules that govern public companies. If we are unable to uncover all material information about these companies, we may not make a fully informed investment decision, and we may lose money on our investment.
42
We may not be able to fully realize the value of the collateral securing our debt investments.
Although a substantial amount of our debt investments are protected by holding security interests in the assets or equity interests of the portfolio companies, we may not be able to fully realize the value of the collateral securing our investments due to one or more of the following factors:
• | Our debt investments may be in the form of unsecured loans, therefore our liens on the collateral, if any, are subordinated to those of the senior secured debt of the portfolio companies, if any. As a result, we may not be able to control remedies with respect to the collateral. |
• | The collateral may not be valuable enough to satisfy all of the obligations under our secured loan, particularly after giving effect to the repayment of secured debt of the portfolio company that ranks senior to our loan. |
• | Bankruptcy laws may limit our ability to realize value from the collateral and may delay the realization process. |
• | Our rights in the collateral may be adversely affected by the failure to perfect security interests in the collateral. |
• | The need to obtain regulatory and contractual consents could impair or impede how effectively the collateral would be liquidated and could affect the value received. |
• | Some or all of the collateral may be illiquid and may have no readily ascertainable market value. The liquidity and value of the collateral could be impaired as a result of changing economic conditions, competition, and other factors, including the availability of suitable buyers. |
Our investments in foreign securities may involve significant risks in addition to the risks inherent in U.S. investments.
Our investment strategy contemplates potential investments in securities of foreign companies, including those located in emerging market countries. Investing in foreign companies may expose us to additional risks not typically associated with investing in U.S. companies. These risks include changes in exchange control regulations, political and social instability, expropriation, imposition of foreign taxes, less liquid markets and less available information than is generally the case in the United States, higher transaction costs, less government supervision of exchanges, brokers and issuers, less developed bankruptcy laws, difficulty in enforcing contractual obligations, lack of uniform accounting and auditing standards and greater price volatility. Such risks are more pronounced in emerging market countries.
Although currently substantially all of our investments are, and we expect that most of our investments will be, U.S. dollar-denominated, investments that are denominated in a foreign currency will be subject to the risk that the value of a particular currency will change in relation to one or more other currencies. Among the factors that may affect currency values are trade balances, the level of short-term interest rates, differences in relative values of similar assets in different currencies, long-term opportunities for investment and capital appreciation, and political developments.
We may expose ourselves to risks if we engage in hedging transactions.
We may employ hedging techniques to minimize certain investment risks, such as fluctuations in interest and currency exchange rates, but we can offer no assurance that such strategies will be effective. If we engage in hedging transactions, we may expose ourselves to risks associated with such transactions. We may utilize instruments such as forward contracts, currency options and interest rate swaps, caps, collars and floors to seek to hedge against fluctuations in the relative values of our portfolio positions from changes in currency exchange rates and market interest rates. Hedging against a decline in the values of our portfolio positions does not eliminate the possibility of fluctuations in the values of such positions or prevent losses if the values of such positions decline. However, such hedging can establish other positions designed to gain from those same developments, thereby offsetting the decline in the value of such portfolio positions. Such hedging transactions may also limit the opportunity for gain if the values of the portfolio positions should increase. Moreover, it may not be possible to hedge against an exchange rate or interest rate fluctuation that is so generally anticipated that we are not able to enter into a hedging transaction at an acceptable price. Furthermore, our ability to engage in hedging transactions may also be adversely affected by rules adopted by the U.S. Commodity Futures Trading Commission.
43
The success of our hedging transactions depends on our ability to correctly predict movements, currencies and interest rates. Therefore, while we may enter into such transactions to seek to reduce currency exchange rate and interest rate risks, unanticipated changes in currency exchange rates or interest rates may result in poorer overall investment performance than if we had not engaged in any such hedging transactions. The degree of correlation between price movements of the instruments used in a hedging strategy and price movements in the portfolio positions being hedged may vary. Moreover, for a variety of reasons, we may not seek to establish a perfect correlation between such hedging instruments and the portfolio holdings being hedged. Any such imperfect correlation may prevent us from achieving the intended hedge and expose us to risk of loss. In addition, it may not be possible to hedge fully or perfectly against currency fluctuations affecting the value of securities denominated in non-U.S. currencies. We have no current intention of engaging in any of the hedging transaction described above, although it reserves the right to do so in the future.
Our Board of Directors may change our operating policies and strategies without prior notice or stockholder approval, the effects of which may be adverse to us and could impair the value of our stockholders’ investment.
Our Board of Directors has the authority to modify or waive our current operating policies and our strategies without prior notice and without stockholder approval. We cannot predict the effect any changes to our current operating policies and strategies would have on our business, financial condition, and value of our common stock. However, the effects might be adverse, which could negatively impact our ability to pay dividends and cause stockholders to lose all or part of their investment.
Our investments in CLOs may be riskier and less transparent to us and our stockholders than direct investments in the underlying companies.
We invest in CLOs. Generally, there may be less information available to us regarding the underlying debt investments held by CLOs than if we had invested directly in the debt of the underlying companies. As a result, our stockholders will not know the details of the underlying securities of the CLOs in which we will invest. Our CLO investments are subject to the risk of leverage associated with the debt issued by such CLOs and the repayment priority of senior debt holders in such CLOs. Our investments in portfolio companies may be risky, and we could lose all or part of our investment.
CLOs typically will have no significant assets other than their underlying senior secured loans; payments on CLO investments are and will be payable solely from the cash flows from such senior secured loans.
CLOs typically will have no significant assets other than their underlying senior secured loans. Accordingly, payments on CLO investments are and will be payable solely from the cash flows from such senior secured loans, net of all management fees and other expenses. Payments to us as a holder of CLO junior securities are and will be made only after payments due on the senior secured notes, and, where appropriate, the junior secured notes, have been made in full. This means that relatively small numbers of defaults of senior secured loans may adversely impact our returns.
Our CLO investments are exposed to leveraged credit risk.
Generally, we are in a subordinated position with respect to realized losses on the senior secured loans underlying our investments in CLOs. The leveraged nature of CLOs, in particular, magnifies the adverse impact of senior secured loan defaults. CLO investments represent a leveraged investment with respect to the underlying senior secured loans. Therefore, changes in the market value of the CLO investments could be greater than the change in the market value of the underlying senior secured loans, which are subject to credit, liquidity and interest rate risk.
There is the potential for interruption and deferral of cash flow from CLO investments.
If certain minimum collateral value ratios and/or interest coverage ratios are not met by a CLO, primarily due to senior secured loan defaults, then cash flow that otherwise would have been available to pay distributions to us on our CLO investments may instead be used to redeem any senior notes or to purchase additional senior secured loans, until the ratios again exceed the minimum required levels or any senior notes are repaid in full. This could result in an elimination, reduction or deferral in the distribution and/or principal paid to the holders of the CLO investments, which would adversely impact our returns.
44
Investments in foreign securities may involve significant risks in addition to the risks inherent in U.S. investments.
Our CLO investment strategy allows investments in foreign CLOs. Investing in foreign entities may expose us to additional risks not typically associated with investing in U.S. issuers. These risks include changes in exchange control regulations, political and social instability, expropriation, imposition of foreign taxes, less liquid markets and less available information than is generally the case in the United States, higher transaction costs, less government supervision of exchanges, brokers and issuers, less developed bankruptcy laws, difficulty in enforcing contractual obligations, lack of uniform accounting and auditing standards and greater price volatility. Further, we, and the CLOs in which we invest, may have difficulty enforcing creditor’s rights in foreign jurisdictions. In addition, the underlying companies of the CLOs in which we invest may be foreign, which may create greater exposure for us to foreign economic developments.
The payment of underlying portfolio manager fees and other charges on CLO investments could adversely impact our returns.
We may invest in CLO investments where the underlying portfolio securities may be subject to management, administration and incentive or performance fees, in addition to those payable by us. Payment of such additional fees could adversely impact the returns we achieve.
The inability of a CLO collateral manager to reinvest the proceeds of the prepayment of senior secured loans may adversely affect us.
There can be no assurance that for any CLO investment, in the event that any of the senior secured loans of a CLO underlying such investment are prepaid, the CLO collateral manager will be able to reinvest such proceeds in new senior secured loans with equivalent investment returns. If the CLO collateral manager cannot reinvest in new senior secured loans with equivalent investment returns, the interest proceeds available to pay interest on the rated liabilities and investments may be adversely affected.
Our CLO investments are subject to prepayments and calls, increasing re-investment risk.
Our CLO investments and/or the underlying senior secured loans may prepay more quickly than expected, which could have an adverse impact on our value. Prepayment rates are influenced by changes in interest rates and a variety of economic, geographic and other factors beyond our control and consequently cannot be predicted with certainty. In addition, for a CLO collateral manager there is often a strong incentive to refinance well performing portfolios once the senior tranches amortize. The yield to maturity of the investments will depend on the amount and timing of payments of principal on the loans and the price paid for the investments. Such yield may be adversely affected by a higher or lower than anticipated rate of prepayments of the debt.
Furthermore, our CLO investments generally do not contain optional call provisions, other than a call at the option of the holders of the equity tranches for the senior notes and the junior secured notes to be paid in full after the expiration of an initial period in the deal (referred to as the “non-call period”).
The exercise of the call option is by the relevant percentage (usually a majority) of the holders of the equity tranches and, therefore, where we do not hold the relevant percentage we will not be able to control the timing of the exercise of the call option. The equity tranches also generally have a call at any time based on certain tax event triggers. In any event, the call can only be exercised by the holders of equity tranches if they can demonstrate (in accordance with the detailed provisions in the transaction) that the senior notes and junior secured notes will be paid in full if the call is exercised.
Early prepayments and/or the exercise of a call option otherwise than at our request may also give rise to increased re-investment risk with respect to certain investments, as we may realize excess cash earlier than expected. If we are unable to reinvest such cash in a new investment with an expected rate of return at least equal to that of the investment repaid, this may reduce our net income and, consequently, could have an adverse impact on our ability to pay dividends.
We have limited control of the administration and amendment of senior secured loans owned by the CLOs in which we invest.
We are not able to directly enforce any rights and remedies in the event of a default of a senior secured loan held by a CLO vehicle. In addition, the terms and conditions of the senior secured loans underlying our CLO investments may be amended, modified or waived only by the agreement of the underlying lenders. Generally, any such agreement must include a majority or a super majority (measured by outstanding loans or commitments) or, in certain circumstances, a unanimous vote of the lenders. Consequently, the terms and conditions of the payment obligations arising from senior secured loans could be modified, amended or waived in a manner contrary to our preferences.
45
We have limited control of the administration and amendment of any CLO in which we invest.
The terms and conditions of target securities may be amended, modified or waived only by the agreement of the underlying security holders. Generally, any such agreement must include a majority or a super majority (measured by outstanding amounts) or, in certain circumstances, a unanimous vote of the security holders. Consequently, the terms and conditions of the payment obligation arising from the CLOs in which we invest be modified, amended or waived in a manner contrary to our preferences.
Senior secured loans of CLOs may be sold and replaced resulting in a loss to us.
The senior secured loans underlying our CLO investments may be sold and replacement collateral purchased within the parameters set out in the relevant CLO indenture between the CLO and the CLO trustee and those parameters may typically only be amended, modified or waived by the agreement of a majority of the holders of the senior notes and/or the junior secured notes and/or the equity tranche once the CLO has been established. If these transactions result in a net loss, the magnitude of the loss from the perspective of the equity tranche would be increased by the leveraged nature of the investment.
Our financial results may be affected adversely if one or more of our significant equity or junior debt investments in a CLO vehicle defaults on its payment obligations or fails to perform as we expect.
We expect that a majority of our portfolio will consist of equity and junior debt investments in CLOs, which involve a number of significant risks. CLOs are typically highly levered up to approximately 10 times, and therefore the junior debt and equity tranches that we will invest in are subject to a higher risk of total loss. In particular, investors in CLOs indirectly bear risks of the underlying debt investments held by such CLOs. We will generally have the right to receive payments only from the CLOs, and will generally not have direct rights against the underlying borrowers or the entities that sponsored the CLOs. Although it is difficult to predict whether the prices of indices and securities underlying CLOs will rise or fall, these prices, and, therefore, the prices of the CLOs will be influenced by the same types of political and economic events that affect issuers of securities and capital markets generally.
The investments we make in CLOs are thinly traded or have only a limited trading market. CLO investments are typically privately offered and sold, in the primary and secondary markets. As a result, investments in CLOs may be characterized as illiquid securities. In addition to the general risks associated with investing in debt securities, CLOs carry additional risks, including, but not limited to: (i) the possibility that distributions from the underlying senior secured loans will not be adequate to make interest or other payments; (ii) the quality of the underlying senior secured loans may decline in value or default; and (iii) the complex structure of the security may not be fully understood at the time of investment and may produce disputes with the CLO or unexpected investment results. Further, our investments in equity and junior debt tranches of CLOs are subordinate to the senior debt tranches thereof.
Investments in structured vehicles, including equity and junior debt instruments issued by CLOs, involve risks, including credit risk and market risk. Changes in interest rates and credit quality may cause significant price fluctuations. Additionally, changes in the underlying senior secured loans held by a CLO may cause payments on the instruments we hold to be reduced, either temporarily or permanently. Structured investments, particularly the subordinated interests in which we invest, are less liquid than many other types of securities and may be more volatile than the senior secured loans underlying the CLOs in which we invest.
Non-investment grade debt involves a greater risk of default and higher price volatility than investment grade debt.
The senior secured loans underlying our CLO investments typically are BB or B rated (non-investment grade) and in limited circumstances, unrated, senior secured loans. Non-investment grade securities are predominantly speculative with respect to the issuer’s capacity to pay interest and repay principal when due and therefore involve a greater risk of default and higher price volatility than investment grade debt.
We will have no influence on management of underlying investments managed by non-affiliated third party CLO collateral managers.
We are not responsible for and have no influence over the asset management of the portfolios underlying the CLO investments we hold as those portfolios are managed by non-affiliated third party CLO collateral managers. Similarly, we are not responsible for and have no influence over the day-to-day management, administration or any other aspect of the issuers of the individual securities. As a result, the values of the portfolios underlying our CLO investments could decrease as a result of decisions made by third party CLO collateral managers.
46
The Volcker Rule may impact how we operate our business.
Section 13 of the Bank Holding Company Act of 1956, as amended, often referred to as the “Volcker Rule,” is expected to impose significant restrictions on banking entities’ ability to sponsor or invest in hedge funds, private equity funds or commodity pools, collectively referred to as covered funds. Certain CLOs will be considered covered funds under the Volcker Rule and banking entities’ investments in such CLOs may be considered ownership interests that are prohibited. The rules are highly complex, and many aspects of the implementation of the Volcker Rule remain unclear. We are in the process of assessing the impact of the Volcker Rule on our investments, CLOs and on our industry. The Volcker Rule may have a material adverse effect on our ability to invest in bank-sponsored CLOs in the future and therefore may adversely affect our share price.
Risks affecting investments in real estate.
We make investments in commercial and multi-family residential real estate through our three wholly-owned real estate investment trusts (“REITs”), American Property REIT Corp., National Property REIT Corp. and United Property REIT Corp. (collectively, “our REITs”). A number of factors may prevent each of our REITs’ properties and assets from generating sufficient net cash flow or may adversely affect their value, or both, resulting in less cash available for distribution, or a loss, to us. These factors include:
• | national economic conditions; |
• | regional and local economic conditions (which may be adversely impacted by plant closings, business layoffs, industry slow-downs, weather conditions, natural disasters, and other factors); |
• | local real estate conditions (such as over-supply of or insufficient demand for office space); |
• | changing demographics; |
• | perceptions by prospective tenants of the convenience, services, safety, and attractiveness of a property; |
• | the ability of property managers to provide capable management and adequate maintenance; |
• | the quality of a property’s construction and design; |
• | increases in costs of maintenance, insurance, and operations (including energy costs and real estate taxes); |
• | changes in applicable laws or regulations (including tax laws, zoning laws, or building codes); |
• | potential environmental and other legal liabilities; |
• | the level of financing used by our REITs in respect of their properties, increases in interest rate levels on such financings and the risk that one of our REITs will default on such financings, each of which increases the risk of loss to us; |
• | the availability and cost of refinancing; |
• | the ability to find suitable tenants for a property and to replace any departing tenants with new tenants; |
• | potential instability, default or bankruptcy of tenants in the properties owned by our REITs; |
• | potential limited number of prospective buyers interested in purchasing a property that one of our REITs wishes to sell; and |
• | the relative illiquidity of real estate investments in general, which may make it difficult to sell a property at an attractive price or within a reasonable time frame. |
47
To the extent OID and PIK interest constitute a portion of our income, we will be exposed to typical risks associated with such income being required to be included in taxable and accounting income prior to receipt of cash representing such income.
Our investments may include original issue discount, or OID, instruments and payment in kind, or PIK, interest arrangements, which represents contractual interest added to a loan balance and due at the end of such loan’s term. To the extent OID or PIK interest constitute a portion of our income, we are exposed to typical risks associated with such income being required to be included in taxable and accounting income prior to receipt of cash, including the following:
• | The higher interest rates of OID and PIK instruments reflect the payment deferral and increased credit risk associated with these instruments, and OID and PIK instruments generally represent a significantly higher credit risk than coupon loans. |
• | Even if the accounting conditions for income accrual are met, the borrower could still default when our actual collection is supposed to occur at the maturity of the obligation. |
• | OID and PIK instruments may have unreliable valuations because their continuing accruals require continuing judgments about the collectibility of the deferred payments and the value of any associated collateral. OID and PIK income may also create uncertainty about the source of our cash distributions. |
For accounting purposes, any cash distributions to shareholders representing OID and PIK income are not treated as coming from paid-in capital, even if the cash to pay them comes from offering proceeds. As a result, despite the fact that a distribution representing OID and PIK income could be paid out of amounts invested by our stockholders, the 1940 Act does not require that stockholders be given notice of this fact by reporting it as a return of capital.
Risks Relating to Our Securities
Our credit ratings may not reflect all risks of an investment in our debt securities.
Our credit ratings are an assessment by third parties of our ability to pay our obligations. Consequently, real or anticipated changes in our credit ratings will generally affect the market value of our debt securities. Our credit ratings, however, may not reflect the potential impact of risks related to market conditions generally or other factors discussed above on the market value of or trading market for the publicly issued debt securities.
Senior securities, including debt, expose us to additional risks, including the typical risks associated with leverage and could adversely affect our business, financial condition and results of operations.
We currently use our revolving credit facility to leverage our portfolio and we expect in the future to borrow from and issue senior debt securities to banks and other lenders and may securitize certain of our portfolio investments. We also have the Senior Notes outstanding, which are a form of leverage and are senior in payment rights to our common stock.
With certain limited exceptions, as a BDC, we are only allowed to borrow amounts or otherwise issue senior securities such that our asset coverage, as defined in the 1940 Act, is at least 200% after such borrowing or other issuance. The amount of leverage that we employ will depend on the Investment Adviser’s and our Board of Directors’ assessment of market conditions and other factors at the time of any proposed borrowing. There is no assurance that a leveraging strategy will be successful. Leverage involves risks and special considerations for stockholders, any of which could adversely affect our business, financial condition and results of operations, including the following:
• | A likelihood of greater volatility in the net asset value and market price of our common stock; |
• | Diminished operating flexibility as a result of asset coverage or investment portfolio composition requirements required by lenders or investors that are more stringent than those imposed by the 1940 Act; |
• | The possibility that investments will have to be liquidated at less than full value or at inopportune times to comply with debt covenants or to pay interest or dividends on the leverage; |
• | Increased operating expenses due to the cost of leverage, including issuance and servicing costs; |
• | Convertible or exchangeable securities, such as the Convertible Notes outstanding or those issued in the future may have rights, preferences and privileges more favorable than those of our common stock; |
48
• | Subordination to lenders’ superior claims on our assets as a result of which lenders will be able to receive proceeds available in the case of our liquidation before any proceeds will be distributed to our stockholders; |
• | Making it more difficult for us to meet our payment and other obligations under the Senior Notes and our other outstanding debt; |
• | The occurrence of an event of default if we fail to comply with the financial and/or other restrictive covenants contained in our debt agreements, including the credit agreement and each indenture governing the Senior Notes, which event of default could result in all or some of our debt becoming immediately due and payable; |
• | Reduced availability of our cash flow to fund investments, acquisitions and other general corporate purposes, and limiting our ability to obtain additional financing for these purposes; |
• | The risk of increased sensitivity to interest rate increases on our indebtedness with variable interest rates, including borrowings under our amended senior credit facility; and |
• | Reduced flexibility in planning for, or reacting to, and increasing our vulnerability to, changes in our business, the industry in which we operate and the general economy. |
For example, the amount we may borrow under our revolving credit facility is determined, in part, by the fair value of our investments. If the fair value of our investments declines, we may be forced to sell investments at a loss to maintain compliance with our borrowing limits. Other debt facilities we may enter into in the future may contain similar provisions. Any such forced sales would reduce our net asset value and also make it difficult for the net asset value to recover. The Investment Adviser and our Board of Directors in their best judgment nevertheless may determine to use leverage if they expect that the benefits to our stockholders of maintaining the leveraged position will outweigh the risks.
In addition, our ability to meet our payment and other obligations of the Senior Notes and our credit facility depends on our ability to generate significant cash flow in the future. This, to some extent, is subject to general economic, financial, competitive, legislative and regulatory factors as well as other factors that are beyond our control. We cannot assure you that our business will generate cash flow from operations, or that future borrowings will be available to us under our existing credit facility or otherwise, in an amount sufficient to enable us to meet our payment obligations under the Senior Notes and our other debt and to fund other liquidity needs. If we are not able to generate sufficient cash flow to service our debt obligations, we may need to refinance or restructure our debt, including the Senior Notes, sell assets, reduce or delay capital investments, or seek to raise additional capital. If we are unable to implement one or more of these alternatives, we may not be able to meet our payment obligations under the Senior Notes and our other debt.
Illustration. The following table illustrates the effect of leverage on returns from an investment in our common stock assuming various annual returns, net of interest expense. The calculations in the table below are hypothetical and actual returns may be higher or lower than those appearing below. The calculation assumes (i) $6.8 billion in total assets, (ii) an average cost of funds of 5.02%, (iii) $3.0 billion in debt outstanding and (iv) $3.8 billion of shareholders’ equity.
Assumed Return on Our Portfolio (net of expenses) | (10 | )% | (5 | )% | 0 | % | 5 | % | 10 | % | |||||
Corresponding Return to Stockholder | (21.9 | )% | (12.9 | )% | (4.0 | )% | 5.0 | % | 13.9 | % | |||||
The assumed portfolio return is required by regulation of the SEC and is not a prediction of, and does not represent, our projected or actual performance. Actual returns may be greater or less than those appearing in the table.
The Convertible Notes and the Public Notes present other risks to holders of our common stock, including the possibility that such notes could discourage an acquisition of us by a third party and accounting uncertainty.
Certain provisions of the Convertible Notes and the Public Notes could make it more difficult or more expensive for a third party to acquire us. Upon the occurrence of certain transactions constituting a fundamental change, holders of the Convertible Notes and the Public Notes will have the right, at their option, to require us to repurchase all of their notes or any portion of the principal amount of such notes in integral multiples of $1,000. We may also be required to increase the conversion rate or provide for conversion into the acquirer’s capital stock in the event of certain fundamental changes with respect to the Convertible Notes. These provisions could discourage an acquisition of us by a third party.
The accounting for convertible debt securities is subject to frequent scrutiny by the accounting regulatory bodies and is subject to change. We cannot predict if or when any such change could be made and any such change could have an adverse impact on our reported or future financial results. Any such impacts could adversely affect the market price of our common stock.
49
We may in the future determine to fund a portion of our investments with preferred stock, which would magnify the potential for gain or loss and the risks of investing in us in the same way as our borrowings.
Preferred stock, which is another form of leverage, has the same risks to our common stockholders as borrowings because the dividends on any preferred stock we issue must be cumulative. Payment of such dividends and repayment of the liquidation preference of such preferred stock must take preference over any dividends or other payments to our common stockholders, and preferred stockholders are not subject to any of our expenses or losses and are not entitled to participate in any income or appreciation in excess of their stated preference.
Holders of any preferred stock we might issue would have the right to elect members of the board of directors and class voting rights on certain matters.
Holders of any preferred stock we might issue, voting separately as a single class, would have the right to elect two members of the board of directors at all times and in the event dividends become two full years in arrears would have the right to elect a majority of the directors until such arrearage is completely eliminated. In addition, preferred stockholders have class voting rights on certain matters, including changes in fundamental investment restrictions and conversion to open-end status, and accordingly can veto any such changes. Restrictions imposed on the declarations and payment of dividends or other distributions to the holders of our common stock and preferred stock, both by the 1940 Act and by requirements imposed by rating agencies or the terms of our credit facilities, might impair our ability to maintain our qualification as a RIC for federal income tax purposes. While we would intend to redeem our preferred stock to the extent necessary to enable us to distribute our income as required to maintain our qualification as a RIC, there can be no assurance that such actions could be effected in time to meet the tax requirements.
In addition to regulatory restrictions that restrict our ability to raise capital, our credit facility contains various covenants which, if not complied with, could accelerate repayment under the facility, thereby materially and adversely affecting our liquidity, financial condition and results of operations.
The agreement governing our credit facility requires us to comply with certain financial and operational covenants. These covenants include:
• | Restrictions on the level of indebtedness that we are permitted to incur in relation to the value of our assets; |
• | Restrictions on our ability to incur liens; and |
• | Maintenance of a minimum level of stockholders’ equity. |
As of June 30, 2015, we were in compliance with these covenants. However, our continued compliance with these covenants depends on many factors, some of which are beyond our control. Accordingly, there are no assurances that we will continue to comply with the covenants in our credit facility. Failure to comply with these covenants would result in a default under this facility which, if we were unable to obtain a waiver from the lenders thereunder, could result in an acceleration of repayments under the facility and thereby have a material adverse impact on our business, financial condition and results of operations.
Failure to extend our existing credit facility, the revolving period of which is currently scheduled to expire on March 27, 2019, could have a material adverse effect on our results of operations and financial position and our ability to pay expenses and make distributions.
The revolving period for our credit facility with a syndicate of lenders is currently scheduled to terminate on March 27, 2019, with an additional one year amortization period (with distributions allowed) after the completion of the revolving period. During such one year amortization period, all principal payments on the pledged assets will be applied to reduce the balance. At the end of the one year amortization period, the remaining balance will become due, if required by the lenders. If the credit facility is not renewed or extended by the participant banks by March 27, 2019, we will not be able to make further borrowings under the facility after such date and the outstanding principal balance on that date will be due and payable on March 27, 2020. As of June 30, 2015, we had $368.7 million of outstanding borrowings under our credit facility. Interest on borrowings under the credit facility is one-month LIBOR plus 225 basis points with no minimum LIBOR floor. Additionally, the lenders charge a fee on the unused portion of the credit facility equal to either 50 basis points if at least 35% of the credit facility is drawn or 100 basis points otherwise.
50
The credit facility requires us to pledge assets as collateral in order to borrow under the credit facility. If we are unable to extend our facility or find a new source of borrowing on acceptable terms, we will be required to pay down the amounts outstanding under the facility during the two-year term-out period through one or more of the following: (1) principal collections on our securities pledged under the facility, (2) at our option, interest collections on our securities pledged under the facility and cash collections on our securities not pledged under the facility, or (3) possible liquidation of some or all of our loans and other assets, any of which could have a material adverse effect on our results of operations and financial position and may force us to decrease or stop paying certain expenses and making distributions until the facility is repaid. In addition, our stock price could decline significantly, we would be restricted in our ability to acquire new investments and, in connection with our year-end audit, our independent registered accounting firm could raise an issue as to our ability to continue as a going concern.
Failure to refinance our existing Unsecured Notes could have a material adverse effect on our results of operations and financial position.
The Unsecured Notes mature at various dates from December 15, 2015 to October 15, 2043. If we are unable to refinance the Unsecured Notes or find a new source of borrowing on acceptable terms, we will be required to pay down the amounts outstanding at maturity under the facility during the two-year term-out period through one or more of the following: (1) borrowing additional funds under our then current credit facility, (2) issuance of additional common stock or (3) possible liquidation of some or all of our loans and other assets, any of which could have a material adverse effect on our results of operations and financial position. In addition, our stock price could decline significantly; we would be restricted in our ability to acquire new investments and, in connection with our year-end audit, our independent registered accounting firm could raise an issue as to our ability to continue as a going concern.
The trading market or market value of our publicly issued debt securities may fluctuate.
Our publicly issued debt securities may or may not have an established trading market. We cannot assure our noteholders that a trading market for our publicly issued debt securities will ever develop or be maintained if developed. In addition to our creditworthiness, many factors may materially adversely affect the trading market for, and market value of, our publicly issued debt securities. These factors include, but are not limited to, the following:
• | the time remaining to the maturity of these debt securities; |
• | the outstanding principal amount of debt securities with terms identical to these debt securities; |
• | the ratings assigned by national statistical ratings agencies; |
• | the general economic environment; |
• | the supply of debt securities trading in the secondary market, if any; |
• | the redemption or repayment features, if any, of these debt securities; |
• | the level, direction and volatility of market interest rates generally; and |
• | market rates of interest higher or lower than rates borne by the debt securities. |
Our noteholders should also be aware that there may be a limited number of buyers when they decide to sell their debt securities. This too may materially adversely affect the market value of the debt securities or the trading market for the debt securities.
Terms relating to redemption may materially adversely affect our noteholders return on any debt securities that we may issue.
If our noteholders’ debt securities are redeemable at our option, we may choose to redeem their debt securities at times when prevailing interest rates are lower than the interest rate paid on their debt securities. In addition, if our noteholders’ debt securities are subject to mandatory redemption, we may be required to redeem their debt securities also at times when prevailing interest rates are lower than the interest rate paid on their debt securities. In this circumstance, our noteholders may not be able to reinvest the redemption proceeds in a comparable security at an effective interest rate as high as their debt securities being redeemed.
51
Our shares of common stock currently trade at a discount from net asset value and may continue to do so in the future, which could limit our ability to raise additional equity capital.
Shares of closed-end investment companies frequently trade at a market price that is less than the net asset value that is attributable to those shares. This characteristic of closed-end investment companies is separate and distinct from the risk that our net asset value per share may decline. It is not possible to predict whether any shares of our common stock will trade at, above, or below net asset value. The stocks of BDCs as an industry, including shares of our common stock, currently trade below net asset value as a result of concerns over liquidity, interest rate changes, leverage restrictions and distribution requirements. When our common stock is trading below its net asset value per share, we will not be able to issue additional shares of our common stock at its market price without first obtaining approval for such issuance from our stockholders and our independent directors. At our 2014 annual meeting of stockholders held on December 5, 2014, our stockholders approved our ability, subject to the condition that the maximum number of shares salable below net asset value pursuant to this authority in any particular offering that could result in such dilution is limited to 25% of our then outstanding common stock immediately prior to each such offering, to sell shares of our common stock at any level of discount from net asset value per share during the 12 month period following December 5, 2014.
There is a risk that investors in our common stock may not receive dividends or that our dividends may not grow over time and investors in our debt securities may not receive all of the interest income to which they are entitled.
We intend to make distributions on a quarterly basis to our stockholders out of assets legally available for distribution. We cannot assure you that we will achieve investment results that will allow us to make a specified level of cash distributions or year-to-year increases in cash distributions. If we declare a dividend and if more stockholders opt to receive cash distributions rather than participate in our dividend reinvestment plan, we may be forced to sell some of our investments in order to make cash dividend payments.
In addition, due to the asset coverage test applicable to us as a BDC, we may be limited in our ability to make distributions. Further, if we invest a greater amount of assets in equity securities that do not pay current dividends, it could reduce the amount available for distribution.
The above-referenced restrictions on distributions may also inhibit our ability to make required interest payments to holders of our debt, which may cause a default under the terms of our debt agreements. Such a default could materially increase our cost of raising capital, as well as cause us to incur penalties under the terms of our debt agreements.
Investing in our securities may involve a high degree of risk and is highly speculative.
The investments we make in accordance with our investment objective may result in a higher amount of risk than alternative investment options and volatility or loss of principal. Our investments in portfolio companies may be speculative and aggressive, and therefore, an investment in our shares may not be suitable for someone with low risk tolerance.
Our stockholders will experience dilution in their ownership percentage if they opt out of our dividend reinvestment plan.
All dividends declared in cash payable to stockholders that are participants in our dividend reinvestment plan are automatically reinvested in shares of our common stock. As a result, our stockholders that opt out of our dividend reinvestment plan will experience dilution in their ownership percentage of our common stock over time.
Sales of substantial amounts of our common stock in the public market may have an adverse effect on the market price of our common stock.
Sales of substantial amounts of our common stock, or the availability of such common stock for sale (including as a result of the conversion of the Convertible Notes into common stock), could adversely affect the prevailing market prices for our common stock. If this occurs and continues, it could impair our ability to raise additional capital through the sale of securities should we desire to do so.
52
If we sell shares of our common stock or securities to subscribe for or are convertible into shares of our common stock at a discount to our net asset value per share, stockholders who do not participate in such sale will experience immediate dilution in an amount that may be material.
At our 2014 annual meeting of stockholders held on December 5, 2014, our stockholders approved our ability, subject to the condition that the maximum number of shares salable below net asset value pursuant to this authority in any particular offering that could result in such dilution is limited to 25% of our then outstanding common stock immediately prior to each such offering, to sell shares of our common stock at any level of discount from net asset value per share during the 12 month period following December 5, 2014. The issuance or sale by us of shares of our common stock or securities to subscribe for or are convertible into shares of our common stock at a discount to net asset value poses a risk of dilution to our stockholders. In particular, stockholders who do not purchase additional shares of common stock at or below the discounted price in proportion to their current ownership will experience an immediate decrease in net asset value per share (as well as in the aggregate net asset value of their shares of common stock if they do not participate at all). These stockholders will also experience a disproportionately greater decrease in their participation in our earnings and assets and their voting power than the increase we experience in our assets, potential earning power and voting interests from such issuance or sale. In addition, such sales may adversely affect the price at which our common stock trades. We have sold shares of our common stock at prices below net asset value per share in the past and may do so to the future. We have not issued any shares of our common stock at prices below net asset value per share since December 3, 2014.
Our ability to enter into transactions with our affiliates is restricted.
We are prohibited under the 1940 Act from knowingly participating in certain transactions with our affiliates without the prior approval of our independent directors. Any person that owns, directly or indirectly, 5% or more of our outstanding voting securities is our affiliate for purposes of the 1940 Act and we are generally prohibited from buying or selling any security or other property from or to such affiliate, absent the prior approval of our independent directors. The 1940 Act also prohibits “joint” transactions with an affiliate, which could include investments in the same portfolio company (whether at the same or different times), without prior approval of our independent directors. Subject to certain limited exceptions, we are prohibited from buying or selling any security or other property from or to the Investment Adviser and its affiliates and persons with whom we are in a control relationship, or entering into joint transactions with any such person, absent the prior approval of the SEC.
On February 10, 2014, we received an exemptive order from the SEC (the “Order”) that gave us the ability to negotiate terms other than price and quantity of co-investment transactions with other funds managed by the Investment Adviser or certain affiliates, including Priority Income Fund, Inc. and Pathway Energy Infrastructure Fund, Inc., subject to the conditions included therein. Under the terms of the relief permitting us to co-invest with other funds managed by our Investment Adviser or its affiliates, a “required majority” (as defined in Section 57(o) of the 1940 Act) of our independent directors must make certain conclusions in connection with a co-investment transaction, including that (1) the terms of the proposed transaction, including the consideration to be paid, are reasonable and fair to us and our stockholders and do not involve overreaching of us or our stockholders on the part of any person concerned and (2) the transaction is consistent with the interests of our stockholders and is consistent with our investment objective and strategies. In certain situations where co-investment with one or more funds managed by the Investment Adviser or its affiliates is not covered by the Order, such as when there is an opportunity to invest in different securities of the same issuer, the personnel of the Investment Adviser or its affiliates will need to decide which fund will proceed with the investment. Such personnel will make these determinations based on policies and procedures, which are designed to reasonably ensure that investment opportunities are allocated fairly and equitably among affiliated funds over time and in a manner that is consistent with applicable laws, rules and regulations. Moreover, except in certain circumstances, when relying on the Order, we will be unable to invest in any issuer in which one or more funds managed by the Investment Adviser or its affiliates has previously invested.
The market price of our securities may fluctuate significantly.
The market price and liquidity of the market for our securities may be significantly affected by numerous factors, some of which are beyond our control and may not be directly related to our operating performance. These factors include:
• | significant volatility in the market price and trading volume of securities of business development companies or other companies in the energy industry, which are not necessarily related to the operating performance of these companies; |
• | price and volume fluctuations in the overall stock market from time to time; |
• | changes in regulatory policies or tax guidelines, particularly with respect to RICs or business development companies; |
• | loss of RIC qualification; |
• | changes in earnings or variations in operating results; |
53
• | changes in the value of our portfolio of investments; |
• | any shortfall in revenue or net income or any increase in losses from levels expected by investors or securities analysts; |
• | departure of one or more of Prospect Capital Management’s key personnel; |
• | operating performance of companies comparable to us; |
• | short-selling pressure with respect to shares of our common stock or BDCs generally; |
• | future sales of our securities convertible into or exchangeable or exercisable for our common stock or the conversion of such securities, including the Convertible Notes; |
• | uncertainty surrounding the strength of the U.S. economic recovery; |
• | concerns regarding European sovereign debt; |
• | changes in prevailing interest rates; |
• | litigation matters; |
• | general economic trends and other external factors; and |
• | loss of a major funding source. |
In the past, following periods of volatility in the market price of a company’s securities, securities class action litigation has, from time to time, been brought against that company.
If our stock price fluctuates significantly, we may be the target of securities litigation in the future. Securities litigation could result in substantial costs and divert management’s attention and resources from our business.
There is a risk that you may not receive distributions or that our distributions may not grow over time.
We have made and intend to continue to make distributions on a monthly basis to our stockholders out of assets legally available for distribution. We cannot assure you that we will achieve investment results or maintain a tax status that will allow or require any specified level of cash distributions or year-to-year increases in cash distributions. In addition, due to the asset coverage test applicable to us as a business development company, we may be limited in our ability to make distributions.
Provisions of the Maryland General Corporation Law and of our charter and bylaws could deter takeover attempts and have an adverse impact on the price of our common stock.
Our charter and bylaws and the Maryland General Corporation Law contain provisions that may have the effect of delaying, deferring or preventing a transaction or a change in control that might involve a premium price for our stockholders or otherwise be in their best interest. These provisions may prevent stockholders from being able to sell shares of our common stock at a premium over the current of prevailing market prices.
Our charter provides for the classification of our Board of Directors into three classes of directors, serving staggered three-year terms, which may render a change of control or removal of our incumbent management more difficult. Furthermore, any and all vacancies on our Board of Directors will be filled generally only by the affirmative vote of a majority of the remaining directors in office, even if the remaining directors do not constitute a quorum, and any director elected to fill a vacancy will serve for the remainder of the full term until a successor is elected and qualifies.
Our Board of Directors is authorized to create and issue new series of shares, to classify or reclassify any unissued shares of stock into one or more classes or series, including preferred stock and, without stockholder approval, to amend our charter to increase or decrease the number of shares of common stock that we have authority to issue, which could have the effect of diluting a stockholder’s ownership interest. Prior to the issuance of shares of common stock of each class or series, including any reclassified series, our Board of Directors is required by our governing documents to set the terms, preferences, conversion or other rights, voting powers, restrictions, limitations as to dividends or other distributions, qualifications and terms or conditions of redemption for each class or series of shares of stock.
54
Our charter and bylaws also provide that our Board of Directors has the exclusive power to adopt, alter or repeal any provision of our bylaws, and to make new bylaws. The Maryland General Corporation Law also contains certain provisions that may limit the ability of a third party to acquire control of us, such as:
• | The Maryland Business Combination Act, which, subject to certain limitations, prohibits certain business combinations between us and an “interested stockholder” (defined generally as any person who beneficially owns 10% or more of the voting power of the common stock or an affiliate thereof) for five years after the most recent date on which the stockholder becomes an interested stockholder and, thereafter, imposes special minimum price provisions and special stockholder voting requirements on these combinations. |
• | The Maryland Control Share Acquisition Act, which provides that “control shares” of a Maryland corporation (defined as shares of common stock which, when aggregated with other shares of common stock controlled by the stockholder, entitles the stockholder to exercise one of three increasing ranges of voting power in electing directors, as described more fully below) acquired in a “control share acquisition” (defined as the direct or indirect acquisition of ownership or control of “control shares”) have no voting rights except to the extent approved by stockholders by the affirmative vote of at least two-thirds of all the votes entitled to be cast on the matter, excluding all interested shares of common stock. |
The provisions of the Maryland Business Combination Act will not apply, however, if our Board of Directors adopts a resolution that any business combination between us and any other person will be exempt from the provisions of the Maryland Business Combination Act. Our Board of Directors has adopted a resolution that any business combination between us and any other person is exempted from the provisions of the Maryland Business Combination Act, provided that the business combination is first approved by the Board of Directors, including a majority of the directors who are not interested persons as defined in the 1940 Act. There can be no assurance that this resolution will not be altered or repealed in whole or in part at any time. If the resolution is altered or repealed, the provisions of the Maryland Business Combination Act may discourage others from trying to acquire control of us.
As permitted by Maryland law, our bylaws contain a provision exempting from the Maryland Control Share Acquisition Act any and all acquisitions by any person of our common stock. Although our bylaws include such a provision, such a provision may also be amended or eliminated by our Board of Directors at any time in the future, provided that we will notify the Division of Investment Management at the SEC prior to amending or eliminating this provision. However, as noted above, the SEC has recently taken the position that the Maryland Control Share Acquisition Act is inconsistent with the 1940 Act and may not be invoked by a BDC. It is the view of the staff of the SEC that opting into the Maryland Control Share Acquisition Act would be acting in a manner inconsistent with section 18(i) of the 1940 Act.
Your interest in us may be diluted if you do not fully exercise your subscription rights in any rights offering. In addition, if the subscription price is less than our net asset value per share, then you will experience an immediate dilution of the aggregate net asset value of your shares.
In the event we issue subscription rights, stockholders who do not fully exercise their subscription rights should expect that they will, at the completion of a rights offering pursuant to this prospectus, own a smaller proportional interest in us than would otherwise be the case if they fully exercised their rights. We cannot state precisely the amount of any such dilution in share ownership because we do not know at this time what proportion of the shares will be purchased as a result of such rights offering.
In addition, if the subscription price is less than the net asset value per share of our common stock, then our stockholders would experience an immediate dilution of the aggregate net asset value of their shares as a result of the offering. The amount of any decrease in net asset value is not predictable because it is not known at this time what the subscription price and net asset value per share will be on the expiration date of a rights offering or what proportion of the shares will be purchased as a result of such rights offering. Such dilution could be substantial.
55
We may in the future choose to pay dividends in our own stock, in which case our stockholders may be required to pay tax in excess of the cash they receive.
We may distribute taxable dividends that are payable in part in our stock. The IRS has issued a private letter ruling on cash/stock dividends paid by us if certain requirements are satisfied, and the ruling permits us to declare such taxable cash/stock dividends, up to 80% in stock, with respect to our taxable years ending August 31, 2014 and August 31, 2015. We have filed an application for a similar private letter ruling for our taxable years ending August 31, 2016 and August 31, 2017. Taxable stockholders receiving such dividends would be required to include the full amount of the dividend as ordinary income (or as long-term capital gain to the extent such distribution is properly designated as a capital gain dividend) to the extent of our current and accumulated earnings and profits for United States federal income tax purposes. As a result, a U.S. Stockholder (as defined in “Material U.S. Federal Income Tax Considerations”) may be required to pay tax with respect to such dividends in excess of any cash received. If a U.S. Stockholder sells the stock it receives as a dividend in order to pay this tax, it may be subject to transaction fees (e.g., broker fees or transfer agent fees) and the sales proceeds may be less than the amount included in income with respect to the dividend, depending on the market price of its stock at the time of the sale. Furthermore, with respect to Non-U.S. Stockholders (as defined in “Material U.S. Federal Income Tax Considerations”), we may be required to withhold U.S. tax with respect to such dividends, including in respect of all or a portion of such dividend that is payable in stock. In addition, if a significant number of our stockholders determine to sell shares of our stock in order to pay taxes owed on dividends, it may put downward pressure on the trading price of our stock. It is unclear whether and to what extent we will be able to pay dividends in cash and our stock.
Item 1B. Unresolved Staff Comments
Not applicable.
Item 2. Properties
We do not own any real estate or other physical properties materially important to our operation. Our principal executive offices are located at 10 East 40th Street, New York, New York 10016, where we occupy our office space pursuant to our Administration Agreement with Prospect Administration. The office facilities, which are shared with the Investment Adviser and Administrator, consist of approximately 30,216 square feet, with various leases expiring up to and through 2023. We believe that our office facilities are suitable and adequate for our business as currently conducted.
Item 3. Legal Proceedings
From time to time, we may become involved in various investigations, claims and legal proceedings that arise in the ordinary course of our business. These matters may relate to intellectual property, employment, tax, regulation, contract or other matters. The resolution of such of these matters as may arise will be subject to various uncertainties and, even if such claims are without merit, could result in the expenditure of significant financial and managerial resources. We are not aware of any such litigation as of June 30, 2015.
Item 4. Mine Safety Disclosures
Not applicable.
56
PART II
Item 5. Market for Registrant’s Common Equity, Related Stockholder Matters and Issuer Purchases of Equity Securities
Our common stock is traded on the NASDAQ Global Select Market under the symbol “PSEC.”
The following table sets forth, for the quarterly reporting periods indicated, the net asset value per share of our common stock and the high and low sales prices for our common stock, as reported on the NASDAQ Global Select Market. Our common stock historically has traded at prices both above and below its net asset value. There can be no assurance, however, that such premium or discount, as applicable, to net asset value will be maintained. See also “Item 1A. Risk Factors” in Part I of this report for additional information about the risks and uncertainties we face.
Year Ended | Net Asset Value Per Share(1) | Sales Price | Premium (Discount) of High Sales Price to Net Asset Value | Premium (Discount) of Low Sales Price to Net Asset Value | ||||||||||||||
High | Low | |||||||||||||||||
June 30, 2014 | ||||||||||||||||||
First quarter | $ | 10.72 | $ | 11.61 | $ | 10.76 | 8.3 | % | 0.4 | % | ||||||||
Second quarter | 10.73 | 11.48 | 10.80 | 7.0 | % | 0.7 | % | |||||||||||
Third quarter | 10.68 | 11.39 | 10.73 | 6.6 | % | 0.5 | % | |||||||||||
Fourth quarter | 10.56 | 10.99 | 9.64 | 4.1 | % | (8.7 | %) | |||||||||||
June 30, 2015 | ||||||||||||||||||
First quarter | $ | 10.47 | $ | 11.00 | $ | 9.90 | 5.1 | % | (5.4 | %) | ||||||||
Second quarter | 10.35 | 9.92 | 8.11 | (4.2 | %) | (21.6 | %) | |||||||||||
Third quarter | 10.30 | 8.81 | 8.23 | (14.5 | %) | (20.1 | %) | |||||||||||
Fourth quarter | 10.31 | 8.65 | 7.22 | (16.1 | %) | (30.0 | %) | |||||||||||
(1) | Net asset value per share is determined as of the last day in the relevant quarter and therefore may not reflect the net asset value per share on the date of the high and low sales prices. The net asset values shown are based on outstanding shares at the end of the relevant quarter. |
As of August 25, 2015, there were 124 shareholders of record of our common stock. This figure does not include a substantially greater number of beneficial holders of our common stock, whose shares are held in the names of brokers, dealers and clearing agencies.
Distribution Policy
Through March 2010, we made quarterly distributions to our stockholders out of assets legally available for distribution. In June 2010, we changed our distribution policy from a quarterly payment to a monthly payment. To the extent prudent and practicable, we currently intend to continue making distributions on a monthly basis. Our ability to pay distributions could be affected by future business performance, liquidity, capital needs, alternative investment opportunities and loan covenants. Our distributions, if any, will be determined by our Board of Directors. Certain amounts of the monthly distributions may from time to time be paid out of our capital rather than from earnings for the quarter as a result of our deliberate planning or by accounting reclassifications.
As a RIC, we generally are not subject to U.S. federal income tax on income and gains we distribute each taxable year to our stockholders, provided that in such taxable year, we distribute an amount equal to at least 90% of our investment company taxable income (as defined by the Code) to our stockholders. Any undistributed taxable income is subject to U.S. federal income tax. In addition, we will be subject to a 4% non-deductible U.S. federal excise tax on certain undistributed income unless we distribute in a timely manner an amount at least equal to the sum of (i) 98% of our ordinary income recognized during the calendar year, (ii) 98.2% of our capital gain net income, as defined by the Code, recognized for the one year period ending October 31 in that calendar year and (iii) any income recognized, but not distributed, in preceding years.
We had an excise tax liability of $461 for the calendar year ended December 31, 2014. Through June 30, 2015, we have an accrued excise tax payable of $305. Tax characteristics of all distributions will be reported to stockholders, as appropriate, on Form 1099-DIV after the end of the calendar year.
57
In addition, although we currently intend to distribute realized net capital gains (which we define as net long-term capital gains in excess of short-term capital losses), if any, at least annually out of the assets legally available for such distributions, we may decide in the future to retain such capital gains for investment. In such event, the consequences of our retention of net capital gains are described under “Material U.S. Federal Income Tax Considerations.” We can offer no assurance that we will achieve results that will permit the payment of any cash distributions and, if we issue senior securities, we may be prohibited from making distributions if doing so causes us to fail to maintain the asset coverage ratios stipulated by the 1940 Act or if distributions are limited by the terms of any of our borrowings.
During the years ended June 30, 2015 and June 30, 2014, we distributed approximately $421.6 million and $403.2 million, respectively, to our stockholders. The following table summarizes our distributions declared and payable for the years ended June 30, 2014 and June 30, 2015.
Declaration Date | Record Date | Payment Date | Amount Per Share | Amount Distributed (in thousands) | ||||||||
5/6/2013 | 7/31/2013 | 8/22/2013 | $ | 0.110175 | $ | 28,001 | ||||||
5/6/2013 | 8/30/2013 | 9/19/2013 | 0.110200 | 28,759 | ||||||||
6/17/2013 | 9/30/2013 | 10/24/2013 | 0.110225 | 29,915 | ||||||||
6/17/2013 | 10/31/2013 | 11/21/2013 | 0.110250 | 31,224 | ||||||||
6/17/2013 | 11/29/2013 | 12/19/2013 | 0.110275 | 32,189 | ||||||||
6/17/2013 | 12/31/2013 | 1/23/2014 | 0.110300 | 33,229 | ||||||||
8/21/2013 | 1/31/2014 | 2/20/2014 | 0.110325 | 34,239 | ||||||||
8/21/2013 | 2/28/2014 | 3/20/2014 | 0.110350 | 35,508 | ||||||||
8/21/2013 | 3/31/2014 | 4/17/2014 | 0.110375 | 36,810 | ||||||||
11/4/2013 | 4/30/2014 | 5/22/2014 | 0.110400 | 37,649 | ||||||||
11/4/2013 | 5/30/2014 | 6/19/2014 | 0.110425 | 37,822 | ||||||||
11/4/2013 | 6/30/2014 | 7/24/2014 | 0.110450 | 37,843 | ||||||||
Total declared and payable for the year ended June 30, 2014 | $ | 403,188 | ||||||||||
2/3/2014 | 7/31/2014 | 8/21/2014 | $ | 0.110475 | $ | 37,863 | ||||||
2/3/2014 | 8/29/2014 | 9/18/2014 | 0.110500 | 37,885 | ||||||||
2/3/2014 | 9/30/2014 | 10/22/2014 | 0.110525 | 38,519 | ||||||||
5/6/2014 | 10/31/2014 | 11/20/2014 | 0.110550 | 38,977 | ||||||||
5/6/2014 | 11/28/2014 | 12/18/2014 | 0.110575 | 39,583 | ||||||||
5/6/2014 | 12/31/2014 | 1/22/2015 | 0.110600 | 39,623 | ||||||||
9/24/2014 | 1/30/2015 | 2/19/2015 | 0.110625 | 39,648 | ||||||||
12/8/2014 | 2/27/2015 | 3/19/2015 | 0.083330 | 29,878 | ||||||||
12/8/2014 | 3/31/2015 | 4/23/2015 | 0.083330 | 29,887 | ||||||||
12/8/2014 | 4/30/2015 | 5/21/2015 | 0.083330 | 29,898 | ||||||||
5/6/2015 | 5/29/2015 | 6/18/2015 | 0.083330 | 29,910 | ||||||||
5/6/2015 | 6/30/2015 | 7/23/2015 | 0.083330 | 29,923 | ||||||||
Total declared and payable for the year ended June 30, 2015 | $ | 421,594 | ||||||||||
Dividends and distributions to common stockholders are recorded on the ex-dividend date. As such, the table above includes distributions with record dates during the years ended June 30, 2015 and June 30, 2014. It does not include distributions previously declared to stockholders of record on any future dates, as those amounts are not yet determinable. The following dividends were previously declared and will be payable subsequent to June 30, 2015:
• | $0.08333 per share for July 2015 to holders of record on July 31, 2015 with a payment date of August 20, 2015; |
• | $0.08333 per share for August 2015 to holders of record on August 31, 2015 with a payment date of September 17, 2015; |
• | $0.08333 per share for September 2015 to holders of record on September 30, 2015 with a payment date of October 22, 2015; and |
• | $0.08333 per share for October 2015 to holders of record on October 30, 2015 with a payment date of November 19, 2015. |
58
Dividend Reinvestment Plan
We maintain an “opt out” dividend reinvestment plan for our common stockholders. As a result, if we declare a distribution (as discussed above), stockholders’ cash distributions will be automatically reinvested in additional shares of our common stock, unless they specifically opt out of the dividend reinvestment plan so as to receive cash distributions. Stockholders who receive distributions in the form of stock are subject to the same U.S. federal, state and local tax consequences as are stockholders who elect to receive their distributions in cash. Stockholders are advised to consult with their brokers or financial institutions, as appropriate, with respect to the administration of their dividends and related instructions. See also “Dividend Reinvestment Plan” in Part I of this report for additional information.
We primarily use newly-issued shares to implement the plan, whether our shares are trading at a premium or at a discount to net asset value. However, we reserve the right to purchase shares in the open market in connection with the implementation of the plan. Our Board of Directors determines how the stock to be distributed as part of the plan is made available.
During the years ended June 30, 2015 and June 30, 2014, we distributed 1,618,566 and 1,408,070 shares of our common stock, respectively, in connection with the dividend reinvestment plan. All of the shares distributed were new issues. The following table summarizes the shares issued through the reinvestment of dividends in the years ended June 30, 2014 and June 30, 2015.
Record Date | Payment Date | Shares Issued | Value of Shares (in thousands) | % of Distribution | ||||||||
6/28/2013 | 7/18/2013 | 109,437 | $ | 1,208 | 4.4 | % | ||||||
7/31/2013 | 8/22/2013 | 113,610 | 1,246 | 4.4 | % | |||||||
8/30/2013 | 9/19/2013 | 132,597 | 1,540 | 5.4 | % | |||||||
9/30/2013 | 10/24/2013 | 135,212 | 1,548 | 5.2 | % | |||||||
10/31/2013 | 11/21/2013 | 206,586 | 2,343 | 7.5 | % | |||||||
11/29/2013 | 12/19/2013 | 106,620 | 1,208 | 3.8 | % | |||||||
12/31/2013 | 1/23/2014 | 109,087 | 1,237 | 3.7 | % | |||||||
1/31/2014 | 2/20/2014 | 88,112 | 995 | 2.9 | % | |||||||
2/28/2014 | 3/20/2014 | 93,735 | 1,011 | 2.8 | % | |||||||
3/31/2014 | 4/17/2014 | 86,333 | 938 | 2.5 | % | |||||||
4/30/2014 | 5/22/2014 | 114,111 | 1,132 | 3.0 | % | |||||||
5/30/2014 | 6/19/2014 | 112,630 | 1,168 | 3.1 | % | |||||||
Total issued in the year ended June 30, 2014 | 1,408,070 | $ | 15,574 | |||||||||
6/30/2014 | 7/24/2014 | 98,503 | $ | 1,074 | 2.8 | % | ||||||
7/31/2014 | 8/21/2014 | 129,435 | 1,412 | 3.7 | % | |||||||
8/29/2014 | 9/18/2014 | 113,020 | 1,154 | 3.0 | % | |||||||
9/30/2014 | 10/22/2014 | 138,721 | 1,346 | 3.5 | % | |||||||
10/31/2014 | 11/20/2014 | 136,076 | 1,314 | 3.4 | % | |||||||
11/28/2014 | 12/18/2014 | 162,173 | 1,370 | 3.5 | % | |||||||
12/31/2014 | 1/22/2015 | 151,538 | 1,279 | 3.2 | % | |||||||
1/30/2015 | 2/19/2015 | 146,186 | 1,279 | 3.2 | % | |||||||
2/27/2015 | 3/19/2015 | 113,596 | 971 | 3.2 | % | |||||||
3/31/2015 | 4/23/2015 | 131,971 | 1,140 | 3.8 | % | |||||||
4/30/2015 | 5/21/2015 | 137,878 | 1,122 | 3.8 | % | |||||||
5/29/2015 | 6/18/2015 | 159,469 | 1,220 | 4.1 | % | |||||||
Total issued in the year ended June 30, 2015 | 1,618,566 | $ | 14,681 | |||||||||
Registered stockholders who opt out of the dividend reinvestment plan must notify the plan administrator prior to the payment date in order for that distribution to be paid in cash. As such, the table above includes distributions with payment dates during the years ended June 30, 2015 and June 30, 2014. It does not include distributions previously declared and recorded as payable to stockholders on any future dates, as those amounts are not yet determinable.
59
Stock Performance Graph
The following graph compares a shareholder’s cumulative total return for the last five fiscal years as if such amounts had been invested in: (i) our common stock; (ii) the stocks included in the S&P 500 Index; (iii) the stocks included in the S&P 500 Financials Sector Index; and (iv) a customized BDC Peer Group composed of Apollo Investment Corporation, Ares Capital Corporation, BlackRock Capital Investment Corporation, Gladstone Capital Corporation, and MVC Capital, Inc. The graph is based on historical stock prices and measures total shareholder return, which takes into account both changes in stock price and dividends. The total return assumes that dividends were reinvested daily and is based on a $100 investment on June 30, 2010.
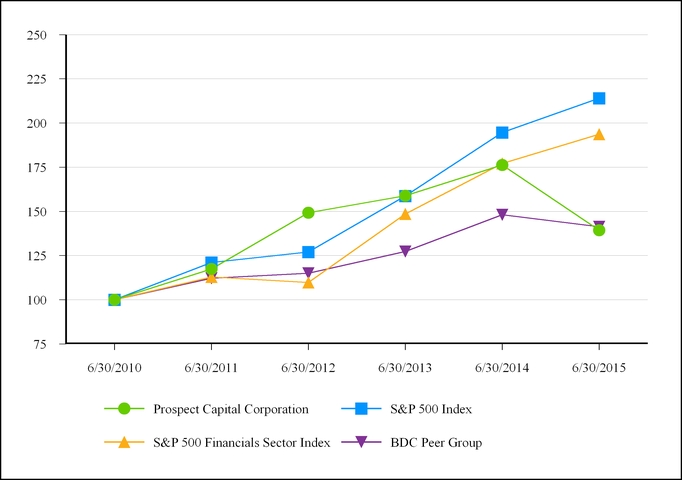
SOURCE: S&P Capital IQ
The graph and other information furnished under this Part II, Item 5 of this Annual Report on Form 10-K shall not be deemed to be “soliciting material” or to be “filed” with the SEC or subject to Regulation 14A or 14C, or to the liabilities of Section 18 of the Exchange Act. The stock price performance included in the above graph is not necessarily indicative of future stock performance.
60
Item 6. Selected Financial Data
The following selected financial data should be read in conjunction with “Item 7. Management’s Discussion and Analysis of Financial Condition and Results of Operations” and consolidated financial statements and notes thereto contained in “Item 8. Financial Statements and Supplementary Data” of this report. All amounts are in thousands except per share data and number of portfolio companies at year end.
Year Ended June 30, | |||||||||||||||||||
2015 | 2014 | 2013 | 2012 | 2011 | |||||||||||||||
Summary of Operations | |||||||||||||||||||
Total investment income | $ | 791,084 | $ | 712,291 | $ | 576,336 | $ | 320,910 | $ | 169,476 | |||||||||
Total operating expenses | 428,337 | 355,068 | 251,412 | 134,226 | 75,255 | ||||||||||||||
Net investment income | 362,747 | 357,223 | 324,924 | 186,684 | 94,221 | ||||||||||||||
Net realized and unrealized (losses) gains on investments | (12,458 | ) | (38,203 | ) | (104,068 | ) | 4,220 | 24,017 | |||||||||||
Net realized losses on extinguishment of debt | (3,950 | ) | — | — | — | — | |||||||||||||
Net increase in net assets resulting from operations | 346,339 | 319,020 | 220,856 | 190,904 | 118,238 | ||||||||||||||
Per Share Data | |||||||||||||||||||
Net investment income(1) | $ | 1.03 | $ | 1.19 | $ | 1.57 | $ | 1.63 | $ | 1.10 | |||||||||
Net increase in net assets resulting from operations(1) | 0.98 | 1.06 | 1.07 | 1.67 | 1.38 | ||||||||||||||
Dividends to shareholders | (1.19 | ) | (1.32 | ) | (1.28 | ) | (1.22 | ) | (1.21 | ) | |||||||||
Net asset value at end of year | 10.31 | 10.56 | 10.72 | 10.83 | 10.36 | ||||||||||||||
Balance Sheet Data | |||||||||||||||||||
Total assets | $ | 6,798,054 | $ | 6,477,269 | $ | 4,448,217 | $ | 2,255,254 | $ | 1,549,317 | |||||||||
Total debt outstanding | 2,983,736 | 2,773,051 | 1,683,002 | 664,138 | 406,700 | ||||||||||||||
Net assets | 3,703,049 | 3,618,182 | 2,656,494 | 1,511,974 | 1,114,357 | ||||||||||||||
Other Data | |||||||||||||||||||
Investment purchases for the year | $ | 2,088,988 | $ | 2,952,356 | $ | 3,103,217 | $ | 1,120,659 | $ | 953,337 | |||||||||
Investment sales and repayments for the year | $ | 1,633,073 | $ | 786,969 | $ | 931,534 | $ | 500,952 | $ | 285,562 | |||||||||
Number of portfolio companies at year end | 131 | 142 | 124 | 85 | 72 | ||||||||||||||
Total return based on market value(2) | (20.8 | %) | 10.9 | % | 6.2 | % | 27.2 | % | 17.2 | % | |||||||||
Total return based on net asset value(2) | 11.5 | % | 11.0 | % | 10.9 | % | 18.0 | % | 12.5 | % | |||||||||
Weighted average yield on debt portfolio at year end(3) | 12.7 | % | 12.1 | % | 13.6 | % | 13.9 | % | 12.8 | % | |||||||||
(1) | Per share data is based on the weighted average number of common shares outstanding for the period presented (except for dividends to shareholders which is based on actual rate per share). |
(2) | Total return based on market value is based on the change in market price per share between the opening and ending market prices per share in each period and assumes that dividends are reinvested in accordance with our dividend reinvestment plan. Total return based on net asset value is based upon the change in net asset value per share between the opening and ending net asset values per share in each period and assumes that dividends are reinvested in accordance with our dividend reinvestment plan. |
(3) | Excludes equity investments and non-performing loans. |
61
Item 7. Management’s Discussion and Analysis of Financial Condition and Results of Operations
(All figures in this item are in thousands except share, per share and other data.)
The following discussion should be read in conjunction with our consolidated financial statements and related notes and other financial information appearing elsewhere in this Annual Report. In addition to historical information, the following discussion and other parts of this Annual Report contain forward-looking information that involves risks and uncertainties. Our actual results may differ significantly from any results expressed or implied by these forward-looking statements due to the factors discussed in Part I, “Item 1A. Risk Factors” and “Forward-Looking Statements” appearing elsewhere herein.
Overview
Prospect Capital Corporation is a financial services company that primarily lends to and invests in middle market privately-held companies. We are a closed-end investment company incorporated in Maryland. We have elected to be regulated as a business development company (“BDC”) under the Investment Company Act of 1940 (the “1940 Act”). As a BDC, we have elected to be treated as a regulated investment company (“RIC”), under Subchapter M of the Internal Revenue Code of 1986 (the “Code”). We were organized on April 13, 2004 and were funded in an initial public offering completed on July 27, 2004.
On May 15, 2007, we formed a wholly-owned subsidiary Prospect Capital Funding LLC (“PCF”), a Delaware limited liability company and a bankruptcy remote special purpose entity, which holds certain of our portfolio loan investments that are used as collateral for the revolving credit facility at PCF. Our wholly-owned subsidiary Prospect Small Business Lending, LLC (“PSBL”) was formed on January 27, 2014 and purchases small business whole loans on a recurring basis from online small business loan originators, including On Deck Capital, Inc. (“OnDeck”) and Direct Capital Corporation (“Direct Capital”). On September 30, 2014, we formed a wholly-owned subsidiary Prospect Yield Corporation, LLC (“PYC”) and effective October 23, 2014, PYC holds our investments in collateralized loan obligations (“CLOs”). Each of these subsidiaries have been consolidated since operations commenced.
Effective July 1, 2014, we began consolidating certain of our wholly-owned and substantially wholly-owned holding companies formed by us in order to facilitate our investment strategy. The following companies have been included in our consolidated financial statements since July 1, 2014: AMU Holdings Inc.; APH Property Holdings, LLC; Arctic Oilfield Equipment USA, Inc.; CCPI Holdings Inc.; CP Holdings of Delaware LLC; Credit Central Holdings of Delaware, LLC; Energy Solutions Holdings Inc.; First Tower Holdings of Delaware LLC; Harbortouch Holdings of Delaware Inc.; MITY Holdings of Delaware Inc.; Nationwide Acceptance Holdings LLC; NMMB Holdings, Inc.; NPH Property Holdings, LLC; STI Holding, Inc.; UPH Property Holdings, LLC; Valley Electric Holdings I, Inc.; Valley Electric Holdings II, Inc.; and Wolf Energy Holdings Inc. On October 10, 2014, concurrent with the sale of the operating company, our ownership increased to 100% of the outstanding equity of ARRM Services, Inc. which was renamed SB Forging Company, Inc. (“SB Forging”). As such, we began consolidating SB Forging on October 11, 2014. We collectively refer to these entities as the “Consolidated Holding Companies.”
We are externally managed by our investment adviser, Prospect Capital Management L.P. (“Prospect Capital Management” or the “Investment Adviser”). Prospect Administration LLC (“Prospect Administration” or the “Administrator”) provides administrative services and facilities necessary for us to operate.
Our investment objective is to generate both current income and long-term capital appreciation through debt and equity investments. We invest primarily in senior and subordinated debt and equity of private companies in need of capital for acquisitions, divestitures, growth, development, recapitalizations and other purposes. We work with the management teams or financial sponsors to seek investments with historical cash flows, asset collateral or contracted pro-forma cash flows.
We currently have nine origination strategies in which we make investments: (1) lending in private equity sponsored transactions, (2) lending directly to companies not owned by private equity firms, (3) control investments in corporate operating companies, (4) control investments in financial companies, (5) investments in structured credit, (6) real estate investments, (7) investments in syndicated debt, (8) aircraft leasing and (9) online lending. We continue to evaluate other origination strategies in the ordinary course of business with no specific tops-down allocation to any single origination strategy.
Lending in Private Equity Sponsored Transactions – We make loans to companies which are controlled by leading private equity firms. This debt can take the form of first lien, second lien, unitranche or unsecured loans. In making these investments, we look for a diversified customer base, recurring demand for the product or service, barriers to entry, strong historical cash flow and experienced management teams. These loans typically have significant equity subordinate to our loan position. Historically, this strategy has comprised approximately 50%-60% of our business, but more recently it is less than 50% of our business.
62
Lending Directly to Companies – We provide debt financing to companies owned by non-private equity firms, the company founder, a management team or a family. Here, in addition to the strengths we look for in a sponsored transaction, we also look for the alignment with the management team with significant invested capital. This strategy often has less competition than the private equity sponsor strategy because such company financing needs are not easily addressed by banks and often require more diligence preparation. Direct lending can result in higher returns and lower leverage than sponsor transactions and may include warrants or equity to us. Historically, this strategy has comprised approximately 5%-15% of our business, but more recently it is less than 5% of our business.
Control Investments in Corporate Operating Companies – This strategy involves acquiring controlling stakes in non-financial operating companies. Our investments in these companies are generally structured as a combination of yield-producing debt and equity. We provide certainty of closure to our counterparties, give the seller personal liquidity and generally look for management to continue on in their current roles. This strategy has comprised approximately 10%-15% of our business.
Control Investments in Financial Companies – This strategy involves acquiring controlling stakes in financial companies, including consumer direct lending, sub-prime auto lending and other strategies. Our investments in these companies are generally structured as a combination of yield-producing debt and equity. These investments are often structured in a tax-efficient RIC-compliant partnership, enhancing returns. This strategy has comprised approximately 5%-15% of our business.
Investments in Structured Credit – We make investments in CLOs, generally taking a significant position in the subordinated interests (equity) of the CLOs. The CLOs include a diversified portfolio of broadly syndicated loans and do not have direct exposure to real estate, mortgages, sub-prime debt or consumer based debt. The CLOs in which we invest are managed by top-tier collateral managers that have been thoroughly diligenced prior to investment. This strategy has comprised approximately 10%-20% of our business.
Real Estate Investments – We make investments in real estate through our three wholly-owned tax-efficient real estate investment trusts (“REITs”), American Property REIT Corp. (“APRC”), National Property REIT Corp. (“NPRC”) and United Property REIT Corp. (“UPRC” and collectively with APRC and NPRC, “our REITs”). Our real estate investments are in various classes of fully developed and occupied real estate properties that generate current yields. We seek to identify properties that have historically high occupancy and steady cash flow generation. Our REITs partner with established property managers with experience in managing the property type to manage such properties after acquisition. This is a more recent investment strategy that has comprised approximately 5%-10% of our business.
Investments in Syndicated Debt – On an opportunistic basis, we make investments in loans and high yield bonds that have been sold to a syndicate of buyers. Here we look for investments with attractive risk-adjusted returns after we have completed a fundamental credit analysis. These investments are purchased with a long term, buy-and-hold outlook and we look to provide significant structuring input by providing anchoring orders. This strategy has comprised approximately 5%-10% of our business.
Aircraft Leasing – We invest debt as well as equity in aircraft assets subject to commercial leases to credit-worthy airlines across the globe. These investments present attractive return opportunities due to cash flow consistency from long-lived assets coupled with hard asset collateral. We seek to deliver risk-adjusted returns with strong downside protection by analyzing relative value characteristics across the spectrum of aircraft types of all vintages. Our target portfolio includes both in-production and out-of-production jet and turboprop aircraft and engines, operated by airlines across the globe. This strategy comprised approximately 1.5% of our business in the fiscal year ended June 30, 2014 and approximately 1% as of June 30, 2015.
Online Lending – We make investments in loans originated by certain consumer loan and small and medium sized business (“SME”) originators. We purchase each loan in its entirety (i.e., a “whole loan”). The borrowers are consumers and SMEs. The loans are typically serviced by the originators of the loans. This strategy comprised approximately 1% of our business in the fiscal year ended June 30, 2014 and less than 5% as of June 30, 2015.
We invest primarily in first and second lien secured loans and unsecured debt, which in some cases includes an equity component. First and second lien secured loans generally are senior debt instruments that rank ahead of unsecured debt of a given portfolio company. These loans also have the benefit of security interests on the assets of the portfolio company, which may rank ahead of or be junior to other security interests. Our investments in CLOs are subordinated to senior loans and are generally unsecured. We invest in debt and equity positions of CLOs which are a form of securitization in which the cash flows of a portfolio of loans are pooled and passed on to different classes of owners in various tranches. Our CLO investments are derived from portfolios of corporate debt securities which are generally risk rated from BB to B.
63
We hold many of our control investments in a two-tier structure consisting of a holding company and one or more related operating companies for tax purposes. These holding companies serve various business purposes including concentration of management teams, optimization of third party borrowing costs, improvement of supplier, customer, and insurance terms, and enhancement of co-investments by the management teams. In these cases, our investment in the holding company, generally as equity, its equity investment in the operating company and along with any debt from us directly to the operating company structure represents our total exposure for the investment. As of June 30, 2015, as shown in our Consolidated Schedule of Investments, the cost basis and fair value of our investments in controlled companies was $1,894,644 and $1,974,202, respectively. This structure gives rise to several of the risks described in our public documents and highlighted elsewhere in this Annual Report. On July 1, 2014, we began consolidating all wholly-owned and substantially wholly-owned holding companies formed by us for the purpose of holding our controlled investments in operating companies. There were no significant effects of consolidating these holding companies as they hold minimal assets other than their investments in the controlled operating companies. Investment company accounting prohibits the consolidation of any operating companies.
We seek to be a long-term investor with our portfolio companies. The aggregate fair value of our portfolio investments was $6,609,558 and $6,253,739 as of June 30, 2015 and June 30, 2014, respectively. During the year ended June 30, 2015, our net cost of investments increased by $187,854, or 2.9%, as a result of the following: twenty-three new investments, several follow-on investments, and thirteen revolver advances totaling $2,059,711 (including structuring fees of $20,916); payment-in-kind interest of $29,277; net amortization of discounts and premiums of $87,638; and full repayments on eighteen investments, sale of twelve investments, and several partial prepayments and amortization payments totaling $1,633,073, net of realized losses totaling $180,423.
Compared to the end of last fiscal year (ended June 30, 2014), net assets increased by $84,867, or 2.3%, during the year ended June 30, 2015, from $3,618,182 to $3,703,049. This increase resulted from the issuance of new shares of our common stock (less offering costs) in the amount of $145,441, dividend reinvestments of $14,681, and $346,339 from operations. These increases, in turn, were offset by $421,594 in dividend distributions to our stockholders. The $346,339 from operations is net of the following: net investment income of $362,747, net realized losses on investments of $180,423, net change in unrealized appreciation on investments of $167,965, and net realized losses on extinguishment of debt of $3,950.
Fourth Quarter Highlights
Investment Transactions
During the three months ended June 30, 2015, we acquired $257,053 of new investments, completed follow-on investments in existing portfolio companies totaling approximately $171,426, funded $18,696 of revolver advances, and recorded PIK interest of $12,792, resulting in gross investment originations of $459,967. During the three months ended June 30, 2015, we received full repayments on eight investments and received several partial prepayments and amortization payments totaling $437,729, including realized losses totaling $29,450. The more significant of these transactions are discussed in “Portfolio Investment Activity.”
Debt Issuances and Redemptions
During the three months ended June 30, 2015, we issued $50,729 aggregate principal amount of Prospect Capital InterNotes® for net proceeds of $49,910. These notes were issued with stated interest rates ranging from 3.375% to 5.10% with a weighted average interest rate of 4.74%. These notes mature between August 15, 2020 and June 15, 2022. The following table summarizes the Prospect Capital InterNotes® issued during the three months ended June 30, 2015.
Tenor at Origination (in years) | Principal Amount | Interest Rate Range | Weighted Average Interest Rate | Maturity Date Range | |||||||
5.25 | $ | 7,126 | 4.625% | 4.625 | % | August 15, 2020 – September 15, 2020 | |||||
5.5 | 31,397 | 4.75% | 4.75 | % | October 15, 2020 – November 15, 2020 | ||||||
6 | 2,197 | 3.375% | 3.375 | % | April 15, 2021 – May 15, 2021 | ||||||
6.5 | 3,912 | 5.10% | 5.10 | % | December 15, 2021 | ||||||
7 | 6,097 | 5.10% | 5.10 | % | May 15, 2022 – June 15, 2022 | ||||||
$ | 50,729 | ||||||||||
64
On May 15, 2015, we redeemed $100,000 aggregate principal amount of the 2022 Notes (as defined below) at par. As a result of this transaction, we recorded a loss in the amount of the difference between the reacquisition price and the net carrying amount of the notes, net of the proportionate amount of unamortized debt issuance costs. The net loss on the extinguishment of the 2022 Notes in the three months ended June 30, 2015 was $2,600.
During the three months ended June 30, 2015, we repaid $2,005 aggregate principal amount of Prospect Capital InterNotes® at par in accordance with the Survivor’s Option, as defined in the InterNotes® Offering prospectus. As a result of these transactions, we recorded a loss in the amount of the difference between the reacquisition price and the net carrying amount of the notes, net of the proportionate amount of unamortized debt issuance costs. The net loss on the extinguishment of Prospect Capital InterNotes® in the three months ended June 30, 2015 was $126.
Equity Issuances
On April 23, 2015, May 21, 2015 and June 18, 2015, we issued 131,971, 137,878 and 159,469 shares of our common stock in connection with the dividend reinvestment plan, respectively.
“Spin-Offs” of Certain Business Strategies
We previously announced that we intend to unlock value by “spinning off” certain “pure play” business strategies to our shareholders. We desire through these transactions to (i) transform some of the business strategies we have successfully grown and developed inside Prospect into pure play public companies with the potential for increased earnings multiples, (ii) allow for continued revenue and earnings growth through more flexible non-BDC formats (which are expected to benefit from not having one or more of the (a) 30% basket, (b) leverage, and (c) control basket constraints with which BDCs must comply), and (iii) free up our 30% basket and leverage capacity for new originations at Prospect. The business strategies we intend to enable our shareholders to participate in on a “pure play” basis have grown faster than our overall growth rate in the past few years, with outlets in less constraining structures required to continue this strong growth. We anticipate these non-BDC companies will have tax efficient structures.
We initially intend on focusing these efforts on three separate companies consisting of portions of our (i) consumer online lending business, (ii) real estate business and (iii) structured credit business. We are seeking to divest these businesses in conjunction with rights offering capital raises in which existing Prospect shareholders could elect to participate in each offering or sell their rights. The goals of these dispositions include leverage and earnings neutrality for Prospect. Our primary objective is to maximize the valuation of each offering (declining to proceed with any offering if we find any valuation not to be attractive).
The sizes and likelihood of these dispositions, some of which are expected to be partial rather than complete spin-offs, remain to be determined, but we currently expect the collective size of these three dispositions to be approximately 10% of our asset base. We seek to complete the first of these dispositions late in calendar year 2015 and the others in 2016 in a sequential fashion. The consummation of any of the spin-offs depends upon, among other things: market conditions, regulatory and exchange listing approval, and sufficient investor demand, and there can be no guarantee that we will consummate any of these spin-offs.
On March 11, 2015, Prospect Yield Corporation, LLC (“Prospect Yield”), our wholly-owned subsidiary, filed a registration statement with the SEC in connection with our rights offering disposition of a portion of our structured credit business, and Prospect Yield filed an amendment on April 17, 2015. We are a selling stockholder under the registration statement. We seek but cannot guarantee consummation of this disposition, which is subject to regulatory review, during calendar year 2016.
On May 6, 2015, Prospect Finance Company, LLC (“Prospect Finance”), our indirect wholly-owned subsidiary, filed a confidential registration statement with the SEC in connection with our rights offering disposition of our online consumer lending business, and Prospect Finance filed confidential amendments on June 16, July 20 and August 12, 2015. We are a selling stockholder under the registration statement. We seek but cannot guarantee consummation of this disposition, which is subject to regulatory review, late in calendar year 2015.
On May 6, 2015, Prospect Realty Income Trust Corp. (“Prospect Realty”), our wholly-owned subsidiary, filed a confidential registration statement with the SEC in connection with our rights offering disposition of a portion of our real estate business, and Prospect Realty filed confidential amendments on June 30, July 27 and August 12, 2015. We are a selling stockholder under the registration statement. We seek but cannot guarantee consummation of this disposition, which is subject to regulatory review, during calendar year 2016.
On May 19, 2015, Prospect, Prospect Capital Management, Prospect Yield, Prospect Finance and Prospect Realty filed an application for an exemptive order authorizing a joint transaction that may otherwise be prohibited by Section 57(a)(4) of the 1940 Act in order to complete each of the rights offerings described above and are awaiting comments from the SEC.
65
We expect to continue as a BDC in the future to pursue our multi-line origination strategy (including continuing to invest in the businesses discussed above) as a value-added differentiating factor compared with other BDCs.
Investment Holdings
As of June 30, 2015, we continue to pursue our investment strategy. At June 30, 2015, approximately $6,609,558, or 178.5%, of our net assets are invested in 131 long-term portfolio investments and CLOs.
During the year ended June 30, 2015, we originated $2,088,988 of new investments, primarily composed of $1,435,647 of debt and equity financing to non-controlled portfolio investments, $432,562 of debt and equity financing to controlled investments, and $220,779 of subordinated notes in CLOs. Our origination efforts are focused primarily on secured lending to non-control investments to reduce the risk in the portfolio by investing primarily in first lien loans, though we also continue to close select junior debt and equity investments. Our annualized current yield was 12.1% and 12.7% as of June 30, 2014 and June 30, 2015, respectively, across all performing interest bearing investments. The increase in our current yield is primarily the result of an increase in the interest rate for First Tower, LLC and increased investments in small business whole loans as well as online consumer lending. Monetization of equity positions that we hold and loans on non-accrual status are not included in this yield calculation. In many of our portfolio companies we hold equity positions, ranging from minority interests to majority stakes, which we expect over time to contribute to our investment returns. Some of these equity positions include features such as contractual minimum internal rates of returns, preferred distributions, flip structures and other features expected to generate additional investment returns, as well as contractual protections and preferences over junior equity, in addition to the yield and security offered by our cash flow and collateral debt protections.
We are a non-diversified company within the meaning of the 1940 Act. As required by the 1940 Act, we classify our investments by level of control. As defined in the 1940 Act, “Control Investments” are those where there is the ability or power to exercise a controlling influence over the management or policies of a company. Control is generally deemed to exist when a company or individual possesses or has the right to acquire within 60 days or less, a beneficial ownership of 25% or more of the voting securities of an investee company. Under the 1940 Act, “Affiliate Investments” are defined by a lesser degree of influence and are deemed to exist through the possession outright or via the right to acquire within 60 days or less, beneficial ownership of 5% or more of the outstanding voting securities of another person. “Non-Control/Non-Affiliate Investments” are those that are neither Control Investments nor Affiliate Investments.
As of June 30, 2015, we own controlling interests in the following portfolio companies: American Property REIT Corp.; Arctic Energy Services, LLC; CCPI Inc.; CP Energy Services Inc.; Credit Central Loan Company, LLC; Echelon Aviation LLC; Edmentum Ultimate Holdings, LLC; First Tower Finance Company LLC; Freedom Marine Solutions, LLC; Gulf Coast Machine & Supply Company; Harbortouch Payments, LLC; MITY, Inc.; National Property REIT Corp.; Nationwide Loan Company LLC (f/k/a Nationwide Acceptance LLC); NMMB, Inc.; R-V Industries, Inc.; United Property REIT Corp.; Valley Electric Company, Inc.; and Wolf Energy, LLC. We also own an affiliated interest in BNN Holdings Corp.
The following shows the composition of our investment portfolio by level of control as of June 30, 2015 and June 30, 2014:
June 30, 2015 | June 30, 2014 | ||||||||||||||||||||
Level of Control | Cost | % of Portfolio | Fair Value | % of Portfolio | Cost | % of Portfolio | Fair Value | % of Portfolio | |||||||||||||
Control Investments | $ | 1,894,644 | 28.9 | % | $ | 1,974,202 | 29.9 | % | $ | 1,719,242 | 27.0 | % | $ | 1,640,454 | 26.2 | % | |||||
Affiliate Investments | 45,150 | 0.7 | % | 45,945 | 0.7 | % | 31,829 | 0.5 | % | 32,121 | 0.5 | % | |||||||||
Non-Control/Non-Affiliate Investments | 4,619,582 | 70.4 | % | 4,589,411 | 69.4 | % | 4,620,451 | 72.5 | % | 4,581,164 | 73.3 | % | |||||||||
Total Investments | $ | 6,559,376 | 100.0 | % | $ | 6,609,558 | 100.0 | % | $ | 6,371,522 | 100.0 | % | $ | 6,253,739 | 100.0 | % | |||||
66
The following shows the composition of our investment portfolio by type of investment as of June 30, 2015 and June 30, 2014:
June 30, 2015 | June 30, 2014 | ||||||||||||||||||||
Type of Investment | Cost | % of Portfolio | Fair Value | % of Portfolio | Cost | % of Portfolio | Fair Value | % of Portfolio | |||||||||||||
Revolving Line of Credit | $ | 30,546 | 0.5 | % | $ | 30,546 | 0.5 | % | $ | 3,445 | 0.1 | % | $ | 2,786 | — | % | |||||
Senior Secured Debt | 3,617,111 | 55.1 | % | 3,533,447 | 53.5 | % | 3,578,339 | 56.2 | % | 3,514,198 | 56.2 | % | |||||||||
Subordinated Secured Debt | 1,234,701 | 18.8 | % | 1,205,303 | 18.2 | % | 1,272,275 | 20.0 | % | 1,200,221 | 19.2 | % | |||||||||
Subordinated Unsecured Debt | 145,644 | 2.2 | % | 144,271 | 2.2 | % | 85,531 | 1.3 | % | 85,531 | 1.4 | % | |||||||||
Small Business Loans | 50,558 | 0.8 | % | 50,892 | 0.8 | % | 4,637 | 0.1 | % | 4,252 | 0.1 | % | |||||||||
CLO Debt | 28,613 | 0.4 | % | 32,398 | 0.5 | % | 28,118 | 0.4 | % | 33,199 | 0.5 | % | |||||||||
CLO Residual Interest | 1,072,734 | 16.4 | % | 1,113,023 | 16.8 | % | 1,044,656 | 16.4 | % | 1,093,985 | 17.5 | % | |||||||||
Preferred Stock | 41,047 | 0.6 | % | 4,361 | 0.1 | % | 78,448 | 1.2 | % | 9,370 | 0.1 | % | |||||||||
Common Stock | 181,404 | 2.8 | % | 164,984 | 2.5 | % | 83,129 | 1.3 | % | 78,074 | 1.3 | % | |||||||||
Membership Interest | 148,192 | 2.3 | % | 278,537 | 4.2 | % | 190,671 | 3.0 | % | 221,168 | 3.6 | % | |||||||||
Participating Interest(1) | — | — | % | 42,787 | 0.6 | % | — | — | % | 213 | — | % | |||||||||
Escrow Receivable | 7,144 | 0.1 | % | 5,984 | 0.1 | % | — | — | % | 1,589 | — | % | |||||||||
Warrants | 1,682 | — | % | 3,025 | — | % | 2,273 | — | % | 9,153 | 0.1 | % | |||||||||
Total Investments | $ | 6,559,376 | 100.0 | % | $ | 6,609,558 | 100.0 | % | $ | 6,371,522 | 100.0 | % | $ | 6,253,739 | 100.0 | % | |||||
(1) | Participating Interest includes our participating equity investments, such as net profits interests, net operating income interests, net revenue interests, and overriding royalty interests. |
The following shows our investments in interest bearing securities by type of investment as of June 30, 2015 and June 30, 2014:
June 30, 2015 | June 30, 2014 | ||||||||||||||||||||
Type of Investment | Cost | % of Portfolio | Fair Value | % of Portfolio | Cost | % of Portfolio | Fair Value | % of Portfolio | |||||||||||||
First Lien | $ | 3,642,761 | 58.9 | % | $ | 3,559,097 | 58.3 | % | $ | 3,581,784 | 59.5 | % | $ | 3,516,984 | 59.3 | % | |||||
Second Lien | 1,239,597 | 20.0 | % | 1,210,199 | 19.8 | % | 1,272,275 | 21.1 | % | 1,200,221 | 20.2 | % | |||||||||
Unsecured | 145,644 | 2.4 | % | 144,271 | 2.4 | % | 85,531 | 1.4 | % | 85,531 | 1.4 | % | |||||||||
Small Business Loans | 50,558 | 0.8 | % | 50,892 | 0.8 | % | 4,637 | 0.1 | % | 4,252 | 0.1 | % | |||||||||
CLO Debt | 28,613 | 0.5 | % | 32,398 | 0.5 | % | 28,118 | 0.5 | % | 33,199 | 0.6 | % | |||||||||
CLO Residual Interest | 1,072,734 | 17.4 | % | 1,113,023 | 18.2 | % | 1,044,656 | 17.4 | % | 1,093,985 | 18.4 | % | |||||||||
Total Debt Investments | $ | 6,179,907 | 100.0 | % | $ | 6,109,880 | 100.0 | % | $ | 6,017,001 | 100.0 | % | $ | 5,934,172 | 100.0 | % | |||||
The following shows the composition of our investment portfolio by geographic location as of June 30, 2015 and June 30, 2014:
June 30, 2015 | June 30, 2014 | ||||||||||||||||||||
Geographic Location | Cost | % of Portfolio | Fair Value | % of Portfolio | Cost | % of Portfolio | Fair Value | % of Portfolio | |||||||||||||
Canada | $ | 15,000 | 0.2 | % | $ | 15,000 | 0.2 | % | $ | 15,000 | 0.2 | % | $ | 15,000 | 0.2 | % | |||||
Cayman Islands | 1,101,347 | 16.8 | % | 1,145,421 | 17.3 | % | 1,072,774 | 16.8 | % | 1,127,184 | 18.0 | % | |||||||||
France | 10,145 | 0.2 | % | 9,734 | 0.2 | % | 10,170 | 0.2 | % | 10,339 | 0.2 | % | |||||||||
Midwest US | 797,002 | 12.2 | % | 822,591 | 12.4 | % | 787,864 | 12.4 | % | 753,932 | 12.1 | % | |||||||||
Northeast US | 1,085,569 | 16.5 | % | 1,151,510 | 17.4 | % | 1,224,403 | 19.2 | % | 1,181,533 | 18.9 | % | |||||||||
Puerto Rico | 40,911 | 0.6 | % | 37,539 | 0.6 | % | 41,307 | 0.6 | % | 36,452 | 0.6 | % | |||||||||
Southeast US | 1,561,990 | 23.8 | % | 1,606,305 | 24.3 | % | 1,570,451 | 24.6 | % | 1,539,076 | 24.6 | % | |||||||||
Southwest US | 762,454 | 11.6 | % | 693,138 | 10.5 | % | 680,351 | 10.8 | % | 659,322 | 10.5 | % | |||||||||
Western US | 1,184,958 | 18.1 | % | 1,128,320 | 17.1 | % | 969,202 | 15.2 | % | 930,901 | 14.9 | % | |||||||||
Total Investments | $ | 6,559,376 | 100.0 | % | $ | 6,609,558 | 100.0 | % | $ | 6,371,522 | 100.0 | % | $ | 6,253,739 | 100.0 | % | |||||
67
The following shows the composition of our investment portfolio by industry as of June 30, 2015 and June 30, 2014:
June 30, 2015 | June 30, 2014 | ||||||||||||||||||||
Industry | Cost | % of Portfolio | Fair Value | % of Portfolio | Cost | % of Portfolio | Fair Value | % of Portfolio | |||||||||||||
Aerospace & Defense | $ | 70,860 | 1.1 | % | $ | 78,675 | 1.2 | % | $ | 102,803 | 1.6 | % | $ | 102,967 | 1.6 | % | |||||
Auto Finance | — | — | % | — | — | % | 11,139 | 0.2 | % | 11,139 | 0.2 | % | |||||||||
Automobile | — | — | % | — | — | % | 22,296 | 0.3 | % | 22,452 | 0.4 | % | |||||||||
Business Services | 646,021 | 9.8 | % | 711,541 | 10.8 | % | 598,940 | 9.4 | % | 611,286 | 9.8 | % | |||||||||
Chemicals | 4,963 | 0.1 | % | 5,000 | 0.1 | % | 19,648 | 0.3 | % | 19,713 | 0.3 | % | |||||||||
Commercial Services | 245,913 | 3.8 | % | 241,620 | 3.6 | % | 301,610 | 4.7 | % | 301,610 | 4.8 | % | |||||||||
Construction & Engineering | 58,837 | 0.9 | % | 30,497 | 0.4 | % | 56,860 | 0.9 | % | 33,556 | 0.5 | % | |||||||||
Consumer Finance | 426,697 | 6.5 | % | 486,977 | 7.4 | % | 425,497 | 6.7 | % | 434,348 | 6.9 | % | |||||||||
Consumer Services | 190,037 | 2.9 | % | 190,216 | 2.9 | % | 502,862 | 7.9 | % | 504,647 | 8.1 | % | |||||||||
Contracting | — | — | % | — | — | % | 3,831 | 0.1 | % | — | — | % | |||||||||
Diversified Financial Services | 120,327 | 1.8 | % | 119,919 | 1.8 | % | 37,937 | 0.6 | % | 37,937 | 0.6 | % | |||||||||
Durable Consumer Products | 439,172 | 6.7 | % | 422,033 | 6.4 | % | 377,205 | 5.9 | % | 375,329 | 6.0 | % | |||||||||
Food Products | 282,185 | 4.3 | % | 281,365 | 4.3 | % | 173,375 | 2.7 | % | 174,603 | 2.8 | % | |||||||||
Healthcare | 435,893 | 6.6 | % | 434,446 | 6.6 | % | 329,408 | 5.2 | % | 326,142 | 5.2 | % | |||||||||
Hotels, Restaurants & Leisure | 177,748 | 2.7 | % | 177,926 | 2.7 | % | 132,193 | 2.1 | % | 132,401 | 2.1 | % | |||||||||
Machinery | 376 | — | % | 563 | — | % | 396 | — | % | 621 | — | % | |||||||||
Manufacturing | 163,380 | 2.5 | % | 126,921 | 1.9 | % | 204,394 | 3.2 | % | 171,577 | 2.7 | % | |||||||||
Media | 361,825 | 5.5 | % | 350,365 | 5.3 | % | 362,738 | 5.7 | % | 344,278 | 5.5 | % | |||||||||
Metal Services & Minerals | 25,670 | 0.4 | % | 23,745 | 0.4 | % | 48,402 | 0.8 | % | 51,977 | 0.8 | % | |||||||||
Oil & Gas Production | 3,000 | — | % | 22 | — | % | 55,451 | 0.9 | % | 3,599 | 0.1 | % | |||||||||
Oil & Gas Services | 289,803 | 4.4 | % | 246,817 | 3.7 | % | 305,418 | 4.8 | % | 312,532 | 5.0 | % | |||||||||
Online Lending | 213,143 | 3.2 | % | 213,477 | 3.2 | % | 4,637 | 0.1 | % | 4,252 | 0.1 | % | |||||||||
Personal & Nondurable Consumer Products | 213,796 | 3.4 | % | 193,046 | 2.8 | % | 10,604 | 0.2 | % | 11,034 | 0.2 | % | |||||||||
Pharmaceuticals | 74,951 | 1.1 | % | 74,588 | 1.1 | % | 78,069 | 1.2 | % | 73,690 | 1.2 | % | |||||||||
Property Management | 5,880 | 0.1 | % | 3,814 | 0.1 | % | 57,500 | 0.9 | % | 45,284 | 0.7 | % | |||||||||
Real Estate | 462,895 | 7.1 | % | 512,245 | 7.8 | % | 353,506 | 5.5 | % | 355,236 | 5.7 | % | |||||||||
Retail | 63 | — | % | 260 | — | % | 14,231 | 0.2 | % | 14,625 | 0.2 | % | |||||||||
Software & Computer Services | 217,429 | 3.3 | % | 217,472 | 3.3 | % | 240,469 | 3.8 | % | 241,260 | 3.9 | % | |||||||||
Telecommunication Services | 4,573 | 0.1 | % | 4,595 | 0.1 | % | 79,630 | 1.2 | % | 79,654 | 1.3 | % | |||||||||
Textiles, Apparel & Luxury Goods | 252,200 | 3.8 | % | 252,200 | 3.8 | % | 275,023 | 4.3 | % | 259,690 | 4.2 | % | |||||||||
Transportation | 70,392 | 1.1 | % | 63,792 | 1.0 | % | 112,676 | 1.8 | % | 69,116 | 1.1 | % | |||||||||
Subtotal | $ | 5,458,029 | 83.2 | % | $ | 5,464,137 | 82.7 | % | $ | 5,298,748 | 83.2 | % | $ | 5,126,555 | 82.0 | % | |||||
Structured Finance(1) | 1,101,347 | 16.8 | % | 1,145,421 | 17.3 | % | 1,072,774 | 16.8 | % | 1,127,184 | 18.0 | % | |||||||||
Total Investments | $ | 6,559,376 | 100.0 | % | $ | 6,609,558 | 100.0 | % | $ | 6,371,522 | 100.0 | % | $ | 6,253,739 | 100.0 | % | |||||
(1) | Our CLO investments do not have industry concentrations and as such have been separated in the table above. |
68
Portfolio Investment Activity
During the year ended June 30, 2015, we acquired $929,023 of new investments, completed follow-on investments in existing portfolio companies totaling approximately $1,073,492, funded $57,196 of revolver advances, and recorded PIK interest of $29,277, resulting in gross investment originations of $2,088,988. The more significant of these transactions are briefly described below.
On July 17, 2014, we restructured our investments in BXC Company, Inc. (“BXC”) and Boxercraft Incorporated (“Boxercraft”), a wholly-owned subsidiary of BXC. The existing Senior Secured Term Loan A and a portion of the existing Senior Secured Term Loan B were replaced with a new Senior Secured Term Loan A to Boxercraft. The remainder of the existing Senior Secured Term Loan B and the existing Senior Secured Term Loan C, Senior Secured Term Loan D, and Senior Secured Term Loan E were replaced with a new Senior Secured Term Loan B to Boxercraft. The existing Senior Secured Term Loan to Boxercraft was converted into Series D Preferred Stock in BXC.
On August 5, 2014, we made an investment of $39,105 to purchase 70.94% of the subordinated notes in CIFC Funding 2014-IV Investor, Ltd. in a co-investment transaction with Priority Income Fund, Inc., a closed-end fund managed by an affiliate of Prospect Capital Management.
On August 13, 2014, we provided $210,000 of first lien senior secured financing, of which $200,000 was funded at closing, to support the recapitalization of Trinity Services Group, Inc. (“Trinity”), a leading food services company in the H.I.G. Capital portfolio. We invested $100,000 in Term Loan A notes and $100,000 in Term Loan B notes. The Term Loan A bears interest in cash at the greater of 6.5% or LIBOR plus 5.5% and has a final maturity of August 13, 2019. The Term Loan B bears interest in cash at the greater of 11.5% or LIBOR plus 10.5% and has a final maturity of August 13, 2019. The $10,000 senior secured revolver, which was unfunded at closing, bore interest in cash at the greater of 9.0% or LIBOR plus 8.0% and was terminated upon maturity on June 5, 2015.
On August 19, 2014 and August 27, 2014, we made a combined $10,670 follow-on investment in UPRC to acquire Michigan Storage, LLC, a portfolio of seven self-storage facilities located in Michigan. We invested $1,281 of equity through UPH Property Holdings, LLC and $9,389 of debt directly to UPRC. The senior secured term loan bears interest in cash at the greater of 6.0% or LIBOR plus 4.0% and payment-in-kind interest of 5.5% and has a final maturity of April 1, 2019. These properties were subsequently contributed to NPRC.
On August 29, 2014, we made a first lien senior secured investment of $44,000 to support the recapitalization of BNN Holdings Corp. We invested an equal amount in Term Loan A notes and Term Loan B notes. The Term Loan A bears interest in cash at the greater of 6.5% or LIBOR plus 5.5% and has a final maturity of August 29, 2019. The Term Loan B bears interest in cash at the greater of 11.5% or LIBOR plus 10.5% and has a final maturity of August 29, 2019. As part of the recapitalization, we received repayment of the $28,950 loan previously outstanding.
On September 10, 2014, we made a $55,869 follow-on first lien senior secured debt investment in Onyx Payments (“Onyx”), of which $50,869 was funded at closing, to fund an acquisition. We invested an additional $25,028 in Term Loan A notes and $25,841 in Term Loan B notes. The Term Loan A bears interest in cash at the greater of 6.5% or LIBOR plus 5.5% and has a final maturity of September 10, 2019. The Term Loan B bears interest in cash at the greater of 13.5% or LIBOR plus 12.5% and has a final maturity of September 10, 2019. The $5,000 senior secured revolver, which was unfunded at closing, originally bore interest in cash at the greater of 9.0% or LIBOR plus 7.75%. Effective November 25, 2014, the terms of the revolver changed to the greater of 9.0% or LIBOR plus 8.0%. The revolver has a final maturity of September 10, 2015.
On September 26, 2014, we provided $215,000 of first lien senior secured financing, of which $202,500 was funded at closing, to Pacific World Corporation (“Pacific World”), a supplier of nail and beauty care products to food, drug, mass, and value retail channels worldwide. The $200,000 term loan originally bore interest in cash at the greater of 8.0% or LIBOR plus 7.0%. On December 31, 2014, the outstanding $200,000 term loan was split into equal tranches of Term Loan A notes and Term Loan B notes. The Term Loan A bears interest in cash at the greater of 6.0% or LIBOR plus 5.0% and has a final maturity of September 26, 2020. The Term Loan B bears interest in cash at the greater of 10.0% or LIBOR plus 9.0% and has a final maturity of September 26, 2020. The $15,000 senior secured revolver, of which $2,500 was funded at closing, bears interest in cash at the greater of 8.0% or LIBOR plus 7.0% and has a final maturity of September 26, 2020.
On September 29, 2014, we made a second lien secured investment of $144,000 to support the recapitalization of PGX Holdings, Inc. (“Progrexion”). The second lien term loan bears interest in cash at the greater of 10.0% or LIBOR plus 9.0% and has a final maturity of September 29, 2021. As part of the recapitalization, we received repayment of the $436,647 loan previously outstanding.
69
On September 29, 2014, we made a $22,618 follow-on investment in UPRC to acquire Canterbury Green Apartments Holdings, LLC, a multi-family property located in Fort Wayne, Indiana. We invested $3,393 of equity through UPH and $19,225 of debt directly to UPRC. The senior secured term loan bears interest in cash at the greater of 6.0% or LIBOR plus 4.0% and payment-in-kind interest of 5.5% and has a final maturity of April 1, 2019.
On September 30, 2014, we made a $26,431 follow-on first lien senior secured debt investment in Harbortouch Payments, LLC (“Harbortouch”) to support an acquisition. The Term Loan C bears interest in cash at the greater of 13.0% or LIBOR plus 9.0% and has a final maturity of September 29, 2018.
On September 30, 2014, we made a $42,200 follow-on first lien senior secured debt investment in PrimeSport, Inc. (“PrimeSport”) to fund a dividend recapitalization. We invested an equal amount in Term Loan A notes and Term Loan B notes. The Term Loan A originally bore interest in cash at the greater of 7.5% or LIBOR plus 6.5% and had a final maturity of December 23, 2019. The Term Loan B originally bore interest in cash at the greater of 11.5% or LIBOR plus 10.5% and payment-in-kind interest of 1.0% and had a final maturity of December 23, 2019. On February 11, 2015, we made a $20,268 follow-on first lien senior secured debt investment in PrimeSport to support its acquisition by a new financial sponsor. We invested an additional $10,680 in Term Loan A notes and $9,588 in Term Loan B notes. In connection with the incremental funding, we amended the terms of the investments. The Term Loan A bears interest in cash at the greater of 7.0% or LIBOR plus 6.0% and has a final maturity of February 11, 2021. The Term Loan B bears interest in cash at the greater of 12.0% or LIBOR plus 11.0% and has a final maturity of February 11, 2021.
On September 30, 2014 and October 29, 2014, we made a combined $22,688 follow-on investment in UPRC to acquire Columbus OH Apartment Holdco, LLC, a portfolio of eight multi-family residential properties located in Ohio. We invested $3,398 of equity through UPH and $19,290 of debt directly to UPRC. The senior secured term loan bears interest in cash at the greater of 6.0% or LIBOR plus 4.0% and payment-in-kind interest of 5.5% and has a final maturity of April 1, 2019.
On October 6, 2014, we made a $35,221 follow-on first lien senior secured debt investment in Onyx to fund an acquisition. We invested an equal amount in Term Loan A notes and Term Loan B notes. The Term Loan A bears interest in cash at the greater of 6.5% or LIBOR plus 5.5% and has a final maturity of September 10, 2019. The Term Loan B bears interest in cash at the greater of 13.5% or LIBOR plus 12.5% and has a final maturity of September 10, 2019.
On October 8, 2014, we made a $65,000 second lien secured debt investment in Capstone Logistics Acquisition, Inc. (“Capstone”), a logistics services portfolio company. The second lien term loan originally bore interest in cash at the greater of 8.75% or LIBOR plus 7.75%. On June 12, 2015, we made a $37,500 follow-on second lien senior secured debt investment in Capstone to support an acquisition. In connection with the incremental funding, we amended the terms of this investment to the greater of 9.25% or LIBOR plus 8.25%. The investment has a final maturity of October 7, 2022.
On October 9, 2014, we made an investment of $50,743 to purchase 83.60% of the subordinated notes in Babson CLO Ltd. 2014-III in a co-investment transaction with Priority Income Fund, Inc., a closed-end fund managed by an affiliate of Prospect Capital Management.
On October 17, 2104, we made an investment of $48,994 to purchase 90.54% of the subordinated notes in Symphony CLO XV, Ltd.
On October 21, 2014, we made a $22,500 first lien senior secured debt investment in Hollander Sleep Products, LLC, a manufacturer of bed pillows and mattress pads in the United States. The first lien term loan bears interest in cash at the greater of 9.0% or LIBOR plus 8.0% and has a final maturity of October 21, 2020.
On November 17, 2014, we made a $35,000 follow-on first lien senior secured debt investment in System One Holdings, LLC, of which $23,500 was funded at closing, to fund a dividend recapitalization. We invested an additional $23,500 of first lien term loan which bears interest in cash at the greater of 10.5% or LIBOR plus 9.5% and has a final maturity of November 17, 2020. We also provided $11,500 of delayed draw term loan commitment to support a future dividend recapitalization. The delayed draw term loan, which was unfunded at closing, would increase the existing first lien term loan and bear the same terms and conditions as the initial loan, if drawn.
On November 25, 2014, we made a $127,000 follow-on first lien senior secured debt investment in InterDent, Inc. (“InterDent”), of which $120,000 was funded at closing, as part of an add-on acquisition growth and recapitalization strategy. We invested an additional $60,000 in Term Loan A notes and $60,000 in Term Loan B notes. The Term Loan A bears interest in cash at the greater of 6.25% or LIBOR plus 5.25% and has a final maturity of August 3, 2017. The Term Loan B bears interest in cash at the greater of 11.25% or LIBOR plus 10.25% and has a final maturity of August 3, 2017. We also provided $7,000 of delayed draw term loan commitment to support future acquisitions. The delayed draw term loan, which was unfunded
70
at closing, was fully drawn on December 23, 2014, increasing the existing Term Loan A and Term Loan B on a pro rata basis and bearing the same terms and conditions as the initial loans.
On December 19, 2014, we provided a $25,000 loan to support the growth of Security Alarm Financing Enterprises, L.P., a national security alarm company. The senior subordinated note bears interest in cash at the greater of 11.5% or LIBOR plus 9.5% and has a final maturity of December 19, 2020.
On January 16, 2015, we made a $13,871 follow-on investment in NPRC to acquire five additional properties in Michigan Storage, LLC, a portfolio of twelve self-storage facilities located in Michigan. We invested $2,061 of equity through NPH Property Holdings, LLC and $11,810 of debt directly to NPRC. The senior secured Term Loan A bears interest in cash at the greater of 6.0% or LIBOR plus 4.0% and payment-in-kind interest of 5.5% and has a final maturity of April 1, 2019.
On March 30, 2015, we made a $74,700 follow-on first lien senior secured debt investment in Instant Web, LLC (“IWCO”), of which $58,700 was funded at closing, to support a recapitalization of the business. We invested an additional $22,100 in Term Loan A notes, $22,100 in Term Loan B notes, and $14,500 in Term Loan C notes. The Term Loan A bears interest in cash at the greater of 5.5% or LIBOR plus 4.5% and has a final maturity of March 28, 2019. The Term Loan B bears interest in cash at the greater of 12.0% or LIBOR plus 11.0% and has a final maturity of March 28, 2019. The Term Loan C bears interest in cash at the greater of 12.75% or LIBOR plus 11.75% and has a final maturity of March 28, 2019. We also provided $16,000 of delayed draw term loan commitment to support a future dividend recapitalization. The delayed draw term loan, which was unfunded at closing, would increase the existing Term Loan A and Term Loan B on a pro rata basis and bear the same terms and conditions as the initial loans, if drawn.
On April 15, 2015, we provided $48,500 of first lien senior secured financing, of which $43,500 was funded at closing, to USG Intermediate, LLC, an entrepreneur-owned direct marketing company. The Term Loan A bears interest in cash at the greater of 7.5% or LIBOR plus 6.5% and has a final maturity of April 15, 2020. The Term Loan B bears interest in cash at the greater of 12.5% or LIBOR plus 11.5% and has a final maturity of April 15, 2020. The $5,000 senior secured revolver, which was unfunded at closing, bears interest in cash at the greater of 10.0% or LIBOR plus 9.0% and has a final maturity of April 15, 2016.
On April 16, 2015, we made a $10,000 second lien secured debt investment in SESAC Holdco II LLC, a performance rights organization based in Nashville, Tennessee. The second lien term loan bears interest in cash at the greater of 9.0% or LIBOR plus 8.0% and has a final maturity of April 22, 2021.
On May 13, 2015, we made an investment of $44,645 to purchase 81.48% of the subordinated notes in Mountain View CLO IX Ltd. in a co-investment transaction with Priority Income Fund, Inc., a closed-end fund managed by an affiliate of Prospect Capital Management.
On May 28, 2015, we made a $15,000 follow-on first lien senior secured debt investment in Traeger Pellet Grills LLC in connection with a delayed purchase price payment. We invested an additional $7,500 in Term Loan A notes and $7,500 in Term Loan B notes. The Term Loan A bears interest in cash at the greater of 6.5% or LIBOR plus 4.5% and has a final maturity of June 18, 2018. The Term Loan B bears interest in cash at the greater of 11.5% or LIBOR plus 9.5% and has a final maturity of June 18, 2018.
On June 5, 2015, we made an investment of $15,106 to purchase 50.07% of the subordinated notes in HarbourView CLO VII, Ltd. in a co-investment transaction with Priority Income Fund, Inc., a closed-end fund managed by an affiliate of Prospect Capital Management.
On June 9, 2015, we provided additional debt and equity financing to support the recapitalization of Edmentum, Inc. (“Edmentum”). As part of the recapitalization, we exchanged 100% of the $50,000 second lien term loan previously outstanding for $26,365 of junior PIK notes and 370,964.14 Class A common units representing 37.1% equity ownership in Edmentum Ultimate Holdings, LLC (“Edmentum Holdings”). In addition, we invested $5,875 in senior PIK notes and committed $7,834 as part of a second lien revolving credit facility, of which $4,896 was funded at closing. The unsecured senior PIK note issued by Edmentum Holdings bears payment-in-kind interest of 8.5% and has a final maturity of June 9, 2020. The unsecured junior PIK note issued by Edmentum Holdings bears payment-in-kind interest of 10.0% and has a final maturity of June 9, 2020. The second lien revolver issued by Edmentum bears interest in cash at 5.0% and has a final maturity of June 9, 2020. On June 9, 2015, we determined that the impairment of Edmentum was other-than-temporary and recorded a realized loss of $22,116 for the amount that the amortized cost exceeded the fair value, reducing the amortized cost to $37,216.
71
On June 12, 2015, we made a second lien secured investment of $5,000 to support the recapitalization of Royal Holdings, Inc., a manufacturer of high-value specialty adhesives and sealants. The second lien term loan bears interest in cash at the greater of 8.5% or LIBOR plus 7.5% and has a final maturity of June 19, 2023. As part of the recapitalization, on June 22, 2015, we received repayment of the $20,000 loan previously outstanding from Royal Adhesives and Sealants, LLC, a wholly-owned subsidiary of Royal Holdings, Inc.
On June 19, 2015, we made a $10,000 second lien secured investment in Prime Security Services Borrower, LLC to support the simultaneous acquisitions of two providers of alarm monitoring services in the United States. The second lien term loan bears interest in cash at the greater of 9.75% or LIBOR plus 8.75% and has a final maturity of July 1, 2022.
On June 23, 2015, we made a $10,000 second lien secured investment in PlayPower, Inc., a global designer and manufacturer of commercial playgrounds as well as indoor and outdoor recreational equipment. The second lien term loan bears interest in cash at the greater of 9.75% or LIBOR plus 8.75% and has a final maturity of June 23, 2022.
On June 26, 2015, we made a $21,400 follow-on first lien senior secured debt investment in Global Employment Solutions, Inc. to support an acquisition. In connection with the incremental funding, we amended the terms of this investment to the greater of 10.25% or LIBOR plus 9.25% and extended the final maturity to June 26, 2020.
On June 26, 2015, we made an investment of $16,928 to purchase 56.52% of the subordinated notes in Jefferson Mill CLO Ltd. in a co-investment transaction with Priority Income Fund, Inc., a closed-end fund managed by an affiliate of Prospect Capital Management.
On June 30, 2015, we provided $58,500 of first lien senior secured financing, of which $44,000 was funded at closing, to BAART Programs, Inc., an operator of outpatient opioid treatment service clinics. We invested $21,500 in Term Loan A notes and $21,500 in Term Loan B notes. The Term Loan A bears interest in cash at the greater of 6.25% or LIBOR plus 5.75% and has a final maturity of June 30, 2020. The Term Loan B bears interest in cash at the greater of 11.25% or LIBOR plus 10.75% and has a final maturity of June 30, 2020. The $5,000 senior secured revolver, of which $1,000 was funded at closing, bears interest in cash at the greater of 8.75% or LIBOR plus 8.25% and has a final maturity of June 30, 2018. We also provided $10,500 of delayed draw term loan commitment to fund a future earnout payment to the sellers. The delayed draw term loan, which was unfunded at closing, would increase the existing Term Loan A and Term Loan B on a pro rata basis and bear the same terms and conditions as the initial loans, if drawn.
In addition to the purchases noted above, during the year ended June 30, 2015, we made thirty-six follow-on investments in NPRC totaling $224,200 to support the online consumer lending initiative. We invested $52,350 of equity through NPH Property Holdings, LLC and $171,850 of debt directly to NPRC and its wholly-owned subsidiaries.
Additionally, during the year ended June 30, 2015, our wholly-owned subsidiary PSBL purchased $96,380 of small business whole loans from OnDeck and Direct Capital.
During the year ended June 30, 2015, we received full repayments on eighteen investments, sold twelve investments, and received several partial prepayments and amortization payments totaling $1,633,073, net of realized losses totaling $180,423. The more significant of these transactions are briefly described below.
On July 22, 2014, Injured Workers Pharmacy, LLC repaid the $22,678 loan receivable to us.
On July 23, 2014, Correctional Healthcare Holding Company, Inc. repaid the $27,100 loan receivable to us.
On July 28, 2014, Tectum Holdings, Inc. repaid the $10,000 loan receivable to us.
On August 1, 2014, we sold our investments in Airmall Inc. (“Airmall”) for net proceeds of $51,379 and realized a loss of $3,473 on the sale. In addition, there is $6,000 being held in escrow, of which 98% is due to Prospect, which will be recognized as an additional realized loss if it is not received. On October 22, 2014, we received a tax refund of $665 related to our investment in Airmall for which we realized a gain of the same amount.
On August 20, 2014, we sold the assets of Borga, Inc. (“Borga”), a wholly-owned subsidiary of STI Holding, Inc., for net proceeds of $382 and realized a loss of $2,589 on the sale. On December 29, 2014, Borga was dissolved.
On August 22, 2014, Byrider Systems Acquisition Corp. repaid the $11,177 loan receivable to us.
On August 22, 2014, Capstone Logistics, LLC repaid the $189,941 loans receivable to us.
72
On August 22, 2014, TriMark USA, LLC repaid the $10,000 loan receivable to us.
On August 25, 2014, we sold Boxercraft, a wholly-owned subsidiary of BXC, for net proceeds of $750 and realized a net loss of $16,949 on the sale.
On September 15, 2014, Echelon Aviation LLC (“Echelon”) repaid $37,313 of the $78,121 loan receivable to us.
On October 3, 2014, we sold our $35,000 investment in Babson CLO Ltd. 2011-I and realized a loss of $6,410 on the sale.
On October 7, 2014, Grocery Outlet, Inc. repaid the $14,457 loan receivable to us.
On October 10, 2014, ARRM Services, Inc. (“ARRM”) sold Ajax Rolled Ring & Machine, LLC (“Ajax”) to a third party and repaid the $19,337 loan receivable to us and we recorded a realized loss of $23,560 related to the sale. Concurrent with the sale, our ownership increased to 100% of the outstanding equity of ARRM Services, Inc. which was renamed SB Forging Company, Inc. (“SB Forging”). As such, we began consolidating SB Forging on October 11, 2014. In addition, there is $3,000 being held in escrow of which $802 was received on May 6, 2015 for which we realized a gain of the same amount. The remainder will be recognized as additional gain if and when received.
On October 20, 2014, we sold our $22,000 investment in Galaxy XII CLO, Ltd. and realized a loss of $2,435 on the sale.
On December 4, 2014, we sold our $29,075 investment in Babson CLO Ltd. 2012-I and realized a loss of $3,767 on the sale.
On December 4, 2014, we sold our $27,850 investment in Babson CLO Ltd. 2012-II and realized a loss of $2,949 on the sale.
On December 24, 2014, Focus Products Group International, LLC repaid the $19,745 loan receivable to us.
On February 13, 2015, CRT MIDCO, LLC repaid the $46,754 loan receivable to us.
On April 2, 2015, we sold our $74,654 investment in American Broadband Holding Company. There was no gain or loss realized on the sale.
On April 8, 2015, we sold 60% of the outstanding principal balance of the senior secured Term Loan A investment in Trinity for $59,253. There was no gain or loss realized on the sale.
On April 10, 2015, Sandow Media, LLC repaid the $24,425 loan receivable to us.
On April 16, 2015, Ikaria, Inc. repaid the $20,000 loan receivable to us.
On May 22, 2015, Blue Coat Systems, Inc. repaid the $11,000 loan receivable to us.
On June 2, 2015, we sold 100% of the outstanding principal balance of the senior secured Term Loan A investment in Fleetwash, Inc. for $24,079. There was no gain or loss realized on the sale.
On June 5, 2015, we sold our equity investment in Vets Securing America, Inc. (“VSA”) and realized a net loss of $975 on the sale. In connection with the sale, VSA was released as a borrower on the secured promissory notes, leaving The Healing Staff, Inc. (“THS”) as the sole borrower. During the year ended June 30, 2015, THS ceased operations and we recorded a realized loss of $2,956, reducing the amortized cost to zero.
On June 8, 2015, we sold an additional 10% of the total outstanding principal balance of the senior secured Term Loan A investment in Trinity for $9,876. There was no gain or loss realized on the sale.
On June 22, 2015, IDQ Holdings, Inc. repaid the $12,500 loan receivable to us.
On June 22, 2015, we sold 26.85% of the outstanding principal balance of the senior secured Term Loan A investment in PrimeSport for $19,950. There was no gain or loss realized on the sale.
On June 22, 2015, we sold an additional 20% of the total outstanding principal balance of the senior secured Term Loan A investment in Trinity for $19,751. There was no gain or loss realized on the sale.
On June 25, 2015, Deltek, Inc. repaid the $12,000 loan receivable to us.
73
In addition to the repayments noted above, during the year ended June 30, 2015, we received partial repayments of $31,365 of the NPRC loan previously outstanding and $5,577 as a return of capital on the equity investment in NPRC.
The following table provides a summary of our investment activity for each quarter within the three years ending June 30, 2015:
Quarter Ended | Acquisitions(1) | Dispositions(2) | ||||||
September 30, 2012 | $ | 747,937 | $ | 158,123 | ||||
December 31, 2012 | 772,125 | 349,269 | ||||||
March 31, 2013 | 784,395 | 102,527 | ||||||
June 30, 2013 | 798,760 | 321,615 | ||||||
September 30, 2013 | 556,843 | 164,167 | ||||||
December 31, 2013 | 608,153 | 255,238 | ||||||
March 31, 2014 | 1,343,256 | 197,947 | ||||||
June 30, 2014 | 444,104 | 169,617 | ||||||
September 30, 2014 | 887,205 | 863,144 | ||||||
December 31, 2014 | 522,705 | 224,076 | ||||||
March 31, 2015 | 219,111 | 108,124 | ||||||
June 30, 2015 | 459,967 | 437,729 | ||||||
(1) | Includes investments in new portfolio companies, follow-on investments in existing portfolio companies, refinancings and PIK interest. |
(2) | Includes sales, scheduled principal payments, prepayments and refinancings. |
Investment Valuation
In determining the fair value of our portfolio investments at June 30, 2015, the Audit Committee considered valuations from the independent valuation firms and from management having an aggregate range of $6,304,870 to $6,736,378, excluding money market investments.
In determining the range of value for debt instruments except CLOs and debt investments in controlled portfolio companies, management and the independent valuation firm generally estimate corporate and security credit ratings and identify corresponding yields to maturity for each loan from relevant market data. A discounted cash flow analysis was then prepared using the appropriate yield to maturity as the discount rate, to determine range of value. For non-traded equity investments, the enterprise value was determined by applying EBITDA multiples or book value multiples for similar guideline public companies and/or similar recent investment transactions. For stressed equity investments, a liquidation analysis was prepared.
In determining the range of value for our investments in CLOs, management and the independent valuation firm used a discounted cash flow model. The valuations were accomplished through the analysis of the CLO deal structures to identify the risk exposures from the modeling point of view as well as to determine an appropriate call date. For each CLO security, the most appropriate valuation approach was chosen from alternative approaches to ensure the most accurate valuation for such security. A waterfall engine is used to store the collateral data, generate collateral cash flows from the assets based on various assumptions for the risk factors, and distribute the cash flows to the liability structure based on the payment priorities, and discount them back using proper discount rates to anticipated maturity and call dates.
The Board of Directors looked at several factors in determining where within the range to value the asset including: recent operating and financial trends for the asset, independent ratings obtained from third parties, comparable multiples for recent sales of companies within the industry and discounted cash flow models for our investments in CLOs. The composite of all these analyses, applied to each investment, was a total valuation of $6,609,558.
Our portfolio companies are generally lower middle market companies, outside of the financial sector, with less than $150,000 of annual EBITDA. We believe our market has experienced less volatility than others because we believe there are more buy and hold investors who own these less liquid investments.
74
Control investments offer increased risk and reward over straight debt investments. Operating results and changes in market multiples can result in dramatic changes in values from quarter to quarter. Significant downturns in operations can further result in our looking to recoveries on sales of assets rather than the enterprise value of the investment. Transactions between our controlled investments and us have been detailed in Note 14 to the accompanying consolidated financial statements. Several control investments in our portfolio are under enhanced scrutiny by our senior management and our Board of Directors and are discussed below.
American Property REIT Corp.
APRC is a Maryland corporation and a qualified REIT for federal income tax purposes. APRC was formed to hold for investment, operate, finance, lease, manage, and sell a portfolio of real estate assets and engage in any and all other activities as may be necessary, incidental or convenient to carry out the foregoing. APRC acquires real estate assets, including, but not limited to, industrial, commercial, and multi-family properties. APRC may acquire real estate assets directly or through joint ventures by making a majority equity investment in a property-owning entity. As of June 30, 2015, we own 100% of the fully-diluted common equity of APRC.
During the year ended June 30, 2015, we provided $1,381 and $107 of debt and equity financing, respectively, to APRC for the acquisition of real estate properties and to fund capital expenditures for existing properties. During the year ended June 30, 2015, APRC transferred its investments in certain properties to NPRC. As a result, our investments in APRC related to these properties also transferred to NPRC. The investments transferred consisted of $12,985 of equity and $95,576 of debt. There was no gain or loss realized on these transactions. In addition, during the year ended June 30, 2015, we received $8 as a return of capital on the equity investment in APRC.
As of June 30, 2015, APRC’s real estate portfolio was comprised of twelve multi-family properties and one commercial property. The following table shows the location, acquisition date, purchase price, and mortgage outstanding due to other parties for each of the properties held by APRC as of June 30, 2015.
No. | Property Name | City | Acquisition Date | Purchase Price | Mortgage Outstanding | |||||||||
1 | 1557 Terrell Mill Road, LLC | Marietta, GA | 12/28/2012 | $ | 23,500 | $ | 15,164 | |||||||
2 | Lofton Place, LLC | Tampa, FL | 4/30/2013 | 26,000 | 16,965 | |||||||||
3 | Vista Palma Sola, LLC | Bradenton, FL | 4/30/2013 | 27,000 | 17,550 | |||||||||
4 | Arlington Park Marietta, LLC | Marietta, GA | 5/8/2013 | 14,850 | 9,650 | |||||||||
5 | Cordova Regency, LLC | Pensacola, FL | 11/15/2013 | 13,750 | 9,026 | |||||||||
6 | Crestview at Oakleigh, LLC | Pensacola, FL | 11/15/2013 | 17,500 | 11,488 | |||||||||
7 | Inverness Lakes, LLC | Mobile, AL | 11/15/2013 | 29,600 | 19,400 | |||||||||
8 | Kings Mill Pensacola, LLC | Pensacola, FL | 11/15/2013 | 20,750 | 13,622 | |||||||||
9 | Plantations at Pine Lake, LLC | Tallahassee, FL | 11/15/2013 | 18,000 | 11,817 | |||||||||
10 | Verandas at Rock Ridge, LLC | Birmingham, AL | 11/15/2013 | 15,600 | 10,205 | |||||||||
11 | Plantations at Hillcrest, LLC | Mobile, AL | 1/17/2014 | 6,930 | 4,972 | |||||||||
12 | Crestview at Cordova, LLC | Pensacola, FL | 1/17/2014 | 8,500 | 4,950 | |||||||||
13 | Taco Bell, OK | Yukon, OK | 6/4/2014 | 1,719 | — | |||||||||
$ | 223,699 | $ | 144,809 | |||||||||||
Due to an increase in same property values driven by an increase in net operating income and a decrease in observed market capitalization rates for the properties, the Board of Directors increased the fair value of our investment in APRC to $118,256 as of June 30, 2015, a premium of $18,064 to its amortized cost, compared to the $3,392 unrealized appreciation recorded at June 30, 2014.
75
First Tower Finance Company LLC
We own 80.1% of First Tower Finance Company LLC (“First Tower Finance”), which owns 100% of First Tower, LLC (“First Tower”), the operating company. First Tower is a multiline specialty finance company based in Flowood, Mississippi with over 170 branch offices.
On June 15, 2012, we acquired 80.1% of First Tower businesses for $110,200 in cash and 14,518,207 unregistered shares of our common stock. Based on our share price of $11.06 at the time of issuance, we acquired our 80.1% interest in First Tower for approximately $270,771. The assets of First Tower acquired include, among other things, the subsidiaries owned by First Tower, which hold finance receivables, leaseholds, and tangible property associated with First Tower’s businesses. As part of the transaction, we received $4,038 in structuring fee income from First Tower. On October 18, 2012, we funded an additional $20,000 of senior secured debt to support seasonally high demand during the holiday season. On December 30, 2013, we funded an additional $10,000 to again support seasonal demand and received $8,000 of structuring fees related to the renegotiation and expansion of First Tower’s revolver with a third party which was recognized as other income. As of June 30, 2015, First Tower had total assets of approximately $605,260 including $400,451 of finance receivables net of unearned charges. As of June 30, 2015, First Tower’s total debt outstanding to parties senior to us was $334,637.
Due to First Tower’s maintained positive momentum driven by strong volumes and historically low delinquencies, the Board of Directors increased the fair value of our investment in First Tower Finance to $365,950 as of June 30, 2015, a premium of $47,899 to its amortized cost, compared to the $7,134 unrealized appreciation recorded at June 30, 2014.
Harbortouch Payments, LLC
Harbortouch is a merchant processor headquartered in Allentown, Pennsylvania. The company offers a range of payment processing equipment and services that facilitate the exchange of goods and services provided by small to medium-sized merchants located in the United States for payments made by credit, debit, prepaid, electronic gift, and loyalty cards. Harbortouch provides point-of-sale equipment free of cost to merchants and then manages the process whereby transaction information is sent to a consumer’s bank from the point-of-sale (front-end processing), and then funds are transferred from the consumer’s account to the merchant’s account (back-end processing).
On March 31, 2014, we acquired a controlling interest in Harbortouch for $147,898 in cash and 2,306,294 unregistered shares of our common stock. We funded $130,796 of senior secured term debt, $123,000 of subordinated term debt and $24,898 of equity at closing. As part of the transaction, we received $7,536 of structuring fee income from Harbortouch. On April 1, 2014, we restructured our investment in Harbortouch and $14,226 of equity was converted into additional debt investment. On September 30, 2014, we made a $26,431 follow-on investment in Harbortouch to support an acquisition. As part of the transaction, we received $529 of structuring fee income and $50 of amendment fee income from Harbortouch which was recorded as other income. On December 19, 2014, we made an additional $1,292 equity investment in Harbortouch Class C voting units. As of June 30, 2015, we own 100% of the Class C voting units of Harbortouch, which provide for a 53.5% residual profits allocation.
Due to improved operating results and a corresponding increase in Harbortouch’s enterprise value, the Board of Directors increased the fair value of our investment in Harbortouch to $376,936 as of June 30, 2015, a premium of $71,477 to its amortized cost, compared to the $12,620 unrealized appreciation recorded at June 30, 2014.
National Property REIT Corp.
NPRC is a Maryland corporation and a qualified REIT for federal income tax purposes. NPRC was formed to hold for investment, operate, finance, lease, manage, and sell a portfolio of real estate assets and engage in any and all other activities as may be necessary, incidental or convenient to carry out the foregoing. NPRC acquires real estate assets, including, but not limited to, industrial, commercial, and multi-family properties. NPRC may acquire real estate assets directly or through joint ventures by making a majority equity investment in a property-owning entity. Additionally, through its wholly-owned subsidiaries, NPRC invests in online consumer loans. As of June 30, 2015, we own 100% of the fully-diluted common equity of NPRC.
During the year ended June 30, 2015, we provided $171,850 and $52,350 of debt and equity financing, respectively, to NPRC to enable certain of its wholly-owned subsidiaries to invest in online consumer loans. In addition, during the year ended June 30, 2015, we received partial repayments of $32,883 of the loans previously outstanding and $5,577 as a return of capital on the equity investment in NPRC.
76
The online consumer loan investments held by certain of NPRC’s wholly-owned subsidiaries are unsecured obligations of individual borrowers that are issued in amounts ranging from $1 to $35, with fixed interest rates and fixed terms of either 36 or 60 months. As of June 30, 2015, the investment in online consumer loans by certain of NPRC’s wholly-owned subsidiaries had a fair value of $366,014. The average outstanding individual loan balance is approximately $9 and the loans mature on dates ranging from October 31, 2016 to June 29, 2020. Fixed interest rates range from 5.3% to 29.0% with a weighted-average current interest rate of 19.6%.
During the year ended June 30, 2015, we provided $12,046 and $2,077 of debt and equity financing, respectively, to NPRC for the acquisition of real estate properties and to fund capital expenditures for existing properties. During the year ended June 30, 2015, APRC and UPRC transferred their investments in certain properties to NPRC. As a result, our investments in APRC and UPRC related to these properties also transferred to NPRC. The investments transferred consisted of $14,266 of equity and $105,020 of debt. There was no gain or loss realized on these transactions.
As of June 30, 2015, NPRC’s real estate portfolio was comprised of eleven multi-family properties and thirteen commercial properties. The following table shows the location, acquisition date, purchase price, and mortgage outstanding due to other parties for each of the properties held by NPRC as of June 30, 2015.
No. | Property Name | City | Acquisition Date | Purchase Price | Mortgage Outstanding | |||||||||
1 | 146 Forest Parkway, LLC | Forest Park, GA | 10/24/2012 | $ | 7,400 | $ | — | |||||||
2 | 5100 Live Oaks Blvd, LLC | Tampa, FL | 1/17/2013 | 63,400 | 39,600 | |||||||||
3 | NPRC Carroll Resort, LLC | Pembroke Pines, FL | 6/24/2013 | 225,000 | 157,500 | |||||||||
4 | APH Carroll 41, LLC | Marietta, GA | 11/1/2013 | 30,600 | 22,097 | |||||||||
5 | Matthews Reserve II, LLC | Matthews, NC | 11/19/2013 | 22,063 | 17,571 | |||||||||
6 | City West Apartments II, LLC | Orlando, FL | 11/19/2013 | 23,562 | 18,533 | |||||||||
7 | Vinings Corner II, LLC | Smyrna, GA | 11/19/2013 | 35,691 | 26,640 | |||||||||
8 | Uptown Park Apartments II, LLC | Altamonte Springs, FL | 11/19/2013 | 36,590 | 27,471 | |||||||||
9 | Mission Gate II, LLC | Plano, TX | 11/19/2013 | 47,621 | 36,148 | |||||||||
10 | St. Marin Apartments II, LLC | Coppell, TX | 11/19/2013 | 73,078 | 53,863 | |||||||||
11 | APH Carroll Bartram Park, LLC | Jacksonville, FL | 12/31/2013 | 38,000 | 28,500 | |||||||||
12 | APH Carroll Atlantic Beach, LLC | Atlantic Beach, FL | 1/31/2014 | 13,025 | 8,916 | |||||||||
13 | 23 Mile Road Self Storage, LLC | Chesterfield, MI | 8/19/2014 | 5,804 | 4,350 | |||||||||
14 | 36th Street Self Storage, LLC | Wyoming, MI | 8/19/2014 | 4,800 | 3,600 | |||||||||
15 | Ball Avenue Self Storage, LLC | Grand Rapids, MI | 8/19/2014 | 7,281 | 5,460 | |||||||||
16 | Ford Road Self Storage, LLC | Westland, MI | 8/29/2014 | 4,642 | 3,480 | |||||||||
17 | Ann Arbor Kalamazoo Self Storage, LLC | Ann Arbor, MI | 8/29/2014 | 4,458 | 3,345 | |||||||||
18 | Ann Arbor Kalamazoo Self Storage, LLC | Scio, MI | 8/29/2014 | 8,927 | 6,695 | |||||||||
19 | Ann Arbor Kalamazoo Self Storage, LLC | Kalamazoo, MI | 8/29/2014 | 2,363 | 1,775 | |||||||||
20 | Jolly Road Self Storage, LLC | Okemos, MI | 1/16/2015 | 7,492 | 5,620 | |||||||||
21 | Eaton Rapids Road Self Storage, LLC | Lansing West, MI | 1/16/2015 | 1,741 | 1,305 | |||||||||
22 | Haggerty Road Self Storage, LLC | Novi, MI | 1/16/2015 | 6,700 | 5,025 | |||||||||
23 | Waldon Road Self Storage, LLC | Lake Orion, MI | 1/16/2015 | 6,965 | 5,225 | |||||||||
24 | Tyler Road Self Storage, LLC | Ypsilanti, MI | 1/16/2015 | 3,507 | 2,630 | |||||||||
$ | 680,710 | $ | 485,349 | |||||||||||
Due to an increase in same property values driven by an increase in net operating income and a decrease in observed market capitalization rates for the properties, the Board of Directors increased the fair value of our investment in NPRC to $471,889 as of June 30, 2015, a premium of $22,229 to its amortized cost, compared to the $2,088 unrealized depreciation recorded at June 30, 2014.
77
United Property REIT Corp.
UPRC is a Delaware limited liability company and a qualified REIT for federal income tax purposes. UPRC was formed to hold for investment, operate, finance, lease, manage, and sell a portfolio of real estate assets and engage in any and all other activities as may be necessary, incidental or convenient to carry out the foregoing. UPRC acquires real estate assets, including, but not limited to, industrial, commercial, and multi-family properties. UPRC may acquire real estate assets directly or through joint ventures by making a majority equity investment in a property-owning entity. As of June 30, 2015, we own 100% of the fully-diluted common equity of UPRC.
During the year ended June 30, 2015, we provided $53,022 and $9,100 of debt and equity financing, respectively, to UPRC for the acquisition of certain properties and to fund capital expenditures for existing properties. During the year ended June 30, 2015, UPRC transferred its investments in certain properties to NPRC. As a result, our investments in UPRC related to these properties also transferred to NPRC. The investments transferred consisted of $1,281 of equity and $9,444 of debt. There was no gain or loss realized on the transaction.
As of June 30, 2015, UPRC’s real estate portfolio was comprised of fifteen multi-families properties and one commercial property. The following table shows the location, acquisition date, purchase price, and mortgage outstanding due to other parties for each of the properties held by UPRC as of June 30, 2015.
No. | Property Name | City | Acquisition Date | Purchase Price | Mortgage Outstanding | |||||||||
1 | Atlanta Eastwood Village LLC | Stockbridge, GA | 12/12/2013 | $ | 25,957 | $ | 19,785 | |||||||
2 | Atlanta Monterey Village LLC | Jonesboro, GA | 12/12/2013 | 11,501 | 9,193 | |||||||||
3 | Atlanta Hidden Creek LLC | Morrow, GA | 12/12/2013 | 5,098 | 3,619 | |||||||||
4 | Atlanta Meadow Springs LLC | College Park, GA | 12/12/2013 | 13,116 | 10,180 | |||||||||
5 | Atlanta Meadow View LLC | College Park, GA | 12/12/2013 | 14,354 | 11,141 | |||||||||
6 | Atlanta Peachtree Landing LLC | Fairburn, GA | 12/12/2013 | 17,224 | 13,575 | |||||||||
7 | Taco Bell, MO | Marshall, MO | 6/4/2014 | 1,405 | — | |||||||||
8 | Canterbury Green Apartments Holdings LLC | Fort Wayne, IN | 9/29/2014 | 85,500 | 65,825 | |||||||||
9 | Abbie Lakes OH Partners, LLC | Canal Winchester, OH | 9/30/2014 | 12,600 | 10,440 | |||||||||
10 | Kengary Way OH Partners, LLC | Reynoldsburg, OH | 9/30/2014 | 11,500 | 11,000 | |||||||||
11 | Lakeview Trail OH Partners, LLC | Canal Winchester, OH | 9/30/2014 | 26,500 | 20,142 | |||||||||
12 | Lakepoint OH Partners, LLC | Pickerington, OH | 9/30/2014 | 11,000 | 10,080 | |||||||||
13 | Sunbury OH Partners, LLC | Columbus, OH | 9/30/2014 | 13,000 | 10,480 | |||||||||
14 | Heatherbridge OH Partners, LLC | Blacklick, OH | 9/30/2014 | 18,416 | 15,480 | |||||||||
15 | Jefferson Chase OH Partners, LLC | Blacklick, OH | 9/30/2014 | 13,551 | 12,240 | |||||||||
16 | Goldenstrand OH Partners, LLC | Hilliard, OH | 10/29/2014 | 7,810 | 8,040 | |||||||||
$ | 288,532 | $ | 231,220 | |||||||||||
Due to an increase in same property values driven by an increase in net operating income and a decrease in observed market capitalization rates for the properties, the Board of Directors increased the fair value of our investment in UPRC to $84,685 as of June 30, 2015, a premium of $9,057 to its amortized cost, compared to the $426 unrealized appreciation recorded at June 30, 2014.
78
Valley Electric Company, Inc.
We own 94.99% of Valley Electric Company, Inc. (“Valley Electric”) as of June 30, 2015. Valley Electric owns 100% of the equity of VE Company, Inc., which owns 100% of the equity of Valley Electric Co. of Mt. Vernon, Inc. (“Valley”). Valley is a leading provider of specialty electrical services in the state of Washington and is among the top 50 electrical contractors in the U.S. The company, with its headquarters in Everett, Washington, offers a comprehensive array of contracting services, primarily for commercial, industrial, and transportation infrastructure applications, including new installation, engineering and design, design-build, traffic lighting and signalization, low to medium voltage power distribution, construction management, energy management and control systems, 24-hour electrical maintenance and testing, as well as special projects and tenant improvement services. Valley was founded in 1982 by the Ward family, who held the company until the end of 2012.
On December 31, 2012, we acquired 96.3% of the outstanding shares of Valley. We funded the recapitalization of Valley with $42,572 of debt and $9,526 of equity financing. Through the recapitalization, we acquired a controlling interest in Valley for $7,449 in cash and 4,141,547 unregistered shares of our common stock. On June 24, 2014, Prospect and management of Valley formed Valley Electric and contributed their shares of Valley stock to Valley Electric. Valley management made an additional equity investment in Valley Electric, reducing our ownership to 94.99%.
Due to soft operating results, the Board of Directors decreased the fair value of our investment in Valley Electric to $30,497 as of June 30, 2015, a discount of $28,340 from its amortized cost, compared to the $23,304 unrealized depreciation recorded at June 30, 2014.
Equity positions in the portfolio are susceptible to potentially significant changes in value, both increases as well as decreases, due to changes in operating results. Several of our controlled companies experienced such volatility and we recorded corresponding fluctuations in valuations during the year ended June 30, 2015. See above for discussions regarding the fluctuations in APRC, First Tower, Harbortouch, NPRC, UPRC, and Valley Electric. During the year ended June 30, 2015, the value of our investment in CP Energy Services Inc. (“CP Energy”) decreased by $41,927 as a result of depressed earnings resulting from softness of the energy markets; Gulf Coast Machine & Supply Company (“Gulf Coast”) decreased by $16,041 due to a decline in operating results; and R-V Industries, Inc. (“R-V”) decreased by $16,052 due to lower sales profitability. In total, thirteen of the controlled investments are valued at the original investment amounts or higher, and six of the controlled investments have been valued at discounts to the original investment. Overall, at June 30, 2015, control investments are valued at $79,558 above their amortized cost.
We hold one affiliate investment at June 30, 2015. Our affiliate portfolio company did not experience a significant change in valuation during the year ended June 30, 2015.
With the non-control/non-affiliate investments, generally, there is less volatility related to our total investments because our equity positions tend to be smaller than with our control/affiliate investments, and debt investments are generally not as susceptible to large swings in value as equity investments. For debt investments, the fair value is generally limited on the high side to each loan’s par value, plus any prepayment premia that could be imposed. Many of the debt investments in this category have not experienced a significant change in value, as they were previously valued at or near par value. Non-control/non-affiliate investments did not experience significant changes and are generally performing as expected or better than expected. During the year ended June 30, 2015, the value of our investment in Pacific World decreased by $21,328 due to a decline in operating results. Overall, at June 30, 2015, non-control/non-affiliate investments are valued at $30,171 below their amortized cost.
Capitalization
Our investment activities are capital intensive and the availability and cost of capital is a critical component of our business. We capitalize our business with a combination of debt and equity. Our debt as of June 30, 2015 consists of: a Revolving Credit Facility availing us of the ability to borrow debt subject to borrowing base determinations; Convertible Notes which we issued in December 2010, February 2011, April 2012, August 2012, December 2012 and April 2014; Public Notes which we issued in March 2013 and April 2014; and Prospect Capital InterNotes® which we may issue from time to time. Our equity capital is comprised entirely of common equity.
79
The following table shows the maximum draw amounts and outstanding borrowings of our Revolving Credit Facility, Convertible Notes, Public Notes and Prospect Capital InterNotes® as of June 30, 2015 and June 30, 2014.
June 30, 2015 | June 30, 2014 | ||||||||||||||
Maximum Draw Amount | Amount Outstanding | Maximum Draw Amount | Amount Outstanding | ||||||||||||
Revolving Credit Facility | $ | 885,000 | $ | 368,700 | $ | 857,500 | $ | 92,000 | |||||||
Convertible Notes | 1,239,500 | 1,239,500 | 1,247,500 | 1,247,500 | |||||||||||
Public Notes | 548,094 | 548,094 | 647,881 | 647,881 | |||||||||||
Prospect Capital InterNotes® | 827,442 | 827,442 | 785,670 | 785,670 | |||||||||||
Total | $ | 3,500,036 | $ | 2,983,736 | $ | 3,538,551 | $ | 2,773,051 | |||||||
The following table shows the contractual maturities of our Revolving Credit Facility, Convertible Notes, Public Notes and Prospect Capital InterNotes® as of June 30, 2015.
Payments Due by Period | |||||||||||||||||||
Total | Less than 1 Year | 1 – 3 Years | 3 – 5 Years | After 5 Years | |||||||||||||||
Revolving Credit Facility | $ | 368,700 | $ | — | $ | — | $ | 368,700 | $ | — | |||||||||
Convertible Notes | 1,239,500 | 150,000 | 497,500 | 592,000 | — | ||||||||||||||
Public Notes | 548,094 | — | — | 300,000 | 248,094 | ||||||||||||||
Prospect Capital InterNotes® | 827,442 | — | 54,509 | 369,938 | 402,995 | ||||||||||||||
Total Contractual Obligations | $ | 2,983,736 | $ | 150,000 | $ | 552,009 | $ | 1,630,638 | $ | 651,089 | |||||||||
The following table shows the contractual maturities of our Revolving Credit Facility, Convertible Notes, Public Notes and Prospect Capital InterNotes® as of June 30, 2014.
Payments Due by Period | |||||||||||||||||||
Total | Less than 1 Year | 1 – 3 Years | 3 – 5 Years | After 5 Years | |||||||||||||||
Revolving Credit Facility | $ | 92,000 | $ | — | $ | 92,000 | $ | — | $ | — | |||||||||
Convertible Notes | 1,247,500 | — | 317,500 | 530,000 | 400,000 | ||||||||||||||
Public Notes | 647,881 | — | — | — | 647,881 | ||||||||||||||
Prospect Capital InterNotes® | 785,670 | — | 8,859 | 261,456 | 515,355 | ||||||||||||||
Total Contractual Obligations | $ | 2,773,051 | $ | — | $ | 418,359 | $ | 791,456 | $ | 1,563,236 | |||||||||
Historically, we have funded a portion of our cash needs through borrowings from banks, issuances of senior securities, including secured, unsecured and convertible debt securities, or issuances of common equity. For flexibility, we maintain a universal shelf registration statement that allows for the public offering and sale of our debt securities, common stock, preferred stock, subscription rights, and warrants and units to purchase such securities in an amount up to $5,000,000 less issuances to date. As of June 30, 2015, we can issue up to $4,822,626 of additional debt and equity securities in the public market under this shelf registration. We may from time to time issue securities pursuant to the shelf registration statement or otherwise pursuant to private offerings. The issuance of debt or equity securities will depend on future market conditions, funding needs and other factors and there can be no assurance that any such issuance will occur or be successful.
Each of our Unsecured Notes (as defined below) are our general, unsecured obligations and rank equal in right of payment with all of our existing and future unsecured indebtedness and will be senior in right of payment to any of our subordinated indebtedness that may be issued in the future. The Unsecured Notes are effectively subordinated to our existing secured indebtedness, such as our credit facility, and future secured indebtedness to the extent of the value of the assets securing such indebtedness and structurally subordinated to any existing and future liabilities and other indebtedness of any of our subsidiaries.
80
Revolving Credit Facility
On March 27, 2012, we closed on an extended and expanded credit facility with a syndicate of lenders through PCF (the “2012 Facility”). The lenders had extended commitments of $857,500 under the 2012 Facility as of June 30, 2014, which was increased to $877,500 in July 2014. The 2012 Facility included an accordion feature which allowed commitments to be increased up to $1,000,000 in the aggregate. Interest on borrowings under the 2012 Facility was one-month LIBOR plus 275 basis points with no minimum LIBOR floor. Additionally, the lenders charged a fee on the unused portion of the 2012 Facility equal to either 50 basis points if at least half of the credit facility is drawn or 100 basis points otherwise.
On August 29, 2014, we renegotiated the 2012 Facility and closed an expanded five and a half year revolving credit facility (the “2014 Facility” and collectively with the 2012 Facility, the “Revolving Credit Facility”). The lenders have extended commitments of $885,000 under the 2014 Facility as of June 30, 2015. The 2014 Facility includes an accordion feature which allows commitments to be increased up to $1,500,000 in the aggregate. The revolving period of the 2014 Facility extends through March 2019, with an additional one year amortization period (with distributions allowed) after the completion of the revolving period. During such one year amortization period, all principal payments on the pledged assets will be applied to reduce the balance. At the end of the one year amortization period, the remaining balance will become due, if required by the lenders.
The 2014 Facility contains restrictions pertaining to the geographic and industry concentrations of funded loans, maximum size of funded loans, interest rate payment frequency of funded loans, maturity dates of funded loans and minimum equity requirements. The 2014 Facility also contains certain requirements relating to portfolio performance, including required minimum portfolio yield and limitations on delinquencies and charge-offs, violation of which could result in the early termination of the 2014 Facility. The 2014 Facility also requires the maintenance of a minimum liquidity requirement. As of June 30, 2015, we were in compliance with the applicable covenants.
Interest on borrowings under the 2014 Facility is one-month LIBOR plus 225 basis points with no minimum LIBOR floor. Additionally, the lenders charge a fee on the unused portion of the 2014 Facility equal to either 50 basis points if at least 35% of the credit facility is drawn or 100 basis points otherwise. The 2014 Facility requires us to pledge assets as collateral in order to borrow under the credit facility.
As of June 30, 2015 and June 30, 2014, we had $721,800 and $780,620, respectively, available to us for borrowing under the Revolving Credit Facility, of which the amount outstanding was $368,700 and $92,000, respectively. As additional eligible investments are transferred to PCF and pledged under the Revolving Credit Facility, PCF will generate additional availability up to the current commitment amount of $885,000. As of June 30, 2015, the investments, including money market funds, used as collateral for the Revolving Credit Facility had an aggregate fair value of $1,539,763, which represents 22.9% of our total investments and money market funds. These assets are held and owned by PCF, a bankruptcy remote special purpose entity, and as such, these investments are not available to our general creditors. The release of any assets from PCF requires the approval of the facility agent.
In connection with the origination and amendments of the Revolving Credit Facility, we incurred $8,866 of new fees and $3,539 of fees carried over for continuing participants from the previous facility, which are being amortized over the term of the facility in accordance with ASC 470-50, of which $10,280 remains to be amortized and is included within deferred financing costs on the Consolidated Statement of Assets and Liabilities as of June 30, 2015. In accordance with ASC 470-50, we expensed $332 of fees relating to credit providers in the 2012 Facility who did not commit to the 2014 Facility.
During the years ended June 30, 2015, 2014 and 2013, we recorded $14,424, $12,216 and $9,082, respectively, of interest costs, unused fees and amortization of financing costs on the Revolving Credit Facility as interest expense.
Convertible Notes
On December 21, 2010, we issued $150,000 aggregate principal amount of convertible notes that mature on December 15, 2015 (the “2015 Notes”), unless previously converted or repurchased in accordance with their terms. The 2015 Notes bear interest at a rate of 6.25% per year, payable semi-annually on June 15 and December 15 of each year, beginning June 15, 2011. Total proceeds from the issuance of the 2015 Notes, net of underwriting discounts and offering costs, were $145,200.
On February 18, 2011, we issued $172,500 aggregate principal amount of convertible notes that mature on August 15, 2016 (the “2016 Notes”), unless previously converted or repurchased in accordance with their terms. The 2016 Notes bear interest at a rate of 5.50% per year, payable semi-annually on February 15 and August 15 of each year, beginning August 15, 2011. Total proceeds from the issuance of the 2016 Notes, net of underwriting discounts and offering costs, were $167,325. Between January 30, 2012 and February 2, 2012, we repurchased $5,000 aggregate principal amount of the 2016 Notes at a price of 97.5, including commissions. The transactions resulted in our recognizing $10 of loss in the year ended June 30, 2012.
81
On April 16, 2012, we issued $130,000 aggregate principal amount of convertible notes that mature on October 15, 2017 (the “2017 Notes”), unless previously converted or repurchased in accordance with their terms. The 2017 Notes bear interest at a rate of 5.375% per year, payable semi-annually on April 15 and October 15 of each year, beginning October 15, 2012. Total proceeds from the issuance of the 2017 Notes, net of underwriting discounts and offering costs, were $126,035.
On August 14, 2012, we issued $200,000 aggregate principal amount of convertible notes that mature on March 15, 2018 (the “2018 Notes”), unless previously converted or repurchased in accordance with their terms. The 2018 Notes bear interest at a rate of 5.75% per year, payable semi-annually on March 15 and September 15 of each year, beginning March 15, 2013. Total proceeds from the issuance of the 2018 Notes, net of underwriting discounts and offering costs, were $193,600.
On December 21, 2012, we issued $200,000 aggregate principal amount of convertible notes that mature on January 15, 2019 (the “2019 Notes”), unless previously converted or repurchased in accordance with their terms. The 2019 Notes bear interest at a rate of 5.875% per year, payable semi-annually on January 15 and July 15 of each year, beginning July 15, 2013. Total proceeds from the issuance of the 2019 Notes, net of underwriting discounts and offering costs, were $193,600.
On April 11, 2014, we issued $400,000 aggregate principal amount of convertible notes that mature on April 15, 2020 (the “2020 Notes”), unless previously converted or repurchased in accordance with their terms. The 2020 Notes bear interest at a rate of 4.75% per year, payable semi-annually on April 15 and October 15 each year, beginning October 15, 2014. Total proceeds from the issuance of the 2020 Notes, net of underwriting discounts and offering costs, were $387,500. On January 30, 2015, we repurchased $8,000 aggregate principal amount of the 2020 Notes at a price of 93.0, including commissions. As a result of this transaction, we recorded a gain in the amount of the difference between the reacquisition price and the net carrying amount of the notes, net of the proportionate amount of unamortized debt issuance costs. The net gain on the extinguishment of the 2020 Notes in the year ended June 30, 2015 was $332.
Certain key terms related to the convertible features for the 2015 Notes, the 2016 Notes, the 2017 Notes, the 2018 Notes, the 2019 Notes and the 2020 Notes (collectively, the “Convertible Notes”) are listed below.
2015 Notes | 2016 Notes | 2017 Notes | 2018 Notes | 2019 Notes | 2020 Notes | ||||||||||||||||||
Initial conversion rate(1) | 88.0902 | 78.3699 | 85.8442 | 82.3451 | 79.7766 | 80.6647 | |||||||||||||||||
Initial conversion price | $ | 11.35 | $ | 12.76 | $ | 11.65 | $ | 12.14 | $ | 12.54 | $ | 12.40 | |||||||||||
Conversion rate at June 30, 2015(1)(2) | 89.9752 | 80.2196 | 87.7516 | 83.6661 | 79.8248 | 80.6670 | |||||||||||||||||
Conversion price at June 30, 2015(2)(3) | $ | 11.11 | $ | 12.47 | $ | 11.40 | $ | 11.95 | $ | 12.53 | $ | 12.40 | |||||||||||
Last conversion price calculation date | 12/21/2014 | 2/18/2015 | 4/16/2015 | 8/14/2014 | 12/21/2014 | 4/11/2015 | |||||||||||||||||
Dividend threshold amount (per share)(4) | $ | 0.101125 | $ | 0.101150 | $ | 0.101500 | $ | 0.101600 | $ | 0.110025 | $ | 0.110525 | |||||||||||
(1) | Conversion rates denominated in shares of common stock per $1 principal amount of the Convertible Notes converted. |
(2) | Represents conversion rate and conversion price, as applicable, taking into account certain de minimis adjustments that will be made on the conversion date. |
(3) | The conversion price in effect at June 30, 2015 was calculated on the last anniversary of the issuance and will be adjusted again on the next anniversary, unless the exercise price shall have changed by more than 1% before the anniversary. |
(4) | The conversion rate is increased if monthly cash dividends paid to common shares exceed the monthly dividend threshold amount, subject to adjustment. |
In no event will the total number of shares of common stock issuable upon conversion exceed 96.8992 per $1 principal amount of the 2015 Notes (the “conversion rate cap”), except that, to the extent we receive written guidance or a no-action letter from the staff of the Securities and Exchange Commission (the “Guidance”) permitting us to adjust the conversion rate in certain instances without regard to the conversion rate cap and to make the 2015 Notes convertible into certain reference property in accordance with certain reclassifications, business combinations, asset sales and corporate events by us without regard to the conversion rate cap, we will make such adjustments without regard to the conversion rate cap and will also, to the extent that we make any such adjustment without regard to the conversion rate cap pursuant to the Guidance, adjust the conversion rate cap accordingly. We will use our commercially reasonable efforts to obtain such Guidance as promptly as practicable.
Prior to obtaining the Guidance, we will not engage in certain transactions that would result in an adjustment to the conversion rate increasing the conversion rate beyond what it would have been in the absence of such transaction unless we have engaged in a reverse stock split or share combination transaction such that in our reasonable best estimation, the conversion rate following the adjustment for such transaction will not be any closer to the conversion rate cap than it would have been in the absence of such transaction.
82
Upon conversion, unless a holder converts after a record date for an interest payment but prior to the corresponding interest payment date, the holder will receive a separate cash payment with respect to the notes surrendered for conversion representing accrued and unpaid interest to, but not including, the conversion date. Any such payment will be made on the settlement date applicable to the relevant conversion on the Convertible Notes.
No holder of Convertible Notes will be entitled to receive shares of our common stock upon conversion to the extent (but only to the extent) that such receipt would cause such converting holder to become, directly or indirectly, a beneficial owner (within the meaning of Section 13(d) of the Securities Exchange Act of 1934 and the rules and regulations promulgated thereunder) of more than 5.0% of the shares of our common stock outstanding at such time. The 5.0% limitation shall no longer apply following the effective date of any fundamental change. We will not issue any shares in connection with the conversion or redemption of the Convertible Notes which would equal or exceed 20% of the shares outstanding at the time of the transaction in accordance with NASDAQ rules.
Subject to certain exceptions, holders may require us to repurchase, for cash, all or part of their Convertible Notes upon a fundamental change at a price equal to 100% of the principal amount of the Convertible Notes being repurchased plus any accrued and unpaid interest up to, but excluding, the fundamental change repurchase date. In addition, upon a fundamental change that constitutes a non-stock change of control we will also pay holders an amount in cash equal to the present value of all remaining interest payments (without duplication of the foregoing amounts) on such Convertible Notes through and including the maturity date.
In connection with the issuance of the Convertible Notes, we incurred $39,678 of fees which are being amortized over the terms of the notes, of which $21,274 remains to be amortized and is included within deferred financing costs on the Consolidated Statement of Assets and Liabilities as of June 30, 2015.
During the years ended June 30, 2015, 2014 and 2013, we recorded $74,365, $58,042 and $45,880, respectively, of interest costs and amortization of financing costs on the Convertible Notes as interest expense.
Public Notes
On May 1, 2012, we issued $100,000 aggregate principal amount of unsecured notes that were scheduled to mature on November 15, 2022 (the “2022 Notes”). The 2022 Notes bore interest at a rate of 6.95% per year, payable quarterly on February 15, May 15, August 15 and November 15 of each year, beginning August 15, 2012. Total proceeds from the issuance of the 2022 Notes, net of underwriting discounts and offering costs, were $97,000. On May 15, 2015, we redeemed $100,000 aggregate principal amount of the 2022 Notes at par. As a result of this transaction, we recorded a loss in the amount of the difference between the reacquisition price and the net carrying amount of the notes, net of the proportionate amount of unamortized debt issuance costs. The net loss on the extinguishment of the 2022 Notes in the year ended June 30, 2015 was $2,600.
On March 15, 2013, we issued $250,000 aggregate principal amount of unsecured notes that mature on March 15, 2023 (the “2023 Notes”). The 2023 Notes bear interest at a rate of 5.875% per year, payable semi-annually on March 15 and September 15 of each year, beginning September 15, 2013. Total proceeds from the issuance of the 2023 Notes, net of underwriting discounts and offering costs, were $245,885.
On April 7, 2014, we issued $300,000 aggregate principal amount of unsecured notes that mature on July 15, 2019 (the “5.00% 2019 Notes”). Included in the issuance is $45,000 of Prospect Capital InterNotes® that were exchanged for the 5.00% 2019 Notes. The 5.00% 2019 Notes bear interest at a rate of 5.00% per year, payable semi-annually on January 15 and July 15 of each year, beginning July 15, 2014. Total proceeds from the issuance of the 5.00% 2019 Notes, net of underwriting discounts and offering costs, were $250,775.
The 2022 Notes, the 2023 Notes and the 5.00% 2019 Notes (collectively, the “Public Notes”) are direct unsecured obligations and rank equally with all of our unsecured indebtedness from time to time outstanding.
In connection with the issuance of the 2023 Notes and the 5.00% 2019 Notes, we incurred $8,036 of fees which are being amortized over the term of the notes, of which $6,604 remains to be amortized and is included within deferred financing costs on the Consolidated Statement of Assets and Liabilities as of June 30, 2015.
During the years ended June 30, 2015, 2014 and 2013, we recorded $37,063, $25,988 and $11,672, respectively, of interest costs and amortization of financing costs on the Public Notes as interest expense.
83
Prospect Capital InterNotes®
On February 16, 2012, we entered into a selling agent agreement (the “Selling Agent Agreement”) with Incapital LLC, as purchasing agent for our issuance and sale from time to time of up to $500,000 of Prospect Capital InterNotes® (the “InterNotes® Offering”), which was increased to $1,500,000 in May 2014. Additional agents may be appointed by us from time to time in connection with the InterNotes® Offering and become parties to the Selling Agent Agreement.
These notes are direct unsecured obligations and rank equally with all of our unsecured indebtedness from time to time outstanding. Each series of notes will be issued by a separate trust. These notes bear interest at fixed interest rates and offer a variety of maturities no less than twelve months from the original date of issuance.
During the year ended June 30, 2015, we issued $125,696 aggregate principal amount of Prospect Capital InterNotes® for net proceeds of $123,641. These notes were issued with stated interest rates ranging from 3.375% to 5.10% with a weighted average interest rate of 4.65%. These notes mature between May 15, 2020 and June 15, 2022. The following table summarizes the Prospect Capital InterNotes® issued during the year ended June 30, 2015.
Tenor at Origination (in years) | Principal Amount | Interest Rate Range | Weighted Average Interest Rate | Maturity Date Range | |||||||
5.25 | $ | 7,126 | 4.625% | 4.625 | % | August 15, 2020 – September 15, 2020 | |||||
5.5 | 106,364 | 4.25%–4.75% | 4.63 | % | May 15, 2020 – November 15, 2020 | ||||||
6 | 2,197 | 3.375% | 3.375 | % | April 15, 2021 – May 15, 2021 | ||||||
6.5 | 3,912 | 5.10% | 5.10 | % | December 15, 2021 | ||||||
7 | 6,097 | 5.10% | 5.10 | % | May 15, 2022 – June 15, 2022 | ||||||
$ | 125,696 | ||||||||||
During the year ended June 30, 2014, we issued $473,762 aggregate principal amount of Prospect Capital InterNotes® for net proceeds of $465,314. These notes were issued with stated interest rates ranging from 3.75% to 6.75% with a weighted average interest rate of 5.12%. These notes mature between October 15, 2016 and October 15, 2043. The following table summarizes the Prospect Capital InterNotes® issued during the year ended June 30, 2014.
Tenor at Origination (in years) | Principal Amount | Interest Rate Range | Weighted Average Interest Rate | Maturity Date Range | |||||||
3 | $ | 5,710 | 4.00% | 4.00 | % | October 15, 2016 | |||||
3.5 | 3,149 | 4.00% | 4.00 | % | April 15, 2017 | ||||||
4 | 45,751 | 3.75%–4.00% | 3.92 | % | November 15, 2017 – May 15, 2018 | ||||||
5 | 207,915 | 4.25%–5.00% | 4.92 | % | July 15, 2018 – May 15, 2019 | ||||||
5.5 | 53,820 | 4.75%–5.00% | 4.86 | % | February 15, 2019 – August 15, 2019 | ||||||
6.5 | 1,800 | 5.50% | 5.50 | % | February 15, 2020 | ||||||
7 | 62,409 | 5.25%–5.75% | 5.44 | % | July 15, 2020 – May 15, 2021 | ||||||
7.5 | 1,996 | 5.75% | 5.75 | % | February 15, 2021 | ||||||
10 | 23,850 | 5.75%–6.50% | 5.91 | % | January 15, 2024 – May 15, 2024 | ||||||
12 | 2,978 | 6.00% | 6.00 | % | November 15, 2025 – December 15, 2025 | ||||||
15 | 2,495 | 6.00% | 6.00 | % | August 15, 2028 – November 15, 2028 | ||||||
18 | 4,062 | 6.00%–6.25% | 6.21 | % | July 15, 2031 – August 15, 2031 | ||||||
20 | 2,791 | 6.00% | 6.00 | % | September 15, 2033 – October 15, 2033 | ||||||
25 | 34,886 | 6.25%–6.50% | 6.39 | % | August 15, 2038 – May 15, 2039 | ||||||
30 | 20,150 | 6.50%–6.75% | 6.60 | % | July 15, 2043 – October 15, 2043 | ||||||
$ | 473,762 | ||||||||||
84
During the year ended June 30, 2015, we redeemed $76,931 aggregate principal amount of Prospect Capital InterNotes® at par with a weighted average interest rate of 6.06% in order to replace debt with higher interest rates with debt with lower rates. During the year ended June 30, 2015, we repaid $6,993 aggregate principal amount of Prospect Capital InterNotes® at par in accordance with the Survivor’s Option, as defined in the InterNotes® Offering prospectus. As a result of these transactions, we recorded a loss in the amount of the difference between the reacquisition price and the net carrying amount of the notes, net of the proportionate amount of unamortized debt issuance costs. The net loss on the extinguishment of Prospect Capital InterNotes® in the year ended June 30, 2015 was $1,682. The following table summarizes the Prospect Capital InterNotes® outstanding as of June 30, 2015.
Tenor at Origination (in years) | Principal Amount | Interest Rate Range | Weighted Average Interest Rate | Maturity Date Range | |||||||
3 | $ | 5,710 | 4.00% | 4.00 | % | October 15, 2016 | |||||
3.5 | 3,109 | 4.00% | 4.00 | % | April 15, 2017 | ||||||
4 | 45,690 | 3.75%–4.00% | 3.92 | % | November 15, 2017 – May 15, 2018 | ||||||
5 | 207,719 | 4.25%–5.00% | 4.92 | % | July 15, 2018 – May 15, 2019 | ||||||
5.25 | 7,126 | 4.625% | 4.63 | % | August 15, 2020 – September 15, 2020 | ||||||
5.5 | 115,184 | 4.25%–5.00% | 4.65 | % | February 15, 2019 – November 15, 2020 | ||||||
6.0 | 2,197 | 3.375% | 3.38 | % | April 15, 2021 – May 15, 2021 | ||||||
6.5 | 5,712 | 5.10%–5.50% | 5.23 | % | February 15, 2020 – December 15, 2021 | ||||||
7 | 191,549 | 4.00%–5.85% | 5.13 | % | September 15, 2019 – June 15, 2022 | ||||||
7.5 | 1,996 | 5.75% | 5.75 | % | February 15, 2021 | ||||||
10 | 36,925 | 3.29%–7.00% | 6.11 | % | March 15, 2022 – May 15, 2024 | ||||||
12 | 2,978 | 6.00% | 6.00 | % | November 15, 2025 – December 15, 2025 | ||||||
15 | 17,385 | 5.00%–6.00% | 5.14 | % | May 15, 2028 – November 15, 2028 | ||||||
18 | 22,729 | 4.125%–6.25% | 5.52 | % | December 15, 2030 – August 15, 2031 | ||||||
20 | 4,530 | 5.75%–6.00% | 5.89 | % | November 15, 2032 – October 15, 2033 | ||||||
25 | 36,320 | 6.25%–6.50% | 6.39 | % | August 15, 2038 – May 15, 2039 | ||||||
30 | 120,583 | 5.50%–6.75% | 6.23 | % | November 15, 2042 – October 15, 2043 | ||||||
$ | 827,442 | ||||||||||
During the year ended June 30, 2014, we repaid $6,869 aggregate principal amount of Prospect Capital InterNotes® in accordance with the Survivor’s Option, as defined in the InterNotes® Offering prospectus. In connection with the issuance of the 5.00% 2019 Notes, $45,000 of previously-issued Prospect Capital InterNotes® were exchanged for the 5.00% 2019 Notes. The following table summarizes the Prospect Capital InterNotes® outstanding as of June 30, 2014.
Tenor at Origination (in years) | Principal Amount | Interest Rate Range | Weighted Average Interest Rate | Maturity Date Range | |||||||
3 | $ | 5,710 | 4.00% | 4.00 | % | October 15, 2016 | |||||
3.5 | 3,149 | 4.00% | 4.00 | % | April 15, 2017 | ||||||
4 | 45,751 | 3.75%–4.00% | 3.92 | % | November 15, 2017 – May 15, 2018 | ||||||
5 | 207,915 | 4.25%–5.00% | 4.92 | % | July 15, 2018 – August 15, 2019 | ||||||
5.5 | 8,820 | 5.00% | 4.86 | % | February 15, 2019 | ||||||
6.5 | 1,800 | 5.50% | 5.50 | % | February 15, 2020 | ||||||
7 | 256,903 | 4.00%–6.55% | 5.39 | % | June 15, 2019 – May 15, 2021 | ||||||
7.5 | 1,996 | 5.75% | 5.75 | % | February 15, 2021 | ||||||
10 | 41,952 | 3.23%–7.00% | 6.18 | % | March 15, 2022 – May 15, 2024 | ||||||
12 | 2,978 | 6.00% | 6.00 | % | November 15, 2025 – December 15, 2025 | ||||||
15 | 17,465 | 5.00%–6.00% | 5.14 | % | May 15, 2028 – November 15, 2028 | ||||||
18 | 25,435 | 4.125%–6.25% | 5.49 | % | December 15, 2030 – August 15, 2031 | ||||||
20 | 5,847 | 5.625%–6.00% | 5.85 | % | November 15, 2032 – October 15, 2033 | ||||||
25 | 34,886 | 6.25%–6.50% | 6.39 | % | August 15, 2038 – May 15, 2039 | ||||||
30 | 125,063 | 5.50%–6.75% | 6.22 | % | November 15, 2042 – October 15, 2043 | ||||||
$ | 785,670 | ||||||||||
85
In connection with the issuance of Prospect Capital InterNotes®, we incurred $20,168 of fees which are being amortized over the term of the notes, of which $16,262 remains to be amortized and is included within deferred financing costs on the Consolidated Statement of Assets and Liabilities as of June 30, 2015.
During the years ended June 30, 2015, 2014 and 2013, we recorded $44,808, $33,857 and $9,707, respectively, of interest costs and amortization of financing costs on the Prospect Capital InterNotes® as interest expense.
Net Asset Value
During the year ended June 30, 2015, we issued $160,122 of additional equity, net of underwriting and offering costs, by issuing 16,464,122 shares of our common stock. During the year ended June 30, 2015, we sold 14,845,556 shares of our common stock at an average price of $9.89 per share, and raised $146,827 of gross proceeds, under our at-the-market offering program (the “ATM Program”). Net proceeds were $145,441 after commissions to the broker-dealer on shares sold and offering costs. During the year ended June 30, 2015, we issued 1,618,566 shares of our common stock in connection with the dividend reinvestment plan. The following table shows the calculation of net asset value per share as of June 30, 2015 and June 30, 2014.
June 30, 2015 | June 30, 2014 | |||||||
Net assets | $ | 3,703,049 | $ | 3,618,182 | ||||
Shares of common stock issued and outstanding | 359,090,759 | 342,626,637 | ||||||
Net asset value per share | $ | 10.31 | $ | 10.56 | ||||
Results of Operations
Net increase in net assets resulting from operations for the years ended June 30, 2015, 2014 and 2013 was $346,339, $319,020 and $220,856, respectively. During the year ended June 30, 2015, the significant increase in the asset base resulted in an additional $135,233 of interest income which was partially offset by increased interest costs from the leverage utilized of $40,557 and increased base management fees of $25,600. Also reducing the net increase in net assets resulting from operations for the year ended June 30, 2015 versus June 30, 2014 were significant declines in the dividends received from Airmall, Borga, and Credit Central, and a decrease in other income of $37,266. The decrease in other income is primarily from a reduction in structuring fees from lower origination levels and purchases of online consumer and commercial loans, which do not generate structuring fees. (See “Investment Income” for more details on our originations in each period.) These decreases were partially offset by a $25,745 favorable decrease in net realized and unrealized losses on investments. (See “Net Realized Losses” and “Net Change in Unrealized Appreciation (Depreciation)” for further discussion.)
During the year ended June 30, 2014, the significant increase in the asset base resulted in an additional $178,286 of interest income which was partially offset by increased interest costs from the leverage utilized of $53,762 and increased base management fees of $39,190. Also reducing the net increase in net assets resulting from operations for the year ended June 30, 2014 versus June 30, 2013 were significant declines in the dividends received from Energy Solutions. These decreases were partially offset by a $65,865 favorable decrease in net realized and unrealized losses on investments. (See “Net Realized Losses” and “Net Change in Unrealized Appreciation (Depreciation)” for further discussion.)
Net increase in net assets resulting from operations for the years ended June 30, 2015, 2014 and 2013 was $0.98, $1.06 and $1.07 per weighted average share, respectively. During the year ended June 30, 2015, the decrease is primarily due to a $0.14 per weighted average share decrease in other income driven by reduced structuring fees and a $0.07 per weighted average share decrease in dividend income received from our investments in Airmall, Borga, and Credit Central. These decreases were partially offset by a $0.04 per weighted average share decrease in income incentive fees and a $0.09 per weighted average share favorable decrease in net realized and unrealized losses on investments.
During the year ended June 30, 2014, the decrease is primarily due to a $0.41 per weighted average share decrease in investment income driven by a $0.31 per weighted average share decrease in dividend income received from our investment in Energy Solutions. The decrease is also attributable to a $0.06 per weighted average share increase in interest costs from the leverage utilized. These decreases were partially offset by a $0.09 per weighted average share decrease in income incentive fees and a $0.37 per weighted average share favorable decrease in net realized and unrealized losses on investments.
While we seek to maximize gains and minimize losses, our investments in portfolio companies can expose our capital to risks greater than those we may anticipate. These companies are typically not issuing securities rated investment grade, have limited resources, have limited operating history, have concentrated product lines or customers, are generally private companies with limited operating information available and are likely to depend on a small core of management talents. Changes in any of these factors can have a significant impact on the value of the portfolio company.
86
Investment Income
We generate revenue in the form of interest income on the debt securities that we own, dividend income on any common or preferred stock that we own, and fees generated from the structuring of new deals. Our investments, if in the form of debt securities, will typically have a term of one to ten years and bear interest at a fixed or floating rate. To the extent achievable, we will seek to collateralize our investments by obtaining security interests in our portfolio companies’ assets. We also may acquire minority or majority equity interests in our portfolio companies, which may pay cash or in-kind dividends on a recurring or otherwise negotiated basis. In addition, we may generate revenue in other forms including prepayment penalties and possibly consulting fees. Any such fees generated in connection with our investments are recognized as earned.
Investment income, which consists of interest income, including accretion of loan origination fees and prepayment penalty fees, dividend income and other income, including settlement of net profits interests, overriding royalty interests and structuring fees, was $791,084, $712,291 and $576,336 for the years ended June 30, 2015, 2014 and 2013, respectively. The increases are primarily the result of a larger income producing portfolio. The following table describes the various components of investment income and the related levels of debt investments:
Year Ended June 30, | |||||||||||
2015 | 2014 | 2013 | |||||||||
Interest income | $ | 748,974 | $ | 613,741 | $ | 435,455 | |||||
Dividend income | 7,663 | 26,837 | 82,705 | ||||||||
Other income | 34,447 | 71,713 | 58,176 | ||||||||
Total investment income | $ | 791,084 | $ | 712,291 | $ | 576,336 | |||||
Average debt principal of performing investments | $ | 6,183,163 | $ | 4,886,910 | $ | 2,878,417 | |||||
Weighted average interest rate earned on performing debt and equity investments | 12.11 | % | 12.56 | % | 15.13 | % | |||||
Average interest income producing assets increased from $2,878,417 for the year ended June 30, 2013 to $4,886,910 for the year ended June 30, 2014 to $6,183,163 for the year ended June 30, 2015. The average interest earned on interest bearing performing assets decreased from 15.13% for the year ended June 30, 2013 to 12.56% for the year ended June 30, 2014 to 12.11% for the year ended June 30, 2015. The decrease in returns during the respective periods is primarily due to originations at lower rates than our average existing portfolio yield and, to a lesser extent, a decline in prepayment penalty income. Excluding the adjustment for prepayment penalty income, our annual return would have been 14.13% for the year ended June 30, 2013, 12.28% for the year ended June 30, 2014, and 11.97% for the year ended June 30, 2015.
Investment income is also generated from dividends and other income. Dividend income decreased from $26,837 for the year ended June 30, 2014 to $7,663 for the year ended June 30, 2015. The decrease in dividend income is primarily attributed to a $12,000 decrease in the level of dividends received from our investment in Airmall. We received dividends of $12,000 from Airmall during the year ended June 30, 2014. No such dividends were received from Airmall during the year ended June 30, 2015. The decrease in dividend income is further attributed to a $4,682 and $3,246 decrease in the level of dividends received from our investments in Credit Central and Borga (f/k/a STI Holding, Inc.), respectively. We received dividends of $159 and $4,841 from Credit Central during the years ended June 30, 2015 and June 30, 2014, respectively. We received dividends of $3,246 from Borga during the year ended June 30, 2014. No dividends were received from Borga during the year ended June 30, 2015. The decrease in dividend income was partially offset by dividends of $1,929 received from our investment in First Tower during the year ended June 30, 2015. No dividends were received from First Tower during the year ended June 30, 2014.
Dividend income decreased from $82,705 for the year ended June 30, 2013 to $26,837 for the year ended June 30, 2014. The decrease in dividend income is primarily attributed to a $53,820 decrease in the level of dividends received from our investment in Energy Solutions. The sale of Gas Solutions by Energy Solutions resulted in significant earnings and profits, as defined by the Code, at Energy Solutions for calendar year 2012. In accordance with ASC 946, the distributions we received from Energy Solutions during calendar year 2012 were required to be recognized as dividend income, as there were current year earnings and profits sufficient to support such recognition. As a result, we recognized dividends of $53,820 from Energy Solutions during the year ended June 30, 2013. No such dividends were received from Energy Solutions during the year ended June 30, 2014. The decrease in dividend income is also attributed to a $23,362 decrease in the level of dividends received from our investment in R-V. We received dividends of $1,100 and $24,462 from R-V during the years ended June 30, 2014 and June 30, 2013, respectively. The dividends from R-V during the year ended June 30, 2013 included a distribution received as part of the portfolio company’s recapitalization in November 2012 for which we provided an additional $9,500 of senior secured financing. The decrease in dividend income was partially offset by dividends of $12,000, $4,841 and $5,000 received from our investments in Airmall, Credit Central and Nationwide, respectively, during the year ended June 30, 2014. The dividends from Credit Central and Nationwide
87
included distributions received as part of the portfolio companies’ recapitalizations in March 2014 for which we provided an additional $2,500 and $4,000 of financing, respectively. No dividends were received from Airmall, Credit Central or Nationwide during the year ended June 30, 2013.
Other income has come primarily from structuring fees, royalty interests, and settlement of net profits interests. Income from other sources decreased from $71,713 for the year ended June 30, 2014 to $34,447 for the year ended June 30, 2015. The decrease is primarily due to a $30,568 decrease in structuring fees. These fees are primarily generated from originations and will fluctuate as levels of originations and types of originations fluctuate. During the fiscal year ended June 30, 2015, we elected to suspend our equity raising activities. The curtailment of capital raising activities suppressed our levels of origination. Total originations decreased from $2,952,356 in the year ended June 30, 2014 to $2,088,988 in the year ended June 30, 2015. As a result, structuring fees fell from $57,697 in the year ended June 30, 2014 to $27,129 in the year ended June 30, 2015. Included within the $27,129 of structuring fees recognized during the year ended June 30, 2015 is a $3,000 fee from Airmall related to the sale of the operating company for which a fee was received in August 2014 and a $2,000 fee from Ajax related to the sale of the operating company for which a fee was received in October 2014. The remaining $22,129 of structuring fees recognized during the year ended June 30, 2015 resulted from follow-on investments in existing portfolio companies and new originations, primarily from our investments in InterDent, IWCO, Pacific World, PrimeSport, Trinity, and UPRC, as discussed above. To a lesser extent, the decrease in other income resulted from a decrease in miscellaneous income due to the receipt of $5,825 of legal cost reimbursement from a litigation settlement during the year ended June 30, 2014 which had been expensed in prior years. No such income was received during the year ended June 30, 2015.
Income from other sources increased from $58,176 for the year ended June 30, 2013 to $71,713 for the year ended June 30, 2014. The increase is primarily due to a $4,998 increase in structuring fees, $5,825 of legal cost reimbursement from a litigation settlement which had been expensed in prior years, and a $1,771 increase in royalty interests from our controlled investments, particularly APH, Credit Central, First Tower, Nationwide, NPH and UPH. During the years ended June 30, 2014 and June 30, 2013, we recognized structuring fees of $57,697 and $52,699, respectively, from new originations, restructurings and follow-on investments. Included within the $57,697 of structuring fees recognized during the year ended June 30, 2014 is an $8,000 fee from First Tower Delaware related to the renegotiation and expansion of First Tower’s third party revolver for which a fee was received in December 2013. The remaining $49,697 of structuring fees recognized during the year ended June 30, 2014 resulted from follow-on investments and new originations, primarily from our investments in Echelon, Harbortouch, IWCO and Matrixx.
Operating Expenses
Our primary operating expenses consist of investment advisory fees (base management and income incentive fees), borrowing costs, legal and professional fees and other operating and overhead-related expenses. These expenses include our allocable portion of overhead under the Administration Agreement with Prospect Administration under which Prospect Administration provides administrative services and facilities for us. Our investment advisory fees compensate the Investment Adviser for its work in identifying, evaluating, negotiating, closing and monitoring our investments. We bear all other costs and expenses of our operations and transactions. Operating expenses were $428,337, $355,068 and $251,412 for the years ended June 30, 2015, 2014 and 2013, respectively.
The base management fee was $134,590, $108,990 and $69,800 for the years ended June 30, 2015, 2014 and 2013, respectively ($0.38, $0.36 and $0.34 per weighted average share, respectively). The increases are directly related to our growth in total assets and the per weighted average share increase is also attributable to our increase in leverage year-over-year.
For the years ended June 30, 2015, 2014 and 2013, we incurred $90,687, $89,306 and $81,231 of income incentive fees, respectively ($0.26, $0.30 and $0.39 per weighted average share, respectively). Income incentive fees remained stable year-over-year on a dollars basis, but the per share decreases were driven by corresponding decreases in pre-incentive fee net investment income from $1.96 per weighted average share for the year ended June 30, 2013 to $1.49 per weighted average share for the year ended June 30, 2014 to $1.28 per weighted average share for the year ended June 30, 2015, primarily due to decreases in dividend and other income per share. No capital gains incentive fee has yet been incurred pursuant to the Investment Advisory Agreement.
During the years ended June 30, 2015, 2014 and 2013, we incurred $170,660, $130,103 and $76,341, respectively, of interest expenses related to our Revolving Credit Facility, Convertible Notes, Public Notes and Prospect Capital InterNotes® (collectively, our “Notes”). These expenses are related directly to the leveraging capacity put into place for each of those periods and the levels of indebtedness actually undertaken in those periods.
88
The table below describes the various expenses of our Notes and the related indicators of leveraging capacity and indebtedness during these periods.
Year Ended June 30, | |||||||||||
2015 | 2014 | 2013 | |||||||||
Interest on borrowings | $ | 149,312 | $ | 111,900 | $ | 62,657 | |||||
Amortization of deferred financing costs | 14,266 | 11,491 | 8,232 | ||||||||
Accretion of discount on Public Notes | 213 | 156 | 50 | ||||||||
Facility commitment fees | 6,869 | 6,556 | 5,402 | ||||||||
Total interest and credit facility expenses | $ | 170,660 | $ | 130,103 | $ | 76,341 | |||||
Average principal debt outstanding | $ | 2,830,727 | $ | 1,984,164 | $ | 1,066,368 | |||||
Weighted average stated interest rate on borrowings(1) | 5.27 | % | 5.64 | % | 5.88 | % | |||||
Weighted average interest rate on borrowings(2) | 6.03 | % | 6.56 | % | 7.16 | % | |||||
Revolving Credit Facility amount at beginning of period | $ | 857,500 | $ | 552,500 | $ | 492,500 | |||||
(1) | Includes only the stated interest expense. |
(2) | Includes the stated interest expense, amortization of deferred financing costs, accretion of discount on Public Notes and commitment fees on the undrawn portion of our Revolving Credit Facility. |
The increase in interest expense during the year ended June 30, 2015 is primarily due to utilizing more debt in 2015 and late 2014 including the issuance of additional Prospect Capital InterNotes®, the 5.00% 2019 Notes and the 2020 Notes, for which we incurred an incremental $38,898 of collective interest expense. The weighted average stated interest rate on borrowings (excluding amortization, accretion and undrawn facility fees) decreased from 5.64% for the year ended June 30, 2014 to 5.27% for the year ended June 30, 2015. This decrease is primarily due to issuances of debt at lower rates.
The increase in interest expense during the year ended June 30, 2014 compared to the year ended June 30, 2013 is primarily due to the issuance of additional Prospect Capital InterNotes®, the 2019 Notes, the 5.00% 2019 Notes, the 2020 Notes and the 2023 Notes, for which we incurred an incremental $49,101 of collective interest expense. The weighted average interest rate on borrowings (excluding amortization, accretion and undrawn facility fees) decreased from 5.88% for the year ended June 30, 2013 to 5.64% for the year ended June 30, 2014. This decrease is primarily due to issuances of debt at lower coupon rates.
The allocation of overhead expense from Prospect Administration was $21,906, $14,373 and $8,737 for the years ended June 30, 2015, 2014 and 2013, respectively. During the year ended June 30, 2015, Prospect Administration received payments of $6,929 directly from our portfolio companies for legal, tax and portfolio level accounting services. We were given a credit for these payments as a reduction of the administrative services cost payable by us to Prospect Administration, resulting in net overhead expense of $14,977 during the year ended June 30, 2015. Had Prospect Administration not received these payments, Prospect Administration’s charges for its administrative services would have increased by these amounts. As our portfolio continues to grow, we expect Prospect Administration to continue to increase the size of its administrative and financial staff.
We accrued an expense of $6,500 for excise taxes for the year ended June 30, 2013. During the year ended June 30, 2014, we amended our excise tax returns resulting in the $4,200 reversal of previously recognized expense and we recorded a $2,200 prepaid asset for the amount our $4,500 excise tax payment exceeded the excise tax liability estimated through June 30, 2014. During the year ended June 30, 2015, we amended our historical excise tax returns which resulted in the increased excise tax expense of $2,505 and we recorded an excise tax payable of $305.
Total operating expenses, net of investment advisory fees, interest and credit facility expenses, allocation of overhead from Prospect Administration and excise tax (“Other Operating Expenses”) were $14,918, $16,496 and $8,803 for the years ended June 30, 2015, 2014 and 2013, respectively. The decrease of $1,578 during the year ended June 30, 2015 is primarily due to a decrease in the expenses related to potential investments that did not materialize. The increase of $7,693 during the year ended June 30, 2014 is primarily due to an increase in our investor relations expense which is included within other general and administrative expenses. Investor relations expense increased due to increased proxy costs incurred for our larger investor base.
89
Net Investment Income
Net investment income represents the difference between investment income and operating expenses. Net investment income was $362,747, $357,223 and $324,924 for the years ended June 30, 2015, 2014 and 2013, respectively. During the year ended June 30, 2015, the significant increase in the asset base resulted in an additional $135,233 of interest income which was offset by increased interest costs from the leverage utilized of $40,557 and increased base management fees of $25,600. Also reducing net investment income for the year ended June 30, 2015 versus June 30, 2014 were significant declines in the dividends received from Airmall, Borga, and Credit Central, and a decrease in other income of $37,266. The decrease in other income is primarily from a reduction in structuring fees from lower origination levels and purchases of online consumer and commercial loans, which do not generate structuring fees.
During the year ended June 30, 2014, the significant increase in the asset base resulted in an additional $178,286 of interest income which was partially offset by increased interest costs from the leverage utilized of $53,762 and increased base management fees of $39,190. Also reducing net investment income for the year ended June 30, 2014 versus June 30, 2013 were significant declines in the dividends received from Energy Solutions.
Net investment income for the years ended June 30, 2015, 2014 and 2013 was $1.03, $1.19 and $1.57 per weighted average share, respectively. During the year ended June 30, 2015, the decrease is primarily due to a $0.14 per weighted average share decrease in other income driven by reduced structuring fees and a $0.07 per weighted average share decrease in dividend income received from our investments in Airmall, Borga, and Credit Central. These decreases were partially offset by a $0.04 per weighted average share decrease in income incentive fees.
During the year ended June 30, 2014, the decrease is primarily due to a $0.41 per weighted average share decrease in investment income driven by a $0.31 per weighted average share decrease in dividend income received from our investment in Energy Solutions. The decrease is also attributable to a $0.06 per weighted average share increase in interest costs from the leverage utilized. These decreases were partially offset by a $0.09 per weighted average share decrease in income incentive fees.
Net Realized Losses
During the years ended June 30, 2015, 2014 and 2013, we recognized net realized losses on investments of $180,423, $3,346 and $26,234, respectively. The net realized loss during the year ended June 30, 2015 was primarily due to the sale of our investments in Airmall, Ajax, Borga, BXC and VSA for which we recognized total realized losses of $47,546, and the sale of four of our CLO investments for which we realized total losses of $15,561, as discussed above. During the year ended June 30, 2015, we determined that the impairments of several of our investments (e.g., Appalachian Energy, Change Clean Energy Company, Coalbed, Edmentum, Manx, New Century Transportation, Stryker Energy, THS, Wind River Resources Corporation, and Yatesville Coal Company) were other-than-temporary and recorded total realized losses of $123,555 (which were previously recognized as unrealized losses) for the amount that the amortized cost exceeded the fair value. These losses were partially offset by net realized gains from the proceeds collected on warrants redeemed from Snacks Parent Corporation, litigation settlements, partial sales, and the release of escrowed amounts due to us from several portfolio companies, for which we recognized total realized gains of $6,239.
The net realized loss during the year ended June 30, 2014 was due primarily to realized losses of $7,853 and $1,669 related to the sale of our investments in National Bankruptcy Services, LLC and ICON Health & Fitness, Inc. (“ICON”), respectively. These losses were partially offset by net realized gains from the redemption of the Apidos CLO VIII subordinated notes, partial sales, and the release of escrowed amounts due to us from several portfolio companies, for which we recognized total realized gains of $6,176. The net realized loss during the year ended June 30, 2013 was primarily due to the H&M debt restructuring which resulted in a capital loss of $19,647 in connection with the foreclosure on the assets, and the sale of our investment in New Meatco Provisions, LLC for which we recognized a realized loss of $10,814. During the year ended June 30, 2013, we determined that the impairment of THS/VSA was other-than-temporary and recorded a realized loss of $12,117 (which was previously recognized as unrealized losses) for the amount that the amortized cost exceeded the fair value. These losses were partially offset by net realized gains from the sale of the assets formerly held by H&M, partial sales, and the release of escrowed amounts due to us from several portfolio companies, for which we recognized total realized gains of $16,344.
During the year ended June 30, 2015, we repurchased $8,000 aggregate principal amount of the 2020 Notes, redeemed $100,000 aggregate principal amount of the 2022 Notes, and redeemed $83,924 aggregate principal amount of Prospect Capital InterNotes® (including amounts repaid in accordance with the Survivor’s Option). As a result of these transactions, we recognized net realized losses on debt extinguishment of $3,950 in the year ended June 30, 2015. We did not recognize any gains or losses on debt extinguishment during the years ended June 30, 2014 and June 30, 2013.
90
Net Change in Unrealized Appreciation (Depreciation)
Net change in unrealized appreciation (depreciation) was $167,965, $(34,857) and $(77,834) for the years ended June 30, 2015, 2014 and 2013, respectively. The variability in results is primarily due to the valuation of equity positions in our portfolio susceptible to significant changes in value, both increases as well as decreases, due to operating results. For the year ended June 30, 2015, the $202,822 increase in net change in unrealized appreciation was primarily the result of realizing losses that were previously unrealized related to the sale of our investments in Airmall, Ajax, Borga, BXC and VSA, and the impairment of certain investments for which we eliminated the unrealized depreciation balances related to these investments. We also experienced significant write-ups in our investments in APRC, First Tower, Harbortouch, NPRC, and UPRC. These instances of unrealized appreciation were partially offset by unrealized depreciation related to CP Energy, Gulf Coast, Pacific World, R-V, and Valley Electric.
For the year ended June 30, 2014, the $42,977 increase in net change in unrealized depreciation was primarily the result of significant write-ups in our investments in CP Well, First Tower, Harbortouch, and our CLO equity investments. These instances of unrealized appreciation were partially offset by the significant write-down of our investment in NCT, which filed for bankruptcy in June 2014. As we held a second lien position and did not expect liquidation proceeds to exceed the first lien liability, we decreased the fair value of our debt investment in NCT to zero. We also experienced significant write-downs in our investments in Airmall, Ajax, Gulf Coast, and Valley Electric.
Financial Condition, Liquidity and Capital Resources
For the years ended June 30, 2015, 2014 and 2013, our operating activities provided (used) $45,464, $(1,725,231) and $(1,786,158) of cash, respectively. There were no investing activities for the years ended June 30, 2015, 2014 and 2013. Financing activities (used) provided $(69,663), $1,656,220 and $1,868,200 of cash during the years ended June 30, 2015, 2014 and 2013, respectively, which included dividend payments of $414,833, $377,070 and $242,301, respectively.
Our primary uses of funds have been to continue to invest in portfolio companies, through both debt and equity investments, repay outstanding borrowings and to make cash distributions to holders of our common stock.
Our primary sources of funds have historically been issuances of debt and equity. More recently, we have and may continue to fund a portion of our cash needs through repayments and opportunistic sales of our existing investment portfolio. We may also securitize a portion of our investments in unsecured or senior secured loans or other assets. Our objective is to put in place such borrowings in order to enable us to expand our portfolio. During the year ended June 30, 2015, we borrowed $1,567,000 and made repayments totaling $1,290,300 under our Revolving Credit Facility. As of June 30, 2015, we had $368,700 outstanding on our Revolving Credit Facility, $1,239,500 outstanding on the Convertible Notes, Public Notes with a carrying value of $548,094, and $827,442 outstanding on the Prospect Capital InterNotes®. (See “Capitalization” above.)
Undrawn committed revolvers and delayed draw term loans to our portfolio companies incur commitment and unused fees ranging from 0.00% to 2.00%. As of June 30, 2015 and June 30, 2014, we had $88,288 and $72,118, respectively, of undrawn revolver and delayed draw term loan commitments to our portfolio companies.
Our shareholders’ equity accounts as of June 30, 2015 and June 30, 2014 reflect cumulative shares issued as of those respective dates. Our common stock has been issued through public offerings, a registered direct offering, the exercise of over-allotment options on the part of the underwriters, our dividend reinvestment plan and in connection with the acquisition of certain controlled portfolio companies. When our common stock is issued, the related offering expenses have been charged against paid-in capital in excess of par. All underwriting fees and offering expenses were borne by us.
On August 24, 2011, our Board of Directors approved a share repurchase plan (the “Repurchase Program”) under which we may repurchase up to $100,000 of our common stock at prices below our net asset value per share. Prior to any repurchase, we are required to notify shareholders of our intention to purchase our common stock. Our last notice was delivered on June 16, 2015. This notice lasts for six months after notice is given. We did not make any purchases of our common stock during the period from August 24, 2011 to June 30, 2015 pursuant to the Repurchase Program. See “Recent Developments” for shares purchased under the Repurchase Program subsequent to June 30, 2015.
Our Board of Directors, pursuant to the Maryland General Corporation Law, executed Articles of Amendment to increase the number of shares authorized for issuance from 500,000,000 to 1,000,000,000 in the aggregate. The amendment became effective May 6, 2014.
On November 4, 2014, our Registration Statement on Form N-2 was declared effective by the SEC. Under this Shelf Registration Statement, we can issue up to $4,822,626 of additional debt and equity securities in the public market as of June 30, 2015.
91
On August 29, 2014, we entered into an ATM Program with BB&T Capital Markets, Goldman Sachs, KeyBanc Capital Markets, and RBC Capital Markets through which we could sell, by means of at-the-market offerings from time to time, up to 50,000,000 shares of our common stock. During the period from September 8, 2014 through October 29, 2014 (with settlement dates of September 11, 2014 to November 3, 2014), we sold 9,490,975 shares of our common stock at an average price of $10.03 per share and raised $95,149 of gross proceeds under the ATM Program. Net proceeds were $94,500 after commissions to the broker-dealer on shares sold and offering costs.
On November 7, 2014, we entered into an ATM Program with BB&T Capital Markets, Goldman Sachs, KeyBanc Capital Markets, RBC Capital Markets and Santander Investment Securities through which we could sell, by means of at-the-market offerings from time to time, up to 50,000,000 shares of our common stock. During the period from November 12, 2014 through November 28, 2014 (with settlement dates of November 17, 2014 to December 3, 2014), we sold 5,354,581 shares of our common stock at an average price of $9.65 per share and raised $51,678 of gross proceeds under the ATM Program. Net proceeds were $50,941 after commissions to the broker-dealer on shares sold and offering costs. There have been no issuances under the ATM Program subsequent to December 3, 2014.
Off-Balance Sheet Arrangements
As of June 30, 2015, we did not have any off-balance sheet liabilities or other contractual obligations that are reasonably likely to have a current or future material effect on our financial condition, other than those which originate from 1) the investment advisory and management agreement and the administration agreement and 2) the portfolio companies.
Recent Developments
On July 1, 2015, we provided $31,000 of first lien senior secured financing, of which $30,200 was funded at closing, to Intelius, Inc. (“Intelius”), an online information commerce company.
On July 8, 2015, we sold 27.45% of the outstanding principal balance of the senior secured Term Loan A investment in InterDent for $34,415. There was no gain or loss realized on the sale.
On July 23, 2015, we made an investment of $37,969 to purchase 80.73% of the subordinated notes in Halcyon Loan Advisors Funding 2015-3 Ltd. in a co-investment transaction with Priority Income Fund, Inc., a closed-end fund managed by an affiliate of Prospect Capital Management.
On July 23, 2015, we issued 193,892 shares of our common stock in connection with the dividend reinvestment plan.
On July 24, 2015, TB Corp. repaid the $23,628 loan receivable to us.
On August 6, 2015, we provided $92,500 of first lien senior secured debt to support the refinancing of Crosman Corporation. Concurrent with the refinancing, we received repayment of the $40,000 second lien term loan previously outstanding.
On August 7, 2015, Ryan, LLC repaid the $72,701 loan receivable to us.
On August 11, 2015, we made a $13,500 follow-on first lien senior secured debt investment in Intelius, of which $13,000 was funded at closing, to support an acquisition.
On August 12, 2015, we made an investment of $22,898 to purchase 50.04% of the subordinated notes in Octagon Investment Partners XVIII, Ltd.
On August 12, 2015, we sold 780 of our small business whole loans purchased from OnDeck to Jefferies Asset Funding LLC for proceeds of $26,562, net of related transaction expenses, and a trust certificate representing a 41.54% interest in the MarketPlace Loan Trust, Series 2015-OD2.
On August 14, 2015, we announced the then current conversion rate on the 2018 Notes as 84.1497 shares of common stock per $1 principal amount of the 2018 Notes converted, which is equivalent to a conversion price of approximately $11.88.
On August 20, 2015, we issued 152,896 shares of our common stock in connection with the dividend reinvestment plan.
On August 21, 2015, we committed to funding a $16,000 second lien secured investment in a provider of customer care outsourcing services.
92
During the period from July 1, 2015 through August 26, 2015, we made seven follow-on investments in NPRC totaling $52,852 to support the online consumer lending initiative. We invested $12,508 of equity through NPH and $40,344 of debt directly to ACL Loan Holdings, Inc., a wholly-owned subsidiary of NPRC.
During the period from July 1, 2015 through August 26, 2015, our wholly-owned subsidiary PSBL purchased $14,101 of small business whole loans from OnDeck.
During the period from July 1, 2015 through August 26, 2015, we issued $32,362 aggregate principal amount of Prospect Capital InterNotes® for net proceeds of $31,870. In addition, we sold $1,425 aggregate principal amount of Prospect Capital InterNotes® for net proceeds of $1,405 with expected closing on August 27, 2015.
During the period from July 28, 2015 through August 14, 2015 (with settlement dates of July 31, 2015 to August 19, 2015), we repurchased 4,158,750 shares of our common stock at an average price of $7.22 per share, including commissions.
On August 24, 2015, we announced the declaration of monthly dividends in the following amounts and with the following dates:
• | $0.08333 per share for September 2015 to holders of record on September 30, 2015 with a payment date of October 22, 2015; and |
• | $0.08333 per share for October 2015 to holders of record on October 30, 2015 with a payment date of November 19, 2015. |
Critical Accounting Policies and Estimates
Basis of Presentation and Consolidation
The accompanying consolidated financial statements have been prepared in accordance with United States generally accepted accounting principles (“GAAP”) pursuant to the requirements for reporting on Form 10-K, ASC 946, Financial Services—Investment Companies (“ASC 946”), and Articles 6, 10 and 12 of Regulation S-X. Under the 1940 Act, ASC 946, and the regulations pursuant to Article 6 of Regulation S-X, we are precluded from consolidating any entity other than another investment company or an operating company which provides substantially all of its services to benefit us. Our consolidated financial statements include the accounts of Prospect, PCF, PSBL, PYC, and the Consolidated Holding Companies. All intercompany balances and transactions have been eliminated in consolidation. The financial results of our non-substantially wholly-owned holding companies and operating portfolio company investments are not consolidated in the financial statements. Any operating companies owned by the Consolidated Holding Companies are not consolidated.
Use of Estimates
The preparation of the consolidated financial statements in accordance with GAAP requires us to make estimates and assumptions that affect the reported amounts of assets and liabilities at the date of the consolidated financial statements and the reported amounts of income, expenses, and gains and losses during the reported period. Changes in the economic environment, financial markets, creditworthiness of our portfolio companies and any other parameters used in determining these estimates could cause actual results to differ, and these differences could be material.
Cash and Cash Equivalents
Cash and cash equivalents include funds deposited with financial institutions and short-term, highly-liquid overnight investments in money market funds. Cash and cash equivalents are carried at cost which approximates fair value.
Investment Classification
We are a non-diversified company within the meaning of the 1940 Act. As required by the 1940 Act, we classify our investments by level of control. As defined in the 1940 Act, “Control Investments” are those where there is the ability or power to exercise a controlling influence over the management or policies of a company. Control is generally deemed to exist when a company or individual possesses or has the right to acquire within 60 days or less, a beneficial ownership of more than 25% of the voting securities of an investee company. Under the 1940 Act, “Affiliate Investments” are defined by a lesser degree of influence and are deemed to exist through the possession outright or via the right to acquire within 60 days or less, beneficial ownership of 5% or more of the outstanding voting securities of another person. “Non-Control/Non-Affiliate Investments” are those that are neither Control Investments nor Affiliate Investments.
93
Investments are recognized when we assume an obligation to acquire a financial instrument and assume the risks for gains or losses related to that instrument. Investments are derecognized when we assume an obligation to sell a financial instrument and forego the risks for gains or losses related to that instrument. Specifically, we record all security transactions on a trade date basis. Amounts for investments recognized or derecognized but not yet settled are reported in due to broker for investments purchased or as a receivable for investments sold in the consolidated statements of assets and liabilities.
Investment Risks
Our investments are subject to a variety of risks. Those risks include the following:
Market Risk
Market risk represents the potential loss that can be caused by a change in the fair value of the financial instrument.
Credit Risk
Credit risk represents the risk that we would incur if the counterparties failed to perform pursuant to the terms of their agreements with us.
Liquidity Risk
Liquidity risk represents the possibility that we may not be able to rapidly adjust the size of our investment positions in times of high volatility and financial stress at a reasonable price.
Interest Rate Risk
Interest rate risk represents a change in interest rates, which could result in an adverse change in the fair value of an interest-bearing financial instrument.
Prepayment Risk
Many of our debt investments allow for prepayment of principal without penalty. Downward changes in interest rates may cause prepayments to occur at a faster than expected rate, thereby effectively shortening the maturity of the security and making the security less likely to be an income producing instrument.
Investment Valuation
To value our investments, we follow the guidance of ASC 820, Fair Value Measurement (“ASC 820”), that defines fair value, establishes a framework for measuring fair value in conformity with GAAP, and requires disclosures about fair value measurements. In accordance with ASC 820, the fair value of our investments is defined as the price that we would receive upon selling an investment in an orderly transaction to an independent buyer in the principal or most advantageous market in which that investment is transacted.
ASC 820 classifies the inputs used to measure these fair values into the following hierarchy:
Level 1: Quoted prices in active markets for identical assets or liabilities, accessible by us at the measurement date.
Level 2: Quoted prices for similar assets or liabilities in active markets, or quoted prices for identical or similar assets or liabilities in markets that are not active, or other observable inputs other than quoted prices.
Level 3: Unobservable inputs for the asset or liability.
In all cases, the level in the fair value hierarchy within which the fair value measurement in its entirety falls has been determined based on the lowest level of input that is significant to the fair value measurement. Our assessment of the significance of a particular input to the fair value measurement in its entirety requires judgment and considers factors specific to each investment.
Our Board of Directors has established procedures for the valuation of our investment portfolio. These procedures are detailed below.
Investments for which market quotations are readily available are valued at such market quotations.
94
For most of our investments, market quotations are not available. With respect to investments for which market quotations are not readily available or when such market quotations are deemed not to represent fair value, our Board of Directors has approved a multi-step valuation process each quarter, as described below.
1. | Each portfolio company or investment is reviewed by our investment professionals with independent valuation firms engaged by our Board of Directors. |
2. | The independent valuation firms conduct independent valuations and make their own independent assessments. |
3. | The Audit Committee of our Board of Directors reviews and discusses the preliminary valuation of the Investment Adviser and that of the independent valuation firms. |
4. | The Board of Directors discusses valuations and determines the fair value of each investment in our portfolio in good faith based on the input of the Investment Adviser, the respective independent valuation firm and the Audit Committee. |
Our non-CLO investments are valued utilizing a yield analysis, enterprise value (“EV”) analysis, net asset value analysis, liquidation analysis, discounted cash flow analysis, or a combination of methods, as appropriate. The yield analysis uses loan spreads, dividend yields for certain investments and other relevant information implied by market data involving identical or comparable assets or liabilities. Under the EV analysis, the EV of a portfolio company is first determined and allocated over the portfolio company’s securities in order of their preference relative to one another (i.e., “waterfall” allocation). To determine the EV, we typically use a market multiples approach that considers relevant and applicable market trading data of guideline public companies, transaction metrics from precedent M&A transactions and/or a discounted cash flow analysis. The net asset value analysis is used to derive a value of an underlying investment (such as real estate property) by dividing a relevant earnings stream by an appropriate capitalization rate. For this purpose, we consider capitalization rates for similar properties as may be obtained from guideline public companies and/or relevant transactions. The liquidation analysis is intended to approximate the net recovery value of an investment based on, among other things, assumptions regarding liquidation proceeds based on a hypothetical liquidation of a portfolio company’s assets. The discounted cash flow analysis uses valuation techniques to convert future cash flows or earnings to a range of fair values from which a single estimate may be derived utilizing an appropriate discount rate. The measurement is based on the net present value indicated by current market expectations about those future amounts.
In applying these methodologies, additional factors that we consider in valuing our investments may include, as we deem relevant: security covenants, call protection provisions, and information rights; the nature and realizable value of any collateral; the portfolio company’s ability to make payments; the principal markets in which the portfolio company does business; publicly available financial ratios of peer companies; the principal market; and enterprise values, among other factors.
Our investments in CLOs are classified as ASC 820 Level 3 securities and are valued using a discounted cash flow model. The valuations have been accomplished through the analysis of the CLO deal structures to identify the risk exposures from the modeling point of view as well as to determine an appropriate call date. For each CLO security, the most appropriate valuation approach has been chosen from alternative approaches to ensure the most accurate valuation for such security. To value a CLO, both the assets and the liabilities of the CLO capital structure are modeled. We use a waterfall engine to store the collateral data, generate collateral cash flows from the assets based on various assumptions for the risk factors, distribute the cash flows to the liability structure based on the payment priorities, and discount them back using current market discount rates. The main risk factors are: default risk, interest rate risk, downgrade risk, and credit spread risk.
Valuation of Other Financial Assets and Financial Liabilities
ASC 825, Financial Instruments, specifically ASC 825-10-25, permits an entity to choose, at specified election dates, to measure eligible items at fair value (the “Fair Value Option”). We have not elected the Fair Value Option to report selected financial assets and financial liabilities. See Note 8 for further discussion of our financial liabilities that are measured using another measurement attribute.
Convertible Notes
We have recorded the Convertible Notes at their contractual amounts. The Convertible Notes were analyzed for any features that would require bifurcation and such features were determined to be immaterial. See Note 5 for further discussion.
95
Revenue Recognition
Realized gains or losses on the sale of investments are calculated using the specific identification method.
Interest income, adjusted for amortization of premium and accretion of discount, is recorded on an accrual basis. Origination, closing and/or commitment fees associated with investments in portfolio companies are accreted into interest income over the respective terms of the applicable loans. Accretion of such purchase discounts or amortization of premiums is calculated by the effective interest method as of the purchase date and adjusted only for material amendments or prepayments. Upon the prepayment of a loan or debt security, any prepayment penalties and unamortized loan origination, closing and commitment fees are recorded as interest income. The purchase discount for portfolio investments acquired from Patriot Capital Funding, Inc. (“Patriot”) was determined based on the difference between par value and fair value as of December 2, 2009, and continued to accrete until maturity or repayment of the respective loans. As of December 31, 2013, the purchase discount for the assets acquired from Patriot had been fully accreted. See Note 3 for further discussion.
Loans are placed on non-accrual status when there is reasonable doubt that principal or interest will be collected. Unpaid accrued interest is generally reversed when a loan is placed on non-accrual status. Interest payments received on non-accrual loans may be recognized as income or applied to principal depending upon management’s judgment. Non-accrual loans are restored to accrual status when past due principal and interest is paid and in management’s judgment, is likely to remain current. As of June 30, 2015, approximately 0.1% of our total assets are in non-accrual status.
Interest income from investments in the “equity” class of security of CLO funds (typically income notes or subordinated notes) is recorded based upon an estimation of an effective yield to expected maturity utilizing assumed cash flows in accordance with ASC 325-40, Beneficial Interests in Securitized Financial Assets. We monitor the expected cash inflows from our CLO equity investments, including the expected residual payments, and the effective yield is determined and updated periodically.
Dividend income is recorded on the ex-dividend date.
Structuring fees and similar fees are recognized as income as earned, usually when paid. Structuring fees, excess deal deposits, net profits interests and overriding royalty interests are included in other income. See Note 10 for further discussion.
Federal and State Income Taxes
We have elected to be treated as a regulated investment company and intend to continue to comply with the requirements of the Code applicable to regulated investment companies. We are required to distribute at least 90% of our investment company taxable income and intend to distribute (or retain through a deemed distribution) all of our investment company taxable income and net capital gain to stockholders; therefore, we have made no provision for income taxes. The character of income and gains that we will distribute is determined in accordance with income tax regulations that may differ from GAAP. Book and tax basis differences relating to stockholder dividends and distributions and other permanent book and tax differences are reclassified to paid-in capital.
If we do not distribute (or are not deemed to have distributed) at least 98% of our annual ordinary income and 98.2% of our capital gains in the calendar year earned, we will generally be required to pay an excise tax equal to 4% of the amount by which 98% of our annual ordinary income and 98.2% of our capital gains exceed the distributions from such taxable income for the year. To the extent that we determine that our estimated current year annual taxable income will be in excess of estimated current year dividend distributions from such taxable income, we accrue excise taxes, if any, on estimated excess taxable income. For the calendar year ended December 31, 2014, we incurred an excise tax expense of $461 because our annual taxable income exceeded our distributions. As of June 30, 2015, we had a payable of $305 for excise taxes as our expected excise tax liability exceeded our excise tax payments through June 30, 2015. This amount is included within accrued expenses on the Consolidated Statement of Assets and Liabilities as of June 30, 2015.
96
If we fail to satisfy the annual distribution requirement or otherwise fail to qualify as a RIC in any taxable year, we would be subject to tax on all of our taxable income at regular corporate rates. We would not be able to deduct distributions to stockholders, nor would we be required to make distributions. Distributions would generally be taxable to our individual and other non-corporate taxable stockholders as ordinary dividend income eligible for the reduced maximum rate applicable to qualified dividend income to the extent of our current and accumulated earnings and profits, provided certain holding period and other requirements are met. Subject to certain limitations under the Code, corporate distributions would be eligible for the dividends-received deduction. To qualify again to be taxed as a RIC in a subsequent year, we would be required to distribute to our shareholders our accumulated earnings and profits attributable to non-RIC years reduced by an interest charge of 50% of such earnings and profits payable by us as an additional tax. In addition, if we failed to qualify as a RIC for a period greater than two taxable years, then, in order to qualify as a RIC in a subsequent year, we would be required to elect to recognize and pay tax on any net built-in gain (the excess of aggregate gain, including items of income, over aggregate loss that would have been realized if we had been liquidated) or, alternatively, be subject to taxation on such built-in gain recognized for a period of ten years.
We follow ASC 740, Income Taxes (“ASC 740”). ASC 740 provides guidance for how uncertain tax positions should be recognized, measured, presented, and disclosed in the consolidated financial statements. ASC 740 requires the evaluation of tax positions taken or expected to be taken in the course of preparing our tax returns to determine whether the tax positions are “more-likely-than-not” of being sustained by the applicable tax authority. Tax positions not deemed to meet the more-likely-than-not threshold are recorded as a tax benefit or expense in the current year. As of June 30, 2014 and June 30, 2015 and for the years then ended, we did not have a liability for any tax benefits. Management’s determinations regarding ASC 740 may be subject to review and adjustment at a later date based upon factors including, but not limited to, an on-going analysis of tax laws, regulations and interpretations thereof. Although we file both federal and state income tax returns, our major tax jurisdiction is federal. Our tax returns for our federal tax years ending August 31, 2012 and thereafter remain subject to examination by the Internal Revenue Service.
Dividends and Distributions
Dividends and distributions to common stockholders are recorded on the ex-dividend date. The amount, if any, to be paid as a monthly dividend or distribution is approved by our Board of Directors quarterly and is generally based upon our management’s estimate of our future earnings. Net realized capital gains, if any, are distributed at least annually.
Financing Costs
We record origination expenses related to our Revolving Credit Facility and Convertible Notes, Public Notes and Prospect Capital InterNotes® (collectively, our “Unsecured Notes”) as deferred financing costs. These expenses are deferred and amortized as part of interest expense using the straight-line method for our Revolving Credit Facility and the effective interest method for our Unsecured Notes over the respective expected life or maturity. In the event that we modify or extinguish our debt before maturity, we follow the guidance in ASC 470-50, Modification and Extinguishments (“ASC 470-50”). For modifications to or exchanges of our Revolving Credit Facility, any unamortized deferred costs relating to lenders who are not part of the new lending group are expensed. For extinguishments of our Unsecured Notes, any unamortized deferred costs are deducted from the carrying amount of the debt in determining the gain or loss from the extinguishment.
We record registration expenses related to shelf filings as prepaid assets. These expenses consist principally of SEC registration fees, legal fees and accounting fees incurred. These prepaid assets are charged to capital upon the receipt of proceeds from an equity offering or charged to expense if no offering is completed.
Guarantees and Indemnification Agreements
We follow ASC 460, Guarantees (“ASC 460”). ASC 460 elaborates on the disclosure requirements of a guarantor in its interim and annual consolidated financial statements about its obligations under certain guarantees that it has issued. It also requires a guarantor to recognize, at the inception of a guarantee, for those guarantees that are covered by ASC 460, the fair value of the obligation undertaken in issuing certain guarantees.
Per Share Information
Net increase or decrease in net assets resulting from operations per share is calculated using the weighted average number of common shares outstanding for the period presented. In accordance with ASC 946, convertible securities are not considered in the calculation of net asset value per share.
97
Recent Accounting Pronouncements
In August 2014, the FASB issued Accounting Standards Update 2014-15, Disclosure of Uncertainties about an Entity’s Ability to Continue as a Going Concern (“ASU 2014-15”). ASU 2014-15 will explicitly require management to assess an entity’s ability to continue as a going concern, and to provide related footnote disclosure in certain circumstances. ASU 2014-15 is effective for annual and interim periods ending after December 15, 2016. Early application is permitted. The adoption of the amended guidance in ASU 2014-15 is not expected to have a significant effect on our consolidated financial statements and disclosures.
In January 2015, the FASB issued Accounting Standards Update 2015-01, Simplifying Income Statement Presentation by Eliminating the Concept of Extraordinary Items (“ASU 2015-01”). ASU 2015-01 simplifies income statement presentation by eliminating the need to determine whether to classify an item as an extraordinary item. ASU 2015-01 is effective for annual and interim periods beginning after December 15, 2015. Early adoption is permitted; however, adoption must occur at the beginning of an annual period. The adoption of the amended guidance in ASU 2015-01 is not expected to have a significant effect on our consolidated financial statements and disclosures.
In February 2015, the FASB issued Accounting Standards Update 2015-02, Amendments to the Consolidation Analysis (“ASU 2015-02”). ASU 2015-02 eliminates the deferral of FAS 167, which allowed reporting entities with interests in certain investment funds to follow the previous consolidation guidance in FIN 46(R), and makes other changes to both the variable interest model and the voting model. ASU 2015-02 is effective for annual and interim periods beginning after December 15, 2015. Early adoption is permitted, including adoption in an interim period. A reporting entity may apply the amendments using a modified retrospective approach by recording a cumulative-effect adjustment to equity as of the beginning of the period of adoption or may apply the amendments retrospectively. We are currently evaluating the effect the adoption of the amended guidance in ASU 2015-02 may have on our consolidated financial statements and disclosures.
In April 2015, the FASB issued Accounting Standards Update 2015-03, Simplifying the Presentation of Debt Issuance Costs (“ASU 2015-03”). ASU 2015-03 requires debt issuance costs related to a recognized debt liability to be presented in the balance sheet as a direct deduction from the debt liability rather than as an asset. The new guidance will make the presentation of debt issuance costs consistent with the presentation of debt discounts or premiums. ASU 2015-03 is effective for financial statements issued for fiscal years beginning after December 15, 2015, and interim periods within those fiscal years. Early adoption is permitted for financial statements that have not been previously issued. The new guidance must be applied on a retrospective basis to all prior periods presented in the financial statements. The adoption of the amended guidance in ASU 2015-03 is not expected to have a significant effect on our consolidated financial statements and disclosures.
Item 7A. Quantitative and Qualitative Disclosures about Market Risk
We are subject to financial market risks, including changes in interest rates and equity price risk. Some of the loans in our portfolio have floating interest rates.
We may hedge against interest rate fluctuations by using standard hedging instruments such as futures, options and forward contracts subject to the requirements of the 1940 Act. While hedging activities may insulate us against adverse changes in interest rates, they may also limit our ability to participate in the benefits of higher interest rates with respect to our portfolio of investments. During the year ended June 30, 2015, we did not engage in hedging activities.
98
Item 8. Financial Statements and Supplementary Data
INDEX TO CONSOLIDATED FINANCIAL STATEMENTS
Page | |
99
Report of Independent Registered Public Accounting Firm
Board of Directors and Stockholders
Prospect Capital Corporation
New York, New York
We have audited the accompanying consolidated statements of assets and liabilities of Prospect Capital Corporation (the “Company”), including the consolidated schedules of investments, as of June 30, 2015 and June 30, 2014, and the related consolidated statements of operations, changes in net assets, and cash flows for each of the three years in the period ended June 30, 2015, and the financial highlights for each of the five years in the period ended June 30, 2015. These consolidated financial statements and financial highlights are the responsibility of the Company’s management. Our responsibility is to express an opinion on these consolidated financial statements and financial highlights based on our audits.
We conducted our audits in accordance with the standards of the Public Company Accounting Oversight Board (United States). Those standards require that we plan and perform the audit to obtain reasonable assurance about whether the financial statements and financial highlights are free of material misstatement. An audit also includes examining, on a test basis, evidence supporting the amounts and disclosures in the financial statements. Our procedures included confirmation of securities owned as of June 30, 2015 and June 30, 2014 by correspondence with the custodian, trustees, online lending servicers and portfolio companies, or by other appropriate auditing procedures where replies were not received. An audit also includes assessing the accounting principles used and significant estimates made by management, as well as evaluating the overall financial statement presentation. We believe that our audits provide a reasonable basis for our opinion.
In our opinion, the consolidated financial statements and financial highlights referred to above present fairly, in all material respects, the financial position of Prospect Capital Corporation at June 30, 2015 and June 30, 2014, the results of its operations, the changes in its net assets, and its cash flows for each of the three years in the period ended June 30, 2015, and the financial highlights for each of the five years in the period ended June 30, 2015, in conformity with accounting principles generally accepted in the United States of America.
We also have audited, in accordance with the standards of the Public Company Accounting Oversight Board (United States), Prospect Capital Corporation’s internal control over financial reporting as of June 30, 2015, based on criteria established in Internal Control—Integrated Framework (2013) issued by the Committee of Sponsoring Organizations of the Treadway Commission (COSO) and our report dated August 26, 2015 expressed an unqualified opinion thereon.
/s/ BDO USA, LLP |
BDO USA, LLP |
New York, New York |
August 26, 2015 |
100
PROSPECT CAPITAL CORPORATION AND SUBSIDIARIES
CONSOLIDATED STATEMENTS OF ASSETS AND LIABILITIES
(in thousands, except share and per share data)
June 30, 2015 | June 30, 2014 | ||||||
Assets | |||||||
Investments at fair value: | |||||||
Control investments (amortized cost of $1,894,644 and $1,719,242, respectively) | $ | 1,974,202 | $ | 1,640,454 | |||
Affiliate investments (amortized cost of $45,150 and $31,829, respectively) | 45,945 | 32,121 | |||||
Non-control/non-affiliate investments (amortized cost of $4,619,582 and $4,620,451, respectively) | 4,589,411 | 4,581,164 | |||||
Total investments at fair value (amortized cost of $6,559,376 and $6,371,522, respectively) | 6,609,558 | 6,253,739 | |||||
Cash and cash equivalents | 110,026 | 134,225 | |||||
Receivables for: | |||||||
Interest, net | 20,408 | 21,997 | |||||
Other | 2,885 | 2,587 | |||||
Prepaid expenses | 757 | 2,828 | |||||
Deferred financing costs | 54,420 | 61,893 | |||||
Total Assets | 6,798,054 | 6,477,269 | |||||
Liabilities | |||||||
Revolving Credit Facility (Notes 4 and 8) | 368,700 | 92,000 | |||||
Convertible Notes (Notes 5 and 8) | 1,239,500 | 1,247,500 | |||||
Public Notes (Notes 6 and 8) | 548,094 | 647,881 | |||||
Prospect Capital InterNotes® (Notes 7 and 8) | 827,442 | 785,670 | |||||
Due to broker | 26,778 | — | |||||
Dividends payable | 29,923 | 37,843 | |||||
Due to Prospect Administration (Note 13) | 4,238 | 2,208 | |||||
Due to Prospect Capital Management (Note 13) | 2,550 | 3 | |||||
Accrued expenses | 3,408 | 4,790 | |||||
Interest payable | 39,659 | 37,459 | |||||
Other liabilities | 4,713 | 3,733 | |||||
Total Liabilities | 3,095,005 | 2,859,087 | |||||
Net Assets | $ | 3,703,049 | $ | 3,618,182 | |||
Components of Net Assets | |||||||
Common stock, par value $0.001 per share (1,000,000,000 common shares authorized; 359,090,759 and 342,626,637 issued and outstanding, respectively) (Note 9) | $ | 359 | $ | 343 | |||
Paid-in capital in excess of par (Note 9) | 3,975,672 | 3,814,634 | |||||
Accumulated (overdistributed) underdistributed net investment income | (21,077 | ) | 42,086 | ||||
Accumulated net realized loss on investments and extinguishment of debt | (302,087 | ) | (121,098 | ) | |||
Net unrealized appreciation (depreciation) on investments | 50,182 | (117,783 | ) | ||||
Net Assets | $ | 3,703,049 | $ | 3,618,182 | |||
Net Asset Value Per Share (Note 16) | $ | 10.31 | $ | 10.56 | |||
See notes to consolidated financial statements.
101
PROSPECT CAPITAL CORPORATION AND SUBSIDIARIES
CONSOLIDATED STATEMENTS OF OPERATIONS
(in thousands, except share and per share data)
Year Ended June 30, | |||||||||||
2015 | 2014 | 2013 | |||||||||
Investment Income | |||||||||||
Interest income: | |||||||||||
Control investments | $ | 200,409 | $ | 153,307 | $ | 106,425 | |||||
Affiliate investments | 3,799 | 4,358 | 6,515 | ||||||||
Non-control/non-affiliate investments | 385,710 | 334,039 | 234,013 | ||||||||
Structured credit securities | 159,056 | 122,037 | 88,502 | ||||||||
Total interest income | 748,974 | 613,741 | 435,455 | ||||||||
Dividend income: | |||||||||||
Control investments | 6,811 | 26,687 | 78,282 | ||||||||
Affiliate investments | 778 | — | 728 | ||||||||
Non-control/non-affiliate investments | 46 | 98 | 3,656 | ||||||||
Money market funds | 28 | 52 | 39 | ||||||||
Total dividend income | 7,663 | 26,837 | 82,705 | ||||||||
Other income: | |||||||||||
Control investments | 12,975 | 43,671 | 16,821 | ||||||||
Affiliate investments | 226 | 17 | 623 | ||||||||
Non-control/non-affiliate investments | 21,246 | 28,025 | 40,732 | ||||||||
Total other income (Note 10) | 34,447 | 71,713 | 58,176 | ||||||||
Total Investment Income | 791,084 | 712,291 | 576,336 | ||||||||
Operating Expenses | |||||||||||
Investment advisory fees: | |||||||||||
Base management fee (Note 13) | 134,590 | 108,990 | 69,800 | ||||||||
Income incentive fee (Note 13) | 90,687 | 89,306 | 81,231 | ||||||||
Total investment advisory fees | 225,277 | 198,296 | 151,031 | ||||||||
Interest and credit facility expenses | 170,660 | 130,103 | 76,341 | ||||||||
Legal fees | 2,375 | 2,771 | 1,918 | ||||||||
Valuation services | 1,686 | 1,836 | 1,579 | ||||||||
Audit, compliance and tax related fees | 3,772 | 2,959 | 1,566 | ||||||||
Allocation of overhead from Prospect Administration (Note 13) | 14,977 | 14,373 | 8,737 | ||||||||
Insurance expense | 583 | 373 | 356 | ||||||||
Directors’ fees | 379 | 325 | 300 | ||||||||
Excise tax | 2,505 | (4,200 | ) | 6,500 | |||||||
Other general and administrative expenses | 6,123 | 8,232 | 3,084 | ||||||||
Total Operating Expenses | 428,337 | 355,068 | 251,412 | ||||||||
Net Investment Income | 362,747 | 357,223 | 324,924 | ||||||||
Net realized losses on investments | (180,423 | ) | (3,346 | ) | (26,234 | ) | |||||
Net change in unrealized appreciation (depreciation) on investments | 167,965 | (34,857 | ) | (77,834 | ) | ||||||
Net realized and unrealized losses on investments | (12,458 | ) | (38,203 | ) | (104,068 | ) | |||||
Net realized losses on extinguishment of debt | (3,950 | ) | — | — | |||||||
Net Increase in Net Assets Resulting from Operations | $ | 346,339 | $ | 319,020 | $ | 220,856 | |||||
Net increase in net assets resulting from operations per share | $ | 0.98 | $ | 1.06 | $ | 1.07 | |||||
Dividends declared per share | $ | (1.19 | ) | $ | (1.32 | ) | $ | (1.28 | ) | ||
See notes to consolidated financial statements.
102
PROSPECT CAPITAL CORPORATION AND SUBSIDIARIES
CONSOLIDATED STATEMENTS OF CHANGES IN NET ASSETS
(in thousands, except share data)
Year Ended June 30, | |||||||||||
2015 | 2014 | 2013 | |||||||||
Operations | |||||||||||
Net investment income | $ | 362,747 | $ | 357,223 | $ | 324,924 | |||||
Net realized losses on investments | (180,423 | ) | (3,346 | ) | (26,234 | ) | |||||
Net change in unrealized appreciation (depreciation) on investments | 167,965 | (34,857 | ) | (77,834 | ) | ||||||
Net realized losses on extinguishment of debt | (3,950 | ) | — | — | |||||||
Net Increase in Net Assets Resulting from Operations | 346,339 | 319,020 | 220,856 | ||||||||
Distributions to Shareholders | |||||||||||
Distribution from net investment income | (421,594 | ) | (403,188 | ) | (271,507 | ) | |||||
Distribution of return of capital | — | — | — | ||||||||
Net Decrease in Net Assets Resulting from Distributions to Shareholders | (421,594 | ) | (403,188 | ) | (271,507 | ) | |||||
Common Stock Transactions | |||||||||||
Issuance of common stock, net of underwriting costs | 146,085 | 973,832 | 1,121,648 | ||||||||
Less: Offering costs from issuance of common stock | (644 | ) | (1,380 | ) | (1,815 | ) | |||||
Value of shares issued to acquire controlled investments | — | 57,830 | 59,251 | ||||||||
Value of shares issued through reinvestment of dividends | 14,681 | 15,574 | 16,087 | ||||||||
Net Increase in Net Assets Resulting from Common Stock Transactions | 160,122 | 1,045,856 | 1,195,171 | ||||||||
Total Increase in Net Assets | 84,867 | 961,688 | 1,144,520 | ||||||||
Net assets at beginning of year | 3,618,182 | 2,656,494 | 1,511,974 | ||||||||
Net Assets at End of Year | $ | 3,703,049 | $ | 3,618,182 | $ | 2,656,494 | |||||
Common Stock Activity | |||||||||||
Shares sold | 14,845,556 | 88,054,653 | 101,245,136 | ||||||||
Shares issued to acquire controlled investments | — | 5,326,949 | 5,507,381 | ||||||||
Shares issued through reinvestment of dividends | 1,618,566 | 1,408,070 | 1,450,578 | ||||||||
Total shares issued due to common stock activity | 16,464,122 | 94,789,672 | 108,203,095 | ||||||||
Shares issued and outstanding at beginning of year | 342,626,637 | 247,836,965 | 139,633,870 | ||||||||
Shares Issued and Outstanding at End of Year | 359,090,759 | 342,626,637 | 247,836,965 | ||||||||
See notes to consolidated financial statements.
103
PROSPECT CAPITAL CORPORATION AND SUBSIDIARIES
CONSOLIDATED STATEMENTS OF CASH FLOWS
(in thousands, except share data)
Year Ended June 30, | |||||||||||
2015 | 2014 | 2013 | |||||||||
Operating Activities | |||||||||||
Net increase in net assets resulting from operations | $ | 346,339 | $ | 319,020 | $ | 220,856 | |||||
Net realized losses on extinguishment of debt | 3,950 | — | — | ||||||||
Net realized losses on investments | 180,423 | 3,346 | 26,234 | ||||||||
Net change in unrealized (appreciation) depreciation on investments | (167,965 | ) | 34,857 | 77,834 | |||||||
Amortization (accretion) of discounts and premiums, net | 87,638 | 46,297 | (11,016 | ) | |||||||
Accretion of discount on Public Notes (Note 6) | 213 | 156 | 50 | ||||||||
Amortization of deferred financing costs | 14,266 | 11,491 | 8,232 | ||||||||
Payment-in-kind interest | (29,277 | ) | (15,145 | ) | (10,947 | ) | |||||
Structuring fees | (20,916 | ) | (45,087 | ) | (52,699 | ) | |||||
Change in operating assets and liabilities: | |||||||||||
Payments for purchases of investments | (2,038,795 | ) | (2,834,294 | ) | (2,980,320 | ) | |||||
Proceeds from sale of investments and collection of investment principal | 1,633,073 | 786,969 | 931,534 | ||||||||
Decrease (increase) in interest receivable, net | 1,589 | 866 | (8,644 | ) | |||||||
(Increase) decrease in other receivables | (298 | ) | 1,810 | (3,613 | ) | ||||||
Decrease (increase) in prepaid expenses | 2,071 | (2,288 | ) | (119 | ) | ||||||
Increase (decrease) in due to broker | 26,778 | (43,588 | ) | (945 | ) | ||||||
Increase in due to Prospect Administration | 2,030 | 842 | 708 | ||||||||
Increase (decrease) in due to Prospect Capital Management | 2,547 | (5,321 | ) | (2,589 | ) | ||||||
(Decrease) increase in accrued expenses | (1,382 | ) | 2,445 | (580 | ) | ||||||
Increase in interest payable | 2,200 | 13,075 | 17,661 | ||||||||
Increase (decrease) in other liabilities | 980 | (682 | ) | 2,205 | |||||||
Net Cash Provided by (Used in) Operating Activities | 45,464 | (1,725,231 | ) | (1,786,158 | ) | ||||||
Financing Activities | |||||||||||
Borrowings under Revolving Credit Facility (Note 4) | 1,567,000 | 1,078,500 | 223,000 | ||||||||
Principal payments under Revolving Credit Facility (Note 4) | (1,290,300 | ) | (1,110,500 | ) | (195,000 | ) | |||||
Issuances of Convertible Notes (Note 5) | — | 400,000 | 400,000 | ||||||||
Repurchases of Convertible Notes, net (Note 5) | (7,668 | ) | — | — | |||||||
Issuances of Public Notes, net of original issue discount (Note 6) | — | 255,000 | 247,675 | ||||||||
Redemptions of Public Notes, net (Note 6) | (102,600 | ) | — | — | |||||||
Issuances of Prospect Capital InterNotes® (Note 7) | 125,696 | 473,762 | 343,139 | ||||||||
Redemptions of Prospect Capital InterNotes®, net (Note 7) | (85,606 | ) | (6,869 | ) | — | ||||||
Financing costs paid and deferred | (6,793 | ) | (29,055 | ) | (28,146 | ) | |||||
Proceeds from issuance of common stock, net of underwriting costs | 146,085 | 973,832 | 1,121,648 | ||||||||
Offering costs from issuance of common stock | (644 | ) | (1,380 | ) | (1,815 | ) | |||||
Dividends paid | (414,833 | ) | (377,070 | ) | (242,301 | ) | |||||
Net Cash (Used in) Provided by Financing Activities | (69,663 | ) | 1,656,220 | 1,868,200 | |||||||
Total (Decrease) Increase in Cash and Cash Equivalents | (24,199 | ) | (69,011 | ) | 82,042 | ||||||
Cash and cash equivalents at beginning of year | 134,225 | 203,236 | 121,194 | ||||||||
Cash and Cash Equivalents at End of Year | $ | 110,026 | $ | 134,225 | $ | 203,236 | |||||
Supplemental Disclosures | |||||||||||
Cash paid for interest | $ | 153,982 | $ | 105,410 | $ | 45,363 | |||||
Non-Cash Financing Activities | |||||||||||
Value of shares issued through reinvestment of dividends | $ | 14,681 | $ | 15,574 | $ | 16,087 | |||||
Value of shares issued to acquire controlled investments | $ | — | $ | 57,830 | $ | 59,251 | |||||
Exchange of Prospect Capital InterNotes® for Public Notes | $ | — | $ | 45,000 | $ | — | |||||
See notes to consolidated financial statements.
104
PROSPECT CAPITAL CORPORATION AND SUBSIDIARIES
CONSOLIDATED SCHEDULES OF INVESTMENTS
(in thousands, except share data)
June 30, 2015 | ||||||||||||
Portfolio Company | Locale / Industry | Investments(1) | Principal Value | Cost | Fair Value(2) | % of Net Assets | ||||||
LEVEL 3 PORTFOLIO INVESTMENTS | ||||||||||||
Control Investments (greater than 25.00% voting control)(49) | ||||||||||||
American Property REIT Corp.(32) | Various / Real Estate | Senior Secured Term Loan (6.00% (LIBOR + 4.00% with 2.00% LIBOR floor) plus 5.50% PIK, due 4/1/2019)(4) | $ | 78,077 | $ | 78,077 | $ | 78,077 | 2.1% | |||
Common Stock (301,845 shares) | 22,115 | 32,098 | 0.9% | |||||||||
Net Operating Income Interest (5% of Net Operating Income) | — | 8,081 | 0.2% | |||||||||
100,192 | 118,256 | 3.2% | ||||||||||
Arctic Energy Services, LLC(30) | Wyoming / Oil & Gas Services | Senior Secured Term Loan (12.00% (LIBOR + 9.00% with 3.00% LIBOR floor), due 5/5/2019)(3)(4) | 31,640 | 31,640 | 31,640 | 0.9% | ||||||
Senior Subordinated Term Loan (14.00% (LIBOR + 11.00% with 3.00% LIBOR floor), due 5/5/2019)(3)(4) | 20,230 | 20,230 | 20,230 | 0.5% | ||||||||
Class A Units (700 units) | 8,879 | 8,374 | 0.2% | |||||||||
Class C Units (10 units) | 127 | 120 | —% | |||||||||
60,876 | 60,364 | 1.6% | ||||||||||
CCPI Inc.(33) | Ohio / Manufacturing | Senior Secured Term Loan A (10.00%, due 12/31/2017)(3) | 16,763 | 16,763 | 16,763 | 0.5% | ||||||
Senior Secured Term Loan B (12.00% plus 7.00% PIK, due 12/31/2017) | 8,844 | 8,844 | 8,844 | 0.2% | ||||||||
Common Stock (14,857 shares) | 8,553 | 15,745 | 0.4% | |||||||||
34,160 | 41,352 | 1.1% | ||||||||||
CP Energy Services Inc.(38) | Oklahoma / Oil & Gas Services | Senior Secured Term Loan A to CP Well Testing, LLC (7.00% (LIBOR + 5.00% with 2.00% LIBOR floor), due 4/1/2019)(4) | 11,035 | 11,035 | 11,035 | 0.3% | ||||||
Senior Secured Term Loan B to CP Well Testing, LLC (10.00% (LIBOR + 8.00% with 2.00% LIBOR floor) plus 7.50% PIK, due 4/1/2019)(3)(4) | 74,493 | 74,493 | 74,493 | 2.0% | ||||||||
Second Lien Term Loan to CP Well Testing, LLC (9.00% (LIBOR + 7.00% with 2.00% LIBOR floor) plus 9.00% PIK, due 4/1/2019)(4) | 15,563 | 15,563 | 5,481 | 0.2% | ||||||||
Common Stock (2,924 shares) | 15,227 | — | —% | |||||||||
116,318 | 91,009 | 2.5% | ||||||||||
Credit Central Loan Company, LLC(34) | Ohio / Consumer Finance | Subordinated Term Loan (10.00% plus 10.00% PIK, due 6/26/2019)(22) | 36,333 | 36,333 | 36,333 | 1.0% | ||||||
Class A Shares (7,500,000 shares)(22) | 11,633 | 14,529 | 0.4% | |||||||||
Net Revenues Interest (25% of Net Revenues)(22) | — | 4,310 | 0.1% | |||||||||
47,966 | 55,172 | 1.5% | ||||||||||
Echelon Aviation LLC | New York / Aerospace & Defense | Senior Secured Term Loan (11.75% (LIBOR + 9.75% with 2.00% LIBOR floor) plus 2.25% PIK, due 3/31/2022)(4) | 40,808 | 40,808 | 40,808 | 1.1% | ||||||
Class A Shares (11,335,318 shares) | 19,907 | 28,133 | 0.8% | |||||||||
60,715 | 68,941 | 1.9% | ||||||||||
Edmentum Ultimate Holdings, LLC(47) | Minnesota / Consumer Services | Second Lien Revolving Credit Facility to Edmentum, Inc. – $7,834 Commitment (5.00%, due 6/9/2020)(25)(26) | 4,896 | 4,896 | 4,896 | 0.1% | ||||||
Unsecured Senior PIK Note (8.50% PIK, due 6/9/2020) | 5,875 | 5,875 | 5,875 | 0.2% | ||||||||
Unsecured Junior PIK Note (10.00% PIK, due 6/9/2020) | 19,868 | 19,868 | 19,868 | 0.5% | ||||||||
Class A Common Units (370,964.14 units) | 6,577 | 6,577 | 0.2% | |||||||||
37,216 | 37,216 | 1.0% | ||||||||||
See notes to consolidated financial statements.
105
PROSPECT CAPITAL CORPORATION AND SUBSIDIARIES
CONSOLIDATED SCHEDULES OF INVESTMENTS (CONTINUED)
(in thousands, except share data)
June 30, 2015 | ||||||||||||
Portfolio Company | Locale / Industry | Investments(1) | Principal Value | Cost | Fair Value(2) | % of Net Assets | ||||||
LEVEL 3 PORTFOLIO INVESTMENTS | ||||||||||||
Control Investments (greater than 25.00% voting control)(49) | ||||||||||||
First Tower Finance Company LLC(29) | Mississippi / Consumer Finance | Subordinated Term Loan to First Tower, LLC (10.00% plus 12.00% PIK, due 6/24/2019)(22) | $ | 251,578 | $ | 251,578 | $ | 251,578 | 6.8% | |||
Class A Shares (83,729,323 shares)(22) | 66,473 | 114,372 | 3.1% | |||||||||
318,051 | 365,950 | 9.9% | ||||||||||
Freedom Marine Solutions, LLC(8) | Louisiana / Oil & Gas Services | Senior Secured Note to Vessel Company, LLC (18.00%, due 12/12/2016) | 3,500 | 3,500 | 3,500 | 0.1% | ||||||
Senior Secured Note to Vessel Company II, LLC (13.00%, due 11/25/2018) | 13,000 | 12,504 | 8,680 | 0.2% | ||||||||
Senior Secured Note to Vessel Company III, LLC (13.00%, due 12/3/2018) | 16,000 | 16,000 | 13,790 | 0.4% | ||||||||
Membership Interest (100%) | 7,808 | 1,120 | —% | |||||||||
39,812 | 27,090 | 0.7% | ||||||||||
Gulf Coast Machine & Supply Company | Texas / Manufacturing | Senior Secured Term Loan (10.50% (LIBOR + 8.50% with 2.00% LIBOR floor), in non-accrual status effective 1/1/2015, due 10/12/2017)(4) | 26,844 | 26,000 | 6,918 | 0.2% | ||||||
Series A Convertible Preferred Stock (99,900 shares) | 25,950 | — | —% | |||||||||
51,950 | 6,918 | 0.2% | ||||||||||
Harbortouch Payments, LLC(43) | Pennsylvania / Business Services | Senior Secured Term Loan A (9.00% (LIBOR + 7.00% with 2.00% LIBOR floor), due 9/30/2017)(3)(4) | 128,980 | 128,980 | 128,980 | 3.5% | ||||||
Senior Secured Term Loan B (5.50% (LIBOR + 4.00% with 1.50% LIBOR floor) plus 5.50% PIK, due 3/31/2018)(4) | 144,878 | 144,878 | 144,878 | 3.9% | ||||||||
Senior Secured Term Loan C (13.00% (LIBOR + 9.00% with 4.00% LIBOR floor), due 9/29/2018)(4) | 22,876 | 22,876 | 22,876 | 0.6% | ||||||||
Class C Shares (535 shares) | 8,725 | 80,202 | 2.2% | |||||||||
305,459 | 376,936 | 10.2% | ||||||||||
MITY, Inc.(17) | Utah / Durable Consumer Products | Senior Secured Note A (10.00% (LIBOR + 7.00% with 3.00% LIBOR floor), due 3/19/2019)(3)(4) | 18,250 | 18,250 | 18,250 | 0.5% | ||||||
Senior Secured Note B (10.00% (LIBOR + 7.00% with 3.00% LIBOR floor) plus 10.00% PIK, due 3/19/2019)(4) | 16,301 | 16,301 | 16,301 | 0.4% | ||||||||
Subordinated Unsecured Note to Broda Enterprises ULC (10.00%, due on demand)(22) | 7,200 | 7,200 | 5,827 | 0.2% | ||||||||
Common Stock (42,053 shares) | 6,849 | 10,417 | 0.3% | |||||||||
48,600 | 50,795 | 1.4% | ||||||||||
National Property REIT Corp.(40) | Various | Senior Secured Term Loan A (6.00% (LIBOR + 4.00% with 2.00% LIBOR floor) plus 5.50% PIK, due 4/1/2019)(4) | 202,629 | 202,629 | 202,629 | 5.5% | ||||||
Senior Secured Term Loan C (6.00% (LIBOR + 4.00% with 2.00% LIBOR floor) plus 7.50% PIK, due 4/1/2019)(4) | 44,147 | 44,147 | 44,147 | 1.2% | ||||||||
Senior Secured Term Loan D (14.00% (LIBOR + 12.00% with 2.00% LIBOR floor) plus 4.50% PIK, due 4/1/2019)(4) | 67,443 | 67,443 | 67,443 | 1.8% | ||||||||
Senior Secured Term Loan A to ACL Loan Holdings, Inc. (6.00% (LIBOR + 4.00% with 2.00% LIBOR floor) plus 7.50% PIK, due 4/1/2019)(4) | 20,413 | 20,413 | 20,413 | 0.6% | ||||||||
Senior Secured Term Loan B to ACL Loan Holdings, Inc. (14.00% (LIBOR + 12.00% with 2.00% LIBOR floor) plus 4.50% PIK, due 4/1/2019)(4) | 30,582 | 30,582 | 30,582 | 0.8% | ||||||||
Common Stock (643,175 shares) | 84,446 | 87,002 | 2.3% | |||||||||
Net Operating Income Interest (5% of Net Operating Income) | — | 19,673 | 0.5% | |||||||||
449,660 | 471,889 | 12.7% | ||||||||||
See notes to consolidated financial statements.
106
PROSPECT CAPITAL CORPORATION AND SUBSIDIARIES
CONSOLIDATED SCHEDULES OF INVESTMENTS (CONTINUED)
(in thousands, except share data)
June 30, 2015 | ||||||||||||
Portfolio Company | Locale / Industry | Investments(1) | Principal Value | Cost | Fair Value(2) | % of Net Assets | ||||||
LEVEL 3 PORTFOLIO INVESTMENTS | ||||||||||||
Control Investments (greater than 25.00% voting control)(49) | ||||||||||||
Nationwide Loan Company LLC (f/k/a Nationwide Acceptance LLC)(36) | Illinois / Consumer Finance | Senior Subordinated Term Loan to Nationwide Acceptance LLC (10.00% plus 10.00% PIK, due 6/18/2019)(22) | $ | 14,820 | $ | 14,820 | $ | 14,820 | 0.4% | |||
Class A Shares (26,974,454.27 shares)(22) | 14,795 | 19,730 | 0.5% | |||||||||
29,615 | 34,550 | 0.9% | ||||||||||
NMMB, Inc.(24) | New York / Media | Senior Secured Note (14.00%, due 5/6/2016) | 3,714 | 3,714 | 3,714 | 0.1% | ||||||
Senior Secured Note to Armed Forces Communications, Inc. (14.00%, due 5/6/2016) | 7,000 | 7,000 | 7,000 | 0.2% | ||||||||
Series A Preferred Stock (7,200 shares) | 7,200 | 1,338 | —% | |||||||||
Series B Preferred Stock (5,669 shares) | 5,669 | — | —% | |||||||||
23,583 | 12,052 | 0.3% | ||||||||||
R-V Industries, Inc. | Pennsylvania / Manufacturing | Senior Subordinated Note (10.00% (LIBOR + 9.00% with 1.00% LIBOR floor), due 6/12/2018)(3)(4) | 29,237 | 29,237 | 29,237 | 0.8% | ||||||
Common Stock (545,107 shares) | 5,087 | 8,246 | 0.2% | |||||||||
Warrant (to purchase 200,000 shares of Common Stock, expires 6/30/2017) | 1,682 | 3,025 | 0.1% | |||||||||
36,006 | 40,508 | 1.1% | ||||||||||
United Property REIT Corp.(41) | Various / Real Estate | Senior Term Loan (6.00% (LIBOR + 4.00% with 2.00% LIBOR floor) plus 5.50% PIK, due 4/1/2019)(4) | 62,768 | 62,768 | 62,768 | 1.7% | ||||||
Common Stock (74,449 shares) | 12,860 | 11,216 | 0.3% | |||||||||
Net Operating Income Interest (5% of Net Operating Income) | — | 10,701 | 0.3% | |||||||||
75,628 | 84,685 | 2.3% | ||||||||||
Valley Electric Company, Inc.(35) | Washington / Construction & Engineering | Senior Secured Note to Valley Electric Co. of Mt. Vernon, Inc. (8.00% (LIBOR + 5.00% with 3.00% LIBOR floor) plus 2.50% PIK, due 12/31/2017)(3)(4) | 10,340 | 10,340 | 10,340 | 0.3% | ||||||
Senior Secured Note (10.00% plus 8.50% PIK, due 12/31/2018) | 22,293 | 22,293 | 20,157 | 0.5% | ||||||||
Common Stock (50,000 shares) | 26,204 | — | —% | |||||||||
58,837 | 30,497 | 0.8% | ||||||||||
Wolf Energy, LLC(12) | Kansas / Oil & Gas Production | Senior Secured Promissory Note secured by assets formerly owned by H&M (18.00%, in non-accrual status effective 4/15/2013, due 4/15/2018)(37) | 32,112 | — | — | —% | ||||||
Membership Interest (100%) | — | — | —% | |||||||||
Net Profits Interest (8% of Equity Distributions)(7) | — | 22 | —% | |||||||||
— | 22 | —% | ||||||||||
Total Control Investments | $ | 1,894,644 | $ | 1,974,202 | 53.3% | |||||||
Affiliate Investments (5.00% to 24.99% voting control)(50) | ||||||||||||
BNN Holdings Corp. | Michigan / Healthcare | Senior Term Loan A (6.50% (LIBOR + 5.50% with 1.00% LIBOR floor), due 8/29/2019)(3)(4) | $ | 21,182 | $ | 21,182 | $ | 21,182 | 0.6% | |||
Senior Term Loan B (11.50% (LIBOR + 10.50% with 1.00% LIBOR floor), due 8/29/2019)(3)(4) | 21,740 | 21,740 | 21,740 | 0.6% | ||||||||
Series A Preferred Stock (9,925.455 shares)(13) | 1,780 | 2,569 | —% | |||||||||
Series B Preferred Stock (1,753.636 shares)(13) | 448 | 454 | —% | |||||||||
45,150 | 45,945 | 1.2% | ||||||||||
Total Affiliate Investments | $ | 45,150 | $ | 45,945 | 1.2% | |||||||
See notes to consolidated financial statements.
107
PROSPECT CAPITAL CORPORATION AND SUBSIDIARIES
CONSOLIDATED SCHEDULES OF INVESTMENTS (CONTINUED)
(in thousands, except share data)
June 30, 2015 | ||||||||||||
Portfolio Company | Locale / Industry | Investments(1) | Principal Value | Cost | Fair Value(2) | % of Net Assets | ||||||
LEVEL 3 PORTFOLIO INVESTMENTS | ||||||||||||
Non-Control/Non-Affiliate Investments (less than 5.00% voting control) | ||||||||||||
Aderant North America, Inc. | Georgia / Software & Computer Services | Second Lien Term Loan (10.00% (LIBOR + 8.75% with 1.25% LIBOR floor), due 6/20/2019)(4)(16) | $ | 7,000 | $ | 6,928 | $ | 7,000 | 0.2% | |||
6,928 | 7,000 | 0.2% | ||||||||||
AFI Shareholder, LLC (f/k/a Aircraft Fasteners International, LLC) | California / Machinery | Class A Units (32,500 units) | 376 | 563 | —% | |||||||
376 | 563 | —% | ||||||||||
Airmall Inc.(27) | Pennsylvania / Property Management | Escrow Receivable | 5,880 | 3,814 | 0.1% | |||||||
5,880 | 3,814 | 0.1% | ||||||||||
Ajax Rolled Ring & Machine, LLC(42) | South Carolina / Manufacturing | Escrow Receivable | 1,264 | 2,170 | 0.1% | |||||||
1,264 | 2,170 | 0.1% | ||||||||||
ALG USA Holdings, LLC | Pennsylvania / Hotels, Restaurants & Leisure | Second Lien Term Loan (10.25% (LIBOR + 9.00% with 1.25% LIBOR floor), due 2/28/2020)(4)(16) | 11,771 | 11,593 | 11,771 | 0.3% | ||||||
11,593 | 11,771 | 0.3% | ||||||||||
American Gilsonite Company | Utah / Metal Services & Minerals | Second Lien Term Loan (11.50%, due 9/1/2017)(16) | 15,755 | 15,755 | 14,287 | 0.4% | ||||||
Membership Interest (99.9999%)(15) | — | — | —% | |||||||||
15,755 | 14,287 | 0.4% | ||||||||||
Apidos CLO IX | Cayman Islands / Structured Finance | Subordinated Notes (Residual Interest, current yield 22.56%)(11)(22) | 23,525 | 20,644 | 22,325 | 0.6% | ||||||
20,644 | 22,325 | 0.6% | ||||||||||
Apidos CLO XI | Cayman Islands / Structured Finance | Subordinated Notes (Residual Interest, current yield 15.64%)(11)(22) | 38,340 | 31,485 | 32,108 | 0.9% | ||||||
31,485 | 32,108 | 0.9% | ||||||||||
Apidos CLO XII | Cayman Islands / Structured Finance | Subordinated Notes (Residual Interest, current yield 17.68%)(11)(22) | 44,063 | 37,751 | 38,817 | 1.0% | ||||||
37,751 | 38,817 | 1.0% | ||||||||||
Apidos CLO XV | Cayman Islands / Structured Finance | Subordinated Notes (Residual Interest, current yield 15.07%)(11)(22) | 36,515 | 33,958 | 30,911 | 0.8% | ||||||
33,958 | 30,911 | 0.8% | ||||||||||
Arctic Glacier U.S.A., Inc. | Minnesota / Food Products | Second Lien Term Loan (10.50% (LIBOR + 9.25% with 1.25% LIBOR floor), due 11/10/2019)(3)(4) | 150,000 | 150,000 | 149,180 | 4.0% | ||||||
150,000 | 149,180 | 4.0% | ||||||||||
Ark-La-Tex Wireline Services, LLC | Louisiana / Oil & Gas Services | Senior Secured Term Loan A (6.50% (LIBOR + 5.50% with 1.00% LIBOR floor), due 4/8/2019)(4) | 21,743 | 21,743 | 20,042 | 0.5% | ||||||
Senior Secured Term Loan B (10.50% (LIBOR + 9.50% with 1.00% LIBOR floor), due 4/8/2019)(4) | 23,697 | 23,697 | 21,675 | 0.6% | ||||||||
45,440 | 41,717 | 1.1% | ||||||||||
Armor Holding II LLC | New York / Diversified Financial Services | Second Lien Term Loan (10.25% (LIBOR + 9.00% with 1.25% LIBOR floor), due 12/26/2020)(3)(4)(16) | 7,000 | 6,888 | 6,480 | 0.2% | ||||||
6,888 | 6,480 | 0.2% | ||||||||||
Atlantis Health Care Group (Puerto Rico), Inc. | Puerto Rico / Healthcare | Revolving Line of Credit – $4,000 Commitment (13.00% (LIBOR + 11.00% with 2.00% LIBOR floor), due 8/21/2016)(4)(25)(26) | 2,350 | 2,350 | 2,350 | 0.1% | ||||||
Senior Term Loan (10.00% (LIBOR + 8.00% with 2.00% LIBOR floor), due 2/21/2018)(3)(4) | 38,561 | 38,561 | 35,189 | 0.9% | ||||||||
40,911 | 37,539 | 1.0% | ||||||||||
See notes to consolidated financial statements.
108
PROSPECT CAPITAL CORPORATION AND SUBSIDIARIES
CONSOLIDATED SCHEDULES OF INVESTMENTS (CONTINUED)
(in thousands, except share data)
June 30, 2015 | ||||||||||||
Portfolio Company | Locale / Industry | Investments(1) | Principal Value | Cost | Fair Value(2) | % of Net Assets | ||||||
LEVEL 3 PORTFOLIO INVESTMENTS | ||||||||||||
Non-Control/Non-Affiliate Investments (less than 5.00% voting control) | ||||||||||||
BAART Programs, Inc. | California / Healthcare | Revolving Line of Credit – $5,000 Commitment (8.75% (LIBOR + 8.25% with 0.50% LIBOR floor), due 6/30/2018)(25)(26) | $ | 1,000 | $ | 1,000 | $ | 1,000 | —% | |||
Senior Secured Term Loan A (6.25% (LIBOR + 5.75% with 0.50% LIBOR floor), due 6/30/2020)(4) | 21,500 | 21,500 | 21,500 | 0.6% | ||||||||
Senior Secured Term Loan B (11.25% (LIBOR + 10.75% with 0.50% LIBOR floor), due 6/30/2020)(4) | 21,500 | 21,500 | 21,500 | 0.6% | ||||||||
Delayed Draw Term Loan – $10,500 Commitment (expires 12/31/2015)(25) | — | — | — | —% | ||||||||
44,000 | 44,000 | 1.2% | ||||||||||
Babson CLO Ltd. 2014-III | Cayman Islands / Structured Finance | Subordinated Notes (Residual Interest, current yield 14.25%)(11)(22)(48) | 52,250 | 47,799 | 47,148 | 1.3% | ||||||
47,799 | 47,148 | 1.3% | ||||||||||
Broder Bros., Co. | Pennsylvania / Textiles, Apparel & Luxury Goods | Senior Secured Notes (10.25% (LIBOR + 9.00% with 1.25% LIBOR floor), due 4/8/2019)(3)(4)(46) | 252,200 | 252,200 | 252,200 | 6.8% | ||||||
252,200 | 252,200 | 6.8% | ||||||||||
Brookside Mill CLO Ltd. | Cayman Islands / Structured Finance | Subordinated Notes (Residual Interest, current yield 19.25%)(11)(22) | 26,000 | 21,432 | 24,566 | 0.7% | ||||||
21,432 | 24,566 | 0.7% | ||||||||||
Caleel + Hayden, LLC | Colorado / Personal & Nondurable Consumer Products | Membership Interest(31) | — | 227 | —% | |||||||
— | 227 | —% | ||||||||||
Capstone Logistics Acquisition, Inc. | Georgia / Business Services | Second Lien Term Loan (9.25% (LIBOR + 8.25% with 1.00% LIBOR floor), due 10/7/2022)(3)(4) | 102,500 | 101,891 | 101,891 | 2.8% | ||||||
101,891 | 101,891 | 2.8% | ||||||||||
Cent CLO 17 Limited | Cayman Islands / Structured Finance | Subordinated Notes (Residual Interest, current yield 14.90%)(11)(22) | 24,870 | 20,309 | 20,922 | 0.6% | ||||||
20,309 | 20,922 | 0.6% | ||||||||||
Cent CLO 20 Limited | Cayman Islands / Structured Finance | Subordinated Notes (Residual Interest, current yield 12.49%)(11)(22) | 40,275 | 35,724 | 33,505 | 0.9% | ||||||
35,724 | 33,505 | 0.9% | ||||||||||
Cent CLO 21 Limited | Cayman Islands / Structured Finance | Subordinated Notes (Residual Interest, current yield 13.42%)(11)(22)(48) | 48,528 | 43,038 | 41,910 | 1.1% | ||||||
43,038 | 41,910 | 1.1% | ||||||||||
CIFC Funding 2011-I, Ltd. | Cayman Islands / Structured Finance | Class D Senior Secured Notes (5.28% (LIBOR + 5.00%, due 1/19/2023)(4)(22) | 19,000 | 15,604 | 18,175 | 0.5% | ||||||
Class E Subordinated Notes (7.28% (LIBOR + 7.00%, due 1/19/2023)(4)(22) | 15,400 | 13,009 | 14,223 | 0.4% | ||||||||
28,613 | 32,398 | 0.9% | ||||||||||
CIFC Funding 2013-III, Ltd. | Cayman Islands / Structured Finance | Subordinated Notes (Residual Interest, current yield 14.56%)(11)(22) | 44,100 | 35,412 | 35,599 | 1.0% | ||||||
35,412 | 35,599 | 1.0% | ||||||||||
CIFC Funding 2013-IV, Ltd. | Cayman Islands / Structured Finance | Subordinated Notes (Residual Interest, current yield 14.87%)(11)(22) | 45,500 | 36,124 | 38,265 | 1.0% | ||||||
36,124 | 38,265 | 1.0% | ||||||||||
CIFC Funding 2014-IV Investor, Ltd. | Cayman Islands / Structured Finance | Income Notes (Residual Interest, current yield 13.83%)(11)(22)(48) | 41,500 | 34,921 | 36,195 | 1.0% | ||||||
34,921 | 36,195 | 1.0% | ||||||||||
Cinedigm DC Holdings, LLC | New York / Software & Computer Services | Senior Secured Term Loan (11.00% (LIBOR + 9.00% with 2.00% LIBOR floor) plus 2.50% PIK, due 3/31/2021)(4) | 67,449 | 67,399 | 67,449 | 1.8% | ||||||
67,399 | 67,449 | 1.8% | ||||||||||
See notes to consolidated financial statements.
109
PROSPECT CAPITAL CORPORATION AND SUBSIDIARIES
CONSOLIDATED SCHEDULES OF INVESTMENTS (CONTINUED)
(in thousands, except share data)
June 30, 2015 | ||||||||||||
Portfolio Company | Locale / Industry | Investments(1) | Principal Value | Cost | Fair Value(2) | % of Net Assets | ||||||
LEVEL 3 PORTFOLIO INVESTMENTS | ||||||||||||
Non-Control/Non-Affiliate Investments (less than 5.00% voting control) | ||||||||||||
Coverall North America, Inc. | Florida / Commercial Services | Senior Secured Term Loan (11.50% (LIBOR + 8.50% with 3.00% LIBOR floor), due 12/17/2017)(3)(4) | $ | 49,922 | $ | 49,922 | $ | 49,922 | 1.3% | |||
49,922 | 49,922 | 1.3% | ||||||||||
Crosman Corporation | New York / Manufacturing | Second Lien Term Loan (12.00% (LIBOR + 10.50% with 1.50% LIBOR floor), due 12/30/2019)(3)(4) | 40,000 | 40,000 | 35,973 | 1.0% | ||||||
40,000 | 35,973 | 1.0% | ||||||||||
Diamondback Operating, LP | Oklahoma / Oil & Gas Production | Net Profits Interest (15% of Equity Distributions)(7) | — | — | —% | |||||||
— | — | —% | ||||||||||
Empire Today, LLC | Illinois / Durable Consumer Products | Senior Secured Note (11.375%, due 2/1/2017)(16) | 15,700 | 15,518 | 13,070 | 0.4% | ||||||
15,518 | 13,070 | 0.4% | ||||||||||
Fleetwash, Inc. | New Jersey / Business Services | Senior Secured Term Loan B (10.50% (LIBOR + 9.50% with 1.00% LIBOR floor), due 4/30/2019)(3)(4) | 24,446 | 24,446 | 24,446 | 0.7% | ||||||
Delayed Draw Term Loan – $15,000 Commitment (expires 4/30/2019)(25) | — | — | — | —% | ||||||||
24,446 | 24,446 | 0.7% | ||||||||||
Focus Brands, Inc. | Georgia / Consumer Services | Second Lien Term Loan (10.25% (LIBOR + 9.00% with 1.25% LIBOR floor), due 8/21/2018)(4)(16) | 18,000 | 17,821 | 18,000 | 0.5% | ||||||
17,821 | 18,000 | 0.5% | ||||||||||
Galaxy XV CLO, Ltd. | Cayman Islands / Structured Finance | Subordinated Notes (Residual Interest, current yield 15.65%)(11)(22) | 35,025 | 27,762 | 29,739 | 0.8% | ||||||
27,762 | 29,739 | 0.8% | ||||||||||
Galaxy XVI CLO, Ltd. | Cayman Islands / Structured Finance | Subordinated Notes (Residual Interest, current yield 13.97%)(11)(22) | 24,575 | 20,434 | 20,849 | 0.6% | ||||||
20,434 | 20,849 | 0.6% | ||||||||||
Galaxy XVII CLO, Ltd. | Cayman Islands / Structured Finance | Subordinated Notes (Residual Interest, current yield 13.43%)(11)(22)(48) | 39,905 | 33,493 | 33,742 | 0.9% | ||||||
33,493 | 33,742 | 0.9% | ||||||||||
Global Employment Solutions, Inc. | Colorado / Business Services | Senior Secured Term Loan (10.25% (LIBOR + 9.25% with 1.00% LIBOR floor), due 6/26/2020)(3)(4) | 49,567 | 49,567 | 49,567 | 1.3% | ||||||
49,567 | 49,567 | 1.3% | ||||||||||
GTP Operations, LLC(10) | Texas / Software & Computer Services | Senior Secured Term Loan (10.00% (LIBOR + 5.00% with 5.00% LIBOR floor), due 12/11/2018)(3)(4) | 116,411 | 116,411 | 116,411 | 3.1% | ||||||
116,411 | 116,411 | 3.1% | ||||||||||
Halcyon Loan Advisors Funding 2012-1 Ltd. | Cayman Islands / Structured Finance | Subordinated Notes (Residual Interest, current yield 30.89%)(11)(22) | 23,188 | 19,941 | 23,172 | 0.6% | ||||||
19,941 | 23,172 | 0.6% | ||||||||||
Halcyon Loan Advisors Funding 2013-1 Ltd. | Cayman Islands / Structured Finance | Subordinated Notes (Residual Interest, current yield 21.41%)(11)(22) | 40,400 | 34,936 | 39,208 | 1.1% | ||||||
34,936 | 39,208 | 1.1% | ||||||||||
Halcyon Loan Advisors Funding 2014-1 Ltd. | Cayman Islands / Structured Finance | Subordinated Notes (Residual Interest, current yield 17.17%)(11)(22) | 24,500 | 21,020 | 22,096 | 0.6% | ||||||
21,020 | 22,096 | 0.6% | ||||||||||
Halcyon Loan Advisors Funding 2014-2 Ltd. | Cayman Islands / Structured Finance | Subordinated Notes (Residual Interest, current yield 18.73%)(11)(22)(48) | 41,164 | 34,723 | 37,555 | 1.0% | ||||||
34,723 | 37,555 | 1.0% | ||||||||||
HarbourView CLO VII, Ltd. | Cayman Islands / Structured Finance | Subordinated Notes (Residual Interest, current yield 17.84%)(11)(22)(48) | 19,025 | 15,252 | 15,197 | 0.4% | ||||||
15,252 | 15,197 | 0.4% | ||||||||||
See notes to consolidated financial statements.
110
PROSPECT CAPITAL CORPORATION AND SUBSIDIARIES
CONSOLIDATED SCHEDULES OF INVESTMENTS (CONTINUED)
(in thousands, except share data)
June 30, 2015 | ||||||||||||
Portfolio Company | Locale / Industry | Investments(1) | Principal Value | Cost | Fair Value(2) | % of Net Assets | ||||||
LEVEL 3 PORTFOLIO INVESTMENTS | ||||||||||||
Non-Control/Non-Affiliate Investments (less than 5.00% voting control) | ||||||||||||
Harley Marine Services, Inc. | Washington / Transportation | Second Lien Term Loan (10.50% (LIBOR + 9.25% with 1.25% LIBOR floor), due 12/20/2019)(3)(4)(16) | $ | 9,000 | $ | 8,855 | $ | 8,748 | 0.2% | |||
8,855 | 8,748 | 0.2% | ||||||||||
Hollander Sleep Products, LLC | Florida / Durable Consumer Products | Senior Secured Term Loan (9.00% (LIBOR + 8.00% with 1.00% LIBOR floor), due 10/21/2020)(3)(4) | 22,444 | 22,444 | 22,444 | 0.6% | ||||||
22,444 | 22,444 | 0.6% | ||||||||||
ICON Health & Fitness, Inc. | Utah / Durable Consumer Products | Senior Secured Note (11.875%, due 10/15/2016)(16) | 16,100 | 16,103 | 16,100 | 0.4% | ||||||
16,103 | 16,100 | 0.4% | ||||||||||
ICV-CSI Holdings, LLC | New York / Transportation | Membership Units (1.6 units) | 1,639 | 2,400 | 0.1% | |||||||
1,639 | 2,400 | 0.1% | ||||||||||
Instant Web, LLC | Minnesota / Media | Senior Secured Term Loan A (5.50% (LIBOR + 4.50% with 1.00% LIBOR floor), due 3/28/2019)(4) | 146,363 | 146,363 | 146,363 | 4.0% | ||||||
Senior Secured Term Loan B (12.00% (LIBOR + 11.00% with 1.00% LIBOR floor), due 3/28/2019)(3)(4) | 150,100 | 150,100 | 150,100 | 4.0% | ||||||||
Senior Secured Term Loan C (12.75% (LIBOR + 11.75% with 1.00% LIBOR floor), due 3/28/2019)(4) | 27,000 | 27,000 | 27,000 | 0.7% | ||||||||
Delayed Draw Term Loan – $16,000 Commitment (expires 5/29/2016)(25) | — | — | — | —% | ||||||||
323,463 | 323,463 | 8.7% | ||||||||||
InterDent, Inc. | California / Healthcare | Senior Secured Term Loan A (6.25% (LIBOR + 5.25% with 1.00% LIBOR floor), due 8/3/2017)(4) | 125,350 | 125,350 | 125,350 | 3.4% | ||||||
Senior Secured Term Loan B (11.25% (LIBOR + 10.25% with 1.00% LIBOR floor), due 8/3/2017)(3)(4) | 131,125 | 131,125 | 131,125 | 3.5% | ||||||||
256,475 | 256,475 | 6.9% | ||||||||||
JAC Holding Corporation | Michigan / Transportation | Senior Secured Note (11.50%, due 10/1/2019)(16) | 3,000 | 3,000 | 3,000 | 0.1% | ||||||
3,000 | 3,000 | 0.1% | ||||||||||
Jefferson Mill CLO Ltd. | Cayman Islands / Structured Finance | Subordinated Notes (Residual Interest, current yield 15.65%)(11)(22)(48) | 19,500 | 16,928 | 16,928 | 0.5% | ||||||
16,928 | 16,928 | 0.5% | ||||||||||
JHH Holdings, Inc. | Texas / Healthcare | Second Lien Term Loan (11.25% (LIBOR + 10.00% with 1.25% LIBOR floor) plus 0.50% PIK, due 3/30/2019)(3)(4) | 35,297 | 35,297 | 35,297 | 1.0% | ||||||
35,297 | 35,297 | 1.0% | ||||||||||
LaserShip, Inc. | Virginia / Transportation | Senior Secured Term Loan A (10.25% (LIBOR + 8.25% with 2.00% LIBOR floor) plus 2.00% default interest, due 3/18/2019)(3)(4) | 35,156 | 35,156 | 30,778 | 0.8% | ||||||
Senior Secured Term Loan B (10.25% (LIBOR + 8.25% with 2.00% LIBOR floor) plus 2.00% default interest, due 3/18/2019)(3)(4) | 21,555 | 21,555 | 18,866 | 0.5% | ||||||||
Delayed Draw Term Loan – $6,000 Commitment (expires 12/31/2016)(25) | — | — | — | —% | ||||||||
56,711 | 49,644 | 1.3% | ||||||||||
LCM XIV Ltd. | Cayman Islands / Structured Finance | Income Notes (Residual Interest, current yield 16.70%)(11)(22) | 26,500 | 22,636 | 23,163 | 0.6% | ||||||
22,636 | 23,163 | 0.6% | ||||||||||
Madison Park Funding IX, Ltd. | Cayman Islands / Structured Finance | Subordinated Notes (Residual Interest, current yield 21.64%)(11)(22) | 31,110 | 23,663 | 25,804 | 0.7% | ||||||
23,663 | 25,804 | 0.7% | ||||||||||
See notes to consolidated financial statements.
111
PROSPECT CAPITAL CORPORATION AND SUBSIDIARIES
CONSOLIDATED SCHEDULES OF INVESTMENTS (CONTINUED)
(in thousands, except share data)
June 30, 2015 | ||||||||||||
Portfolio Company | Locale / Industry | Investments(1) | Principal Value | Cost | Fair Value(2) | % of Net Assets | ||||||
LEVEL 3 PORTFOLIO INVESTMENTS | ||||||||||||
Non-Control/Non-Affiliate Investments (less than 5.00% voting control) | ||||||||||||
Matrixx Initiatives, Inc. | New Jersey / Pharmaceuticals | Senior Secured Term Loan A (7.50% (LIBOR + 6.00% with 1.50% LIBOR floor), due 8/9/2018)(3)(4) | $ | 34,389 | $ | 34,389 | $ | 34,026 | 0.9% | |||
Senior Secured Term Loan B (12.50% (LIBOR + 11.00% with 1.50% LIBOR floor), due 8/9/2018)(3)(4) | 40,562 | 40,562 | 40,562 | 1.1% | ||||||||
74,951 | 74,588 | 2.0% | ||||||||||
Maverick Healthcare Equity, LLC | Arizona / Healthcare | Preferred Units (1,250,000 units) | 1,252 | 2,190 | 0.1% | |||||||
Class A Common Units (1,250,000 units) | — | — | —% | |||||||||
1,252 | 2,190 | 0.1% | ||||||||||
Mountain View CLO 2013-I Ltd. | Cayman Islands / Structured Finance | Subordinated Notes (Residual Interest, current yield 18.47%)(11)(22) | 43,650 | 37,168 | 40,480 | 1.1% | ||||||
37,168 | 40,480 | 1.1% | ||||||||||
Mountain View CLO IX Ltd. | Cayman Islands / Structured Finance | Subordinated Notes (Residual Interest, current yield 15.43%)(11)(22)(48) | 47,830 | 44,739 | 44,666 | 1.2% | ||||||
44,739 | 44,666 | 1.2% | ||||||||||
Nathan's Famous, Inc. | New York / Food Products | Senior Secured Notes (10.00%, due 3/15/2020)(16) | 3,000 | 3,000 | 3,000 | 0.1% | ||||||
3,000 | 3,000 | 0.1% | ||||||||||
NCP Finance Limited Partnership(23) | Ohio / Consumer Finance | Subordinated Secured Term Loan (11.00% (LIBOR + 9.75% with 1.25% LIBOR floor), due 9/30/2018)(3)(4)(16)(22) | 16,305 | 16,065 | 16,305 | 0.4% | ||||||
16,065 | 16,305 | 0.4% | ||||||||||
New Century Transportation, Inc. | New Jersey / Transportation | Senior Subordinated Term Loan (12.00% (LIBOR + 10.00% with 2.00% LIBOR floor) plus 4.00% PIK, in non-accrual status effective 4/1/2014, due 2/3/2018)(4) | 187 | 187 | — | —% | ||||||
187 | — | —% | ||||||||||
Nixon, Inc. | California / Durable Consumer Products | Senior Secured Term Loan (8.75% plus 2.75% PIK, due 4/16/2018)(3)(16) | 13,925 | 13,749 | 13,616 | 0.4% | ||||||
13,749 | 13,616 | 0.4% | ||||||||||
Octagon Investment Partners XV, Ltd. | Cayman Islands / Structured Finance | Income Notes (Residual Interest, current yield 20.72%)(11)(22) | 28,571 | 24,515 | 26,461 | 0.7% | ||||||
24,515 | 26,461 | 0.7% | ||||||||||
Onyx Payments(44) | Texas / Diversified Financial Services | Revolving Line of Credit – $5,000 Commitment (9.00% (LIBOR + 8.00% with 1.00% LIBOR floor), due 9/10/2015)(4)(25)(26) | 2,000 | 2,000 | 2,000 | 0.1% | ||||||
Senior Secured Term Loan A (6.50% (LIBOR + 5.50% with 1.00% LIBOR floor), due 9/10/2019)(3)(4) | 52,050 | 52,050 | 52,050 | 1.4% | ||||||||
Senior Secured Term Loan B (13.50% (LIBOR + 12.50% with 1.00% LIBOR floor), due 9/10/2019)(4) | 59,389 | 59,389 | 59,389 | 1.6% | ||||||||
113,439 | 113,439 | 3.1% | ||||||||||
Pacific World Corporation | California / Personal & Nondurable Consumer Products | Revolving Line of Credit – $15,000 Commitment (8.00% (LIBOR + 7.00% with 1.00% LIBOR floor), due 9/26/2020)(4)(25)(26) | 6,500 | 6,500 | 6,500 | 0.2% | ||||||
Senior Secured Term Loan A (6.00% (LIBOR + 5.00% with 1.00% LIBOR floor), due 9/26/2020)(4) | 99,250 | 99,250 | 95,400 | 2.6% | ||||||||
Senior Secured Term Loan B (10.00% (LIBOR + 9.00% with 1.00% LIBOR floor), due 9/26/2020)(3)(4) | 99,250 | 99,250 | 81,772 | 2.2% | ||||||||
205,000 | 183,672 | 5.0% | ||||||||||
Pelican Products, Inc. | California / Durable Consumer Products | Second Lien Term Loan (9.25% (LIBOR + 8.25% with 1.00% LIBOR floor), due 4/9/2021)(4)(16) | 17,500 | 17,484 | 17,500 | 0.5% | ||||||
17,484 | 17,500 | 0.5% | ||||||||||
See notes to consolidated financial statements.
112
PROSPECT CAPITAL CORPORATION AND SUBSIDIARIES
CONSOLIDATED SCHEDULES OF INVESTMENTS (CONTINUED)
(in thousands, except share data)
June 30, 2015 | ||||||||||||
Portfolio Company | Locale / Industry | Investments(1) | Principal Value | Cost | Fair Value(2) | % of Net Assets | ||||||
LEVEL 3 PORTFOLIO INVESTMENTS | ||||||||||||
Non-Control/Non-Affiliate Investments (less than 5.00% voting control) | ||||||||||||
PGX Holdings, Inc.(28) | Utah / Consumer Services | Second Lien Term Loan (10.00% (LIBOR + 9.00% with 1.00% LIBOR floor), due 9/29/2021)(3)(4) | $ | 135,000 | $ | 135,000 | $ | 135,000 | 3.6% | |||
135,000 | 135,000 | 3.6% | ||||||||||
Photonis Technologies SAS | France / Aerospace & Defense | First Lien Term Loan (8.50% (LIBOR + 7.50% with 1.00% LIBOR floor), due 9/18/2019)(4)(16)(22) | 10,369 | 10,145 | 9,734 | 0.3% | ||||||
10,145 | 9,734 | 0.3% | ||||||||||
Pinnacle (US) Acquisition Co. Limited | Texas / Software & Computer Services | Second Lien Term Loan (10.50% (LIBOR + 9.25% with 1.25% LIBOR floor), due 8/3/2020)(4)(16) | 7,037 | 6,890 | 6,612 | 0.2% | ||||||
6,890 | 6,612 | 0.2% | ||||||||||
PlayPower, Inc. | North Carolina / Durable Consumer Products | Second Lien Term Loan (9.75% (LIBOR + 8.75% with 1.00% LIBOR floor), due 6/23/2022)(4)(16) | 10,000 | 9,850 | 9,850 | 0.3% | ||||||
9,850 | 9,850 | 0.3% | ||||||||||
Prime Security Services Borrower, LLC | Illinois / Consumer Services | Second Lien Term Loan (9.75% (LIBOR + 8.75% with 1.00% LIBOR floor), due 7/1/2022)(4)(16) | 10,000 | 9,850 | 9,850 | 0.3% | ||||||
9,850 | 9,850 | 0.3% | ||||||||||
PrimeSport, Inc. | Georgia / Hotels, Restaurants & Leisure | Revolving Line of Credit – $15,000 Commitment (9.50% (LIBOR + 8.50% with 1.00% LIBOR floor), due 7/31/2015)(4)(25)(26) | 13,800 | 13,800 | 13,800 | 0.4% | ||||||
Senior Secured Term Loan A (7.00% (LIBOR + 6.00% with 1.00% LIBOR floor), due 2/11/2021)(3)(4) | 54,227 | 54,227 | 54,227 | 1.4% | ||||||||
Senior Secured Term Loan B (12.00% (LIBOR + 11.00% with 1.00% LIBOR floor), due 2/11/2021)(3)(4) | 74,500 | 74,500 | 74,500 | 2.0% | ||||||||
142,527 | 142,527 | 3.8% | ||||||||||
Prince Mineral Holding Corp. | New York / Metal Services & Minerals | Senior Secured Term Loan (11.50%, due 12/15/2019)(16) | 10,000 | 9,915 | 9,458 | 0.3% | ||||||
9,915 | 9,458 | 0.3% | ||||||||||
Rocket Software, Inc. | Massachusetts / Software & Computer Services | Second Lien Term Loan (10.25% (LIBOR + 8.75% with 1.50% LIBOR floor), due 2/8/2019)(3)(4)(16) | 20,000 | 19,801 | 20,000 | 0.5% | ||||||
19,801 | 20,000 | 0.5% | ||||||||||
Royal Holdings, Inc. | Indiana / Chemicals | Second Lien Term Loan (8.50% (LIBOR + 7.50% with 1.00% LIBOR floor), due 6/19/2023)(4)(16) | 5,000 | 4,963 | 5,000 | 0.1% | ||||||
4,963 | 5,000 | 0.1% | ||||||||||
Ryan, LLC | Texas / Business Services | Subordinated Unsecured Notes (12.00% (LIBOR + 9.00% with 3.00% LIBOR floor) plus 3.00% PIK, due 6/30/2018)(4) | 72,701 | 72,701 | 72,701 | 2.0% | ||||||
72,701 | 72,701 | 2.0% | ||||||||||
Security Alarm Financing Enterprises, L.P.(45) | California / Consumer Services | Subordinated Unsecured Notes (11.50% (LIBOR + 9.50% with 2.00% LIBOR floor), due 12/19/2020)(4) | 25,000 | 25,000 | 25,000 | 0.7% | ||||||
25,000 | 25,000 | 0.7% | ||||||||||
SESAC Holdco II LLC | Tennessee / Media | Second Lien Term Loan (9.00% (LIBOR + 8.00% with 1.00% LIBOR floor), due 4/22/2021)(3)(4)(16) | 10,000 | 9,854 | 9,925 | 0.3% | ||||||
9,854 | 9,925 | 0.3% | ||||||||||
Small Business Whole Loan Portfolio(19) | New York / Online Lending | 40 small business loans purchased from Direct Capital Corporation | 492 | 492 | 362 | —% | ||||||
2,306 small business loans purchased from On Deck Capital, Inc. | 50,066 | 50,066 | 50,530 | 1.4% | ||||||||
50,558 | 50,892 | 1.4% | ||||||||||
See notes to consolidated financial statements.
113
PROSPECT CAPITAL CORPORATION AND SUBSIDIARIES
CONSOLIDATED SCHEDULES OF INVESTMENTS (CONTINUED)
(in thousands, except share data)
June 30, 2015 | ||||||||||||
Portfolio Company | Locale / Industry | Investments(1) | Principal Value | Cost | Fair Value(2) | % of Net Assets | ||||||
LEVEL 3 PORTFOLIO INVESTMENTS | ||||||||||||
Non-Control/Non-Affiliate Investments (less than 5.00% voting control) | ||||||||||||
Spartan Energy Services, Inc. | Louisiana / Oil & Gas Services | Senior Secured Term Loan A (7.00% (LIBOR + 6.00% with 1.00% LIBOR floor), due 12/28/2017)(3)(4) | $ | 13,422 | $ | 13,422 | $ | 12,973 | 0.3% | |||
Senior Secured Term Loan B (11.00% (LIBOR + 10.00% with 1.00% LIBOR floor), due 12/28/2017)(3)(4) | 13,935 | 13,935 | 13,664 | 0.4% | ||||||||
27,357 | 26,637 | 0.7% | ||||||||||
Speedy Group Holdings Corp. | Canada / Consumer Finance | Senior Unsecured Notes (12.00%, due 11/15/2017)(16)(22) | 15,000 | 15,000 | 15,000 | 0.4% | ||||||
15,000 | 15,000 | 0.4% | ||||||||||
Stauber Performance Ingredients, Inc. | California / Food Products | Senior Secured Term Loan A (7.50% (LIBOR + 6.50% with 1.00% LIBOR floor), due 11/25/2019)(3)(4) | 9,561 | 9,561 | 9,561 | 0.2% | ||||||
Senior Secured Term Loan B (10.50% (LIBOR + 9.50% with 1.00% LIBOR floor), due 11/25/2019)(3)(4) | 9,799 | 9,799 | 9,799 | 0.3% | ||||||||
19,360 | 19,360 | 0.5% | ||||||||||
Stryker Energy, LLC | Ohio / Oil & Gas Production | Overriding Royalty Interests(18) | — | — | — | —% | ||||||
— | — | —% | ||||||||||
Sudbury Mill CLO Ltd. | Cayman Islands / Structured Finance | Subordinated Notes (Residual Interest, current yield 15.92%)(11)(22) | 28,200 | 22,562 | 24,425 | 0.7% | ||||||
22,562 | 24,425 | 0.7% | ||||||||||
Symphony CLO IX Ltd. | Cayman Islands / Structured Finance | Preference Shares (Residual Interest, current yield 20.76%)(11)(22) | 45,500 | 34,797 | 40,034 | 1.1% | ||||||
34,797 | 40,034 | 1.1% | ||||||||||
Symphony CLO XIV Ltd. | Cayman Islands / Structured Finance | Subordinated Notes (Residual Interest, current yield 12.24%)(11)(22)(48) | 49,250 | 44,018 | 45,641 | 1.2% | ||||||
44,018 | 45,641 | 1.2% | ||||||||||
Symphony CLO XV, Ltd. | Cayman Islands / Structured Finance | Subordinated Notes (Residual Interest, current yield 11.72%)(11)(22) | 50,250 | 46,994 | 46,452 | 1.3% | ||||||
46,994 | 46,452 | 1.3% | ||||||||||
System One Holdings, LLC | Pennsylvania / Business Services | Senior Secured Term Loan (10.50% (LIBOR + 9.50% with 1.00% LIBOR floor), due 11/17/2020)(3)(4) | 68,146 | 68,146 | 68,146 | 1.8% | ||||||
Delayed Draw Term Loan – $11,500 Commitment (expires 12/31/2015)(25) | — | — | — | —% | ||||||||
68,146 | 68,146 | 1.8% | ||||||||||
Targus Group International, Inc. | California / Durable Consumer Products | First Lien Term Loan (11.75% (PRIME + 8.50%) plus 1.00% PIK and 2.00% default interest, due 5/24/2016)(4)(16) | 21,487 | 21,378 | 17,233 | 0.5% | ||||||
21,378 | 17,233 | 0.5% | ||||||||||
TB Corp. | Texas / Hotels, Restaurants & Leisure | Senior Subordinated Note (12.00% plus 1.50% PIK, due 12/19/2018)(3) | 23,628 | 23,628 | 23,628 | 0.6% | ||||||
23,628 | 23,628 | 0.6% | ||||||||||
Therakos, Inc. | New Jersey / Healthcare | Second Lien Term Loan (10.75% (LIBOR + 9.50% with 1.25% LIBOR floor), due 6/27/2018)(4)(16) | 13,000 | 12,808 | 13,000 | 0.4% | ||||||
12,808 | 13,000 | 0.4% | ||||||||||
Tolt Solutions, Inc. | South Carolina / Business Services | Senior Secured Term Loan A (7.00% (LIBOR + 6.00% with 1.00% LIBOR floor), due 3/7/2019)(3)(4) | 47,802 | 47,802 | 45,548 | 1.2% | ||||||
Senior Secured Term Loan B (12.00% (LIBOR + 11.00% with 1.00% LIBOR floor), due 3/7/2019)(3)(4) | 48,900 | 48,900 | 46,155 | 1.2% | ||||||||
96,702 | 91,703 | 2.4% | ||||||||||
TouchTunes Interactive Networks, Inc. | New York / Media | Second Lien Term Loan (9.25% (LIBOR + 8.25% with 1.00% LIBOR floor), due 5/29/2022)(4)(16) | 5,000 | 4,925 | 4,925 | 0.1% | ||||||
4,925 | 4,925 | 0.1% | ||||||||||
See notes to consolidated financial statements.
114
PROSPECT CAPITAL CORPORATION AND SUBSIDIARIES
CONSOLIDATED SCHEDULES OF INVESTMENTS (CONTINUED)
(in thousands, except share data)
June 30, 2015 | ||||||||||||
Portfolio Company | Locale / Industry | Investments(1) | Principal Value | Cost | Fair Value(2) | % of Net Assets | ||||||
LEVEL 3 PORTFOLIO INVESTMENTS | ||||||||||||
Non-Control/Non-Affiliate Investments (less than 5.00% voting control) | ||||||||||||
Traeger Pellet Grills LLC | Oregon / Durable Consumer Products | Senior Secured Term Loan A (6.50% (LIBOR + 4.50% with 2.00% LIBOR floor), due 6/18/2018)(3)(4) | $ | 35,644 | $ | 35,644 | $ | 35,644 | 1.0% | |||
Senior Secured Term Loan B (11.50% (LIBOR + 9.50% with 2.00% LIBOR floor), due 6/18/2018)(3)(4) | 36,881 | 36,881 | 36,881 | 1.0% | ||||||||
72,525 | 72,525 | 2.0% | ||||||||||
Transaction Network Services, Inc. | Virginia / Telecommunication Services | Second Lien Term Loan (9.00% (LIBOR + 8.00% with 1.00% LIBOR floor), due 8/14/2020)(4)(16) | 4,595 | 4,573 | 4,595 | 0.1% | ||||||
4,573 | 4,595 | 0.1% | ||||||||||
Trinity Services Group, Inc.(14) | Florida / Food Products | Senior Secured Term Loan A (6.50% (LIBOR + 5.50% with 1.00% LIBOR floor), due 8/13/2019)(4) | 9,825 | 9,825 | 9,825 | 0.3% | ||||||
Senior Secured Term Loan B (11.50% (LIBOR + 10.50% with 1.00% LIBOR floor), due 8/13/2019)(3)(4) | 100,000 | 100,000 | 100,000 | 2.7% | ||||||||
109,825 | 109,825 | 3.0% | ||||||||||
United Sporting Companies, Inc.(5) | South Carolina / Durable Consumer Products | Second Lien Term Loan (12.75% (LIBOR + 11.00% with 1.75% LIBOR floor), due 5/16/2018)(3)(4) | 158,238 | 158,238 | 145,618 | 3.9% | ||||||
158,238 | 145,618 | 3.9% | ||||||||||
United States Environmental Services, LLC | Texas / Commercial Services | Senior Secured Term Loan A (6.50% (LIBOR + 5.50% with 1.00% LIBOR floor) plus 2.00% default interest, due 3/31/2019)(3)(4) | 23,250 | 23,250 | 21,551 | 0.6% | ||||||
Senior Secured Term Loan B (11.50% (LIBOR + 10.50% with 1.00% LIBOR floor) plus 2.00% default interest, due 3/31/2019)(3)(4) | 36,000 | 36,000 | 33,406 | 0.9% | ||||||||
59,250 | 54,957 | 1.5% | ||||||||||
USG Intermediate, LLC | Texas / Durable Consumer Products | Revolving Line of Credit – $5,000 Commitment (10.00% (LIBOR + 9.00% with 1.00% LIBOR floor), due 4/15/2016)(4)(25)(26) | — | — | — | —% | ||||||
Senior Secured Term Loan A (7.50% (LIBOR + 6.50% with 1.00% LIBOR floor), due 4/15/2020)(3)(4) | 21,587 | 21,587 | 21,587 | 0.6% | ||||||||
Senior Secured Term Loan B (12.50% (LIBOR + 11.50% with 1.00% LIBOR floor), due 4/15/2020)(3)(4) | 21,695 | 21,695 | 21,695 | 0.6% | ||||||||
Equity | 1 | — | —% | |||||||||
43,283 | 43,282 | 1.2% | ||||||||||
Venio LLC | Pennsylvania / Business Services | Second Lien Term Loan (12.00% (LIBOR + 9.50% with 2.50% LIBOR floor), due 2/19/2020)(3)(4) | 17,000 | 17,000 | 16,042 | 0.4% | ||||||
17,000 | 16,042 | 0.4% | ||||||||||
Voya CLO 2012-2, Ltd. | Cayman Islands / Structured Finance | Income Notes (Residual Interest, current yield 19.32%)(11)(22) | 38,070 | 30,002 | 32,391 | 0.9% | ||||||
30,002 | 32,391 | 0.9% | ||||||||||
Voya CLO 2012-3, Ltd. | Cayman Islands / Structured Finance | Income Notes (Residual Interest, current yield 16.87%)(11)(22) | 46,632 | 37,208 | 38,465 | 1.0% | ||||||
37,208 | 38,465 | 1.0% | ||||||||||
Voya CLO 2012-4, Ltd. | Cayman Islands / Structured Finance | Income Notes (Residual Interest, current yield 19.40%)(11)(22) | 40,613 | 32,918 | 34,977 | 0.9% | ||||||
32,918 | 34,977 | 0.9% | ||||||||||
Voya CLO 2014-1, Ltd. | Cayman Islands / Structured Finance | Subordinated Notes (Residual Interest, current yield 15.25%)(11)(22)(48) | 32,383 | 28,886 | 29,170 | 0.8% | ||||||
28,886 | 29,170 | 0.8% | ||||||||||
Washington Mill CLO Ltd. | Cayman Islands / Structured Finance | Subordinated Notes (Residual Interest, current yield 14.28%)(11)(22)(48) | 22,600 | 19,542 | 20,137 | 0.5% | ||||||
19,542 | 20,137 | 0.5% | ||||||||||
See notes to consolidated financial statements.
115
PROSPECT CAPITAL CORPORATION AND SUBSIDIARIES
CONSOLIDATED SCHEDULES OF INVESTMENTS (CONTINUED)
(in thousands, except share data)
June 30, 2015 | ||||||||||||
Portfolio Company | Locale / Industry | Investments(1) | Principal Value | Cost | Fair Value(2) | % of Net Assets | ||||||
LEVEL 3 PORTFOLIO INVESTMENTS | ||||||||||||
Non-Control/Non-Affiliate Investments (less than 5.00% voting control) | ||||||||||||
Water Pik, Inc. | Colorado / Personal & Nondurable Consumer Products | Second Lien Term Loan (9.75% (LIBOR + 8.75% with 1.00% LIBOR floor), due 1/8/2021)(4)(16) | $ | 9,147 | $ | 8,796 | $ | 9,147 | 0.2% | |||
8,796 | 9,147 | 0.2% | ||||||||||
Wheel Pros, LLC | Colorado / Business Services | Senior Subordinated Secured Note (11.00% (LIBOR + 7.00% with 4.00% LIBOR floor), due 6/29/2020)(3)(4) | 12,000 | 12,000 | 12,000 | 0.3% | ||||||
Delayed Draw Term Loan – $3,000 Commitment (expires 12/30/2015)(25) | — | — | — | —% | ||||||||
12,000 | 12,000 | 0.3% | ||||||||||
Wind River Resources Corporation(39) | Utah / Oil & Gas Production | Senior Secured Note (13.00% (LIBOR + 7.50% with 5.50% LIBOR floor) plus 3.00% default interest on principal and 16.00% default interest on past due interest, in non-accrual status effective 12/1/2008, past due)(4) | 3,000 | 3,000 | — | —% | ||||||
Net Profits Interest (5% of Equity Distributions)(7) | — | — | —% | |||||||||
3,000 | — | —% | ||||||||||
Total Non-Control/Non-Affiliate Investments (Level 3) | $ | 4,619,519 | $ | 4,589,151 | 124.0% | |||||||
Total Level 3 Portfolio Investments | $ | 6,559,313 | $ | 6,609,298 | 178.5% | |||||||
LEVEL 1 PORTFOLIO INVESTMENTS | ||||||||||
Non-Control/Non-Affiliate Investments (less than 5.00% voting control) | ||||||||||
Dover Saddlery, Inc. | Massachusetts / Retail | Common Stock (30,974 shares) | $ | 63 | $ | 260 | —% | |||
63 | 260 | —% | ||||||||
Total Non-Control/Non-Affiliate Investments (Level 1) | $ | 63 | $ | 260 | —% | |||||
Total Non-Control/Non-Affiliate Investments | $ | 4,619,582 | $ | 4,589,411 | 124.0% | |||||
Total Portfolio Investments | $ | 6,559,376 | $ | 6,609,558 | 178.5% | |||||
See notes to consolidated financial statements.
116
PROSPECT CAPITAL CORPORATION AND SUBSIDIARIES
CONSOLIDATED SCHEDULES OF INVESTMENTS (CONTINUED)
(in thousands, except share data)
June 30, 2014 | ||||||||||||
Portfolio Company | Locale / Industry | Investments(1) | Principal Value | Cost | Fair Value(2) | % of Net Assets | ||||||
LEVEL 3 PORTFOLIO INVESTMENTS | ||||||||||||
Control Investments (greater than 25.00% voting control)(51) | ||||||||||||
AMU Holdings Inc.(27) | Pennsylvania / Property Management | Senior Secured Term Loan A to Airmall Inc. (12.00% (LIBOR + 9.00% with 3.00% LIBOR floor), due 6/30/2015)(3)(4) | $ | 27,587 | $ | 27,587 | $ | 27,587 | 0.8% | |||
Senior Secured Term Loan B to Airmall Inc. (12.00% plus 6.00% PIK, due 12/31/2015) | 19,993 | 19,993 | 17,697 | 0.5% | ||||||||
Series A Preferred Stock of AMU Holdings Inc. (9,919.684 shares) | 9,920 | — | —% | |||||||||
Common Stock of AMU Holdings Inc. (100 shares) | — | — | —% | |||||||||
57,500 | 45,284 | 1.3% | ||||||||||
APH Property Holdings, LLC(32) | Various / Real Estate | Senior Term Loan to American Property REIT Corp. (6.00% (LIBOR + 4.00% with 2.00% LIBOR floor) plus 5.50% PIK, due 4/1/2019)(4) | 167,743 | 167,743 | 167,743 | 4.6% | ||||||
Membership Interest in APH Property Holdings, LLC | 35,024 | 38,416 | 1.1% | |||||||||
202,767 | 206,159 | 5.7% | ||||||||||
Arctic Oilfield Equipment USA, Inc.(30) | Wyoming / Oil & Gas Services | Senior Secured Term Loan to Arctic Energy Services, LLC (12.00% (LIBOR + 9.00% with 3.00% LIBOR floor), due 5/5/2019)(4) | 31,640 | 31,640 | 31,640 | 0.9% | ||||||
Senior Subordinated Term Loan to Arctic Energy Services, LLC (14.00% (LIBOR + 11.00% with 3.00% LIBOR floor), due 5/5/2019)(4) | 20,230 | 20,230 | 20,230 | 0.6% | ||||||||
Common Stock of Arctic Oilfield Equipment USA, Inc. (100 shares) | 9,006 | 9,244 | 0.2% | |||||||||
60,876 | 61,114 | 1.7% | ||||||||||
ARRM Services, Inc.(42) | South Carolina / Manufacturing | Senior Secured Note to Ajax Rolled Ring & Machine, LLC (10.50% (LIBOR + 7.50% with 3.00% LIBOR floor), due 3/30/2018)(4) | 19,337 | 19,337 | 19,337 | 0.5% | ||||||
Series B Preferred Stock of ARRM Services, Inc. (25,000 shares) | 21,156 | 6,199 | 0.2% | |||||||||
Series A Convertible Preferred Stock of ARRM Services, Inc. (6,142.60 shares) | 6,057 | — | —% | |||||||||
Common Stock of ARRM Services, Inc. (6.00 shares) | — | — | —% | |||||||||
46,550 | 25,536 | 0.7% | ||||||||||
BXC Company, Inc. (f/k/a BXC Holding Company)(20) | Georgia / Textiles, Apparel & Luxury Goods | Senior Secured Term Loan A to Boxercraft Incorporated (10.00% plus 1.00% PIK, in non-accrual status effective 1/1/2014, due 9/15/2015) | 1,629 | 1,621 | 1,629 | 0.1% | ||||||
Senior Secured Term Loan B to Boxercraft Incorporated (10.00% plus 1.00% PIK, in non-accrual status effective 1/1/2014, due 9/15/2015) | 4,942 | 4,917 | 486 | —% | ||||||||
Senior Secured Term Loan C to Boxercraft Incorporated (10.00% plus 1.00% PIK, in non-accrual status effective 1/1/2014, due 9/15/2015) | 2,395 | 2,383 | — | —% | ||||||||
Senior Secured Term Loan D to Boxercraft Incorporated (10.00% plus 1.00% PIK, in non-accrual status effective 4/18/2014, due 9/15/2015) | 301 | 300 | — | —% | ||||||||
Senior Secured Term Loan to Boxercraft Incorporated (10.00% plus 1.00% PIK, in non-accrual status effective 1/1/2014, due 9/15/2015) | 8,410 | 8,227 | — | —% | ||||||||
Series A Preferred Stock of BXC Company, Inc. (12,520,000 shares) | — | — | —% | |||||||||
Series B Preferred Stock of BXC Company, Inc. (2,400,000 shares) | — | — | —% | |||||||||
Common Stock of BXC Company, Inc. (138,250 shares) | — | — | —% | |||||||||
Warrant (to purchase 15% of all classes of equity of BXC Company, Inc., expires 8/31/2022) | — | — | —% | |||||||||
17,448 | 2,115 | 0.1% | ||||||||||
See notes to consolidated financial statements.
117
PROSPECT CAPITAL CORPORATION AND SUBSIDIARIES
CONSOLIDATED SCHEDULES OF INVESTMENTS (CONTINUED)
(in thousands, except share data)
June 30, 2014 | ||||||||||||
Portfolio Company | Locale / Industry | Investments(1) | Principal Value | Cost | Fair Value(2) | % of Net Assets | ||||||
LEVEL 3 PORTFOLIO INVESTMENTS | ||||||||||||
Control Investments (greater than 25.00% voting control)(51) | ||||||||||||
CCPI Holdings Inc.(33) | Ohio / Manufacturing | Senior Secured Term Loan A to CCPI Inc. (10.00%, due 12/31/2017)(3) | $ | 17,213 | $ | 17,213 | $ | 17,213 | 0.5% | |||
Senior Secured Term Loan B to CCPI Inc. (12.00% plus 7.00% PIK, due 12/31/2017) | 8,245 | 8,245 | 8,245 | 0.2% | ||||||||
Common Stock of CCPI Holdings Inc. (100 shares) | 8,579 | 7,136 | 0.2% | |||||||||
34,037 | 32,594 | 0.9% | ||||||||||
CP Holdings of Delaware LLC(38) | Oklahoma / Oil & Gas Services | Senior Secured Term Loan A to CP Well Testing, LLC (7.00% (LIBOR + 5.00% with 2.00% LIBOR floor), due 4/1/2019)(4) | 11,035 | 11,035 | 11,035 | 0.3% | ||||||
Senior Secured Term Loan B to CP Well Testing, LLC (10.00% (LIBOR + 8.00% with 2.00% LIBOR floor) plus 7.50% PIK, due 4/1/2019)(4) | 72,238 | 72,238 | 72,238 | 2.0% | ||||||||
Second Lien Term Loan to CP Well Testing, LLC (9.00% (LIBOR + 7.00% with 2.00% LIBOR floor) plus 9.00% PIK, due 4/1/2019)(4) | 15,000 | 15,000 | 15,000 | 0.4% | ||||||||
Membership Interest in CP Holdings of Delaware LLC | 15,228 | 31,846 | 0.9% | |||||||||
113,501 | 130,119 | 3.6% | ||||||||||
Credit Central Holdings of Delaware, LLC(34) | Ohio / Consumer Finance | Subordinated Term Loan to Credit Central Loan Company, LLC (10.00% plus 10.00% PIK, due 6/26/2019)(22) | 36,333 | 36,333 | 36,333 | 1.0% | ||||||
Membership Interest in Credit Central Holdings of Delaware, LLC(22) | 13,670 | 14,099 | 0.4% | |||||||||
50,003 | 50,432 | 1.4% | ||||||||||
Echelon Aviation LLC | New York / Aerospace & Defense | Senior Secured Term Loan to Echelon Aviation LLC (11.75% (LIBOR + 9.75% with 2.00% LIBOR floor) plus 2.25% PIK, due 3/31/2022)(4) | 78,521 | 78,521 | 78,521 | 2.2% | ||||||
Membership Interest in Echelon Aviation LLC | 14,107 | 14,107 | 0.4% | |||||||||
92,628 | 92,628 | 2.6% | ||||||||||
Energy Solutions Holdings Inc.(8) | Texas / Oil & Gas Services | Senior Secured Note to Vessel Company, LLC (18.00%, due 12/12/2016) | 3,500 | 3,500 | 3,500 | 0.1% | ||||||
Senior Secured Note to Vessel Company II, LLC (13.00%, due 11/25/2018) | 13,000 | 12,504 | 12,504 | 0.4% | ||||||||
Senior Secured Note to Vessel Company III, LLC (13.00%, due 12/3/2018) | 16,000 | 16,000 | 16,000 | 0.4% | ||||||||
Senior Secured Note to Yatesville Coal Company, LLC (in non-accrual status effective 1/1/2009, past due) | 1,449 | 1,449 | — | —% | ||||||||
Common Stock of Energy Solutions Holdings Inc. (100 shares) | 8,293 | — | —% | |||||||||
41,746 | 32,004 | 0.9% | ||||||||||
First Tower Holdings of Delaware LLC(29) | Mississippi / Consumer Finance | Subordinated Term Loan to First Tower, LLC (10.00% plus 7.00% PIK, due 6/24/2019)(22) | 251,246 | 251,246 | 251,246 | 6.9% | ||||||
Membership Interest in First Tower Holdings of Delaware LLC(22) | 68,405 | 75,539 | 2.1% | |||||||||
319,651 | 326,785 | 9.0% | ||||||||||
Gulf Coast Machine & Supply Company | Texas / Manufacturing | Senior Secured Term Loan to Gulf Coast Machine & Supply Company (10.50% (LIBOR + 8.50% with 2.00% LIBOR floor) plus 2.00% default interest on principal, due 10/12/2017)(4) | 17,500 | 17,500 | 14,459 | 0.4% | ||||||
Series A Convertible Preferred Stock of Gulf Coast Machine & Supply Company (99,900 shares) | 25,950 | — | —% | |||||||||
43,450 | 14,459 | 0.4% | ||||||||||
See notes to consolidated financial statements.
118
PROSPECT CAPITAL CORPORATION AND SUBSIDIARIES
CONSOLIDATED SCHEDULES OF INVESTMENTS (CONTINUED)
(in thousands, except share data)
June 30, 2014 | ||||||||||||
Portfolio Company | Locale / Industry | Investments(1) | Principal Value | Cost | Fair Value(2) | % of Net Assets | ||||||
LEVEL 3 PORTFOLIO INVESTMENTS | ||||||||||||
Control Investments (greater than 25.00% voting control)(51) | ||||||||||||
Harbortouch Holdings of Delaware Inc.(43) | Pennsylvania / Business Services | Senior Secured Term Loan A to Harbortouch Payments, LLC (9.00% (LIBOR + 7.00% with 2.00% LIBOR floor), due 9/30/2017)(4) | $ | 130,796 | $ | 130,796 | $ | 130,796 | 3.6% | |||
Senior Secured Term Loan B to Harbortouch Payments, LLC (5.50% (LIBOR + 4.00% with 1.50% LIBOR floor) plus 5.50% PIK, due 3/31/2018)(4) | 137,226 | 137,226 | 137,226 | 3.8% | ||||||||
Common Stock of Harbortouch Holdings of Delaware Inc. (100 shares) | 10,672 | 23,292 | 0.6% | |||||||||
278,694 | 291,314 | 8.0% | ||||||||||
The Healing Staff, Inc.(9) | North Carolina / Contracting | Secured Promissory Notes to The Healing Staff, Inc. and Vets Securing America, Inc. (15.00%, in non-accrual status effective 12/22/2010, past due) | 1,688 | 1,686 | — | —% | ||||||
Senior Demand Note to The Healing Staff, Inc. (15.00%, in non-accrual status effective 11/1/2010, past due) | 1,170 | 1,170 | — | —% | ||||||||
Common Stock of The Healing Staff, Inc. (1,000 shares) | — | — | —% | |||||||||
Common Stock of Vets Securing America, Inc. (1,500 shares) | 975 | — | —% | |||||||||
3,831 | — | —% | ||||||||||
Manx Energy, Inc.(6) | Kansas / Oil & Gas Production | Senior Secured Note to Manx Energy, Inc. (13.00%, in non-accrual status effective 1/19/2010, past due) | 50 | 50 | — | —% | ||||||
Series A-1 Preferred Stock of Manx Energy, Inc. (6,635 shares) | — | — | —% | |||||||||
Common Stock of Manx Energy, Inc. (17,082 shares) | — | — | —% | |||||||||
50 | — | —% | ||||||||||
MITY Holdings of Delaware Inc.(17) | Utah / Durable Consumer Products | Revolving Line of Credit to MITY, Inc. – $7,500 Commitment (9.50% (LIBOR + 7.00% with 2.50% LIBOR floor), due 12/23/2014)(4)(25)(26) | — | — | — | —% | ||||||
Senior Secured Note A to MITY, Inc. (10.00% (LIBOR + 7.00% with 3.00% LIBOR floor), due 3/19/2019)(3)(4) | 18,250 | 18,250 | 18,250 | 0.5% | ||||||||
Senior Secured Note B to MITY, Inc. (10.00% (LIBOR + 7.00% with 3.00% LIBOR floor) plus 10.00% PIK, due 3/19/2019)(4) | 15,769 | 15,769 | 15,769 | 0.4% | ||||||||
Common Stock of MITY Holdings of Delaware Inc. (100 shares) | 14,143 | 15,270 | 0.4% | |||||||||
48,162 | 49,289 | 1.3% | ||||||||||
Nationwide Acceptance Holdings LLC(36) | Illinois / Consumer Finance | Senior Subordinated Term Loan to Nationwide Acceptance LLC (10.00% plus 10.00% PIK, due 6/18/2019)(22) | 14,820 | 14,820 | 14,820 | 0.4% | ||||||
Membership Interest in Nationwide Acceptance Holdings LLC(22) | 14,331 | 15,103 | 0.4% | |||||||||
29,151 | 29,923 | 0.8% | ||||||||||
NMMB Holdings, Inc.(24) | New York / Media | Senior Secured Note to NMMB, Inc. (14.00%, due 5/6/2016) | 3,714 | 3,714 | 2,183 | 0.1% | ||||||
Senior Secured Note to Armed Forces Communications, Inc. (14.00%, due 5/6/2016) | 7,000 | 7,000 | 4,114 | 0.1% | ||||||||
Series B Convertible Preferred Stock of NMMB Holdings, Inc. (8,086 shares) | 8,086 | — | —% | |||||||||
Series A Preferred Stock of NMMB Holdings, Inc. (4,400 shares) | 4,400 | — | —% | |||||||||
23,200 | 6,297 | 0.2% | ||||||||||
See notes to consolidated financial statements.
119
PROSPECT CAPITAL CORPORATION AND SUBSIDIARIES
CONSOLIDATED SCHEDULES OF INVESTMENTS (CONTINUED)
(in thousands, except share data)
June 30, 2014 | ||||||||||||
Portfolio Company | Locale / Industry | Investments(1) | Principal Value | Cost | Fair Value(2) | % of Net Assets | ||||||
LEVEL 3 PORTFOLIO INVESTMENTS | ||||||||||||
Control Investments (greater than 25.00% voting control)(51) | ||||||||||||
NPH Property Holdings, LLC(40) | Various | Senior Term Loan to National Property REIT Corp. (6.00% (LIBOR + 4.00% with 2.00% LIBOR floor) plus 5.50% PIK, due 4/1/2019)(4) | $ | 105,309 | $ | 105,309 | $ | 105,309 | 2.9% | |||
Membership Interest in NPH Property Holdings, LLC | 21,290 | 19,202 | 0.5% | |||||||||
126,599 | 124,511 | 3.4% | ||||||||||
R-V Industries, Inc. | Pennsylvania / Manufacturing | Senior Subordinated Note to R-V Industries, Inc. (10.00% (LIBOR + 9.00% with 1.00% LIBOR floor), due 6/12/2018)(3)(4) | 30,411 | 30,411 | 30,411 | 0.8% | ||||||
Common Stock of R-V Industries, Inc. (545,107 shares) | 5,087 | 19,989 | 0.6% | |||||||||
Warrant (to purchase 200,000 shares of Common Stock of R-V Industries, expires 6/30/2017) | 1,682 | 7,334 | 0.2% | |||||||||
37,180 | 57,734 | 1.6% | ||||||||||
STI Holding, Inc.(21) | California / Manufacturing | Revolving Line of Credit to Borga, Inc. – $1,150 Commitment (5.00% (PRIME + 1.75%), in non-accrual status effective 3/2/2010, past due)(4)(25) | 1,150 | 1,095 | 436 | —% | ||||||
Senior Secured Term Loan B to Borga, Inc. (8.50% (PRIME + 5.25%), in non-accrual status effective 3/2/2010, past due)(4) | 1,612 | 1,501 | — | —% | ||||||||
Senior Secured Term Loan C to Borga, Inc. (12.00% plus 4.00% PIK, in non-accrual status effective 3/2/2010, past due) | 10,016 | 581 | — | —% | ||||||||
Common Stock of STI Holding, Inc. (100 shares) | — | — | —% | |||||||||
Warrant (to purchase 33,750 shares of Common Stock of Borga, Inc., expires 5/6/2015) | — | — | —% | |||||||||
3,177 | 436 | —% | ||||||||||
UPH Property Holdings, LLC(41) | Various / Real Estate | Senior Term Loan to United Property REIT Corp. (6.00% (LIBOR + 4.00% with 2.00% LIBOR floor) plus 5.50% PIK, due 4/1/2019)(4) | 19,027 | 19,027 | 19,027 | 0.5% | ||||||
Membership Interest in UPH Property Holdings, LLC | 5,113 | 5,539 | 0.2% | |||||||||
24,140 | 24,566 | 0.7% | ||||||||||
Valley Electric Holdings I, Inc.(35) | Washington / Construction & Engineering | Senior Secured Note to Valley Electric Co. of Mt. Vernon, Inc. (8.00% (LIBOR + 5.00% with 3.00% LIBOR floor) plus 2.50% PIK, due 12/31/2017)(3)(4) | 10,081 | 10,081 | 10,081 | 0.3% | ||||||
Senior Secured Note to Valley Electric Company, Inc. (10.00% plus 8.5% PIK, due 12/31/2018) | 20,500 | 20,500 | 20,500 | 0.6% | ||||||||
Common Stock of Valley Electric Holdings I, Inc. (100 shares) | 26,279 | 2,975 | —% | |||||||||
56,860 | 33,556 | 0.9% | ||||||||||
Wolf Energy Holdings Inc.(12) | Kansas / Oil & Gas Production | Senior Secured Promissory Note to Wolf Energy, LLC secured by assets formerly owned by H&M (18.00%, in non-accrual status effective 4/15/2013, due 4/15/2018)(37) | 22,000 | — | 3,386 | 0.1% | ||||||
Senior Secured Note to Appalachian Energy LLC (8.00%, in non-accrual status effective 1/19/2010, past due)(6) | 2,865 | 2,000 | — | —% | ||||||||
Senior Secured Note to Appalachian Energy LLC (8.00%, in non-accrual status, past due)(6) | 56 | 50 | — | —% | ||||||||
Senior Secured Note to Coalbed, LLC (8.00%, in non-accrual status effective 1/19/2010, past due)(6) | 8,595 | 5,991 | — | —% | ||||||||
Common Stock of Wolf Energy Holdings Inc. (100 shares) | — | — | —% | |||||||||
Net Profits Interest in Wolf Energy, LLC (8% of Equity Distributions)(7) | — | 213 | —% | |||||||||
8,041 | 3,599 | 0.1% | ||||||||||
Total Control Investments | $ | 1,719,242 | $ | 1,640,454 | 45.3% | |||||||
See notes to consolidated financial statements.
120
PROSPECT CAPITAL CORPORATION AND SUBSIDIARIES
CONSOLIDATED SCHEDULES OF INVESTMENTS (CONTINUED)
(in thousands, except share data)
June 30, 2014 | ||||||||||||
Portfolio Company | Locale / Industry | Investments(1) | Principal Value | Cost | Fair Value(2) | % of Net Assets | ||||||
LEVEL 3 PORTFOLIO INVESTMENTS | ||||||||||||
Affiliate Investments (5.00% to 24.99% voting control)(52) | ||||||||||||
BNN Holdings Corp. | Michigan / Healthcare | Senior Secured Note (10.00% (LIBOR + 8.00% with 2.00% LIBOR floor), due 12/17/2017)(3)(4) | $ | 28,950 | $ | 28,950 | $ | 28,950 | 0.8% | |||
Series A Preferred Stock (9,925.455 shares)(13) | 2,300 | 2,614 | 0.1% | |||||||||
Series B Preferred Stock (1,753.636 shares)(13) | 579 | 557 | —% | |||||||||
31,829 | 32,121 | 0.9% | ||||||||||
Total Affiliate Investments | $ | 31,829 | $ | 32,121 | 0.9% | |||||||
Non-Control/Non-Affiliate Investments (less than 5.00% voting control) | ||||||||||||
Aderant North America, Inc. | Georgia / Software & Computer Services | Second Lien Term Loan (10.00% (LIBOR + 8.75% with 1.25% LIBOR floor), due 6/20/2019)(4)(16) | $ | 7,000 | $ | 6,914 | $ | 7,000 | 0.2% | |||
6,914 | 7,000 | 0.2% | ||||||||||
Aircraft Fasteners International, LLC | California / Machinery | Class A Units (32,500 units) | 396 | 505 | —% | |||||||
396 | 505 | —% | ||||||||||
ALG USA Holdings, LLC | Pennsylvania / Hotels, Restaurants & Leisure | Second Lien Term Loan (10.25% (LIBOR + 9.00% with 1.25% LIBOR floor), due 2/28/2020)(4)(16) | 12,000 | 11,792 | 12,000 | 0.3% | ||||||
11,792 | 12,000 | 0.3% | ||||||||||
Allied Defense Group, Inc. | Virginia / Aerospace & Defense | Common Stock (10,000 shares) | 5 | — | —% | |||||||
5 | — | —% | ||||||||||
American Broadband Holding Company and Cameron Holdings of NC, Inc. | North Carolina / Telecommunication Services | Senior Secured Term Loan B (11.00% (LIBOR + 9.75% with 1.25% LIBOR floor), due 9/30/2018)(3)(4) | 74,654 | 74,654 | 74,654 | 2.1% | ||||||
74,654 | 74,654 | 2.1% | ||||||||||
American Gilsonite Company | Utah / Metal Services & Minerals | Second Lien Term Loan (11.50%, due 9/1/2017)(16) | 38,500 | 38,500 | 38,500 | 1.1% | ||||||
Membership Interest (99.9999%)(15) | — | 3,477 | 0.1% | |||||||||
38,500 | 41,977 | 1.2% | ||||||||||
Apidos CLO IX | Cayman Islands / Structured Finance | Subordinated Notes (Residual Interest, current yield 18.84%)(11)(22) | 20,525 | 18,444 | 19,903 | 0.5% | ||||||
18,444 | 19,903 | 0.5% | ||||||||||
Apidos CLO XI | Cayman Islands / Structured Finance | Subordinated Notes (Residual Interest, current yield 15.02%)(11)(22) | 38,340 | 33,937 | 37,087 | 1.0% | ||||||
33,937 | 37,087 | 1.0% | ||||||||||
Apidos CLO XII | Cayman Islands / Structured Finance | Subordinated Notes (Residual Interest, current yield 15.82%)(11)(22) | 44,063 | 42,042 | 42,499 | 1.2% | ||||||
42,042 | 42,499 | 1.2% | ||||||||||
Apidos CLO XV | Cayman Islands / Structured Finance | Subordinated Notes (Residual Interest, current yield 14.21%)(11)(22) | 36,515 | 37,038 | 36,715 | 1.0% | ||||||
37,038 | 36,715 | 1.0% | ||||||||||
Arctic Glacier U.S.A., Inc. | Minnesota / Food Products | Second Lien Term Loan (10.50% (LIBOR + 9.25% with 1.25% LIBOR floor), due 11/10/2019)(3)(4) | 150,000 | 150,000 | 150,000 | 4.1% | ||||||
150,000 | 150,000 | 4.1% | ||||||||||
See notes to consolidated financial statements.
121
PROSPECT CAPITAL CORPORATION AND SUBSIDIARIES
CONSOLIDATED SCHEDULES OF INVESTMENTS (CONTINUED)
(in thousands, except share data)
June 30, 2014 | ||||||||||||
Portfolio Company | Locale / Industry | Investments(1) | Principal Value | Cost | Fair Value(2) | % of Net Assets | ||||||
LEVEL 3 PORTFOLIO INVESTMENTS | ||||||||||||
Non-Control/Non-Affiliate Investments (less than 5.00% voting control) | ||||||||||||
Ark-La-Tex Wireline Services, LLC | Louisiana / Oil & Gas Services | Senior Secured Term Loan A (6.50% (LIBOR + 5.50% with 1.00% LIBOR floor), due 4/8/2019)(4) | $ | 26,831 | $ | 26,831 | $ | 26,831 | 0.7% | |||
Senior Secured Term Loan B (10.50% (LIBOR + 9.50% with 1.00% LIBOR floor), due 4/8/2019)(4) | 26,831 | 26,831 | 26,831 | 0.7% | ||||||||
Delayed Draw Term Loan – $5,000 Commitment (expires 10/8/2015)(4)(25) | — | — | — | —% | ||||||||
53,662 | 53,662 | 1.4% | ||||||||||
Armor Holding II LLC | New York / Diversified Financial Services | Second Lien Term Loan (10.25% (LIBOR + 9.00% with 1.25% LIBOR floor), due 12/26/2020)(3)(4)(16) | 7,000 | 6,874 | 6,874 | 0.2% | ||||||
6,874 | 6,874 | 0.2% | ||||||||||
Atlantis Health Care Group (Puerto Rico), Inc. | Puerto Rico / Healthcare | Revolving Line of Credit – $3,000 Commitment (13.00% (LIBOR + 11.00% with 2.00% LIBOR floor), due 8/21/2014)(4)(25)(26) | 2,350 | 2,350 | 2,350 | 0.1% | ||||||
Senior Term Loan (10.00% (LIBOR + 8.00% with 2.00% LIBOR floor), due 2/21/2018)(3)(4) | 38,957 | 38,957 | 34,102 | 0.9% | ||||||||
41,307 | 36,452 | 1.0% | ||||||||||
Babson CLO Ltd. 2011-I | Cayman Islands / Structured Finance | Subordinated Notes (Residual Interest, current yield 12.44%)(11)(22) | 35,000 | 33,591 | 33,801 | 0.9% | ||||||
33,591 | 33,801 | 0.9% | ||||||||||
Babson CLO Ltd. 2012-I | Cayman Islands / Structured Finance | Subordinated Notes (Residual Interest, current yield 13.35%)(11)(22) | 29,075 | 23,471 | 26,401 | 0.7% | ||||||
23,471 | 26,401 | 0.7% | ||||||||||
Babson CLO Ltd. 2012-II | Cayman Islands / Structured Finance | Subordinated Notes (Residual Interest, current yield 11.33%)(11)(22) | 27,850 | 26,764 | 27,230 | 0.8% | ||||||
26,764 | 27,230 | 0.8% | ||||||||||
Blue Coat Systems, Inc. | Massachusetts / Software & Computer Services | Second Lien Term Loan (9.50% (LIBOR + 8.50% with 1.00% LIBOR floor), due 6/28/2020)(3)(4)(16) | 11,000 | 10,902 | 11,000 | 0.3% | ||||||
10,902 | 11,000 | 0.3% | ||||||||||
Broder Bros., Co. | Pennsylvania / Textiles, Apparel & Luxury Goods | Senior Secured Notes (10.25% (LIBOR + 9.00% with 1.25% LIBOR floor), due 4/8/2019)(3)(4)(46) | 257,575 | 257,575 | 257,575 | 7.1% | ||||||
257,575 | 257,575 | 7.1% | ||||||||||
Brookside Mill CLO Ltd. | Cayman Islands / Structured Finance | Subordinated Notes (Residual Interest, current yield 19.62%)(11)(22) | 26,000 | 22,613 | 25,081 | 0.7% | ||||||
22,613 | 25,081 | 0.7% | ||||||||||
Byrider Systems Acquisition Corp. | Indiana / Auto Finance | Senior Subordinated Notes (12.00% plus 2.00% PIK, due 11/3/2016)(3)(22) | 11,139 | 11,139 | 11,139 | 0.3% | ||||||
11,139 | 11,139 | 0.3% | ||||||||||
Caleel + Hayden, LLC | Colorado / Personal & Nondurable Consumer Products | Membership Interest(31) | — | 182 | —% | |||||||
Escrow Receivable | — | 118 | —% | |||||||||
— | 300 | —% | ||||||||||
Capstone Logistics, LLC | Georgia / Commercial Services | Senior Secured Term Loan A (6.50% (LIBOR + 5.00% with 1.50% LIBOR floor), due 9/16/2016)(4) | 92,085 | 92,085 | 92,085 | 2.6% | ||||||
Senior Secured Term Loan B (11.50% (LIBOR + 10.00% with 1.50% LIBOR floor), due 9/16/2016)(3)(4) | 98,465 | 98,465 | 98,465 | 2.7% | ||||||||
190,550 | 190,550 | 5.3% | ||||||||||
Cent CLO 17 Limited | Cayman Islands / Structured Finance | Subordinated Notes (Residual Interest, current yield 10.10%)(11)(22) | 24,870 | 21,999 | 23,896 | 0.7% | ||||||
21,999 | 23,896 | 0.7% | ||||||||||
See notes to consolidated financial statements.
122
PROSPECT CAPITAL CORPORATION AND SUBSIDIARIES
CONSOLIDATED SCHEDULES OF INVESTMENTS (CONTINUED)
(in thousands, except share data)
June 30, 2014 | ||||||||||||
Portfolio Company | Locale / Industry | Investments(1) | Principal Value | Cost | Fair Value(2) | % of Net Assets | ||||||
LEVEL 3 PORTFOLIO INVESTMENTS | ||||||||||||
Non-Control/Non-Affiliate Investments (less than 5.00% voting control) | ||||||||||||
Cent CLO 20 Limited | Cayman Islands / Structured Finance | Subordinated Notes (Residual Interest, current yield 10.83%)(11)(22) | $ | 40,275 | $ | 40,483 | $ | 40,259 | 1.1% | |||
40,483 | 40,259 | 1.1% | ||||||||||
Cent CLO 21 Limited | Cayman Islands / Structured Finance | Subordinated Notes (Residual Interest, current yield 15.47%)(11)(22)(48) | 48,528 | 46,597 | 46,154 | 1.3% | ||||||
46,597 | 46,154 | 1.3% | ||||||||||
CIFC Funding 2011-I, Ltd. | Cayman Islands / Structured Finance | Class D Senior Secured Notes (5.23% (LIBOR + 5.00%, due 1/19/2023)(4)(22) | 19,000 | 15,304 | 18,037 | 0.5% | ||||||
Class E Subordinated Notes (7.23% (LIBOR + 7.00%, due 1/19/2023)(4)(22) | 15,400 | 12,814 | 15,162 | 0.4% | ||||||||
28,118 | 33,199 | 0.9% | ||||||||||
CIFC Funding 2013-III, Ltd. | Cayman Islands / Structured Finance | Subordinated Notes (Residual Interest, current yield 14.01%)(11)(22) | 44,100 | 39,534 | 43,217 | 1.2% | ||||||
39,534 | 43,217 | 1.2% | ||||||||||
CIFC Funding 2013-IV, Ltd. | Cayman Islands / Structured Finance | Subordinated Notes (Residual Interest, current yield 12.52%)(11)(22) | 45,500 | 40,255 | 40,934 | 1.1% | ||||||
40,255 | 40,934 | 1.1% | ||||||||||
Cinedigm DC Holdings, LLC | New York / Software & Computer Services | Senior Secured Term Loan (11.00% (LIBOR + 9.00% with 2.00% LIBOR floor) plus 2.50% PIK, due 3/31/2021)(4) | 68,714 | 68,664 | 68,714 | 1.9% | ||||||
68,664 | 68,714 | 1.9% | ||||||||||
The Copernicus Group, Inc. | North Carolina / Healthcare | Escrow Receivable | — | 115 | —% | |||||||
— | 115 | —% | ||||||||||
Correctional Healthcare Holding Company, Inc. | Colorado / Healthcare | Second Lien Term Loan (11.25%, due 1/11/2020)(3) | 27,100 | 27,100 | 27,642 | 0.8% | ||||||
27,100 | 27,642 | 0.8% | ||||||||||
Coverall North America, Inc. | Florida / Commercial Services | Senior Secured Term Loan (11.50% (LIBOR + 8.50% with 3.00% LIBOR floor), due 12/17/2017)(3)(4) | 51,210 | 51,210 | 51,210 | 1.4% | ||||||
51,210 | 51,210 | 1.4% | ||||||||||
Crosman Corporation | New York / Manufacturing | Second Lien Term Loan (12.00% (LIBOR + 10.50% with 1.50% LIBOR floor), due 12/30/2019)(3)(4) | 40,000 | 40,000 | 39,708 | 1.1% | ||||||
40,000 | 39,708 | 1.1% | ||||||||||
CRT MIDCO, LLC | Wisconsin / Media | Senior Secured Term Loan (10.50% (LIBOR + 7.50% with 3.00% LIBOR floor), due 6/30/2017)(3)(4) | 47,504 | 47,504 | 47,504 | 1.3% | ||||||
47,504 | 47,504 | 1.3% | ||||||||||
Deltek, Inc. | Virginia / Software & Computer Services | Second Lien Term Loan (10.00% (LIBOR + 8.75% with 1.25% LIBOR floor), due 10/10/2019)(3)(4)(16) | 12,000 | 11,852 | 12,000 | 0.3% | ||||||
11,852 | 12,000 | 0.3% | ||||||||||
Diamondback Operating, LP | Oklahoma / Oil & Gas Production | Net Profits Interest (15% of Equity Distributions)(7) | — | — | —% | |||||||
— | — | —% | ||||||||||
Edmentum, Inc.(47) | Minnesota / Consumer Services | Second Lien Term Loan (11.25% (LIBOR + 9.75% with 1.50% LIBOR floor), due 5/17/2019)(3)(4)(16) | 50,000 | 48,439 | 50,000 | 1.4% | ||||||
48,439 | 50,000 | 1.4% | ||||||||||
Empire Today, LLC | Illinois / Durable Consumer Products | Senior Secured Note (11.375%, due 2/1/2017)(16) | 15,700 | 15,419 | 15,700 | 0.4% | ||||||
15,419 | 15,700 | 0.4% | ||||||||||
Fischbein, LLC | North Carolina / Machinery | Escrow Receivable | — | 116 | —% | |||||||
— | 116 | —% | ||||||||||
See notes to consolidated financial statements.
123
PROSPECT CAPITAL CORPORATION AND SUBSIDIARIES
CONSOLIDATED SCHEDULES OF INVESTMENTS (CONTINUED)
(in thousands, except share data)
June 30, 2014 | ||||||||||||
Portfolio Company | Locale / Industry | Investments(1) | Principal Value | Cost | Fair Value(2) | % of Net Assets | ||||||
LEVEL 3 PORTFOLIO INVESTMENTS | ||||||||||||
Non-Control/Non-Affiliate Investments (less than 5.00% voting control) | ||||||||||||
Fleetwash, Inc. | New Jersey / Business Services | Senior Secured Term Loan A (6.50% (LIBOR + 5.50% with 1.00% LIBOR floor), due 4/30/2019)(4) | $ | 25,000 | $ | 25,000 | $ | 25,000 | 0.7% | |||
Senior Secured Term Loan B (10.50% (LIBOR + 9.50% with 1.00% LIBOR floor), due 4/30/2019)(4) | 25,000 | 25,000 | 25,000 | 0.7% | ||||||||
Delayed Draw Term Loan – $15,000 Commitment (expires 4/30/2019)(25) | — | — | — | —% | ||||||||
50,000 | 50,000 | 1.4% | ||||||||||
Focus Brands, Inc. | Georgia / Consumer Services | Second Lien Term Loan (10.25% (LIBOR + 9.00% with 1.25% LIBOR floor), due 8/21/2018)(4)(16) | 18,000 | 17,776 | 18,000 | 0.5% | ||||||
17,776 | 18,000 | 0.5% | ||||||||||
Focus Products Group International, LLC | Illinois / Durable Consumer Products | Senior Secured Term Loan (12.00% (LIBOR + 11.00% with 1.00% LIBOR floor), due 1/20/2017)(3)(4) | 20,297 | 20,297 | 19,886 | 0.5% | ||||||
Common Stock (5,638 shares) | 27 | — | —% | |||||||||
20,324 | 19,886 | 0.5% | ||||||||||
Galaxy XII CLO, Ltd. | Cayman Islands / Structured Finance | Subordinated Notes (Residual Interest, current yield 13.31%)(11)(22) | 22,000 | 19,498 | 20,449 | 0.6% | ||||||
19,498 | 20,449 | 0.6% | ||||||||||
Galaxy XV CLO, Ltd. | Cayman Islands / Structured Finance | Subordinated Notes (Residual Interest, current yield 14.27%)(11)(22) | 35,025 | 29,777 | 31,824 | 0.9% | ||||||
29,777 | 31,824 | 0.9% | ||||||||||
Galaxy XVI CLO, Ltd. | Cayman Islands / Structured Finance | Subordinated Notes (Residual Interest, current yield 12.19%)(11)(22) | 22,575 | 20,790 | 20,573 | 0.6% | ||||||
20,790 | 20,573 | 0.6% | ||||||||||
Galaxy XVII CLO, Ltd. | Cayman Islands / Structured Finance | Subordinated Notes (Residual Interest, current yield 14.79%)(11)(22)(48) | 39,905 | 36,811 | 36,589 | 1.0% | ||||||
36,811 | 36,589 | 1.0% | ||||||||||
Global Employment Solutions, Inc. | Colorado / Business Services | Senior Secured Term Loan (10.00% (LIBOR + 9.00% with 1.00% LIBOR floor), due 3/25/2019)(3)(4) | 28,464 | 28,464 | 28,464 | 0.8% | ||||||
28,464 | 28,464 | 0.8% | ||||||||||
Grocery Outlet, Inc. | California / Retail | Second Lien Term Loan (10.50% (LIBOR + 9.25% with 1.25% LIBOR floor), due 6/17/2019)(4)(16) | 14,457 | 14,168 | 14,457 | 0.4% | ||||||
14,168 | 14,457 | 0.4% | ||||||||||
GTP Operations, LLC(10) | Texas / Software & Computer Services | Senior Secured Term Loan (10.00% (LIBOR + 5.00% with 5.00% LIBOR floor), due 12/11/2018)(3)(4) | 112,546 | 112,546 | 112,546 | 3.1% | ||||||
112,546 | 112,546 | 3.1% | ||||||||||
Halcyon Loan Advisors Funding 2012-1 Ltd. | Cayman Islands / Structured Finance | Subordinated Notes (Residual Interest, current yield 21.35%)(11)(22) | 23,188 | 20,600 | 22,570 | 0.6% | ||||||
20,600 | 22,570 | 0.6% | ||||||||||
Halcyon Loan Advisors Funding 2013-1 Ltd. | Cayman Islands / Structured Finance | Subordinated Notes (Residual Interest, current yield 18.49%)(11)(22) | 40,400 | 38,460 | 41,509 | 1.1% | ||||||
38,460 | 41,509 | 1.1% | ||||||||||
Halcyon Loan Advisors Funding 2014-1 Ltd. | Cayman Islands / Structured Finance | Subordinated Notes (Residual Interest, current yield 15.28%)(11)(22) | 24,500 | 23,471 | 23,110 | 0.6% | ||||||
23,471 | 23,110 | 0.6% | ||||||||||
Halcyon Loan Advisors Funding 2014-2 Ltd. | Cayman Islands / Structured Finance | Subordinated Notes (Residual Interest, current yield 16.06%)(11)(22)(48) | 41,164 | 38,630 | 38,066 | 1.1% | ||||||
38,630 | 38,066 | 1.1% | ||||||||||
Harley Marine Services, Inc. | Washington / Transportation | Second Lien Term Loan (10.50% (LIBOR + 9.25% with 1.25% LIBOR floor), due 12/20/2019)(3)(4)(16) | 9,000 | 8,832 | 8,832 | 0.2% | ||||||
8,832 | 8,832 | 0.2% | ||||||||||
See notes to consolidated financial statements.
124
PROSPECT CAPITAL CORPORATION AND SUBSIDIARIES
CONSOLIDATED SCHEDULES OF INVESTMENTS (CONTINUED)
(in thousands, except share data)
June 30, 2014 | ||||||||||||
Portfolio Company | Locale / Industry | Investments(1) | Principal Value | Cost | Fair Value(2) | % of Net Assets | ||||||
LEVEL 3 PORTFOLIO INVESTMENTS | ||||||||||||
Non-Control/Non-Affiliate Investments (less than 5.00% voting control) | ||||||||||||
ICON Health & Fitness, Inc. | Utah / Durable Consumer Products | Senior Secured Note (11.875%, due 10/15/2016)(16) | $ | 21,850 | $ | 22,005 | $ | 20,889 | 0.6% | |||
22,005 | 20,889 | 0.6% | ||||||||||
ICV-CSI Holdings, LLC | New York / Transportation | Common Equity (1.6 units) | 1,639 | 2,079 | 0.1% | |||||||
1,639 | 2,079 | 0.1% | ||||||||||
IDQ Holdings, Inc. | Texas / Automobile | Senior Secured Note (11.50%, due 4/1/2017)(16) | 12,500 | 12,344 | 12,500 | 0.3% | ||||||
12,344 | 12,500 | 0.3% | ||||||||||
Ikaria, Inc. | New Jersey / Healthcare | Second Lien Term Loan (8.75% (LIBOR + 7.75% with 1.00% LIBOR floor), due 2/12/2022)(4)(16) | 25,000 | 24,430 | 25,000 | 0.7% | ||||||
24,430 | 25,000 | 0.7% | ||||||||||
Injured Workers Pharmacy, LLC | Massachusetts / Healthcare | Second Lien Term Loan (11.50% (LIBOR + 7.00% with 4.50% LIBOR floor) plus 1.00% PIK, due 5/31/2019)(3)(4) | 22,678 | 22,678 | 22,904 | 0.6% | ||||||
22,678 | 22,904 | 0.6% | ||||||||||
Instant Web, LLC | Minnesota / Media | Senior Secured Term Loan A (5.50% (LIBOR + 4.50% with 1.00% LIBOR floor), due 3/28/2019)(4) | 126,453 | 126,453 | 126,453 | 3.5% | ||||||
Senior Secured Term Loan B (12.00% (LIBOR + 11.00% with 1.00% LIBOR floor), due 3/28/2019)(3)(4) | 128,000 | 128,000 | 128,000 | 3.6% | ||||||||
Senior Secured Term Loan C (12.75% (LIBOR + 11.75% with 1.00% LIBOR floor), due 3/28/2019)(4) | 12,500 | 12,500 | 12,500 | 0.3% | ||||||||
266,953 | 266,953 | 7.4% | ||||||||||
InterDent, Inc. | California / Healthcare | Senior Secured Term Loan A (7.25% (LIBOR + 5.75% with 1.50% LIBOR floor), due 8/3/2017)(4) | 63,225 | 63,225 | 63,225 | 1.7% | ||||||
Senior Secured Term Loan B (12.25% (LIBOR + 9.25% with 3.00% LIBOR floor), due 8/3/2017)(3)(4) | 67,625 | 67,625 | 67,625 | 1.9% | ||||||||
130,850 | 130,850 | 3.6% | ||||||||||
JHH Holdings, Inc. | Texas / Healthcare | Second Lien Term Loan (11.25% (LIBOR + 10.00% with 1.25% LIBOR floor) plus 0.50% PIK, due 3/30/2019)(3)(4) | 35,119 | 35,119 | 35,119 | 1.0% | ||||||
35,119 | 35,119 | 1.0% | ||||||||||
LaserShip, Inc. | Virginia / Transportation | Revolving Line of Credit – $5,000 Commitment (10.25% (LIBOR + 8.25% with 2.00% LIBOR floor), due 12/21/2014)(4)(25) | — | — | — | —% | ||||||
Senior Secured Term Loan A (10.25% (LIBOR + 8.25% with 2.00% LIBOR floor), due 3/18/2019)(3)(4) | 36,094 | 36,094 | 36,094 | 1.0% | ||||||||
Senior Secured Term Loan B (10.25% (LIBOR + 8.25% with 2.00% LIBOR floor), due 3/18/2019)(3)(4) | 22,111 | 22,111 | 22,111 | 0.6% | ||||||||
Delayed Draw Term Loan – $6,000 Commitment (expires 12/31/2016)(25) | — | — | — | —% | ||||||||
58,205 | 58,205 | 1.6% | ||||||||||
LCM XIV Ltd. | Cayman Islands / Structured Finance | Income Notes (Residual Interest, current yield 16.02%)(11)(22) | 26,500 | 24,914 | 25,124 | 0.7% | ||||||
24,914 | 25,124 | 0.7% | ||||||||||
LHC Holdings Corp. | Florida / Healthcare | Revolving Line of Credit – $750 Commitment (8.50% (LIBOR + 6.00% with 2.50% LIBOR floor), due 5/31/2015)(4)(25)(26) | — | — | — | —% | ||||||
Senior Subordinated Debt (10.50%, due 5/31/2015)(3) | 1,865 | 1,865 | 1,865 | 0.1% | ||||||||
Membership Interest (125 units) | 216 | 253 | —% | |||||||||
2,081 | 2,118 | 0.1% | ||||||||||
Madison Park Funding IX, Ltd. | Cayman Islands / Structured Finance | Subordinated Notes (Residual Interest, current yield 12.97%)(11)(22) | 31,110 | 24,546 | 27,266 | 0.8% | ||||||
24,546 | 27,266 | 0.8% | ||||||||||
See notes to consolidated financial statements.
125
PROSPECT CAPITAL CORPORATION AND SUBSIDIARIES
CONSOLIDATED SCHEDULES OF INVESTMENTS (CONTINUED)
(in thousands, except share data)
June 30, 2014 | ||||||||||||
Portfolio Company | Locale / Industry | Investments(1) | Principal Value | Cost | Fair Value(2) | % of Net Assets | ||||||
LEVEL 3 PORTFOLIO INVESTMENTS | ||||||||||||
Non-Control/Non-Affiliate Investments (less than 5.00% voting control) | ||||||||||||
Matrixx Initiatives, Inc. | New Jersey / Pharmaceuticals | Senior Secured Term Loan A (7.50% (LIBOR + 6.00% with 1.50% LIBOR floor), due 8/9/2018)(3)(4) | $ | 38,319 | $ | 38,319 | $ | 36,839 | 1.0% | |||
Senior Secured Term Loan B (12.50% (LIBOR + 11.00% with 1.50% LIBOR floor), due 8/9/2018)(3)(4) | 39,750 | 39,750 | 36,851 | 1.0% | ||||||||
78,069 | 73,690 | 2.0% | ||||||||||
Maverick Healthcare Equity, LLC | Arizona / Healthcare | Preferred Units (1,250,000 units) | 1,252 | 821 | —% | |||||||
Class A Common Units (1,250,000 units) | — | — | —% | |||||||||
1,252 | 821 | —% | ||||||||||
Mountain View CLO 2013-I Ltd. | Cayman Islands / Structured Finance | Subordinated Notes (Residual Interest, current yield 15.64%)(11)(22) | 43,650 | 40,754 | 43,555 | 1.2% | ||||||
40,754 | 43,555 | 1.2% | ||||||||||
NCP Finance Limited Partnership(23) | Ohio / Consumer Finance | Subordinated Secured Term Loan (11.00% (LIBOR + 9.75% with 1.25% LIBOR floor), due 9/30/2018)(3)(4)(16)(22) | 11,910 | 11,692 | 12,208 | 0.3% | ||||||
11,692 | 12,208 | 0.3% | ||||||||||
New Century Transportation, Inc. | New Jersey / Transportation | Senior Subordinated Term Loan (12.00% (LIBOR + 10.00% with 2.00% LIBOR floor) plus 4.00% PIK, in non-accrual status effective 4/1/2014, due 2/3/2018)(4) | 44,000 | 44,000 | — | —% | ||||||
44,000 | — | —% | ||||||||||
Nixon, Inc. | California / Durable Consumer Products | Senior Secured Term Loan (8.75% plus 2.75% PIK, due 4/16/2018)(16) | 13,532 | 13,316 | 13,316 | 0.4% | ||||||
13,316 | 13,316 | 0.4% | ||||||||||
NRG Manufacturing, Inc. | Texas / Manufacturing | Escrow Receivable | — | 1,110 | —% | |||||||
— | 1,110 | —% | ||||||||||
Octagon Investment Partners XV, Ltd. | Cayman Islands / Structured Finance | Income Notes (Residual Interest, current yield 20.60%)(11)(22) | 26,901 | 24,338 | 26,732 | 0.7% | ||||||
24,338 | 26,732 | 0.7% | ||||||||||
Onyx Payments(44) | Texas / Diversified Financial Services | Senior Secured Term Loan A (6.75% (LIBOR + 5.50% with 1.25% LIBOR floor), due 4/18/2018)(4) | 15,125 | 15,125 | 15,125 | 0.4% | ||||||
Senior Secured Term Loan B (13.75% (LIBOR + 12.50% with 1.25% LIBOR floor), due 4/18/2018)(4) | 15,938 | 15,938 | 15,938 | 0.4% | ||||||||
31,063 | 31,063 | 0.8% | ||||||||||
Pelican Products, Inc. | California / Durable Consumer Products | Second Lien Term Loan (9.25% (LIBOR + 8.25% with 1.00% LIBOR floor), due 4/9/2021)(4)(16) | 17,500 | 17,482 | 17,500 | 0.5% | ||||||
17,482 | 17,500 | 0.5% | ||||||||||
PGX Holdings, Inc.(28) | Utah / Consumer Services | Senior Secured Term Loan (10.50% (LIBOR + 8.50% with 2.00% LIBOR floor), due 9/14/2017)(3)(4) | 436,647 | 436,647 | 436,647 | 12.1% | ||||||
436,647 | 436,647 | 12.1% | ||||||||||
Photonis Technologies SAS | France / Aerospace & Defense | First Lien Term Loan (8.50% (LIBOR + 7.50% with 1.00% LIBOR floor), due 9/18/2019)(4)(16)(22) | 10,448 | 10,170 | 10,339 | 0.3% | ||||||
10,170 | 10,339 | 0.3% | ||||||||||
Pinnacle (US) Acquisition Co. Limited | Texas / Software & Computer Services | Second Lien Term Loan (10.50% (LIBOR + 9.25% with 1.25% LIBOR floor), due 8/3/2020)(4)(16) | 10,000 | 9,833 | 10,000 | 0.3% | ||||||
9,833 | 10,000 | 0.3% | ||||||||||
See notes to consolidated financial statements.
126
PROSPECT CAPITAL CORPORATION AND SUBSIDIARIES
CONSOLIDATED SCHEDULES OF INVESTMENTS (CONTINUED)
(in thousands, except share data)
June 30, 2014 | ||||||||||||
Portfolio Company | Locale / Industry | Investments(1) | Principal Value | Cost | Fair Value(2) | % of Net Assets | ||||||
LEVEL 3 PORTFOLIO INVESTMENTS | ||||||||||||
Non-Control/Non-Affiliate Investments (less than 5.00% voting control) | ||||||||||||
PrimeSport, Inc. | Georgia / Hotels, Restaurants & Leisure | Revolving Line of Credit – $15,000 Commitment (10.00% (LIBOR + 9.50% with 0.50% LIBOR floor), due 6/30/2015)(4)(25)(26) | $ | — | $ | — | $ | — | —% | |||
Senior Secured Term Loan A (7.50% (LIBOR + 6.50% with 1.00% LIBOR floor), due 12/23/2019)(3)(4) | 43,263 | 43,263 | 43,263 | 1.2% | ||||||||
Senior Secured Term Loan B (11.50% (LIBOR + 10.50% with 1.00% LIBOR floor) plus 1.00% PIK, due 12/23/2019)(3)(4) | 43,700 | 43,700 | 43,700 | 1.2% | ||||||||
86,963 | 86,963 | 2.4% | ||||||||||
Prince Mineral Holding Corp. | New York / Metal Services & Minerals | Senior Secured Term Loan (11.50%, due 12/15/2019)(16) | 10,000 | 9,902 | 10,000 | 0.3% | ||||||
9,902 | 10,000 | 0.3% | ||||||||||
Rocket Software, Inc. | Massachusetts / Software & Computer Services | Second Lien Term Loan (10.25% (LIBOR + 8.75% with 1.50% LIBOR floor), due 2/8/2019)(3)(4)(16) | 20,000 | 19,758 | 20,000 | 0.6% | ||||||
19,758 | 20,000 | 0.6% | ||||||||||
Royal Adhesives and Sealants, LLC | Indiana / Chemicals | Second Lien Term Loan (9.75% (LIBOR + 8.50% with 1.25% LIBOR floor), due 1/31/2019)(4)(16) | 20,000 | 19,648 | 19,713 | 0.5% | ||||||
19,648 | 19,713 | 0.5% | ||||||||||
Ryan, LLC | Texas / Business Services | Subordinated Unsecured Notes (12.00% (LIBOR + 9.00% with 3.00% LIBOR floor) plus 3.00% PIK, due 6/30/2018)(4) | 70,531 | 70,531 | 70,531 | 1.9% | ||||||
70,531 | 70,531 | 1.9% | ||||||||||
Sandow Media, LLC | Florida / Media | Senior Secured Term Loan (12.00%, due 5/8/2018)(3) | 25,081 | 25,081 | 23,524 | 0.7% | ||||||
25,081 | 23,524 | 0.7% | ||||||||||
Small Business Whole Loan Portfolio(19) | New York / Online Lending | 144 small business loans purchased from On Deck Capital, Inc. | 4,637 | 4,637 | 4,252 | 0.1% | ||||||
4,637 | 4,252 | 0.1% | ||||||||||
Snacks Parent Corporation | Minnesota / Food Products | Series A Preferred Stock (4,021.45 shares) | — | — | —% | |||||||
Series B Preferred Stock (1,866.10 shares) | — | — | —% | |||||||||
Warrant (to purchase 31,196.52 shares of Common Stock, expires 11/12/2020) | 591 | 1,819 | 0.1% | |||||||||
591 | 1,819 | 0.1% | ||||||||||
Spartan Energy Services, Inc. | Louisiana / Oil & Gas Services | Senior Secured Term Loan (10.50% (LIBOR + 9.00% with 1.50% LIBOR floor), due 12/28/2017)(3)(4) | 35,633 | 35,633 | 35,633 | 1.0% | ||||||
35,633 | 35,633 | 1.0% | ||||||||||
Speedy Group Holdings Corp. | Canada / Consumer Finance | Senior Unsecured Notes (12.00%, due 11/15/2017)(16)(22) | 15,000 | 15,000 | 15,000 | 0.4% | ||||||
15,000 | 15,000 | 0.4% | ||||||||||
Sport Helmets Holdings, LLC | New York / Personal & Nondurable Consumer Products | Escrow Receivable | — | 130 | —% | |||||||
— | 130 | —% | ||||||||||
Stauber Performance Ingredients, Inc. | California / Food Products | Senior Secured Term Loan (10.50% (LIBOR + 7.50% with 3.00% LIBOR floor), due 1/21/2016)(3)(4) | 12,809 | 12,809 | 12,809 | 0.4% | ||||||
Senior Secured Term Loan (10.50% (LIBOR + 7.50% with 3.00% LIBOR floor), due 5/21/2017)(3)(4) | 9,975 | 9,975 | 9,975 | 0.3% | ||||||||
22,784 | 22,784 | 0.7% | ||||||||||
See notes to consolidated financial statements.
127
PROSPECT CAPITAL CORPORATION AND SUBSIDIARIES
CONSOLIDATED SCHEDULES OF INVESTMENTS (CONTINUED)
(in thousands, except share data)
June 30, 2014 | ||||||||||||
Portfolio Company | Locale / Industry | Investments(1) | Principal Value | Cost | Fair Value(2) | % of Net Assets | ||||||
LEVEL 3 PORTFOLIO INVESTMENTS | ||||||||||||
Non-Control/Non-Affiliate Investments (less than 5.00% voting control) | ||||||||||||
Stryker Energy, LLC | Ohio / Oil & Gas Production | Subordinated Secured Revolving Credit Facility – $50,300 Commitment (12.25% (LIBOR + 10.75% with 1.50% LIBOR floor) plus 3.75% PIK, in non-accrual status effective 12/1/2011, due 12/1/2015)(4)(25) | $ | 36,080 | $ | 32,710 | $ | — | —% | |||
Overriding Royalty Interests(18) | — | — | —% | |||||||||
32,710 | — | —% | ||||||||||
Sudbury Mill CLO Ltd. | Cayman Islands / Structured Finance | Subordinated Notes (Residual Interest, current yield 16.25%)(11)(22) | 28,200 | 26,914 | 26,140 | 0.7% | ||||||
26,914 | 26,140 | 0.7% | ||||||||||
Symphony CLO IX Ltd. | Cayman Islands / Structured Finance | Preference Shares (Residual Interest, current yield 19.76%)(11)(22) | 45,500 | 37,734 | 44,294 | 1.2% | ||||||
37,734 | 44,294 | 1.2% | ||||||||||
Symphony CLO XIV Ltd. | Cayman Islands / Structured Finance | Subordinated Notes (Residual Interest, current yield 14.03%)(11)(22)(48) | 49,250 | 49,858 | 49,025 | 1.4% | ||||||
49,858 | 49,025 | 1.4% | ||||||||||
System One Holdings, LLC | Pennsylvania / Business Services | Senior Secured Term Loan (11.00% (LIBOR + 9.50% with 1.50% LIBOR floor), due 12/31/2018)(3)(4) | 44,646 | 44,646 | 44,646 | 1.2% | ||||||
44,646 | 44,646 | 1.2% | ||||||||||
Targus Group International, Inc. | California / Durable Consumer Products | First Lien Term Loan (11.00% (LIBOR + 9.50% with 1.50% LIBOR floor) plus 1.0% PIK, due 5/24/2016)(3)(4)(16) | 21,911 | 21,697 | 19,949 | 0.6% | ||||||
21,697 | 19,949 | 0.6% | ||||||||||
TB Corp. | Texas / Hotels, Restaurants & Leisure | Senior Subordinated Note (12.00% plus 1.50% PIK, due 12/19/2018)(3) | 23,628 | 23,628 | 23,628 | 0.7% | ||||||
23,628 | 23,628 | 0.7% | ||||||||||
Tectum Holdings, Inc. | Michigan / Automobile | Second Lien Term Loan (9.00% (LIBOR + 8.00% with 1.00% LIBOR floor), due 3/12/2019)(4)(16) | 10,000 | 9,952 | 9,952 | 0.3% | ||||||
9,952 | 9,952 | 0.3% | ||||||||||
Therakos, Inc. | New Jersey / Healthcare | Second Lien Term Loan (11.25% (LIBOR + 10.00% with 1.25% LIBOR floor), due 6/27/2018)(4)(16) | 13,000 | 12,762 | 13,000 | 0.4% | ||||||
12,762 | 13,000 | 0.4% | ||||||||||
Tolt Solutions, Inc. | South Carolina / Business Services | Senior Secured Term Loan A (7.00% (LIBOR + 6.00% with 1.00% LIBOR floor), due 3/7/2019)(3)(4) | 48,705 | 48,705 | 48,705 | 1.3% | ||||||
Senior Secured Term Loan B (12.00% (LIBOR + 11.00% with 1.00% LIBOR floor), due 3/7/2019)(3)(4) | 48,900 | 48,900 | 48,900 | 1.4% | ||||||||
97,605 | 97,605 | 2.7% | ||||||||||
Traeger Pellet Grills LLC | Oregon / Durable Consumer Products | Senior Secured Term Loan A (6.50% (LIBOR + 4.50% with 2.00% LIBOR floor), due 6/18/2018)(3)(4) | 29,100 | 29,100 | 29,100 | 0.8% | ||||||
Senior Secured Term Loan B (11.50% (LIBOR + 9.50% with 2.00% LIBOR floor), due 6/18/2018)(3)(4) | 29,700 | 29,700 | 29,700 | 0.8% | ||||||||
58,800 | 58,800 | 1.6% | ||||||||||
Transaction Network Services, Inc. | Virginia / Telecommunication Services | Second Lien Term Loan (9.00% (LIBOR + 8.00% with 1.00% LIBOR floor), due 8/14/2020)(4)(16) | 5,000 | 4,976 | 5,000 | 0.1% | ||||||
4,976 | 5,000 | 0.1% | ||||||||||
TriMark USA, LLC | Massachusetts / Hotels, Restaurants & Leisure | Second Lien Term Loan (10.00% (LIBOR + 9.00% with 1.00% LIBOR floor), due 8/11/2019)(4)(16) | 10,000 | 9,810 | 9,810 | 0.3% | ||||||
9,810 | 9,810 | 0.3% | ||||||||||
United Sporting Companies, Inc.(5) | South Carolina / Durable Consumer Products | Second Lien Term Loan (12.75% (LIBOR + 11.00% with 1.75% LIBOR floor), due 5/16/2018)(3)(4) | 160,000 | 160,000 | 160,000 | 4.4% | ||||||
160,000 | 160,000 | 4.4% | ||||||||||
See notes to consolidated financial statements.
128
PROSPECT CAPITAL CORPORATION AND SUBSIDIARIES
CONSOLIDATED SCHEDULES OF INVESTMENTS (CONTINUED)
(in thousands, except share data)
June 30, 2014 | ||||||||||||
Portfolio Company | Locale / Industry | Investments(1) | Principal Value | Cost | Fair Value(2) | % of Net Assets | ||||||
LEVEL 3 PORTFOLIO INVESTMENTS | ||||||||||||
Non-Control/Non-Affiliate Investments (less than 5.00% voting control) | ||||||||||||
United States Environmental Services, LLC | Texas / Commercial Services | Senior Secured Term Loan A (6.50% (LIBOR + 5.50% with 1.00% LIBOR floor), due 3/31/2019)(3)(4) | $ | 23,850 | $ | 23,850 | $ | 23,850 | 0.7% | |||
Senior Secured Term Loan B (11.50% (LIBOR + 10.50% with 1.00% LIBOR floor), due 3/31/2019)(3)(4) | 36,000 | 36,000 | 36,000 | 1.0% | ||||||||
59,850 | 59,850 | 1.7% | ||||||||||
Venio LLC | Pennsylvania / Business Services | Second Lien Term Loan (12.00% (LIBOR + 9.50% with 2.50% LIBOR floor), due 2/19/2020)(3)(4) | 17,000 | 17,000 | 16,726 | 0.5% | ||||||
17,000 | 16,726 | 0.5% | ||||||||||
Voya CLO 2012-2, Ltd. | Cayman Islands / Structured Finance | Income Notes (Residual Interest, current yield 14.69%)(11)(22) | 38,070 | 31,058 | 35,843 | 1.0% | ||||||
31,058 | 35,843 | 1.0% | ||||||||||
Voya CLO 2012-3, Ltd. | Cayman Islands / Structured Finance | Income Notes (Residual Interest, current yield 12.97%)(11)(22) | 46,632 | 39,368 | 43,960 | 1.2% | ||||||
39,368 | 43,960 | 1.2% | ||||||||||
Voya CLO 2012-4, Ltd. | Cayman Islands / Structured Finance | Income Notes (Residual Interest, current yield 15.28%)(11)(22) | 40,613 | 34,941 | 39,647 | 1.1% | ||||||
34,941 | 39,647 | 1.1% | ||||||||||
Voya CLO 2014-1, Ltd. | Cayman Islands / Structured Finance | Subordinated Notes (Residual Interest, current yield 14.49%)(11)(22)(48) | 32,383 | 33,825 | 32,949 | 0.9% | ||||||
33,825 | 32,949 | 0.9% | ||||||||||
Washington Mill CLO Ltd. | Cayman Islands / Structured Finance | Subordinated Notes (Residual Interest, current yield 17.43%)(11)(22)(48) | 22,600 | 21,601 | 21,583 | 0.6% | ||||||
21,601 | 21,583 | 0.6% | ||||||||||
Water Pik, Inc. | Colorado / Personal & Nondurable Consumer Products | Second Lien Term Loan (9.75% (LIBOR + 8.75% with 1.00% LIBOR floor), due 1/8/2021)(4)(16) | 11,000 | 10,604 | 10,604 | 0.3% | ||||||
10,604 | 10,604 | 0.3% | ||||||||||
Wheel Pros, LLC | Colorado / Business Services | Senior Subordinated Secured Note (11.00% (LIBOR + 7.00% with 4.00% LIBOR floor), due 6/29/2020)(4) | 12,000 | 12,000 | 12,000 | 0.3% | ||||||
Delayed Draw Term Loan – $3,000 Commitment (expires 12/30/2015)(25) | — | — | — | —% | ||||||||
12,000 | 12,000 | 0.3% | ||||||||||
Wind River Resources Corporation(39) | Utah / Oil & Gas Production | Senior Secured Note (13.00% (LIBOR + 7.50% with 5.50% LIBOR floor) plus 3.00% default interest on principal and 16.00% default interest on past due interest, in non-accrual status effective 12/1/2008, past due)(4) | 15,000 | 14,650 | — | —% | ||||||
Net Profits Interest (5% of Equity Distributions)(7) | — | — | —% | |||||||||
14,650 | — | —% | ||||||||||
Total Non-Control/Non-Affiliate Investments (Level 3) | $ | 4,620,388 | $ | 4,580,996 | 126.6% | |||||||
Total Level 3 Portfolio Investments | $ | 6,371,459 | $ | 6,253,571 | 172.8% | |||||||
See notes to consolidated financial statements.
129
PROSPECT CAPITAL CORPORATION AND SUBSIDIARIES
CONSOLIDATED SCHEDULES OF INVESTMENTS (CONTINUED)
(in thousands, except share data)
June 30, 2014 | ||||||
Portfolio Company | Locale / Industry | Investments(1) | Principal Value | Cost | Fair Value(2) | % of Net Assets |
LEVEL 1 PORTFOLIO INVESTMENTS | ||||||||||
Non-Control/Non-Affiliate Investments (less than 5.00% voting control) | ||||||||||
Dover Saddlery, Inc. | Massachusetts / Retail | Common Stock (30,974 shares) | $ | 63 | $ | 168 | —% | |||
63 | 168 | —% | ||||||||
Total Non-Control/Non-Affiliate Investments (Level 1) | $ | 63 | $ | 168 | —% | |||||
Total Non-Control/Non-Affiliate Investments | $ | 4,620,451 | $ | 4,581,164 | 126.6% | |||||
Total Portfolio Investments | $ | 6,371,522 | $ | 6,253,739 | 172.8% | |||||
See notes to consolidated financial statements.
130
PROSPECT CAPITAL CORPORATION AND SUBSIDIARIES
CONSOLIDATED SCHEDULES OF INVESTMENTS (CONTINUED)
(in thousands, except share data)
Endnote Explanations as of June 30, 2015 and June 30, 2014
(1) | The terms “Prospect,” “we,” “us” and “our” mean Prospect Capital Corporation and its subsidiaries unless the context specifically requires otherwise. The securities in which Prospect has invested were acquired in transactions that were exempt from registration under the Securities Act of 1933, as amended (the “Securities Act”). These securities may be resold only in transactions that are exempt from registration under the Securities Act. |
(2) | Fair value is determined by or under the direction of our Board of Directors. As of June 30, 2015 and June 30, 2014, one of our portfolio investments, Dover Saddlery, Inc., was publicly traded and classified as Level 1 within the valuation hierarchy established by ASC 820, Fair Value Measurement (“ASC 820”). As of June 30, 2015 and June 30, 2014, the fair value of our remaining portfolio investments was determined using significant unobservable inputs. ASC 820 classifies such inputs used to measure fair value as Level 3 within the valuation hierarchy. See Notes 2 and 3 within the accompanying notes to consolidated financial statements for further discussion. |
(3) | Security, or a portion thereof, is held by Prospect Capital Funding LLC (“PCF”), our wholly-owned subsidiary and a bankruptcy remote special purpose entity, and is pledged as collateral for the Revolving Credit Facility and such security is not available as collateral to our general creditors (see Note 4). The fair values of these investments held by PCF at June 30, 2015 and June 30, 2014 were $1,511,585 and $1,500,897, respectively; they represent 22.9% and 24.0% of our total investments, respectively. |
(4) | Security, or a portion thereof, has a floating interest rate which may be subject to a LIBOR or PRIME floor. Stated interest rate was in effect at June 30, 2015 and June 30, 2014. |
(5) | Ellett Brothers, LLC, Evans Sports, Inc., Jerry’s Sports, Inc., Simmons Gun Specialties, Inc., Bonitz Brothers, Inc., and Outdoor Sports Headquarters, Inc. are joint borrowers on the second lien term loan. United Sporting Companies, Inc. is a parent guarantor of this debt investment. |
(6) | On January 19, 2010, we modified the terms of our senior secured debt in Appalachian Energy Holdings, LLC (“AEH”) and Coalbed, LLC (“Coalbed”) in conjunction with the formation of Manx Energy, Inc. (“Manx”), a new entity consisting of the assets of AEH, Coalbed and Kinley Exploration. The assets of the three companies were brought under new common management. We funded $2,800 at closing to Manx to provide for working capital. As part of the Manx roll-up, our loans to AEH and Coalbed were assigned to Manx and a portion of the debt was exchanged for Manx preferred equity, while our AEH equity interest was converted into Manx common stock. There was no change to fair value at the time of restructuring. On June 30, 2012, Manx returned the investments in Coalbed and AEH to us and we contributed these investments to Wolf Energy Holdings Inc. (“Wolf Energy Holdings”), a newly-formed, separately owned holding company. During the three months ended June 30, 2013, we determined that the impairment of Manx was other-than-temporary and recorded a realized loss of $9,397 for the amount that the amortized cost exceeded the fair value, reducing the amortized cost to $500. As of June 30, 2014, Prospect owned 41% of the equity of Manx. During the three months ended December 31, 2014, Manx was dissolved and we recorded a realized loss of $50, reducing the amortized cost to zero. |
(7) | In addition to the stated returns, the net profits interest held will be realized upon sale of the borrower or a sale of the interests. |
(8) | During the quarter ended December 31, 2011, our ownership of Change Clean Energy Holdings, LLC, Change Clean Energy, LLC, Freedom Marine Services Holdings, LLC (“Freedom Marine”), and Yatesville Coal Holdings, LLC was transferred to Energy Solutions Holdings Inc. (f/k/a Gas Solutions Holdings, Inc.) (“Energy Solutions”) to consolidate all of our energy holdings under one management team. We own 100% of Energy Solutions. On December 28, 2011, we made a $3,500 debt investment in Vessel Holdings, LLC, a subsidiary of Freedom Marine. On November 25, 2013, we provided $13,000 in senior secured debt financing for the recapitalization of our investment in Jettco Marine Services, LLC (“Jettco”), a subsidiary of Freedom Marine. The subordinated secured loan to Jettco was replaced with a senior secured note to Vessel Holdings II, LLC, a new subsidiary of Freedom Marine. On December 3, 2013, we made a $16,000 senior secured investment in Vessel Holdings III, LLC, another new subsidiary of Freedom Marine. On June 4, 2014, Gas Solutions GP LLC and Gas Solutions LP LLC, two subsidiaries of Energy Solutions, merged with and into Freedom Marine, with Freedom Marine as the surviving entity. In June 2014, Freedom Marine Services Holdings, LLC was renamed Freedom Marine Solutions, LLC; Vessel Holdings, LLC was renamed Vessel Company, LLC; Vessel Holdings II, LLC was renamed Vessel Company II, LLC; Vessel Holdings III, LLC was renamed Vessel Company III, LLC; Yatesville Coal Holdings, LLC was renamed Yatesville Coal Company, LLC; and Change Clean Energy Holdings, LLC was renamed Change Clean Energy Company, LLC. On July 1, 2014, we began consolidating Energy Solutions and as a result, we began reporting our investments in Change Clean Energy Company, LLC, Freedom Marine Solutions, LLC and Yatesville Coal Company, LLC as separate controlled companies. During the three months ended December 31, 2014, we determined that the impairments of Change Clean Energy Company, LLC and Yatesville Coal Company, LLC were other-than-temporary and recorded a realized loss of $1,449, reducing the amortized cost to zero. |
See notes to consolidated financial statements.
131
PROSPECT CAPITAL CORPORATION AND SUBSIDIARIES
CONSOLIDATED SCHEDULES OF INVESTMENTS (CONTINUED)
(in thousands, except share data)
Endnote Explanations as of June 30, 2015 and June 30, 2014 (Continued)
(9) | As of June 30, 2014, we owned 100% of the equity of Vets Securing America, Inc. (“VSA”) and 100% of the equity of The Healing Staff, Inc. (“THS”), a former wholly-owned subsidiary of ESA Environmental Specialists, Inc. As of June 30, 2014, THS and VSA were joint borrowers on the secured promissory notes. On June 5, 2015, we sold our equity investment in VSA and realized a net loss of $975 on the sale. In connection with the sale, VSA was released as a borrower on the secured promissory notes, leaving THS as the sole borrower. During the year ended June 30, 2015, THS ceased operations and we recorded a realized loss of $2,956, reducing the amortized cost to zero. |
(10) | GTP Operations, LLC, Transplace, LLC, CI (Transplace) International, LLC, Transplace Freight Services, LLC, Transplace Texas, LP, Transplace Stuttgart, LP, Transplace International, Inc., Celtic International, LLC, and Treetop Merger Sub, LLC are joint borrowers on the senior secured term loan. |
(11) | The CLO equity investments are entitled to recurring distributions which are generally equal to the excess cash flow generated from the underlying investments after payment of the contractual payments to debt holders and fund expenses. The current estimated yield is based on the current projections of this excess cash flow taking into account assumptions which have been made regarding expected prepayments, losses and future reinvestment rates. These assumptions are periodically reviewed and adjusted. Ultimately, the actual yield may be higher or lower than the estimated yield if actual results differ from those used for the assumptions. |
(12) | Wolf Energy Holdings, an entity in which we own 100% of the common stock, owns 100% of the equity of Wolf Energy, LLC (“Wolf Energy”). Effective June 30, 2012, the membership interests and associated operating company debt of AEH and Coalbed, which were previously owned by Manx, were assigned to Wolf Energy Holdings. Effective June 6, 2014, Appalachian Energy Holdings, LLC was renamed Appalachian Energy LLC. On July 1, 2014, we began consolidating Wolf Energy Holdings and as a result, we began reporting our investments in Appalachian Energy LLC, Coalbed, LLC and Wolf Energy, LLC as separate controlled companies. During the three months ended September 30, 2014, we determined that the impairment of Appalachian Energy LLC was other-than-temporary and recorded a realized loss of $2,050, reducing the amortized cost to zero. On November 21, 2014, Coalbed merged with and into Wolf Energy, with Wolf Energy as the surviving entity. During the three months ended December 31, 2014, we determined that the impairment of the Coalbed debt assumed by Wolf Energy was other-than-temporary and recorded a realized loss of $5,991, reducing the amortized cost to zero. |
(13) | On a fully diluted basis represents 10.00% of voting common shares. |
(14) | Trinity Services Group, Inc. and Trinity Services I, LLC are joint borrowers on the senior secured loan facility. |
(15) | We own 99.9999% of AGC/PEP, LLC. AGC/PEP, LLC owns 2,037.65 out of a total of 83,818.69 shares (including 5,111 vested and unvested management options) of American Gilsonite Holding Company which owns 100% of American Gilsonite Company. |
(16) | Syndicated investment which was originated by a financial institution and broadly distributed. |
(17) | MITY Holdings of Delaware Inc. (“MITY Delaware”), an entity in which we own 100% of the common stock, owns 94.99% of the equity of MITY, Inc. (f/k/a MITY Enterprises, Inc.) (“MITY”). MITY owns 100% of each of MITY-Lite, Inc.; Broda Enterprises USA, Inc.; and Broda Enterprises ULC (“Broda Canada”). On June 23, 2014, Prospect made a new $15,769 debt investment in MITY and MITY distributed proceeds to MITY Delaware as a return of capital. MITY Delaware used this distribution to pay down the senior secured debt of MITY Delaware to Prospect by the same amount. The remaining amount of the senior secured debt due from MITY Delaware to Prospect, $7,200, was then contributed to the capital of MITY Delaware. As a result of this transaction, Prospect held the $15,769 MITY note. Effective June 23, 2014, Mity Enterprises, Inc. was renamed MITY, Inc. and Broda Enterprises USA, Inc. was renamed Broda USA, Inc. On June 23, 2014, Prospect also extended a new $7,500 senior secured revolving facility to MITY, of which none was funded at closing. On July 1, 2014, we began consolidating MITY Delaware and as a result, we now report MITY, Inc. as a separate controlled company. MITY Delaware has a subordinated unsecured note issued and outstanding to Broda Canada that is denominated in Canadian Dollars (CAD). As of June 30, 2015, the principal balance of this note was CAD 7,371. In accordance with ASC 830, Foreign Currency Matters (“ASC 830”), this note was remeasured into our functional currency, US Dollars (USD), and is presented on our Consolidated Schedule of Investments in USD. |
(18) | The overriding royalty interests held receive payments at the stated rates based upon operations of the borrower. |
(19) | Our wholly-owned subsidiary Prospect Small Business Lending, LLC purchases small business whole loans on a recurring basis from online small business loan originators, including On Deck Capital, Inc. and Direct Capital Corporation. |
See notes to consolidated financial statements.
132
PROSPECT CAPITAL CORPORATION AND SUBSIDIARIES
CONSOLIDATED SCHEDULES OF INVESTMENTS (CONTINUED)
(in thousands, except share data)
Endnote Explanations as of June 30, 2015 and June 30, 2014 (Continued)
(20) | Boxercraft Incorporated (“Boxercraft”) and BXC Company, Inc. (f/k/a BXC Holding Company) (“BXC”) are joint borrowers on our senior secured investments. Effective March 28, 2014, we acquired voting control of BXC pursuant to a voting agreement and irrevocable proxy. Effective May 8, 2014, we acquired control of BXC by transferring shares held by the other equity holders of BXC to us pursuant to an assignment agreement entered into with such other equity holders. As of June 30, 2014, we owned 86.7% of Series A preferred stock, 96.8% of Series B preferred stock, and 83.1% of the fully-diluted common stock of BXC. BXC owned 100% of the common stock of Boxercraft. We owned a warrant to purchase 15% of all classes of equity of BXC, which consisted of 3,755,000 shares of Series A preferred stock, 625,000 shares of Series B preferred stock, and 43,800 shares of voting common stock as of June 30, 2014. On August 25, 2014, we sold Boxercraft, a wholly-owned subsidiary of BXC, for net proceeds of $750 and realized a net loss of $16,949 on the sale. |
(21) | We owned warrants to purchase 33,750 shares of common stock in Metal Buildings Holding Corporation (“Metal Buildings”), the former holding company of Borga, Inc. (“Borga”). Metal Buildings owned 100% of Borga. On March 8, 2010, we foreclosed on the stock in Borga that was held by Metal Buildings, obtaining 100% ownership of Borga. On January 24, 2014, we contributed our holdings in Borga to STI Holding, Inc. (“STI”), a wholly-owned holding company. On July 1, 2014, we began consolidating STI and as a result, we reported Borga, Inc. as a separate controlled company from July 1, 2014 until its sale on August 20, 2014. On August 20, 2014, we sold the assets of Borga, a wholly-owned subsidiary of STI, for net proceeds of $382 and realized a loss of $2,589 on the sale. On December 29, 2014, Borga was dissolved. |
(22) | Investment has been designated as an investment not “qualifying” under Section 55(a) of the Investment Company Act of 1940 (the “1940 Act”). Under the 1940 Act, we may not acquire any non-qualifying asset unless, at the time such acquisition is made, qualifying assets represent at least 70% of our total assets. We monitor the status of these assets on an ongoing basis. |
(23) | NCP Finance Limited Partnership, NCP Finance Ohio, LLC, and certain affiliates thereof are joint borrowers on the subordinated secured term loan. |
(24) | On May 6, 2011, we made a secured first lien $24,250 debt investment to NMMB, Inc. (f/k/a NMMB Acquisition, Inc.) (“NMMB”), a $2,800 secured debt and $4,400 equity investment to NMMB Holdings, Inc. (“NMMB Holdings”). We owned 100% of the Series A Preferred Stock in NMMB Holdings. NMMB Holdings owned 100% of the Convertible Preferred Stock in NMMB. On December 13, 2013, we provided $8,086 in preferred equity for the recapitalization of NMMB Holdings. After the restructuring, we received repayment of $2,800 secured debt outstanding. We own 100% of the equity of NMMB Holdings as of June 30, 2015 and June 30, 2014. NMMB Holdings owns 96.33% and 92.93% of the fully diluted equity of NMMB as of June 30, 2015 and June 30, 2014, respectively. NMMB owns 100% of Refuel Agency, Inc. (“Refuel Agency”), which owns 100% of Armed Forces Communications, Inc. (“Armed Forces”). On June 12, 2014, Prospect made a new $7,000 senior secured term loan to Armed Forces. Armed Forces distributed this amount to Refuel Agency as a return of capital. Refuel Agency distributed this amount to NMMB as a return of capital, which was used to pay down $7,000 of NMMB’s $10,714 senior secured term loan to Prospect. On July 1, 2014, we began consolidating NMMB Holdings and as a result, we now report NMMB, Inc. as a separate controlled company. |
(25) | Undrawn committed revolvers and delayed draw term loans to our portfolio companies incur commitment and unused fees ranging from 0.00% to 2.00%. As of June 30, 2015 and June 30, 2014, we had $88,288 and $72,118, respectively, of undrawn revolver and delayed draw term loan commitments to our portfolio companies. |
(26) | Stated interest rates are based on June 30, 2015 and June 30, 2014 one month or three month LIBOR rates plus applicable spreads based on the respective credit agreements. Interest rates are subject to change based on actual elections by the borrower for a LIBOR rate contract or Base Rate contract when drawing on the revolver. |
(27) | On July 30, 2010, we made a $30,000 senior secured debt investment in Airmall Inc. (“Airmall”), a $12,500 secured second lien in AMU Holdings Inc. (“AMU”), and acquired 100% of the Series A preferred stock and common stock of AMU. Our preferred stock in AMU had a 12.0% dividend rate which was paid from the dividends received from its operating subsidiary, Airmall. AMU owned 100% of the common stock in Airmall. On December 4, 2013, we sold a $972 participation in both debt investments, equal to 2% of the outstanding principal amount of loans on that date. On June 13, 2014, Prospect made a new $19,993 investment as a senior secured loan to Airmall. Airmall then distributed this amount to AMU as a return of capital, which AMU used to pay down the senior subordinated loan in the same amount. The minority interest held by a third party in AMU was exchanged for common stock of Airmall. As of June 30, 2014, we owned 100% of the equity of AMU, which owned 98% of Airmall. On July 1, 2014, we began consolidating AMU and as a result, we reported Airmall Inc. as a separate controlled company from July 1, 2014 until its sale on August 1, 2014. On August 1, 2014, we sold our investments in Airmall for net proceeds of $51,379 and realized a loss of $3,473 on the sale. In addition, there is $6,000 being held in escrow, of which 98% is due to Prospect, which will be recognized as an additional realized loss if it is not received. On October 22, 2014, we received a tax refund of $665 related to our investment in Airmall for which we realized a gain of the same amount. |
See notes to consolidated financial statements.
133
PROSPECT CAPITAL CORPORATION AND SUBSIDIARIES
CONSOLIDATED SCHEDULES OF INVESTMENTS (CONTINUED)
(in thousands, except share data)
Endnote Explanations as of June 30, 2015 and June 30, 2014 (Continued)
(28) | As of June 30, 2014, Progrexion Marketing, Inc., Progrexion Teleservices, Inc., Progrexion ASG, Inc., Progrexion IP, Inc., Creditrepair.com, Inc., and eFolks, LLC were joint borrowers on the senior secured term loan. PGX Holdings, Inc. was the parent guarantor of this debt investment. As of June 30, 2015, PGX Holdings, Inc. is the sole borrower on the second lien term loan. |
(29) | First Tower Holdings of Delaware LLC (“First Tower Delaware”), an entity in which we own 100% of the membership interests, owns 80.1% of First Tower Finance Company LLC (“First Tower Finance”), which owns 100% of First Tower, LLC (“First Tower”), the operating company. On June 24, 2014, Prospect made a new $251,246 second lien term loan to First Tower. First Tower distributed this amount to First Tower Finance, which distributed this amount to First Tower Delaware as a return of capital. First Tower Delaware used the distribution to partially pay down the Senior Secured Revolving Credit Facility. The remaining $23,712 of the Senior Secured Revolving Credit Facility was then converted to additional membership interests held by Prospect in First Tower Delaware. On July 1, 2014, we began consolidating First Tower Delaware and as a result, we now report First Tower Finance Company LLC as a separate controlled company. |
(30) | Arctic Oilfield Equipment USA, Inc. (“Arctic Equipment”), an entity in which we own 100% of the common equity, owns 70% of the equity of Arctic Energy Services, LLC (“Arctic Energy”), the operating company. On July 1, 2014, we began consolidating Arctic Equipment and as a result, we now report Arctic Energy as a separate controlled company. |
(31) | We own 2.8% (13,220 shares) of Mineral Fusion Natural, LLC, a subsidiary of Caleel + Hayden, LLC, common and preferred interest. |
(32) | APH Property Holdings, LLC (“APH”), an entity in which we own 100% of the membership interests, owns 100% of the common equity of American Property REIT Corp. (f/k/a American Property Holdings Corp.) (“APRC”), a qualified REIT which holds investments in several real estate properties. Effective April 1, 2014, Prospect made a new $167,162 senior term loan to APRC. APRC then distributed this amount to APH as a return of capital which was used to pay down the Senior Term Loan from APH by the same amount. On July 1, 2014, we began consolidating APH and as a result, we now report APRC as a separate controlled company. See Note 3 for further discussion of the properties held by APRC. |
(33) | CCPI Holdings Inc. (“CCPI Holdings”), an entity in which we own 100% of the common stock, owns 94.95% and 94.77% of CCPI Inc. (“CCPI”), the operating company, as of June 30, 2015 and June 30, 2014, respectively. On June 13, 2014, Prospect made a new $8,218 senior secured note to CCPI. CCPI then distributed this amount to CCPI Holdings as a return of capital which was used to pay down the $8,216 senior secured note from CCPI Holdings to Prospect. The remaining $2 was distributed to Prospect as a return of capital of Prospect’s equity investment in CCPI Holdings. On July 1, 2014, we began consolidating CCPI Holdings and as a result, we now report CCPI Inc. as a separate controlled company. |
(34) | Credit Central Holdings of Delaware, LLC (“Credit Central Delaware”), an entity in which we own 100% of the membership interests, owns 74.93% and 74.75% of Credit Central Loan Company, LLC (f/k/a Credit Central Holdings, LLC) (“Credit Central”) as of June 30, 2015 and June 30, 2014, respectively. Credit Central owns 100% of each of Credit Central, LLC; Credit Central South, LLC; Credit Central of Texas, LLC; and Credit Central of Tennessee, LLC, the operating companies. On June 26, 2014, Prospect made a new $36,333 second lien term loan to Credit Central. Credit Central then distributed this amount to Credit Central Delaware as a return of capital which was used to pay down the Senior Secured Revolving Credit Facility from Credit Central Delaware by the same amount. The remaining amount of the Senior Secured Revolving Credit Facility, $3,874, was then converted into additional membership interests in Credit Central Delaware. On July 1, 2014, we began consolidating Credit Central Delaware and as a result, we now report Credit Central Loan Company, LLC as a separate controlled company. |
(35) | Valley Electric Holdings I, Inc. (“Valley Holdings I”), an entity in which we own 100% of the common stock, owns 100% of Valley Electric Holdings II, Inc. (“Valley Holdings II”). Valley Holdings II owns 94.99% of Valley Electric Company, Inc. (“Valley Electric”). Valley Electric owns 100% of the equity of VE Company, Inc., which owns 100% of the equity of Valley Electric Co. of Mt. Vernon, Inc. (“Valley”). On June 24, 2014, Valley Holdings II and management of Valley formed Valley Electric and contributed their shares of Valley stock to Valley Electric. Prospect made a new $20,471 senior secured loan to Valley Electric. Valley Electric then distributed this amount to Valley Holdings I, via Valley Holdings II, as a return of capital which was used to pay down the senior secured note of Valley Holdings I by the same amount. The remaining principal amount of the senior secured note, $16,754, was then contributed to the capital of Valley Holdings I. On July 1, 2014, we began consolidating Valley Holdings I and Valley Holdings II and as a result, we now report Valley Electric Company, Inc. as a separate controlled company. |
See notes to consolidated financial statements.
134
PROSPECT CAPITAL CORPORATION AND SUBSIDIARIES
CONSOLIDATED SCHEDULES OF INVESTMENTS (CONTINUED)
(in thousands, except share data)
Endnote Explanations as of June 30, 2015 and June 30, 2014 (Continued)
(36) | Nationwide Acceptance Holdings LLC (“Nationwide Holdings”), an entity in which we own 100% of the membership interests, owns 93.79% of Nationwide Loan Company LLC (f/k/a Nationwide Acceptance LLC) (“Nationwide”), the operating company. On June 18, 2014, Prospect made a new $14,820 second lien term loan to Nationwide. Nationwide distributed this amount to Nationwide Holdings as a return of capital. Nationwide Holdings used the distribution to pay down the Senior Secured Revolving Credit Facility. The remaining $9,888 of the Senior Secured Revolving Credit Facility was then converted into additional membership interests in Nationwide Holdings. On July 1, 2014, we began consolidating Nationwide Holdings and as a result, we now report Nationwide Loan Company LLC as a separate controlled company. On June 1, 2015, Nationwide completed a corporate reorganization. As part of the reorganization, Nationwide Acceptance LLC was renamed Nationwide Loan Company LLC (continues as “Nationwide”) and formed two new wholly-owned subsidiaries: Pelican Loan Company LLC (“Pelican”) and Nationwide Consumer Loans LLC. Nationwide assigned 100% of the equity interests in its other subsidiaries to Pelican which, in turn, assigned these interests to Nationwide Acceptance LLC (“New Nationwide”), the new operating company wholly-owned by Pelican. New Nationwide also assumed the existing senior subordinated term loan due to Prospect. |
(37) | On April 15, 2013, assets previously held by H&M Oil & Gas, LLC (“H&M”) were assigned to Wolf Energy in exchange for a $66,000 term loan secured by the assets. The cost basis in this loan of $44,632 was determined in accordance with ASC 310-40, Troubled Debt Restructurings by Creditors, and was equal to the fair value of assets at the time of transfer resulting in a capital loss of $19,647 in connection with the foreclosure on the assets. On May 17, 2013, Wolf Energy sold the assets located in Martin County, which were previously held by H&M, for $66,000. Proceeds from the sale were primarily used to repay the loan, accrued interest and net profits interest receivable due to us resulting in a realized capital gain of $11,826. We received $3,960 of structuring and advisory fees from Wolf Energy during the year ended June 30, 2013 related to the sale and $991 under the net profits interest agreement which was recognized as other income during the fiscal year ended June 30, 2013. |
(38) | CP Holdings of Delaware LLC (“CP Holdings”), an entity in which we own 100% of the membership interests, owns 82.3% and 82.9% of CP Energy Services Inc. (“CP Energy”) as of June 30, 2015 and June 30, 2014, respectively. As of June 30, 2014, CP Energy owned directly or indirectly 100% of each of CP Well Testing Services, LLC (“CP Well Testing”); CP Well Testing, LLC (“CP Well”); Fluid Management Services, Inc.; Fluid Management Services, LLC; Wright Transport, Inc.; Wright Foster Disposals, LLC; Foster Testing Co., Inc.; ProHaul Transports, LLC; Artexoma Logistics, LLC; and Wright Trucking, Inc. On April 1, 2014, Prospect made new loans to CP Well (with ProHaul Transports, LLC; Wright Trucking, Inc.; and Foster Testing Co., Inc. as co-borrowers), comprised of two first lien loans in the amount of $11,035 and $72,238 and a second lien loan in the amount of $15,000. The proceeds of these loans were used to repay CP Well Testing’s senior secured term loan and CP Energy’s senior secured term loan from Prospect. On July 1, 2014, we began consolidating CP Holdings and as a result, we now report CP Energy Services Inc. as a separate controlled company. Effective December 31, 2014, CP Energy underwent a corporate reorganization in order to consolidate certain of its wholly-owned subsidiaries. As of June 30, 2015, CP Energy owned directly or indirectly 100% of each of CP Well; Wright Foster Disposals, LLC; Foster Testing Co., Inc.; ProHaul Transports, LLC; and Wright Trucking, Inc. |
(39) | Wind River Resources Corporation and Wind River II Corporation are joint borrowers on the senior secured note. |
(40) | NPH Property Holdings, LLC (“NPH”), an entity in which we own 100% of the membership interests, owns 100% of the common equity of National Property REIT Corp. (f/k/a National Property Holdings Corp.) (“NPRC”), a property REIT which holds investments in several real estate properties. Additionally, through its wholly-owned subsidiaries, NPRC invests in online consumer loans. Effective April 1, 2014, Prospect made a new $104,460 senior term loan to NPRC. NPRC then distributed this amount to NPH as a return of capital which was used to pay down the Senior Term Loan from NPH by the same amount. On July 1, 2014, we began consolidating NPH and as a result, we now report NPRC as a separate controlled company. See Note 3 for further discussion of the properties held by NPRC. On March 17, 2015, we entered into a new credit agreement with ACL Loan Holdings, Inc. (“ACLLH”), a wholly-owned subsidiary of NPRC, to form two new tranches of senior secured term loans, Term Loan A and Term Loan B, with the same terms as the existing NPRC Term Loan A and Term Loan B due to us. The agreement was effective as of June 30, 2014. On June 30, 2014, ACLLH made a non-cash return of capital distribution of $22,390 to NPRC and NPRC transferred and assigned to ACLLH a senior secured Term Loan A due to us. On June 2, 2015, we amended the credit agreement with NPRC to form two new tranches of senior secured term loans, Term Loan C and Term Loan D, with the same terms as the existing ACLLH Term Loan A and Term Loan B due to us. The amendment was effective as of April 1, 2015. |
(41) | UPH Property Holdings, LLC (“UPH”), an entity in which we own 100% of the membership interests, owns 100% of the common equity of United Property REIT Corp. (f/k/a United Property Holdings Corp.) (“UPRC”), a property REIT which holds investments in several real estate properties. Effective April 1, 2014, Prospect made a new $19,027 senior term loan to UPRC. UPRC then distributed this amount to UPH as a return of capital which was used to pay down the Senior Term Loan from UPH by the same amount. On July 1, 2014, we began consolidating UPH and as a result, we now report UPRC as a separate controlled company. See Note 3 for further discussion of the properties held by UPRC. |
See notes to consolidated financial statements.
135
PROSPECT CAPITAL CORPORATION AND SUBSIDIARIES
CONSOLIDATED SCHEDULES OF INVESTMENTS (CONTINUED)
(in thousands, except share data)
Endnote Explanations as of June 30, 2015 and June 30, 2014 (Continued)
(42) | On April 4, 2008, we acquired a controlling equity interest in ARRM Holdings, Inc. (“ARRM”), which owned 100% of Ajax Rolled Ring & Machine, LLC (“Ajax”), the operating company. On April 1, 2013, we refinanced the existing $19,837 and $18,635 senior loans to Ajax and ARRM, respectively, increasing the total size of the debt investment to $38,537. Concurrent with the refinancing, we received repayment of the $18,635 loans previously outstanding. On October 11, 2013, we provided $25,000 in preferred equity for the recapitalization of ARRM. After the financing, we received repayment of the $20,009 subordinated unsecured loan previously outstanding. On June 12, 2014, ARRM Holdings, Inc. was renamed ARRM Services, Inc. As of June 30, 2014, we controlled 79.53% of the fully-diluted common, 85.76% of the Series A Preferred and 100% of the Series B Preferred equity of ARRM. On October 10, 2014, ARRM sold Ajax to a third party and repaid the $19,337 loan receivable to us and we recorded a realized loss of $23,560 related to the sale. Concurrent with the sale, our ownership increased to 100% of the outstanding equity of ARRM Services, Inc. which was renamed SB Forging Company, Inc. (“SB Forging”). As such, we began consolidating SB Forging on October 11, 2014. In addition, there is $3,000 being held in escrow of which $802 was received on May 6, 2015 for which we realized a gain of the same amount. The remainder will be recognized as additional gain if and when received. |
(43) | Harbortouch Holdings of Delaware Inc. (“Harbortouch Delaware”), an entity in which we own 100% of the common stock, owns 100% of the Class C voting units of Harbortouch Payments, LLC (“Harbortouch”), which provide for a 53.5% residual profits allocation. Harbortouch management owns 100% of the Class B and Class D voting units of Harbortouch, which provide for a 46.5% residual profits allocation. Harbortouch owns 100% of Credit Card Processing USA, LLC. On April 1, 2014, Prospect made a new $137,226 senior secured term loan to Harbortouch. Harbortouch then distributed this amount to Harbortouch Delaware as a return of capital which was used to pay down the $123,000 senior secured note from Harbortouch Delaware to Prospect. The remaining $14,226 was distributed to Prospect as a return of capital of Prospect’s equity investment in Harbortouch Delaware. On July 1, 2014, we began consolidating Harbortouch Delaware and as a result, we now report Harbortouch Payments, LLC as a separate controlled company. |
(44) | Pegasus Business Intelligence, LP, Paycom Acquisition, LLC, and Paycom Acquisition Corp. are joint borrowers on the senior secured loan facility. Paycom Intermediate Holdings, Inc. is the parent guarantor of this debt investment. These entities transact business internationally under the trade name Onyx Payments. |
(45) | Security Alarm Financing Enterprises, L.P. and California Security Alarms, Inc. are joint borrowers on the senior subordinated note. |
(46) | A portion of the senior secured note is denominated in Canadian Dollars (CAD). As of June 30, 2014 and June 30, 2015, the principal balance of this note was CAD 37,422 and CAD 36,666, respectively. In accordance with ASC 830, this note was remeasured into our functional currency, US Dollars (USD), and is presented on our Consolidated Schedules of Investments in USD. |
(47) | On June 9, 2015, we provided additional debt and equity financing to support the recapitalization of Edmentum, Inc. (“Edmentum”). As part of the recapitalization, we exchanged 100% of the $50,000 second lien term loan previously outstanding for $26,365 of junior PIK notes and 370,964.14 Class A common units representing 37.1% equity ownership in Edmentum Ultimate Holdings, LLC. In addition, we invested $5,875 in senior PIK notes and committed $7,834 as part of a second lien revolving credit facility, of which $4,896 was funded at closing. On June 9, 2015, we determined that the impairment of Edmentum was other-than-temporary and recorded a realized loss of $22,116 for the amount that the amortized cost exceeded the fair value, reducing the amortized cost to $37,216. |
(48) | Co-investment with another fund managed by an affiliate of our investment adviser, Prospect Capital Management L.P. See Note 13 for further discussion. |
See notes to consolidated financial statements.
136
PROSPECT CAPITAL CORPORATION AND SUBSIDIARIES
CONSOLIDATED SCHEDULES OF INVESTMENTS (CONTINUED)
(in thousands, except share data)
Endnote Explanations as of June 30, 2015 and June 30, 2014 (Continued)
(49) | As defined in the 1940 Act, we are deemed to “Control” these portfolio companies because we own more than 25% of the portfolio company’s outstanding voting securities. Transactions during the year ended June 30, 2015 with these controlled investments were as follows: |
Portfolio Company | Purchases* | Redemptions* | Sales | Interest income | Dividend income | Other income | Net realized gains (losses) | Net unrealized gains (losses) | |||||||||||||||||
Airmall Inc. | $ | — | $ | (47,580 | ) | $ | (9,920 | ) | $ | 576 | $ | — | $ | 3,000 | $ | (2,808 | ) | $ | 12,216 | ||||||
American Property REIT Corp. | (107,073 | ) | ** | (8 | ) | — | 14,747 | — | 1,342 | — | 14,672 | ||||||||||||||
Appalachian Energy LLC | — | (2,050 | ) | — | — | — | — | (2,050 | ) | 2,050 | |||||||||||||||
Arctic Energy Services, LLC | — | — | — | 6,721 | — | — | — | (750 | ) | ||||||||||||||||
ARRM Services, Inc. | — | (19,337 | ) | (27,213 | ) | 956 | — | 2,000 | (23,560 | ) | 21,014 | ||||||||||||||
Borga, Inc. | — | — | (2,589 | ) | — | — | — | (2,589 | ) | 2,741 | |||||||||||||||
BXC Company, Inc. | 250 | (750 | ) | (16,949 | ) | — | — | 5 | (16,949 | ) | 15,333 | ||||||||||||||
CCPI Inc. | — | (450 | ) | — | 3,332 | — | 525 | — | 8,635 | ||||||||||||||||
Change Clean Energy Company, LLC | — | — | — | — | — | — | — | — | |||||||||||||||||
Coalbed, LLC | — | — | — | — | — | — | — | — | |||||||||||||||||
CP Energy Services Inc. | — | — | — | 16,420 | — | — | — | (41,927 | ) | ||||||||||||||||
Credit Central Loan Company, LLC | — | (141 | ) | — | 7,375 | 159 | 1,220 | — | 6,777 | ||||||||||||||||
Echelon Aviation LLC | 5,800 | (37,313 | ) | (400 | ) | 6,895 | — | — | — | 8,226 | |||||||||||||||
Edmentum Ultimate Holdings, LLC | 59,333 | (22,116 | ) | — | — | — | — | (22,116 | ) | — | |||||||||||||||
First Tower Finance Company LLC | — | 1,929 | — | 52,900 | 1,929 | — | — | 40,765 | |||||||||||||||||
Freedom Marine Solutions, LLC | — | — | — | 4,461 | — | — | — | (4,429 | ) | ||||||||||||||||
Gulf Coast Machine & Supply Company | 8,500 | — | — | 1,370 | — | — | — | (16,041 | ) | ||||||||||||||||
Harbortouch Payments, LLC | 27,722 | (5,426 | ) | — | 29,834 | — | 579 | — | 58,857 | ||||||||||||||||
Manx Energy, Inc. | — | (50 | ) | — | — | — | — | (50 | ) | 50 | |||||||||||||||
MITY, Inc. | 2,500 | (2,500 | ) | — | 5,783 | — | — | (5 | ) | 1,068 | |||||||||||||||
National Property REIT Corp. | 357,609 | ** | (38,460 | ) | — | 30,611 | — | 1,959 | — | 24,317 | |||||||||||||||
Nationwide Loan Company LLC (f/k/a Nationwide Acceptance LLC) | 2,814 | — | — | 3,005 | 4,425 | — | — | 4,163 | |||||||||||||||||
NMMB, Inc. | 383 | — | — | 1,521 | — | — | — | 5,372 | |||||||||||||||||
R-V Industries, Inc. | — | (1,175 | ) | — | 3,018 | 298 | — | — | (16,052 | ) | |||||||||||||||
United Property REIT Corp. | 51,774 | ** | (376 | ) | — | 5,893 | — | 2,345 | — | 8,631 | |||||||||||||||
Valley Electric Company, Inc. | — | — | — | 4,991 | — | — | — | (5,036 | ) | ||||||||||||||||
Vets Securing America, Inc.*** | 100 | (2,956 | ) | (975 | ) | — | — | — | (3,246 | ) | 3,831 | ||||||||||||||
Wolf Energy, LLC | — | (5,991 | ) | — | — | — | — | (5,818 | ) | 2,414 | |||||||||||||||
Yatesville Coal Company, LLC | — | (1,449 | ) | — | — | — | — | (1,449 | ) | 1,449 | |||||||||||||||
Total | $ | 409,712 | $ | (186,199 | ) | $ | (58,046 | ) | $ | 200,409 | $ | 6,811 | $ | 12,975 | $ | (80,640 | ) | $ | 158,346 | ||||||
(50) | As defined in the 1940 Act, we are deemed to be an “Affiliated company” of these portfolio companies because we own more than 5% of the portfolio company’s outstanding voting securities. Transactions during the year ended June 30, 2015 with these affiliated investments were as follows: |
Portfolio Company | Purchases* | Redemptions* | Sales | Interest income | Dividend income | Other income | Net realized gains (losses) | Net unrealized gains (losses) | ||||||||||||||||
BNN Holdings Corp. | $ | 44,000 | $ | (30,679 | ) | $ | — | $ | 3,799 | $ | 778 | $ | 226 | $ | — | $ | 503 | |||||||
Total | $ | 44,000 | $ | (30,679 | ) | $ | — | $ | 3,799 | $ | 778 | $ | 226 | $ | — | $ | 503 | |||||||
* Purchase amounts do not include payment-in-kind interest. Redemption amounts include impairments. Redemption amounts do not include the cost basis adjustments resulting from consolidation on July 1, 2014.
** These amounts include the cost basis of investments transferred from APRC and UPRC to NPRC. (See Note 3 for details.)
*** During the year ended June 30, 2015, THS ceased operations and the VSA management team supervised both the continued operations of VSA and the wind-down of activities at THS.
See notes to consolidated financial statements.
137
PROSPECT CAPITAL CORPORATION AND SUBSIDIARIES
CONSOLIDATED SCHEDULES OF INVESTMENTS (CONTINUED)
(in thousands, except share data)
Endnote Explanations as of June 30, 2015 and June 30, 2014 (Continued)
(51) | As defined in the 1940 Act, we are deemed to “Control” these portfolio companies because we own more than 25% of the portfolio company’s outstanding voting securities. Transactions during the year ended June 30, 2014 with these controlled investments were as follows: |
Portfolio Company | Purchases* | Redemptions* | Sales | Interest income | Dividend income | Other income | Net realized gains (losses) | Net unrealized gains (losses) | |||||||||||||||||
AMU Holdings Inc. | $ | 7,600 | $ | (593 | ) | $ | (972 | ) | $ | 6,579 | $ | 12,000 | $ | — | $ | — | $ | (15,694 | ) | ||||||
APH Property Holdings, LLC | 163,747 | (118,186 | ) | ** | — | 18,788 | — | 5,946 | — | 3,393 | |||||||||||||||
Arctic Oilfield Equipment USA, Inc. | 60,876 | — | — | 1,050 | — | 1,713 | — | 238 | |||||||||||||||||
ARRM Services, Inc. | 25,000 | (24,251 | ) | — | (733 | ) | — | 148 | — | (14,957 | ) | ||||||||||||||
BXC Company, Inc. (f/k/a BXC Holding Company)*** | 300 | — | — | — | — | — | — | (3,796 | ) | ||||||||||||||||
CCPI Holdings Inc. | — | (450 | ) | — | 3,312 | 500 | 71 | — | (1,443 | ) | |||||||||||||||
CP Holdings of Delaware LLC | 113,501 | — | — | 13,858 | — | 1,864 | — | 16,618 | |||||||||||||||||
Credit Central Holdings of Delaware, LLC | 2,500 | (159 | ) | — | 7,845 | 4,841 | 521 | — | (2,371 | ) | |||||||||||||||
Echelon Aviation LLC | 92,628 | — | — | 2,809 | — | 2,771 | — | — | |||||||||||||||||
Energy Solutions Holdings Inc. | 16,000 | (8,525 | ) | — | 8,245 | — | 2,480 | — | (2,168 | ) | |||||||||||||||
First Tower Holdings of Delaware LLC | 10,000 | — | — | 54,320 | — | 10,560 | — | 17,003 | |||||||||||||||||
Gulf Coast Machine & Supply Company | 28,450 | (26,213 | ) | — | 1,449 | — | — | — | (777 | ) | |||||||||||||||
Harbortouch Holdings of Delaware Inc. | 278,694 | — | — | 6,879 | — | 7,536 | — | 12,620 | |||||||||||||||||
The Healing Staff, Inc. | — | — | — | — | — | 5,825 | — | — | |||||||||||||||||
Manx Energy, Inc. | — | (450 | ) | — | — | — | — | — | 104 | ||||||||||||||||
MITY Holdings of Delaware Inc. | 47,985 | — | — | 4,693 | — | 1,049 | — | 1,127 | |||||||||||||||||
Nationwide Acceptance Holdings LLC | 4,000 | — | — | 4,429 | 5,000 | 1,854 | — | 772 | |||||||||||||||||
NMMB Holdings, Inc. | 8,086 | (8,086 | ) | — | 2,051 | — | — | — | (6,852 | ) | |||||||||||||||
NPH Property Holdings, LLC | 40,425 | 85,724 | ** | — | 5,973 | — | 1,029 | — | (2,088 | ) | |||||||||||||||
R-V Industries, Inc. | — | (2,339 | ) | — | 3,188 | 1,100 | — | — | 2,005 | ||||||||||||||||
STI Holding, Inc. | — | (125 | ) | — | — | 3,246 | — | — | (25 | ) | |||||||||||||||
UPH Property Holdings, LLC | 1,405 | 22,562 | ** | — | 1,101 | — | 156 | — | 426 | ||||||||||||||||
Valley Electric Holdings I, Inc. | — | (200 | ) | — | 7,471 | — | 148 | — | (23,304 | ) | |||||||||||||||
Wolf Energy Holdings Inc. | — | — | — | — | — | — | — | (1,350 | ) | ||||||||||||||||
Total | $ | 901,197 | $ | (81,291 | ) | $ | (972 | ) | $ | 153,307 | $ | 26,687 | $ | 43,671 | $ | — | $ | (20,519 | ) | ||||||
(52) | As defined in the 1940 Act, we are deemed to be an “Affiliated company” of these portfolio companies because we own more than 5% of the portfolio company’s outstanding voting securities. Transactions during the year ended June 30, 2014 with these affiliated investments were as follows: |
Portfolio Company | Purchases* | Redemptions* | Sales | Interest income | Dividend income | Other income | Net realized gains (losses) | Net unrealized gains (losses) | |||||||||||||||||
BNN Holdings Corp. | $ | — | $ | (600 | ) | $ | — | $ | 2,974 | $ | — | $ | — | $ | — | $ | (194 | ) | |||||||
BXC Holding Company*** | — | (100 | ) | — | 1,384 | — | 17 | — | (4,163 | ) | |||||||||||||||
Smart, LLC | — | — | — | — | — | — | — | (143 | ) | ||||||||||||||||
Total | $ | — | $ | (700 | ) | $ | — | $ | 4,358 | $ | — | $ | 17 | $ | — | $ | (4,500 | ) | |||||||
* Purchase amounts do not include payment-in-kind interest. Redemption amounts include impairments.
** These amounts include the cost basis of investments transferred from APH to NPH and UPH.
*** During the year ended June 30, 2014, we acquired control of BXC Company, Inc. (f/k/a BXC Holding Company). As such, this investment was a controlled investment for part of the year and an affiliated investment for part of the year. See Note 14 for further discussion of this transaction.
See notes to consolidated financial statements.
138
PROSPECT CAPITAL CORPORATION AND SUBSIDIARIES
NOTES TO CONSOLIDATED FINANCIAL STATEMENTS
(in thousands, except share and per share data)
Note 1. Organization
In this report, the terms “Prospect,” “we,” “us” and “our” mean Prospect Capital Corporation and its subsidiaries unless the context specifically requires otherwise.
Prospect Capital Corporation is a financial services company that primarily lends to and invests in middle market privately-held companies. We are a closed-end investment company incorporated in Maryland. We have elected to be regulated as a business development company (“BDC”) under the Investment Company Act of 1940 (the “1940 Act”). As a BDC, we have elected to be treated as a regulated investment company (“RIC”), under Subchapter M of the Internal Revenue Code of 1986 (the “Code”). We were organized on April 13, 2004 and were funded in an initial public offering completed on July 27, 2004.
On May 15, 2007, we formed a wholly-owned subsidiary Prospect Capital Funding LLC (“PCF”), a Delaware limited liability company and a bankruptcy remote special purpose entity, which holds certain of our portfolio loan investments that are used as collateral for the revolving credit facility at PCF. Our wholly-owned subsidiary Prospect Small Business Lending, LLC (“PSBL”) was formed on January 27, 2014 and purchases small business whole loans on a recurring basis from online small business loan originators, including On Deck Capital, Inc. (“OnDeck”) and Direct Capital Corporation (“Direct Capital”). On September 30, 2014, we formed a wholly-owned subsidiary Prospect Yield Corporation, LLC (“PYC”) and effective October 23, 2014, PYC holds our investments in collateralized loan obligations (“CLOs”). Each of these subsidiaries have been consolidated since operations commenced.
Effective July 1, 2014, we began consolidating certain of our wholly-owned and substantially wholly-owned holding companies formed by us in order to facilitate our investment strategy. The following companies have been included in our consolidated financial statements since July 1, 2014: AMU Holdings Inc.; APH Property Holdings, LLC; Arctic Oilfield Equipment USA, Inc.; CCPI Holdings Inc.; CP Holdings of Delaware LLC; Credit Central Holdings of Delaware, LLC; Energy Solutions Holdings Inc.; First Tower Holdings of Delaware LLC; Harbortouch Holdings of Delaware Inc.; MITY Holdings of Delaware Inc.; Nationwide Acceptance Holdings LLC; NMMB Holdings, Inc.; NPH Property Holdings, LLC; STI Holding, Inc.; UPH Property Holdings, LLC; Valley Electric Holdings I, Inc.; Valley Electric Holdings II, Inc.; and Wolf Energy Holdings Inc. On October 10, 2014, concurrent with the sale of the operating company, our ownership increased to 100% of the outstanding equity of ARRM Services, Inc. which was renamed SB Forging Company, Inc. (“SB Forging”). As such, we began consolidating SB Forging on October 11, 2014. We collectively refer to these entities as the “Consolidated Holding Companies.”
We are externally managed by our investment adviser, Prospect Capital Management L.P. (“Prospect Capital Management” or the “Investment Adviser”). Prospect Administration LLC (“Prospect Administration” or the “Administrator”) provides administrative services and facilities necessary for us to operate.
Our investment objective is to generate both current income and long-term capital appreciation through debt and equity investments. We invest primarily in senior and subordinated debt and equity of private companies in need of capital for acquisitions, divestitures, growth, development, recapitalizations and other purposes. We work with the management teams or financial sponsors to seek investments with historical cash flows, asset collateral or contracted pro-forma cash flows.
Note 2. Significant Accounting Policies
Basis of Presentation and Consolidation
The accompanying consolidated financial statements have been prepared in accordance with United States generally accepted accounting principles (“GAAP”) pursuant to the requirements for reporting on Form 10-K, ASC 946, Financial Services—Investment Companies (“ASC 946”), and Articles 6, 10 and 12 of Regulation S-X. Under the 1940 Act, ASC 946, and the regulations pursuant to Article 6 of Regulation S-X, we are precluded from consolidating any entity other than another investment company or an operating company which provides substantially all of its services to benefit us. Our consolidated financial statements include the accounts of Prospect, PCF, PSBL, PYC, and the Consolidated Holding Companies. All intercompany balances and transactions have been eliminated in consolidation. The financial results of our non-substantially wholly-owned holding companies and operating portfolio company investments are not consolidated in the financial statements. Any operating companies owned by the Consolidated Holding Companies are not consolidated.
139
Use of Estimates
The preparation of the consolidated financial statements in accordance with GAAP requires us to make estimates and assumptions that affect the reported amounts of assets and liabilities at the date of the consolidated financial statements and the reported amounts of income, expenses, and gains and losses during the reported period. Changes in the economic environment, financial markets, creditworthiness of our portfolio companies and any other parameters used in determining these estimates could cause actual results to differ, and these differences could be material.
Cash and Cash Equivalents
Cash and cash equivalents include funds deposited with financial institutions and short-term, highly-liquid overnight investments in money market funds. Cash and cash equivalents are carried at cost which approximates fair value.
Investment Classification
We are a non-diversified company within the meaning of the 1940 Act. As required by the 1940 Act, we classify our investments by level of control. As defined in the 1940 Act, “Control Investments” are those where there is the ability or power to exercise a controlling influence over the management or policies of a company. Control is generally deemed to exist when a company or individual possesses or has the right to acquire within 60 days or less, a beneficial ownership of more than 25% of the voting securities of an investee company. Under the 1940 Act, “Affiliate Investments” are defined by a lesser degree of influence and are deemed to exist through the possession outright or via the right to acquire within 60 days or less, beneficial ownership of 5% or more of the outstanding voting securities of another person. “Non-Control/Non-Affiliate Investments” are those that are neither Control Investments nor Affiliate Investments.
Investments are recognized when we assume an obligation to acquire a financial instrument and assume the risks for gains or losses related to that instrument. Investments are derecognized when we assume an obligation to sell a financial instrument and forego the risks for gains or losses related to that instrument. Specifically, we record all security transactions on a trade date basis. Amounts for investments recognized or derecognized but not yet settled are reported in due to broker or as a receivable for investments sold in the consolidated statements of assets and liabilities.
Investment Risks
Our investments are subject to a variety of risks. Those risks include the following:
Market Risk
Market risk represents the potential loss that can be caused by a change in the fair value of the financial instrument.
Credit Risk
Credit risk represents the risk that we would incur if the counterparties failed to perform pursuant to the terms of their agreements with us.
Liquidity Risk
Liquidity risk represents the possibility that we may not be able to rapidly adjust the size of our investment positions in times of high volatility and financial stress at a reasonable price.
Interest Rate Risk
Interest rate risk represents a change in interest rates, which could result in an adverse change in the fair value of an interest-bearing financial instrument.
Prepayment Risk
Many of our debt investments allow for prepayment of principal without penalty. Downward changes in interest rates may cause prepayments to occur at a faster than expected rate, thereby effectively shortening the maturity of the security and making the security less likely to be an income producing instrument.
140
Investment Valuation
To value our investments, we follow the guidance of ASC 820, Fair Value Measurement (“ASC 820”), that defines fair value, establishes a framework for measuring fair value in conformity with GAAP, and requires disclosures about fair value measurements. In accordance with ASC 820, the fair value of our investments is defined as the price that we would receive upon selling an investment in an orderly transaction to an independent buyer in the principal or most advantageous market in which that investment is transacted.
ASC 820 classifies the inputs used to measure these fair values into the following hierarchy:
Level 1: Quoted prices in active markets for identical assets or liabilities, accessible by us at the measurement date.
Level 2: Quoted prices for similar assets or liabilities in active markets, or quoted prices for identical or similar assets or liabilities in markets that are not active, or other observable inputs other than quoted prices.
Level 3: Unobservable inputs for the asset or liability.
In all cases, the level in the fair value hierarchy within which the fair value measurement in its entirety falls has been determined based on the lowest level of input that is significant to the fair value measurement. Our assessment of the significance of a particular input to the fair value measurement in its entirety requires judgment and considers factors specific to each investment.
Our Board of Directors has established procedures for the valuation of our investment portfolio. These procedures are detailed below.
Investments for which market quotations are readily available are valued at such market quotations.
For most of our investments, market quotations are not available. With respect to investments for which market quotations are not readily available or when such market quotations are deemed not to represent fair value, our Board of Directors has approved a multi-step valuation process each quarter, as described below.
1. | Each portfolio company or investment is reviewed by our investment professionals with independent valuation firms engaged by our Board of Directors. |
2. | The independent valuation firms conduct independent valuations and make their own independent assessments. |
3. | The Audit Committee of our Board of Directors reviews and discusses the preliminary valuation of the Investment Adviser and that of the independent valuation firms. |
4. | The Board of Directors discusses valuations and determines the fair value of each investment in our portfolio in good faith based on the input of the Investment Adviser, the respective independent valuation firm and the Audit Committee. |
Our non-CLO investments are valued utilizing a yield analysis, enterprise value (“EV”) analysis, net asset value analysis, liquidation analysis, discounted cash flow analysis, or a combination of methods, as appropriate. The yield analysis uses loan spreads for loans, dividend yields for certain investments and other relevant information implied by market data involving identical or comparable assets or liabilities. Under the EV analysis, the EV of a portfolio company is first determined and allocated over the portfolio company’s securities in order of their preference relative to one another (i.e., “waterfall” allocation). To determine the EV, we typically use a market multiples approach that considers relevant and applicable market trading data of guideline public companies, transaction metrics from precedent M&A transactions and/or a discounted cash flow analysis. The net asset value analysis is used to derive a value of an underlying investment (such as real estate property) by dividing a relevant earnings stream by an appropriate capitalization rate. For this purpose, we consider capitalization rates for similar properties as may be obtained from guideline public companies and/or relevant transactions. The liquidation analysis is intended to approximate the net recovery value of an investment based on, among other things, assumptions regarding liquidation proceeds based on a hypothetical liquidation of a portfolio company’s assets. The discounted cash flow analysis uses valuation techniques to convert future cash flows or earnings to a range of fair values from which a single estimate may be derived utilizing an appropriate discount rate. The measurement is based on the net present value indicated by current market expectations about those future amounts.
In applying these methodologies, additional factors that we consider in valuing our investments may include, as we deem relevant: security covenants, call protection provisions, and information rights; the nature and realizable value of any collateral; the portfolio company’s ability to make payments; the principal markets in which the portfolio company does business; publicly available financial ratios of peer companies; the principal market; and enterprise values, among other factors.
141
Our investments in CLOs are classified as ASC 820 Level 3 securities and are valued using a discounted cash flow model. The valuations have been accomplished through the analysis of the CLO deal structures to identify the risk exposures from the modeling point of view as well as to determine an appropriate call date. For each CLO security, the most appropriate valuation approach has been chosen from alternative approaches to ensure the most accurate valuation for such security. To value a CLO, both the assets and the liabilities of the CLO capital structure are modeled. We use a waterfall engine to store the collateral data, generate collateral cash flows from the assets based on various assumptions for the risk factors, distribute the cash flows to the liability structure based on the payment priorities, and discount them back using current market discount rates. The main risk factors are: default risk, interest rate risk, downgrade risk, and credit spread risk.
Valuation of Other Financial Assets and Financial Liabilities
ASC 825, Financial Instruments, specifically ASC 825-10-25, permits an entity to choose, at specified election dates, to measure eligible items at fair value (the “Fair Value Option”). We have not elected the Fair Value Option to report selected financial assets and financial liabilities. See Note 8 for further discussion of our financial liabilities that are measured using another measurement attribute.
Convertible Notes
We have recorded the Convertible Notes at their contractual amounts. The Convertible Notes were analyzed for any features that would require bifurcation and such features were determined to be immaterial. See Note 5 for further discussion.
Revenue Recognition
Realized gains or losses on the sale of investments are calculated using the specific identification method.
Interest income, adjusted for amortization of premium and accretion of discount, is recorded on an accrual basis. Origination, closing and/or commitment fees associated with investments in portfolio companies are accreted into interest income over the respective terms of the applicable loans. Accretion of such purchase discounts or amortization of premiums is calculated by the effective interest method as of the purchase date and adjusted only for material amendments or prepayments. Upon the prepayment of a loan or debt security, any prepayment penalties and unamortized loan origination, closing and commitment fees are recorded as interest income. The purchase discount for portfolio investments acquired from Patriot Capital Funding, Inc. (“Patriot”) was determined based on the difference between par value and fair value as of December 2, 2009, and continued to accrete until maturity or repayment of the respective loans. As of December 31, 2013, the purchase discount for the assets acquired from Patriot had been fully accreted. See Note 3 for further discussion.
Loans are placed on non-accrual status when there is reasonable doubt that principal or interest will be collected. Unpaid accrued interest is generally reversed when a loan is placed on non-accrual status. Interest payments received on non-accrual loans may be recognized as income or applied to principal depending upon management’s judgment. Non-accrual loans are restored to accrual status when past due principal and interest is paid and in management’s judgment, is likely to remain current. As of June 30, 2015, approximately 0.1% of our total assets are in non-accrual status.
Interest income from investments in the “equity” class of security of CLO funds (typically income notes or subordinated notes) is recorded based upon an estimation of an effective yield to expected maturity utilizing assumed cash flows in accordance with ASC 325-40, Beneficial Interests in Securitized Financial Assets. We monitor the expected cash inflows from our CLO equity investments, including the expected residual payments, and the effective yield is determined and updated periodically.
Dividend income is recorded on the ex-dividend date.
Structuring fees and similar fees are recognized as income as earned, usually when paid. Structuring fees, excess deal deposits, net profits interests and overriding royalty interests are included in other income. See Note 10 for further discussion.
142
Federal and State Income Taxes
We have elected to be treated as a regulated investment company and intend to continue to comply with the requirements of the Code applicable to regulated investment companies. We are required to distribute at least 90% of our investment company taxable income and intend to distribute (or retain through a deemed distribution) all of our investment company taxable income and net capital gain to stockholders; therefore, we have made no provision for income taxes. The character of income and gains that we will distribute is determined in accordance with income tax regulations that may differ from GAAP. Book and tax basis differences relating to stockholder dividends and distributions and other permanent book and tax differences are reclassified to paid-in capital.
If we do not distribute (or are not deemed to have distributed) at least 98% of our annual ordinary income and 98.2% of our capital gains in the calendar year earned, we will generally be required to pay an excise tax equal to 4% of the amount by which 98% of our annual ordinary income and 98.2% of our capital gains exceed the distributions from such taxable income for the year. To the extent that we determine that our estimated current year annual taxable income will be in excess of estimated current year dividend distributions from such taxable income, we accrue excise taxes, if any, on estimated excess taxable income. For the calendar year ended December 31, 2014, we incurred an excise tax expense of $461 because our annual taxable income exceeded our distributions. As of June 30, 2015, we had a payable of $305 for excise taxes as our expected excise tax liability exceeded our excise tax payments through June 30, 2015. This amount is included within accrued expenses on the Consolidated Statement of Assets and Liabilities as of June 30, 2015.
If we fail to satisfy the annual distribution requirement or otherwise fail to qualify as a RIC in any taxable year, we would be subject to tax on all of our taxable income at regular corporate rates. We would not be able to deduct distributions to stockholders, nor would we be required to make distributions. Distributions would generally be taxable to our individual and other non-corporate taxable stockholders as ordinary dividend income eligible for the reduced maximum rate applicable to qualified dividend income to the extent of our current and accumulated earnings and profits, provided certain holding period and other requirements are met. Subject to certain limitations under the Code, corporate distributions would be eligible for the dividends-received deduction. To qualify again to be taxed as a RIC in a subsequent year, we would be required to distribute to our shareholders our accumulated earnings and profits attributable to non-RIC years reduced by an interest charge of 50% of such earnings and profits payable by us as an additional tax. In addition, if we failed to qualify as a RIC for a period greater than two taxable years, then, in order to qualify as a RIC in a subsequent year, we would be required to elect to recognize and pay tax on any net built-in gain (the excess of aggregate gain, including items of income, over aggregate loss that would have been realized if we had been liquidated) or, alternatively, be subject to taxation on such built-in gain recognized for a period of ten years.
We follow ASC 740, Income Taxes (“ASC 740”). ASC 740 provides guidance for how uncertain tax positions should be recognized, measured, presented, and disclosed in the consolidated financial statements. ASC 740 requires the evaluation of tax positions taken or expected to be taken in the course of preparing our tax returns to determine whether the tax positions are “more-likely-than-not” of being sustained by the applicable tax authority. Tax positions not deemed to meet the more-likely-than-not threshold are recorded as a tax benefit or expense in the current year. As of June 30, 2014 and June 30, 2015 and for the years then ended, we did not have a liability for any unrecognized tax benefits. Management’s determinations regarding ASC 740 may be subject to review and adjustment at a later date based upon factors including, but not limited to, an on-going analysis of tax laws, regulations and interpretations thereof. Although we file both federal and state income tax returns, our major tax jurisdiction is federal. Our tax returns for our federal tax years ending August 31, 2012 and thereafter remain subject to examination by the Internal Revenue Service.
Dividends and Distributions
Dividends and distributions to common stockholders are recorded on the ex-dividend date. The amount, if any, to be paid as a monthly dividend or distribution is approved by our Board of Directors quarterly and is generally based upon our management’s estimate of our future earnings. Net realized capital gains, if any, are distributed at least annually.
Financing Costs
We record origination expenses related to our Revolving Credit Facility and Convertible Notes, Public Notes and Prospect Capital InterNotes® (collectively, our “Unsecured Notes”) as deferred financing costs. These expenses are deferred and amortized as part of interest expense using the straight-line method for our Revolving Credit Facility and the effective interest method for our Unsecured Notes over the respective expected life or maturity. In the event that we modify or extinguish our debt before maturity, we follow the guidance in ASC 470-50, Modification and Extinguishments (“ASC 470-50”). For modifications to or exchanges of our Revolving Credit Facility, any unamortized deferred costs relating to lenders who are not part of the new lending group are expensed. For extinguishments of our Unsecured Notes, any unamortized deferred costs are deducted from the carrying amount of the debt in determining the gain or loss from the extinguishment.
143
We record registration expenses related to shelf filings as prepaid assets. These expenses consist principally of SEC registration fees, legal fees and accounting fees incurred. These prepaid assets are charged to capital upon the receipt of proceeds from an equity offering or charged to expense if no offering is completed.
Guarantees and Indemnification Agreements
We follow ASC 460, Guarantees (“ASC 460”). ASC 460 elaborates on the disclosure requirements of a guarantor in its interim and annual consolidated financial statements about its obligations under certain guarantees that it has issued. It also requires a guarantor to recognize, at the inception of a guarantee, for those guarantees that are covered by ASC 460, the fair value of the obligation undertaken in issuing certain guarantees.
Per Share Information
Net increase or decrease in net assets resulting from operations per share is calculated using the weighted average number of common shares outstanding for the period presented. In accordance with ASC 946, convertible securities are not considered in the calculation of net asset value per share.
Recent Accounting Pronouncements
In August 2014, the FASB issued Accounting Standards Update 2014-15, Disclosure of Uncertainties about an Entity’s Ability to Continue as a Going Concern (“ASU 2014-15”). ASU 2014-15 will explicitly require management to assess an entity’s ability to continue as a going concern, and to provide related footnote disclosure in certain circumstances. ASU 2014-15 is effective for annual and interim periods ending after December 15, 2016. Early application is permitted. The adoption of the amended guidance in ASU 2014-15 is not expected to have a significant effect on our consolidated financial statements and disclosures.
In January 2015, the FASB issued Accounting Standards Update 2015-01, Simplifying Income Statement Presentation by Eliminating the Concept of Extraordinary Items (“ASU 2015-01”). ASU 2015-01 simplifies income statement presentation by eliminating the need to determine whether to classify an item as an extraordinary item. ASU 2015-01 is effective for annual and interim periods beginning after December 15, 2015. Early adoption is permitted; however, adoption must occur at the beginning of an annual period. The adoption of the amended guidance in ASU 2015-01 is not expected to have a significant effect on our consolidated financial statements and disclosures.
In February 2015, the FASB issued Accounting Standards Update 2015-02, Amendments to the Consolidation Analysis (“ASU 2015-02”). ASU 2015-02 eliminates the deferral of FAS 167, which allowed reporting entities with interests in certain investment funds to follow the previous consolidation guidance in FIN 46(R), and makes other changes to both the variable interest model and the voting model. ASU 2015-02 is effective for annual and interim periods beginning after December 15, 2015. Early adoption is permitted, including adoption in an interim period. A reporting entity may apply the amendments using a modified retrospective approach by recording a cumulative-effect adjustment to equity as of the beginning of the period of adoption or may apply the amendments retrospectively. We are currently evaluating the effect the adoption of the amended guidance in ASU 2015-02 may have on our consolidated financial statements and disclosures.
In April 2015, the FASB issued Accounting Standards Update 2015-03, Simplifying the Presentation of Debt Issuance Costs (“ASU 2015-03”). ASU 2015-03 requires debt issuance costs related to a recognized debt liability to be presented in the balance sheet as a direct deduction from the debt liability rather than as an asset. The new guidance will make the presentation of debt issuance costs consistent with the presentation of debt discounts or premiums. ASU 2015-03 is effective for financial statements issued for fiscal years beginning after December 15, 2015, and interim periods within those fiscal years. Early adoption is permitted for financial statements that have not been previously issued. The new guidance must be applied on a retrospective basis to all prior periods presented in the financial statements. The adoption of the amended guidance in ASU 2015-03 is not expected to have a significant effect on our consolidated financial statements and disclosures.
144
Note 3. Portfolio Investments
At June 30, 2015, we had investments in 131 long-term portfolio investments, which had an amortized cost of $6,559,376 and a fair value of $6,609,558. At June 30, 2014, we had investments in 142 long-term portfolio investments, which had an amortized cost of $6,371,522 and a fair value of $6,253,739.
The original cost basis of debt placements and equity securities acquired, including follow-on investments for existing portfolio companies, totaled $2,088,988 and $2,952,356 during the years ended June 30, 2015 and June 30, 2014, respectively. Debt repayments and proceeds from sales of equity securities of approximately $1,633,073 and $786,969 were received during the years ended June 30, 2015 and June 30, 2014, respectively.
The following table shows the composition of our investment portfolio as of June 30, 2015 and June 30, 2014.
June 30, 2015 | June 30, 2014 | ||||||||||||||
Cost | Fair Value | Cost | Fair Value | ||||||||||||
Revolving Line of Credit | $ | 30,546 | $ | 30,546 | $ | 3,445 | $ | 2,786 | |||||||
Senior Secured Debt | 3,617,111 | 3,533,447 | 3,578,339 | 3,514,198 | |||||||||||
Subordinated Secured Debt | 1,234,701 | 1,205,303 | 1,272,275 | 1,200,221 | |||||||||||
Subordinated Unsecured Debt | 145,644 | 144,271 | 85,531 | 85,531 | |||||||||||
Small Business Loans | 50,558 | 50,892 | 4,637 | 4,252 | |||||||||||
CLO Debt | 28,613 | 32,398 | 28,118 | 33,199 | |||||||||||
CLO Residual Interest | 1,072,734 | 1,113,023 | 1,044,656 | 1,093,985 | |||||||||||
Equity | 379,469 | 499,678 | 354,521 | 319,567 | |||||||||||
Total Investments | $ | 6,559,376 | $ | 6,609,558 | $ | 6,371,522 | $ | 6,253,739 | |||||||
In the previous table and throughout the remainder of this footnote, we aggregate our portfolio investments by type of investment, which may differ slightly from the nomenclature used by the constituent instruments defining the rights of holders of the investment, as disclosed on our Consolidated Schedules of Investments (“SOI”). The following investments are included in each category:
• | Senior Secured Debt includes investments listed on the SOI such as senior secured term loans, senior term loans, secured promissory notes, senior demand notes, and first lien term loans. |
• | Subordinated Secured Debt includes investments listed on the SOI such as subordinated secured term loans, subordinated term loans, senior subordinated notes, and second lien term loans. |
• | Subordinated Unsecured Debt includes investments listed on the SOI such as subordinated unsecured notes and senior unsecured notes. |
• | Small Business Loans includes our investments in small business whole loans purchased from OnDeck and Direct Capital. |
• | CLO Debt includes our investments in the “debt” class of security of CLO funds. |
• | CLO Residual Interest includes our investments in the “equity” class of security of CLO funds such as income notes, preference shares, and subordinated notes. |
• | Equity includes our investments in preferred stock, common stock, membership interests, net profits interests, net operating income interests, net revenue interests, overriding royalty interests, escrows receivable, and warrants, unless specifically stated otherwise. |
145
The following table shows the fair value of our investments disaggregated into the three levels of the ASC 820 valuation hierarchy as of June 30, 2015.
Level 1 | Level 2 | Level 3 | Total | ||||||||||||
Revolving Line of Credit | $ | — | $ | — | $ | 30,546 | $ | 30,546 | |||||||
Senior Secured Debt | — | — | 3,533,447 | 3,533,447 | |||||||||||
Subordinated Secured Debt | — | — | 1,205,303 | 1,205,303 | |||||||||||
Subordinated Unsecured Debt | — | — | 144,271 | 144,271 | |||||||||||
Small Business Loans | — | — | 50,892 | 50,892 | |||||||||||
CLO Debt | — | — | 32,398 | 32,398 | |||||||||||
CLO Residual Interest | — | — | 1,113,023 | 1,113,023 | |||||||||||
Equity | 260 | — | 499,418 | 499,678 | |||||||||||
Total Investments | $ | 260 | $ | — | $ | 6,609,298 | $ | 6,609,558 | |||||||
The following table shows the fair value of our investments disaggregated into the three levels of the ASC 820 valuation hierarchy as of June 30, 2014.
Level 1 | Level 2 | Level 3 | Total | ||||||||||||
Revolving Line of Credit | $ | — | $ | — | $ | 2,786 | $ | 2,786 | |||||||
Senior Secured Debt | — | — | 3,514,198 | 3,514,198 | |||||||||||
Subordinated Secured Debt | — | — | 1,200,221 | 1,200,221 | |||||||||||
Subordinated Unsecured Debt | — | — | 85,531 | 85,531 | |||||||||||
Small Business Loans | — | — | 4,252 | 4,252 | |||||||||||
CLO Debt | — | — | 33,199 | 33,199 | |||||||||||
CLO Residual Interest | — | — | 1,093,985 | 1,093,985 | |||||||||||
Equity | 168 | — | 319,399 | 319,567 | |||||||||||
Total Investments | $ | 168 | $ | — | $ | 6,253,571 | $ | 6,253,739 | |||||||
146
The following tables show the aggregate changes in the fair value of our Level 3 investments during the year ended June 30, 2015.
Fair Value Measurements Using Unobservable Inputs (Level 3) | |||||||||||||||
Control Investments | Affiliate Investments | Non-Control/ Non-Affiliate Investments | Total | ||||||||||||
Fair value as of June 30, 2014 | $ | 1,640,454 | $ | 32,121 | $ | 4,580,996 | $ | 6,253,571 | |||||||
Net realized losses on investments | (80,640 | ) | — | (99,836 | ) | (180,476 | ) | ||||||||
Net change in unrealized appreciation | 158,346 | 503 | 9,024 | 167,873 | |||||||||||
Net realized and unrealized gains (losses) | 77,706 | 503 | (90,812 | ) | (12,603 | ) | |||||||||
Purchases of portfolio investments | 409,712 | 44,000 | 1,605,999 | 2,059,711 | |||||||||||
Payment-in-kind interest | 22,850 | — | 6,427 | 29,277 | |||||||||||
Amortization of discounts and premiums | — | — | (87,638 | ) | (87,638 | ) | |||||||||
Repayments and sales of portfolio investments | (176,520 | ) | (30,679 | ) | (1,425,821 | ) | (1,633,020 | ) | |||||||
Transfers within Level 3(1) | — | — | — | — | |||||||||||
Transfers in (out) of Level 3(1) | — | — | — | — | |||||||||||
Fair value as of June 30, 2015 | $ | 1,974,202 | $ | 45,945 | $ | 4,589,151 | $ | 6,609,298 | |||||||
Revolving Line of Credit | Senior Secured Debt | Subordinated Secured Debt | Subordinated Unsecured Debt | Small Business Loans | CLO Debt | CLO Residual Interest | Equity | Total | |||||||||||||||||||||||||||
Fair value as of June 30, 2014 | $ | 2,786 | $ | 3,514,198 | $ | 1,200,221 | $ | 85,531 | $ | 4,252 | $ | 33,199 | $ | 1,093,985 | $ | 319,399 | $ | 6,253,571 | |||||||||||||||||
Net realized losses on investments | (1,095 | ) | (36,955 | ) | (77,745 | ) | (6,502 | ) | (2,490 | ) | — | (15,561 | ) | (40,128 | ) | (180,476 | ) | ||||||||||||||||||
Net change in unrealized appreciation (depreciation) | 659 | (19,521 | ) | 42,658 | (1,374 | ) | 719 | (1,296 | ) | (9,043 | ) | 155,071 | 167,873 | ||||||||||||||||||||||
Net realized and unrealized (losses) gains | (436 | ) | (56,476 | ) | (35,087 | ) | (7,876 | ) | (1,771 | ) | (1,296 | ) | (24,604 | ) | 114,943 | (12,603 | ) | ||||||||||||||||||
Purchases of portfolio investments | 58,196 | 1,234,738 | 314,767 | 38,834 | 96,614 | — | 220,779 | 95,783 | 2,059,711 | ||||||||||||||||||||||||||
Payment-in-kind interest | — | 25,695 | 1,412 | 2,170 | — | — | — | — | 29,277 | ||||||||||||||||||||||||||
Accretion (amortization) of discounts and premiums | — | 314 | 3,617 | — | — | 495 | (92,064 | ) | — | (87,638 | ) | ||||||||||||||||||||||||
Repayments and sales of portfolio investments | (30,000 | ) | (1,185,022 | ) | (254,627 | ) | 612 | (48,203 | ) | — | (85,073 | ) | (30,707 | ) | (1,633,020 | ) | |||||||||||||||||||
Transfers within Level 3(1) | — | — | (25,000 | ) | 25,000 | — | — | — | — | — | |||||||||||||||||||||||||
Transfers in (out) of Level 3(1) | — | — | — | — | — | — | — | — | — | ||||||||||||||||||||||||||
Fair value as of June 30, 2015 | $ | 30,546 | $ | 3,533,447 | $ | 1,205,303 | $ | 144,271 | $ | 50,892 | $ | 32,398 | $ | 1,113,023 | $ | 499,418 | $ | 6,609,298 | |||||||||||||||||
(1) | Transfers are assumed to have occurred at the beginning of the quarter during which the asset was transferred. |
147
The following tables show the aggregate changes in the fair value of our Level 3 investments during the year ended June 30, 2014.
Fair Value Measurements Using Unobservable Inputs (Level 3) | |||||||||||||||
Control Investments | Affiliate Investments | Non-Control/ Non-Affiliate Investments | Total | ||||||||||||
Fair value as of June 30, 2013 | $ | 811,634 | $ | 42,443 | $ | 3,318,663 | $ | 4,172,740 | |||||||
Net realized losses on investments | — | — | (3,346 | ) | (3,346 | ) | |||||||||
Net change in unrealized depreciation | (20,519 | ) | (4,500 | ) | (9,894 | ) | (34,913 | ) | |||||||
Net realized and unrealized losses | (20,519 | ) | (4,500 | ) | (13,240 | ) | (38,259 | ) | |||||||
Purchases of portfolio investments | 901,197 | — | 2,036,014 | 2,937,211 | |||||||||||
Payment-in-kind interest | 11,796 | 90 | 3,259 | 15,145 | |||||||||||
Accretion (amortization) of discounts and premiums | — | 399 | (46,696 | ) | (46,297 | ) | |||||||||
Repayments and sales of portfolio investments | (82,263 | ) | (700 | ) | (704,006 | ) | (786,969 | ) | |||||||
Transfers within Level 3(1) | 18,609 | (5,611 | ) | (12,998 | ) | — | |||||||||
Transfers in (out) of Level 3(1) | — | — | — | — | |||||||||||
Fair value as of June 30, 2014 | $ | 1,640,454 | $ | 32,121 | $ | 4,580,996 | $ | 6,253,571 | |||||||
Revolving Line of Credit | Senior Secured Debt | Subordinated Secured Debt | Subordinated Unsecured Debt | Small Business Loans | CLO Debt | CLO Residual Interest | Equity | Total | |||||||||||||||||||||||||||
Fair value as of June 30, 2013 | $ | 8,729 | $ | 2,207,091 | $ | 1,024,901 | $ | 88,827 | $ | — | $ | 28,589 | $ | 658,086 | $ | 156,517 | $ | 4,172,740 | |||||||||||||||||
Net realized (losses) gains on investments | — | (1,593 | ) | (7,558 | ) | — | — | — | 1,183 | 4,622 | (3,346 | ) | |||||||||||||||||||||||
Net change in unrealized (depreciation) appreciation | (150 | ) | (8,907 | ) | (34,566 | ) | (357 | ) | (386 | ) | 4,159 | 51,864 | (46,570 | ) | (34,913 | ) | |||||||||||||||||||
Net realized and unrealized (losses) gains | (150 | ) | (10,500 | ) | (42,124 | ) | (357 | ) | (386 | ) | 4,159 | 53,047 | (41,948 | ) | (38,259 | ) | |||||||||||||||||||
Purchases of portfolio investments | 14,850 | 1,692,284 | 554,973 | — | 6,540 | — | 453,492 | 215,072 | 2,937,211 | ||||||||||||||||||||||||||
Payment-in-kind interest | — | 13,850 | 428 | 867 | — | — | — | — | 15,145 | ||||||||||||||||||||||||||
Accretion (amortization) of discounts and premiums | — | 683 | 2,065 | 73 | — | 451 | (49,569 | ) | — | (46,297 | ) | ||||||||||||||||||||||||
Repayments and sales of portfolio investments | (20,643 | ) | (389,210 | ) | (270,022 | ) | (73,879 | ) | (1,902 | ) | — | (21,071 | ) | (10,242 | ) | (786,969 | ) | ||||||||||||||||||
Transfers within Level 3(1) | — | — | (70,000 | ) | 70,000 | — | — | — | — | — | |||||||||||||||||||||||||
Transfers in (out) of Level 3(1) | — | — | — | — | — | — | — | — | — | ||||||||||||||||||||||||||
Fair value as of June 30, 2014 | $ | 2,786 | $ | 3,514,198 | $ | 1,200,221 | $ | 85,531 | $ | 4,252 | $ | 33,199 | $ | 1,093,985 | $ | 319,399 | $ | 6,253,571 | |||||||||||||||||
(1) | Transfers are assumed to have occurred at the beginning of the quarter during which the asset was transferred. |
For the years ended June 30, 2015 and June 30, 2014, the net change in unrealized appreciation (depreciation) on the investments that use Level 3 inputs was $82,432 and $(27,973) for investments still held as of June 30, 2015 and June 30, 2014, respectively.
148
The ranges of unobservable inputs used in the fair value measurement of our Level 3 investments as of June 30, 2015 were as follows:
Unobservable Input | ||||||||||||
Asset Category | Fair Value | Primary Valuation Technique | Input | Range | Weighted Average | |||||||
Senior Secured Debt | $ | 2,421,188 | Yield Analysis | Market Yield | 6.1%-21.4% | 11.3% | ||||||
Senior Secured Debt | 563,050 | EV Analysis | EBITDA Multiple | 3.5x-11.0x | 8.1x | |||||||
Senior Secured Debt(1) | 64,560 | EV Analysis | Loss-Adjusted Discount Rate | 3.8%-10.7% | 6.9% | |||||||
Senior Secured Debt(2) | 98,025 | EV Analysis | Loss-Adjusted Discount Rate | 5.4%-16.3% | 10.0% | |||||||
Senior Secured Debt | 40,808 | EV Analysis | Discount Rate | 7.0%-9.0% | 8.0% | |||||||
Senior Secured Debt | 25,970 | EV Analysis | Appraisal | N/A | N/A | |||||||
Senior Secured Debt | 6,918 | Liquidation Analysis | N/A | N/A | N/A | |||||||
Senior Secured Debt | 343,474 | Net Asset Value Analysis | Capitalization Rate | 5.6%-7.0% | 6.0% | |||||||
Subordinated Secured Debt | 847,624 | Yield Analysis | Market Yield | 8.1%-18.3% | 12.5% | |||||||
Subordinated Secured Debt | 54,948 | EV Analysis | EBITDA Multiple | 3.5x-6.0x | 4.7x | |||||||
Subordinated Secured Debt | 302,731 | EV Analysis | Book Value Multiple | 1.2x-3.8x | 2.7x | |||||||
Subordinated Unsecured Debt | 112,701 | Yield Analysis | Market Yield | 9.1%-15.3% | 11.8% | |||||||
Subordinated Unsecured Debt | 31,570 | EV Analysis | EBITDA Multiple | 5.8x-8.0x | 7.2x | |||||||
Small Business Loans(3) | 362 | Discounted Cash Flow | Loss-Adjusted Discount Rate | 11.7%-27.3% | 23.5% | |||||||
Small Business Loans(4) | 50,530 | Discounted Cash Flow | Loss-Adjusted Discount Rate | 20.4%-33.2% | 24.9% | |||||||
CLO Debt | 32,398 | Discounted Cash Flow | Discount Rate | 6.1%-6.9% | 6.5% | |||||||
CLO Residual Interest | 1,113,023 | Discounted Cash Flow | Discount Rate | 11.2%-18.0% | 14.0% | |||||||
Equity | 139,424 | EV Analysis | EBITDA Multiple | 2.0x-11.0x | 8.5x | |||||||
Equity | 148,631 | EV Analysis | Book Value Multiple | 1.2x-3.8x | 2.5x | |||||||
Equity | 1,120 | EV Analysis | Appraisal | N/A | N/A | |||||||
Equity | 3,023 | Yield Analysis | Market Yield | 19.8%-24.7% | 22.2% | |||||||
Equity | 130,316 | Net Asset Value Analysis | Capitalization Rate | 5.6%-7.0% | 5.9% | |||||||
Equity | 28,133 | Discounted Cash Flow | Discount Rate | 7.0%-9.0% | 8.0% | |||||||
Participating Interest(5) | 42,765 | Yield Analysis | Market Yield | 11.5%-18.0% | 12.5% | |||||||
Participating Interest(5) | 22 | Liquidation Analysis | N/A | N/A | N/A | |||||||
Escrow Receivable | 5,984 | Discounted Cash Flow | Discount Rate | 7.0%-8.2% | 7.6% | |||||||
Total Level 3 Investments | $ | 6,609,298 | ||||||||||
(1) | EV analysis is based on the fair value of our investments in consumer loans purchased from Prosper, which are valued using a discounted cash flow valuation technique. The key unobservable input to the discounted cash flow analysis is noted above. In addition, the valuation also used projected loss rates as an unobservable input ranging from 0.6%-26.5%, with a weighted average of 8.4%. |
(2) | EV analysis is based on the fair value of our investments in consumer loans purchased from Lending Club, which are valued using a discounted cash flow valuation technique. The key unobservable input to the discounted cash flow analysis is noted above. In addition, the valuation also used projected loss rates as an unobservable input ranging from 2.3%-23.8%, with a weighted average of 16.9%. |
(3) | Includes our investments in small business whole loans purchased from Direct Capital. Valuation also used projected loss rates as an unobservable input ranging from 0.03%-60.0%, with a weighted average of 42.3%. |
(4) | Includes our investments in small business whole loans purchased from OnDeck. Valuation also used projected loss rates as an unobservable input ranging from 4.2%-11.7%, with a weighted average of 9.7%. |
(5) | Participating Interest includes our participating equity investments, such as net profits interests, net operating income interests, net revenue interests, and overriding royalty interests. |
149
The ranges of unobservable inputs used in the fair value measurement of our Level 3 investments as of June 30, 2014 were as follows:
Unobservable Input | ||||||||||||
Asset Category | Fair Value | Primary Valuation Technique | Input | Range | Weighted Average | |||||||
Senior Secured Debt | $ | 2,550,073 | Yield Analysis | Market Yield | 5.5%-20.3% | 11.1% | ||||||
Senior Secured Debt | 560,485 | EV Analysis | EBITDA Multiple | 3.5x-9.0x | 7.1x | |||||||
Senior Secured Debt | 110,525 | EV Analysis | Other | N/A | N/A | |||||||
Senior Secured Debt | 3,822 | Liquidation Analysis | N/A | N/A | N/A | |||||||
Senior Secured Debt | 292,079 | Net Asset Value Analysis | Capitalization Rate | 4.5%-10.0% | 7.4% | |||||||
Subordinated Secured Debt | 832,181 | Yield Analysis | Market Yield | 8.7%-14.7% | 10.9% | |||||||
Subordinated Secured Debt | 353,220 | EV Analysis | EBITDA Multiple | 4.5x-8.2x | 6.2x | |||||||
Subordinated Secured Debt | 14,820 | EV Analysis | Book Value Multiple | 1.2x-1.4x | 1.3x | |||||||
Subordinated Unsecured Debt | 85,531 | Yield Analysis | Market Yield | 7.4%-14.4% | 12.1% | |||||||
Small Business Loans | 4,252 | Yield Analysis | Market Yield | 75.5%-79.5% | 77.5% | |||||||
CLO Debt | 33,199 | Discounted Cash Flow | Discount Rate | 4.2%-5.8% | 4.9% | |||||||
CLO Residual Interest | 1,093,985 | Discounted Cash Flow | Discount Rate | 10.4%-23.7% | 16.8% | |||||||
Equity | 222,059 | EV Analysis | EBITDA Multiple | 2.0x-15.3x | 5.3x | |||||||
Equity | 15,103 | EV Analysis | Book Value Multiple | 1.2x-1.4x | 1.3x | |||||||
Equity | 3,171 | Yield Analysis | Market Yield | 13.7%-16.5% | 15.1% | |||||||
Equity | 63,157 | Net Asset Value Analysis | Capitalization Rate | 4.5%-10.0% | 7.4% | |||||||
Equity | 14,107 | Discounted Cash Flow | Discount Rate | 8.0%-10.0% | 9.0% | |||||||
Participating Interest(1) | 213 | Liquidation Analysis | N/A | N/A | N/A | |||||||
Escrow Receivable | 1,589 | Discounted Cash Flow | Discount Rate | 6.6%-7.8% | 7.2% | |||||||
Total Level 3 Investments | $ | 6,253,571 | ||||||||||
(1) | Participating Interest includes our participating equity investments, such as net profits interests, net operating income interests, net revenue interests, and overriding royalty interests. |
In determining the range of value for debt instruments except CLOs and debt investments in controlling portfolio companies, management and the independent valuation firm generally estimated corporate and security credit ratings and identified corresponding yields to maturity for each loan from relevant market data. A discounted cash flow analysis was then prepared using the appropriate yield to maturity as the discount rate, to determine range of value. For non-traded equity investments, the enterprise value was determined by applying earnings before income tax, depreciation and amortization (“EBITDA”) multiples, net income multiples, or book value multiples for similar guideline public companies and/or similar recent investment transactions. For stressed equity investments, a liquidation analysis was prepared. For the private REIT investments, enterprise values were determined based on an average of results from a net asset value analysis of the underlying property investments and a dividend yield analysis utilizing capitalization rates and dividend yields, respectively, for similar guideline companies and/or similar recent investment transactions.
In determining the range of value for our investments in CLOs, management and the independent valuation firm used a discounted cash flow model. The valuations were accomplished through the analysis of the CLO deal structures to identify the risk exposures from the modeling point of view as well as to determine an appropriate call date. For each CLO security, the most appropriate valuation approach was chosen from alternative approaches to ensure the most accurate valuation for such security. A waterfall engine was used to store the collateral data, generate collateral cash flows from the assets based on various assumptions for the risk factors, distribute the cash flows to the liability structure based on the payment priorities, and discount them back using proper discount rates to expected maturity or call date.
150
CLO investments may be riskier and less transparent to us than direct investments in underlying companies. CLOs typically will have no significant assets other than their underlying senior secured loans. Therefore, payments on CLO investments are and will be payable solely from the cash flows from such senior secured loans. Our CLO investments are exposed to leveraged credit risk. If certain minimum collateral value ratios and/or interest coverage ratios are not met by a CLO, primarily due to senior secured loan defaults, then cash flow that otherwise would have been available to pay distributions to us on our CLO investments may instead be used to redeem any senior notes or to purchase additional senior secured loans, until the ratios again exceed the minimum required levels or any senior notes are repaid in full. Our CLO investments and/or the underlying senior secured loans may prepay more quickly than expected, which could have an adverse impact on our value. We are not responsible for and have no influence over the asset management of the portfolios underlying the CLO investments we hold as those portfolios are managed by non-affiliated third party CLO collateral managers.
The significant unobservable input used to value our investments based on the yield analysis and discounted cash flow analysis is the market yield (or applicable discount rate) used to discount the estimated future cash flows expected to be received from the underlying investment, which includes both future principal and interest/dividend payments. Increases or decreases in the market yield (or applicable discount rate) would result in a decrease or increase, respectively, in the fair value measurement. Management and the independent valuation firm consider the following factors when selecting market yields or discount rates: risk of default, rating of the investment and comparable company investments, and call provisions.
The significant unobservable inputs used to value our investments based on the EV analysis may include market multiples of specified financial measures such as EBITDA, net income, or book value of identified guideline public companies, implied valuation multiples from precedent M&A transactions, and/or discount rates applied in a discounted cash flow analysis. The independent valuation firm identifies a population of publicly traded companies with similar operations and key attributes to that of the portfolio company. Using valuation and operating metrics of these guideline public companies and/or as implied by relevant precedent transactions, a range of multiples of the latest twelve months EBITDA, or other measure such as net income or book value, is typically calculated. The independent valuation firm utilizes the determined multiples to estimate the portfolio company’s EV generally based on the latest twelve months EBITDA of the portfolio company (or other meaningful measure). Increases or decreases in the multiple may result in an increase or decrease, respectively, in EV which may increase or decrease the fair value measurement of the debt and/or equity investment, as applicable. In certain instances, a discounted cash flow analysis may be considered in estimating EV, in which case, discount rates based on a weighted average cost of capital and application of the Capital Asset Pricing Model may be utilized.
The significant unobservable input used to value our investments based on the net asset value analysis is the capitalization rate applied to the earnings measure of the underlying property. Increases or decreases in the capitalization rate would result in a decrease or increase, respectively, in the fair value measurement.
Changes in market yields, discount rates, capitalization rates or EBITDA multiples, each in isolation, may change the fair value measurement of certain of our investments. Generally, an increase in market yields, discount rates or capitalization rates, or a decrease in EBITDA (or other) multiples may result in a decrease in the fair value measurement of certain of our investments.
Due to the inherent uncertainty of determining the fair value of investments that do not have a readily available market value, the fair value of our investments may fluctuate from period to period. Additionally, the fair value of our investments may differ significantly from the values that would have been used had a ready market existed for such investments and may differ materially from the values that we may ultimately realize. Further, such investments are generally subject to legal and other restrictions on resale or otherwise are less liquid than publicly traded securities. If we were required to liquidate a portfolio investment in a forced or liquidation sale, we could realize significantly less than the value at which we have recorded it.
In addition, changes in the market environment and other events that may occur over the life of the investments may cause the gains or losses ultimately realized on these investments to be different than the unrealized gains or losses reflected in the currently assigned valuations.
During the year ended June 30, 2015, the valuation methodology for American Gilsonite Company (“AGC”) changed to incorporate secondary trade data in addition to the yield analysis used in previous periods. As a result of this change, and in recognition of recent company performance and current market conditions, we decreased the fair value of our investment in AGC to $14,287 as of June 30, 2015, a discount of $1,468 from its amortized cost, compared to the $3,477 unrealized appreciation recorded at June 30, 2014.
151
During the year ended June 30, 2015, the valuation methodology for CCPI Inc. (“CCPI”) changed to solely an EV analysis by removing the discounted cash flow used in previous periods. Management adopted this change due to a lack of long-term forecasts for CCPI. As a result of this change, and in recognition of recent company performance and current market conditions, we increased the fair value of our investment in CCPI to $41,352 as of June 30, 2015, a premium of $7,192 to its amortized cost, compared to the $1,443 unrealized depreciation recorded at June 30, 2014.
During the year ended June 30, 2015, the valuation methodology for Edmentum, Inc. (“Edmentum”) changed to an EV analysis in place of the yield analysis used in previous periods. Management adopted this change due to the company’s debt restructuring in June 2015, through which Prospect became the largest shareholder of the company. As a result of this change, and in recognition of recent company performance and subsequent other-than-temporary impairment, we decreased the fair value of our investment in Edmentum to $37,216 as of June 30, 2015, equal to its amortized cost, compared to the $1,561 unrealized appreciation recorded at June 30, 2014.
During the year ended June 30, 2015, the valuation methodology for Empire Today, LLC (“Empire Today”) changed to incorporate an EV analysis and secondary trade data in addition to the yield analysis used in previous periods. Management adopted the EV analysis due to a deterioration in operating results and resulting credit impairment. As a result of this change, and in recognition of recent company performance and current market conditions, we decreased the fair value of our investment in Empire Today to $13,070 as of June 30, 2015, a discount of $2,448 from its amortized cost, compared to the $281 unrealized appreciation recorded at June 30, 2014.
During the year ended June 30, 2015, the valuation methodology for Gulf Coast Machine & Supply Company (“Gulf Coast”) changed to a liquidation analysis in place of the EV analysis used in previous periods. Management adopted the liquidation analysis due to a deterioration in operating results, resulting credit impairment, and the unavailability of revised budget figures. As a result of this change, and in recognition of recent company performance and current market conditions, we decreased the fair value of our investment in Gulf Coast to $6,918 as of June 30, 2015, a discount of $45,032 from its amortized cost, compared to the $28,991 unrealized depreciation recorded at June 30, 2014.
During the year ended June 30, 2015, the valuation methodology for ICON Health & Fitness, Inc. (“ICON”) changed to incorporate secondary trade data in addition to the yield analysis used in previous periods. As a result of this change, and in recognition of recent company performance and current market conditions, we increased the fair value of our investment in ICON to $16,100 as of June 30, 2015, a discount of $3 from its amortized cost, compared to the $1,116 unrealized depreciation recorded at June 30, 2014.
During the year ended June 30, 2015, the valuation methodology for Prince Mineral Holding Corp. (“Prince”) changed to incorporate secondary trade data in addition to the yield analysis used in previous periods. As a result of this change, and in recognition of recent company performance and current market conditions, we decreased the fair value of our investment in Prince to $9,458 as of June 30, 2015, a discount of $457 from its amortized cost, compared to the $98 unrealized appreciation recorded at June 30, 2014.
During the year ended June 30, 2015, the valuation methodology for Targus Group International, Inc. (“Targus”) changed to incorporate an EV analysis in place of the yield analysis used in previous periods. Management adopted the EV analysis due to a deterioration in operating results and resulting credit impairment. As a result of this change, and in recognition of recent company performance and current market conditions, we decreased the fair value of our investment in Targus to $17,233 as of June 30, 2015, a discount of $4,145 from its amortized cost, compared to the $1,748 unrealized depreciation recorded at June 30, 2014.
During the year ended June 30, 2015, the valuation methodology for United Sporting Companies, Inc. (“USC”) changed to incorporate an EV analysis in addition to the yield analysis used in previous periods. Management adopted the EV analysis due to a deterioration in operating results and resulting credit impairment. As a result of this change, and in recognition of recent company performance and current market conditions, we decreased the fair value of our investment in USC to $145,618 as of June 30, 2015, a discount of $12,620 from its amortized cost, compared to being valued at cost at June 30, 2014.
152
During the year ended June 30, 2015, we provided $1,381 and $107 of debt and equity financing, respectively, to American Property REIT Corp. (“APRC”) for the acquisition of real estate properties and to fund capital expenditures for existing properties. During the year ended June 30, 2015, APRC transferred its investments in certain properties to National Property REIT Corp. (“NPRC”). As a result, our investments in APRC related to these properties also transferred to NPRC. The investments transferred consisted of $12,985 of equity and $95,576 of debt. There was no gain or loss realized on these transactions. In addition, during the year ended June 30, 2015, we received $8 as a return of capital on the equity investment in APRC. As of June 30, 2015, our investment in APRC had an amortized cost of $100,192 and a fair value of $118,256.
As of June 30, 2015, APRC’s real estate portfolio was comprised of twelve multi-family properties and one commercial property. The following table shows the location, acquisition date, purchase price, and mortgage outstanding due to other parties for each of the properties held by APRC as of June 30, 2015.
No. | Property Name | City | Acquisition Date | Purchase Price | Mortgage Outstanding | |||||||||
1 | 1557 Terrell Mill Road, LLC | Marietta, GA | 12/28/2012 | $ | 23,500 | $ | 15,164 | |||||||
2 | Lofton Place, LLC | Tampa, FL | 4/30/2013 | 26,000 | 16,965 | |||||||||
3 | Vista Palma Sola, LLC | Bradenton, FL | 4/30/2013 | 27,000 | 17,550 | |||||||||
4 | Arlington Park Marietta, LLC | Marietta, GA | 5/8/2013 | 14,850 | 9,650 | |||||||||
5 | Cordova Regency, LLC | Pensacola, FL | 11/15/2013 | 13,750 | 9,026 | |||||||||
6 | Crestview at Oakleigh, LLC | Pensacola, FL | 11/15/2013 | 17,500 | 11,488 | |||||||||
7 | Inverness Lakes, LLC | Mobile, AL | 11/15/2013 | 29,600 | 19,400 | |||||||||
8 | Kings Mill Pensacola, LLC | Pensacola, FL | 11/15/2013 | 20,750 | 13,622 | |||||||||
9 | Plantations at Pine Lake, LLC | Tallahassee, FL | 11/15/2013 | 18,000 | 11,817 | |||||||||
10 | Verandas at Rock Ridge, LLC | Birmingham, AL | 11/15/2013 | 15,600 | 10,205 | |||||||||
11 | Plantations at Hillcrest, LLC | Mobile, AL | 1/17/2014 | 6,930 | 4,972 | |||||||||
12 | Crestview at Cordova, LLC | Pensacola, FL | 1/17/2014 | 8,500 | 4,950 | |||||||||
13 | Taco Bell, OK | Yukon, OK | 6/4/2014 | 1,719 | — | |||||||||
$ | 223,699 | $ | 144,809 | |||||||||||
153
During the year ended June 30, 2015, we provided $171,850 and $52,350 of debt and equity financing, respectively, to NPRC to enable certain of its wholly-owned subsidiaries to invest in online consumer loans. In addition, during the year ended June 30, 2015, we received partial repayments of $32,883 of the loans previously outstanding and $5,577 as a return of capital on the equity investment in NPRC.
The online consumer loan investments held by certain of NPRC’s wholly-owned subsidiaries are unsecured obligations of individual borrowers that are issued in amounts ranging from $1 to $35, with fixed interest rates and fixed terms of either 36 or 60 months. As of June 30, 2015, the investment in online consumer loans by certain of NPRC’s wholly-owned subsidiaries had a fair value of $366,014. The average outstanding individual loan balance is approximately $9 and the loans mature on dates ranging from October 31, 2016 to June 29, 2020. Fixed interest rates range from 5.3% to 29.0% with a weighted-average current interest rate of 19.6%.
During the year ended June 30, 2015, we provided $12,046 and $2,077 of debt and equity financing, respectively, to NPRC for the acquisition of real estate properties and to fund capital expenditures for existing properties. During the year ended June 30, 2015, APRC and United Property REIT Corp. (“UPRC”) transferred their investments in certain properties to NPRC. As a result, our investments in APRC and UPRC related to these properties also transferred to NPRC. The investments transferred consisted of $14,266 of equity and $105,020 of debt. There was no gain or loss realized on these transactions. As of June 30, 2015, our investment in NPRC had an amortized cost of $449,660 and a fair value of $471,889.
As of June 30, 2015, NPRC’s real estate portfolio was comprised of eleven multi-family properties and thirteen commercial properties. The following table shows the location, acquisition date, purchase price, and mortgage outstanding due to other parties for each of the properties held by NPRC as of June 30, 2015.
No. | Property Name | City | Acquisition Date | Purchase Price | Mortgage Outstanding | |||||||||
1 | 146 Forest Parkway, LLC | Forest Park, GA | 10/24/2012 | $ | 7,400 | $ | — | |||||||
2 | 5100 Live Oaks Blvd, LLC | Tampa, FL | 1/17/2013 | 63,400 | 39,600 | |||||||||
3 | NPRC Carroll Resort, LLC | Pembroke Pines, FL | 6/24/2013 | 225,000 | 157,500 | |||||||||
4 | APH Carroll 41, LLC | Marietta, GA | 11/1/2013 | 30,600 | 22,097 | |||||||||
5 | Matthews Reserve II, LLC | Matthews, NC | 11/19/2013 | 22,063 | 17,571 | |||||||||
6 | City West Apartments II, LLC | Orlando, FL | 11/19/2013 | 23,562 | 18,533 | |||||||||
7 | Vinings Corner II, LLC | Smyrna, GA | 11/19/2013 | 35,691 | 26,640 | |||||||||
8 | Uptown Park Apartments II, LLC | Altamonte Springs, FL | 11/19/2013 | 36,590 | 27,471 | |||||||||
9 | Mission Gate II, LLC | Plano, TX | 11/19/2013 | 47,621 | 36,148 | |||||||||
10 | St. Marin Apartments II, LLC | Coppell, TX | 11/19/2013 | 73,078 | 53,863 | |||||||||
11 | APH Carroll Bartram Park, LLC | Jacksonville, FL | 12/31/2013 | 38,000 | 28,500 | |||||||||
12 | APH Carroll Atlantic Beach, LLC | Atlantic Beach, FL | 1/31/2014 | 13,025 | 8,916 | |||||||||
13 | 23 Mile Road Self Storage, LLC | Chesterfield, MI | 8/19/2014 | 5,804 | 4,350 | |||||||||
14 | 36th Street Self Storage, LLC | Wyoming, MI | 8/19/2014 | 4,800 | 3,600 | |||||||||
15 | Ball Avenue Self Storage, LLC | Grand Rapids, MI | 8/19/2014 | 7,281 | 5,460 | |||||||||
16 | Ford Road Self Storage, LLC | Westland, MI | 8/29/2014 | 4,642 | 3,480 | |||||||||
17 | Ann Arbor Kalamazoo Self Storage, LLC | Ann Arbor, MI | 8/29/2014 | 4,458 | 3,345 | |||||||||
18 | Ann Arbor Kalamazoo Self Storage, LLC | Scio, MI | 8/29/2014 | 8,927 | 6,695 | |||||||||
19 | Ann Arbor Kalamazoo Self Storage, LLC | Kalamazoo, MI | 8/29/2014 | 2,363 | 1,775 | |||||||||
20 | Jolly Road Self Storage, LLC | Okemos, MI | 1/16/2015 | 7,492 | 5,620 | |||||||||
21 | Eaton Rapids Road Self Storage, LLC | Lansing West, MI | 1/16/2015 | 1,741 | 1,305 | |||||||||
22 | Haggerty Road Self Storage, LLC | Novi, MI | 1/16/2015 | 6,700 | 5,025 | |||||||||
23 | Waldon Road Self Storage, LLC | Lake Orion, MI | 1/16/2015 | 6,965 | 5,225 | |||||||||
24 | Tyler Road Self Storage, LLC | Ypsilanti, MI | 1/16/2015 | 3,507 | 2,630 | |||||||||
$ | 680,710 | $ | 485,349 | |||||||||||
154
During the year ended June 30, 2015, we provided $53,022 and $9,100 of debt and equity financing, respectively, to UPRC for the acquisition of certain properties and to fund capital expenditures for existing properties. During the year ended June 30, 2015, UPRC transferred its investments in certain properties to NPRC. As a result, our investments in UPRC related to these properties also transferred to NPRC. The investments transferred consisted of $1,281 of equity and $9,444 of debt. There was no gain or loss realized on the transaction. As of June 30, 2015, our investment in UPRC had an amortized cost of $75,628 and a fair value of $84,685.
As of June 30, 2015, UPRC’s real estate portfolio was comprised of fifteen multi-families properties and one commercial property. The following table shows the location, acquisition date, purchase price, and mortgage outstanding due to other parties for each of the properties held by UPRC as of June 30, 2015.
No. | Property Name | City | Acquisition Date | Purchase Price | Mortgage Outstanding | |||||||||
1 | Atlanta Eastwood Village LLC | Stockbridge, GA | 12/12/2013 | $ | 25,957 | $ | 19,785 | |||||||
2 | Atlanta Monterey Village LLC | Jonesboro, GA | 12/12/2013 | 11,501 | 9,193 | |||||||||
3 | Atlanta Hidden Creek LLC | Morrow, GA | 12/12/2013 | 5,098 | 3,619 | |||||||||
4 | Atlanta Meadow Springs LLC | College Park, GA | 12/12/2013 | 13,116 | 10,180 | |||||||||
5 | Atlanta Meadow View LLC | College Park, GA | 12/12/2013 | 14,354 | 11,141 | |||||||||
6 | Atlanta Peachtree Landing LLC | Fairburn, GA | 12/12/2013 | 17,224 | 13,575 | |||||||||
7 | Taco Bell, MO | Marshall, MO | 6/4/2014 | 1,405 | — | |||||||||
8 | Canterbury Green Apartments Holdings LLC | Fort Wayne, IN | 9/29/2014 | 85,500 | 65,825 | |||||||||
9 | Abbie Lakes OH Partners, LLC | Canal Winchester, OH | 9/30/2014 | 12,600 | 10,440 | |||||||||
10 | Kengary Way OH Partners, LLC | Reynoldsburg, OH | 9/30/2014 | 11,500 | 11,000 | |||||||||
11 | Lakeview Trail OH Partners, LLC | Canal Winchester, OH | 9/30/2014 | 26,500 | 20,142 | |||||||||
12 | Lakepoint OH Partners, LLC | Pickerington, OH | 9/30/2014 | 11,000 | 10,080 | |||||||||
13 | Sunbury OH Partners, LLC | Columbus, OH | 9/30/2014 | 13,000 | 10,480 | |||||||||
14 | Heatherbridge OH Partners, LLC | Blacklick, OH | 9/30/2014 | 18,416 | 15,480 | |||||||||
15 | Jefferson Chase OH Partners, LLC | Blacklick, OH | 9/30/2014 | 13,551 | 12,240 | |||||||||
16 | Goldenstrand OH Partners, LLC | Hilliard, OH | 10/29/2014 | 7,810 | 8,040 | |||||||||
$ | 288,532 | $ | 231,220 | |||||||||||
On January 4, 2012, Energy Solutions Holdings Inc. (“Energy Solutions”) sold its gas gathering and processing assets held in Gas Solutions II Ltd. (“Gas Solutions”) for a potential sale price of $199,805, adjusted for the final working capital settlement, including a potential earn-out of $28,000 that may be paid based on the future performance of Gas Solutions. After expenses, including structuring fees of $9,966 paid to us, and $3,152 of third-party expenses, Gas Solutions LP LLC and Gas Solutions GP LLC, subsidiaries of Gas Solutions, received $157,100 and $1,587 in cash, respectively, and subsequently distributed these amounts, $158,687 in total, to Energy Solutions. On June 4, 2014, Gas Solutions GP LLC and Gas Solutions LP LLC merged with and into Freedom Marine Solutions, LLC (f/k/a Freedom Marine Services Holdings, LLC) (“Freedom Marine”), another subsidiary of Energy Solutions, with Freedom Marine as the surviving entity. On December 29, 2014, Freedom Marine reached a settlement for and received $5,174, net of third-party obligations, related to the contingent earn-out from the sale of Gas Solutions in January 2012 which was retained by Freedom Marine. This is a final settlement and no further payments are expected from the sale.
On August 6, 2013, we received a distribution of $4,065 related to our investment in NRG Manufacturing, Inc. (“NRG”) for which we realized a gain of $3,252. This was a partial release of the amount held in escrow. On February 17, 2015, we received a distribution of $7,140 related to our investment in NRG for which we realized a gain of $4,647. This was a full release of the amount held in escrow. The $7,140 distribution received from NRG included $1,739 as reimbursement for legal, tax and portfolio level accounting services provided directly to NRG for which Prospect received payment on behalf of Prospect Administration (no direct income was recognized by Prospect, but Prospect was given credit for these payments as a reduction of the administrative services costs payable by Prospect to Prospect Administration).
On October 31, 2013, we sold $18,755 of the National Bankruptcy Services, LLC loan receivable. The loan receivable was sold at a discount and we realized a loss of $7,853.
During the year ended June 30, 2014, Energy Solutions repaid $8,500 of our subordinated secured debt to us. In addition to the repayment of principal, we received $4,812 of make-whole fees for early repayment of the outstanding loan receivables, which was recorded as additional interest income during the year ended June 30, 2014.
155
On November 25, 2013, we provided $13,000 in senior secured debt financing for the recapitalization of our investment in Freedom Marine. The subordinated secured loan to Jettco Marine Services, LLC, a subsidiary of Freedom Marine, was replaced with a senior secured note to Vessel Company II, LLC (f/k/a Vessel Holdings II, LLC) (“Vessel II”), a new subsidiary of Freedom Marine. On December 3, 2013, we made a $16,000 senior secured investment in Vessel Company III, LLC (f/k/a Vessel Holdings III, LLC), another new subsidiary of Freedom Marine. Overall the restructuring of our investment in Freedom Marine provided approximately $16,000 net senior secured debt financing to support the acquisition of two new vessels. We received $2,480 of structuring fees from Energy Solutions related to the Freedom Marine restructuring which was recognized as other income during the year ended June 30, 2014.
During the year ended June 30, 2014, we received an $8,000 fee from First Tower Holdings of Delaware LLC (“First Tower Delaware”) related to the renegotiation and expansion of First Tower’s revolver in December 2013 which was recorded as other income and we provided an additional $8,500 and $1,500 of senior secured first-lien and common equity financing, respectively, to First Tower Delaware.
During the year ended June 30, 2014, we provided an additional $7,600 of subordinated secured financing to AMU Holdings Inc. (“AMU”). During the year ended June 30, 2014, we received distributions of $12,000 from AMU which were recorded as dividend income.
On March 31, 2014, we invested $246,250 in cash and 2,306,294 unregistered shares of our common stock to support the recapitalization of Harbortouch Payments, LLC (f/k/a United Bank Card, Inc. (d/b/a Harbortouch)), a provider of transaction processing services and point-of-sale equipment used by merchants across the United States. We invested $24,898 of equity and $123,000 of debt in Harbortouch Holdings of Delaware Inc., the newly-formed holding company, and $130,796 of debt in Harbortouch Payments, LLC, the operating company (collectively, “Harbortouch”). Through the recapitalization, we acquired a controlling interest in Harbortouch Holdings of Delaware Inc. After the recapitalization, we received repayment of the $23,894 loan previously outstanding. We received structuring fees of $7,536 related to our investment in Harbortouch which were recognized as other income during the year ended June 30, 2014.
On March 31, 2014, we provided $78,521 of debt and $14,107 of equity financing to Echelon Aviation LLC (“Echelon”), a newly established portfolio company which provides liquidity alternatives on aviation assets. In connection with our investment, we received a structuring fee of $2,771 from Echelon which was recognized as other income during the year ended June 30, 2014.
On August 1, 2014, we sold our investments in Airmall Inc. (“Airmall”) for net proceeds of $51,379 and realized a loss of $3,473 on the sale. In addition, there is $6,000 being held in escrow, of which 98% is due to Prospect, which will be recognized as an additional realized loss if it is not received. Included in the net proceeds were $3,000 of structuring fees from Airmall related to the sale of the operating company which was recognized as other income during the year ended June 30, 2015. On October 22, 2014, we received a tax refund of $665 related to our investment in Airmall for which we realized a gain of the same amount.
On August 20, 2014, we sold the assets of Borga, Inc., a wholly-owned subsidiary of STI Holding, Inc. (“STI”), for net proceeds of $382 and realized a loss of $2,589 on the sale. On December 29, 2014, Borga was dissolved.
On August 25, 2014, we sold Boxercraft Incorporated, a wholly-owned subsidiary of BXC Company, Inc. (“BXC”), for net proceeds of $750 and realized a net loss of $16,949 on the sale.
On September 30, 2014, we made a $26,431 follow-on investment in Harbortouch to support an acquisition. As part of the transaction, we received $529 of structuring fee income and $50 of amendment fee income from Harbortouch which was recognized as other income.
During the three months ended September 30, 2014, we determined that the impairment of Appalachian Energy LLC was other-than-temporary and recorded a realized loss of $2,050, reducing the amortized cost to zero.
On October 3, 2014, we sold our $35,000 investment in Babson CLO Ltd. 2011-I and realized a loss of $6,410 on the sale.
On October 10, 2014, ARRM Services, Inc. (“ARRM”) sold Ajax Rolled Ring & Machine, LLC (“Ajax”) to a third party and repaid the $19,337 loan receivable to us and we recorded a realized loss of $23,560 related to the sale. Concurrent with the sale, our ownership increased to 100% of the outstanding equity in SB Forging (see Note 1). As such, we began consolidating SB Forging on October 11, 2014. In addition, there is $3,000 being held in escrow of which $802 was received on May 6, 2015 for which we realized a gain of the same amount. The remainder will be recognized as additional gain if and when received. We received $2,000 of structuring fees from Ajax related to the sale of the operating company which was recognized as other income during the year ended June 30, 2015.
On October 20, 2014, we sold our $22,000 investment in Galaxy XII CLO, Ltd. and realized a loss of $2,435 on the sale.
156
On November 21, 2014, Coalbed, LLC (“Coalbed”) merged with and into Wolf Energy, LLC (“Wolf Energy”), with Wolf Energy as the surviving entity. During the three months ended December 31, 2014, we determined that the impairment of the Coalbed debt assumed by Wolf Energy was other-than-temporary and recorded a realized loss of $5,991, reducing the amortized cost to zero.
On December 4, 2014, we sold our $29,075 investment in Babson CLO Ltd. 2012-I and realized a loss of $3,767 on the sale.
On December 4, 2014, we sold our $27,850 investment in Babson CLO Ltd. 2012-II and realized a loss of $2,949 on the sale.
During the three months ended December 31, 2014, Manx Energy, Inc. (“Manx”) was dissolved and we recorded a realized loss of $50, reducing the amortized cost to zero.
During the three months ended December 31, 2014, we determined that the impairments of Change Clean Energy Company, LLC and Yatesville Coal Company, LLC (“Yatesville”) were other-than-temporary and recorded a realized loss of $1,449, reducing the amortized cost to zero.
During the three months ended December 31, 2014, we determined that the impairment of New Century Transportation, Inc. (“NCT”) was other-than-temporary and recorded a realized loss of $42,064, reducing the amortized cost to $980.
During the three months ended December 31, 2014, we determined that the impairment of Stryker Energy, LLC (“Stryker”) was other-than-temporary and recorded a realized loss of $32,711, reducing the amortized cost to zero.
During the three months ended December 31, 2014, we determined that the impairment of Wind River Resources Corporation (“Wind River”) was other-than-temporary and recorded a realized loss of $11,650, reducing the amortized cost to $3,000.
On June 5, 2015, we sold our equity investment in Vets Securing America, Inc. (“VSA”) and realized a net loss of $975 on the sale. In connection with the sale, VSA was released as a borrower on the secured promissory notes, leaving The Healing Staff, Inc. (“THS”) as the sole borrower. During the year ended June 30, 2015, THS ceased operations and we recorded a realized loss of $2,956, reducing the amortized cost to zero.
On June 9, 2015, we provided additional debt and equity financing to support the recapitalization of Edmentum. As part of the recapitalization, we exchanged 100% of the $50,000 second lien term loan previously outstanding for $26,365 of junior PIK notes and 370,964.14 Class A common units representing 37.1% equity ownership in Edmentum Ultimate Holdings, LLC. In addition, we invested $5,875 in senior PIK notes and committed $7,834 as part of a second lien revolving credit facility, of which $4,896 was funded at closing. On June 9, 2015, we determined that the impairment of Edmentum was other-than-temporary and recorded a realized loss of $22,116 for the amount that the amortized cost exceeded the fair value, reducing the amortized cost to $37,216.
During the year ended June 30, 2014, we recognized $400 of interest income due to purchase discount accretion for the assets acquired from Patriot. As of December 31, 2013, the purchase discount for the assets acquired from Patriot had been fully accreted. As such, no such income was recognized during the year ended June 30, 2015.
As of June 30, 2015, $4,413,161 of our loans, at fair value, bear interest at floating rates and $4,380,763 of those loans have LIBOR floors ranging from 0.5% to 5.5%. As of June 30, 2014, $4,212,376 of our loans, at fair value, bore interest at floating rates and $4,179,177 of those loans had LIBOR floors ranging from 1.25% to 6.00%.
At June 30, 2015, four loan investments were on non-accrual status: Gulf Coast, NCT, Wind River, and Wolf Energy. At June 30, 2014, nine loan investments were on non-accrual status: BXC, THS, Manx, NCT, STI, Stryker, Wind River, Wolf Energy Holdings Inc., and Yatesville. Principal balances of these loans amounted to $62,143 and $163,408 as of June 30, 2015 and June 30, 2014, respectively. The fair value of these loans amounted to $6,918 and $5,937 as of June 30, 2015 and June 30, 2014, respectively. The fair values of these investments represent approximately 0.1% and 0.1% of our total assets as of June 30, 2015 and June 30, 2014, respectively. For the years ended June 30, 2015, 2014 and 2013, the income foregone as a result of not accruing interest on non-accrual debt investments amounted to $22,927, $24,040 and $25,965, respectively.
Undrawn committed revolvers and delayed draw term loans to our portfolio companies incur commitment and unused fees ranging from 0.00% to 2.00%. As of June 30, 2015 and June 30, 2014, we had $88,288 and $72,118, respectively, of undrawn revolver and delayed draw term loan commitments to our portfolio companies.
During the year ended June 30, 2015, we sold $132,909 of the outstanding principal balance of the senior secured Term Loan A investments in certain portfolio companies. There was no gain or loss realized on the sale. We serve as an agent for these loans and collect a servicing fee from the counterparties on behalf of the Investment Adviser. We receive a credit for these payments as a reduction of base management fee payable by us to the Investment Adviser. See Note 13 for further discussion.
157
Unconsolidated Significant Subsidiaries
Our investments are generally in small and mid-sized companies in a variety of industries. In accordance with Rules 3-09 and 4-08(g) of Regulation S-X, we must determine which of our unconsolidated controlled portfolio companies are considered “significant subsidiaries”, if any. In evaluating these investments, there are three tests utilized to determine if any of our controlled investments are considered significant subsidiaries: the investment test, the asset test and the income test. Rule 3-09 of Regulation S-X, as interpreted by the SEC, requires separate audited financial statements of an unconsolidated majority-owned subsidiary in an annual report if any of the three tests exceed 20%. Rule 4-08(g) of Regulation S-X requires summarized financial information in an annual report if any of the three tests exceeds 10% and summarized financial information in a quarterly report if any of the three tests exceeds 20%.
As of June 30, 2015, we had no single investment that represented greater than 10% of our total investment portfolio at fair value. As of June 30, 2015, we had one investment whose assets represented greater than 10% but less than 20% of our total assets. Income, consisting of interest, dividends, fees, other investment income and gains or losses, which can fluctuate upon repayment or sale of an investment or the marking to fair value of an investment in any given year can be highly concentrated among several investments. After performing the income analysis for the year ended June 30, 2015, we determined that one of our controlled investments individually generated more than 10% but less than 20% of our income, primarily due to the unrealized appreciation that was recognized on the investment during the year ended June 30, 2015. As such, the following unconsolidated majority-owned portfolio company was considered a significant subsidiary at the 10% level as of June 30, 2015: National Property REIT Corp.
The following tables show summarized financial information for National Property REIT Corp. and its subsidiaries, which met the 10% asset test and the 10% income test:
June 30, 2015 | June 30, 2014 | |||||||
Balance Sheet Data | ||||||||
Cash and cash equivalents | $ | 43,722 | $ | 17,204 | ||||
Real estate, net | 639,012 | 312,896 | ||||||
Unsecured consumer loans, net | 366,014 | 45,597 | ||||||
Other assets | 51,383 | 8,185 | ||||||
Mortgages payable | 484,771 | 240,176 | ||||||
Revolving credit facilities | 208,296 | 27,600 | ||||||
Notes payable, due to Prospect or Affiliate | 365,214 | 105,309 | ||||||
Other liabilities | 21,736 | 5,173 | ||||||
Total equity | 20,114 | 5,624 | ||||||
Twelve Months Ended June 30, 2015 | From Inception (December 30, 2013) to June 30, 2014 | |||||||
Summary of Operations | ||||||||
Total revenue | $ | 120,576 | $ | 20,669 | ||||
Operating expenses | 115,206 | 20,507 | ||||||
Operating income | 5,370 | 162 | ||||||
Depreciation and amortization | 23,960 | 11,978 | ||||||
Fair value adjustment | 7,005 | 578 | ||||||
Net loss | $ | (25,595 | ) | $ | (12,394 | ) | ||
As of June 30, 2015, we had no single investment that represented greater than 20% of our total investment portfolio at fair value. As of June 30, 2015, we had no single investment whose assets represented greater than 20% of our total assets. After performing the income analysis, as discussed earlier, for the year ended June 30, 2015, we determined that two of our controlled investments individually generated more than 20% of our income, primarily due to the unrealized appreciation that was recognized on the investments during the year ended June 30, 2015. As such, the following unconsolidated majority-owned portfolio companies were considered significant subsidiaries at the 20% level as of June 30, 2015: First Tower Finance Company LLC and Harbortouch Payments, LLC.
158
The following tables show summarized financial information for First Tower Finance Company LLC and its subsidiaries:
June 30, 2015 | June 30, 2014 | |||||||
Balance Sheet Data | ||||||||
Cash and cash equivalents | $ | 65,614 | $ | 60,368 | ||||
Finance receivables, net | 400,451 | 385,875 | ||||||
Intangibles, including goodwill | 121,822 | 137,696 | ||||||
Other assets | 17,373 | 14,056 | ||||||
Notes payable | 334,637 | 313,563 | ||||||
Notes payable, due to Prospect or Affiliate | 251,578 | 251,246 | ||||||
Other liabilities | 47,493 | 46,276 | ||||||
Total equity | (28,448 | ) | (13,090 | ) | ||||
Twelve Months Ended June 30, | ||||||||||||
2015 | 2014 | 2013 | ||||||||||
Summary of Operations | ||||||||||||
Total revenue | $ | 207,128 | $ | 201,724 | $ | 186,037 | ||||||
Total expenses | 219,143 | 162,941 | 144,368 | |||||||||
Net (loss) income | $ | (12,015 | ) | $ | 38,783 | $ | 41,669 | |||||
The following tables show summarized financial information for Harbortouch Payments, LLC:
June 30, 2015 | June 30, 2014 | |||||||
Balance Sheet Data | ||||||||
Cash and cash equivalents | $ | 168 | $ | 2,083 | ||||
Receivables | 28,721 | 24,530 | ||||||
Intangibles, including goodwill | 351,396 | 400,453 | ||||||
Other assets | 28,686 | 15,106 | ||||||
Notes payable | 25,132 | 24,329 | ||||||
Notes payable, due to Prospect or Affiliate | 296,734 | 268,022 | ||||||
Other liabilities | 37,235 | 42,734 | ||||||
Total equity | 49,870 | 107,087 | ||||||
Twelve Months Ended June 30, 2015 | From Inception (March 31, 2014) to June 30, 2014 | |||||||
Summary of Operations | ||||||||
Total revenue | $ | 280,606 | $ | 68,759 | ||||
Total expenses | 329,469 | 82,673 | ||||||
Net loss | $ | (48,863 | ) | $ | (13,914 | ) | ||
As the SEC has not released details on the mechanics of how the calculations related to Rules 3-09 and 4-08(g) of Regulation S-X are to be completed, there is diversity in practice for the calculations. Based on our interpretation of Rule 3-09 of Regulation S-X and related calculations, we have included the separate financial statements of First Tower Finance Company LLC and Harbortouch Payments, LLC as exhibits to this report. We expect that the SEC will clarify the calculation methods in the near future.
Note 4. Revolving Credit Facility
On March 27, 2012, we closed on an extended and expanded credit facility with a syndicate of lenders through PCF (the “2012 Facility”). The lenders had extended commitments of $857,500 under the 2012 Facility as of June 30, 2014, which was increased to $877,500 in July 2014. The 2012 Facility included an accordion feature which allowed commitments to be increased up to $1,000,000 in the aggregate. Interest on borrowings under the 2012 Facility was one-month LIBOR plus 275 basis points with no minimum LIBOR floor. Additionally, the lenders charged a fee on the unused portion of the 2012 Facility equal to either 50 basis points if at least half of the credit facility is drawn or 100 basis points otherwise.
On August 29, 2014, we renegotiated the 2012 Facility and closed an expanded five and a half year revolving credit facility (the “2014 Facility” and collectively with the 2012 Facility, the “Revolving Credit Facility”). The lenders have extended commitments of $885,000 under the 2014 Facility as of June 30, 2015. The 2014 Facility includes an accordion feature which allows commitments to be increased up to $1,500,000 in the aggregate. The revolving period of the 2014 Facility extends through March 2019, with an additional one year amortization period (with distributions allowed) after the completion of the revolving period. During such one year amortization period, all principal payments on the pledged assets will be applied to reduce the balance. At the end of the one year amortization period, the remaining balance will become due, if required by the lenders.
The 2014 Facility contains restrictions pertaining to the geographic and industry concentrations of funded loans, maximum size of funded loans, interest rate payment frequency of funded loans, maturity dates of funded loans and minimum equity requirements. The 2014 Facility also contains certain requirements relating to portfolio performance, including required minimum portfolio yield and limitations on delinquencies and charge-offs, violation of which could result in the early termination of the 2014 Facility. The 2014 Facility also requires the maintenance of a minimum liquidity requirement. As of June 30, 2015, we were in compliance with the applicable covenants.
Interest on borrowings under the 2014 Facility is one-month LIBOR plus 225 basis points with no minimum LIBOR floor. Additionally, the lenders charge a fee on the unused portion of the 2014 Facility equal to either 50 basis points if at least 35% of the credit facility is drawn or 100 basis points otherwise. The 2014 Facility requires us to pledge assets as collateral in order to borrow under the credit facility.
As of June 30, 2015 and June 30, 2014, we had $721,800 and $780,620, respectively, available to us for borrowing under the Revolving Credit Facility, of which the amount outstanding was $368,700 and $92,000, respectively. As additional eligible investments are transferred to PCF and pledged under the Revolving Credit Facility, PCF will generate additional availability up to the current commitment amount of $885,000. As of June 30, 2015, the investments, including money market funds, used as collateral for the Revolving Credit Facility had an aggregate fair value of $1,539,763, which represents 22.9% of our total investments and money market funds. These assets are held and owned by PCF, a bankruptcy remote special purpose entity, and as such, these investments are not available to our general creditors. The release of any assets from PCF requires the approval of the facility agent.
In connection with the origination and amendments of the Revolving Credit Facility, we incurred $8,866 of new fees and $3,539 of fees carried over for continuing participants from the previous facility, which are being amortized over the term of the facility in accordance with ASC 470-50, of which $10,280 remains to be amortized and is included within deferred financing costs on the Consolidated Statement of Assets and Liabilities as of June 30, 2015. In accordance with ASC 470-50, we expensed $332 of fees relating to credit providers in the 2012 Facility who did not commit to the 2014 Facility.
During the years ended June 30, 2015, 2014 and 2013, we recorded $14,424, $12,216 and $9,082, respectively, of interest costs, unused fees and amortization of financing costs on the Revolving Credit Facility as interest expense.
159
Note 5. Convertible Notes
On December 21, 2010, we issued $150,000 aggregate principal amount of convertible notes that mature on December 15, 2015 (the “2015 Notes”), unless previously converted or repurchased in accordance with their terms. The 2015 Notes bear interest at a rate of 6.25% per year, payable semi-annually on June 15 and December 15 of each year, beginning June 15, 2011. Total proceeds from the issuance of the 2015 Notes, net of underwriting discounts and offering costs, were $145,200.
On February 18, 2011, we issued $172,500 aggregate principal amount of convertible notes that mature on August 15, 2016 (the “2016 Notes”), unless previously converted or repurchased in accordance with their terms. The 2016 Notes bear interest at a rate of 5.50% per year, payable semi-annually on February 15 and August 15 of each year, beginning August 15, 2011. Total proceeds from the issuance of the 2016 Notes, net of underwriting discounts and offering costs, were $167,325. Between January 30, 2012 and February 2, 2012, we repurchased $5,000 aggregate principal amount of the 2016 Notes at a price of 97.5, including commissions. The transactions resulted in our recognizing $10 of loss in the year ended June 30, 2012.
On April 16, 2012, we issued $130,000 aggregate principal amount of convertible notes that mature on October 15, 2017 (the “2017 Notes”), unless previously converted or repurchased in accordance with their terms. The 2017 Notes bear interest at a rate of 5.375% per year, payable semi-annually on April 15 and October 15 of each year, beginning October 15, 2012. Total proceeds from the issuance of the 2017 Notes, net of underwriting discounts and offering costs, were $126,035.
On August 14, 2012, we issued $200,000 aggregate principal amount of convertible notes that mature on March 15, 2018 (the “2018 Notes”), unless previously converted or repurchased in accordance with their terms. The 2018 Notes bear interest at a rate of 5.75% per year, payable semi-annually on March 15 and September 15 of each year, beginning March 15, 2013. Total proceeds from the issuance of the 2018 Notes, net of underwriting discounts and offering costs, were $193,600.
On December 21, 2012, we issued $200,000 aggregate principal amount of convertible notes that mature on January 15, 2019 (the “2019 Notes”), unless previously converted or repurchased in accordance with their terms. The 2019 Notes bear interest at a rate of 5.875% per year, payable semi-annually on January 15 and July 15 of each year, beginning July 15, 2013. Total proceeds from the issuance of the 2019 Notes, net of underwriting discounts and offering costs, were $193,600.
On April 11, 2014, we issued $400,000 aggregate principal amount of convertible notes that mature on April 15, 2020 (the “2020 Notes”), unless previously converted or repurchased in accordance with their terms. The 2020 Notes bear interest at a rate of 4.75% per year, payable semi-annually on April 15 and October 15 each year, beginning October 15, 2014. Total proceeds from the issuance of the 2020 Notes, net of underwriting discounts and offering costs, were $387,500. On January 30, 2015, we repurchased $8,000 aggregate principal amount of the 2020 Notes at a price of 93.0, including commissions. As a result of this transaction, we recorded a gain in the amount of the difference between the reacquisition price and the net carrying amount of the notes, net of the proportionate amount of unamortized debt issuance costs. The net gain on the extinguishment of the 2020 Notes in the year ended June 30, 2015 was $332.
Certain key terms related to the convertible features for the 2015 Notes, the 2016 Notes, the 2017 Notes, the 2018 Notes, the 2019 Notes and the 2020 Notes (collectively, the “Convertible Notes”) are listed below.
2015 Notes | 2016 Notes | 2017 Notes | 2018 Notes | 2019 Notes | 2020 Notes | ||||||||||||||||||
Initial conversion rate(1) | 88.0902 | 78.3699 | 85.8442 | 82.3451 | 79.7766 | 80.6647 | |||||||||||||||||
Initial conversion price | $ | 11.35 | $ | 12.76 | $ | 11.65 | $ | 12.14 | $ | 12.54 | $ | 12.40 | |||||||||||
Conversion rate at June 30, 2015(1)(2) | 89.9752 | 80.2196 | 87.7516 | 83.6661 | 79.8248 | 80.6670 | |||||||||||||||||
Conversion price at June 30, 2015(2)(3) | $ | 11.11 | $ | 12.47 | $ | 11.40 | $ | 11.95 | $ | 12.53 | $ | 12.40 | |||||||||||
Last conversion price calculation date | 12/21/2014 | 2/18/2015 | 4/16/2015 | 8/14/2014 | 12/21/2014 | 4/11/2015 | |||||||||||||||||
Dividend threshold amount (per share)(4) | $ | 0.101125 | $ | 0.101150 | $ | 0.101500 | $ | 0.101600 | $ | 0.110025 | $ | 0.110525 | |||||||||||
(1) | Conversion rates denominated in shares of common stock per $1 principal amount of the Convertible Notes converted. |
(2) | Represents conversion rate and conversion price, as applicable, taking into account certain de minimis adjustments that will be made on the conversion date. |
(3) | The conversion price in effect at June 30, 2015 was calculated on the last anniversary of the issuance and will be adjusted again on the next anniversary, unless the exercise price shall have changed by more than 1% before the anniversary. |
(4) | The conversion rate is increased if monthly cash dividends paid to common shares exceed the monthly dividend threshold amount, subject to adjustment. |
160
In no event will the total number of shares of common stock issuable upon conversion exceed 96.8992 per $1 principal amount of the 2015 Notes (the “conversion rate cap”), except that, to the extent we receive written guidance or a no-action letter from the staff of the Securities and Exchange Commission (the “Guidance”) permitting us to adjust the conversion rate in certain instances without regard to the conversion rate cap and to make the 2015 Notes convertible into certain reference property in accordance with certain reclassifications, business combinations, asset sales and corporate events by us without regard to the conversion rate cap, we will make such adjustments without regard to the conversion rate cap and will also, to the extent that we make any such adjustment without regard to the conversion rate cap pursuant to the Guidance, adjust the conversion rate cap accordingly. We will use our commercially reasonable efforts to obtain such Guidance as promptly as practicable.
Prior to obtaining the Guidance, we will not engage in certain transactions that would result in an adjustment to the conversion rate increasing the conversion rate beyond what it would have been in the absence of such transaction unless we have engaged in a reverse stock split or share combination transaction such that in our reasonable best estimation, the conversion rate following the adjustment for such transaction will not be any closer to the conversion rate cap than it would have been in the absence of such transaction.
Upon conversion, unless a holder converts after a record date for an interest payment but prior to the corresponding interest payment date, the holder will receive a separate cash payment with respect to the notes surrendered for conversion representing accrued and unpaid interest to, but not including, the conversion date. Any such payment will be made on the settlement date applicable to the relevant conversion on the Convertible Notes.
No holder of Convertible Notes will be entitled to receive shares of our common stock upon conversion to the extent (but only to the extent) that such receipt would cause such converting holder to become, directly or indirectly, a beneficial owner (within the meaning of Section 13(d) of the Securities Exchange Act of 1934 and the rules and regulations promulgated thereunder) of more than 5.0% of the shares of our common stock outstanding at such time. The 5.0% limitation shall no longer apply following the effective date of any fundamental change. We will not issue any shares in connection with the conversion or redemption of the Convertible Notes which would equal or exceed 20% of the shares outstanding at the time of the transaction in accordance with NASDAQ rules.
Subject to certain exceptions, holders may require us to repurchase, for cash, all or part of their Convertible Notes upon a fundamental change at a price equal to 100% of the principal amount of the Convertible Notes being repurchased plus any accrued and unpaid interest up to, but excluding, the fundamental change repurchase date. In addition, upon a fundamental change that constitutes a non-stock change of control we will also pay holders an amount in cash equal to the present value of all remaining interest payments (without duplication of the foregoing amounts) on such Convertible Notes through and including the maturity date.
In connection with the issuance of the Convertible Notes, we incurred $39,678 of fees which are being amortized over the terms of the notes, of which $21,274 remains to be amortized and is included within deferred financing costs on the Consolidated Statement of Assets and Liabilities as of June 30, 2015.
During the years ended June 30, 2015, 2014 and 2013, we recorded $74,365, $58,042 and $45,880, respectively, of interest costs and amortization of financing costs on the Convertible Notes as interest expense.
Note 6. Public Notes
On May 1, 2012, we issued $100,000 aggregate principal amount of unsecured notes that were scheduled to mature on November 15, 2022 (the “2022 Notes”). The 2022 Notes bore interest at a rate of 6.95% per year, payable quarterly on February 15, May 15, August 15 and November 15 of each year, beginning August 15, 2012. Total proceeds from the issuance of the 2022 Notes, net of underwriting discounts and offering costs, were $97,000. On May 15, 2015, we redeemed $100,000 aggregate principal amount of the 2022 Notes at par. As a result of this transaction, we recorded a loss in the amount of the difference between the reacquisition price and the net carrying amount of the notes, net of the proportionate amount of unamortized debt issuance costs. The net loss on the extinguishment of the 2022 Notes in the year ended June 30, 2015 was $2,600.
On March 15, 2013, we issued $250,000 aggregate principal amount of unsecured notes that mature on March 15, 2023 (the “2023 Notes”). The 2023 Notes bear interest at a rate of 5.875% per year, payable semi-annually on March 15 and September 15 of each year, beginning September 15, 2013. Total proceeds from the issuance of the 2023 Notes, net of underwriting discounts and offering costs, were $245,885.
161
On April 7, 2014, we issued $300,000 aggregate principal amount of unsecured notes that mature on July 15, 2019 (the “5.00% 2019 Notes”). Included in the issuance is $45,000 of Prospect Capital InterNotes® that were exchanged for the 5.00% 2019 Notes. The 5.00% 2019 Notes bear interest at a rate of 5.00% per year, payable semi-annually on January 15 and July 15 of each year, beginning July 15, 2014. Total proceeds from the issuance of the 5.00% 2019 Notes, net of underwriting discounts and offering costs, were $250,775.
The 2022 Notes, the 2023 Notes and the 5.00% 2019 Notes (collectively, the “Public Notes”) are direct unsecured obligations and rank equally with all of our unsecured indebtedness from time to time outstanding.
In connection with the issuance of the 2023 Notes and the 5.00% 2019 Notes, we incurred $8,036 of fees which are being amortized over the term of the notes, of which $6,604 remains to be amortized and is included within deferred financing costs on the Consolidated Statement of Assets and Liabilities as of June 30, 2015.
During the years ended June 30, 2015, 2014 and 2013, we recorded $37,063, $25,988 and $11,672, respectively, of interest costs and amortization of financing costs on the Public Notes as interest expense.
Note 7. Prospect Capital InterNotes®
On February 16, 2012, we entered into a selling agent agreement (the “Selling Agent Agreement”) with Incapital LLC, as purchasing agent for our issuance and sale from time to time of up to $500,000 of Prospect Capital InterNotes® (the “InterNotes® Offering”), which was increased to $1,500,000 in May 2014. Additional agents may be appointed by us from time to time in connection with the InterNotes® Offering and become parties to the Selling Agent Agreement.
These notes are direct unsecured obligations and rank equally with all of our unsecured indebtedness from time to time outstanding. Each series of notes will be issued by a separate trust. These notes bear interest at fixed interest rates and offer a variety of maturities no less than twelve months from the original date of issuance.
During the year ended June 30, 2015, we issued $125,696 aggregate principal amount of Prospect Capital InterNotes® for net proceeds of $123,641. These notes were issued with stated interest rates ranging from 3.375% to 5.10% with a weighted average interest rate of 4.65%. These notes mature between May 15, 2020 and June 15, 2022. The following table summarizes the Prospect Capital InterNotes® issued during the year ended June 30, 2015.
Tenor at Origination (in years) | Principal Amount | Interest Rate Range | Weighted Average Interest Rate | Maturity Date Range | |||||||
5.25 | $ | 7,126 | 4.625% | 4.625 | % | August 15, 2020 – September 15, 2020 | |||||
5.5 | 106,364 | 4.25%–4.75% | 4.63 | % | May 15, 2020 – November 15, 2020 | ||||||
6 | 2,197 | 3.375% | 3.375 | % | April 15, 2021 – May 15, 2021 | ||||||
6.5 | 3,912 | 5.10% | 5.10 | % | December 15, 2021 | ||||||
7 | 6,097 | 5.10% | 5.10 | % | May 15, 2022 – June 15, 2022 | ||||||
$ | 125,696 | ||||||||||
162
During the year ended June 30, 2014, we issued $473,762 aggregate principal amount of Prospect Capital InterNotes® for net proceeds of $465,314. These notes were issued with stated interest rates ranging from 3.75% to 6.75% with a weighted average interest rate of 5.12%. These notes mature between October 15, 2016 and October 15, 2043. The following table summarizes the Prospect Capital InterNotes® issued during the year ended June 30, 2014.
Tenor at Origination (in years) | Principal Amount | Interest Rate Range | Weighted Average Interest Rate | Maturity Date Range | |||||||
3 | $ | 5,710 | 4.00% | 4.00 | % | October 15, 2016 | |||||
3.5 | 3,149 | 4.00% | 4.00 | % | April 15, 2017 | ||||||
4 | 45,751 | 3.75%–4.00% | 3.92 | % | November 15, 2017 – May 15, 2018 | ||||||
5 | 207,915 | 4.25%–5.00% | 4.92 | % | July 15, 2018 – May 15, 2019 | ||||||
5.5 | 53,820 | 4.75%–5.00% | 4.86 | % | February 15, 2019 – August 15, 2019 | ||||||
6.5 | 1,800 | 5.50% | 5.50 | % | February 15, 2020 | ||||||
7 | 62,409 | 5.25%–5.75% | 5.44 | % | July 15, 2020 – May 15, 2021 | ||||||
7.5 | 1,996 | 5.75% | 5.75 | % | February 15, 2021 | ||||||
10 | 23,850 | 5.75%–6.50% | 5.91 | % | January 15, 2024 – May 15, 2024 | ||||||
12 | 2,978 | 6.00% | 6.00 | % | November 15, 2025 – December 15, 2025 | ||||||
15 | 2,495 | 6.00% | 6.00 | % | August 15, 2028 – November 15, 2028 | ||||||
18 | 4,062 | 6.00%–6.25% | 6.21 | % | July 15, 2031 – August 15, 2031 | ||||||
20 | 2,791 | 6.00% | 6.00 | % | September 15, 2033 – October 15, 2033 | ||||||
25 | 34,886 | 6.25%–6.50% | 6.39 | % | August 15, 2038 – May 15, 2039 | ||||||
30 | 20,150 | 6.50%–6.75% | 6.60 | % | July 15, 2043 – October 15, 2043 | ||||||
$ | 473,762 | ||||||||||
During the year ended June 30, 2015, we redeemed $76,931 aggregate principal amount of Prospect Capital InterNotes® at par with a weighted average interest rate of 6.06% in order to replace debt with higher interest rates with debt with lower rates. During the year ended June 30, 2015, we repaid $6,993 aggregate principal amount of Prospect Capital InterNotes® at par in accordance with the Survivor’s Option, as defined in the InterNotes® Offering prospectus. As a result of these transactions, we recorded a loss in the amount of the difference between the reacquisition price and the net carrying amount of the notes, net of the proportionate amount of unamortized debt issuance costs. The net loss on the extinguishment of Prospect Capital InterNotes® in the year ended June 30, 2015 was $1,682. The following table summarizes the Prospect Capital InterNotes® outstanding as of June 30, 2015.
Tenor at Origination (in years) | Principal Amount | Interest Rate Range | Weighted Average Interest Rate | Maturity Date Range | |||||||
3 | $ | 5,710 | 4.00% | 4.00 | % | October 15, 2016 | |||||
3.5 | 3,109 | 4.00% | 4.00 | % | April 15, 2017 | ||||||
4 | 45,690 | 3.75%–4.00% | 3.92 | % | November 15, 2017 – May 15, 2018 | ||||||
5 | 207,719 | 4.25%–5.00% | 4.92 | % | July 15, 2018 – May 15, 2019 | ||||||
5.25 | 7,126 | 4.625% | 4.63 | % | August 15, 2020 – September 15, 2020 | ||||||
5.5 | 115,184 | 4.25%–5.00% | 4.65 | % | February 15, 2019 – November 15, 2020 | ||||||
6.0 | 2,197 | 3.375% | 3.38 | % | April 15, 2021 – May 15, 2021 | ||||||
6.5 | 5,712 | 5.10%–5.50% | 5.23 | % | February 15, 2020 – December 15, 2021 | ||||||
7 | 191,549 | 4.00%–5.85% | 5.13 | % | September 15, 2019 – June 15, 2022 | ||||||
7.5 | 1,996 | 5.75% | 5.75 | % | February 15, 2021 | ||||||
10 | 36,925 | 3.29%–7.00% | 6.11 | % | March 15, 2022 – May 15, 2024 | ||||||
12 | 2,978 | 6.00% | 6.00 | % | November 15, 2025 – December 15, 2025 | ||||||
15 | 17,385 | 5.00%–6.00% | 5.14 | % | May 15, 2028 – November 15, 2028 | ||||||
18 | 22,729 | 4.125%–6.25% | 5.52 | % | December 15, 2030 – August 15, 2031 | ||||||
20 | 4,530 | 5.75%–6.00% | 5.89 | % | November 15, 2032 – October 15, 2033 | ||||||
25 | 36,320 | 6.25%–6.50% | 6.39 | % | August 15, 2038 – May 15, 2039 | ||||||
30 | 120,583 | 5.50%–6.75% | 6.23 | % | November 15, 2042 – October 15, 2043 | ||||||
$ | 827,442 | ||||||||||
163
During the year ended June 30, 2014, we repaid $6,869 aggregate principal amount of Prospect Capital InterNotes® in accordance with the Survivor’s Option, as defined in the InterNotes® Offering prospectus. In connection with the issuance of the 5.00% 2019 Notes, $45,000 of previously-issued Prospect Capital InterNotes® were exchanged for the 5.00% 2019 Notes. The following table summarizes the Prospect Capital InterNotes® outstanding as of June 30, 2014.
Tenor at Origination (in years) | Principal Amount | Interest Rate Range | Weighted Average Interest Rate | Maturity Date Range | |||||||
3 | $ | 5,710 | 4.00% | 4.00 | % | October 15, 2016 | |||||
3.5 | 3,149 | 4.00% | 4.00 | % | April 15, 2017 | ||||||
4 | 45,751 | 3.75%–4.00% | 3.92 | % | November 15, 2017 – May 15, 2018 | ||||||
5 | 207,915 | 4.25%–5.00% | 4.92 | % | July 15, 2018 – August 15, 2019 | ||||||
5.5 | 8,820 | 5.00% | 4.86 | % | February 15, 2019 | ||||||
6.5 | 1,800 | 5.50% | 5.50 | % | February 15, 2020 | ||||||
7 | 256,903 | 4.00%–6.55% | 5.39 | % | June 15, 2019 – May 15, 2021 | ||||||
7.5 | 1,996 | 5.75% | 5.75 | % | February 15, 2021 | ||||||
10 | 41,952 | 3.23%–7.00% | 6.18 | % | March 15, 2022 – May 15, 2024 | ||||||
12 | 2,978 | 6.00% | 6.00 | % | November 15, 2025 – December 15, 2025 | ||||||
15 | 17,465 | 5.00%–6.00% | 5.14 | % | May 15, 2028 – November 15, 2028 | ||||||
18 | 25,435 | 4.125%–6.25% | 5.49 | % | December 15, 2030 – August 15, 2031 | ||||||
20 | 5,847 | 5.625%–6.00% | 5.85 | % | November 15, 2032 – October 15, 2033 | ||||||
25 | 34,886 | 6.25%–6.50% | 6.39 | % | August 15, 2038 – May 15, 2039 | ||||||
30 | 125,063 | 5.50%–6.75% | 6.22 | % | November 15, 2042 – October 15, 2043 | ||||||
$ | 785,670 | ||||||||||
In connection with the issuance of Prospect Capital InterNotes®, we incurred $20,168 of fees which are being amortized over the term of the notes, of which $16,262 remains to be amortized and is included within deferred financing costs on the Consolidated Statement of Assets and Liabilities as of June 30, 2015.
During the years ended June 30, 2015, 2014 and 2013, we recorded $44,808, $33,857 and $9,707, respectively, of interest costs and amortization of financing costs on the Prospect Capital InterNotes® as interest expense.
Note 8. Fair Value and Maturity of Debt Outstanding
The following table shows the maximum draw amounts and outstanding borrowings of our Revolving Credit Facility, Convertible Notes, Public Notes and Prospect Capital InterNotes® as of June 30, 2015 and June 30, 2014.
June 30, 2015 | June 30, 2014 | ||||||||||||||
Maximum Draw Amount | Amount Outstanding | Maximum Draw Amount | Amount Outstanding | ||||||||||||
Revolving Credit Facility | $ | 885,000 | $ | 368,700 | $ | 857,500 | $ | 92,000 | |||||||
Convertible Notes | 1,239,500 | 1,239,500 | 1,247,500 | 1,247,500 | |||||||||||
Public Notes | 548,094 | 548,094 | 647,881 | 647,881 | |||||||||||
Prospect Capital InterNotes® | 827,442 | 827,442 | 785,670 | 785,670 | |||||||||||
Total | $ | 3,500,036 | $ | 2,983,736 | $ | 3,538,551 | $ | 2,773,051 | |||||||
164
The following table shows the contractual maturities of our Revolving Credit Facility, Convertible Notes, Public Notes and Prospect Capital InterNotes® as of June 30, 2015.
Payments Due by Period | |||||||||||||||||||
Total | Less than 1 Year | 1 – 3 Years | 3 – 5 Years | After 5 Years | |||||||||||||||
Revolving Credit Facility | $ | 368,700 | $ | — | $ | — | $ | 368,700 | $ | — | |||||||||
Convertible Notes | 1,239,500 | 150,000 | 497,500 | 592,000 | — | ||||||||||||||
Public Notes | 548,094 | — | — | 300,000 | 248,094 | ||||||||||||||
Prospect Capital InterNotes® | 827,442 | — | 54,509 | 369,938 | 402,995 | ||||||||||||||
Total Contractual Obligations | $ | 2,983,736 | $ | 150,000 | $ | 552,009 | $ | 1,630,638 | $ | 651,089 | |||||||||
The following table shows the contractual maturities of our Revolving Credit Facility, Convertible Notes, Public Notes and Prospect Capital InterNotes® as of June 30, 2014.
Payments Due by Period | |||||||||||||||||||
Total | Less than 1 Year | 1 – 3 Years | 3 – 5 Years | After 5 Years | |||||||||||||||
Revolving Credit Facility | $ | 92,000 | $ | — | $ | 92,000 | $ | — | $ | — | |||||||||
Convertible Notes | 1,247,500 | — | 317,500 | 530,000 | 400,000 | ||||||||||||||
Public Notes | 647,881 | — | — | — | 647,881 | ||||||||||||||
Prospect Capital InterNotes® | 785,670 | — | 8,859 | 261,456 | 515,355 | ||||||||||||||
Total Contractual Obligations | $ | 2,773,051 | $ | — | $ | 418,359 | $ | 791,456 | $ | 1,563,236 | |||||||||
As permitted by ASC 825-10-25, we have not elected to value our Revolving Credit Facility, Convertible Notes, Public Notes and Prospect Capital InterNotes® at fair value. The following table shows the fair value of these financial liabilities disaggregated into the three levels of the ASC 820 valuation hierarchy as of June 30, 2015.
Fair Value Hierarchy | |||||||||||||||
Level 1 | Level 2 | Level 3 | Total | ||||||||||||
Revolving Credit Facility(1) | $ | — | $ | 368,700 | $ | — | $ | 368,700 | |||||||
Convertible Notes(2) | — | 1,244,402 | — | 1,244,402 | |||||||||||
Public Notes(2) | — | 564,052 | — | 564,052 | |||||||||||
Prospect Capital InterNotes®(3) | — | 848,387 | — | 848,387 | |||||||||||
Total | $ | — | $ | 3,025,541 | $ | — | $ | 3,025,541 | |||||||
(1) | The carrying value of our Revolving Credit Facility approximates the fair value. |
(2) | We use available market quotes to estimate the fair value of the Convertible Notes and Public Notes. |
(3) | The fair value of Prospect Capital InterNotes® is estimated by discounting remaining payments using current Treasury rates. |
The following table shows the fair value of these financial liabilities disaggregated into the three levels of the ASC 820 valuation hierarchy as of June 30, 2014.
Fair Value Hierarchy | |||||||||||||||
Level 1 | Level 2 | Level 3 | Total | ||||||||||||
Revolving Credit Facility(1) | $ | — | $ | 92,000 | $ | — | $ | 92,000 | |||||||
Convertible Notes(2) | — | 1,293,495 | — | 1,293,495 | |||||||||||
Public Notes(2) | — | 679,816 | — | 679,816 | |||||||||||
Prospect Capital InterNotes®(3) | — | 799,631 | — | 799,631 | |||||||||||
Total | $ | — | $ | 2,864,942 | $ | — | $ | 2,864,942 | |||||||
(1) | The carrying value of our Revolving Credit Facility approximates the fair value. |
(2) | We use available market quotes to estimate the fair value of the Convertible Notes and Public Notes. |
(3) | The fair value of Prospect Capital InterNotes® is estimated by discounting remaining payments using current Treasury rates. |
165
Note 9. Equity Offerings, Offering Expenses, and Distributions
Excluding dividend reinvestments, we issued 14,845,556 and 93,381,602 shares of our common stock during the years ended June 30, 2015 and June 30, 2014, respectively. The following table summarizes our issuances of common stock during the years ended June 30, 2014 and June 30, 2015.
Issuances of Common Stock | Number of Shares Issued | Gross Proceeds | Underwriting Fees | Offering Expenses | Average Offering Price | ||||||||||||||
During the year ended June 30, 2014: | |||||||||||||||||||
July 5, 2013 – August 21, 2013(1) | 9,818,907 | $ | 107,725 | $ | 902 | $ | 169 | $ | 10.97 | ||||||||||
August 2, 2013(2) | 1,918,342 | 21,006 | — | — | $ | 10.95 | |||||||||||||
August 29, 2013 – November 4, 2013(1) | 24,127,242 | 272,114 | 2,703 | 414 | $ | 11.28 | |||||||||||||
November 12, 2013 – February 5, 2014(1) | 27,301,889 | 307,045 | 3,069 | 436 | $ | 11.25 | |||||||||||||
February 10, 2014 – April 9, 2014(1) | 21,592,715 | 239,305 | 2,233 | 168 | $ | 11.08 | |||||||||||||
March 31, 2014(2) | 2,306,294 | 24,908 | — | — | $ | 10.80 | |||||||||||||
April 15, 2014 – May 2, 2014(1) | 5,213,900 | 56,995 | 445 | 193 | $ | 10.93 | |||||||||||||
May 5, 2014(2) | 1,102,313 | 11,916 | — | — | $ | 10.81 | |||||||||||||
During the year ended June 30, 2015: | |||||||||||||||||||
September 11, 2014 – November 3, 2014(1) | 9,490,975 | 95,149 | 474 | 175 | $ | 10.03 | |||||||||||||
November 17, 2014 – December 3, 2014(1) | 5,354,581 | 51,678 | 268 | 469 | $ | 9.65 | |||||||||||||
(1) | Shares were issued in connection with our at-the-market offering program which we enter into from time to time with various counterparties. |
(2) | Shares were issued in conjunction with our investments in the following controlled portfolio companies: CP Holdings of Delaware LLC, Harbortouch Holdings of Delaware Inc., and Arctic Oilfield Equipment USA, Inc. |
Our shareholders’ equity accounts as of June 30, 2015 and June 30, 2014 reflect cumulative shares issued as of those respective dates. Our common stock has been issued through public offerings, a registered direct offering, the exercise of over-allotment options on the part of the underwriters, our dividend reinvestment plan and in connection with the acquisition of certain controlled portfolio companies. When our common stock is issued, the related offering expenses have been charged against paid-in capital in excess of par. All underwriting fees and offering expenses were borne by us.
On August 24, 2011, our Board of Directors approved a share repurchase plan (the “Repurchase Program”) under which we may repurchase up to $100,000 of our common stock at prices below our net asset value per share. Prior to any repurchase, we are required to notify shareholders of our intention to purchase our common stock. Our last notice was delivered on June 16, 2015. This notice lasts for six months after notice is given. We did not make any purchases of our common stock during the period from August 24, 2011 to June 30, 2015 pursuant to the Repurchase Program. See Note 18 for shares purchased under the Repurchase Program subsequent to June 30, 2015.
Our Board of Directors, pursuant to the Maryland General Corporation Law, executed Articles of Amendment to increase the number of shares authorized for issuance from 500,000,000 to 1,000,000,000 in the aggregate. The amendment became effective May 6, 2014.
On November 4, 2014, our Registration Statement on Form N-2 was declared effective by the SEC. Under this Shelf Registration Statement, we can issue up to $4,822,626 of additional debt and equity securities in the public market as of June 30, 2015.
166
During the years ended June 30, 2015 and June 30, 2014, we distributed approximately $421,594 and $403,188, respectively, to our stockholders. The following table summarizes our distributions declared and payable for the years ended June 30, 2014 and June 30, 2015.
Declaration Date | Record Date | Payment Date | Amount Per Share | Amount Distributed (in thousands) | ||||||||
5/6/2013 | 7/31/2013 | 8/22/2013 | $ | 0.110175 | $ | 28,001 | ||||||
5/6/2013 | 8/30/2013 | 9/19/2013 | 0.110200 | 28,759 | ||||||||
6/17/2013 | 9/30/2013 | 10/24/2013 | 0.110225 | 29,915 | ||||||||
6/17/2013 | 10/31/2013 | 11/21/2013 | 0.110250 | 31,224 | ||||||||
6/17/2013 | 11/29/2013 | 12/19/2013 | 0.110275 | 32,189 | ||||||||
6/17/2013 | 12/31/2013 | 1/23/2014 | 0.110300 | 33,229 | ||||||||
8/21/2013 | 1/31/2014 | 2/20/2014 | 0.110325 | 34,239 | ||||||||
8/21/2013 | 2/28/2014 | 3/20/2014 | 0.110350 | 35,508 | ||||||||
8/21/2013 | 3/31/2014 | 4/17/2014 | 0.110375 | 36,810 | ||||||||
11/4/2013 | 4/30/2014 | 5/22/2014 | 0.110400 | 37,649 | ||||||||
11/4/2013 | 5/30/2014 | 6/19/2014 | 0.110425 | 37,822 | ||||||||
11/4/2013 | 6/30/2014 | 7/24/2014 | 0.110450 | 37,843 | ||||||||
Total declared and payable for the year ended June 30, 2014 | $ | 403,188 | ||||||||||
2/3/2014 | 7/31/2014 | 8/21/2014 | $ | 0.110475 | $ | 37,863 | ||||||
2/3/2014 | 8/29/2014 | 9/18/2014 | 0.110500 | 37,885 | ||||||||
2/3/2014 | 9/30/2014 | 10/22/2014 | 0.110525 | 38,519 | ||||||||
5/6/2014 | 10/31/2014 | 11/20/2014 | 0.110550 | 38,977 | ||||||||
5/6/2014 | 11/28/2014 | 12/18/2014 | 0.110575 | 39,583 | ||||||||
5/6/2014 | 12/31/2014 | 1/22/2015 | 0.110600 | 39,623 | ||||||||
9/24/2014 | 1/30/2015 | 2/19/2015 | 0.110625 | 39,648 | ||||||||
12/8/2014 | 2/27/2015 | 3/19/2015 | 0.083330 | 29,878 | ||||||||
12/8/2014 | 3/31/2015 | 4/23/2015 | 0.083330 | 29,887 | ||||||||
12/8/2014 | 4/30/2015 | 5/21/2015 | 0.083330 | 29,898 | ||||||||
5/6/2015 | 5/29/2015 | 6/18/2015 | 0.083330 | 29,910 | ||||||||
5/6/2015 | 6/30/2015 | 7/23/2015 | 0.083330 | 29,923 | ||||||||
Total declared and payable for the year ended June 30, 2015 | $ | 421,594 | ||||||||||
Dividends and distributions to common stockholders are recorded on the ex-dividend date. As such, the table above includes distributions with record dates during the years ended June 30, 2015 and June 30, 2014. It does not include distributions previously declared to stockholders of record on any future dates, as those amounts are not yet determinable. The following dividends were previously declared and will be payable subsequent to June 30, 2015:
• | $0.08333 per share for July 2015 to holders of record on July 31, 2015 with a payment date of August 20, 2015; |
• | $0.08333 per share for August 2015 to holders of record on August 31, 2015 with a payment date of September 17, 2015; |
• | $0.08333 per share for September 2015 to holders of record on September 30, 2015 with a payment date of October 22, 2015; and |
• | $0.08333 per share for October 2015 to holders of record on October 30, 2015 with a payment date of November 19, 2015. |
During the years ended June 30, 2015 and June 30, 2014, we issued 1,618,566 and 1,408,070 shares of our common stock, respectively, in connection with the dividend reinvestment plan.
As of June 30, 2015, we have reserved 102,790,062 shares of our common stock for issuance upon conversion of the Convertible Notes (see Note 5).
167
Note 10. Other Income
Other income consists of structuring fees, overriding royalty interests, revenue receipts related to net profit interests, deal deposits, administrative agent fees, and other miscellaneous and sundry cash receipts. The following table shows income from such sources during the years ended June 30, 2015, 2014 and 2013.
Year Ended June 30, | |||||||||||
2015 | 2014 | 2013 | |||||||||
Structuring and amendment fees (refer to Note 3) | $ | 28,562 | $ | 59,527 | $ | 53,708 | |||||
Recovery of legal costs from prior periods from legal settlement | — | 5,825 | — | ||||||||
Royalty interests | 5,219 | 5,893 | 4,122 | ||||||||
Administrative agent fees | 666 | 468 | 346 | ||||||||
Total Other Income | $ | 34,447 | $ | 71,713 | $ | 58,176 | |||||
Note 11. Net Increase in Net Assets per Share
The following information sets forth the computation of net increase in net assets resulting from operations per share during the years ended June 30, 2015, 2014 and 2013.
Year Ended June 30, | |||||||||||
2015 | 2014 | 2013 | |||||||||
Net increase in net assets resulting from operations | $ | 346,339 | $ | 319,020 | $ | 220,856 | |||||
Weighted average common shares outstanding | 353,648,522 | 300,283,941 | 207,069,971 | ||||||||
Net increase in net assets resulting from operations per share | $ | 0.98 | $ | 1.06 | $ | 1.07 | |||||
Note 12. Income Taxes
While our fiscal year end for financial reporting purposes is June 30 of each year, our tax year end is August 31 of each year. The information presented in this footnote is based on our tax year end for each period presented, unless otherwise specified.
For income tax purposes, dividends paid and distributions made to shareholders are reported as ordinary income, capital gains, non-taxable return of capital, or a combination thereof. The tax character of dividends paid to shareholders during the tax years ended August 31, 2014, 2013 and 2012 were as follows:
Tax Year Ended August 31, | ||||||||||||
2014 | 2013 | 2012 | ||||||||||
Ordinary income | $ | 413,051 | $ | 282,621 | $ | 147,204 | ||||||
Capital gain | — | — | — | |||||||||
Return of capital | — | — | — | |||||||||
Total dividends paid to shareholders | $ | 413,051 | $ | 282,621 | $ | 147,204 | ||||||
For the tax year ending August 31, 2015, the tax character of dividends paid to shareholders through June 30, 2015 is expected to be ordinary income. Because of the difference between our fiscal and tax year ends, the final determination of the tax character of dividends will not be made until we file our tax return for the tax year ending August 31, 2015.
Taxable income generally differs from net increase in net assets resulting from operations for financial reporting purposes due to temporary and permanent differences in the recognition of income and expenses, and generally excludes net unrealized gains or losses, as unrealized gains or losses are generally not included in taxable income until they are realized.
168
The following reconciles the net increase in net assets resulting from operations to taxable income for the tax years ended August 31, 2014, 2013 and 2012:
Tax Year Ended August 31, | ||||||||||||
2014 | 2013 | 2012 | ||||||||||
Net increase in net assets resulting from operations | $ | 317,671 | $ | 238,721 | $ | 208,331 | ||||||
Net realized loss (gain) on investments | 28,244 | 24,632 | (38,363 | ) | ||||||||
Net unrealized depreciation on investments | 24,638 | 77,835 | 32,367 | |||||||||
Other temporary book-to-tax differences | (9,122 | ) | (6,994 | ) | (1,132 | ) | ||||||
Permanent differences | (4,317 | ) | 5,939 | (6,103 | ) | |||||||
Taxable income before deductions for distributions | $ | 357,114 | $ | 340,133 | $ | 195,100 | ||||||
Capital losses in excess of capital gains earned in a tax year may generally be carried forward and used to offset capital gains, subject to certain limitations. The Regulated Investment Company Modernization Act (the “RIC Modernization Act”) was enacted on December 22, 2010. Under the RIC Modernization Act, capital losses incurred by taxpayers in taxable years beginning after the date of enactment will be allowed to be carried forward indefinitely and are allowed to retain their character as either short-term or long-term losses. As such, the capital loss carryforwards generated by us after the August 31, 2011 tax year will not be subject to expiration. Any losses incurred in post-enactment tax years will be required to be utilized prior to the losses incurred in pre-enactment tax years. As of August 31, 2014, we had capital loss carryforwards of approximately $117,393 available for use in later tax years. Of the amount available as of August 31, 2014, $623, $33,096 and $46,910 will expire on August 31, 2016, 2017 and 2018, respectively, and $36,764 is not subject to expiration. The unused balance each year will be carried forward and utilized as gains are realized, subject to limitations. While our ability to utilize losses in the future depends upon a variety of factors that cannot be known in advance, substantially all of our capital loss carryforwards may become permanently unavailable due to limitations by the Code.
Under current tax law, capital losses and specific ordinary losses realized after October 31st and December 31st, respectively, may be deferred and treated as occurring on the first business day of the following tax year. As of August 31, 2014, we had deferred $22,601 of long-term capital losses which will be treated as arising on the first day of the tax year ending August 31, 2015.
For the tax year ended August 31, 2014, we had distributions in excess of taxable income. After the excess distributions, we still had cumulative taxable income in excess of cumulative distributions, and therefore, we elected to carry forward the excess for distribution to shareholders in the tax year ending August 31, 2015. The amount carried forward to 2015 was approximately $49,471. For the tax year ended August 31, 2013, we had taxable income in excess of the distributions made from such taxable income during the year, and therefore, we elected to carry forward the excess for distribution to shareholders in the tax year ended August 31, 2014. The amount carried forward to 2014 was approximately $105,408. For the tax year ended August 31, 2012, we had taxable income in excess of the distributions made from such taxable income during the year, and therefore, we elected to carry forward the excess for distribution to shareholders in the tax year ended August 31, 2013. The amount carried forward to 2013 was approximately $47,896.
As of June 30, 2015, the cost basis of investments for tax purposes was $6,599,876 resulting in estimated gross unrealized appreciation and depreciation of $263,892 and $254,210, respectively. As of June 30, 2014, the cost basis of investments for tax purposes was $6,424,182 resulting in estimated gross unrealized appreciation and depreciation of $139,620 and $310,063, respectively. Due to the difference between our fiscal and tax year ends, the cost basis of our investments for tax purposes as of June 30, 2015 and June 30, 2014 was calculated based on the book cost of investments as of June 30, 2015 and June 30, 2014, respectively, with cumulative book-to-tax adjustments for investments through each investment’s most current tax year end.
In general, we may make certain adjustments to the classification of net assets as a result of permanent book-to-tax differences, which may include merger-related items, differences in the book and tax basis of certain assets and liabilities, and nondeductible federal taxes, among other items. During the tax year ended August 31, 2014, we increased accumulated overdistributed net investment income by $4,316, decreased accumulated net realized loss on investments by $3,384 and increased capital in excess of par value by $932. During the tax year ended August 31, 2013, we increased accumulated undistributed net investment income by $5,939, increased accumulated net realized loss on investments by $2,621 and decreased capital in excess of par value by $3,318. Due to the difference between our fiscal and tax year ends, the reclassifications for the taxable year ended August 31, 2014 are recorded in the fiscal year ending June 30, 2015 and the reclassifications for the taxable year ended August 31, 2013 were recorded in the fiscal year ended June 30, 2014.
169
Note 13. Related Party Agreements and Transactions
Investment Advisory Agreement
On December 23, 2014, the Investment Adviser, Prospect Capital Management LLC, converted into a Delaware limited partnership and is now known as Prospect Capital Management L.P. (continues as the “Investment Adviser”). We have entered into an investment advisory and management agreement with the Investment Adviser (the “Investment Advisory Agreement”) under which the Investment Adviser, subject to the overall supervision of our Board of Directors, manages the day-to-day operations of, and provides investment advisory services to, us. Under the terms of the Investment Advisory Agreement, the Investment Adviser: (i) determines the composition of our portfolio, the nature and timing of the changes to our portfolio and the manner of implementing such changes, (ii) identifies, evaluates and negotiates the structure of the investments we make (including performing due diligence on our prospective portfolio companies); and (iii) closes and monitors investments we make.
The Investment Adviser’s services under the Investment Advisory Agreement are not exclusive, and it is free to furnish similar services to other entities so long as its services to us are not impaired. For providing these services the Investment Adviser receives a fee from us, consisting of two components: a base management fee and an incentive fee. The base management fee is calculated at an annual rate of 2.00% on our gross assets (including amounts borrowed). For services currently rendered under the Investment Advisory Agreement, the base management fee is payable quarterly in arrears. The base management fee is calculated based on the average value of our gross assets at the end of the two most recently completed calendar quarters and appropriately adjusted for any share issuances or repurchases during the current calendar quarter.
The total base management fee incurred to the favor of the Investment Adviser was $134,590, $108,990 and $69,800 during the years ended June 30, 2015, 2014 and 2013, respectively.
The Investment Adviser has entered into a servicing agreement with certain institutions, where we serve as the agent and collect a servicing fee on behalf of the Investment Adviser. During the year ended June 30, 2015, we received payments of $170 from these institutions, on behalf of the Investment Adviser, for providing such services under the servicing agreement. We were given a credit for these payments as a reduction of base management fee payable by us to Prospect Capital Management.
The incentive fee has two parts. The first part, the income incentive fee, is calculated and payable quarterly in arrears based on our pre-incentive fee net investment income for the immediately preceding calendar quarter. For this purpose, pre-incentive fee net investment income means interest income, dividend income and any other income (including any other fees (other than fees for providing managerial assistance), such as commitment, origination, structuring, diligence and consulting fees and other fees that we receive from portfolio companies) accrued during the calendar quarter, minus our operating expenses for the quarter (including the base management fee, expenses payable under the Administration Agreement described below, and any interest expense and dividends paid on any issued and outstanding preferred stock, but excluding the incentive fee). Pre-incentive fee net investment income includes, in the case of investments with a deferred interest feature (such as original issue discount, debt instruments with payment-in-kind interest and zero coupon securities), accrued income that we have not yet received in cash. Pre-incentive fee net investment income does not include any realized capital gains, realized capital losses or unrealized capital appreciation or depreciation. Pre-incentive fee net investment income, expressed as a rate of return on the value of our net assets at the end of the immediately preceding calendar quarter, is compared to a “hurdle rate” of 1.75% per quarter (7.00% annualized).
The net investment income used to calculate this part of the incentive fee is also included in the amount of the gross assets used to calculate the 2.00% base management fee. We pay the Investment Adviser an income incentive fee with respect to our pre-incentive fee net investment income in each calendar quarter as follows:
• | No incentive fee in any calendar quarter in which our pre-incentive fee net investment income does not exceed the hurdle rate; |
• | 100.00% of our pre-incentive fee net investment income with respect to that portion of such pre-incentive fee net investment income, if any, that exceeds the hurdle rate but is less than 125.00% of the quarterly hurdle rate in any calendar quarter (8.75% annualized assuming a 7.00% annualized hurdle rate); and |
• | 20.00% of the amount of our pre-incentive fee net investment income, if any, that exceeds 125.00% of the quarterly hurdle rate in any calendar quarter (8.75% annualized assuming a 7.00% annualized hurdle rate). |
These calculations are appropriately prorated for any period of less than three months and adjusted for any share issuances or repurchases during the current quarter.
170
The second part of the incentive fee, the capital gains incentive fee, is determined and payable in arrears as of the end of each calendar year (or upon termination of the Investment Advisory Agreement, as of the termination date), and equals 20.00% of our realized capital gains for the calendar year, if any, computed net of all realized capital losses and unrealized capital depreciation at the end of such year. In determining the capital gains incentive fee payable to the Investment Adviser, we calculate the aggregate realized capital gains, aggregate realized capital losses and aggregate unrealized capital depreciation, as applicable, with respect to each investment that has been in its portfolio. For the purpose of this calculation, an “investment” is defined as the total of all rights and claims which maybe asserted against a portfolio company arising from our participation in the debt, equity, and other financial instruments issued by that company. Aggregate realized capital gains, if any, equal the sum of the differences between the aggregate net sales price of each investment and the aggregate cost basis of such investment when sold or otherwise disposed. Aggregate realized capital losses equal the sum of the amounts by which the aggregate net sales price of each investment is less than the aggregate cost basis of such investment when sold or otherwise disposed. Aggregate unrealized capital depreciation equals the sum of the differences, if negative, between the aggregate valuation of each investment and the aggregate cost basis of such investment as of the applicable calendar year-end. At the end of the applicable calendar year, the amount of capital gains that serves as the basis for our calculation of the capital gains incentive fee involves netting aggregate realized capital gains against aggregate realized capital losses on a since-inception basis and then reducing this amount by the aggregate unrealized capital depreciation. If this number is positive, then the capital gains incentive fee payable is equal to 20.00% of such amount, less the aggregate amount of any capital gains incentive fees paid since inception.
The total income incentive fee incurred was $90,687, $89,306 and $81,231 during the years ended June 30, 2015, 2014 and 2013, respectively. No capital gains incentive fee was incurred during the years ended June 30, 2015, 2014 and 2013.
Administration Agreement
We have also entered into an administration agreement (the “Administration Agreement”) with Prospect Administration under which Prospect Administration, among other things, provides (or arranges for the provision of) administrative services and facilities for us. For providing these services, we reimburse Prospect Administration for our allocable portion of overhead incurred by Prospect Administration in performing its obligations under the Administration Agreement, including rent and our allocable portion of the costs of our Chief Financial Officer and Chief Compliance Officer and his staff. Under this agreement, Prospect Administration furnishes us with office facilities, equipment and clerical, bookkeeping and record keeping services at such facilities. Prospect Administration also performs, or oversees the performance of, our required administrative services, which include, among other things, being responsible for the financial records that we are required to maintain and preparing reports to our stockholders and reports filed with the SEC. In addition, Prospect Administration assists us in determining and publishing our net asset value, overseeing the preparation and filing of our tax returns and the printing and dissemination of reports to our stockholders, and generally oversees the payment of our expenses and the performance of administrative and professional services rendered to us by others. Under the Administration Agreement, Prospect Administration also provides on our behalf managerial assistance to those portfolio companies to which we are required to provide such assistance (see “Managerial Assistance” below). The Administration Agreement may be terminated by either party without penalty upon 60 days’ written notice to the other party. Prospect Administration is a subsidiary of the Investment Adviser.
The Administration Agreement provides that, absent willful misfeasance, bad faith or negligence in the performance of its duties or by reason of the reckless disregard of its duties and obligations, Prospect Administration and its officers, managers, partners, agents, employees, controlling persons, members and any other person or entity affiliated with it are entitled to indemnification from us for any damages, liabilities, costs and expenses (including reasonable attorneys’ fees and amounts reasonably paid in settlement) arising from the rendering of Prospect Administration’s services under the Administration Agreement or otherwise as administrator for us. Our payments to Prospect Administration are periodically reviewed by our Board of Directors.
The allocation of overhead expense from Prospect Administration was $21,906, $14,373 and $8,737 for the years ended June 30, 2015, 2014 and 2013, respectively. During the year ended June 30, 2015, Prospect Administration received payments of $6,929 directly from our portfolio companies for legal, tax and portfolio level accounting services. We were given a credit for these payments as a reduction of the administrative services cost payable by us to Prospect Administration, resulting in net overhead expense of $14,977 during the year ended June 30, 2015. Had Prospect Administration not received these payments, Prospect Administration’s charges for its administrative services would have increased by these amounts.
171
Managerial Assistance
As a BDC, we are obligated under the 1940 Act to make available to certain of our portfolio companies significant managerial assistance. “Making available significant managerial assistance” refers to any arrangement whereby we provide significant guidance and counsel concerning the management, operations, or business objectives and policies of a portfolio company. We are also deemed to be providing managerial assistance to all portfolio companies that we control, either by ourselves or in conjunction with others. The nature and extent of significant managerial assistance provided by us to controlled and non-controlled portfolio companies will vary according to the particular needs of each portfolio company. Examples of such activities include (i) advice on recruiting, hiring, management and termination of employees, officers and directors, succession planning and other human resource matters; (ii) advice on capital raising, capital budgeting, and capital expenditures; (iii) advice on advertising, marketing, and sales; (iv) advice on fulfillment, operations, and execution; (v) advice on managing relationships with unions and other personnel organizations, financing sources, vendors, customers, lessors, lessees, lawyers, accountants, regulators and other important counterparties; (vi) evaluating acquisition and divestiture opportunities, plant expansions and closings, and market expansions; (vii) participating in audit committee, nominating committee, board and management meetings; (viii) consulting with and advising board members and officers of portfolio companies (on overall strategy and other matters); and (ix) providing other organizational, operational, managerial and financial guidance.
Prospect Administration, when performing a managerial assistance agreement executed with each portfolio company to which we provide managerial assistance, arranges for the provision of such managerial assistance on our behalf. When doing so, Prospect Administration utilizes personnel of our Investment Adviser. We, on behalf of Prospect Administration, invoice portfolio companies receiving and paying for managerial assistance, and we remit to Prospect Administration its cost of providing such services, including the charges deemed appropriate by our Investment Adviser for providing such managerial assistance. No income was recognized by Prospect.
During the years ended June 30, 2015, 2014 and 2013, we received payments of $5,126, $6,612 and $4,776, respectively, from our portfolio companies for managerial assistance and subsequently remitted these amounts to Prospect Administration. During the year ended June 30, 2015, we incurred $2,400 of managerial assistance expense related to our consolidated entity First Tower Delaware which was included within allocation from Prospect Administration on our Consolidated Statement of Operations for the year ended June 30, 2015. Of this amount, $600 had not yet been paid by First Tower Delaware to Prospect Administration and was included within due to Prospect Administration on our Consolidated Statement of Assets and Liabilities as of June 30, 2015. See Note 14 for further discussion.
Co-Investments
On February 10, 2014, we received an exemptive order from the SEC (the “Order”) that gave us the ability to negotiate terms other than price and quantity of co-investment transactions with other funds managed by the Investment Adviser or certain affiliates, including Priority Income Fund, Inc. and Pathway Energy Infrastructure Fund, Inc., subject to the conditions included therein. Under the terms of the relief permitting us to co-invest with other funds managed by our Investment Adviser or its affiliates, a “required majority” (as defined in Section 57(o) of the 1940 Act) of our independent directors must make certain conclusions in connection with a co-investment transaction, including that (1) the terms of the proposed transaction, including the consideration to be paid, are reasonable and fair to us and our stockholders and do not involve overreaching of us or our stockholders on the part of any person concerned and (2) the transaction is consistent with the interests of our stockholders and is consistent with our investment objective and strategies. In certain situations where co-investment with one or more funds managed by the Investment Adviser or its affiliates is not covered by the Order, such as when there is an opportunity to invest in different securities of the same issuer, the personnel of the Investment Adviser or its affiliates will need to decide which fund will proceed with the investment. Such personnel will make these determinations based on policies and procedures, which are designed to reasonably ensure that investment opportunities are allocated fairly and equitably among affiliated funds over time and in a manner that is consistent with applicable laws, rules and regulations. Moreover, except in certain circumstances, when relying on the Order, we will be unable to invest in any issuer in which one or more funds managed by the Investment Adviser or its affiliates has previously invested.
As of June 30, 2015, we had co-investments with Priority Income Fund, Inc. in the following CLO funds: Babson CLO Ltd. 2014-III; Cent CLO 21 Limited; CIFC Funding 2014-IV Investor, Ltd.; Galaxy XVII CLO, Ltd.; Halcyon Loan Advisors Funding 2014-2 Ltd.; HarbourView CLO VII, Ltd.; Jefferson Mill CLO Ltd.; Mountain View CLO IX Ltd.; Symphony CLO XIV Ltd.; Voya CLO 2014-1, Ltd.; and Washington Mill CLO Ltd.
172
Note 14. Transactions with Controlled Companies
The descriptions below detail the transactions which Prospect Capital Corporation (“Prospect”) has entered into with each of our controlled companies. Certain of the controlled entities discussed below were consolidated effective July 1, 2014 (see Note 1). As such, transactions with these Consolidated Holding Companies for the year ended June 30, 2015 are presented on a consolidated basis.
Airmall Inc.
As of June 30, 2014, Prospect owned 100% of the equity of AMU Holdings Inc. (“AMU”), a Consolidated Holding Company. AMU owned 98% of Airmall Inc. (f/k/a Airmall USA Holdings, Inc.) (“Airmall”). Airmall is a developer and manager of airport retail operations.
On July 30, 2010, Prospect made a $22,420 investment in AMU, of which $12,500 was a senior subordinated note and $9,920 was used to purchase 100% of the preferred and common equity of AMU. AMU used its combined debt and equity proceeds of $22,420 to purchase 100% of Airmall’s common stock for $18,000, to pay $1,573 of structuring fees from AMU to Prospect (which was recognized by Prospect as structuring fee income), $836 of third party expenses, $11 of legal services provided by attorneys at Prospect Administration, and $2,000 of withholding tax. Prospect then purchased for $30,000 two loans of Airmall payable to unrealized third parties, one for $10,000 and the other $20,000. Prospect and Airmall subsequently refinanced the two loans into a single $30,000 loan from Airmall to Prospect.
On October 1, 2013, Prospect made an additional $2,600 investment in the senior subordinated note, of which $575 was utilized by AMU to pay interest due to Prospect and $2,025 was retained by AMU for working capital. On November 25, 2013, Prospect funded an additional $5,000 to the senior subordinated note, which was utilized by AMU to pay a $5,000 dividend to Prospect. On December 4, 2013, Prospect sold 2% of the outstanding principal balance of the senior secured term loan to Airmall and 2% of the outstanding principal balance of the senior subordinated note to AMU for $972.
On June 13, 2014, Prospect made a new $19,993 investment as a senior secured loan to Airmall. Airmall then distributed this amount to AMU as a return of capital, which AMU used to pay down the senior subordinated loan in the same amount. The minority interest held by a third party in AMU was exchanged for common stock of Airmall.
On July 1, 2014, Prospect began consolidating AMU. As a result, any transactions between AMU and Prospect are eliminated in consolidation and as such, transactions after July 1, 2014 are not presented below.
On August 1, 2014, Prospect sold its investments in Airmall for net proceeds of $51,379 and realized a loss of $3,473 on the sale. In addition, there is $6,000 being held in escrow, of which 98% is due to Prospect, which will be recognized as an additional realized loss if it is not received. Included in the net proceeds were $3,000 of structuring fees from Airmall related to the sale of the operating company which was recognized as other income during the year ended June 30, 2015. On October 22, 2014, Prospect received a tax refund of $665 related to its investment in Airmall and realized a gain of the same amount.
In addition to the repayments noted above, the following amounts were paid from Airmall to Prospect and recorded by Prospect as repayment of loan receivable:
Year Ended June 30, 2013 | $ | 600 | |
Year Ended June 30, 2014 | 593 | ||
Year Ended June 30, 2015 | 49 | ||
The following dividends were declared and paid from Airmall to AMU and recognized as dividend income by AMU:
Year Ended June 30, 2013 | $ | — | |
Year Ended June 30, 2014 | 7,000 | ||
Year Ended June 30, 2015 | N/A | ||
The following dividends were declared and paid from AMU to Prospect and recognized as dividend income by Prospect:
Year Ended June 30, 2013 | $ | — | |
Year Ended June 30, 2014 | 12,000 | ||
Year Ended June 30, 2015 | N/A | ||
173
All dividends were paid from earnings and profits of Airmall and AMU.
The following interest payments were accrued and paid from AMU to Prospect and recognized by Prospect as interest income:
Year Ended June 30, 2013 | $ | 2,286 | |
Year Ended June 30, 2014 | 3,159 | ||
Year Ended June 30, 2015 | N/A | ||
Included above, the following payment-in-kind interest from AMU was capitalized and recognized by Prospect as interest income:
Year Ended June 30, 2013 | $ | — | |
Year Ended June 30, 2014 | 295 | ||
Year Ended June 30, 2015 | N/A | ||
The following interest payments were accrued and paid from Airmall to Prospect and recognized by Prospect as interest income:
Year Ended June 30, 2013 | $ | 3,536 | |
Year Ended June 30, 2014 | 3,420 | ||
Year Ended June 30, 2015 | 576 | ||
The following interest income recognized had not yet been paid by Airmall to Prospect and was included by Prospect within interest receivable:
June 30, 2014 | $ | 920 | |
June 30, 2015 | — | ||
The following managerial assistance payments were paid from AMU to Prospect and subsequently remitted to Prospect Administration (no income was recognized by Prospect):
Year Ended June 30, 2013 | $ | 225 | |
Year Ended June 30, 2014 | 300 | ||
Year Ended June 30, 2015 | N/A | ||
The following managerial assistance payments were paid from Airmall to Prospect and subsequently remitted to Prospect Administration (no income was recognized by Prospect):
Year Ended June 30, 2013 | $ | — | |
Year Ended June 30, 2014 | — | ||
Year Ended June 30, 2015 | 75 | ||
The following managerial assistance recognized had not yet been paid by Airmall to Prospect and was included by Prospect within other receivables and due to Prospect Administration:
June 30, 2014 | $ | 75 | |
June 30, 2015 | — | ||
The following payments were paid from Airmall to Prospect Administration as reimbursement for legal, tax and portfolio level accounting services provided directly to Airmall (no direct income was recognized by Prospect, but Prospect was given credit for these payments as a reduction of the administrative services costs payable by Prospect to Prospect Administration):
Year Ended June 30, 2013 | $ | 8 | |
Year Ended June 30, 2014 | — | ||
Year Ended June 30, 2015 | 730 | ||
174
The following amounts were due from Airmall to Prospect for reimbursement of expenses paid by Prospect on behalf of Airmall and were included by Prospect within other receivables:
June 30, 2014 | $ | 11 | |
June 30, 2015 | — | ||
American Property REIT Corp.
Prospect owns 100% of the equity of APH Property Holdings, LLC (“APH”), a Consolidated Holding Company. APH owns 100% of the common equity of American Property REIT Corp. (f/k/a American Property Holdings Corp.) (“APRC”). APRC is a Maryland corporation and a qualified REIT for federal income tax purposes. In order to qualify as a REIT, APRC issued 125 shares of Series A Cumulative Non-Voting Preferred Stock to 125 accredited investors. The preferred stockholders are entitled to receive cumulative dividends semi-annually at an annual rate of 12.5% and do not have the ability to participate in the management or operation of APRC.
APRC was formed to hold for investment, operate, finance, lease, manage, and sell a portfolio of real estate assets and engage in any and all other activities as may be necessary, incidental or convenient to carry out the foregoing. APRC acquires real estate assets, including, but not limited to, industrial, commercial, and multi-family properties. APRC may acquire real estate assets directly or through joint ventures by making a majority equity investment in a property-owning entity (the “JV”).
On October 24, 2012, Prospect initially made a $7,808 investment in APH, of which $6,000 was a Senior Term Loan and $1,808 was used to purchase the membership interests of APH. The proceeds were utilized by APH to purchase APRC common equity for $7,806, with $2 retained by APH for working capital. The proceeds were utilized by APRC to purchase a 100% ownership interest in 146 Forest Parkway, LLC for $7,326, pay a $250 non-refundable deposit and $222 of structuring fees to Prospect (which was recognized by Prospect as structuring fee income), with $8 retained by APRC for working capital. 146 Forest Parkway, LLC was purchased for $7,400. The remaining proceeds were used to pay $168 of third party expenses and $5 of legal services provided by attorneys at Prospect Administration, with $3 retained by the JV for working capital. The investment was subsequently contributed to NPRC.
On December 28, 2012, Prospect made a $9,594 investment in APH, of which $6,400 was a Senior Term Loan and $3,194 was used to purchase additional membership interests of APH. The proceeds were utilized by APH to purchase additional APRC common equity for $9,594. The proceeds were utilized by APRC to purchase a 92.7% ownership interest in 1557 Terrell Mill Road, LLC for $9,548, with $46 retained by APRC for other expenses. The JV was purchased for $23,500 which included debt financing and minority interest of $15,275 and $757, respectively. The remaining proceeds were used to pay $286 of structuring fees to Prospect (which was recognized by Prospect as structuring fee income) and $1,652 of third party expenses, with $142 retained by the JV for working capital.
On January 17, 2013, Prospect made a $30,348 investment in APH, of which $27,600 was a Senior Term Loan and $2,748 was used to purchase additional membership interests of APH. The proceeds were utilized by APH to purchase additional APRC common equity for $29,348, with $1,000 retained by APH for working capital. The proceeds were utilized by APRC to purchase a 97.7% ownership interest in 5100 Live Oaks Blvd, LLC for $29,348. The JV was purchased for $63,400 which included debt financing and minority interest of $39,600 and $686, respectively. The remaining proceeds were used to pay $880 of structuring fees to Prospect (which was recognized by Prospect as structuring fee income), $4,265 of third party expenses, $14 of legal services provided by attorneys at Prospect Administration, and $1,030 of prepaid assets, with $45 retained by the JV for working capital. The investment was subsequently contributed to NPRC.
On April 30, 2013, Prospect made a $10,383 investment in APH, of which $9,000 was a Senior Term Loan and $1,383 was used to purchase additional membership interests of APH. The proceeds were utilized by APH to purchase additional APRC common equity for $10,233, with $150 retained by APH for working capital. The proceeds were utilized by APRC to purchase a 93.2% ownership interest in Lofton Place, LLC for $10,233. The JV was purchased for $26,000 which included debt financing and minority interest of $16,965 and $745, respectively. The remaining proceeds were used to pay $306 of structuring fees to Prospect (which was recognized by Prospect as structuring fee income), $1,223 of third party expenses, $5 of legal services provided by attorneys at Prospect Administration, and $364 of prepaid assets, with $45 retained by the JV for working capital.
175
On April 30, 2013, Prospect made a $10,863 investment in APH, of which $9,000 was a Senior Term Loan and $1,863 was used to purchase additional membership interests of APH. The proceeds were utilized by APH to purchase additional APRC common equity for $10,708, with $155 retained by APH for working capital. The proceeds were utilized by APRC to purchase a 93.2% ownership interest in Vista Palma Sola, LLC for $10,708. The JV was purchased for $27,000 which included debt financing and minority interest of $17,550 and $785, respectively. The remaining proceeds were used to pay $321 of structuring fees to Prospect (which was recognized by Prospect as structuring fee income), $1,272 of third party expenses, $4 of legal services provided by attorneys at Prospect Administration, and $401 of prepaid assets, with $45 retained by the JV for working capital.
On May 8, 2013, Prospect made a $6,118 investment in APH, of which $4,000 was a Senior Term Loan and $2,118 was used to purchase additional membership interests of APH. The proceeds were utilized by APH to purchase additional APRC common equity for $6,028, with $90 retained by APH for working capital. The proceeds were utilized by APRC to purchase a 93.3% ownership interest in Arlington Park Marietta, LLC for $6,028. Arlington Park Marietta, LLC was purchased for $14,850 which included debt financing and minority interest of $9,650 and $437, respectively. The remaining proceeds were used to pay $181 of structuring fees to Prospect (which was recognized by Prospect as structuring fee income), $911 of third party expenses, and $128 of prepaid assets, with $45 retained by the JV for working capital.
On June 24, 2013, Prospect made a $76,533 investment in APH, of which $63,000 was a Senior Term Loan and $13,533 was used to purchase additional membership interests of APH. The proceeds were utilized by APH to purchase additional APRC common equity for $75,233, with $1,300 retained by APH for working capital. The proceeds were utilized by APRC to purchase a 95.0% ownership interest in APH Carroll Resort, LLC for $74,398 and to pay $835 of structuring fees to Prospect (which was recognized by Prospect as structuring fee income). The JV was purchased for $225,000 which included debt financing and minority interest of $157,500 and $3,916, respectively. The remaining proceeds were used to pay $1,436 of structuring fees to Prospect (which was recognized by Prospect as structuring fee income), $7,687 of third party expenses, $8 of legal services provided by attorneys at Prospect Administration, and $1,683 of prepaid assets. The investment was subsequently contributed to NPRC and renamed NPRC Carroll Resort, LLC.
Between October 29, 2013 and December 4, 2013, Prospect made an $11,000 investment in APH, of which $9,350 was a Senior Term Loan and $1,650 was used to purchase additional membership interests of APH. The proceeds were utilized by certain of APH’s wholly-owned subsidiaries to purchase online consumer loans from a third party. The investment was subsequently contributed to NPRC.
On November 1, 2013, Prospect made a $9,869 investment in APH, of which $8,200 was a Senior Term Loan and $1,669 was used to purchase additional membership interests of APH. The proceeds were utilized by APH to purchase additional APRC common equity for $9,869. The proceeds were utilized by APRC to purchase a 94.0% ownership interest in APH Carroll 41, LLC for $9,548 and to pay $102 of structuring fees to Prospect (which was recognized by Prospect as structuring fee income), with $219 retained by APRC for working capital. The JV was purchased for $30,600 which included debt financing and minority interest of $22,497 and $609, respectively. The remaining proceeds were used to pay $190 of structuring fees to Prospect (which was recognized by Prospect as structuring fee income), $1,589 of third party expenses, $5 of legal services provided by attorneys at Prospect Administration, and $270 of prepaid assets. The investment was subsequently contributed to NPRC.
On November 15, 2013, Prospect made a $45,900 investment in APH, of which $38,500 was a Senior Term Loan and $7,400 was used to purchase additional membership interests of APH. The proceeds were utilized by APH to purchase additional APRC common equity for $45,900. The proceeds were utilized by APRC to purchase a 99.3% ownership interest in APH Gulf Coast Holdings, LLC for $45,024 and to pay $364 of structuring fees to Prospect (which was recognized by Prospect as structuring fee income), with $512 retained by APRC for working capital. The JV was purchased for $115,200 which included debt financing and minority interest of $75,558 and $337, respectively. The remaining proceeds were used to pay $1,013 of structuring fees to Prospect (which was recognized by Prospect as structuring fee income), $2,590 of third party expenses, $23 of legal services provided by attorneys at Prospect Administration, and $2,023 of prepaid assets, with $70 retained by the JV for working capital.
On November 19, 2013, Prospect made a $66,188 investment in APH, of which $55,000 was a Senior Term Loan and $11,188 was used to purchase additional membership interests of APH. The proceeds were utilized by APH to purchase additional APRC common equity for $66,188. The proceeds were utilized by APRC to purchase a 90.0% ownership interest in APH McDowell, LLC for $64,392 and to pay $695 of structuring fees to Prospect (which was recognized by Prospect as structuring fee income), with $1,101 retained by APRC for working capital. The JV was purchased for $238,605 which included debt financing and minority interest of $180,226 and $7,155, respectively. The remaining proceeds were used to pay $1,290 of structuring fees to Prospect (which was recognized by Prospect as structuring fee income), $9,205 of third party expenses, $23 of legal services provided by attorneys at Prospect Administration, and $1,160 of prepaid assets, with $1,490 retained by the JV for working capital. The investment was subsequently contributed to NPRC and renamed NPH McDowell, LLC.
176
On December 12, 2013, Prospect made a $22,507 investment in APH, of which $18,800 was a Senior Term Loan and $3,707 was used to purchase additional membership interests of APH. The proceeds were utilized by APH to purchase additional APRC common equity for $22,507. The proceeds were utilized by APRC to purchase a 92.6% ownership interest in South Atlanta Portfolio Holding Company, LLC for $21,874 and to pay $238 of structuring fees to Prospect (which was recognized by Prospect as structuring fee income), with $395 retained by APRC for working capital. The JV was purchased for $87,250 which included debt financing and minority interest of $67,493 and $1,756, respectively. The remaining proceeds were used to pay $437 of structuring fees to Prospect (which was recognized by Prospect as structuring fee income), $2,920 of third party expenses, and $116 of prepaid assets, with $400 retained by the JV for working capital. The investment was subsequently contributed to UPRC.
On December 31, 2013, APRC distributed its majority interests in five JVs holding real estate assets to APH. APH then distributed these JV interests to Prospect in a transaction characterized as a return of capital. Prospect, on the same day, contributed certain of these JV interests to NPH Property Holdings, LLC and the remainder to UPH Property Holdings, LLC (each wholly-owned subsidiaries of Prospect). Each of NPH and UPH immediately thereafter contributed these JV interests to NPRC and UPRC, respectively. The total investments in the JVs transferred consisted of $98,164 and $20,022 of debt and equity financing, respectively. There was no material gain or loss realized on these transactions.
On January 17, 2014, Prospect made a $6,565 investment in APH, of which $5,500 was a Senior Term Loan and $1,065 was used to purchase additional membership interests of APH. The proceeds were utilized by APH to purchase additional APRC common equity for $6,565. The proceeds were utilized by APRC to purchase a 99.3% ownership interest in APH Gulf Coast Holdings, LLC for $6,336 and to pay $54 of structuring fees to Prospect (which was recognized by Prospect as structuring fee income), with $175 retained by APRC for other expenses. The JV was purchased for $15,430 which included debt financing and minority interest of $10,167 and $48, respectively. The remaining proceeds were used to pay $143 of structuring fees to Prospect (which was recognized by Prospect as structuring fee income), $627 of third party expenses, $4 of legal services provided by attorneys at Prospect Administration, and $312 of prepaid assets, with $35 retained by the JV for working capital.
Effective April 1, 2014, Prospect made a new $167,162 senior term loan to APRC. APRC then distributed this amount to APH as a return of capital which was used to pay down the Senior Term Loan from APH by the same amount.
On June 4, 2014, Prospect made a $1,719 investment in APH to purchase additional membership interests of APH, which was revised to $1,732 on July 1, 2014. The proceeds were utilized by APH to purchase additional APRC common equity for $1,732. The proceeds were utilized by APRC to acquire the real property located at 975 South Cornwell, Yukon, OK (“Taco Bell, OK”) for $1,719 and pay $13 of third party expenses.
On July 1, 2014, Prospect began consolidating APH. As a result, any transactions between APH and Prospect are eliminated in consolidation and as such, transactions after July 1, 2014 are not presented below.
On November 26, 2014, APRC transferred its investment in APH Carroll Resort, LLC to NPRC and the investment was renamed NPRC Carroll Resort, LLC. As a result, Prospect’s investments in APRC related to this property also transferred to NPRC. The investments transferred consisted of $10,237 of equity and $65,586 of debt. There was no gain or loss realized on the transaction.
On May 1, 2015, APRC transferred its investment in 5100 Live Oaks Blvd, LLC to NPRC. As a result, Prospect’s investments in APRC related to this property also transferred to NPRC. The investments transferred consisted of $2,748 of equity and $29,990 of debt. There was no gain or loss realized on the transaction.
On May 6, 2015, Prospect made a $1,475 investment in APRC, of which $1,381 was a Senior Term Loan and $94 was used to purchase additional common equity of APRC through APH. The proceeds were utilized by APRC to purchase additional ownership interest in its twelve multi-family properties for $1,473 and pay $2 of legal services provided by attorneys at Prospect Administration. The minority interest holder also invested an additional $17 in the JVs. The proceeds were used by the JVs to fund $1,490 of capital expenditures.
During the year ended June 30, 2015, Prospect received $8 as a return of capital on the equity investment in APRC.
The following dividends were declared and paid from APRC to APH (partially via a wholly-owned subsidiary of APH) and recognized as dividend income by APH:
Year Ended June 30, 2013 | $ | 1,676 | |
Year Ended June 30, 2014 | 8,810 | ||
Year Ended June 30, 2015 | — | ||
All dividends were paid from earnings and profits of APRC.
177
The following interest payments were accrued and paid from APH to Prospect and recognized by Prospect as interest income:
Year Ended June 30, 2013 | $ | 2,898 | |
Year Ended June 30, 2014 | 13,928 | ||
Year Ended June 30, 2015 | N/A | ||
Included above, the following payment-in-kind interest from APH was capitalized and recognized by Prospect as interest income:
Year Ended June 30, 2013 | $ | 892 | |
Year Ended June 30, 2014 | 4,084 | ||
Year Ended June 30, 2015 | N/A | ||
The following interest payments were accrued and paid from APRC to Prospect and recognized by Prospect as interest income:
Year Ended June 30, 2013 | $ | — | |
Year Ended June 30, 2014 | 4,860 | ||
Year Ended June 30, 2015 | 14,747 | ||
Included above, the following payment-in-kind interest from APRC was capitalized and recognized by Prospect as interest income:
Year Ended June 30, 2013 | $ | — | |
Year Ended June 30, 2014 | 581 | ||
Year Ended June 30, 2015 | 4,529 | ||
The following interest income recognized had not yet been paid by APRC to Prospect and was included by Prospect within interest receivable:
June 30, 2014 | $ | 54 | |
June 30, 2015 | 25 | ||
The following royalty payments were paid from APH to Prospect and recognized by Prospect as other income:
Year Ended June 30, 2013 | $ | 140 | |
Year Ended June 30, 2014 | 1,418 | ||
Year Ended June 30, 2015 | N/A | ||
The following royalty payments were paid from APRC to Prospect and recognized by Prospect as other income:
Year Ended June 30, 2013 | $ | — | |
Year Ended June 30, 2014 | — | ||
Year Ended June 30, 2015 | 1,342 | ||
The following managerial assistance payments were paid from APRC to Prospect and subsequently remitted to Prospect Administration (no income was recognized by Prospect):
Year Ended June 30, 2013 | $ | 148 | |
Year Ended June 30, 2014 | 637 | ||
Year Ended June 30, 2015 | 590 | ||
The following managerial assistance payments received by Prospect had not yet been remitted to Prospect Administration and were included by Prospect within due to Prospect Administration:
June 30, 2014 | $ | 148 | |
June 30, 2015 | 148 | ||
178
The following payments were paid from APRC to Prospect Administration as reimbursement for legal, tax and portfolio level accounting services provided directly to APRC (no direct income was recognized by Prospect, but Prospect was given credit for these payments as a reduction of the administrative services costs payable by Prospect to Prospect Administration):
Year Ended June 30, 2013 | $ | 90 | |
Year Ended June 30, 2014 | 1,791 | ||
Year Ended June 30, 2015 | 301 | ||
The following amounts were due from APRC to Prospect for reimbursement of expenses paid by Prospect on behalf of APRC and were included by Prospect within other receivables:
June 30, 2014 | $ | 202 | |
June 30, 2015 | 124 | ||
Arctic Energy Services, LLC
Prospect owns 100% of the equity of Arctic Oilfield Equipment USA, Inc. (“Arctic Equipment”), a Consolidated Holding Company. Arctic Equipment owns 70% of the equity of Arctic Energy Services, LLC (“Arctic Energy”), with Ailport Holdings, LLC (“Ailport”) (100% owned and controlled by Arctic Energy management) owning the remaining 30% of the equity of Arctic Energy. Arctic Energy provides oilfield service personnel, well testing flowback equipment, frac support systems and other services to exploration and development companies in the Rocky Mountains.
On May 5, 2014, Prospect initially purchased 100% of the common shares of Arctic Equipment for $9,006. Proceeds were utilized by Arctic Equipment to purchase 70% of Arctic Energy as described in the following paragraph.
On May 5, 2014, Prospect made an additional $51,870 investment (including in exchange for 1,102,313 common shares of Prospect at fair value of $11,916) in Arctic Energy in exchange for a $31,640 senior secured loan and a $20,230 subordinated loan. Total proceeds received by Arctic Energy of $60,876 were used to purchase 70% of the equity interests in Arctic Energy from Ailport for $47,516, pay $875 of third-party expenses, $1,713 of structuring fees to Prospect (which was recognized as structuring fee income), $445 of legal services provided by attorneys at Prospect Administration and $10,327 was retained as working capital.
On July 1, 2014, Prospect began consolidating Arctic Equipment. As a result, any transactions between Arctic Equipment and Prospect are eliminated in consolidation and as such, transactions after July 1, 2014 are not presented below.
The following interest payments were accrued and paid from Arctic Energy to Prospect and recognized by Prospect as interest income:
Year Ended June 30, 2013 | $ | — | |
Year Ended June 30, 2014 | 1,050 | ||
Year Ended June 30, 2015 | 6,721 | ||
The following interest income recognized had not yet been paid by Arctic Energy to Prospect and was included by Prospect within interest receivable:
June 30, 2014 | $ | 18 | |
June 30, 2015 | 18 | ||
The following managerial assistance payments were paid from Arctic Energy to Prospect and subsequently remitted to Prospect Administration (no income was recognized by Prospect):
Year Ended June 30, 2013 | $ | — | |
Year Ended June 30, 2014 | 15 | ||
Year Ended June 30, 2015 | 100 | ||
179
The following managerial assistance payments received by Prospect had not yet been remitted to Prospect Administration and were included by Prospect within due to Prospect Administration:
June 30, 2014 | $ | 15 | |
June 30, 2015 | 25 | ||
The following payments were paid from Arctic Energy to Prospect Administration as reimbursement for legal, tax and portfolio level accounting services provided directly to Arctic Energy (no direct income was recognized by Prospect, but Prospect was given credit for these payments as a reduction of the administrative services costs payable by Prospect to Prospect Administration):
Year Ended June 30, 2013 | $ | — | |
Year Ended June 30, 2014 | 445 | ||
Year Ended June 30, 2015 | — | ||
The following amounts were due from Arctic Energy to Prospect for reimbursement of expenses paid by Prospect on behalf of Arctic Energy and were included by Prospect within other receivables:
June 30, 2014 | $ | 6 | |
June 30, 2015 | — | ||
The following amounts were due to Arctic Energy from Prospect for reimbursement of expenses paid by Arctic Energy on behalf of Prospect and were included by Prospect within other liabilities:
June 30, 2014 | $ | — | |
June 30, 2015 | 1 | ||
ARRM Services, Inc.
As of June 30, 2014, Prospect owned 79.53% of the fully-diluted common, 85.76% of the Series A Preferred and 100% of the Series B Preferred equity of ARRM Services, Inc. (f/k/a ARRM Holdings, Inc.) (“ARRM”). ARRM owned 100% of the equity of Ajax Rolled Ring & Machine, LLC (f/k/a Ajax Rolled Ring & Machine, Inc.) (“Ajax”). Ajax forges large seamless steel rings on two forging mills in the company’s York, South Carolina facility. The rings are used in a range of industrial applications, including in construction equipment and power turbines. Ajax also provides machining and other ancillary services.
As of July 1, 2011, the cost basis of Prospect’s total debt and equity investment in Ajax was $41,699, including capitalized payment-in-kind interest of $3,535. Prospect’s investment in Ajax consisted of the following: $20,607 of senior secured term debt (“Tranche A Term Loan”); $15,035 of subordinated secured term debt (“Tranche B Term Loan”); and $6,057 of common equity. In October 2011, ARRM assumed Ajax’s Tranche B Term Loan and the equity of Ajax was exchanged for equity in ARRM. Ajax was converted into a limited liability company shortly thereafter. On December 28, 2012, Prospect provided an additional $3,600 of unsecured debt to ARRM (“Promissory Demand Note”).
On April 1, 2013, Prospect refinanced its investment in Ajax and ARRM, increasing the total size of the debt investment to $38,537. The $19,837 Tranche A Term Loan was replaced with a new senior secured term loan to Ajax in the same amount. The $15,035 Tranche B Term Loan and $3,600 Promissory Demand Note were replaced with a new subordinated unsecured term loan to ARRM in the amount of $18,700. Prospect received $50 and $46 of structuring fees from Ajax and ARRM, respectively, which were recognized as other income.
On June 28, 2013, Prospect provided an additional $1,000 in the ARRM subordinated unsecured term loan to fund equity into Ajax. The proceeds were used by Ajax to repay senior debt to a third party. On October 11, 2013, Prospect provided $25,000 in preferred equity for the recapitalization of ARRM. After the financing, Prospect received repayment of the $20,008 subordinated unsecured term loan previously outstanding from ARRM. In March 2014, Prospect received $98 of structuring fees from Ajax related to the amendment of the loan agreement in September 2013.
180
On October 10, 2014, ARRM sold Ajax to a third party and repaid the $19,337 loan receivable to Prospect and Prospect recorded a realized loss of $23,560 related to the sale. Concurrent with the sale, Prospect’s ownership increased to 100% of the outstanding equity of ARRM Services, Inc. which was renamed SB Forging Company, Inc. (“SB Forging”). As such, Prospect began consolidating SB Forging on October 11, 2014. In addition, there is $3,000 being held in escrow of which $802 was received on May 6, 2015 for which Prospect realized a gain of the same amount. The remainder of the escrow will be recognized as additional gain if and when received. Prospect received $2,000 of structuring fees from Ajax related to the sale of the operating company which was recognized as other income during the year ended June 30, 2015.
In addition to the repayments noted above, the following amounts were paid from Ajax to Prospect and recorded by Prospect as repayment of loan receivable:
Year Ended June 30, 2013 | $ | 430 | |
Year Ended June 30, 2014 | 400 | ||
Year Ended June 30, 2015 | — | ||
The following interest payments, including prepayment penalty fees, were accrued and paid from ARRM to Prospect and recognized by Prospect as interest income:
Year Ended June 30, 2013 | $ | 993 | |
Year Ended June 30, 2014 | 1,029 | ||
Year Ended June 30, 2015 | — | ||
Included above, the following payment-in-kind interest from ARRM was capitalized and recognized by Prospect as interest income:
Year Ended June 30, 2013 | $ | — | |
Year Ended June 30, 2014 | 309 | ||
Year Ended June 30, 2015 | — | ||
The following interest payments, including prepayment penalty fees, were accrued and paid from Ajax to Prospect and recognized by Prospect as interest income:
Year Ended June 30, 2013 | $ | 4,183 | |
Year Ended June 30, 2014 | 2,082 | ||
Year Ended June 30, 2015 | 956 | ||
As of June 30, 2014, due to the pending sale transaction, Prospect reversed $3,844 of previously recognized payment-in-kind interest which we did not expect to receive.
The following interest income recognized had not yet been paid by Ajax to Prospect and was included by Prospect within interest receivable:
June 30, 2014 | $ | 6 | |
June 30, 2015 | — | ||
The following managerial assistance payments were paid from Ajax to Prospect and subsequently remitted to Prospect Administration (no income was recognized by Prospect):
Year Ended June 30, 2013 | $ | 225 | |
Year Ended June 30, 2014 | 180 | ||
Year Ended June 30, 2015 | 45 | ||
The following managerial assistance payments received by Prospect had not yet been remitted to Prospect Administration and were included by Prospect within due to Prospect Administration:
June 30, 2014 | $ | 45 | |
June 30, 2015 | — | ||
181
The following payments were paid from ARRM to Prospect Administration as reimbursement for legal, tax and portfolio level accounting services provided directly to ARRM (no direct income was recognized by Prospect, but Prospect was given credit for these payments as a reduction of the administrative services costs payable by Prospect to Prospect Administration):
Year Ended June 30, 2013 | $ | 63 | |
Year Ended June 30, 2014 | 17 | ||
Year Ended June 30, 2015 | 1,485 | ||
The following amounts were due from Ajax to Prospect for reimbursement of expenses paid by Prospect on behalf of Ajax and were included by Prospect within other receivables:
June 30, 2014 | $ | 2 | |
June 30, 2015 | — | ||
Borga, Inc.
As of June 30, 2014, Prospect owned 100% of the equity of STI Holding, Inc. (“STI”), a Consolidated Holding Company. STI owned 100% of the equity of Borga, Inc. (“Borga”). Borga manufactures pre-engineered metal buildings and components for the agricultural and light industrial markets.
On May 6, 2005, Patriot Capital Funding, Inc. (“Patriot”) (previously acquired by Prospect) provided $14,000 in senior secured debt to Borga. The debt was comprised of $1,000 Senior Secured Revolver, $3,500 Senior Secured Term Loan A, $2,500 Senior Secured Term Loan B and $7,000 Senior Secured Term Loan C. On March 31, 2009, Borga made its final amortization payment on the Senior Secured Term Loan A. The other loans remained outstanding. Prospect owned warrants to purchase 33,750 shares of common stock in Metal Buildings Holding Corporation (“Metal Buildings”), the former holding company of Borga. Metal Buildings owned 100% of Borga.
On March 8, 2010, Prospect acquired the remaining common stock of Borga.
On January 24, 2014, Prospect contributed its holdings in Borga to STI. STI also held $3,371 of proceeds from the sale of a minority equity interest in Smart Tuition Holdings, LLC (“SMART”). Prospect initially acquired membership interests in SMART indirectly as part of the Patriot acquisition on December 2, 2009 recording a zero cost basis for the equity investment. The $3,371 was distributed to Prospect on May 29, 2014, of which $3,246 was paid from earnings and profits of STI and was recognized as dividend income by Prospect. The remaining $125 was recognized as return of capital by Prospect.
On July 1, 2014, Prospect began consolidating STI. As a result, any transactions between STI and Prospect are eliminated in consolidation and as such, transactions after July 1, 2014 are not presented below.
On August 20, 2014, Prospect sold the assets of Borga, a wholly-owned subsidiary of STI, for net proceeds of $382 and realized a loss of $2,589 on the sale. On December 29, 2014, Borga was dissolved.
BXC Company, Inc.
As of June 30, 2014, Prospect owned 86.7% of Series A Preferred Stock, 96.8% of Series B Preferred Stock, and 83.1% of fully diluted common stock of BXC Company, Inc. (f/k/a BXC Holding Company) (“BXC”). BXC owned 100% of the common stock of Boxercraft Incorporated (“Boxercraft”).
As of July 1, 2012, the cost basis of Prospect’s total debt and equity investment in Boxercraft was $15,123, including capitalized payment-in-kind interest of $1,466. On December 31, 2013, Boxercraft repaid $100 of the senior secured term loan. On April 18, 2014, Prospect made a new $300 senior secured term loan to Boxercraft. During the period from July 1, 2012 through June 30, 2014, Prospect capitalized a total of $804 of paid-in-kind interest and accreted a total of $1,321 of the original purchase discount, increasing the total debt investment to $17,448 as of June 30, 2014.
Effective March 28, 2014, Prospect acquired voting control of BXC pursuant to a voting agreement and irrevocable proxy. Effective May 8, 2014, Prospect acquired control of BXC by transferring shares held by the other equity holders of BXC to Prospect pursuant to an assignment agreement entered into with such other equity holders.
On July 2, 2014, Prospect made a new $250 senior secured term loan to provide liquidity to Boxercraft.
182
On July 17, 2014, Prospect restructured the investments in BXC and Boxercraft. The existing Senior Secured Term Loan A and a portion of the existing Senior Secured Term Loan B were replaced with a new Senior Secured Term Loan A to Boxercraft. The remainder of the existing Senior Secured Term Loan B and the existing Senior Secured Term Loan C, Senior Secured Term Loan D, and Senior Secured Term Loan E were replaced with a new Senior Secured Term Loan B to Boxercraft. The existing Senior Secured Term Loan to Boxercraft was converted into Series D Preferred Stock in BXC.
During the year ended June 30, 2015, Prospect accrued $5 of administrative agent fees from Boxercraft (which were recognized by Prospect as other income). On August 25, 2014, Prospect sold Boxercraft, a wholly-owned subsidiary of BXC, for net proceeds of $750 and realized a net loss of $16,949 on the sale.
CCPI Inc.
Prospect owns 100% of the equity of CCPI Holdings Inc. (“CCPI Holdings”), a Consolidated Holding Company. CCPI Holdings owns 94.95% of the equity of CCPI Inc. (“CCPI”), with CCPI management owning the remaining 5.05% of the equity. CCPI owns 100% of each of CCPI Europe Ltd. and MEFEC B.V., and 45% of Gulf Temperature Sensors W.L.L.
On December 13, 2012, Prospect initially made a $15,921 investment (including 467,928 common shares of Prospect at fair value of $5,021) in CCPI Holdings, $7,500 senior secured note and $8,443 equity interest. The proceeds received by CCPI Holdings were partially utilized to purchase 95.13% of CCPI common stock for $14,878. The remaining proceeds were used to pay $395 of structuring fees from CCPI Holdings to Prospect (which were recognized by Prospect as structuring fee income), $215 for legal services provided by attorneys at Prospect Administration, $137 for third party expenses and $318 was retained by CCPI Holdings for working capital.
On December 13, 2012, Prospect made an additional investment of $18,000 in CCPI senior secured debt. The proceeds of the Prospect loan along with $14,878 of equity financing from CCPI Holdings (mentioned above) were used to purchase 95.13% of CCPI equity from the sellers for $31,829, provide $120 of debt financing to CCPI management (to partially fund a purchase by management of CCPI stock), fund $180 of structuring fees from CCPI to Prospect (which were recognized by Prospect as structuring fee income), pay $548 of third-party expenses, reimburse $12 for reimbursement of expenses paid by Prospect on behalf of CCPI (no income was recognized by Prospect) and $189 was retained by CCPI as working capital.
During the year ended June 30, 2014, certain members of CCPI management exercised options to purchase common stock, decreasing our ownership to 94.77%. On June 13, 2014, Prospect made a new $8,218 senior secured note to CCPI. CCPI then distributed this amount to CCPI Holdings as a return of capital which was used to pay down the $8,216 senior secured note from CCPI Holdings to Prospect. The remaining $2 was distributed to Prospect as a return of capital of Prospect’s equity investment in CCPI Holdings.
On July 1, 2014, Prospect began consolidating CCPI Holdings. As a result, any transactions between CCPI Holdings and Prospect are eliminated in consolidation and as such, transactions after July 1, 2014 are not presented below.
During the year ended June 30, 2015, CCPI repurchased 30 shares of its common stock from a former CCPI executive, decreasing the number of shares outstanding and increasing Prospect’s ownership to 94.95%.
In June 2015, CCPI engaged Prospect to provide certain investment banking and financial advisory services in connection with a possible transaction. As compensation for the services provided, Prospect received $525 of advisory fees from CCPI which was recognized as other income during the year ended June 30, 2015.
In addition to the repayments noted above, the following amounts were paid from CCPI to Prospect and recorded by Prospect as repayment of loan receivable:
Year Ended June 30, 2013 | $ | 338 | |
Year Ended June 30, 2014 | 450 | ||
Year Ended June 30, 2015 | 450 | ||
The following dividends were declared and paid from CCPI to CCPI Holdings and recognized as dividend income by CCPI Holdings:
Year Ended June 30, 2013 | $ | 794 | |
Year Ended June 30, 2014 | 1,266 | ||
Year Ended June 30, 2015 | — | ||
183
The following dividends were declared and paid from CCPI Holdings to Prospect and recognized as dividend income by Prospect:
Year Ended June 30, 2013 | $ | — | |
Year Ended June 30, 2014 | 500 | ||
Year Ended June 30, 2015 | N/A | ||
All dividends were paid from earnings and profits of CCPI and CCPI Holdings.
The following interest payments were accrued and paid from CCPI Holdings to Prospect and recognized by Prospect as interest income:
Year Ended June 30, 2013 | $ | 801 | |
Year Ended June 30, 2014 | 1,464 | ||
Year Ended June 30, 2015 | N/A | ||
Included above, the following payment-in-kind interest from CCPI Holdings was capitalized and recognized by Prospect as interest income:
Year Ended June 30, 2013 | $ | 159 | |
Year Ended June 30, 2014 | 557 | ||
Year Ended June 30, 2015 | N/A | ||
The following interest payments were accrued and paid from CCPI to Prospect and recognized by Prospect as interest income:
Year Ended June 30, 2013 | $ | 991 | |
Year Ended June 30, 2014 | 1,848 | ||
Year Ended June 30, 2015 | 3,332 | ||
Included above, the following payment-in-kind interest from CCPI was capitalized and recognized by Prospect as interest income:
Year Ended June 30, 2013 | $ | — | |
Year Ended June 30, 2014 | 27 | ||
Year Ended June 30, 2015 | 599 | ||
The following interest income recognized had not yet been paid by CCPI to Prospect and was included by Prospect within interest receivable:
June 30, 2014 | $ | 9 | |
June 30, 2015 | — | ||
The following royalty payments were paid from CCPI Holdings to Prospect and recognized by Prospect as other income:
Year Ended June 30, 2013 | $ | 32 | |
Year Ended June 30, 2014 | 71 | ||
Year Ended June 30, 2015 | N/A | ||
The following managerial assistance payments were paid from CCPI to Prospect and subsequently remitted to Prospect Administration (no income was recognized by Prospect):
Year Ended June 30, 2013 | $ | 132 | |
Year Ended June 30, 2014 | 240 | ||
Year Ended June 30, 2015 | 240 | ||
184
The following managerial assistance payments received by Prospect had not yet been remitted to Prospect Administration and were included by Prospect within due to Prospect Administration:
June 30, 2014 | $ | 60 | |
June 30, 2015 | 60 | ||
The following payments were paid from CCPI to Prospect Administration as reimbursement for legal, tax and portfolio level accounting services provided directly to CCPI (no direct income was recognized by Prospect, but Prospect was given credit for these payments as a reduction of the administrative services costs payable by Prospect to Prospect Administration):
Year Ended June 30, 2013 | $ | 214 | |
Year Ended June 30, 2014 | 249 | ||
Year Ended June 30, 2015 | — | ||
The following amounts were due from CCPI to Prospect for reimbursement of expenses paid by Prospect on behalf of CCPI and were included by Prospect within other receivables:
June 30, 2014 | $ | 10 | |
June 30, 2015 | — | ||
CP Energy Services Inc.
Prospect owns 100% of the equity of CP Holdings of Delaware LLC (“CP Holdings”), a Consolidated Holding Company. CP Holdings owns 82.3% of the equity of CP Energy Services Inc. (“CP Energy”), and the remaining 17.7% of the equity is owned by CP Energy management. As of June 30, 2014, CP Energy owned directly or indirectly 100% of each of CP Well Testing Services, LLC (f/k/a CP Well Testing Holding Company LLC) (“CP Well Testing”); CP Well Testing, LLC (“CP Well”); Fluid Management Services, Inc. (f/k/a Fluid Management Holdings, Inc.) (“Fluid Management”); Fluid Management Services LLC (f/k/a Fluid Management Holdings LLC); Wright Transport, Inc. (f/k/a Wright Holdings, Inc.); Wright Foster Disposals, LLC; Foster Testing Co., Inc.; ProHaul Transports, LLC; Artexoma Logistics, LLC; and Wright Trucking, Inc. Effective December 31, 2014, CP Energy underwent a corporate reorganization in order to consolidate certain of its wholly-owned subsidiaries. As of June 30, 2015, CP Energy owned directly or indirectly 100% of each of CP Well; Wright Foster Disposals, LLC; Foster Testing Co., Inc.; ProHaul Transports, LLC; and Wright Trucking, Inc. CP Energy provides oilfield flowback services and fluid hauling and disposal services through its subsidiaries.
On October 3, 2012, Prospect initially made a $21,500 senior secured debt investment in CP Well. As part of the transaction, Prospect received $430 of structuring fees from CP Well (which was recognized by Prospect as structuring fee income) and $7 was paid by CP Well to Prospect Administration for legal services provided by attorneys at Prospect Administration.
On August 2, 2013, Prospect invested $94,014 (including 1,918,342 unregistered shares of Prospect common stock at a fair value of $21,006) to support the recapitalization of CP Energy where Prospect acquired a controlling interest in CP Energy.
On August 2, 2013, Prospect invested $12,741 into CP Holdings to purchase 100% of the common stock in CP Holdings. The proceeds were used by CP Holdings to purchase 82.9% of the common stock in CP Energy for $12,135 and pay $606 of legal services provided by attorneys at Prospect Administration.
On August 2, 2013, Prospect made a senior secured debt investment of $58,773 in CP Energy. CP Energy also received $2,505 management co-investment in exchange for 17.1% of CP Energy common stock. Total proceeds received by CP Energy of $73,413 (including the $12,135 of equity financing from CP Holdings mentioned above) were used to purchase 100% of the equity interests in CP Well Testing and Fluid Management for $33,600 and $34,576, respectively. The remaining proceeds were used by CP Energy to pay $1,414 of structuring fees to Prospect (which was recognized by Prospect as structuring fee income) and pay $823 of third-party expenses, with $3,000 retained by CP Energy for working capital.
On August 2, 2013, Prospect made an additional senior secured debt investment of $22,500 in CP Well Testing. Total proceeds received by CP Well Testing of $56,100 (including the $33,600 of equity financing from CP Energy mentioned above) were used to purchase 100% of the equity interests in CP Well for $55,650 and pay $450 of structuring fees to Prospect (which was recognized by Prospect as structuring fee income). After the financing, Prospect received repayment of the $18,991 loan previously outstanding from CP Well.
185
On October 11, 2013, Prospect made a $746 follow-on investment in CP Holdings to fund equity into CP Energy and made an additional senior secured loan to CP Energy of $5,100. Management invested an additional $154 of equity in CP Energy, and the percentage ownership of CP Energy did not change. Total proceeds of $6,000 were used to purchase flowback equipment and expand the CP Well operations in West Texas.
On December 26, 2013, Prospect made an additional $1,741 follow-on investment in CP Holdings to fund equity into CP Energy and made an additional senior secured loan to CP Energy of $11,900. Management invested an additional $359 of equity in CP Energy, and the percentage ownership of CP Energy did not change. Total proceeds of $14,000 were used to purchase additional equipment.
On April 1, 2014, Prospect made new loans to CP Well (with Foster Testing Co., Inc.; ProHaul Transports, LLC; and Wright Trucking, Inc. as co-borrowers), two first lien loans in the amount of $11,035 and $72,238, and a second lien loan in the amount of $15,000. The proceeds of these loans were used to repay CP Energy’s senior secured term loan and CP Well Testing’s senior secured term loan previously outstanding from Prospect.
On July 1, 2014, Prospect began consolidating CP Holdings. As a result, any transactions between CP Holdings and Prospect are eliminated in consolidation and as such, transactions after July 1, 2014 are not presented below.
During the year ended June 30, 2015, certain members of CP Energy management exercised options to purchase common stock, decreasing our ownership to 82.3%.
The following interest payments were accrued and paid from CP Energy to Prospect and recognized by Prospect as interest income:
Year Ended June 30, 2013 | $ | — | |
Year Ended June 30, 2014 | 8,083 | ||
Year Ended June 30, 2015 | — | ||
The following interest payments were accrued and paid from CP Well Testing to Prospect and recognized by Prospect as interest income:
Year Ended June 30, 2013 | $ | — | |
Year Ended June 30, 2014 | 1,657 | ||
Year Ended June 30, 2015 | — | ||
The following interest payments were accrued and paid from CP Well to Prospect and recognized by Prospect as interest income:
Year Ended June 30, 2013 | $ | — | |
Year Ended June 30, 2014 | 4,118 | ||
Year Ended June 30, 2015 | 16,420 | ||
Included above, the following payment-in-kind interest from CP Well was capitalized and recognized by Prospect as interest income:
Year Ended June 30, 2013 | $ | — | |
Year Ended June 30, 2014 | — | ||
Year Ended June 30, 2015 | 2,818 | ||
The following interest income recognized had not yet been paid by CP Well to Prospect and was included by Prospect within interest receivable:
June 30, 2014 | $ | 45 | |
June 30, 2015 | 46 | ||
186
The following managerial assistance payments were paid from CP Energy to Prospect and subsequently remitted to Prospect Administration (no income was recognized by Prospect):
Year Ended June 30, 2013 | $ | — | |
Year Ended June 30, 2014 | 275 | ||
Year Ended June 30, 2015 | 300 | ||
The following managerial assistance payments received by Prospect had not yet been remitted to Prospect Administration and were included by Prospect within due to Prospect Administration:
June 30, 2014 | $ | 75 | |
June 30, 2015 | 75 | ||
The following payments were paid from CP Energy to Prospect Administration as reimbursement for legal, tax and portfolio level accounting services provided directly to CP Energy (no direct income was recognized by Prospect, but Prospect was given credit for these payments as a reduction of the administrative services costs payable to Prospect Administration):
Year Ended June 30, 2013 | $ | — | |
Year Ended June 30, 2014 | 609 | ||
Year Ended June 30, 2015 | 60 | ||
The following amounts were due from CP Energy to Prospect for reimbursement of expenses paid by Prospect on behalf of CP Energy and were included by Prospect within other receivables:
June 30, 2014 | $ | 4 | |
June 30, 2015 | 1 | ||
Credit Central Loan Company, LLC
Prospect owns 100% of the equity of Credit Central Holdings of Delaware, LLC (“Credit Central Delaware”), a Consolidated Holding Company. Credit Central Delaware owns 74.93% of the equity of Credit Central Loan Company, LLC (f/k/a Credit Central Holdings, LLC) (“Credit Central”), with entities owned by Credit Central management owning the remaining 25.07% of the equity. Credit Central owns 100% of each of Credit Central, LLC; Credit Central South, LLC; Credit Central of Texas, LLC; and Credit Central of Tennessee, LLC. Credit Central is a branch-based provider of installment loans.
On December 28, 2012, Prospect initially made a $47,663 investment (including the fair value of 897,906 common shares of Prospect for $9,581 on that date, which were included in the purchase cost paid to acquire Credit Central) in Credit Central Delaware, of which $38,082 was a Senior Secured Revolving Credit Facility and $9,581 to purchase the membership interests of Credit Central Delaware. The proceeds were partially utilized to purchase 74.75% of Credit Central’s membership interests for $43,293. The remaining proceeds were used to pay $1,440 of structuring fees from Credit Central Delaware to Prospect (which was recognized by Prospect as structuring fee income), $638 for third party expenses, $292 for legal services provided by attorneys at Prospect Administration and $2,000 was retained by Credit Central Delaware for working capital. On March 28, 2014, Prospect funded an additional $2,500 ($2,125 to the Senior Secured Revolving Credit Facility and $375 to purchase additional membership interests of Credit Central Delaware) which was utilized by Credit Central Delaware to pay a $2,000 dividend to Prospect and $500 was retained by Credit Central Delaware for working capital.
On June 26, 2014, Prospect made a new $36,333 second lien term loan to Credit Central. Credit Central then distributed this amount to Credit Central Delaware as a return of capital which was used to pay down the Senior Secured Revolving Credit Facility from Credit Central Delaware by the same amount. The remaining amount of the Senior Secured Revolving Credit Facility, $3,874, was then converted to additional membership interests in Credit Central Delaware.
On July 1, 2014, Prospect began consolidating Credit Central Delaware. As a result, any transactions between Credit Central Delaware and Prospect are eliminated in consolidation and as such, transactions after July 1, 2014 are not presented below.
During the year ended June 30, 2015, Credit Central redeemed 24,629 shares of its membership interest from former Credit Central employees, decreasing the number of shares outstanding and increasing Prospect’s ownership to 74.93%.
187
In addition to the repayments noted above, the following amounts were paid from Credit Central to Prospect and recorded by Prospect as repayment of loan receivable:
Year Ended June 30, 2013 | $ | — | |
Year Ended June 30, 2014 | — | ||
Year Ended June 30, 2015 | 300 | ||
The following dividends were declared and paid from Credit Central to Credit Central Delaware and recognized as dividend income by Credit Central Delaware:
Year Ended June 30, 2013 | $ | 4,796 | |
Year Ended June 30, 2014 | 10,431 | ||
Year Ended June 30, 2015 | — | ||
The following dividends were declared and paid from Credit Central Delaware to Prospect and recognized as dividend income by Prospect:
Year Ended June 30, 2013 | $ | — | |
Year Ended June 30, 2014 | 4,841 | ||
Year Ended June 30, 2015 | N/A | ||
During the year ended June 30, 2015, Prospect reclassified $159 of return of capital received from Credit Central Delaware in the year ended June 30, 2014 as dividend income.
All dividends were paid from earnings and profits of Credit Central and Credit Central Delaware.
The following interest payments were accrued and paid from Credit Central Delaware to Prospect and recognized by Prospect as interest income:
Year Ended June 30, 2013 | $ | 3,893 | |
Year Ended June 30, 2014 | 7,744 | ||
Year Ended June 30, 2015 | N/A | ||
The following interest payments were accrued and paid from Credit Central to Prospect and recognized by Prospect as interest income:
Year Ended June 30, 2013 | $ | — | |
Year Ended June 30, 2014 | 101 | ||
Year Ended June 30, 2015 | 7,375 | ||
Included above, the following payment-in-kind interest from Credit Central was capitalized and recognized by Prospect as interest income:
Year Ended June 30, 2013 | $ | — | |
Year Ended June 30, 2014 | — | ||
Year Ended June 30, 2015 | 300 | ||
The following interest income recognized had not yet been paid by Credit Central to Prospect and was included by Prospect within interest receivable:
June 30, 2014 | $ | 20 | |
June 30, 2015 | 20 | ||
188
The following royalty payments were paid from Credit Central Delaware to Prospect and recognized by Prospect as other income:
Year Ended June 30, 2013 | $ | 240 | |
Year Ended June 30, 2014 | 521 | ||
Year Ended June 30, 2015 | N/A | ||
The following royalty payments were paid from Credit Central to Prospect and recognized by Prospect as other income:
Year Ended June 30, 2013 | $ | — | |
Year Ended June 30, 2014 | — | ||
Year Ended June 30, 2015 | 1,220 | ||
The following managerial assistance payments were paid from Credit Central to Prospect and subsequently remitted to Prospect Administration (no income was recognized by Prospect):
Year Ended June 30, 2013 | $ | 350 | |
Year Ended June 30, 2014 | 700 | ||
Year Ended June 30, 2015 | 700 | ||
The following managerial assistance payments received by Prospect had not yet been remitted to Prospect Administration and were included by Prospect within due to Prospect Administration:
June 30, 2014 | $ | 175 | |
June 30, 2015 | 175 | ||
The following payments were paid from Credit Central to Prospect Administration as reimbursement for legal, tax and portfolio level accounting services provided directly to Credit Central (no direct income was recognized by Prospect, but Prospect was given credit for these payments as a reduction of the administrative services costs payable to Prospect Administration):
Year Ended June 30, 2013 | $ | 292 | |
Year Ended June 30, 2014 | 131 | ||
Year Ended June 30, 2015 | — | ||
The following amounts were due to Credit Central from Prospect for reimbursement of expenses paid by Credit Central on behalf of Prospect and were included by Prospect within other liabilities:
June 30, 2014 | $ | 38 | |
June 30, 2015 | 27 | ||
Echelon Aviation LLC
Prospect owns 99.02% of the membership interests of Echelon Aviation LLC (“Echelon”). Echelon owns 60.7% of the equity of AerLift Leasing Limited (“AerLift”).
On March 31, 2014, Prospect initially made a $92,628 investment in Echelon, of which $78,521 was a Senior Secured Revolving Credit Facility and $14,107 to purchase 100% of the membership interests of Echelon. The proceeds were partially utilized to purchase 60.7% of AerLift’s membership interests for $83,657. The remaining proceeds were used to pay $2,771 of structuring fees from Echelon to Prospect (which was recognized by Prospect as structuring fee income), $540 for third party expenses, $664 for legal and tax services provided by Prospect Administration and $4,996 was retained by Echelon for working capital.
During the year ended June 30, 2014, Echelon issued 57,779.44 Class B shares to the company’s President, decreasing Prospect’s ownership to 99.49%.
On July 1, 2014, Prospect sold a $400 participation in the Senior Secured Revolving Credit Facility, equal to 0.51% of the outstanding principal amount on that date.
On September 15, 2014, Echelon made an optional partial prepayment of $37,313 of the Senior Secured Revolving Credit Facility outstanding.
189
On September 30, 2014, Prospect made an additional $5,800 investment in the membership interests of Echelon.
During the year ended June 30, 2015, Echelon issued 54,482.06 Class B shares to the company’s President, decreasing Prospect’s ownership to 99.02%.
The following interest payments were accrued and paid from Echelon to Prospect and recognized by Prospect as interest income:
Year Ended June 30, 2013 | $ | — | |
Year Ended June 30, 2014 | 2,809 | ||
Year Ended June 30, 2015 | 6,895 | ||
The following interest income recognized had not yet been paid by Echelon to Prospect and was included by Prospect within interest receivable:
June 30, 2014 | $ | 2,809 | |
June 30, 2015 | 2,412 | ||
The following managerial assistance payments were paid from Echelon to Prospect and subsequently remitted to Prospect Administration (no income was recognized by Prospect):
Year Ended June 30, 2013 | $ | — | |
Year Ended June 30, 2014 | — | ||
Year Ended June 30, 2015 | 313 | ||
The following managerial assistance payments received by Prospect had not yet been remitted to Prospect Administration and were included by Prospect within due to Prospect Administration:
June 30, 2014 | $ | — | |
June 30, 2015 | 63 | ||
The following managerial assistance recognized had not yet been paid by Echelon to Prospect and was included by Prospect within other receivables and due to Prospect Administration:
June 30, 2014 | $ | 63 | |
June 30, 2015 | — | ||
The following payments were paid from Echelon to Prospect Administration as reimbursement for legal, tax and portfolio level accounting services provided directly to Echelon (no direct income was recognized by Prospect, but Prospect was given credit for these payments as a reduction of the administrative services costs payable by Prospect to Prospect Administration):
Year Ended June 30, 2013 | $ | — | |
Year Ended June 30, 2014 | 664 | ||
Year Ended June 30, 2015 | 211 | ||
The following amounts were due from Echelon to Prospect for reimbursement of expenses paid by Prospect on behalf of Echelon and were included by Prospect within other receivables:
June 30, 2014 | $ | 78 | |
June 30, 2015 | 30 | ||
Edmentum Ultimate Holdings, LLC
Prospect owns 37.1% of the equity of Edmentum Ultimate Holdings, LLC (“Edmentum Holdings”). Edmentum Holdings owns 100% of the equity of Edmentum, Inc. (“Edmentum”). Edmentum is the largest all subscription based, software as a service provider of online curriculum and assessments to the U.S. education market. Edmentum provides high-value, comprehensive online solutions that support educators to successfully transition learners from one stage to the next.
On May 17, 2012, Prospect initially made a $50,000 second lien term loan to Edmentum.
190
On June 9, 2015, Prospect provided additional debt and equity financing to support the recapitalization of Edmentum. As part of the recapitalization, Prospect exchanged 100% of the $50,000 second lien term loan previously outstanding for $26,365 of junior PIK notes and 370,964.14 Class A common units representing 37.1% equity ownership in Edmentum Holdings. In addition, Prospect invested $5,875 in senior PIK notes and committed $7,834 as part of a second lien revolving credit facility, of which $4,896 was funded at closing. On June 9, 2015, we determined that the impairment of Edmentum was other-than-temporary and recorded a realized loss of $22,116 for the amount that the amortized cost exceeded the fair value, reducing the amortized cost to $37,216.
Energy Solutions Holdings Inc.
Prospect owns 100% of the equity of Energy Solutions Holdings Inc. (f/k/a Gas Solutions Holdings Inc.) (“Energy Solutions”), a Consolidated Holding Company. Energy Solutions owns 100% of each of Change Clean Energy Company, LLC (f/k/a Change Clean Energy Holdings, LLC) (“Change Clean”); Freedom Marine Solutions, LLC (f/k/a Freedom Marine Services Holdings, LLC) (“Freedom Marine”); and Yatesville Coal Company, LLC (f/k/a Yatesville Coal Holdings, LLC) (“Yatesville”). Change Clean owns 100% of each of Change Clean Energy, LLC and Down East Power Company, LLC, and 50.1% of BioChips LLC. Freedom Marine owns 100% of each of Vessel Company, LLC (f/k/a Vessel Holdings, LLC) (“Vessel”); Vessel Company II, LLC (f/k/a Vessel Holdings II, LLC) (“Vessel II”); and Vessel Company III, LLC (f/k/a Vessel Holdings III, LLC) (“Vessel III”). Yatesville owns 100% of North Fork Collieries, LLC.
Energy Solutions owns interests in companies operating in the energy sector. These include companies operating offshore supply vessels, ownership of a non-operating biomass electrical generation plant and several coal mines. Energy Solutions subsidiaries formerly owned interests in gathering and processing business in east Texas. As of July 1, 2011, the cost basis of Prospect’s investment in Energy Solutions, including debt and equity, was $42,003.
In December 2011, Prospect completed a reorganization of Gas Solutions Holdings Inc. renaming the company Energy Solutions and transferring ownership of other operating companies owned by Prospect and operating within the energy industry. As part of the reorganization, Prospect transferred its debt and equity interests with cost basis of $2,540 in Change Clean Energy Holdings, Inc. and Change Clean Energy, Inc. to Change Clean; $12,504 in Freedom Marine Holdings, Inc. to Freedom Marine; and $1,449 of Yatesville Coal Holdings, Inc. to Yatesville. Each of these entities is wholly owned (directly or indirectly) by Energy Solutions. On December 28, 2011, Prospect made a follow-on $1,250 equity investment in Energy Solutions and a $3,500 debt investment in Vessel.
On January 4, 2012, Energy Solutions sold its gas gathering and processing assets held in Gas Solutions II Ltd. (“Gas Solutions”) for a potential sale price of $199,805, adjusted for the final working capital settlement, including a potential earn-out of $28,000 that may be paid based on the future performance of Gas Solutions. After expenses, including structuring fees of $9,966 paid to Prospect, and $3,152 of third-party expenses, Gas Solutions LP LLC and Gas Solutions GP LLC, subsidiaries of Gas Solutions, received $157,100 and $1,587 in cash, respectively, and subsequently distributed these amounts, $158,687 in total, to Energy Solutions. The sale of Gas Solutions by Energy Solutions resulted in significant earnings and profits, as defined by the Code, at Energy Solutions for calendar year 2012. In accordance with ASC 946, the distributions Prospect received from Energy Solutions during calendar year 2012 were required to be recognized as dividend income, as there were current year earnings and profits sufficient to support such recognition. As a result, we recognized dividends of $53,820 from Energy Solutions during the year ended June 30, 2013. No such dividends were received from Energy Solutions during the year ended June 30, 2014.
During the year ended June 30, 2013, Energy Solutions repaid $28,500 of senior and subordinated secured debt due to Prospect. In addition to the repayment of principal, Prospect received $19,543 of make-whole fees for early repayment of the outstanding loan receivables, which was recorded as additional interest income during the year ended June 30, 2013.
On November 25, 2013, Prospect restructured its investment in Freedom Marine. The $12,504 subordinated secured loan to Jettco Marine Services, LLC, a subsidiary of Freedom Marine, was replaced with a senior secured note to Vessel II. On December 3, 2013, Prospect made a $16,000 senior secured investment in Vessel III. Overall, the restructuring of Prospect’s investment in Freedom Marine provided approximately $16,000 net new senior secured debt financing to support the acquisition of two new vessels. Prospect received $2,480 of structuring fees from Energy Solutions related to the Freedom Marine restructuring which was recognized as other income.
During the year ended June 30, 2014, Energy Solutions repaid the remaining $8,500 of the subordinated secured debt due to Prospect. In addition to the repayment of principal, Prospect received $4,812 of make-whole fees for early repayment of the outstanding loan receivables, which was recorded as additional interest income during the year ended June 30, 2014.
On November 28, 2012 and January 1, 2014, Prospect received $475 and $25 of litigation settlement proceeds related to Change Clean and recorded a reduction in its equity investment cost basis for Energy Solutions, respectively.
191
On June 4, 2014, Gas Solutions GP LLC and Gas Solutions LP LLC merged with and into Freedom Marine, with Freedom Marine as the surviving entity.
On July 1, 2014, Prospect began consolidating Energy Solutions. As a result, any transactions between Energy Solutions and Prospect are eliminated in consolidation and as such, transactions after July 1, 2014 are not presented below. Transactions between Prospect and Freedom Marine are separately discussed below under “Freedom Marine Solutions, LLC.”
During the three months ended December 31, 2014, Prospect determined that the impairments of Change Clean and Yatesville were other-than-temporary and recorded a realized loss of $1,449, reducing the amortized cost to zero.
The following interest payments, including prepayment penalty fees, were accrued and paid from Energy Solutions to Prospect and recognized by Prospect as interest income:
Year Ended June 30, 2013 | $ | 24,172 | |
Year Ended June 30, 2014 | 5,368 | ||
Year Ended June 30, 2015 | N/A | ||
The following managerial assistance payments were paid from Energy Solutions to Prospect and subsequently remitted to Prospect Administration (no income was recognized by Prospect):
Year Ended June 30, 2013 | $ | 180 | |
Year Ended June 30, 2014 | 180 | ||
Year Ended June 30, 2015 | N/A | ||
The following managerial assistance payments received by Prospect had not yet been remitted to Prospect Administration and were included by Prospect within due to Prospect Administration:
June 30, 2014 | $ | 45 | |
June 30, 2015 | N/A | ||
The following payments were paid from Energy Solutions to Prospect Administration as reimbursement for legal, tax and portfolio level accounting services provided directly to Energy Solutions (no direct income was recognized by Prospect, but Prospect was given credit for these payments as a reduction of the administrative services costs payable by Prospect to Prospect Administration):
Year Ended June 30, 2013 | $ | 118 | |
Year Ended June 30, 2014 | — | ||
Year Ended June 30, 2015 | N/A | ||
First Tower Finance Company LLC
Prospect owns 100% of the equity of First Tower Holdings of Delaware LLC (“First Tower Delaware”), a Consolidated Holding Company. First Tower Delaware owns 80.1% of First Tower Finance Company LLC (f/k/a First Tower Holdings LLC) (“First Tower Finance”). First Tower Finance owns 100% of First Tower, LLC (“First Tower”), a multiline specialty finance company.
On June 15, 2012, Prospect made a $287,953 investment (including 14,518,207 common shares of Prospect at a fair value of $160,571) in First Tower Delaware, of which $244,760 was a Senior Secured Revolving Credit Facility and $43,193 of membership interest in First Tower Delaware. The proceeds were utilized by First Tower Delaware to purchase 80.1% of the membership interests in First Tower Finance for $282,968. The remaining proceeds at First Tower Delaware were used to pay $4,038 of structuring fees from First Tower Delaware to Prospect (which was recognized by Prospect as structuring fee income), $940 of legal services provided by attorneys at Prospect Administration, and $7 of third party expenses. Prospect received an additional $4,038 of structuring fees from First Tower (which was recognized by Prospect as structuring fee income). Management purchased the additional 19.9% of First Tower Finance common stock for $70,300. The combined proceeds received by First Tower Finance of $353,268 ($282,968 equity financing from First Tower Delaware mentioned above and $70,300 equity financing from management) were used to purchase 100% of the common stock of First Tower for $338,042, pay $11,188 of third-party expenses and $4,038 of structuring fees from First Tower mentioned above (which was recognized by Prospect as structuring fee income).
192
On October 18, 2012, Prospect made an additional $20,000 investment through the Senior Secured Revolving Credit Facility, $12,008 of which was invested by First Tower Delaware in First Tower Finance as equity and $7,992 of which was retained by First Tower Delaware as working capital. On December 30, 2013, Prospect funded an additional $10,000 into First Tower Delaware, $8,500 through the Senior Secured Revolving Credit Facility and $1,500 through the purchase of additional membership interests in First Tower Delaware. $8,000 of the proceeds were utilized by First Tower Delaware to pay structuring fees to Prospect for the renegotiation and expansion of First Tower’s third-party revolver, and $2,000 of the proceeds were retained by First Tower Delaware for working capital.
On June 24, 2014, Prospect made a new $251,246 second lien term loan to First Tower. First Tower distributed this amount to First Tower Finance, which distributed this amount to First Tower Delaware as a return of capital. First Tower Delaware used the distribution to partially pay down the Senior Secured Revolving Credit Facility. The remaining $23,712 of the Senior Secured Revolving Credit Facility was then converted to additional membership interests held by Prospect in First Tower Delaware.
On July 1, 2014, Prospect began consolidating First Tower Delaware. As a result, any transactions between First Tower Delaware and Prospect are eliminated in consolidation and as such, transactions after July 1, 2014 are not presented below.
The following cash distributions were declared and paid from First Tower Finance to First Tower Delaware and recognized as a return of capital by First Tower Delaware:
Year Ended June 30, 2013 | $ | 31,918 | |
Year Ended June 30, 2014 | 14,912 | ||
Year Ended June 30, 2015 | — | ||
The following dividends were declared and paid from First Tower Finance to First Tower Delaware and recognized as dividend income by First Tower Delaware:
Year Ended June 30, 2013 | $ | 54,035 | |
Year Ended June 30, 2014 | 36,064 | ||
Year Ended June 30, 2015 | — | ||
During the year ended June 30, 2015, Prospect reclassified $1,929 of return of capital received from First Tower Finance in prior periods as dividend income.
All dividends were paid from earnings and profits of First Tower Finance.
The following interest payments were accrued and paid from First Tower Delaware to Prospect and recognized by Prospect as interest income:
Year Ended June 30, 2013 | $ | 52,476 | |
Year Ended June 30, 2014 | 53,489 | ||
Year Ended June 30, 2015 | N/A | ||
Included above, the following payment-in-kind interest from First Tower Delaware was capitalized and recognized by Prospect as interest income:
Year Ended June 30, 2013 | $ | — | |
Year Ended June 30, 2014 | 1,698 | ||
Year Ended June 30, 2015 | N/A | ||
The following interest payments were accrued and paid from First Tower to Prospect and recognized by Prospect as interest income:
Year Ended June 30, 2013 | $ | — | |
Year Ended June 30, 2014 | 831 | ||
Year Ended June 30, 2015 | 52,900 | ||
193
Included above, the following payment-in-kind interest from First Tower was capitalized and recognized by Prospect as interest income:
Year Ended June 30, 2013 | $ | — | |
Year Ended June 30, 2014 | — | ||
Year Ended June 30, 2015 | 332 | ||
The following interest income recognized had not yet been paid by First Tower to Prospect and was included by Prospect within interest receivable:
June 30, 2014 | $ | 119 | |
June 30, 2015 | 4,612 | ||
The following royalty payments were paid from First Tower Delaware to Prospect and recognized by Prospect as other income:
Year Ended June 30, 2013 | $ | 2,426 | |
Year Ended June 30, 2014 | 2,560 | ||
Year Ended June 30, 2015 | N/A | ||
The following managerial assistance payments were paid from First Tower Delaware to Prospect and subsequently remitted to Prospect Administration (no income was recognized by Prospect):
Year Ended June 30, 2013 | $ | 2,520 | |
Year Ended June 30, 2014 | 2,400 | ||
Year Ended June 30, 2015 | N/A | ||
At June 30, 2014, $600 of managerial assistance received by Prospect had not yet been remitted to Prospect Administration and was included by Prospect within due to Prospect Administration.
The following managerial assistance payments were accrued and paid from First Tower Delaware to Prospect Administration and recognized by Prospect as an expense:
Year Ended June 30, 2013 | $ | — | |
Year Ended June 30, 2014 | — | ||
Year Ended June 30, 2015 | 2,400 | ||
At June 30, 2015, $600 of managerial assistance recognized had not yet been paid by First Tower Delaware to Prospect Administration and was included by Prospect within due to Prospect Administration.
The following payments were paid from First Tower Delaware to Prospect Administration as reimbursement for legal, tax and portfolio level accounting services provided directly to First Tower Delaware (no direct income was recognized by Prospect, but Prospect was given credit for these payments as a reduction of the administrative services costs payable by Prospect to Prospect Administration):
Year Ended June 30, 2013 | $ | 4 | |
Year Ended June 30, 2014 | 243 | ||
Year Ended June 30, 2015 | N/A | ||
The following amounts were due from First Tower to Prospect for reimbursement of expenses paid by Prospect on behalf of First Tower and were included by Prospect within other receivables:
June 30, 2014 | $ | 37 | |
June 30, 2015 | 20 | ||
194
Freedom Marine Solutions, LLC
As discussed above, Prospect owns 100% of the equity of Energy Solutions, a Consolidated Holding Company. Energy Solutions owns 100% of Freedom Marine. Freedom Marine owns 100% of each of Vessel, Vessel II, and Vessel III.
As of July 1, 2014, the cost basis of Prospect’s total debt and equity investment in Freedom Marine was $39,811, which consisted of the following: $3,500 senior secured note to Vessel; $12,504 senior secured note to Vessel II; $16,000 senior secured note to Vessel III; and $7,807 of equity.
On December 29, 2014, Freedom Marine reached a settlement for and received $5,174, net of third party obligations, related to the contingent earn-out from the sale of Gas Solutions in January 2012 which was retained by Freedom Marine. This is a final settlement and no further payments are expected from the sale. (See “Energy Solutions Holdings Inc.” above for more information related to the sale of Gas Solutions.)
The following interest payments were accrued and paid from Vessel to Prospect and recognized by Prospect as interest income:
Year Ended June 30, 2013 | $ | 637 | |
Year Ended June 30, 2014 | 641 | ||
Year Ended June 30, 2015 | 639 | ||
The following interest income recognized had not yet been paid by Vessel to Prospect and was included by Prospect within interest receivable:
June 30, 2014 | $ | 2 | |
June 30, 2015 | 2 | ||
The following interest payments were accrued and paid from Vessel II to Prospect and recognized by Prospect as interest income:
Year Ended June 30, 2013 | $ | — | |
Year Ended June 30, 2014 | 1,023 | ||
Year Ended June 30, 2015 | 1,713 | ||
The following interest income recognized had not yet been paid by Vessel II to Prospect and was included by Prospect within interest receivable:
June 30, 2014 | $ | 5 | |
June 30, 2015 | 5 | ||
The following interest payments were accrued and paid from Vessel III to Prospect and recognized by Prospect as interest income:
Year Ended June 30, 2013 | $ | — | |
Year Ended June 30, 2014 | 1,213 | ||
Year Ended June 30, 2015 | 2,109 | ||
The following interest income recognized had not yet been paid by Vessel III to Prospect and was included by Prospect within interest receivable:
June 30, 2014 | $ | 6 | |
June 30, 2015 | 6 | ||
The following managerial assistance payments were paid from Freedom Marine to Prospect and subsequently remitted to Prospect Administration (no income was recognized by Prospect):
Year Ended June 30, 2013 | $ | — | |
Year Ended June 30, 2014 | — | ||
Year Ended June 30, 2015 | 300 | ||
195
The following managerial assistance payments received by Prospect had not yet been remitted to Prospect Administration and were included by Prospect within due to Prospect Administration:
June 30, 2014 | $ | — | |
June 30, 2015 | 75 | ||
The following payments were paid from Freedom Marine to Prospect Administration as reimbursement for legal, tax and portfolio level accounting services provided directly to Freedom Marine (no direct income was recognized by Prospect, but Prospect was given credit for these payments as a reduction of the administrative services costs payable by Prospect to Prospect Administration):
Year Ended June 30, 2013 | $ | 1 | |
Year Ended June 30, 2014 | 38 | ||
Year Ended June 30, 2015 | 115 | ||
The following amounts were due from Freedom Marine to Prospect for reimbursement of expenses paid by Prospect on behalf of Freedom Marine and were included by Prospect within other receivables:
June 30, 2014 | $ | 1 | |
June 30, 2015 | 3 | ||
Gulf Coast Machine & Supply Company
Prospect owns 100% of the preferred equity of Gulf Coast Machine & Supply Company (“Gulf Coast”). Gulf Coast is a provider of value-added forging solutions to energy and industrial end markets.
On October 12, 2012, Prospect initially made a $42,000 first lien term loan to Gulf Coast, of which $840 was used to pay structuring fees from Gulf Coast to Prospect (which was recognized by Prospect as structuring fee income). During the year ended June 30, 2013, Gulf Coast repaid $787 of the first lien term loan.
Between July 1, 2013 and November 8, 2013, Gulf Coast repaid $263 of the first lien term loan, leaving a balance of $40,950. On November 8, 2013, Gulf Coast issued $25,950 of convertible preferred stock to Prospect (representing 99.9% of the voting securities of Gulf Coast) in exchange for crediting the same amount to the first lien term loan previously outstanding, leaving a first lien loan balance of $15,000. Prior to this conversion, Prospect was just a lender to Gulf Coast and the investment was not a controlled investment. On November 29, 2013 and December 16, 2013, Prospect provided an additional $1,000 and $1,500, respectively, to fund working capital needs, increasing the first lien loan balance to $17,500.
During the year ended June 30, 2015, Prospect made an additional $8,500 investment in the first lien term loan to Gulf Coast to fund capital improvements to key forging equipment and other liquidity needs.
The following interest payments were accrued and paid from Gulf Coast to Prospect and recognized by Prospect as interest income:
Year Ended June 30, 2013 | $ | — | |
Year Ended June 30, 2014 | 1,449 | ||
Year Ended June 30, 2015 | 1,370 | ||
The following interest income recognized had not yet been paid by Gulf Coast to Prospect and was included by Prospect within interest receivable:
June 30, 2014 | $ | 6 | |
June 30, 2015 | — | ||
The following amounts were due from Gulf Coast to Prospect for reimbursement of expenses paid by Prospect on behalf of Gulf Coast and were included by Prospect within other receivables:
June 30, 2014 | $ | 342 | |
June 30, 2015 | 1 | ||
196
Harbortouch Payments, LLC
Prospect owns 100% of the equity of Harbortouch Holdings of Delaware Inc. (“Harbortouch Delaware”), a Consolidated Holding Company. Harbortouch Delaware owns 100% of the Class C voting units of Harbortouch Payments, LLC (“Harbortouch”), which provide for a 53.5% residual profits allocation. Harbortouch management owns 100% of the Class B and D voting units of Harbortouch, which provide for a 46.5% residual profits allocation. Harbortouch owns 100% of Credit Card Processing USA, LLC. Harbortouch is a provider of transaction processing services and point-of sale equipment used by merchants across the United States.
On March 31, 2014, Prospect made a $147,898 investment (including 2,306,294 common shares of Prospect at a fair value of $24,908) in Harbortouch Delaware. Of this amount, $123,000 was loaned in exchanged for a subordinated note and $24,898 was an equity contribution. Harbortouch Delaware utilized $137,972 to purchase 100% of the Harbortouch Class A voting preferred units which provided an 11% preferred return and a 53.5% interest in the residual profits. Harbortouch Delaware used the remaining proceeds to pay $4,920 of structuring fees to Prospect (which was recognized by Prospect as structuring fee income), $1,761 for legal services provided by attorneys at Prospect Administration and $3,245 was retained by Harbortouch Delaware for working capital. Additionally, on March 31, 2014, Prospect provided Harbortouch a senior secured loan of $130,796. Prospect received a structuring fee of $2,616 from Harbortouch (which was recognized by Prospect as structuring fee income).
On April 1, 2014, Prospect made a new $137,226 senior secured term loan to Harbortouch. Harbortouch then distributed this amount to Harbortouch Delaware as a return of capital which was used to pay down the $123,000 senior secured note from Harbortouch Delaware to Prospect. The remaining $14,226 was distributed to Prospect as a return of capital of Prospect’s equity investment in Harbortouch Delaware.
On July 1, 2014, Prospect began consolidating Harbortouch Delaware. As a result, any transactions between Harbortouch Delaware and Prospect are eliminated in consolidation and as such, transactions after July 1, 2014 are not presented below.
On September 30, 2014, Prospect made a new $26,431 senior secured term loan to Harbortouch to support an acquisition. As part of the transaction, Prospect received $529 of structuring fees (which was recognized by Prospect as structuring fee income) and $50 of amendment fees (which was recognized by Prospect as amendment fee income).
On December 19, 2014, Prospect made an additional $1,291 equity investment in Harbortouch Class C voting units. This amount was deferred consideration stipulated in the original agreement.
In addition to the repayments noted above, the following amounts were paid from Harbortouch to Prospect and recorded by Prospect as repayment of loan receivable:
Year Ended June 30, 2013 | $ | — | |
Year Ended June 30, 2014 | — | ||
Year Ended June 30, 2015 | 5,371 | ||
The following cash distributions were declared and paid from Harbortouch to Harbortouch Holdings and recognized as a return of capital by Harbortouch Holdings:
Year Ended June 30, 2013 | $ | — | |
Year Ended June 30, 2014 | — | ||
Year Ended June 30, 2015 | 55 | ||
The following interest payments were accrued and paid from Harbortouch Delaware to Prospect and recognized by Prospect as interest income:
Year Ended June 30, 2013 | $ | — | |
Year Ended June 30, 2014 | 55 | ||
Year Ended June 30, 2015 | N/A | ||
197
The following interest payments were accrued and paid from Harbortouch to Prospect and recognized by Prospect as interest income:
Year Ended June 30, 2013 | $ | — | |
Year Ended June 30, 2014 | 6,824 | ||
Year Ended June 30, 2015 | 29,834 | ||
Included above, the following payment-in-kind interest from Harbortouch was capitalized and recognized by Prospect as interest income:
Year Ended June 30, 2013 | $ | — | |
Year Ended June 30, 2014 | — | ||
Year Ended June 30, 2015 | 7,652 | ||
The following interest income recognized had not yet been paid by Harbortouch to Prospect and was included by Prospect within interest receivable:
June 30, 2014 | $ | 1,962 | |
June 30, 2015 | 2,077 | ||
The following managerial assistance payments were paid from Harbortouch to Prospect and subsequently remitted to Prospect Administration (no income was recognized by Prospect):
Year Ended June 30, 2013 | $ | — | |
Year Ended June 30, 2014 | 125 | ||
Year Ended June 30, 2015 | 500 | ||
The following managerial assistance payments received by Prospect had not yet been remitted to Prospect Administration and were included by Prospect within due to Prospect Administration:
June 30, 2014 | $ | 125 | |
June 30, 2015 | 125 | ||
The following payments were paid from Harbortouch to Prospect Administration as reimbursement for legal, tax and portfolio level accounting services provided directly to Harbortouch (no direct income was recognized by Prospect, but Prospect was given credit for these payments as a reduction of the administrative services costs payable by Prospect to Prospect Administration):
Year Ended June 30, 2013 | $ | — | |
Year Ended June 30, 2014 | 1,761 | ||
Year Ended June 30, 2015 | 46 | ||
Manx Energy, Inc.
As of June 30, 2014, Prospect owned 41% of the equity of Manx Energy, Inc. (“Manx”). Manx was formed on January 19, 2010 for the purpose of rolling up the assets of existing Prospect portfolio companies, Coalbed, LLC (“Coalbed”), Appalachian Energy LLC (f/k/a Appalachian Energy Holdings, LLC) (“AEH”) and Kinley Exploration LLC. The three companies were combined under new common management.
On January 19, 2010, Prospect made a $2,800 investment at closing to Manx to provide for working capital. On the same date, Prospect exchanged $2,100 and $4,500 of the loans to AEH and Coalbed, respectively, for Manx preferred equity, and Prospect’s AEH equity interest was converted into Manx common stock. There was no change to fair value at the time of restructuring, and Prospect continued to fully reserve any income accrued for Manx. On October 15, 2010 and May 26, 2011, Prospect increased its loan to Manx in the amount of $500 and $250, respectively, to provide additional working capital. As of June 30, 2011, the cost basis of Prospect’s investment in Manx, including debt and equity, was $19,019.
198
On June 30, 2012, AEH and Coalbed loans held by Manx with a cost basis of $7,991 were removed from Manx and contributed by Prospect to Wolf Energy Holdings Inc., a separate holding company wholly owned by Prospect. During the three months ended June 30, 2013, Prospect determined that the impairment of Manx was other-than-temporary and recorded a realized loss of $9,397 for the amount that the amortized cost exceeded the fair value, reducing the amortized cost to $500. During the year ended June 30, 2014, Manx repaid $450 of the senior secured note. During the three months ended December 31, 2014, Manx was dissolved and Prospect recorded a realized loss of $50, reducing the amortized cost to zero.
MITY, Inc.
Prospect owns 100% of the equity of MITY Holdings of Delaware Inc. (“MITY Delaware”), a Consolidated Holding Company. MITY Delaware holds 94.99% of the equity of MITY, Inc. (f/k/a MITY Enterprises, Inc.) (“MITY”), with management of MITY owning the remaining 5.01% of the equity of MITY. MITY owns 100% of each of MITY-Lite, Inc. (“MITY-Lite”); Broda USA, Inc. (f/k/a Broda Enterprises USA, Inc.) (“Broda USA”); and Broda Enterprises ULC (“Broda Canada”). MITY is a designer, manufacturer and seller of multipurpose room furniture and specialty healthcare seating products.
On September 19, 2013, Prospect made a $29,735 investment in MITY Delaware, of which $22,792 was a senior secured debt to MITY Delaware and $6,943 was a capital contribution to the equity of MITY Delaware. The proceeds were partially utilized to purchase 97.7% of MITY common stock for $21,027. The remaining proceeds were used to issue a $7,200 note from Broda Canada to MITY Delaware, pay $684 of structuring fees from MITY Delaware to Prospect (which was recognized by Prospect as structuring fee income), $311 for legal services provided by attorneys employed by Prospect Administration and $513 was retained by MITY Delaware for working capital.
On September 19, 2013, Prospect made an additional $18,250 senior secured debt investment in MITY. The proceeds were used to repay existing third-party indebtedness, pay $365 of structuring fees from MITY to Prospect (which was recognized by Prospect as structuring fee income), pay $1,143 of third party expenses and $2,580 was retained by MITY for working capital. Members of management of MITY purchased additional shares of common stock of MITY, reducing MITY Delaware’s ownership to 94.99%. MITY, MITY-Lite and Broda USA are joint borrowers on the senior secured debt of MITY.
On June 23, 2014, Prospect made a new $15,769 debt investment in MITY and MITY distributed proceeds to MITY Delaware as a return of capital. MITY Delaware used this distribution to pay down the senior secured debt of MITY Delaware to Prospect by the same amount. The remaining amount of the senior secured debt due from MITY Delaware to Prospect, $7,200, was then contributed to the capital of MITY Delaware. On June 23, 2014, Prospect also extended a new $7,500 senior secured revolving facility to MITY, which was unfunded at closing.
On July 1, 2014, Prospect began consolidating MITY Delaware. As a result, any transactions between MITY Delaware and Prospect are eliminated in consolidation and as such, transactions after July 1, 2014 are not presented below.
During the year ended June 30, 2015, Prospect funded $2,500 of MITY’s senior secured revolving facility, which MITY fully repaid during that time.
The following cash distributions were declared and paid from MITY to MITY Delaware and recognized as a return of capital by MITY Delaware:
Year Ended June 30, 2013 | $ | — | |
Year Ended June 30, 2014 | 884 | ||
Year Ended June 30, 2015 | — | ||
The following dividends were declared and paid from MITY to MITY Delaware and recognized as dividend income by MITY Delaware:
Year Ended June 30, 2013 | $ | — | |
Year Ended June 30, 2014 | 861 | ||
Year Ended June 30, 2015 | — | ||
All dividends were paid from earnings and profits of MITY.
199
The following interest payments were accrued and paid from MITY Delaware to Prospect and recognized by Prospect as interest income:
Year Ended June 30, 2013 | $ | — | |
Year Ended June 30, 2014 | 3,177 | ||
Year Ended June 30, 2015 | N/A | ||
Included above, the following payment-in-kind interest from MITY Delaware was capitalized and recognized by Prospect as interest income:
Year Ended June 30, 2013 | $ | — | |
Year Ended June 30, 2014 | 177 | ||
Year Ended June 30, 2015 | N/A | ||
The following interest payments were accrued and paid from MITY to Prospect and recognized by Prospect as interest income:
Year Ended June 30, 2013 | $ | — | |
Year Ended June 30, 2014 | 1,516 | ||
Year Ended June 30, 2015 | 5,146 | ||
Included above, the following payment-in-kind interest from MITY was capitalized and recognized by Prospect as interest income:
Year Ended June 30, 2013 | $ | — | |
Year Ended June 30, 2014 | — | ||
Year Ended June 30, 2015 | 532 | ||
The following interest income recognized had not yet been paid by MITY to Prospect and was included by Prospect within interest receivable:
June 30, 2014 | $ | 14 | |
June 30, 2015 | 14 | ||
The following interest payments were accrued and paid from Broda Canada to MITY Delaware and recognized by Prospect as interest income:
Year Ended June 30, 2013 | $ | — | |
Year Ended June 30, 2014 | — | ||
Year Ended June 30, 2015 | 637 | ||
During the year ended June 30, 2015, there was an unfavorable fluctuation in the foreign currency exchange rate and MITY Delaware recognized $5 of realized loss related to its investment in Broda Canada.
The following managerial assistance payments were paid from MITY to Prospect and subsequently remitted to Prospect Administration (no income was recognized by Prospect):
Year Ended June 30, 2013 | $ | — | |
Year Ended June 30, 2014 | 225 | ||
Year Ended June 30, 2015 | 310 | ||
The following managerial assistance payments received by Prospect had not yet been remitted to Prospect Administration and were included by Prospect within due to Prospect Administration:
June 30, 2014 | $ | 75 | |
June 30, 2015 | 75 | ||
200
The following managerial assistance recognized had not yet been paid by MITY to Prospect and was included by Prospect within other receivables and due to Prospect Administration:
June 30, 2014 | $ | 10 | |
June 30, 2015 | — | ||
The following payments were paid from MITY to Prospect Administration as reimbursement for legal, tax and portfolio level accounting services provided directly to MITY (no direct income was recognized by Prospect, but Prospect was given credit for these payments as a reduction of the administrative services costs payable by Prospect to Prospect Administration):
Year Ended June 30, 2013 | $ | — | |
Year Ended June 30, 2014 | 495 | ||
Year Ended June 30, 2015 | 121 | ||
The following amounts were due to MITY from Prospect for reimbursement of expenses paid by MITY on behalf of Prospect and were included within other liabilities:
June 30, 2014 | $ | 5 | |
June 30, 2015 | 1 | ||
National Property REIT Corp.
Prospect owns 100% of the equity of NPH Property Holdings, LLC (“NPH”), a Consolidated Holding Company. NPH owns 100% of the common equity of National Property REIT Corp. (f/k/a National Property Holdings Corp.) (“NPRC”). NPRC is a Maryland corporation and a qualified REIT for federal income tax purposes. In order to qualify as a REIT, NPRC issued 125 shares of Series A Cumulative Non-Voting Preferred Stock to 125 accredited investors. The preferred stockholders are entitled to receive cumulative dividends semi-annually at an annual rate of 12.5% and do not have the ability to participate in the management or operation of NPRC.
NPRC was formed to hold for investment, operate, finance, lease, manage, and sell a portfolio of real estate assets and engage in any and all other activities as may be necessary, incidental or convenient to carry out the foregoing. NPRC acquires real estate assets, including, but not limited to, industrial, commercial, and multi-family properties. NPRC may acquire real estate assets directly or through joint ventures by making a majority equity investment in a property-owning entity (the “JV”). Additionally, through its wholly-owned subsidiaries, NPRC invests in online consumer loans.
On December 31, 2013, APRC distributed its majority interests in five JVs holding real estate assets to APH. APH then distributed these JV interests to Prospect in a transaction characterized as a return of capital. Prospect, on the same day, contributed certain of these JV interests to NPH and the remainder to UPH (each wholly-owned subsidiaries of Prospect). Each of NPH and UPH immediately thereafter contributed these JV interests to NPRC and UPRC, respectively. The total investments in the JVs transferred to NPH and from NPH to NPRC consisted of $79,309 and $16,315 of debt and equity financing, respectively. There was no material gain or loss realized on these transactions.
On December 31, 2013, Prospect made a $10,620 investment in NPH, of which $8,800 was a Senior Term Loan and $1,820 was used to purchase additional membership interests of NPH. The proceeds were utilized by NPH to purchase additional NPRC common equity for $10,620. The proceeds were utilized by NPRC to purchase a 93.0% ownership interest in APH Carroll Bartram Park, LLC for $10,288 and to pay $113 of structuring fees to Prospect (which was recognized by Prospect as structuring fee income), with $219 retained by NPRC for working capital. The JV was purchased for $38,000 which included debt financing and minority interest of $28,500 and $774, respectively. The remaining proceeds were used to pay $206 of structuring fees to Prospect (which was recognized by Prospect as structuring fee income), $1,038 of third party expenses, $5 of legal services provided by attorneys at Prospect Administration, and $304 of prepaid assets, with $9 retained by the JV for working capital.
Between January 7, 2014 and March 13, 2014, Prospect made a $14,000 investment in NPH, of which $11,900 was a Senior Term Loan and $2,100 was used to purchase additional membership interests of NPH. The proceeds were utilized by certain of NPRC’s wholly-owned subsidiaries to purchase online consumer loans from a third party.
201
On January 31, 2014, Prospect made a $4,805 investment in NPH, of which $4,000 was a Senior Term Loan and $805 used to purchase additional membership interests of NPH. The proceeds were utilized by NPH to purchase additional NPRC common equity for $4,805. The proceeds were utilized by NPRC to purchase a 93.0% ownership interest in APH Carroll Atlantic Beach, LLC for $4,603 and to pay $52 of structuring fees to Prospect (which was recognized by Prospect as structuring fee income), with $150 retained by NPRC for working capital. The JV was purchased for $13,025 which included debt financing and minority interest of $9,118 and $346, respectively. The remaining proceeds were used to pay $92 of structuring fees to Prospect (which was recognized by Prospect as structuring fee income), $681 of third party expenses, $7 of legal services provided by attorneys at Prospect Administration, and $182 of prepaid assets, with $80 retained by the JV for working capital.
Effective April 1, 2014, Prospect made a new $104,460 senior term loan to NPRC. NPRC then distributed this amount to NPH as a return of capital which was used to pay down the Senior Term Loan from NPH by the same amount.
Between April 3, 2014 and May 21, 2014, Prospect made an $11,000 investment in NPH and NPRC, of which $9,350 was a Senior Term Loan to NPRC and $1,650 was used to purchase additional membership interests of NPH. The proceeds were utilized by NPH to purchase additional NPRC common equity for $1,650. The proceeds were utilized by certain of NPRC’s wholly-owned subsidiaries to purchase online consumer loans from a third party.
On July 1, 2014, Prospect began consolidating NPH. As a result, any transactions between NPH and Prospect are eliminated in consolidation and as such, transactions after July 1, 2014 are not presented below.
On October 23, 2014, UPRC transferred its investment in Michigan Storage, LLC to NPRC. As a result, Prospect’s investments in UPRC related to these properties also transferred to NPRC. The investments transferred consisted of $1,281 of equity and $9,444 of debt. There was no gain or loss realized on the transaction.
On November 26, 2014, APRC transferred its investment in APH Carroll Resort, LLC to NPRC and the investment was renamed NPRC Carroll Resort, LLC. As a result, Prospect’s investments in APRC related to this property also transferred to NPRC. The investments transferred consisted of $10,237 of equity and $65,586 of debt. There was no gain or loss realized on the transaction.
On January 16, 2015, Prospect made a $13,871 investment in NPRC, of which $11,810 was a Senior Term Loan directly to NPRC and $2,061 was used to purchase additional common equity of NPRC through NPH. The proceeds were utilized by NPRC to purchase additional ownership interest in Michigan Storage, LLC (which was originally purchased by UPRC and transferred to NPRC, as discussed below) for $13,854, with $17 retained by NPRC for working capital. The minority interest holder also invested an additional $2,445 in the JV. With additional debt financing of $12,602, the total proceeds were used by the JV to purchase five additional properties for $26,405. The remaining proceeds were used to pay $276 of structuring fees to Prospect (which was recognized by Prospect as structuring fee income), $1,762 of third party expenses, $65 in pre-funded capital expenditures, and $393 of prepaid assets.
On March 17, 2015, Prospect entered into a new credit agreement with ACL Loan Holdings, Inc. (“ACLLH”), a wholly-owned subsidiary of NPRC, to form two new tranches of senior secured term loans, Term Loan A and Term Loan B, with the same terms as the existing NPRC Term Loan A and Term Loan B due to Prospect. The agreement was effective as of June 30, 2014. On June 30, 2014, ACLLH made a non-cash return of capital distribution of $22,390 to NPRC and NPRC transferred and assigned to ACLLH a senior secured Term Loan A due to Prospect.
On May 1, 2015, APRC transferred its investment in 5100 Live Oaks Blvd, LLC to NPRC. As a result, Prospect’s investments in APRC related to this property also transferred to NPRC. The investments transferred consisted of $2,748 of equity and $29,990 of debt. There was no gain or loss realized on the transaction.
On May 6, 2015, Prospect made a $252 investment in NPRC, of which $236 was a Senior Term Loan and $16 was used to purchase additional common equity of NPRC through NPH. The proceeds were utilized by NPRC to purchase additional ownership interest in 5100 Live Oaks Blvd, LLC for $252. The minority interest holder also invested an additional $6 in the JV. The proceeds were used by the JV to fund $258 of capital expenditures.
On June 2, 2015, Prospect amended the credit agreement with NPRC to form two new tranches of senior secured term loans, Term Loan C and Term Loan D, with the same terms as the existing ACLLH Term Loan A and Term Loan B due to Prospect. The amendment was effective as of April 1, 2015.
During the year ended June 30, 2015, Prospect made thirty-six follow-on investments in NPRC totaling $224,200 to support the online consumer lending initiative. Prospect invested $52,350 of equity through NPH and $171,850 of debt directly to NPRC and its wholly-owned subsidiaries. In addition, during the year ended June 30, 2015, Prospect received partial repayments of $32,883 of the loans previously outstanding and $5,577 as a return of capital on the equity investment in NPRC.
202
The following dividends were declared and paid from NPRC to NPH (partially via a wholly-owned subsidiary of NPH) and recognized as dividend income by NPH:
Year Ended June 30, 2013 | $ | — | |
Year Ended June 30, 2014 | 2,696 | ||
Year Ended June 30, 2015 | — | ||
All dividends were paid from earnings and profits of NPRC.
The following interest payments were accrued and paid by NPH to Prospect and recognized by Prospect as interest income:
Year Ended June 30, 2013 | $ | — | |
Year Ended June 30, 2014 | 2,838 | ||
Year Ended June 30, 2015 | N/A | ||
Included above, the following payment-in-kind interest from NPH was capitalized and recognized by Prospect as interest income:
Year Ended June 30, 2013 | $ | — | |
Year Ended June 30, 2014 | 432 | ||
Year Ended June 30, 2015 | N/A | ||
The following interest payments were accrued and paid by NPRC to Prospect and recognized by Prospect as interest income:
Year Ended June 30, 2013 | $ | — | |
Year Ended June 30, 2014 | 3,135 | ||
Year Ended June 30, 2015 | 23,869 | ||
Included above, the following payment-in-kind interest from NPRC was capitalized and recognized by Prospect as interest income:
Year Ended June 30, 2013 | $ | — | |
Year Ended June 30, 2014 | 18 | ||
Year Ended June 30, 2015 | 3,056 | ||
The following interest income recognized had not yet been paid by NPRC to Prospect and was included by Prospect within interest receivable:
June 30, 2014 | $ | — | |
June 30, 2015 | 116 | ||
The following interest payments were accrued and paid by ACLLH to Prospect and recognized by Prospect as interest income:
Year Ended June 30, 2013 | $ | — | |
Year Ended June 30, 2014 | — | ||
Year Ended June 30, 2015 | 6,742 | ||
Included above, the following payment-in-kind interest from ACLLH was capitalized and recognized by Prospect as interest income:
Year Ended June 30, 2013 | $ | — | |
Year Ended June 30, 2014 | — | ||
Year Ended June 30, 2015 | 816 | ||
203
The following interest income recognized had not yet been paid by ACLLH to Prospect and was included by Prospect within interest receivable:
June 30, 2014 | $ | — | |
June 30, 2015 | 23 | ||
The following royalty payments were paid from NPH to Prospect and recognized by Prospect as other income:
Year Ended June 30, 2013 | $ | — | |
Year Ended June 30, 2014 | 567 | ||
Year Ended June 30, 2015 | N/A | ||
The following royalty payments were paid from NPRC to Prospect and recognized by Prospect as other income:
Year Ended June 30, 2013 | $ | — | |
Year Ended June 30, 2014 | — | ||
Year Ended June 30, 2015 | 1,683 | ||
The following managerial assistance payments were paid from NPRC to Prospect and subsequently remitted to Prospect Administration (no income was recognized by Prospect):
Year Ended June 30, 2013 | $ | — | |
Year Ended June 30, 2014 | 255 | ||
Year Ended June 30, 2015 | 510 | ||
The following managerial assistance payments received by Prospect had not yet been remitted to Prospect Administration and were included by Prospect within due to Prospect Administration:
June 30, 2014 | $ | 128 | |
June 30, 2015 | 128 | ||
The following payments were paid from NPRC to Prospect Administration as reimbursement for legal, tax and portfolio level accounting services provided directly to NPRC (no direct income was recognized by Prospect, but Prospect was given credit for these payments as a reduction of the administrative services costs payable by Prospect to Prospect Administration):
Year Ended June 30, 2013 | $ | — | |
Year Ended June 30, 2014 | 207 | ||
Year Ended June 30, 2015 | 1,164 | ||
The following amounts were due from NPRC to Prospect for reimbursement of expenses paid by Prospect on behalf of NPRC and included by Prospect within other receivables:
June 30, 2014 | $ | 13 | |
June 30, 2015 | 108 | ||
Nationwide Acceptance LLC
Prospect owns 100% of the membership interests of Nationwide Acceptance Holdings LLC (“Nationwide Holdings”), a Consolidated Holding Company. Nationwide Holdings owns 93.79% of the equity of Nationwide Loan Company LLC (f/k/a Nationwide Acceptance LLC) (“Nationwide”), with members of Nationwide management owning the remaining 6.21% of the equity.
On January 31, 2013, Prospect initially made a $25,151 investment in Nationwide Holdings, of which $21,308 was a Senior Secured Revolving Credit Facility and $3,843 was in the form of membership interests in Nationwide Holdings. $21,885 of the proceeds were utilized to purchase 93.79% of the membership interests in Nationwide. Proceeds were also used to pay $753 of structuring fees from Nationwide Holdings to Prospect (which was recognized by Prospect as structuring fee income), $350 of third party expenses and $163 of legal services provided by attorneys at Prospect Administration. The remaining $2,000 was retained by Nationwide Holdings as working capital.
204
In December 2013, Prospect received $1,500 of structuring fees from Nationwide Holdings related to the amendment of the loan agreement. On March 28, 2014, Prospect funded an additional $4,000 to Nationwide Holdings ($3,400 through the Senior Secured Revolving Credit Facility and $600 to purchase additional membership interests in Nationwide Holdings). The additional funding along with cash on hand was utilized by Nationwide Holdings to fund a $5,000 dividend to Prospect.
On June 18, 2014, Prospect made a new $14,820 second lien term loan to Nationwide. Nationwide distributed this amount to Nationwide Holdings as a return of capital. Nationwide Holdings used the distribution to pay down the Senior Secured Revolving Credit Facility. The remaining $9,888 of the Senior Secured Revolving Credit Facility was then converted to additional membership interests in Nationwide Holdings.
On July 1, 2014, Prospect began consolidating Nationwide Holdings. As a result, any transactions between Nationwide Holdings and Prospect are eliminated in consolidation and as such, transactions after July 1, 2014 are not presented below.
On June 1, 2015, Nationwide completed a corporate reorganization. As part of the reorganization, Nationwide Acceptance LLC was renamed Nationwide Loan Company LLC (continues as “Nationwide”) and formed two new wholly-owned subsidiaries: Pelican Loan Company LLC (“Pelican”) and Nationwide Consumer Loans LLC. Nationwide assigned 100% of the equity interests in its other subsidiaries to Pelican which, in turn, assigned these interests to Nationwide Acceptance LLC (“New Nationwide”), the new operating company wholly-owned by Pelican. New Nationwide also assumed the existing senior subordinated term loan due to Prospect.
During the year ended June 30, 2015, Prospect made additional equity investments totaling $2,814 in Nationwide. Nationwide management invested an additional $186 of equity in Nationwide, and Prospect’s ownership in Nationwide did not change.
The following dividends were declared and paid from Nationwide to Nationwide Holdings and recognized as dividend income by Nationwide Holdings:
Year Ended June 30, 2013 | $ | 2,615 | |
Year Ended June 30, 2014 | 7,074 | ||
Year Ended June 30, 2015 | 4,425 | ||
The following dividends were declared and paid from Nationwide Holdings to Prospect and recognized as dividend income by Prospect:
Year Ended June 30, 2013 | $ | — | |
Year Ended June 30, 2014 | 5,000 | ||
Year Ended June 30, 2015 | N/A | ||
All dividends were paid from earnings and profits of Nationwide and Nationwide Holdings.
The following interest payments were accrued and paid from Nationwide Holdings to Prospect and recognized by Prospect as interest income:
Year Ended June 30, 2013 | $ | 1,788 | |
Year Ended June 30, 2014 | 4,322 | ||
Year Ended June 30, 2015 | N/A | ||
The following interest payments were accrued and paid from Nationwide to Prospect and recognized by Prospect as interest income:
Year Ended June 30, 2013 | $ | — | |
Year Ended June 30, 2014 | 107 | ||
Year Ended June 30, 2015 | 3,005 | ||
The following interest income recognized had not yet been paid by Nationwide to Prospect and was included by Prospect within interest receivable:
June 30, 2014 | $ | 8 | |
June 30, 2015 | 8 | ||
205
The following royalty payments were paid from Nationwide Holdings to Prospect and recognized by Prospect as other income:
Year Ended June 30, 2013 | $ | 131 | |
Year Ended June 30, 2014 | 354 | ||
Year Ended June 30, 2015 | N/A | ||
The following managerial assistance payments were paid from Nationwide to Prospect and subsequently remitted to Prospect Administration (no income was recognized by Prospect):
Year Ended June 30, 2013 | $ | 167 | |
Year Ended June 30, 2014 | 400 | ||
Year Ended June 30, 2015 | 400 | ||
The following managerial assistance payments received by Prospect had not yet been remitted to Prospect Administration and were included by Prospect within due to Prospect Administration:
June 30, 2014 | $ | 100 | |
June 30, 2015 | 100 | ||
The following payments were paid from Nationwide to Prospect Administration as reimbursement for legal, tax and portfolio level accounting services provided directly to Nationwide (no direct income was recognized by Prospect, but Prospect was given credit for these payments as a reduction of the administrative services costs payable by Prospect to Prospect Administration):
Year Ended June 30, 2013 | $ | 163 | |
Year Ended June 30, 2014 | 234 | ||
Year Ended June 30, 2015 | 4 | ||
The following amounts were due from Nationwide to Prospect for reimbursement of expenses paid by Prospect on behalf of Nationwide and were included by Prospect within other receivables:
June 30, 2014 | $ | 2 | |
June 30, 2015 | — | ||
The following amounts were due to Nationwide from Prospect for reimbursement of expenses paid by Nationwide on behalf of Prospect and were included by Prospect within other liabilities:
June 30, 2014 | $ | — | |
June 30, 2015 | 12 | ||
NMMB, Inc.
Prospect owns 100% of the equity of NMMB Holdings, Inc. (“NMMB Holdings”), a Consolidated Holding Company. NMMB Holdings owns 96.33% of the fully-diluted equity of NMMB, Inc. (f/k/a NMMB Acquisition, Inc.) (“NMMB”), with NMMB management owning the remaining 3.67% of the equity. NMMB owns 100% of Refuel Agency, Inc. (“Refuel Agency”). Refuel Agency owns 100% of Armed Forces Communications, Inc. (“Armed Forces”). NMMB is an advertising media buying business.
On May 6, 2011, Prospect initially made a $34,450 investment (of which $31,750 was funded at closing) in NMMB Holdings and NMMB, of which $24,250 was a senior secured term loan to NMMB, $3,000 was a senior secured revolver to NMMB (of which $300 was funded at closing), $2,800 was a senior subordinated term loan to NMMB Holdings and $4,400 to purchase 100% of the Series A Preferred Stock of NMMB Holdings. The proceeds received by NMMB were used to purchase 100% of the equity of Refuel Agency and assets related to the business for $30,069, pay $1,035 of structuring fees to Prospect (which was recognized by Prospect as structuring fee income), pay $396 for third party expenses and $250 was retained by NMMB for working capital. On May 31, 2011, NMMB repaid the $300 senior secured revolver.
During the year ended June 30, 2012, NMMB repaid $2,550 of the senior secured term loan. During the year ended June 30, 2013, NMMB repaid $5,700 of the senior secured term loan due.
206
On December 13, 2013, Prospect invested $8,086 for preferred equity to recapitalize NMMB Holdings. The proceeds were used by NMMB Holdings to repay in full the $2,800 outstanding under the subordinated term loan and the remaining $5,286 of proceeds from Prospect were used by NMMB Holdings to purchase preferred equity in NMMB. NMMB used the proceeds from the preferred equity issuance to pay down the senior term loan.
On June 12, 2014, Prospect made a new $7,000 senior secured term loan to Armed Forces. Armed Forces distributed this amount to Refuel Agency as a return of capital. Refuel Agency distributed this amount to NMMB as a return of capital, which was used to pay down $7,000 of NMMB’s $10,714 senior secured term loan to Prospect.
On July 1, 2014, Prospect began consolidating NMMB Holdings. As a result, any transactions between NMMB Holdings and Prospect are eliminated in consolidation and as such, transactions after July 1, 2014 are not presented below.
On October 1, 2014, Prospect made an additional $383 equity investment in NMMB Series B Preferred Stock, increasing Prospect’s ownership to 93.13%. During the year ended June 30, 2015, NMMB repurchased 460 shares of its common stock from a former NMMB executive, decreasing the number of shares outstanding and increasing Prospect’s ownership to 96.33%.
The following interest payments were accrued and paid from NMMB Holdings to Prospect and recognized by Prospect as interest income:
Year Ended June 30, 2013 | $ | 426 | |
Year Ended June 30, 2014 | 192 | ||
Year Ended June 30, 2015 | N/A | ||
The following interest payments were accrued and paid from NMMB to Prospect and recognized by Prospect as interest income:
Year Ended June 30, 2013 | $ | 2,601 | |
Year Ended June 30, 2014 | 1,826 | ||
Year Ended June 30, 2015 | 525 | ||
The following interest income recognized had not yet been paid by NMMB to Prospect and was included by Prospect within interest receivable:
June 30, 2014 | $ | 1 | |
June 30, 2015 | 133 | ||
The following interest payments were accrued and paid from Armed Forces to Prospect and recognized by Prospect as interest income:
Year Ended June 30, 2013 | $ | — | |
Year Ended June 30, 2014 | 33 | ||
Year Ended June 30, 2015 | 996 | ||
The following interest income recognized had not yet been paid by Armed Forces to Prospect and was included by Prospect within interest receivable:
June 30, 2014 | $ | 3 | |
June 30, 2015 | 250 | ||
The following managerial assistance payments were paid from NMMB to Prospect and subsequently remitted to Prospect Administration (no income was recognized by Prospect):
Year Ended June 30, 2013 | $ | 500 | |
Year Ended June 30, 2014 | 100 | ||
Year Ended June 30, 2015 | — | ||
207
The following managerial assistance recognized had not yet been paid by NMMB to Prospect and was included by Prospect within other receivables and due to Prospect Administration:
June 30, 2014 | $ | 300 | |
June 30, 2015 | 700 | ||
The following payments were paid from NMMB to Prospect Administration as reimbursement for legal, tax and portfolio level accounting services provided directly to NMMB (no direct income was recognized by Prospect, but Prospect was given credit for these payments as a reduction of the administrative services costs payable by Prospect to Prospect Administration):
Year Ended June 30, 2013 | $ | 12 | |
Year Ended June 30, 2014 | 15 | ||
Year Ended June 30, 2015 | — | ||
The following amounts were due from NMMB to Prospect for reimbursement of expenses paid by Prospect on behalf of NMMB and were included by Prospect within other receivables:
June 30, 2014 | $ | 1 | |
June 30, 2015 | 2 | ||
R-V Industries, Inc.
As of July 1, 2011 and continuing through June 30, 2015, Prospect owns 88.27% of the fully-diluted equity of R-V Industries, Inc. (“R-V”), with R-V management owning the remaining 11.73% of the equity. As of June 30, 2011, Prospect’s equity investment cost basis was $1,682 and $5,087 for warrants and common stock, respectively.
On November 30, 2012, Prospect made a $9,500 second lien term loan to R-V and R-V received an additional $4,000 of senior secured financing from a third-party lender. The combined $13,500 of proceeds was partially utilized by R-V to pay a dividend to its common stockholders in an aggregate amount equal to $13,288 (including $11,073 to Prospect recognized by Prospect as a dividend). The remaining proceeds were used by R-V to pay $142 of structuring fees to Prospect (which was recognized by Prospect as structuring fee income), $47 for third party expenses and $23 for legal services provided by attorneys at Prospect Administration.
On June 12, 2013, Prospect provided an additional $23,250 to the second lien term loan to R-V. The proceeds were partially utilized by R-V to pay a dividend to the common stockholders in an aggregate amount equal to $15,000 (including $13,240 dividend to Prospect). The remaining proceeds were used to pay off $7,835 of outstanding debt due from R-V to a third-party, $11 for legal services provided by attorneys at Prospect Administration and $404 was retained by R-V for working capital.
In addition to the repayments noted above, the following amounts were paid from R-V to Prospect and recorded by Prospect as repayment of loan receivable:
Year Ended June 30, 2013 | $ | — | |
Year Ended June 30, 2014 | 2,339 | ||
Year Ended June 30, 2015 | 1,175 | ||
The following dividends were declared and paid from R-V to Prospect and recognized as dividend income by Prospect:
Year Ended June 30, 2013 | $ | 24,462 | |
Year Ended June 30, 2014 | 1,100 | ||
Year Ended June 30, 2015 | 298 | ||
All dividends were paid from earnings and profits of R-V.
The following interest payments were accrued and paid from R-V to Prospect and recognized by Prospect as interest income:
Year Ended June 30, 2013 | $ | 781 | |
Year Ended June 30, 2014 | 3,188 | ||
Year Ended June 30, 2015 | 3,018 | ||
208
The following managerial assistance payments were paid from R-V to Prospect and subsequently remitted to Prospect Administration (no income was recognized by Prospect):
Year Ended June 30, 2013 | $ | 180 | |
Year Ended June 30, 2014 | 180 | ||
Year Ended June 30, 2015 | 180 | ||
The following managerial assistance payments received by Prospect had not yet been remitted to Prospect Administration and were included by Prospect within due to Prospect Administration:
June 30, 2014 | $ | 45 | |
June 30, 2015 | 45 | ||
The following payments were paid from R-V to Prospect Administration as reimbursement for legal, tax and portfolio level accounting services provided directly to R-V (no direct income was recognized by Prospect, but Prospect was given credit for these payments as a reduction of the administrative services costs payable by Prospect to Prospect Administration):
Year Ended June 30, 2013 | $ | 37 | |
Year Ended June 30, 2014 | — | ||
Year Ended June 30, 2015 | 13 | ||
The following amounts were due to R-V from Prospect for reimbursement of expenses paid by R-V on behalf of Prospect and were included by Prospect within other liabilities:
June 30, 2014 | $ | 2 | |
June 30, 2015 | 2 | ||
United Property REIT Corp.
Prospect owns 100% of the equity of UPH Property Holdings, LLC (“UPH”), a Consolidated Holding Company. UPH owns 100% of the common equity of United Property REIT Corp. (f/k/a United Property Holdings Corp.) (“UPRC”). UPRC is a Maryland corporation and a qualified REIT for federal income tax purposes. In order to qualify as a REIT, UPRC issued 125 shares of Series A Cumulative Non-Voting Preferred Stock to 125 accredited investors. The preferred stockholders are entitled to receive cumulative dividends semi-annually at an annual rate of 12.5% and do not have the ability to participate in the management or operation of UPRC.
UPRC was formed to hold for investment, operate, finance, lease, manage, and sell a portfolio of real estate assets and engage in any and all other activities as may be necessary, incidental or convenient to carry out the foregoing. UPRC acquires real estate assets, including, but not limited to, industrial, commercial, and multi-family properties. UPRC may acquire real estate assets directly or through joint ventures by making a majority equity investment in a property-owning entity (the “JV”).
On December 31, 2013, APRC distributed its majority interests in five JVs holding real estate assets to APH. APH then distributed these JV interests to Prospect in a transaction characterized as a return of capital. Prospect, on the same day, contributed certain of these JV interests to NPH and the remainder to UPH (each wholly-owned subsidiaries of Prospect). Each of NPH and UPH immediately thereafter contributed these JV interests to NPRC and UPRC, respectively. The total investments in the JVs transferred to UPH and from UPH to UPRC consisted of $18,855 and $3,707 of debt and equity financing, respectively. There was no material gain or loss realized on these transactions.
Effective April 1, 2014, Prospect made a new $19,027 senior term loan to UPRC. UPRC then distributed this amount to UPH as a return of capital which was used to pay down the Senior Term Loan from UPH by the same amount.
On June 4, 2014, Prospect made a $1,405 investment in UPH to purchase additional membership interests of UPH, which was revised to $1,420 on July 1, 2014. The proceeds were utilized by UPH to purchase additional UPRC common equity for $1,420. The proceeds were utilized by UPRC to acquire the real property located at 1201 West College, Marshall, MO (“Taco Bell, MO”) for $1,405 and pay $15 of third party expenses.
On July 1, 2014, Prospect began consolidating UPH. As a result, any transactions between UPH and Prospect are eliminated in consolidation and as such, transactions after July 1, 2014 are not presented below.
209
On August 19, 2014 and August 27, 2014, Prospect made a combined $11,046 investment in UPRC, of which $9,389 was a Senior Term Loan directly to UPRC and $1,657 was used to purchase additional common equity of UPRC through UPH. On October 1, 2015, UPRC distributed $376 to Prospect as a return of capital. The net proceeds were utilized by UPRC to purchase an 85.0% ownership interest in Michigan Storage, LLC for $10,579, with $42 retained by UPRC for working capital and $49 restricted for future property acquisitions. The JV was purchased for $38,275 which included debt financing and minority interest of $28,705 and $1,867, respectively. The remaining proceeds were used to pay $210 of structuring fees to Prospect (which was recognized by Prospect as structuring fee income), $2,589 of third party expenses, and $77 for legal services provided by attorneys at Prospect Administration. The investment was subsequently contributed to NPRC.
On September 29, 2014, Prospect made a $22,618 investment in UPRC, of which $19,225 was a Senior Term Loan and $3,393 was used to purchase additional common equity of UPRC through UPH. The proceeds were utilized by UPRC to purchase a 92.5% ownership interest in Canterbury Green Apartments Holdings, LLC for $22,036, with $582 retained by UPRC for working capital. The JV was purchased for $85,500 which included debt financing and minority interest of $65,825 and $1,787, respectively. The remaining proceeds were used to pay $432 of structuring fees to Prospect (which was recognized by Prospect as structuring fee income), $2,135 of third party expenses, $82 for legal services provided by attorneys at Prospect Administration, and $1,249 of prepaid assets, with $250 retained by the JV for working capital.
On September 30, 2014 and October 29, 2014, Prospect made a combined $22,688 investment in UPRC, of which $19,290 was a Senior Term Loan and $3,398 was used to purchase additional common equity of UPRC through UPH. The proceeds were utilized by UPRC to purchase a 66.2% ownership interest in Columbus OH Apartment Holdco, LLC for $21,992 and to pay $241 of structuring fees to Prospect (which was recognized by Prospect as structuring fee income), with $455 retained by UPRC for working capital. The JV was purchased for $114,377 which included debt financing and minority interest of $97,902 and $11,250, respectively. The remaining proceeds were used to pay $440 of structuring fees to Prospect (which was recognized by Prospect as structuring fee income), $7,711 of third party expenses, $180 for legal services provided by attorneys at Prospect Administration, $6,778 in pre-funded capital expenditures, and $1,658 of prepaid assets.
On October 23, 2014, UPRC transferred its investment in Michigan Storage, LLC to NPRC. As a result, Prospect’s investments in UPRC related to these properties also transferred to NPRC. The investments transferred consisted of $1,281 of equity and $9,444 of debt. There was no gain or loss realized on the transaction.
On November 12, 2014, Prospect made a $669 investment in UPRC, of which $569 was a Senior Term Loan and $100 was used to purchase additional common equity of UPRC through UPH. The proceeds were utilized by UPRC to purchase additional ownership interest in South Atlanta Portfolio Holding Company, LLC for $667, with $2 retained by UPRC for working capital. The minority interest holder also invested an additional $53 in the JV. The proceeds were used by the JV to fund $707 of capital expenditures and pay $13 of structuring fees to Prospect (which was recognized by Prospect as structuring fee income).
On April 27, 2015, Prospect made a $733 investment in UPRC, of which $623 was a Senior Term Loan and $110 was used to purchase additional common equity of UPRC through UPH. The proceeds were utilized by UPRC to purchase additional ownership interest in South Atlanta Portfolio Holding Company, LLC for $731 and pay $2 of legal services provided by attorneys at Prospect Administration. The minority interest holder also invested an additional $59 in the JV. The proceeds were used by the JV to fund $775 of capital expenditures and pay $15 of structuring fees to Prospect (which was recognized by Prospect as structuring fee income).
On May 19, 2015, Prospect made a $4,730 investment in UPRC, of which $3,926 was a Senior Term Loan and $804 was used to purchase additional common equity of UPRC through UPH. The proceeds were utilized by UPRC to purchase additional ownership interest in Columbus OH Apartment Holdco, LLC for $4,658, with $72 retained by UPRC for working capital. The proceeds were used by the JV to fund $4,565 of capital expenditures and pay $93 of structuring fees to Prospect (which was recognized by Prospect as structuring fee income).
The following dividends were declared and paid from UPRC to UPH and recognized as dividend income by UPH:
Year Ended June 30, 2013 | $ | — | |
Year Ended June 30, 2014 | 510 | ||
Year Ended June 30, 2015 | — | ||
All dividends were paid from earnings and profits of UPRC.
210
The following interest payments were accrued and paid by UPH to Prospect and recognized by Prospect as interest income:
Year Ended June 30, 2013 | $ | — | |
Year Ended June 30, 2014 | 548 | ||
Year Ended June 30, 2015 | N/A | ||
Included above, the following payment-in-kind interest from UPH was capitalized and recognized by Prospect as interest income:
Year Ended June 30, 2013 | $ | — | |
Year Ended June 30, 2014 | 173 | ||
Year Ended June 30, 2015 | N/A | ||
The following interest payments were accrued and paid by UPRC to Prospect and recognized by Prospect as interest income:
Year Ended June 30, 2013 | $ | — | |
Year Ended June 30, 2014 | 553 | ||
Year Ended June 30, 2015 | 5,893 | ||
Included above, the following payment-in-kind interest from UPRC was capitalized and recognized by Prospect as interest income:
Year Ended June 30, 2013 | $ | — | |
Year Ended June 30, 2014 | — | ||
Year Ended June 30, 2015 | 162 | ||
The following interest income recognized had not yet been paid by UPRC to Prospect and was included by Prospect within interest receivable:
June 30, 2014 | $ | 6 | |
June 30, 2015 | 20 | ||
The following royalty payments were paid from UPH to Prospect and recognized by Prospect as other income:
Year Ended June 30, 2013 | $ | — | |
Year Ended June 30, 2014 | 156 | ||
Year Ended June 30, 2015 | N/A | ||
The following royalty payments were paid from UPRC to Prospect and recognized by Prospect as other income:
Year Ended June 30, 2013 | $ | — | |
Year Ended June 30, 2014 | — | ||
Year Ended June 30, 2015 | 901 | ||
The following managerial assistance payments were paid from UPRC to Prospect and subsequently remitted to Prospect Administration (no income was recognized by Prospect):
Year Ended June 30, 2013 | $ | — | |
Year Ended June 30, 2014 | 100 | ||
Year Ended June 30, 2015 | 200 | ||
The following managerial assistance payments received by Prospect had not yet been remitted to Prospect Administration and were included by Prospect within due to Prospect Administration:
June 30, 2014 | $ | 50 | |
June 30, 2015 | 50 | ||
211
The following payments were paid from UPRC to Prospect Administration as reimbursement for legal, tax and portfolio level accounting services provided directly to UPRC (no direct income was recognized by Prospect, but Prospect was given credit for these payments as a reduction of the administrative services costs payable by Prospect to Prospect Administration):
Year Ended June 30, 2013 | $ | — | |
Year Ended June 30, 2014 | 85 | ||
Year Ended June 30, 2015 | 262 | ||
The following amounts were due from UPRC to Prospect for reimbursement of expenses paid by Prospect on behalf of UPRC and were included by Prospect within other receivables:
June 30, 2014 | $ | 32 | |
June 30, 2015 | 15 | ||
Valley Electric Company, Inc.
Prospect owns 100% of the common stock of Valley Electric Holdings I, Inc. (“Valley Holdings I”), a Consolidated Holding Company. Valley Holdings I owns 100% of Valley Electric Holdings II, Inc. (“Valley Holdings II”), a Consolidated Holding Company. Valley Holdings II owns 94.99% of Valley Electric Company, Inc. (“Valley Electric”), with Valley Electric management owning the remaining 5.01% of the equity. Valley Electric owns 100% of the equity of VE Company, Inc., which owns 100% of the equity of Valley Electric Co. of Mt. Vernon, Inc. (“Valley”), a leading provider of specialty electrical services in the state of Washington and among the top 50 electrical contractors in the United States.
On December 31, 2012, Prospect initially invested $52,098 (including 4,141,547 common shares of Prospect at a fair value of $44,650) in exchange for $32,572 was in the form of a senior secured note to Valley Holdings I, a $10,000 senior secured note to Valley (discussed below) and $9,526 to purchase the common stock of Valley Holdings I. The proceeds were partially utilized by Valley Holdings I to purchase 100% of Valley Holdings II common stock for $40,528. The remaining proceeds at Valley Holdings I were used to pay $977 of structuring fees from Valley Holdings I to Prospect (which were recognized by Prospect as structuring fee income), $345 for legal services provided by attorneys at Prospect Administration and $248 was retained by Valley Holdings I for working capital. The $40,528 of proceeds received by Valley Holdings II were subsequently used to purchase 96.3% of Valley’s common stock. Valley management provided a $1,500 co-investment in Valley.
On December 31, 2012, Prospect invested $10,000 (as mentioned above) into Valley in the form of senior secured debt. Total proceeds of $52,028 received by Valley (including $42,028 equity investment mentioned above) were used to purchase the equity of Valley from third-party sellers for $45,650, pay $4,628 of third-party transaction expenses (including bonuses to Valley’s management of $2,320), pay $250 from Valley to Prospect (which were recognized by Prospect as structuring fee income) and $1,500 was retained by Valley for working capital.
On June 24, 2014, Valley Holdings II and management of Valley formed Valley Electric and contributed their shares of Valley stock to Valley Electric. Valley management made an additional equity investment in Valley Electric, reducing our ownership to 94.99%. Prospect made a new $20,471 senior secured loan to Valley Electric. Valley Electric then distributed this amount to Valley Holdings I, via Valley Holdings II, as a return of capital which was used to pay down the senior secured note of Valley Holdings I by the same amount. The remaining principal amount of the senior secured note, $16,754, was then contributed to the capital of Valley Holdings I.
On July 1, 2014, Prospect began consolidating Valley Holdings I and Valley Holdings II. As a result, any transactions between Valley Holdings I, Valley Holdings II and Prospect are eliminated in consolidation and as such, transactions after July 1, 2014 are not presented below.
In addition to the repayments noted above, the following amounts were paid from Valley to Prospect and recorded by Prospect as repayment of loan receivable:
Year Ended June 30, 2013 | $ | 100 | |
Year Ended June 30, 2014 | 200 | ||
Year Ended June 30, 2015 | — | ||
212
The following dividends were declared and paid from Valley to Valley Holdings II, which were subsequently distributed to and recognized as dividend income by Valley Holdings I:
Year Ended June 30, 2013 | $ | 1,867 | |
Year Ended June 30, 2014 | 2,953 | ||
Year Ended June 30, 2015 | — | ||
All dividends were paid from earnings and profits of Valley and Valley Holdings II.
The following interest payments were accrued and paid from Valley Holdings I to Prospect and recognized by Prospect as interest income:
Year Ended June 30, 2013 | $ | 2,982 | |
Year Ended June 30, 2014 | 6,323 | ||
Year Ended June 30, 2015 | N/A | ||
Included above, the following payment-in-kind interest from Valley Holdings I was capitalized and recognized by Prospect as interest income:
Year Ended June 30, 2013 | $ | 1,491 | |
Year Ended June 30, 2014 | 3,162 | ||
Year Ended June 30, 2015 | N/A | ||
The following interest payments were accrued and paid from Valley Electric to Prospect and recognized by Prospect as interest income:
Year Ended June 30, 2013 | $ | — | |
Year Ended June 30, 2014 | 74 | ||
Year Ended June 30, 2015 | 3,905 | ||
Included above, the following payment-in-kind interest from Valley Electric was capitalized and recognized by Prospect as interest income:
Year Ended June 30, 2013 | $ | — | |
Year Ended June 30, 2014 | 29 | ||
Year Ended June 30, 2015 | 1,794 | ||
The following interest income recognized had not yet been paid by Valley Electric to Prospect and was included by Prospect within interest receivable:
June 30, 2014 | $ | 45 | |
June 30, 2015 | 11 | ||
The following interest payments were accrued and paid from Valley to Prospect and recognized by Prospect as interest income:
Year Ended June 30, 2013 | $ | 530 | |
Year Ended June 30, 2014 | 1,074 | ||
Year Ended June 30, 2015 | 1,086 | ||
Included above, the following payment-in-kind interest from Valley was capitalized and recognized by Prospect as interest income:
Year Ended June 30, 2013 | $ | 126 | |
Year Ended June 30, 2014 | 255 | ||
Year Ended June 30, 2015 | 259 | ||
213
The following interest income recognized had not yet been paid by Valley to Prospect and was included by Prospect within interest receivable:
June 30, 2014 | $ | 3 | |
June 30, 2015 | 3 | ||
The following royalty payments were paid from Valley Holdings I to Prospect and recognized by Prospect as other income:
Year Ended June 30, 2013 | $ | 98 | |
Year Ended June 30, 2014 | 148 | ||
Year Ended June 30, 2015 | N/A | ||
The following managerial assistance payments were paid from Valley to Prospect and subsequently remitted to Prospect Administration (no income was recognized by Prospect):
Year Ended June 30, 2013 | $ | 150 | |
Year Ended June 30, 2014 | 300 | ||
Year Ended June 30, 2015 | 300 | ||
The following managerial assistance payments received by Prospect had not yet been remitted to Prospect Administration and were included by Prospect within due to Prospect Administration:
June 30, 2014 | $ | 75 | |
June 30, 2015 | 75 | ||
The following payments were paid from Valley Electric to Prospect Administration as reimbursement for legal, tax and portfolio level accounting services provided directly to Valley Electric (no direct income was recognized by Prospect, but Prospect was given credit for these payments as a reduction of the administrative services costs payable by Prospect to Prospect Administration):
Year Ended June 30, 2013 | $ | 345 | |
Year Ended June 30, 2014 | 91 | ||
Year Ended June 30, 2015 | 18 | ||
The following amounts were due to Valley Electric from Prospect for reimbursement of expenses paid by Valley Electric on behalf of Prospect and were included by Prospect within other liabilities:
June 30, 2014 | $ | 6 | |
June 30, 2015 | — | ||
Vets Securing America, Inc.
As of June 30, 2014, Prospect owned 100% of the equity of Vets Securing America, Inc. (“VSA”) and 100% of the equity of The Healing Staff, Inc. (“THS”), a former wholly-owned subsidiary of ESA Environmental Specialists, Inc. (“ESA”). During the year ended June 30, 2015, THS ceased operations and the VSA management team supervised both the continued operations of VSA and the wind-down of activities at THS. VSA provides out-sourced security guards staffing.
As of July 1, 2011, the cost basis of Prospect’s investment in THS and VSA, including debt and equity, was $18,219. During the year ended June 30, 2012, Prospect made follow-on secured debt investments of $1,033 to support the ongoing operations of THS and VSA. In October 2011, Prospect sold a building previously acquired from ESA for $894. In January 2012, Prospect received $2,250 of litigation settlement proceeds related to ESA. The proceeds from both of these transactions were used to reduce the outstanding loan balances due from THS and VSA by $3,144. In June 2012, THS and VSA repaid $118 and $42, respectively, of loans previously outstanding.
In May 2012, in connection with the implementation of accounts receivable based funding programs for THS and VSA with a third party provider, Prospect agreed to subordinate its first priority security interest in all of the accounts receivable and other assets of THS and VSA to the third party provider of that accounts receivable based funding.
214
During the year ended June 30, 2013, Prospect determined that the impairment of THS and VSA was other-than-temporary and recorded a realized loss of $12,117, reducing the amortized cost to $3,831. During the year ended June 30, 2014, Prospect received $5,825 of legal cost reimbursement related to the ESA litigation settlement which had been expensed in prior years. The proceeds were recognized by Prospect as other income during the year ended June 30, 2014. During the year ended June 30, 2015, Prospect received $685 related to the ESA litigation settlement which was recognized as realized gain.
On May 20, 2015, Prospect made a new $100 secured promissory note to provide liquidity to VSA.
As of June 30, 2014, THS and VSA were joint borrowers on the secured promissory notes. On June 5, 2015, Prospect sold its equity investment in VSA and realized a net loss of $975 on the sale. In connection with the sale, VSA was released as a borrower on the secured promissory notes, leaving THS as the sole borrower. During the year ended June 30, 2015, THS ceased operations and Prospect recorded a realized loss of $2,956, reducing the amortized cost to zero.
The following amounts were due from THS and VSA to Prospect for reimbursement of expenses paid by Prospect on behalf of THS and VSA and were included by Prospect within other receivables:
June 30, 2014 | $ | 6 | |
June 30, 2015 | — | ||
Wolf Energy, LLC
Prospect owns 100% of the equity of Wolf Energy Holdings Inc. (“Wolf Energy Holdings”), a Consolidated Holding Company. Wolf Energy Holdings owns 100% of each of Appalachian Energy LLC (f/k/a Appalachian Energy Holdings, LLC) (“AEH”); Coalbed, LLC (“Coalbed”); and Wolf Energy, LLC (“Wolf Energy”). AEH owns 100% of C&S Operating, LLC.
Wolf Energy Holdings is a holding company formed to hold 100% of the outstanding membership interests of each of AEH and Coalbed. The membership interests and associated operating company debt of AEH and Coalbed, which were previously owned by Manx Energy, Inc. (“Manx”), were assigned to Wolf Energy Holdings effective June 30, 2012. The purpose of assignment was to remove those activities from Manx deemed non-core by the Manx convertible debt investors who were not interested in funding those operations. On June 30, 2012, AEH and Coalbed loans with a cost basis of $7,991 were assigned by Prospect to Wolf Energy Holdings from Manx.
In addition, effective June 29, 2012, C&J Cladding Holding Company, Inc. (“C&J Holdings”) merged with and into Wolf Energy Holdings, with Wolf Energy Holdings as the surviving entity. At the time of the merger, C&J Holdings held the remaining undistributed proceeds in cash from the sale of its membership interests in C&J Cladding, LLC (“C&J”) (discussed below). The merger was effectuated in connection with the broader simplification of Prospect’s energy investment holdings.
On June 1, 2012, Prospect sold the membership interests in C&J for $5,500. Proceeds from the sale were used to pay a $3,000 distribution to Prospect ($580 reduction in cost basis and $2,420 realized gain recognized by Prospect), an advisory fee of $1,500 from C&J to Prospect (which was recognized by Prospect as other income) and $978 was retained by C&J as working capital to pay $22 of legal services provided by attorneys at Prospect Administration and third-party expenses.
On February 27, 2013, Prospect made a $50 senior secured debt investment senior secured to East Cumberland, L.L.C., a former wholly-owned subsidiary of AEH with AEH as guarantor. Proceeds were used to pay off vendors.
On April 15, 2013, Prospect foreclosed on the assets of H&M Oil & Gas, LLC (“H&M”). At the time of foreclosure, H&M was in default on loans receivables due to Prospect with a cost basis of $64,449. The assets previously held by H&M were assigned by Prospect to Wolf Energy in exchange for a $66,000 term loan secured by the assets. The cost basis in this loan of $44,632 was determined in accordance with ASC 310-40, Troubled Debt Restructurings by Creditors, and was equal to the fair value of assets at the time of transfer resulting in a capital loss of $19,647 in connection with the foreclosure on the assets. On May 17, 2013, Wolf Energy sold the assets located in Martin County, which were previously held by H&M, for $66,000. Proceeds from the sale were primarily used to repay the loan, accrued interest and net profits interest receivable due to us resulting in a realized capital gain of $11,826 offsetting the previously recognized loss. Prospect received $3,960 of structuring and advisory fees from Wolf Energy during the year ended June 30, 2013 related to the sale and $991 under the net profits interest agreement which was recognized as other income during the fiscal year ended June 30, 2013.
On July 1, 2014, Prospect began consolidating Wolf Energy Holdings. As a result, any transactions between Wolf Energy Holdings and Prospect are eliminated in consolidation and as such, transactions after July 1, 2014 are not presented below.
215
During the three months ended September 30, 2014, Prospect determined that the impairment of AEH was other-than temporary and recorded a realized loss of $2,050, reducing the amortized cost to zero. On November 21, 2014, Coalbed merged with and into Wolf Energy, with Wolf Energy as the surviving entity. During the three months ended December 31, 2014, Prospect determined that the impairment of the Coalbed debt assumed by Wolf Energy was other-than-temporary and recorded a realized loss of $5,991, reducing the amortized cost to zero.
During the year ended June 30, 2015, Wolf Energy Holdings received a tax refund of $173 related to its investment in C&J and Prospect realized a gain of the same amount.
The following payments were paid from Wolf Energy Holdings to Prospect Administration as reimbursement for legal, tax and portfolio level accounting services provided directly to Wolf Energy Holdings (no direct income was recognized by Prospect, but Prospect was given credit for these payments as a reduction of the administrative services costs payable by Prospect to Prospect Administration):
Year Ended June 30, 2013 | $ | 22 | |
Year Ended June 30, 2014 | 101 | ||
Year Ended June 30, 2015 | N/A | ||
Note 15. Litigation
From time to time, we may become involved in various investigations, claims and legal proceedings that arise in the ordinary course of our business. These matters may relate to intellectual property, employment, tax, regulation, contract or other matters. The resolution of these matters as they arise will be subject to various uncertainties and, even if such claims are without merit, could result in the expenditure of significant financial and managerial resources. We are not aware of any material litigation as of June 30, 2015.
216
Note 16. Financial Highlights
The following is a schedule of financial highlights for each of the five years in the period ended June 30, 2015:
Year Ended June 30, | |||||||||||||||||||
2015 | 2014 | 2013 | 2012 | 2011 | |||||||||||||||
Per Share Data | |||||||||||||||||||
Net asset value at beginning of year | $ | 10.56 | $ | 10.72 | $ | 10.83 | $ | 10.36 | $ | 10.30 | |||||||||
Net investment income(1) | 1.03 | 1.19 | 1.57 | 1.63 | 1.10 | ||||||||||||||
Net realized losses (gains) on investments(1) | (0.51 | ) | (0.01 | ) | (0.13 | ) | 0.32 | 0.19 | |||||||||||
Net change in unrealized appreciation (depreciation) on investments(1) | 0.47 | (0.12 | ) | (0.37 | ) | (0.28 | ) | 0.09 | |||||||||||
Net realized losses on extinguishment of debt(1) | (0.01 | ) | — | — | — | — | |||||||||||||
Dividends to shareholders | (1.19 | ) | (1.32 | ) | (1.28 | ) | (1.22 | ) | (1.21 | ) | |||||||||
Common stock transactions(2) | (0.04 | ) | 0.10 | 0.10 | 0.02 | (0.11 | ) | ||||||||||||
Net asset value at end of year | $ | 10.31 | $ | 10.56 | $ | 10.72 | $ | 10.83 | $ | 10.36 | |||||||||
Per share market value at end of year | $ | 7.37 | $ | 10.63 | $ | 10.80 | $ | 11.39 | $ | 10.11 | |||||||||
Total return based on market value(3) | (20.84 | %) | 10.88 | % | 6.24 | % | 27.21 | % | 17.22 | % | |||||||||
Total return based on net asset value(3) | 11.47 | % | 10.97 | % | 10.91 | % | 18.03 | % | 12.54 | % | |||||||||
Shares of common stock outstanding at end of year | 359,090,759 | 342,626,637 | 247,836,965 | 139,633,870 | 107,606,690 | ||||||||||||||
Weighted average shares of common stock outstanding | 353,648,522 | 300,283,941 | 207,069,971 | 114,394,554 | 85,978,757 | ||||||||||||||
Ratios/Supplemental Data | |||||||||||||||||||
Net assets at end of year | $ | 3,703,049 | $ | 3,618,182 | $ | 2,656,494 | $ | 1,511,974 | $ | 1,114,357 | |||||||||
Portfolio turnover rate | 25.32 | % | 15.21 | % | 29.24 | % | 29.06 | % | 27.63 | % | |||||||||
Annualized ratio of operating expenses to average net assets | 11.70 | % | 11.11 | % | 11.50 | % | 10.73 | % | 8.47 | % | |||||||||
Annualized ratio of net investment income to average net assets | 9.91 | % | 11.18 | % | 14.86 | % | 14.92 | % | 10.60 | % | |||||||||
(1) | Per share data amount is based on the weighted average number of common shares outstanding for the period presented (except for dividends to shareholders which is based on actual rate per share). |
(2) | Common stock transactions include the effect of our issuance of common stock in public offerings (net of underwriting and offering costs), shares issued in connection with our dividend reinvestment plan and shares issued to acquire investments. |
(3) | Total return based on market value is based on the change in market price per share between the opening and ending market prices per share in each period and assumes that dividends are reinvested in accordance with our dividend reinvestment plan. Total return based on net asset value is based upon the change in net asset value per share between the opening and ending net asset values per share in each period and assumes that dividends are reinvested in accordance with our dividend reinvestment plan. |
217
Note 17. Selected Quarterly Financial Data (Unaudited)
The following table sets forth selected financial data for each quarter within the three years ended June 30, 2015.
Investment Income | Net Investment Income | Net Realized and Unrealized Gains (Losses) | Net Increase in Net Assets from Operations | |||||||||||||||||||||||||||||
Quarter Ended | Total | Per Share(1) | Total | Per Share(1) | Total | Per Share(1) | Total | Per Share(1) | ||||||||||||||||||||||||
September 30, 2012 | $ | 123,636 | $ | 0.76 | $ | 74,027 | $ | 0.46 | $ | (26,778 | ) | $ | (0.17 | ) | $ | 47,249 | $ | 0.29 | ||||||||||||||
December 31, 2012 | 166,035 | 0.85 | 99,216 | 0.51 | (52,727 | ) | (0.27 | ) | 46,489 | 0.24 | ||||||||||||||||||||||
March 31, 2013 | 120,195 | 0.53 | 59,585 | 0.26 | (15,156 | ) | (0.07 | ) | 44,429 | 0.20 | ||||||||||||||||||||||
June 30, 2013 | 166,470 | 0.68 | 92,096 | 0.38 | (9,407 | ) | (0.04 | ) | 82,689 | 0.34 | ||||||||||||||||||||||
September 30, 2013 | 161,034 | 0.62 | 82,337 | 0.32 | (2,437 | ) | (0.01 | ) | 79,900 | 0.31 | ||||||||||||||||||||||
December 31, 2013 | 178,090 | 0.62 | 92,215 | 0.32 | (6,853 | ) | (0.02 | ) | 85,362 | 0.30 | ||||||||||||||||||||||
March 31, 2014 | 190,327 | 0.60 | 98,523 | 0.31 | (16,422 | ) | (0.05 | ) | 82,101 | 0.26 | ||||||||||||||||||||||
June 30, 2014 | 182,840 | 0.54 | 84,148 | 0.25 | (12,491 | ) | (0.04 | ) | 71,657 | 0.21 | ||||||||||||||||||||||
September 30, 2014 | 202,021 | 0.59 | 94,463 | 0.28 | (10,355 | ) | (0.04 | ) | 84,108 | 0.24 | ||||||||||||||||||||||
December 31, 2014 | 198,883 | 0.56 | 91,325 | 0.26 | (5,355 | ) | (0.02 | ) | 85,970 | 0.24 | ||||||||||||||||||||||
March 31, 2015 | 191,350 | 0.53 | 87,441 | 0.24 | (5,949 | ) | (0.01 | ) | 81,492 | 0.23 | ||||||||||||||||||||||
June 30, 2015 | 198,830 | 0.55 | 89,518 | 0.25 | 5,251 | 0.01 | 94,769 | 0.26 | ||||||||||||||||||||||||
(1) | Per share amounts are calculated using the weighted average number of common shares outstanding for the period presented. As such, the sum of the quarterly per share amounts above will not necessarily equal the per share amounts for the fiscal year. |
Note 18. Subsequent Events
On July 1, 2015, we provided $31,000 of first lien senior secured financing, of which $30,200 was funded at closing, to Intelius, Inc. (“Intelius”), an online information commerce company.
On July 8, 2015, we sold 27.45% of the outstanding principal balance of the senior secured Term Loan A investment in InterDent, Inc. for $34,415. There was no gain or loss realized on the sale.
On July 23, 2015, we made an investment of $37,969 to purchase 80.73% of the subordinated notes in Halcyon Loan Advisors Funding 2015-3 Ltd. in a co-investment transaction with Priority Income Fund, Inc., a closed-end fund managed by an affiliate of Prospect Capital Management.
On July 23, 2015, we issued 193,892 shares of our common stock in connection with the dividend reinvestment plan.
On July 24, 2015, TB Corp. repaid the $23,628 loan receivable to us.
On August 6, 2015, we provided $92,500 of first lien senior secured debt to support the refinancing of Crosman Corporation. Concurrent with the refinancing, we received repayment of the $40,000 second lien term loan previously outstanding.
On August 7, 2015, Ryan, LLC repaid the $72,701 loan receivable to us.
On August 11, 2015, we made a $13,500 follow-on first lien senior secured debt investment in Intelius, of which $13,000 was funded at closing, to support an acquisition.
On August 12, 2015, we made an investment of $22,898 to purchase 50.04% of the subordinated notes in Octagon Investment Partners XVIII, Ltd.
On August 12, 2015, we sold 780 of our small business whole loans purchased from OnDeck to Jefferies Asset Funding LLC for proceeds of $26,562, net of related transaction expenses, and a trust certificate representing a 41.54% interest in the MarketPlace Loan Trust, Series 2015-OD2.
On August 14, 2015, we announced the then current conversion rate on the 2018 Notes as 84.1497 shares of common stock per $1 principal amount of the 2018 Notes converted, which is equivalent to a conversion price of approximately $11.88.
On August 20, 2015, we issued 152,896 shares of our common stock in connection with the dividend reinvestment plan.
218
On August 21, 2015, we committed to funding a $16,000 second lien secured investment in a provider of customer care outsourcing services.
During the period from July 1, 2015 through August 26, 2015, we made seven follow-on investments in NPRC totaling $52,852 to support the online consumer lending initiative. We invested $12,508 of equity through NPH and $40,344 of debt directly to ACL Loan Holdings, Inc., a wholly-owned subsidiary of NPRC.
During the period from July 1, 2015 through August 26, 2015, our wholly-owned subsidiary PSBL purchased $14,101 of small business whole loans from OnDeck.
During the period from July 1, 2015 through August 26, 2015, we issued $32,362 aggregate principal amount of Prospect Capital InterNotes® for net proceeds of $31,870. In addition, we sold $1,425 aggregate principal amount of Prospect Capital InterNotes® for net proceeds of $1,405 with expected closing on August 27, 2015.
During the period from July 28, 2015 through August 14, 2015 (with settlement dates of July 31, 2015 to August 19, 2015), we repurchased 4,158,750 shares of our common stock at an average price of $7.22 per share, including commissions.
On August 24, 2015, we announced the declaration of monthly dividends in the following amounts and with the following dates:
• | $0.08333 per share for September 2015 to holders of record on September 30, 2015 with a payment date of October 22, 2015; and |
• | $0.08333 per share for October 2015 to holders of record on October 30, 2015 with a payment date of November 19, 2015. |
219
Item 9. Changes in and Disagreements with Accountants on Accounting and Financial Disclosure
Not applicable.
Item 9A. Controls and Procedures
Evaluation of Disclosure Controls and Procedures
As of June 30, 2015, we evaluated the effectiveness of the design and operation of our disclosure controls and procedures (as defined in Rule 13a-15(e) of the 1934 Act). Based on that evaluation, our management, including the Chief Executive Officer and Chief Financial Officer, concluded that our disclosure controls and procedures were effective and provided reasonable assurance that information required to be disclosed in our periodic SEC filings is recorded, processed, summarized and reported within the time periods specified in the SEC’s rules and forms, and that such information is accumulated and communicated to our management, including our Chief Executive Officer and Chief Financial Officer, as appropriate, to allow timely decisions regarding required disclosure. However, in evaluating the disclosure controls and procedures, management recognized that any controls and procedures, no matter how well designed and operated can provide only reasonable assurance of achieving the desired control objectives, and management necessarily was required to apply its judgment in evaluating the cost-benefit relationship of such possible controls and procedures.
Report of Management on Internal Control Over Financial Reporting
Management is responsible for establishing and maintaining adequate internal control over financial reporting, and for performing an assessment of the effectiveness of internal control over financial reporting as of June 30, 2015. Internal control over financial reporting is a process designed to provide reasonable assurance regarding the reliability of financial reporting and the preparation of financial statements for external purposes in accordance with generally accepted accounting principles. The Company’s internal control over financial reporting includes those policies and procedures that (i) pertain to assets of the Company; (ii) provide reasonable assurance that transactions are recorded as necessary to permit preparation of financial statements in accordance with generally accepted accounting principles, and that receipts and expenditures of the Company are being made only in accordance with authorizations of management and directors of the Company; and (iii) provide reasonable assurance regarding prevention or timely detection of unauthorized acquisition, use, or disposition of the Company’s assets that could have a material effect on the financial statements.
Management performed an assessment of the effectiveness of the Company’s internal control over financial reporting as of June 30, 2015 based upon criteria in Internal Control—Integrated Framework (2013) issued by the Committee of Sponsoring Organizations of the Treadway Commission (“COSO”). Based on our assessment, management determined that the Company’s internal control over financial reporting was effective as of June 30, 2015 based on the criteria on Internal Control—Integrated Framework (2013) issued by COSO. There were no changes in our internal control over financial reporting during the quarter ended June 30, 2015 that have materially affected, or are reasonably likely to affect, our internal control over financial reporting.
Our management’s assessment of the effectiveness of our internal control over financial reporting as of June 30, 2015 has been audited by BDO USA, LLP, an independent registered public accounting firm, as stated in their report which appears herein.
220
Report of Independent Registered Public Accounting Firm
Board of Directors and Shareholders
Prospect Capital Corporation
New York, New York
We have audited Prospect Capital Corporation’s internal control over financial reporting as of June 30, 2015, based on criteria established in Internal Control—Integrated Framework (2013) issued by the Committee of Sponsoring Organizations of the Treadway Commission (the COSO criteria). Prospect Capital Corporation’s management is responsible for maintaining effective internal control over financial reporting and for its assessment of the effectiveness of internal control over financial reporting, included in the accompanying “Item 9A, Report of Management on Internal Control Over Financial Reporting.” Our responsibility is to express an opinion on the company's internal control over financial reporting based on our audit.
We conducted our audit in accordance with the standards of the Public Company Accounting Oversight Board (United States). Those standards require that we plan and perform the audit to obtain reasonable assurance about whether effective internal control over financial reporting was maintained in all material respects. Our audit included obtaining an understanding of internal control over financial reporting, assessing the risk that a material weakness exists, and testing and evaluating the design and operating effectiveness of internal control based on the assessed risk. Our audit also included performing such other procedures as we considered necessary in the circumstances. We believe that our audit provides a reasonable basis for our opinion.
A company’s internal control over financial reporting is a process designed to provide reasonable assurance regarding the reliability of financial reporting and the preparation of financial statements for external purposes in accordance with generally accepted accounting principles. A company’s internal control over financial reporting includes those policies and procedures that (1) pertain to the maintenance of records that, in reasonable detail, accurately and fairly reflect the transactions and dispositions of the assets of the company; (2) provide reasonable assurance that transactions are recorded as necessary to permit preparation of financial statements in accordance with generally accepted accounting principles, and that receipts and expenditures of the company are being made only in accordance with authorizations of management and directors of the company; and (3) provide reasonable assurance regarding prevention or timely detection of unauthorized acquisition, use, or disposition of the company’s assets that could have a material effect on the financial statements.
Because of its inherent limitations, internal control over financial reporting may not prevent or detect misstatements. Also, projections of any evaluation of effectiveness to future periods are subject to the risk that controls may become inadequate because of changes in conditions, or that the degree of compliance with the policies or procedures may deteriorate.
In our opinion, Prospect Capital Corporation maintained, in all material respects, effective internal control over financial reporting as of June 30, 2015, based on the COSO criteria.
We also have audited, in accordance with the standards of the Public Company Accounting Oversight Board (United States), the consolidated statements of assets and liabilities of Prospect Capital Corporation, including the consolidated schedules of investments, as of June 30, 2015 and June 30, 2014, and the related consolidated statements of operations, changes in net assets, and cash flows for each of the three years in the period ended June 30, 2015, and the financial highlights for each of the five years in the period ended June 30, 2015, and our report dated August 26, 2015 expressed an unqualified opinion thereon.
/s/ BDO USA, LLP |
BDO USA, LLP |
New York, New York |
August 26, 2015 |
221
Item 9B. Other Information
Not applicable.
PART III
Item 10. Directors, Executive Officers and Corporate Governance
Section 16(a) Beneficial Ownership Reporting Compliance
Section 16(a) of the Securities Exchange Act of 1934, as amended, requires the Company’s directors and executive officers, and persons who own more than 10% of the Company’s common stock to file reports of ownership and changes in ownership with the Securities and Exchange Commission. To the Company’s knowledge, during the fiscal year ended June 30, 2015, the Company’s officers, directors and greater than 10% stockholders had complied with all Section 16(a) filing requirements, except that one Form 4 was filed three days late on behalf of John F. Barry III, Chief Executive Officer, for the purchase of shares of common stock due to an administrative error.
The information required by Item 10 is hereby incorporated by reference from our 2015 Proxy Statement.
Code of Ethics
We, Prospect Capital Management and Prospect Administration have each adopted a code of ethics pursuant to Rule 17j-1 under the 1940 Act that establishes procedures for personal investments and restricts certain personal securities transactions. Personnel subject to each code may invest in securities for their personal investment accounts, including securities that may be purchased or held by us, so long as such investments are made in accordance with the code’s requirements. For information on how to obtain a copy of each code of ethics, see “Available Information” in Part I of this Annual Report.
Item 11. Executive Compensation
The information required by Item 11 is hereby incorporated by reference from our 2015 Proxy Statement.
Item 12. Security Ownership of Certain Beneficial Owners and Management and Related Stockholder Matters
The information required by Item 12 is hereby incorporated by reference from our 2015 Proxy Statement.
Item 13. Certain Relationships and Related Transactions, and Director Independence
The information required by Item 13 is hereby incorporated by reference from our 2015 Proxy Statement.
Item 14. Principal Accountant Fees and Services
The information required by Item 14 is hereby incorporated by reference from our 2015 Proxy Statement.
222
PART IV
Item 15. Exhibits, Financial Statement Schedules
The following documents are filed as part of this Annual Report:
1. | Financial Statements – See the Index to Consolidated Financial Statements in Item 8 of this report. |
2. | Financial Statement Schedules – The financial statements of First Tower Finance Company LLC and its consolidated subsidiaries required by Rule 3-09 of Regulation S-X are provided as Exhibit 99.1 to this report. The financial statements of Harbortouch Payments, LLC required by Rule 3-09 of Regulation S-X are provided as Exhibit 99.2 to this report. |
3. | Exhibits – The following exhibits are filed as part of this report or hereby incorporated by reference to exhibits previously filed with the SEC (according to the number assigned to them in Item 601 of Regulation S-K): |
Exhibit No. | |
3.1 | Articles of Amendment and Restatement(1) |
3.2 | Amended and Restated Bylaws(3) |
4.1 | Form of Share Certificate(2) |
4.2 | Form of Indenture(9) |
4.3 | Indenture dated as of December 21, 2010 relating to the 6.25% Senior Convertible Notes, by and between the Registrant and American Stock Transfer & Trust Company, LLC, as Trustee and Form of 6.25% Senior Convertible Note due 2015(7) |
4.4 | Indenture dated as of February 18, 2011 relating to the 5.50% Senior Convertible Notes, by and between the Registrant and American Stock Transfer & Trust Company, LLC, as Trustee(8) |
4.5 | Form of 5.50% Senior Convertible Note due 2016(6) |
4.6 | Indenture dated as of February 16, 2012, by and between the Registrant and American Stock Transfer & Trust Company, LLC, as Trustee(10) |
4.7 | First Supplemental Indenture dated as of March 1, 2012, to the Indenture dated as of February 16, 2012, by and between the Registrant and American Stock Transfer & Trust Company, LLC, as Trustee and Form of 7.00% Prospect Capital InterNote® due 2022(10) |
4.8 | Second Supplemental Indenture dated as of March 8, 2012, to the Indenture dated as of February 16, 2012, by and between the Registrant and American Stock Transfer & Trust Company, LLC, as Trustee(11) |
4.9 | Joinder Supplemental Indenture dated as of March 8, 2012, to the Indenture dated as of February 16, 2012, by and among the Registrant, American Stock Transfer & Trust Company, LLC, as Original Trustee, and U.S. Bank National Association, as Series Trustee and Form of 6.900% Prospect Capital InterNote® due 2022(11) |
4.10 | Agreement of Resignation, Appointment and Acceptance dated as of March 12, 2012, by and among the Registrant, American Stock Transfer & Trust Company, LLC, as Retiring Trustee, and U.S. Bank National Association, as Successor Trustee (the “U.S. Bank Indenture”)(12) |
4.11 | Third Supplemental Indenture dated as of April 5, 2012, to the U.S. Bank Indenture and Form of 6.850% Prospect Capital InterNote® due 2022(14) |
4.12 | Fourth Supplemental Indenture dated as of April 12, 2012, to the U.S. Bank Indenture and Form of 6.700% Prospect Capital InterNote® due 2022(15) |
4.13 | Indenture dated as of April 16, 2012 relating to the 5.375% Senior Convertible Notes, by and between the Registrant and American Stock Transfer & Trust Company, as Trustee(16) |
4.14 | Form of 5.375% Senior Convertible Note due 2017(17) |
4.15 | Fifth Supplemental Indenture dated as of April 26, 2012, to the U.S. Bank Indenture and Form of 6.500% Prospect Capital InterNote® due 2022(18) |
4.16 | Indenture dated as of August 14, 2012 relating to the 5.75% Senior Convertible Notes, by and between the Registrant and American Stock Transfer & Trust Company, as Trustee(19) |
4.17 | Form of 5.75% Senior Convertible Note due 2018(20) |
4.18 | Nineteenth Supplemental Indenture dated as of September 27, 2012, to the U.S. Bank Indenture and Form of 5.850% Prospect Capital InterNote® due 2019(21) |
4.19 | Twentieth Supplemental Indenture dated as of October 4, 2012, to the U.S. Bank Indenture and Form of 5.700% Prospect Capital InterNote® due 2019(22) |
223
Exhibit No. | |
4.20 | Twenty-First Supplemental Indenture dated as of November 23, 2012, to the U.S. Bank Indenture and Form of 5.125% Prospect Capital InterNote® due 2019(23) |
4.21 | Twenty-Second Supplemental Indenture dated as of November 23, 2012, to the U.S. Bank Indenture and Form of 6.625% Prospect Capital InterNote® due 2042(23) |
4.22 | Twenty-Third Supplemental Indenture dated as of November 29, 2012, to the U.S. Bank Indenture and Form of 5.000% Prospect Capital InterNote® due 2019(24) |
4.23 | Twenty-Fourth Supplemental Indenture dated as of November 29, 2012, to the U.S. Bank Indenture and Form of 5.750% Prospect Capital InterNote® due 2032(24) |
4.24 | Twenty-Fifth Supplemental Indenture dated as of November 29, 2012, to the U.S. Bank Indenture and Form of 6.500% Prospect Capital InterNote® due 2042(24) |
4.25 | Twenty-Sixth Supplemental Indenture dated as of December 6, 2012, to the U.S. Bank Indenture and Form of 4.875% Prospect Capital InterNote® due 2019(25) |
4.26 | Twenty-Eighth Supplemental Indenture dated as of December 6, 2012, to the U.S. Bank Indenture and Form of 6.375% Prospect Capital InterNote® due 2042(25) |
4.27 | Twenty-Ninth Supplemental Indenture dated as of December 13, 2012, to the U.S. Bank Indenture and Form of 4.750% Prospect Capital InterNote® due 2019(26) |
4.28 | Thirty-First Supplemental Indenture dated as of December 13, 2012, to the U.S. Bank Indenture and Form of 6.250% Prospect Capital InterNote® due 2042(26) |
4.29 | Thirty-Second Supplemental Indenture dated as of December 20, 2012, to the U.S. Bank Indenture and Form of 4.625% Prospect Capital InterNote® due 2019(27) |
4.30 | Thirty-Fourth Supplemental Indenture dated as of December 20, 2012, to the U.S. Bank Indenture and Form of 6.125% Prospect Capital InterNote® due 2042(27) |
4.31 | Indenture dated as of December 21, 2012, by and between the Registrant and American Stock Transfer & Trust Company, as Trustee and Form of Global Note 5.875% Convertible Senior Note Due 2019(28) |
4.32 | Thirty-Fifth Supplemental Indenture dated as of December 28, 2012, to the U.S. Bank Indenture and Form of 4.500% Prospect Capital InterNote® due 2019(29) |
4.33 | Thirty-Sixth Supplemental Indenture dated as of December 28, 2012, to the U.S. Bank Indenture and Form of 5.000% Prospect Capital InterNote® due 2030(29) |
4.34 | Thirty-Seventh Supplemental Indenture dated as of December 28, 2012, to the U.S. Bank Indenture and Form of 6.000% Prospect Capital InterNote® due 2042(29) |
4.35 | Thirty-Eighth Supplemental Indenture dated as of January 4, 2013, to the U.S. Bank Indenture and Form of 4.375% Prospect Capital InterNote® due 2020(30) |
4.36 | Thirty-Ninth Supplemental Indenture dated as of January 4, 2013, to the U.S. Bank Indenture and Form of 4.875% Prospect Capital InterNote® due 2031(30) |
4.37 | Fortieth Supplemental Indenture dated as of January 4, 2013, to the U.S. Bank Indenture and Form of 5.875% Prospect Capital InterNote® due 2043(30) |
4.38 | Forty-First Supplemental Indenture dated as of January 10, 2013, to the U.S. Bank Indenture and Form of 4.250% Prospect Capital InterNote® due 2020(31) |
4.39 | Forty-Second Supplemental Indenture dated as of January 10, 2013, to the U.S. Bank Indenture and Form of 4.750% Prospect Capital InterNote® due 2031(31) |
4.40 | Forty-Third Supplemental Indenture dated as of January 10, 2013, to the U.S. Bank Indenture and Form of 5.750% Prospect Capital InterNote® due 2043(31) |
4.41 | Forty-Fourth Supplemental Indenture dated as of January 17, 2013, to the U.S. Bank Indenture and Form of 4.125% Prospect Capital InterNote® due 2020(32) |
4.42 | Forty-Fifth Supplemental Indenture dated as of January 17, 2013, to the U.S. Bank Indenture and Form of 4.625% Prospect Capital InterNote® due 2031(32) |
4.43 | Forty-Sixth Supplemental Indenture dated as of January 17, 2013, to the U.S. Bank Indenture and Form of 5.625% Prospect Capital InterNote® due 2043(32) |
4.44 | Forty-Seventh Supplemental Indenture dated as of January 25, 2013, to the U.S. Bank Indenture and Form of 4.000% Prospect Capital InterNote® due 2020(33) |
4.45 | Forty-Eighth Supplemental Indenture dated as of January 25, 2013, to the U.S. Bank Indenture and Form of 4.500% Prospect Capital InterNote® due 2031(33) |
224
Exhibit No. | |
4.46 | Forty-Ninth Supplemental Indenture dated as of January 25, 2013, to the U.S. Bank Indenture and Form of 5.500% Prospect Capital InterNote® due 2043(33) |
4.47 | Fiftieth Supplemental Indenture dated as of January 31, 2013, to the U.S. Bank Indenture and Form of 4.000% Prospect Capital InterNote® due 2020(34) |
4.48 | Fifty-First Supplemental Indenture dated as of January 31, 2013, to the U.S. Bank Indenture and Form of 4.500% Prospect Capital InterNote® due 2031(34) |
4.49 | Fifty-Second Supplemental Indenture dated as of January 31, 2013, to the U.S. Bank Indenture and Form of 5.500% Prospect Capital InterNote® due 2043(34) |
4.50 | Fifty-Third Supplemental Indenture dated as of February 7, 2013, to the U.S. Bank Indenture and Form of 4.000% Prospect Capital InterNote® due 2020(35) |
4.51 | Fifty-Fourth Supplemental Indenture dated as of February 7, 2013, to the U.S. Bank Indenture and Form of 4.500% Prospect Capital InterNote® due 2031(35) |
4.52 | Fifty-Fifth Supplemental Indenture dated as of February 7, 2013, to the U.S. Bank Indenture and Form of 5.500% Prospect Capital InterNote® due 2043(35) |
4.53 | Fifty-Sixth Supplemental Indenture dated as of February 22, 2013, to the U.S. Bank Indenture and Form of 4.000% Prospect Capital InterNote® due 2020(36) |
4.54 | Fifty-Seventh Supplemental Indenture dated as of February 22, 2013, to the U.S. Bank Indenture and Form of 4.500% Prospect Capital InterNote® due 2031(36) |
4.55 | Fifty-Eighth Supplemental Indenture dated as of February 22, 2013, to the U.S. Bank Indenture and Form of 5.500% Prospect Capital InterNote® due 2043(36) |
4.56 | Fifty-Ninth Supplemental Indenture dated as of February 28, 2013, to the U.S. Bank Indenture and Form of 4.000% Prospect Capital InterNote® due 2020(37) |
4.57 | Sixtieth Supplemental Indenture dated as of February 28, 2013, to the U.S. Bank Indenture and Form of 4.500% Prospect Capital InterNote® due 2031(37) |
4.58 | Sixty-First Supplemental Indenture dated as of February 28, 2013, to the U.S. Bank Indenture and Form of 5.500% Prospect Capital InterNote® due 2043(37) |
4.59 | Sixty-Second Supplemental Indenture dated as of March 7, 2013, to the U.S. Bank Indenture and Form of 4.000% Prospect Capital InterNote® due 2020(38) |
4.60 | Sixty-Third Supplemental Indenture dated as of March 7, 2013, to the U.S. Bank Indenture and Form of 4.500% Prospect Capital InterNote® due 2031(38) |
4.61 | Sixty-Fourth Supplemental Indenture dated as of March 7, 2013, to the U.S. Bank Indenture and Form of 5.500% Prospect Capital InterNote® due 2043(38) |
4.62 | Sixty-Fifth Supplemental Indenture dated as of March 14, 2013, to the U.S. Bank Indenture and Form of 4.000% Prospect Capital InterNote® due 2020(39) |
4.63 | Sixty-Sixth Supplemental Indenture dated as of March 14, 2013, to the U.S. Bank Indenture and Form of 4.125% to 6.000% Prospect Capital InterNote® due 2031(39) |
4.64 | Sixty-Seventh Supplemental Indenture dated as of March 14, 2013, to the U.S. Bank Indenture and Form of 5.500% Prospect Capital InterNote® due 2043(39) |
4.65 | Sixty-Eighth Supplemental Indenture dated as of March 14, 2013, to the U.S. Bank Indenture and Form of Floating Prospect Capital InterNote® due 2023(39) |
4.66 | Supplemental Indenture dated as of March 15, 2013, to the U.S. Bank Indenture(40) |
4.67 | Form of Global Note 5.875% Senior Note due 2023(41) |
4.68 | Sixty-Ninth Supplemental Indenture dated as of March 21, 2013, to the U.S. Bank Indenture and Form of 4.000% Prospect Capital InterNote® due 2020(42) |
4.69 | Seventieth Supplemental Indenture dated as of March 21, 2013, to the U.S. Bank Indenture and Form of 4.125% to 6.000% Prospect Capital InterNote® due 2031(42) |
4.70 | Seventy-First Supplemental Indenture dated as of March 21, 2013, to the U.S. Bank Indenture and Form of 5.500% Prospect Capital InterNote® due 2043(42) |
4.71 | Seventy-Second Supplemental Indenture dated as of March 21, 2013, to the U.S. Bank Indenture and Form of Floating Prospect Capital InterNote® due 2023(42) |
4.72 | Seventy-Third Supplemental Indenture dated as of March 28, 2013, to the U.S. Bank Indenture and Form of 4.000% Prospect Capital InterNote® due 2020(43) |
225
Exhibit No. | |
4.73 | Seventy-Fourth Supplemental Indenture dated as of March 28, 2013, to the U.S. Bank Indenture and Form of 4.125% to 6.000% Prospect Capital InterNote® due 2031(43) |
4.74 | Seventy-Fifth Supplemental Indenture dated as of March 28, 2013, to the U.S. Bank Indenture and Form of 5.500% Prospect Capital InterNote® due 2043(43) |
4.75 | Seventy-Sixth Supplemental Indenture dated as of March 28, 2013, to the U.S. Bank Indenture and Form of Floating Prospect Capital InterNote® due 2023(43) |
4.76 | Seventy-Seventh Supplemental Indenture dated as of April 4, 2013, to the U.S. Bank Indenture and Form of 4.500% Prospect Capital InterNote® due 2020(44) |
4.77 | Seventy-Eighth Supplemental Indenture dated as of April 4, 2013, to the U.S. Bank Indenture and Form of 4.625% to 6.500% Prospect Capital InterNote® due 2031(44) |
4.78 | Seventy-Ninth Supplemental Indenture dated as of April 4, 2013, to the U.S. Bank Indenture and Form of 6.000% Prospect Capital InterNote® due 2043(44) |
4.79 | Eightieth Supplemental Indenture dated as of April 4, 2013, to the U.S. Bank Indenture and Form of Floating Prospect Capital InterNote® due 2023(44) |
4.80 | Eighty-First Supplemental Indenture dated as of April 11, 2013, to the U.S. Bank Indenture and Form of 4.500% Prospect Capital InterNote® due 2020(45) |
4.81 | Eighty-Second Supplemental Indenture dated as of April 11, 2013, to the U.S. Bank Indenture and Form of 5.500% Prospect Capital InterNote® due 2031(45) |
4.82 | Eighty-Third Supplemental Indenture dated as of April 11, 2013, to the U.S. Bank Indenture and Form of 6.000% Prospect Capital InterNote® due 2043(45) |
4.83 | Eighty-Fourth Supplemental Indenture dated as of April 11, 2013, to the U.S. Bank Indenture and Form of Floating Prospect Capital InterNote® due 2023(45) |
4.84 | Eighty-Fifth Supplemental Indenture dated as of April 18, 2013, to the U.S. Bank Indenture and Form of 5.000% Prospect Capital InterNote® due 2020(46) |
4.85 | Eighty-Sixth Supplemental Indenture dated as of April 18, 2013, to the U.S. Bank Indenture and Form of 5.500% Prospect Capital InterNote® due 2031(46) |
4.86 | Eighty-Seventh Supplemental Indenture dated as of April 18, 2013, to the U.S. Bank Indenture and Form of 6.000% Prospect Capital InterNote® due 2043(46) |
4.87 | Eighty-Eighth Supplemental Indenture dated as of April 25, 2013, to the U.S. Bank Indenture and Form of 5.000% Prospect Capital InterNote® due 2020(47) |
4.88 | Eighty-Ninth Supplemental Indenture dated as of April 25, 2013, to the U.S. Bank Indenture and Form of 5.500% Prospect Capital InterNote® due 2031(47) |
4.89 | Ninetieth Supplemental Indenture dated as of April 25, 2013, to the U.S. Bank Indenture and Form of 6.000% Prospect Capital InterNote® due 2043(47) |
4.90 | Ninety-First Supplemental Indenture dated as of May 2, 2013, to the U.S. Bank Indenture and Form of 5.000% Prospect Capital InterNote® due 2020(48) |
4.91 | Ninety-Second Supplemental Indenture dated as of May 2, 2013, to the U.S. Bank Indenture and Form of 5.750% Prospect Capital InterNote® due 2031(48) |
4.92 | Ninety-Third Supplemental Indenture dated as of May 2, 2013, to the U.S. Bank Indenture and Form of 6.250% Prospect Capital InterNote® due 2043(48) |
4.93 | Ninety-Fourth Supplemental Indenture dated as of May 9, 2013, to the U.S. Bank Indenture and Form of 5.000% Prospect Capital InterNote® due 2020(49) |
4.94 | Ninety-Fifth Supplemental Indenture dated as of May 9, 2013, to the U.S. Bank Indenture and Form of 5.750% Prospect Capital InterNote® due 2031(49) |
4.95 | Ninety-Sixth Supplemental Indenture dated as of May 9, 2013, to the U.S. Bank Indenture and Form of 6.250% Prospect Capital InterNote® due 2043(49) |
4.96 | Ninety-Seventh Supplemental Indenture dated as of May 23, 2013, to the U.S. Bank Indenture and Form of 5.000% Prospect Capital InterNote® due 2020(50) |
4.97 | Ninety-Eighth Supplemental Indenture dated as of May 23, 2013, to the U.S. Bank Indenture and Form of 5.750% Prospect Capital InterNote® due 2031(50) |
4.98 | Ninety-Ninth Supplemental Indenture dated as of May 23, 2013, to the U.S. Bank Indenture and Form of 6.250% Prospect Capital InterNote® due 2043(50) |
226
Exhibit No. | |
4.99 | One Hundredth Supplemental Indenture dated as of May 23, 2013, to the U.S. Bank Indenture and Form of 5.000% to 7.000% Prospect Capital InterNote® due 2028(50) |
4.100 | One Hundred-First Supplemental Indenture dated as of May 31, 2013, to the U.S. Bank Indenture and Form of 5.000% Prospect Capital InterNote® due 2020(51) |
4.101 | One Hundred-Second Supplemental Indenture dated as of May 31, 2013, to the U.S. Bank Indenture and Form of 5.750% Prospect Capital InterNote® due 2031(51) |
4.102 | One Hundred-Third Supplemental Indenture dated as of May 31, 2013, to the U.S. Bank Indenture and Form of 6.250% Prospect Capital InterNote® due 2043(51) |
4.103 | One Hundred-Fourth Supplemental Indenture dated as of June 6, 2013, to the U.S. Bank Indenture and Form of 5.000% Prospect Capital InterNote® due 2020(52) |
4.104 | One Hundred-Fifth Supplemental Indenture dated as of June 6, 2013, to the U.S. Bank Indenture and Form of 5.750% Prospect Capital InterNote® due 2031(52) |
4.105 | One Hundred-Sixth Supplemental Indenture dated as of June 6, 2013, to the U.S. Bank Indenture and Form of 6.250% Prospect Capital InterNote® due 2043(52) |
4.106 | One Hundred-Seventh Supplemental Indenture dated as of June 6, 2013, to the U.S. Bank Indenture and Form of 5.000% to 7.000% Prospect Capital InterNote® due 2028(52) |
4.107 | One Hundred-Eighth Supplemental Indenture dated as of June 13, 2013, to the U.S. Bank Indenture and Form of 5.000% Prospect Capital InterNote® due 2020(53) |
4.108 | One Hundred-Ninth Supplemental Indenture dated as of June 13, 2013, to the U.S. Bank Indenture and Form of 5.750% Prospect Capital InterNote® due 2031(53) |
4.109 | One Hundred-Tenth Supplemental Indenture dated as of June 13, 2013, to the U.S. Bank Indenture and Form of 6.250% Prospect Capital InterNote® due 2043(53) |
4.110 | One Hundred-Eleventh Supplemental Indenture dated as of June 20, 2013, to the U.S. Bank Indenture and Form of 5.000% Prospect Capital InterNote® due 2020(54) |
4.111 | One Hundred-Twelfth Supplemental Indenture dated as of June 20, 2013, to the U.S. Bank Indenture and Form of 5.750% Prospect Capital InterNote® due 2031(54) |
4.112 | One Hundred-Thirteenth Supplemental Indenture dated as of June 20, 2013, to the U.S. Bank Indenture and Form of 6.250% Prospect Capital InterNote® due 2043(54) |
4.113 | One Hundred-Fifteenth Supplemental Indenture dated as of June 27, 2013, to the U.S. Bank Indenture and Form of 6.000% Prospect Capital InterNote® due 2031(55) |
4.114 | One Hundred-Sixteenth Supplemental Indenture dated as of June 27, 2013, to the U.S. Bank Indenture and Form of 6.500% Prospect Capital InterNote® due 2043(55) |
4.115 | One Hundred-Seventeenth Supplemental Indenture dated as of July 5, 2013, to the U.S. Bank Indenture and Form of 4.750% Prospect Capital InterNote® due 2020(56) |
4.116 | One Hundred-Eighteenth Supplemental Indenture dated as of July 5, 2013, to the U.S. Bank Indenture and Form of 5.500% Prospect Capital InterNote® due 2031(56) |
4.117 | One Hundred-Nineteenth Supplemental Indenture dated as of July 5, 2013, to the U.S. Bank Indenture and Form of 6.250% Prospect Capital InterNote® due 2043(56) |
4.118 | One Hundred-Twentieth Supplemental Indenture dated as of July 5, 2013, to the U.S. Bank Indenture and Form of 6.750% Prospect Capital InterNote® due 2043(56) |
4.119 | One Hundred Twenty-First Supplemental Indenture dated as of July 11, 2013, to the U.S. Bank Indenture and Form of 4.750% Prospect Capital InterNote® due 2020(57) |
4.120 | One Hundred Twenty-Second Supplemental Indenture dated as of July 11, 2013, to the U.S. Bank Indenture and Form of 5.500% Prospect Capital InterNote® due 2031(57) |
4.121 | One Hundred Twenty-Third Supplemental Indenture dated as of July 11, 2013, to the U.S. Bank Indenture and Form of 6.250% Prospect Capital InterNote® due 2043(57) |
4.122 | One Hundred Twenty-Fourth Supplemental Indenture dated as of July 11, 2013, to the U.S. Bank Indenture and Form of 6.750% Prospect Capital InterNote® due 2043(57) |
4.123 | One Hundred Twenty-Fifth Supplemental Indenture dated as of July 18, 2013, to the U.S. Bank Indenture and Form of 5.000% Prospect Capital InterNote® due 2020(58) |
4.124 | One Hundred Twenty-Sixth Supplemental Indenture dated as of July 18, 2013, to the U.S. Bank Indenture and Form of 5.750% Prospect Capital InterNote® due 2031(58) |
227
Exhibit No. | |
4.125 | One Hundred Twenty-Seventh Supplemental Indenture dated as of July 18, 2013, to the U.S. Bank Indenture and Form of 6.250% Prospect Capital InterNote® due 2043(58) |
4.126 | One Hundred Twenty-Eighth Supplemental Indenture dated as of July 18, 2013, to the U.S. Bank Indenture and Form of 6.750% Prospect Capital InterNote® due 2043(58) |
4.127 | One Hundred Twenty-Ninth Supplemental Indenture dated as of July 25, 2013, to the U.S. Bank Indenture and Form of 5.000% Prospect Capital InterNote® due 2020(59) |
4.128 | One Hundred Thirtieth Supplemental Indenture dated as of July 25, 2013, to the U.S. Bank Indenture and Form of 5.750% Prospect Capital InterNote® due 2031(59) |
4.129 | One Hundred Thirty-First Supplemental Indenture dated as of July 25, 2013, to the U.S. Bank Indenture and Form of 6.250% Prospect Capital InterNote® due 2043(59) |
4.130 | One Hundred Thirty-Second Supplemental Indenture dated as of July 25, 2013, to the U.S. Bank Indenture and Form of 6.750% Prospect Capital InterNote® due 2043(59) |
4.131 | One Hundred Thirty-Third Supplemental Indenture dated as of August 1, 2013, to the U.S. Bank Indenture and Form of 5.000% Prospect Capital InterNote® due 2019(60) |
4.132 | One Hundred Thirty-Fourth Supplemental Indenture dated as of August 1, 2013, to the U.S. Bank Indenture and Form of 5.750% Prospect Capital InterNote® due 2021(60) |
4.133 | One Hundred Thirty-Fifth Supplemental Indenture dated as of August 1, 2013, to the U.S. Bank Indenture and Form of 6.125% Prospect Capital InterNote® due 2031(60) |
4.134 | One Hundred Thirty-Sixth Supplemental Indenture dated as of August 1, 2013, to the U.S. Bank Indenture and Form of 6.625% Prospect Capital InterNote® due 2043(60) |
4.135 | One Hundred Thirty-Seventh Supplemental Indenture dated as of August 8, 2013, to the U.S. Bank Indenture and Form of 5.000% Prospect Capital InterNote® due 2018(61) |
4.136 | One Hundred Thirty-Eighth Supplemental Indenture dated as of August 8, 2013, to the U.S. Bank Indenture and Form of 5.500% Prospect Capital InterNote® due 2020(61) |
4.137 | One Hundred Thirty-Ninth Supplemental Indenture dated as of August 8, 2013, to the U.S. Bank Indenture and Form of 6.000% Prospect Capital InterNote® due 2031(61) |
4.138 | One Hundred Fortieth Supplemental Indenture dated as of August 8, 2013, to the U.S. Bank Indenture and Form of 6.500% Prospect Capital InterNote® due 2043(61) |
4.139 | One Hundred Forty-First Supplemental Indenture dated as of August 15, 2013, to the U.S. Bank Indenture and Form of 5.000% Prospect Capital InterNote® due 2018(62) |
4.140 | One Hundred Forty-Second Supplemental Indenture dated as of August 15, 2013, to the U.S. Bank Indenture and Form of 5.500% Prospect Capital InterNote® due 2020(62) |
4.141 | One Hundred Forty-Third Supplemental Indenture dated as of August 15, 2013, to the U.S. Bank Indenture and Form of 6.000% Prospect Capital InterNote® due 2028(62) |
4.142 | One Hundred Forty-Fourth Supplemental Indenture dated as of August 15, 2013, to the U.S. Bank Indenture and Form of 6.500% Prospect Capital InterNote® due 2038(62) |
4.143 | One Hundred Forty-Fifth Supplemental Indenture dated as of August 22, 2013, to the U.S. Bank Indenture and Form of 5.000% Prospect Capital InterNote® due 2018(63) |
4.144 | One Hundred Forty-Sixth Supplemental Indenture dated as of August 22, 2013, to the U.S. Bank Indenture and Form of 5.500% Prospect Capital InterNote® due 2020(63) |
4.145 | One Hundred Forty-Seventh Supplemental Indenture dated as of August 22, 2013, to the U.S. Bank Indenture and Form of 6.000% Prospect Capital InterNote® due 2028(63) |
4.146 | One Hundred Forty-Eighth Supplemental Indenture dated as of August 22, 2013, to the U.S. Bank Indenture and Form of 6.500% Prospect Capital InterNote® due 2038(63) |
4.147 | One Hundred Forty-Ninth Supplemental Indenture dated as of September 6, 2013, to the U.S. Bank Indenture and Form of 5.000% Prospect Capital InterNote® due 2018(64) |
4.148 | One Hundred Fiftieth Supplemental Indenture dated as of September 6, 2013, to the U.S. Bank Indenture and Form of 5.500% Prospect Capital InterNote® due 2020(64) |
4.149 | One Hundred Fifty-First Supplemental Indenture dated as of September 6, 2013, to the U.S. Bank Indenture and Form of 6.000% Prospect Capital InterNote® due 2028(64) |
4.150 | One Hundred Fifty-Second Supplemental Indenture dated as of September 6, 2013, to the U.S. Bank Indenture and Form of 6.500% Prospect Capital InterNote® due 2038(64) |
228
Exhibit No. | |
4.151 | One Hundred Fifty-Third Supplemental Indenture dated as of September 12, 2013, to the U.S. Bank Indenture and Form of 5.000% Prospect Capital InterNote® due 2018(65) |
4.152 | One Hundred Fifty-Fourth Supplemental Indenture dated as of September 12, 2013, to the U.S. Bank Indenture and Form of 5.500% Prospect Capital InterNote® due 2020(65) |
4.153 | One Hundred Fifty-Fifth Supplemental Indenture dated as of September 12, 2013, to the U.S. Bank Indenture and Form of 6.000% Prospect Capital InterNote® due 2033(65) |
4.154 | One Hundred Fifty-Sixth Supplemental Indenture dated as of September 12, 2013, to the U.S. Bank Indenture and Form of 6.500% Prospect Capital InterNote® due 2043(65) |
4.155 | One Hundred Fifty-Seventh Supplemental Indenture dated as of September 19, 2013, to the U.S. Bank Indenture and Form of 5.000% Prospect Capital InterNote® due 2018(66) |
4.156 | One Hundred Fifty-Eighth Supplemental Indenture dated as of September 19, 2013, to the U.S. Bank Indenture and Form of 5.500% Prospect Capital InterNote® due 2020(66) |
4.157 | One Hundred Fifty-Ninth Supplemental Indenture dated as of September 19, 2013, to the U.S. Bank Indenture and Form of 6.000% Prospect Capital InterNote® due 2033(66) |
4.158 | One Hundred Sixtieth Supplemental Indenture dated as of September 19, 2013, to the U.S. Bank Indenture and Form of 6.500% Prospect Capital InterNote® due 2043(66) |
4.159 | One Hundred Sixty-First Supplemental Indenture dated as of September 26, 2013, to the U.S. Bank Indenture and Form of 5.000% Prospect Capital InterNote® due 2018(67) |
4.160 | One Hundred Sixty-Second Supplemental Indenture dated as of September 26, 2013, to the U.S. Bank Indenture and Form of 5.500% Prospect Capital InterNote® due 2020(67) |
4.161 | One Hundred Sixty-Third Supplemental Indenture dated as of September 26, 2013, to the U.S. Bank Indenture and Form of 6.000% Prospect Capital InterNote® due 2033(67) |
4.162 | One Hundred Sixty-Fourth Supplemental Indenture dated as of September 26, 2013, to the U.S. Bank Indenture and Form of 6.500% Prospect Capital InterNote® due 2043(67) |
4.163 | One Hundred Sixty-Fifth Supplemental Indenture dated as of October 3, 2013, to the U.S. Bank Indenture and Form of 5.000% Prospect Capital InterNote® due 2018(68) |
4.164 | One Hundred Sixty-Sixth Supplemental Indenture dated as of October 3, 2013, to the U.S. Bank Indenture and Form of 5.500% Prospect Capital InterNote® due 2020(68) |
4.165 | One Hundred Sixty-Seventh Supplemental Indenture dated as of October 3, 2013, to the U.S. Bank Indenture and Form of 6.000% Prospect Capital InterNote® due 2033(68) |
4.166 | One Hundred Sixty-Eighth Supplemental Indenture dated as of October 3, 2013, to the U.S. Bank Indenture and Form of 6.500% Prospect Capital InterNote® due 2043(68) |
4.167 | One Hundred Sixty-Ninth Supplemental Indenture dated as of October 10, 2013, to the U.S. Bank Indenture and Form of 5.000% Prospect Capital InterNote® due 2018(69) |
4.168 | One Hundred Seventieth Supplemental Indenture dated as of October 10, 2013, to the U.S. Bank Indenture and Form of 5.500% Prospect Capital InterNote® due 2020(69) |
4.169 | One Hundred Seventy-First Supplemental Indenture dated as of October 10, 2013, to the U.S. Bank Indenture and Form of 6.000% Prospect Capital InterNote® due 2033(69) |
4.170 | One Hundred Seventy-Second Supplemental Indenture dated as of October 10, 2013, to the U.S. Bank Indenture and Form of 6.500% Prospect Capital InterNote® due 2043(69) |
4.171 | One Hundred Seventy-Third Supplemental Indenture dated as of October 18, 2013, to the U.S. Bank Indenture and Form of 5.000% Prospect Capital InterNote® due 2018(70) |
4.172 | One Hundred Seventy-Fourth Supplemental Indenture dated as of October 18, 2013, to the U.S. Bank Indenture and Form of 5.500% Prospect Capital InterNote® due 2020(70) |
4.173 | One Hundred Seventy-Fifth Supplemental Indenture dated as of October 18, 2013, to the U.S. Bank Indenture and Form of 6.000% Prospect Capital InterNote® due 2033(70) |
4.174 | One Hundred Seventy-Sixth Supplemental Indenture dated as of October 18, 2013, to the U.S. Bank Indenture and Form of 6.500% Prospect Capital InterNote® due 2043(70) |
4.175 | One Hundred Seventy-Seventh Supplemental Indenture dated as of October 24, 2013, to the U.S. Bank Indenture and Form of 4.000% Prospect Capital InterNote® due 2016(71) |
4.176 | One Hundred Seventy-Eighth Supplemental Indenture dated as of October 24, 2013, to the U.S. Bank Indenture and Form of 5.000% Prospect Capital InterNote® due 2018(71) |
229
Exhibit No. | |
4.177 | One Hundred Seventy-Ninth Supplemental Indenture dated as of October 24, 2013, to the U.S. Bank Indenture and Form of 5.500% Prospect Capital InterNote® due 2020(71) |
4.178 | One Hundred Eightieth Supplemental Indenture dated as of October 24, 2013, to the U.S. Bank Indenture and Form of 6.000% Prospect Capital InterNote® due 2033(71) |
4.179 | One Hundred Eighty-First Supplemental Indenture dated as of October 24, 2013, to the U.S. Bank Indenture and Form of 6.500% Prospect Capital InterNote® due 2043(71) |
4.180 | One Hundred Eighty-Second Supplemental Indenture dated as of October 31, 2013, to the U.S. Bank Indenture and Form of 4.000% Prospect Capital InterNote® due 2017(72) |
4.181 | One Hundred Eighty-Third Supplemental Indenture dated as of October 31, 2013, to the U.S. Bank Indenture and Form of 5.000% Prospect Capital InterNote® due 2018(72) |
4.182 | One Hundred Eighty-Fourth Supplemental Indenture dated as of October 31, 2013, to the U.S. Bank Indenture and Form of 5.500% Prospect Capital InterNote® due 2020(72) |
4.183 | One Hundred Eighty-Fifth Supplemental Indenture dated as of October 31, 2013, to the U.S. Bank Indenture and Form of 6.000% Prospect Capital InterNote® due 2028(72) |
4.184 | One Hundred Eighty-Sixth Supplemental Indenture dated as of October 31, 2013, to the U.S. Bank Indenture and Form of 6.500% Prospect Capital InterNote® due 2038(72) |
4.185 | One Hundred Eighty-Seventh Supplemental Indenture dated as of November 7, 2013, to the U.S. Bank Indenture and Form of 4.000% Prospect Capital InterNote® due 2017(73) |
4.186 | One Hundred Eighty-Eighth Supplemental Indenture dated as of November 7, 2013, to the U.S. Bank Indenture and Form of 5.000% Prospect Capital InterNote® due 2018(73) |
4.187 | One Hundred Eighty-Ninth Supplemental Indenture dated as of November 7, 2013, to the U.S. Bank Indenture and Form of 5.500% Prospect Capital InterNote® due 2020(73) |
4.188 | One Hundred Ninetieth Supplemental Indenture dated as of November 7, 2013, to the U.S. Bank Indenture and Form of 6.000% Prospect Capital InterNote® due 2028(73) |
4.189 | One Hundred Ninety-First Supplemental Indenture dated as of November 7, 2013, to the U.S. Bank Indenture and Form of 6.500% Prospect Capital InterNote® due 2038(73) |
4.190 | One Hundred Ninety-Second Supplemental Indenture dated as of November 15, 2013, to the U.S. Bank Indenture and Form of 4.000% Prospect Capital InterNote® due 2017(74) |
4.191 | One Hundred Ninety-Third Supplemental Indenture dated as of November 15, 2013, to the U.S. Bank Indenture and Form of 5.000% Prospect Capital InterNote® due 2018(74) |
4.192 | One Hundred Ninety-Fourth Supplemental Indenture dated as of November 15, 2013, to the U.S. Bank Indenture and Form of 5.500% Prospect Capital InterNote® due 2020(74) |
4.193 | One Hundred Ninety-Fifth Supplemental Indenture dated as of November 15, 2013, to the U.S. Bank Indenture and Form of 6.000% Prospect Capital InterNote® due 2028(74) |
4.194 | One Hundred Ninety-Sixth Supplemental Indenture dated as of November 15, 2013, to the U.S. Bank Indenture and Form of 6.500% Prospect Capital InterNote® due 2038(74) |
4.195 | One Hundred Ninety-Seventh Supplemental Indenture dated as of November 21, 2013, to the U.S. Bank Indenture and Form of 4.000% Prospect Capital InterNote® due 2017(75) |
4.196 | One Hundred Ninety-Eighth Supplemental Indenture dated as of November 21, 2013, to the U.S. Bank Indenture and Form of 5.000% Prospect Capital InterNote® due 2018(75) |
4.197 | One Hundred Ninety-Ninth Supplemental Indenture dated as of November 21, 2013, to the U.S. Bank Indenture and Form of 5.500% Prospect Capital InterNote® due 2020(75) |
4.198 | Two Hundredth Supplemental Indenture dated as of November 21, 2013, to the U.S. Bank Indenture and Form of 6.000% Prospect Capital InterNote® due 2028(75) |
4.199 | Two Hundred First Supplemental Indenture dated as of November 21, 2013, to the U.S. Bank Indenture and Form of 6.500% Prospect Capital InterNote® due 2038(75) |
4.200 | Two Hundred Second Supplemental Indenture dated as of November 29, 2013, to the U.S. Bank Indenture and Form of 4.000% Prospect Capital InterNote® due 2017(76) |
4.201 | Two Hundred Third Supplemental Indenture dated as of November 29, 2013, to the U.S. Bank Indenture and Form of 5.000% Prospect Capital InterNote® due 2018(76) |
4.202 | Two Hundred Fourth Supplemental Indenture dated as of November 29, 2013, to the U.S. Bank Indenture and Form of 5.500% Prospect Capital InterNote® due 2020(76) |
230
Exhibit No. | |
4.203 | Two Hundred Fifth Supplemental Indenture dated as of November 29, 2013, to the U.S. Bank Indenture and Form of 6.000% Prospect Capital InterNote® due 2025(76) |
4.204 | Two Hundred Sixth Supplemental Indenture dated as of November 29, 2013, to the U.S. Bank Indenture and Form of 6.500% Prospect Capital InterNote® due 2038(76) |
4.205 | Two Hundred Seventh Supplemental Indenture dated as of December 5, 2013, to the U.S. Bank Indenture and Form of 4.000% Prospect Capital InterNote® due 2017(77) |
4.206 | Two Hundred Eighth Supplemental Indenture dated as of December 5, 2013, to the U.S. Bank Indenture and Form of 5.000% Prospect Capital InterNote® due 2018(77) |
4.207 | Two Hundred Tenth Supplemental Indenture dated as of December 5, 2013, to the U.S. Bank Indenture and Form of 6.000% Prospect Capital InterNote® due 2025(77) |
4.208 | Two Hundred Eleventh Supplemental Indenture dated as of December 5, 2013, to the U.S. Bank Indenture and Form of 6.500% Prospect Capital InterNote® due 2038(77) |
4.209 | Two Hundred Twelfth Supplemental Indenture dated as of December 12, 2013, to the U.S. Bank Indenture and Form of 4.000% Prospect Capital InterNote® due 2017(78) |
4.210 | Two Hundred Thirteenth Supplemental Indenture dated as of December 12, 2013, to the U.S. Bank Indenture and Form of 5.000% Prospect Capital InterNote® due 2018(78) |
4.211 | Two Hundred Fifteenth Supplemental Indenture dated as of December 12, 2013, to the U.S. Bank Indenture and Form of 6.000% Prospect Capital InterNote® due 2025(78) |
4.212 | Two Hundred Sixteenth Supplemental Indenture dated as of December 12, 2013, to the U.S. Bank Indenture and Form of 6.500% Prospect Capital InterNote® due 2038(78) |
4.213 | Two Hundred Seventeenth Supplemental Indenture dated as of December 19, 2013, to the U.S. Bank Indenture and Form of 4.000% Prospect Capital InterNote® due 2017(79) |
4.214 | Two Hundred Eighteenth Supplemental Indenture dated as of December 19, 2013, to the U.S. Bank Indenture and Form of 5.000% Prospect Capital InterNote® due 2018(79) |
4.215 | Two Hundred Twentieth Supplemental Indenture dated as of December 19, 2013, to the U.S. Bank Indenture and Form of 6.000% Prospect Capital InterNote® due 2025(79) |
4.216 | Two Hundred Twenty-First Supplemental Indenture dated as of December 19, 2013, to the U.S. Bank Indenture and Form of 6.500% Prospect Capital InterNote® due 2038(79) |
4.217 | Two Hundred Twenty-Second Supplemental Indenture dated as of December 27, 2013, to the U.S. Bank Indenture and Form of 4.000% Prospect Capital InterNote® due 2017(80) |
4.218 | Two Hundred Twenty-Third Supplemental Indenture dated as of December 27, 2013, to the U.S. Bank Indenture and Form of 5.000% Prospect Capital InterNote® due 2018(80) |
4.219 | Two Hundred Twenty-Fifth Supplemental Indenture dated as of December 27, 2013, to the U.S. Bank Indenture and Form of 6.000% Prospect Capital InterNote® due 2025(80) |
4.220 | Two Hundred Twenty-Sixth Supplemental Indenture dated as of December 27, 2013, to the U.S. Bank Indenture and Form of 6.500% Prospect Capital InterNote® due 2038(80) |
4.221 | Two Hundred Twenty-Seventh Supplemental Indenture dated as of January 3, 2014, to the U.S. Bank Indenture and Form of 4.000% Prospect Capital InterNote® due 2018(81) |
4.222 | Two Hundred Twenty-Eighth Supplemental Indenture dated as of January 3, 2014, to the U.S. Bank Indenture and Form of 5.000% Prospect Capital InterNote® due 2019(81) |
4.223 | Two Hundred Twenty-Ninth Supplemental Indenture dated as of January 3, 2014, to the U.S. Bank Indenture and Form of 5.500% Prospect Capital InterNote® due 2021(81) |
4.224 | Two Hundred Thirtieth Supplemental Indenture dated as of January 3, 2014, to the U.S. Bank Indenture and Form of 6.000% Prospect Capital InterNote® due 2026(81) |
4.225 | Two Hundred Thirty-First Supplemental Indenture dated as of January 3, 2014, to the U.S. Bank Indenture and Form of 6.500% Prospect Capital InterNote® due 2039(81) |
4.226 | Two Hundred Thirty-Second Supplemental Indenture dated as of January 9, 2014, to the U.S. Bank Indenture and Form of 4.000% Prospect Capital InterNote® due 2018(82) |
4.227 | Two Hundred Thirty-Third Supplemental Indenture dated as of January 9, 2014, to the U.S. Bank Indenture and Form of 5.000% Prospect Capital InterNote® due 2019(82) |
4.228 | Two Hundred Thirty-Fourth Supplemental Indenture dated as of January 9, 2014, to the U.S. Bank Indenture and Form of 5.500% Prospect Capital InterNote® due 2021(82) |
231
Exhibit No. | |
4.229 | Two Hundred Thirty-Fifth Supplemental Indenture dated as of January 9, 2014, to the U.S. Bank Indenture and Form of 6.000% Prospect Capital InterNote® due 2026(82) |
4.230 | Two Hundred Thirty-Sixth Supplemental Indenture dated as of January 9, 2014, to the U.S. Bank Indenture and Form of 6.500% Prospect Capital InterNote® due 2039(82) |
4.231 | Two Hundred Thirty-Seventh Supplemental Indenture dated as of January 16, 2014, to the U.S. Bank Indenture and Form of 4.000% Prospect Capital InterNote® due 2018(83) |
4.232 | Two Hundred Thirty-Eighth Supplemental Indenture dated as of January 16, 2014, to the U.S. Bank Indenture and Form of 5.000% Prospect Capital InterNote® due 2019(83) |
4.233 | Two Hundred Thirty-Ninth Supplemental Indenture dated as of January 16, 2014, to the U.S. Bank Indenture and Form of 5.500% Prospect Capital InterNote® due 2021(83) |
4.234 | Two Hundred Fortieth Supplemental Indenture dated as of January 16, 2014, to the U.S. Bank Indenture and Form of 6.000% Prospect Capital InterNote® due 2026(83) |
4.235 | Two Hundred Forty-First Supplemental Indenture dated as of January 16, 2014, to the U.S. Bank Indenture and Form of 6.500% Prospect Capital InterNote® due 2039(83) |
4.236 | Two Hundred Forty-Second Supplemental Indenture dated as of January 24, 2014, to the U.S. Bank Indenture and Form of 4.000% Prospect Capital InterNote® due 2018(84) |
4.237 | Two Hundred Forty-Third Supplemental Indenture dated as of January 24, 2014, to the U.S. Bank Indenture and Form of 5.000% Prospect Capital InterNote® due 2019(84) |
4.238 | Two Hundred Forty-Fourth Supplemental Indenture dated as of January 24, 2014, to the U.S. Bank Indenture and Form of 5.500% Prospect Capital InterNote® due 2021(84) |
4.239 | Two Hundred Forty-Fifth Supplemental Indenture dated as of January 24, 2014, to the U.S. Bank Indenture and Form of 6.000% Prospect Capital InterNote® due 2026(84) |
4.240 | Two Hundred Forty-Sixth Supplemental Indenture dated as of January 24, 2014, to the U.S. Bank Indenture and Form of 6.500% Prospect Capital InterNote® due 2039(84) |
4.241 | Two Hundred Forty-Seventh Supplemental Indenture dated as of January 30, 2014, to the U.S. Bank Indenture and Form of 4.000% Prospect Capital InterNote® due 2018(85) |
4.242 | Two Hundred Forty-Eighth Supplemental Indenture dated as of January 30, 2014, to the U.S. Bank Indenture and Form of 5.000% Prospect Capital InterNote® due 2019(85) |
4.243 | Two Hundred Forty-Ninth Supplemental Indenture dated as of January 30, 2014, to the U.S. Bank Indenture and Form of 5.500% Prospect Capital InterNote® due 2021(85) |
4.244 | Two Hundred Fiftieth Supplemental Indenture dated as of January 30, 2014, to the U.S. Bank Indenture and Form of 6.000% Prospect Capital InterNote® due 2026(85) |
4.245 | Two Hundred Fifty-First Supplemental Indenture dated as of January 30, 2014, to the U.S. Bank Indenture and Form of 6.500% Prospect Capital InterNote® due 2039(85) |
4.246 | Two Hundred Fifty-Second Supplemental Indenture dated as of February 6, 2014, to the U.S. Bank Indenture and Form of 4.000% Prospect Capital InterNote® due 2018(86) |
4.247 | Two Hundred Fifty-Third Supplemental Indenture dated as of February 6, 2014, to the U.S. Bank Indenture and Form of 5.000% Prospect Capital InterNote® due 2019(86) |
4.248 | Two Hundred Fifty-Fourth Supplemental Indenture dated as of February 6, 2014, to the U.S. Bank Indenture and Form of 5.500% Prospect Capital InterNote® due 2021(86) |
4.249 | Two Hundred Fifty-Fifth Supplemental Indenture dated as of February 6, 2014, to the U.S. Bank Indenture and Form of 6.000% Prospect Capital InterNote® due 2026(86) |
4.250 | Two Hundred Fifty-Sixth Supplemental Indenture dated as of February 6, 2014, to the U.S. Bank Indenture and Form of 6.500% Prospect Capital InterNote® due 2039(86) |
4.251 | Two Hundred Fifty-Seventh Supplemental Indenture dated as of February 13, 2014, to the U.S. Bank Indenture and Form of 4.000% Prospect Capital InterNote® due 2018(87) |
4.252 | Two Hundred Fifty-Eighth Supplemental Indenture dated as of February 13, 2014, to the U.S. Bank Indenture and Form of 5.000% Prospect Capital InterNote® due 2019(87) |
4.253 | Two Hundred Fifty-Ninth Supplemental Indenture dated as of February 13, 2014, to the U.S. Bank Indenture and Form of 5.500% Prospect Capital InterNote® due 2021(87) |
4.254 | Two Hundred Sixtieth Supplemental Indenture dated as of February 13, 2014, to the U.S. Bank Indenture and Form of 6.000% Prospect Capital InterNote® due 2026(87) |
232
Exhibit No. | |
4.255 | Two Hundred Sixty-First Supplemental Indenture dated as of February 13, 2014, to the U.S. Bank Indenture and Form of 6.500% Prospect Capital InterNote® due 2039(87) |
4.256 | Two Hundred Sixty-Seventh Supplemental Indenture dated as of February 19, 2014, to the U.S. Bank Indenture and Form of 4.75% Prospect Capital InterNote® due 2019(88) |
4.257 | Two Hundred Sixty-Second Supplemental Indenture dated as of February 21, 2014, to the U.S. Bank Indenture and Form of 4.000% Prospect Capital InterNote® due 2018(89) |
4.258 | Two Hundred Sixty-Third Supplemental Indenture dated as of February 21, 2014, to the U.S. Bank Indenture and Form of 5.000% Prospect Capital InterNote® due 2019(89) |
4.259 | Two Hundred Sixty-Fourth Supplemental Indenture dated as of February 21, 2014, to the U.S. Bank Indenture and Form of 5.500% Prospect Capital InterNote® due 2021(89) |
4.260 | Two Hundred Sixty-Fifth Supplemental Indenture dated as of February 21, 2014, to the U.S. Bank Indenture and Form of 6.000% Prospect Capital InterNote® due 2026(89) |
4.261 | Two Hundred Sixty-Sixth Supplemental Indenture dated as of February 21, 2014, to the U.S. Bank Indenture and Form of 6.500% Prospect Capital InterNote® due 2039(89) |
4.262 | Two Hundred Sixty-Eighth Supplemental Indenture dated as of February 27, 2014, to the U.S. Bank Indenture and Form of 3.750% Prospect Capital InterNote® due 2018(90) |
4.263 | Two Hundred Sixty-Ninth Supplemental Indenture dated as of February 27, 2014, to the U.S. Bank Indenture and Form of 4.750% Prospect Capital InterNote® due 2019(90) |
4.264 | Two Hundred Seventieth Supplemental Indenture dated as of February 27, 2014, to the U.S. Bank Indenture and Form of 5.250% Prospect Capital InterNote® due 2021(90) |
4.265 | Two Hundred Seventy-First Supplemental Indenture dated as of February 27, 2014, to the U.S. Bank Indenture and Form of 5.750% Prospect Capital InterNote® due 2026(90) |
4.266 | Two Hundred Seventy-Second Supplemental Indenture dated as of February 27, 2014, to the U.S. Bank Indenture and Form of 6.250% Prospect Capital InterNote® due 2039(90) |
4.267 | Two Hundred Seventy-Third Supplemental Indenture dated as March 6, 2014, to the U.S. Bank Indenture and Form of 3.750% Prospect Capital InterNote® due 2018(91) |
4.268 | Two Hundred Seventy-Fourth Supplemental Indenture dated as of March 6, 2014, to the U.S. Bank Indenture and Form of 4.750% Prospect Capital InterNote® due 2019(91) |
4.269 | Two Hundred Seventy-Fifth Supplemental Indenture dated as of March 6, 2014, to the U.S. Bank Indenture and Form of 5.250% Prospect Capital InterNote® due 2021(91) |
4.270 | Two Hundred Seventy-Sixth Supplemental Indenture dated as of March 6, 2014, to the U.S. Bank Indenture and Form of 5.750% Prospect Capital InterNote® due 2026(91) |
4.271 | Two Hundred Seventy-Seventh Supplemental Indenture dated as of March 6, 2014, to the U.S. Bank Indenture and Form of 6.250% Prospect Capital InterNote® due 2039(91) |
4.272 | Supplement No. 1 to the Two Hundred Sixty-Seventh Supplemental Indenture dated as of March 11, 2014, to the U.S. Bank Indenture and Form of 4.75% Prospect Capital InterNote® due 2019(92) |
4.273 | Two Hundred Seventy-Eighth Supplemental Indenture dated as March 13, 2014, to the U.S. Bank Indenture and Form of 3.750% Prospect Capital InterNote® due 2018(93) |
4.274 | Two Hundred Seventy-Ninth Supplemental Indenture dated as of March 13, 2014, to the U.S. Bank Indenture and Form of 4.750% Prospect Capital InterNote® due 2019(93) |
4.275 | Two Hundred Eightieth Supplemental Indenture dated as of March 13, 2014, to the U.S. Bank Indenture and Form of 5.250% Prospect Capital InterNote® due 2021(93) |
4.276 | Two Hundred Eighty-First Supplemental Indenture dated as of March 13, 2014, to the U.S. Bank Indenture and Form of 5.750% Prospect Capital InterNote® due 2026(93) |
4.277 | Two Hundred Eighty-Second Supplemental Indenture dated as of March 13, 2014, to the U.S. Bank Indenture and Form of 6.250% Prospect Capital InterNote® due 2039(93) |
4.278 | Two Hundred Eighty-Fourth Supplemental Indenture dated as March 20, 2014, to the U.S. Bank Indenture and Form of 3.750% Prospect Capital InterNote® due 2018(94) |
4.279 | Two Hundred Eighty-Fifth Supplemental Indenture dated as of March 20, 2014, to the U.S. Bank Indenture and Form of 4.750% Prospect Capital InterNote® due 2019(94) |
4.280 | Two Hundred Eighty-Sixth Supplemental Indenture dated as of March 20, 2014, to the U.S. Bank Indenture and Form of 5.250% Prospect Capital InterNote® due 2021(94) |
233
Exhibit No. | |
4.281 | Two Hundred Eighty-Seventh Supplemental Indenture dated as of March 20, 2014, to the U.S. Bank Indenture and Form of 5.750% Prospect Capital InterNote® due 2026(94) |
4.282 | Two Hundred Eighty-Eighth Supplemental Indenture dated as of March 20, 2014, to the U.S. Bank Indenture and Form of 6.250% Prospect Capital InterNote® due 2039(94) |
4.283 | Two Hundred Eighty-Ninth Supplemental Indenture dated as March 27, 2014, to the U.S. Bank Indenture and Form of 3.750% Prospect Capital InterNote® due 2018(95) |
4.284 | Two Hundred Ninetieth Supplemental Indenture dated as of March 20, 2014, to the U.S. Bank Indenture and Form of 4.750% Prospect Capital InterNote® due 2019(95) |
4.285 | Two Hundred Ninety-First Supplemental Indenture dated as of March 27, 2014, to the U.S. Bank Indenture and Form of 5.250% Prospect Capital InterNote® due 2021(95) |
4.286 | Two Hundred Ninety-Second Supplemental Indenture dated as of March 27, 2014, to the U.S. Bank Indenture and Form of 5.750% Prospect Capital InterNote® due 2026(95) |
4.287 | Two Hundred Ninety-Third Supplemental Indenture dated as of March 27, 2014, to the U.S. Bank Indenture and Form of 6.250% Prospect Capital InterNote® due 2039(95) |
4.288 | Two Hundred Ninety-Fourth Supplemental Indenture dated as of April 3, 2014, to the U.S. Bank Indenture and Form of 3.750% Prospect Capital InterNote® due 2018(96) |
4.289 | Two Hundred Ninety-Fifth Supplemental Indenture dated as of April 3, 2014, to the U.S. Bank Indenture and Form of 4.500% Prospect Capital InterNote® due 2019(96) |
4.290 | Two Hundred Ninety-Sixth Supplemental Indenture dated as of April 3, 2014, to the U.S. Bank Indenture and Form of 5.250% Prospect Capital InterNote® due 2021(96) |
4.291 | Two Hundred Ninety-Seventh Supplemental Indenture dated as of April 3, 2014, to the U.S. Bank Indenture and Form of 5.750% Prospect Capital InterNote® due 2024(96) |
4.292 | Two Hundred Ninety-Eighth Supplemental Indenture dated as of April 3, 2014, to the U.S. Bank Indenture and Form of 6.250% Prospect Capital InterNote® due 2039(96) |
4.293 | Supplemental Indenture dated as of April 7, 2014, to the U.S. Bank Indenture and Form of 5.000% Senior Notes due 2019(97) |
4.294 | Two Hundred Ninety-Ninth Supplemental Indenture dated as of April 10, 2014, to the U.S. Bank Indenture and Form of 3.750% Prospect Capital InterNote® due 2018(98) |
4.295 | Three Hundredth Supplemental Indenture dated as of April 10, 2014, to the U.S. Bank Indenture and Form of 4.250% Prospect Capital InterNote® due 2019(98) |
4.296 | Three Hundred First Supplemental Indenture dated as of April 10, 2014, to the U.S. Bank Indenture and Form of 5.250% Prospect Capital InterNote® due 2021(98) |
4.297 | Three Hundred Second Supplemental Indenture dated as of April 10, 2014, to the U.S. Bank Indenture and Form of 5.750% Prospect Capital InterNote® due 2024(98) |
4.298 | Three Hundred Third Supplemental Indenture dated as of April 10, 2014, to the U.S. Bank Indenture and Form of 6.250% Prospect Capital InterNote® due 2039(98) |
4.299 | Indenture dated as of April 11, 2014, by and between Prospect Capital Corporation and American Stock Transfer & Trust Company, as Trustee and Form of Global Note of 4.75% Senior Convertible Notes Due 2020(99) |
4.300 | Three Hundred Fourth Supplemental Indenture dated as of April 17, 2014, to the U.S. Bank Indenture and Form of 3.750% Prospect Capital InterNote® due 2018(100) |
4.301 | Three Hundred Fifth Supplemental Indenture dated as of April 17, 2014, to the U.S. Bank Indenture and Form of 4.250% Prospect Capital InterNote® due 2019(100) |
4.302 | Three Hundred Sixth Supplemental Indenture dated as of April 17, 2014, to the U.S. Bank Indenture and Form of 5.250% Prospect Capital InterNote® due 2021(100) |
4.303 | Three Hundred Seventh Supplemental Indenture dated as of April 17, 2014, to the U.S. Bank Indenture and Form of 5.750% Prospect Capital InterNote® due 2024(100) |
4.304 | Three Hundred Eighth Supplemental Indenture dated as of April 17, 2014, to the U.S. Bank Indenture and Form of 6.250% Prospect Capital InterNote® due 2039(100) |
4.305 | Three Hundred Ninth Supplemental Indenture dated as of April 24, 2014, to the U.S. Bank Indenture and Form of 3.750% Prospect Capital InterNote® due 2018(101) |
4.306 | Three Hundred Tenth Supplemental Indenture dated as of April 24, 2014, to the U.S. Bank Indenture and Form of 4.500% Prospect Capital InterNote® due 2019(101) |
234
Exhibit No. | |
4.307 | Three Hundred Eleventh Supplemental Indenture dated as of April 24, 2014, to the U.S. Bank Indenture and Form of 5.250% Prospect Capital InterNote® due 2021(101) |
4.308 | Three Hundred Twelfth Supplemental Indenture dated as of April 24, 2014, to the U.S. Bank Indenture and Form of 5.750% Prospect Capital InterNote® due 2024(101) |
4.309 | Three Hundred Thirteenth Supplemental Indenture dated as of April 24, 2014, to the U.S. Bank Indenture and Form of 6.250% Prospect Capital InterNote® due 2039(101) |
4.310 | Three Hundred Fourteenth Supplemental Indenture dated as of May 1, 2014, to the U.S. Bank Indenture and Form of 3.750% Prospect Capital InterNote® due 2018(102) |
4.311 | Three Hundred Fifteenth Supplemental Indenture dated as of May 1, 2014, to the U.S. Bank Indenture and Form of 4.500% Prospect Capital InterNote® due 2019(102) |
4.312 | Three Hundred Sixteenth Supplemental Indenture dated as of May 1, 2014, to the U.S. Bank Indenture and Form of 5.250% Prospect Capital InterNote® due 2021(102) |
4.313 | Three Hundred Seventeenth Supplemental Indenture dated as of May 1, 2014, to the U.S. Bank Indenture and Form of 5.750% Prospect Capital InterNote® due 2024(102) |
4.314 | Three Hundred Eighteenth Supplemental Indenture dated as of May 1, 2014, to the U.S. Bank Indenture and Form of 6.250% Prospect Capital InterNote® due 2039(102) |
4.315 | Three Hundred Nineteenth Supplemental Indenture dated as of May 8, 2014, to the U.S. Bank Indenture and Form of 3.750% Prospect Capital InterNote® due 2018(103) |
4.316 | Three Hundred Twentieth Supplemental Indenture dated as of May 8, 2014, to the U.S. Bank Indenture and Form of 4.500% Prospect Capital InterNote® due 2019(103) |
4.317 | Three Hundred Twenty-First Supplemental Indenture dated as of May 8, 2014, to the U.S. Bank Indenture and Form of 5.250% Prospect Capital InterNote® due 2021(103) |
4.318 | Three Hundred Twenty-Second Supplemental Indenture dated as of May 8, 2014, to the U.S. Bank Indenture and Form of 5.750% Prospect Capital InterNote® due 2024(103) |
4.319 | Three Hundred Twenty-Third Supplemental Indenture dated as of May 8, 2014, to the U.S. Bank Indenture and Form of 6.250% Prospect Capital InterNote® due 2039(103) |
4.320 | Three Hundred Twenty-Fourth Supplemental Indenture dated as of November 17, 2014, to the U.S. Bank Indenture and Form of 4.250% Prospect Capital InterNote® due 2020(110) |
4.321 | Three Hundred Twenty-Fifth Supplemental Indenture dated as of November 28, 2014, to the U.S. Bank Indenture and Form of 4.250% Prospect Capital InterNote® due 2020(111) |
4.322 | Three Hundred Twenty-Sixth Supplemental Indenture dated as of December 4, 2014, to the U.S. Bank Indenture and Form of 4.250% Prospect Capital InterNote® due 2020(112) |
4.323 | Three Hundred Twenty-Seventh Supplemental Indenture dated as of December 11, 2014, to the U.S. Bank Indenture and Form of 4.250% Prospect Capital InterNote® due 2020(113) |
4.324 | Three Hundred Twenty-Eighth Supplemental Indenture dated as of December 18, 2014, to the U.S. Bank Indenture and Form of 4.250% Prospect Capital InterNote® due 2020(114) |
4.325 | Three Hundred Twenty-Ninth Supplemental Indenture dated as of December 29, 2014, to the U.S. Bank Indenture and Form of 4.250% Prospect Capital InterNote® due 2020(115) |
4.326 | Three Hundred Thirtieth Supplemental Indenture dated as of January 2, 2015, to the U.S. Bank Indenture and Form of 4.250% Prospect Capital InterNote® due 2020(116) |
4.327 | Three Hundred Thirty-First Supplemental Indenture dated as of January 8, 2015, to the U.S. Bank Indenture and Form of 4.250% Prospect Capital InterNote® due 2020(117) |
4.328 | Three Hundred Thirty-Second Supplemental Indenture dated as of January 15, 2015, to the U.S. Bank Indenture and Form of 4.500% Prospect Capital InterNote® due 2020(118) |
4.329 | Three Hundred Thirty-Third Supplemental Indenture dated as of January 23, 2015, to the U.S. Bank Indenture and Form of 4.750% Prospect Capital InterNote® due 2020(119) |
4.330 | Three Hundred Thirty-Fourth Supplemental Indenture dated as of January 29, 2015, to the U.S. Bank Indenture and Form of 4.750% Prospect Capital InterNote® due 2020(120) |
4.331 | Three Hundred Thirty-Fifth Supplemental Indenture dated as of February 5, 2015, to the U.S. Bank Indenture and Form of 4.750% Prospect Capital InterNote® due 2020(121) |
4.332 | Three Hundred Thirty-Sixth Supplemental Indenture dated as of February 20, 2015, to the U.S. Bank Indenture and Form of 4.750% Prospect Capital InterNote® due 2020(122) |
235
Exhibit No. | |
4.333 | Three Hundred Thirty-Seventh Supplemental Indenture dated as of February 26, 2015, to the U.S. Bank Indenture and Form of 4.750% Prospect Capital InterNote® due 2020(123) |
4.334 | Three Hundred Thirty-Eighth Supplemental Indenture dated as of March 5, 2015, to the U.S. Bank Indenture and Form of 4.750% Prospect Capital InterNote® due 2020(124) |
4.335 | Three Hundred Thirty-Ninth Supplemental Indenture dated as of March 12, 2015, to the U.S. Bank Indenture and Form of 4.750% Prospect Capital InterNote® due 2020(125) |
4.336 | Three Hundred Fortieth Supplemental Indenture dated as of March 19, 2015, to the U.S. Bank Indenture and Form of 4.750% Prospect Capital InterNote® due 2020(126) |
4.337 | Three Hundred Forty-First Supplemental Indenture dated as of March 26, 2015, to the U.S. Bank Indenture and Form of 4.750% Prospect Capital InterNote® due 2020(127) |
4.338 | Three Hundred Forty-Second Supplemental Indenture dated as of April 2, 2015, to the U.S. Bank Indenture and Form of 4.750% Prospect Capital InterNote® due 2020(128) |
4.339 | Three Hundred Forty-Third Supplemental Indenture dated as of April 9, 2015, to the U.S. Bank Indenture and Form of 4.750% Prospect Capital InterNote® due 2020(129) |
4.340 | Three Hundred Forty-Fourth Supplemental Indenture dated as of April 16, 2015, to the U.S. Bank Indenture and Form of 4.750% Prospect Capital InterNote® due 2020(130) |
4.341 | Three Hundred Forty-Fifth Supplemental Indenture dated as of April 16, 2015, to the U.S. Bank Indenture and Form of 3.375% to 6.375% Prospect Capital InterNote® due 2021(130) |
4.342 | Three Hundred Forty-Sixth Supplemental Indenture dated as of April 23, 2015, to the U.S. Bank Indenture and Form of 4.750% Prospect Capital InterNote® due 2020(131) |
4.343 | Three Hundred Forty-Seventh Supplemental Indenture dated as of April 23, 2015, to the U.S. Bank Indenture and Form of 3.375% to 6.375% Prospect Capital InterNote® due 2021(131) |
4.344 | Three Hundred Forty-Eighth Supplemental Indenture dated as of April 30, 2015, to the U.S. Bank Indenture and Form of 4.750% Prospect Capital InterNote® due 2020(132) |
4.345 | Three Hundred Forty-Ninth Supplemental Indenture dated as of April 30, 2015, to the U.S. Bank Indenture and Form of 3.375% to 6.375% Prospect Capital InterNote® due 2021(132) |
4.346 | Three Hundred Fiftieth Supplemental Indenture dated as of May 7, 2015, to the U.S. Bank Indenture and Form of 4.750% Prospect Capital InterNote® due 2020(133) |
4.347 | Three Hundred Fifty-First Supplemental Indenture dated as of May 7, 2015, to the U.S. Bank Indenture and Form of 3.375% to 6.375% Prospect Capital InterNote® due 2021(133) |
4.348 | Three Hundred Fifty-Second Supplemental Indenture dated as of May 21, 2015, to the U.S. Bank Indenture and Form of 4.750% Prospect Capital InterNote® due 2020(134) |
4.349 | Three Hundred Fifty-Third Supplemental Indenture dated as of May 29, 2015, to the U.S. Bank Indenture and Form of 4.625% Prospect Capital InterNote® due 2020(135) |
4.350 | Three Hundred Fifty-Fourth Supplemental Indenture dated as of May 29, 2015, to the U.S. Bank Indenture and Form of 5.100% Prospect Capital InterNote® due 2022(135) |
4.351 | Three Hundred Fifty-Fifth Supplemental Indenture dated as of June 4, 2015, to the U.S. Bank Indenture and Form of 4.625% Prospect Capital InterNote® due 2020(136) |
4.352 | Three Hundred Fifty-Sixth Supplemental Indenture dated as of June 4, 2015, to the U.S. Bank Indenture and Form of 5.100% Prospect Capital InterNote® due 2022(136) |
4.353 | Three Hundred Fifty-Seventh Supplemental Indenture dated as of June 11, 2015, to the U.S. Bank Indenture and Form of 4.625% Prospect Capital InterNote® due 2020(137) |
4.354 | Three Hundred Fifty-Eighth Supplemental Indenture dated as of June 11, 2015, to the U.S. Bank Indenture and Form of 5.100% Prospect Capital InterNote® due 2022(137) |
4.355 | Three Hundred Fifty-Ninth Supplemental Indenture dated as of June 18, 2015, to the U.S. Bank Indenture and Form of 4.625% Prospect Capital InterNote® due 2020(138) |
4.356 | Three Hundred Sixtieth Supplemental Indenture dated as of June 18, 2015, to the U.S. Bank Indenture and Form of 5.100% Prospect Capital InterNote® due 2021(138) |
4.357 | Three Hundred Sixty-First Supplemental Indenture dated as of June 25, 2015, to the U.S. Bank Indenture and Form of 4.625% Prospect Capital InterNote® due 2020(139) |
4.358 | Three Hundred Sixty-Second Supplemental Indenture dated as of June 25, 2015, to the U.S. Bank Indenture and Form of 5.100% Prospect Capital InterNote® due 2021(139) |
236
Exhibit No. | |
4.359 | Three Hundred Sixty-Third Supplemental Indenture dated as of July 2, 2015, to the U.S. Bank Indenture and Form of 4.625% Prospect Capital InterNote® due 2020(140) |
4.360 | Three Hundred Sixty-Fourth Supplemental Indenture dated as of July 2, 2015, to the U.S. Bank Indenture and Form of 5.100% Prospect Capital InterNote® due 2021(140) |
4.361 | Three Hundred Sixty-Fifth Supplemental Indenture dated as of July 9, 2015, to the U.S. Bank Indenture and Form of 4.750% Prospect Capital InterNote® due 2020(141) |
4.362 | Three Hundred Sixty-Sixth Supplemental Indenture dated as of July 9, 2015, to the U.S. Bank Indenture and Form of 5.250% Prospect Capital InterNote® due 2022(141) |
4.363 | Three Hundred Sixty-Seventh Supplemental Indenture dated as of July 16, 2015, to the U.S. Bank Indenture and Form of 4.750% Prospect Capital InterNote® due 2020(142) |
4.364 | Three Hundred Sixty-Eighth Supplemental Indenture dated as of July 16, 2015, to the U.S. Bank Indenture and Form of 5.250% Prospect Capital InterNote® due 2022(142) |
4.365 | Three Hundred Sixty-Ninth Supplemental Indenture dated as of July 23, 2015, to the U.S. Bank Indenture and Form of 4.750% Prospect Capital InterNote® due 2020(143) |
4.366 | Three Hundred Seventieth Supplemental Indenture dated as of July 23, 2015, to the U.S. Bank Indenture and Form of 5.250% Prospect Capital InterNote® due 2022(143) |
4.367 | Three Hundred Seventy-First Supplemental Indenture dated as of July 30, 2015, to the U.S. Bank Indenture and Form of 4.750% Prospect Capital InterNote® due 2020(144) |
4.368 | Three Hundred Seventy-Second Supplemental Indenture dated as of July 30, 2015, to the U.S. Bank Indenture and Form of 5.250% Prospect Capital InterNote® due 2022(144) |
4.369 | Three Hundred Seventy-Third Supplemental Indenture dated as of August 6, 2015, to the U.S. Bank Indenture and Form of 4.750% Prospect Capital InterNote® due 2020(145) |
4.370 | Three Hundred Seventy-Fourth Supplemental Indenture dated as of August 6, 2015, to the U.S. Bank Indenture and Form of 5.250% Prospect Capital InterNote® due 2022(145) |
4.371 | Three Hundred Seventy-Fifth Supplemental Indenture dated as of August 13, 2015, to the U.S. Bank Indenture and Form of 4.750% Prospect Capital InterNote® due 2020(146) |
4.372 | Three Hundred Seventy-Sixth Supplemental Indenture dated as of August 13, 2015, to the U.S. Bank Indenture and Form of 5.250% Prospect Capital InterNote® due 2022(146) |
4.373 | Three Hundred Seventy-Fifth Supplemental Indenture dated as of August 20, 2015, to the U.S. Bank Indenture and Form of 4.750% Prospect Capital InterNote® due 2020(147) |
4.374 | Three Hundred Seventy-Sixth Supplemental Indenture dated as of August 20, 2015, to the U.S. Bank Indenture and Form of 5.250% Prospect Capital InterNote® due 2022(147) |
10.1 | Investment Advisory Agreement between Registrant and Prospect Capital Management L.P.(2) |
10.2 | Administration Agreement between Registrant and Propsect Administration LLC(2) |
10.3 | Dividend Reinvestment Plan(2) |
10.4 | Trademark License Agreement between the Registrant and Prospect Capital Investment Management, LLC(2) |
10.5 | Transfer Agency and Registrar Services Agreement(4) |
10.6 | Fifth Amended and Restated Loan and Servicing Agreement, dated August 29, 2014, among Prospect Capital Funding LLC, Prospect Capital Corporation, the lenders from time to time party thereto, the managing agents from time to time party thereto, U.S. Bank National Association as Calculation Agent, Paying Agent and Documentation Agent, KeyBank National Association as Facility Agent, Key Equipment Finance Inc. and Royal Bank of Canada as Syndication Agents, and KeyBank National Association as Structuring Agent, Sole Lead Arranger and Sole Bookrunner(13) |
10.7 | Fourth Amended and Restated Selling Agent Agreement, dated November 7, 2014, by and among, the Registrant, Prospect Capital Management L.P., Prospect Administration LLC, Incapital LLC and the Agents named therein and added from time to time(109) |
10.8 | Amended and Restated Custody Agreement, dated as of September 23, 2014, by and between the Registrant and U.S. Bank National Association(106) |
10.9 | Custody Agreement, dated as of April 24, 2013, by and between the Registrant and Israeli Discount Bank of New York Ltd.(5) |
10.10 | Custody Agreement, dated as of October 28, 2013, by and between the Registrant and Fifth Third Bank(82) |
10.11 | Custody Agreement, dated as of May 9, 2014, by and between the Registrant and Customers Bank(104) |
10.12 | Custody Agreement, dated as of May 9, 2014, by and between the Registrant and Peapack-Gladstone Bank(105) |
237
Exhibit No. | |
10.13 | Custody Agreement, dated as of October 10, 2014, by and between Prospect Yield Corporation, LLC and U.S. Bank National Association(106) |
11 | Computation of Per Share Earnings (included in the notes to the financial statements contained in this report) |
12 | Computation of Ratios (included in the notes to the financial statements contained in this report) |
14 | Code of Ethics(150) |
21 | Subsidiaries of the Registrant (included in the notes to the consolidated financial statements contained in this annual report) |
22.1 | Proxy Statement(148) |
22.2 | Published report regarding matters submitted to vote of security holders(149) |
23.1 | Consent of McGladrey LLP, Independent Accountants to First Tower Finance Company LLC* |
31.1 | Certification of Chief Executive Officer pursuant to Rule 13a-14(a) of the Securities Exchange Act of 1934, as amended* |
31.2 | Certification of Chief Financial Officer pursuant to Rule 13a-14(a) of the Securities Exchange Act of 1934, as amended* |
32.1 | Certification of Chief Executive Officer pursuant to Section 906 of The Sarbanes-Oxley Act of 2002 (18 U.S.C. 1350)* |
32.2 | Certification of Chief Financial Officer pursuant to Section 906 of The Sarbanes-Oxley Act of 2002 (18 U.S.C. 1350)* |
99.1 | Audited Consolidated Financial Statements of First Tower Finance Company LLC and its subsidiaries as of and for the years ended December 31, 2014 and 2013* |
99.2 | Financial Statements of Harbortouch Payments, LLC as of December 31, 2014, and for the period from March 27, 2014 (date of inception) through December 31, 2014* |
________________________
* | Filed herewith. |
(1) | Incorporated by reference to Exhibit 3.1 of the Registrant’s Form 8-K, filed on May 9, 2014. |
(2) | Incorporated by reference from the Registrant’s Pre-effective Amendment No. 2 to the Registration Statement on Form N-2, filed on July 6, 2004. |
(3) | Incorporated by reference to Exhibit 3.1 of the Registrant’s Form 8-K, filed on August 26, 2011. |
(4) | Incorporated by reference from the Registrant’s Pre-effective Amendment No. 3 to the Registration Statement on Form N-2, filed on July 23, 2004. |
(5) | Incorporated by reference to Exhibit 10.258 of the Registrant’s Form 10-K filed on August 21, 2013. |
(6) | Incorporated by reference to Exhibit 4.2 of the Registrant’s Form 8-K, filed on February 18, 2011. |
(7) | Incorporated by reference to Exhibit 4.1 of the Registrant’s Form 8-K, filed on December 21, 2010. |
(8) | Incorporated by reference to Exhibit 4.1 of the Registrant’s Form 8-K, filed on February 18, 2011. |
(9) | Incorporated by reference from the Registrant’s Registration Statement on Form N-2, filed on September 1, 2011. |
(10) | Incorporated by reference from the Registrant’s Post-Effective Amendment No. 1 to the Registration Statement on Form N-2, filed on March 1, 2012. |
(11) | Incorporated by reference from the Registrant’s Post-Effective Amendment No. 2 to the Registration Statement on Form N-2, filed on March 8, 2012. |
(12) | Incorporated by reference from the Registrant’s Post-Effective Amendment No. 3 to the Registration Statement on Form N-2, filed on March 14, 2012. |
(13) | Incorporated by reference to Exhibit 10.1 of the Registrant's Form 8-K, filed on September 2, 2014. |
(14) | Incorporated by reference from the Registrant’s Post-Effective Amendment No. 5 to the Registration Statement on Form N-2, filed on April 5, 2012. |
(15) | Incorporated by reference from the Registrant’s Post-Effective Amendment No. 6 to the Registration Statement on Form N-2, filed on April 12, 2012. |
(16) | Incorporated by reference to Exhibit 4.1 of the Registrant’s Form 8-K, filed on April 16, 2012. |
(17) | Incorporated by reference to Exhibit 4.2 of the Registrant’s Form 8-K, filed on April 16, 2012. |
(18) | Incorporated by reference from the Registrant’s Post-Effective Amendment No. 8 to the Registration Statement on Form N-2, filed on April 26, 2012. |
(19) | Incorporated by reference to Exhibit 4.1 of the Registrant’s Form 8-K, filed on August 14, 2012. |
(20) | Incorporated by reference to Exhibit 4.2 of the Registrant’s Form 8-K, filed on August 14, 2012. |
(21) | Incorporated by reference from the Registrant’s Post-Effective Amendment No. 26 to the Registration Statement on Form N-2, filed on September 27, 2012. |
238
(22) | Incorporated by reference from the Registrant’s Post-Effective Amendment No. 27 to the Registration Statement on Form N-2, filed on October 4, 2012. |
(23) | Incorporated by reference from the Registrant’s Post-Effective Amendment No. 2 to the Registration Statement on Form N-2, filed on November 23, 2012. |
(24) | Incorporated by reference from the Registrant’s Post-Effective Amendment No. 3 to the Registration Statement on Form N-2, filed on November 29, 2012. |
(25) | Incorporated by reference from the Registrant’s Post-Effective Amendment No. 4 to the Registration Statement on Form N-2, filed on December 6, 2012. |
(26) | Incorporated by reference from the Registrant’s Post-Effective Amendment No. 5 to the Registration Statement on Form N-2, filed on December 13, 2012. |
(27) | Incorporated by reference from the Registrant’s Post-Effective Amendment No. 6 to the Registration Statement on Form N-2, filed on December 20, 2012. |
(28) | Incorporated by reference to Exhibit 4.1 of the Registrant’s Form 8-K, filed on December 21, 2012. |
(29) | Incorporated by reference from the Registrant’s Post-Effective Amendment No. 8 to the Registration Statement on Form N-2, filed on December 28, 2012. |
(30) | Incorporated by reference from the Registrant’s Post-Effective Amendment No. 9 to the Registration Statement on Form N-2, filed on January 4, 2013. |
(31) | Incorporated by reference from the Registrant’s Post-Effective Amendment No. 10 to the Registration Statement on Form N-2, filed on January 10, 2013. |
(32) | Incorporated by reference from the Registrant’s Post-Effective Amendment No. 11 to the Registration Statement on Form N-2, filed on January 17, 2013. |
(33) | Incorporated by reference from the Registrant’s Post-Effective Amendment No. 12 to the Registration Statement on Form N-2, filed on January 25, 2013. |
(34) | Incorporated by reference from the Registrant’s Post-Effective Amendment No. 13 to the Registration Statement on Form N-2, filed on January 31, 2013. |
(35) | Incorporated by reference from the Registrant’s Post-Effective Amendment No. 14 to the Registration Statement on Form N-2, filed on February 7, 2013. |
(36) | Incorporated by reference from the Registrant’s Post-Effective Amendment No. 16 to the Registration Statement on Form N-2, filed on February 22, 2013. |
(37) | Incorporated by reference from the Registrant’s Post-Effective Amendment No. 17 to the Registration Statement on Form N-2, filed on February 28, 2013. |
(38) | Incorporated by reference from the Registrant’s Post-Effective Amendment No. 18 to the Registration Statement on Form N-2, filed on March 7, 2013. |
(39) | Incorporated by reference from the Registrant’s Post-Effective Amendment No. 19 to the Registration Statement on Form N-2, filed on March 14, 2013. |
(40) | Incorporated by reference to Exhibit 4.1 of the Registrant’s Form 8-K, filed on March 15, 2013. |
(41) | Incorporated by reference to Exhibit 4.2 of the Registrant’s Form 8-K, filed on March 15, 2013. |
(42) | Incorporated by reference from the Registrant’s Post-Effective Amendment No. 21 to the Registration Statement on Form N-2, filed on March 21, 2013. |
(43) | Incorporated by reference from the Registrant’s Post-Effective Amendment No. 22 to the Registration Statement on Form N-2, filed on March 28, 2013. |
(44) | Incorporated by reference from the Registrant’s Post-Effective Amendment No. 23 to the Registration Statement on Form N-2, filed on April 4, 2013. |
(45) | Incorporated by reference from the Registrant’s Post-Effective Amendment No. 24 to the Registration Statement on Form N-2, filed on April 11, 2013. |
(46) | Incorporated by reference from the Registrant’s Post-Effective Amendment No. 25 to the Registration Statement on Form N-2, filed on April 18, 2013. |
(47) | Incorporated by reference from the Registrant’s Post-Effective Amendment No. 26 to the Registration Statement on Form N-2, filed on April 25, 2013. |
(48) | Incorporated by reference from the Registrant’s Post-Effective Amendment No. 27 to the Registration Statement on Form N-2, filed on May 2, 2013. |
(49) | Incorporated by reference from the Registrant’s Post-Effective Amendment No. 29 to the Registration Statement on Form N-2, filed on May 9, 2013. |
(50) | Incorporated by reference from the Registrant’s Post-Effective Amendment No. 30 to the Registration Statement on Form N-2, filed on May 23, 2013. |
239
(51) | Incorporated by reference from the Registrant’s Post-Effective Amendment No. 31 to the Registration Statement on Form N-2, filed on May 31, 2013. |
(52) | Incorporated by reference from the Registrant’s Post-Effective Amendment No. 32 to the Registration Statement on Form N-2, filed on June 6, 2013. |
(53) | Incorporated by reference from the Registrant’s Post-Effective Amendment No. 33 to the Registration Statement on Form N-2, filed on June 13, 2013. |
(54) | Incorporated by reference from the Registrant’s Post-Effective Amendment No. 34 to the Registration Statement on Form N-2, filed on June 20, 2013. |
(55) | Incorporated by reference from the Registrant’s Post-Effective Amendment No. 35 to the Registration Statement on Form N-2, filed on June 27, 2013. |
(56) | Incorporated by reference from the Registrant’s Post-Effective Amendment No. 36 to the Registration Statement on Form N-2, filed on July 5, 2013. |
(57) | Incorporated by reference from the Registrant’s Post-Effective Amendment No. 37 to the Registration Statement on Form N-2, filed on July 11, 2013. |
(58) | Incorporated by reference from the Registrant’s Post-Effective Amendment No. 38 to the Registration Statement on Form N-2, filed on July 18, 2013. |
(59) | Incorporated by reference from the Registrant’s Post-Effective Amendment No. 39 to the Registration Statement on Form N-2, filed on July 25, 2013. |
(60) | Incorporated by reference from the Registrant’s Post-Effective Amendment No. 40 to the Registration Statement on Form N-2, filed on August 1, 2013. |
(61) | Incorporated by reference from the Registrant’s Post-Effective Amendment No. 41 to the Registration Statement on Form N-2, filed on August 8, 2013. |
(62) | Incorporated by reference from the Registrant’s Post-Effective Amendment No. 42 to the Registration Statement on Form N-2, filed on August 15, 2013. |
(63) | Incorporated by reference from the Registrant’s Post-Effective Amendment No. 43 to the Registration Statement on Form N-2, filed on August 22, 2013. |
(64) | Incorporated by reference from the Registrant’s Post-Effective Amendment No. 45 to the Registration Statement on Form N-2, filed on September 6, 2013. |
(65) | Incorporated by reference from the Registrant’s Post-Effective Amendment No. 46 to the Registration Statement on Form N-2, filed on September 12, 2013. |
(66) | Incorporated by reference from the Registrant’s Post-Effective Amendment No. 47 to the Registration Statement on Form N-2, filed on September 19, 2013. |
(67) | Incorporated by reference from the Registrant’s Post-Effective Amendment No. 48 to the Registration Statement on Form N-2, filed on September 26, 2013. |
(68) | Incorporated by reference from the Registrant’s Post-Effective Amendment No. 49 to the Registration Statement on Form N-2, filed on October 3, 2013. |
(69) | Incorporated by reference from the Registrant’s Post-Effective Amendment No. 50 to the Registration Statement on Form N-2, filed on October 10, 2013. |
(70) | Incorporated by reference from the Registrant’s Post-Effective Amendment No. 51 to the Registration Statement on Form N-2, filed on October 18, 2013. |
(71) | Incorporated by reference from the Registrant’s Post-Effective Amendment No. 3 to the Registration Statement on Form N-2, filed on October 24, 2013. |
(72) | Incorporated by reference from the Registrant’s Post-Effective Amendment No. 4 to the Registration Statement on Form N-2, filed on October 31, 2013. |
(73) | Incorporated by reference from the Registrant’s Post-Effective Amendment No. 6 to the Registration Statement on Form N-2, filed on November 7, 2013. |
(74) | Incorporated by reference from the Registrant’s Post-Effective Amendment No. 7 to the Registration Statement on Form N-2, filed on November 15, 2013. |
(75) | Incorporated by reference from the Registrant’s Post-Effective Amendment No. 8 to the Registration Statement on Form N-2, filed on November 21, 2013. |
(76) | Incorporated by reference from the Registrant’s Post-Effective Amendment No. 9 to the Registration Statement on Form N-2, filed on November 29, 2013. |
(77) | Incorporated by reference from the Registrant’s Post-Effective Amendment No. 10 to the Registration Statement on Form N-2, filed on December 5, 2013. |
(78) | Incorporated by reference from the Registrant’s Post-Effective Amendment No. 11 to the Registration Statement on Form N-2, filed on December 12, 2013. |
240
(79) | Incorporated by reference from the Registrant’s Post-Effective Amendment No. 12 to the Registration Statement on Form N-2, filed on December 19, 2013. |
(80) | Incorporated by reference from the Registrant’s Post-Effective Amendment No. 13 to the Registration Statement on Form N-2, filed on December 27, 2013. |
(81) | Incorporated by reference from the Registrant’s Post-Effective Amendment No. 14 to the Registration Statement on Form N-2, filed on January 3, 2014. |
(82) | Incorporated by reference from the Registrant’s Post-Effective Amendment No. 15 to the Registration Statement on Form N-2, filed on January 9, 2014. |
(83) | Incorporated by reference from the Registrant’s Post-Effective Amendment No. 16 to the Registration Statement on Form N-2, filed on January 16, 2014. |
(84) | Incorporated by reference from the Registrant’s Post-Effective Amendment No. 17 to the Registration Statement on Form N-2, filed on January 24, 2014. |
(85) | Incorporated by reference from the Registrant’s Post-Effective Amendment No. 18 to the Registration Statement on Form N-2, filed on January 30, 2014. |
(86) | Incorporated by reference from the Registrant’s Post-Effective Amendment No. 19 to the Registration Statement on Form N-2, filed on February 6, 2014. |
(87) | Incorporated by reference from the Registrant’s Post-Effective Amendment No. 20 to the Registration Statement on Form N-2, filed on February 13, 2014. |
(88) | Incorporated by reference from the Registrant’s Post-Effective Amendment No. 21 to the Registration Statement on Form N-2, filed on February 19, 2014. |
(89) | Incorporated by reference from the Registrant’s Post-Effective Amendment No. 22 to the Registration Statement on Form N-2, filed on February 21, 2014. |
(90) | Incorporated by reference from the Registrant’s Post-Effective Amendment No. 23 to the Registration Statement on Form N-2, filed on February 27, 2014. |
(91) | Incorporated by reference from the Registrant’s Post-Effective Amendment No. 24 to the Registration Statement on Form N-2, filed on March 6, 2014. |
(92) | Incorporated by reference from the Registrant’s Post-Effective Amendment No. 25 to the Registration Statement on Form N-2, filed on March 11, 2014. |
(93) | Incorporated by reference from the Registrant’s Post-Effective Amendment No. 26 to the Registration Statement on Form N-2, filed on March 13, 2014. |
(94) | Incorporated by reference from the Registrant’s Post-Effective Amendment No. 27 to the Registration Statement on Form N-2, filed on March 20, 2014. |
(95) | Incorporated by reference from the Registrant’s Post-Effective Amendment No. 28 to the Registration Statement on Form N-2, filed on March 27, 2014. |
(96) | Incorporated by reference from the Registrant’s Post-Effective Amendment No. 29 to the Registration Statement on Form N-2, filed on April 3, 2014. |
(97) | Incorporated by reference from the Registrant’s Post-Effective Amendment No. 30 to the Registration Statement on Form N-2, filed on April 7, 2014. |
(98) | Incorporated by reference from the Registrant’s Post-Effective Amendment No. 31 to the Registration Statement on Form N-2, filed on April 10, 2014. |
(99) | Incorporated by reference to Exhibit 4.1 of the Registrant’s Form 8-K, filed on April 16, 2014. |
(100) | Incorporated by reference from the Registrant’s Post-Effective Amendment No. 32 to the Registration Statement on Form N-2, filed on April 17, 2014. |
(101) | Incorporated by reference from the Registrant’s Post-Effective Amendment No. 33 to the Registration Statement on Form N-2, filed on April 24, 2014. |
(102) | Incorporated by reference from the Registrant’s Post-Effective Amendment No. 34 to the Registration Statement on Form N-2, filed on May 1, 2014. |
(103) | Incorporated by reference from the Registrant’s Post-Effective Amendment No. 35 to the Registration Statement on Form N-2, filed on May 8, 2014. |
(104) | Incorporated by reference to Exhibit 10.12 of the Registrant’s Form 10-K, filed on August 25, 2014. |
(105) | Incorporated by reference to Exhibit 10.13 of the Registrant’s Form 10-K, filed on August 25, 2014. |
(106) | Incorporated by reference from the Registrant's Pre-Effective Amendment No. 1 to the Registration Statement on Form N-2, filed on October 14, 2014. |
(107) | Incorporated by reference to Exhibit 99.1 of the Registrant's Form 10-K/A, filed on November 3, 2014. |
241
(108) | Incorporated by reference from the Registrant's Pre-Effective Amendment No. 2 to the Registration Statement on Form N-2, filed on November 3, 2014. |
(109) | Incorporated by reference from the Registrant's Post-Effective Amendment No. 1 to the Registration Statement on Form N-2, filed on November 3, 2014. |
(110) | Incorporated by reference from the Registrant's Post-Effective Amendment No. 2 to the Registration Statement on Form N-2, filed on November 20, 2014. |
(111) | Incorporated by reference from the Registrant's Post-Effective Amendment No. 3 to the Registration Statement on Form N-2, filed on November 28, 2014. |
(112) | Incorporated by reference from the Registrant's Post-Effective Amendment No. 4 to the Registration Statement on Form N-2, filed on December 4, 2014. |
(113) | Incorporated by reference from the Registrant's Post-Effective Amendment No. 5 to the Registration Statement on Form N-2, filed on December 11, 2014. |
(114) | Incorporated by reference from the Registrant's Post-Effective Amendment No. 6 to the Registration Statement on Form N-2, filed on December 18, 2014. |
(115) | Incorporated by reference from the Registrant's Post-Effective Amendment No. 7 to the Registration Statement on Form N-2, filed on December 29, 2014. |
(116) | Incorporated by reference from the Registrant's Post-Effective Amendment No. 8 to the Registration Statement on Form N-2, filed on January 5, 2015. |
(117) | Incorporated by reference from the Registrant's Post-Effective Amendment No. 9 to the Registration Statement on Form N-2, filed on January 8, 2015. |
(118) | Incorporated by reference from the Registrant's Post-Effective Amendment No. 10 to the Registration Statement on Form N-2, filed on January 15, 2015. |
(119) | Incorporated by reference from the Registrant's Post-Effective Amendment No. 11 to the Registration Statement on Form N-2, filed on January 23, 2015. |
(120) | Incorporated by reference from the Registrant's Post-Effective Amendment No. 12 to the Registration Statement on Form N-2, filed on January 29, 2015. |
(121) | Incorporated by reference from the Registrant's Post-Effective Amendment No. 13 to the Registration Statement on Form N-2, filed on February 5, 2015. |
(122) | Incorporated by reference from the Registrant's Post-Effective Amendment No. 14 to the Registration Statement on Form N-2, filed on February 20, 2015. |
(123) | Incorporated by reference from the Registrant's Post-Effective Amendment No. 15 to the Registration Statement on Form N-2, filed on February 26, 2015. |
(124) | Incorporated by reference from the Registrant's Post-Effective Amendment No. 16 to the Registration Statement on Form N-2, filed on March 5, 2015. |
(125) | Incorporated by reference from the Registrant's Post-Effective Amendment No. 17 to the Registration Statement on Form N-2, filed on March 12, 2015. |
(126) | Incorporated by reference from the Registrant's Post-Effective Amendment No. 18 to the Registration Statement on Form N-2, filed on March 19, 2015. |
(127) | Incorporated by reference from the Registrant's Post-Effective Amendment No. 19 to the Registration Statement on Form N-2, filed on March 26, 2015. |
(128) | Incorporated by reference from the Registrant's Post-Effective Amendment No. 20 to the Registration Statement on Form N-2, filed on April 2, 2015. |
(129) | Incorporated by reference from the Registrant's Post-Effective Amendment No. 21 to the Registration Statement on Form N-2, filed on April 9, 2015. |
(130) | Incorporated by reference from the Registrant's Post-Effective Amendment No. 22 to the Registration Statement on Form N-2, filed on April 16, 2015. |
(131) | Incorporated by reference from the Registrant's Post-Effective Amendment No. 23 to the Registration Statement on Form N-2, filed on April 23, 2015. |
(132) | Incorporated by reference from the Registrant's Post-Effective Amendment No. 24 to the Registration Statement on Form N-2, filed on April 29, 2015. |
(133) | Incorporated by reference from the Registrant's Post-Effective Amendment No. 25 to the Registration Statement on Form N-2, filed on May 7, 2015. |
(134) | Incorporated by reference from the Registrant's Post-Effective Amendment No. 26 to the Registration Statement on Form N-2, filed on May 21, 2015. |
(135) | Incorporated by reference from the Registrant's Post-Effective Amendment No. 27 to the Registration Statement on Form N-2, filed on May 29, 2015. |
242
(136) | Incorporated by reference from the Registrant's Post-Effective Amendment No. 28 to the Registration Statement on Form N-2, filed on June 4, 2015. |
(137) | Incorporated by reference from the Registrant's Post-Effective Amendment No. 29 to the Registration Statement on Form N-2, filed on June 11, 2015. |
(138) | Incorporated by reference from the Registrant's Post-Effective Amendment No. 30 to the Registration Statement on Form N-2, filed on June 18, 2015. |
(139) | Incorporated by reference from the Registrant's Post-Effective Amendment No. 31 to the Registration Statement on Form N-2, filed on June 25, 2015. |
(140) | Incorporated by reference from the Registrant's Post-Effective Amendment No. 32 to the Registration Statement on Form N-2, filed on July 2, 2015. |
(141) | Incorporated by reference from the Registrant's Post-Effective Amendment No. 33 to the Registration Statement on Form N-2, filed on July 9, 2015. |
(142) | Incorporated by reference from the Registrant's Post-Effective Amendment No. 34 to the Registration Statement on Form N-2, filed on July 16, 2015. |
(143) | Incorporated by reference from the Registrant's Post-Effective Amendment No. 35 to the Registration Statement on Form N-2, filed on July 23, 2015. |
(144) | Incorporated by reference from the Registrant's Post-Effective Amendment No. 36 to the Registration Statement on Form N-2, filed on July 30, 2015. |
(145) | Incorporated by reference from the Registrant's Post-Effective Amendment No. 37 to the Registration Statement on Form N-2, filed on August 6, 2015. |
(146) | Incorporated by reference from the Registrant's Post-Effective Amendment No. 38 to the Registration Statement on Form N-2, filed on August 13, 2015. |
(147) | Incorporated by reference from the Registrant's Post-Effective Amendment No. 39 to the Registration Statement on Form N-2, filed on August 20, 2015. |
(148) | Incorporated by reference from the Registrant's Proxy Statement, filed on September 10, 2014. |
(149) | Incorporated by reference from the Registrant’s Form 8-K, filed on December 5, 2014. |
(150) | Incorporated by reference to Exhibit 14 of the Registrant’s Form 10-K filed on August 26, 2015. |
243
SIGNATURES
Pursuant to the requirements of Section 13 or 15(d) of the Securities Exchange Act of 1934, the Registrant has duly caused this report to be signed on its behalf by the undersigned, thereunto duly authorized on September 11, 2015.
PROSPECT CAPITAL CORPORATION | |
By: | /s/ JOHN F. BARRY III |
John F. Barry III | |
Chairman of the Board and Chief Executive Officer | |
Pursuant to the requirements of the Securities Exchange Act of 1934, this report has been signed below by the following persons on behalf of the Registrant and in the capacities and on the dates indicated.
/s/ JOHN F. BARRY III | /s/ ANDREW C. COOPER | |
John F. Barry III | Andrew C. Cooper | |
Chairman of the Board, Chief Executive Officer and Director | Director | |
September 11, 2015 | September 11, 2015 | |
/s/ BRIAN H. OSWALD | /s/ WILLIAM J. GREMP | |
Brian H. Oswald | William J. Gremp | |
Chief Financial Officer | Director | |
September 11, 2015 | September 11, 2015 | |
/s/ M. GRIER ELIASEK | /s/ EUGENE S. STARK | |
M. Grier Eliasek | Eugene S. Stark | |
President, Chief Operating Officer and Director | Director | |
September 11, 2015 | September 11, 2015 | |
244