Attached files
| file | filename |
|---|---|
| EX-32.1 - EXHIBIT 32.1 - EVOLUTION PETROLEUM CORP | a6302015exhibit321.htm |
| EX-31.1 - EXHIBIT 31.1 - EVOLUTION PETROLEUM CORP | a6302015exhibit311.htm |
| EX-21.1 - EXHIBIT 21.1 - EVOLUTION PETROLEUM CORP | listofsubs63015exh211.htm |
| EX-31.2 - EXHIBIT 31.2 - EVOLUTION PETROLEUM CORP | a6302015exhibit312.htm |
| EX-32.2 - EXHIBIT 32.2 - EVOLUTION PETROLEUM CORP | a6302015exhibit322.htm |
| EX-23.3 - EXHIBIT 23.3 - EVOLUTION PETROLEUM CORP | vongconsent63015exh_233.htm |
| EX-23.1 - EXHIBIT 23.1 - EVOLUTION PETROLEUM CORP | heinconsent63015exh_231.htm |
| EX-99.4 - EXHIBIT 99.4 D&M ENGINEERING RPT - EVOLUTION PETROLEUM CORP | a6302015engrptexhibit994.htm |
| EX-23.2 - EXHIBIT 23.2 - EVOLUTION PETROLEUM CORP | dandmconsent63015exh_232.htm |
| EX-23.4 - EXHIBIT 23.4 - EVOLUTION PETROLEUM CORP | pinnacleconsent63015exh_234.htm |
UNITED STATES
SECURITIES AND EXCHANGE COMMISSION
Washington, D.C. 20549
FORM 10-K
ý | ANNUAL REPORT PURSUANT TO SECTION 13 OR 15(d) OF THE SECURITIES EXCHANGE ACT OF 1934 | |
For the fiscal year ended June 30, 2015
o | TRANSITION REPORT PURSUANT TO SECTION 13 OR 15(d) OF THE SECURITIES EXCHANGE ACT OF 1934 | |
For the transition period from to
Commission File Number 001-32942
EVOLUTION PETROLEUM CORPORATION
(Exact name of registrant as specified in its charter)
Nevada (State or other jurisdiction of incorporation or organization) | 41-1781991 (IRS Employer Identification No.) | |
2500 CityWest Blvd., Suite 1300, Houston, Texas 77042 (Address of principal executive offices and zip code) | ||
(713) 935-0122 (Registrant's telephone number, including area code) | ||
Securities registered pursuant to Section 12(b) of the Act:
Title of Each Class | Name of Each Exchange On Which Registered | |||
Common Stock, $0.001 par value | NYSE MKT | |||
8.5% Series A Cumulative Preferred Stock, $0.001 par value | NYSE MKT | |||
Securities registered pursuant to Section 12(g) of the Act:
None
(Title of Class)
Indicate by check mark if the registrant is a well-known seasoned issuer, as defined in Rule 405 of the Securities Act. Yes: o No: ý
Indicate by check mark if the registrant is not required to file reports pursuant to Section 13 or Section 15(d) of the Act. Yes: o No: ý
Indicate by check mark whether the registrant (1) has filed all reports required to be filed by Section 13 or 15(d) of the Securities Exchange Act of 1934 during the preceding 12 months (or for such shorter period that the registrant was required to file such reports), and (2) has been subject to such filing requirements for the past 90 days. Yes: ý No: o
Indicate by check mark whether the registrant has submitted electronically and posted on its corporate Web site, if any, every Interactive Data File required to be submitted and posted pursuant to Rule 405 of Regulation S-T (§ 232.405 of this chapter) during the preceding 12 months (or for such shorter period that the registrant was required to submit and post such files). Yes: ý No: o
Indicate by check mark if disclosure of delinquent filers pursuant to Item 405 of Regulation S-K (§ 229.405 of this chapter) is not contained herein, and will not be contained, to the best of registrant's knowledge, in definitive proxy or information statements incorporated by reference in Part III of this Form 10-K or any amendment to this Form 10-K. ý
Indicate by check mark whether the registrant is a large accelerated filer, an accelerated filer, a non-accelerated filer or a smaller reporting company. See the definition of "large accelerated filer", "accelerated filer" and "smaller reporting company" in Rule 12b-2 of the Exchange Act.
Large accelerated filer o | Accelerated filer ý | Non-accelerated filer o | Smaller reporting company o | |||
Indicate by check mark whether the registrant is a shell company (as defined in Rule 12b-2 of the Exchange Act.). Yes: o No: ý
The aggregate market value of the voting and non-voting common equity held by non-affiliates on December 31, 2014, the last business day of the registrant’s most recently completed second fiscal quarter, based on the closing price on that date of $7.43 on the NYSE MKT was $183,168,484.
The number of shares outstanding of the registrant's common stock, par value $0.001, as of September 1, 2015, was 32,671,415.
DOCUMENTS INCORPORATED BY REFERENCE
Portions of the proxy statement related to the registrant's 2015 Annual Meeting of Stockholders to be filed within 120 days of the end of the fiscal year covered by this report are incorporated by reference into Part III of this report.
1
EVOLUTION PETROLEUM CORPORATION AND SUBSIDIARIES
2015 ANNUAL REPORT ON FORM 10-K
TABLE OF CONTENTS
Page | ||||
This Form 10-K and the information referenced herein contain forward-looking statements within the meaning of the Private Securities Litigations Reform Act of 1995, Section 27A of the Securities Act of 1933 and Section 21E of the Securities Exchange Act of 1934. The words "plan," "expect," "project," "estimate," "assume," "believe," "anticipate," "intend," "budget," "forecast," "predict" and other similar expressions are intended to identify forward-looking statements. These statements appear in a number of places and include statements regarding our plans, beliefs or current expectations, including the plans, beliefs and expectations of our officers and directors. When considering any forward-looking statement, you should keep in mind the risk factors that could cause our actual results to differ materially from those contained in any forward-looking statement. Important factors that could cause actual results to differ materially from those in the forward-looking statements herein include the timing and extent of changes in commodity prices for oil and natural gas, operating risks and other risk factors as described in this Annual Report on Form 10-K as filed with the Securities and Exchange Commission ("SEC"). Furthermore, the assumptions that support our forward-looking statements are based upon information that is currently available and is subject to change. We specifically disclaim all responsibility to publicly update any information contained in a forward-looking statement or any forward-looking statement in its entirety and therefore disclaim any resulting liability for potentially related damages. All forward-looking statements attributable to Evolution Petroleum Corporation are expressly qualified in their entirety by this cautionary statement.
We use the terms, "EPM," "Company," "we," "us" and "our" to refer to Evolution Petroleum Corporation, and unless the context otherwise requires, its wholly-owned subsidiaries.
PART I
Item 1. Business
Note: See Glossary of Selected Petroleum Industry Terms at the back of this document - refer to Table of Contents
General
We are an oil and gas company engaged primarily in the acquisition, exploitation and development of properties for the production of crude oil and natural gas, onshore in the United States. We acquire known crude oil and natural gas resources and exploit them through the application of conventional and specialized technology, with the objective of increasing production, ultimate recoveries, or both. In 2013, our business was modified to include a second focus on applying our proprietary artificial lift technology for recovering incremental oil and gas from existing wells. In this document, we provide additional information about our business operations and plans for commercializing our artificial lift technology, but it is not currently a separate reportable segment of our operations. Additional information regarding our operating segment, major customers, revenues and assets can be found in in Item 8. Financial Statements - Notes to Consolidated Financial Statements.
Our petroleum operations began in September of 2003. On May 26, 2004, our predecessor, Natural Gas Systems, Inc. (Delaware, "Old NGS"), a private corporation formed in September 2003, merged into a wholly-owned subsidiary of Reality Interactive, Inc. (Nevada, "Reality"), an inactive public company, which was renamed Natural Gas Systems, Inc. ("NGS"). The former officers and directors of Reality resigned and the officers, directors and business operations of Old NGS became the Company. Concurrently with the listing of NGS shares on the NYSE MKT in July 2006, NGS was renamed Evolution Petroleum Corporation. Our principal executive offices are located at 2500 City West Blvd, Suite 1300, Houston, Texas 77042, and our telephone number is (713) 935-0122. We maintain a website at www.evolutionpetroleum.com, but information contained on our website does not constitute part of this document.
Our common stock is traded on the NYSE MKT under the ticker symbol "EPM". We also have preferred stock which trades under the symbol "EPM.A"
At June 30, 2015, we had ten full-time employees, not including contract personnel and outsourced service providers. None of the Company’s employees are currently represented by a union, and the Company believes that it has excellent relations with its employees. Our team is broadly experienced in oil and gas operations, development, acquisitions and financing. We follow a strategy of outsourcing most of our property accounting, human resources, administrative and other non-core functions.
Business Strategy
Our business strategy is to acquire known, underdeveloped oil and natural gas resources and exploit them through the application of capital, sound engineering and modern technology, including our patented artificial lift technology, to increase production, ultimate recoveries, or both. We also provide our artificial lift technology to other operators to improve recovery of oil and gas from existing wells.
Our principal assets include interests in a CO2 enhanced oil recovery project in Louisiana’s Delhi Field and our patented artificial lift technology, GARP®. We are focused on increasing underlying asset values on a per share basis. In doing so, we depend on a conservative capital structure, allowing us to maintain financial control of our assets for the benefit of our shareholders.
Delhi Field—Louisiana
Our mineral and working interests in the Delhi Holt-Bryant Unit in the Delhi Field ("Unit"), located in Northeast Louisiana, are currently our most significant asset. The Unit is approximately 13,636 acres in size and has had a prolific production history totaling approximately 195 million bbls of oil through primary and limited secondary recovery operations since its discovery in the mid-1940s. Since initial enhanced oil recovery ("EOR") production began in March 2010, the Unit has produced over 9 million bbls of oil. The Unit is currently producing as an EOR project utilizing CO2 flood technology
1
following the sale of a majority of our working interest to a subsidiary of Denbury Resources, Inc., the current operator, in 2006. At the time of our $2.8 million purchase of the field in 2003, the Unit had minimal production.
We own two types of interests in the Unit:
• | 7.4% of overriding royalty interests that are in effect throughout the life of the project and mineral royalty interests, free of all operating and capital cost burdens; and |
• | A 23.9% working interest with an associated 19.0% net revenue interest. The working interest reverted to us effective November 1, 2014, when the operator generated $200 million of net revenue from the 100% working interest less direct operating expenses and the cost of purchased CO2. Upon occurrence of this contractual payout, we began bearing 23.9% of all operating expenses and capital expenditures and our net revenue interest increased to an aggregate of 26.4%. |
Our independent reservoir engineers, DeGolyer & MacNaughton, assigned the following estimated reserves net to our interests at Delhi as of June 30, 2015. Equivalent oil reserves is defined as six MCF of gas and 42 gallons of natural gas liquids to one barrel of oil conversion ratio.
• | 12.4 million bbls of proved oil equivalent reserves, with a PV-10* of $218.7 million |
• | 9.3 million bbls of probable** oil equivalent reserves, with a PV-10* of $72.3 million |
• | 3.0 million bbls of possible** oil equivalent reserves, with a PV-10* of $13.6 million |
_______________________________________________________________________________
* | PV-10 of Proved reserves is a non-GAAP measure, reconciled to the Standardized Measure at "Estimated Oil and Natural Gas Reserves and Estimated Future Net Revenues" under Item 2. Properties of this Form 10-K. Probable and Possible reserves are not recognized by GAAP, and therefore the PV-10 of such reserves cannot be reconciled to a GAAP measure. |
** | With respect to the above reserve numbers, estimates of Probable and Possible reserves are inherently imprecise. When producing an estimate of the amount of oil and natural gas that is recoverable from a particular reservoir, Probable reserves are those additional reserves that are less certain to be recovered than Proved reserves but which, together with Proved reserves, are as likely as not to be recovered. Possible reserves are even less certain and generally require only a 10% or greater probability of being recovered. All categories of reserves are continually subject to revisions based on production history, results of additional exploration and development, price changes and other factors. Estimates of Probable and Possible reserves are by their nature much more speculative than estimates of Proved reserves and are subject to greater uncertainties, and accordingly the likelihood of recovering those reserves is subject to substantially greater risk. These three reserve categories and net present worth discounted at 10% relating to each category have not been adjusted to different levels of recovery risk among these categories and are therefore not comparable and are not meaningfully combined. |
The operator has planned multiple phases for the installation of the CO2 flood.
Phase I began CO2 injection in November 2009. First oil production response occurred in March 2010, about three to four months earlier than expected, and production in the field increased to approximately 2,000 gross BOPD.
Implementation of Phase II, which was more than double the size of Phase I, commenced with incremental CO2 injection at the end of December 2010. First oil production response from Phase II occurred during March 2011, three or more months ahead of expectations, and field gross production increased to more than 4,000 BO per day.
Phase III was installed during calendar 2011, and was expanded twice during calendar 2011. Production subsequently increased to more than 6,000 BO per day.
Phase IV was substantially installed during the first six months of calendar 2012. During early calendar 2013, the operator intensified development in the previously redeveloped western side of the field based on production results and new geological mapping that included the results of seismic data acquired over the last few years. Gross field production increased to more than 7,500 BO per day before the operator temporarily suspended CO2 injection in the southwestern tip of the field due to a fluid release event in June 2013, which consisted of the uncontrolled release of CO2, water, natural gas and a small amount of oil from one or more previously plugged wells in the southwest part of the field. The operator has fully remediated the affected area, but has temporarily isolated that part of the field with a water curtain and is evaluating options to continue production from that area as a water flood, potentially aided by surfactants or other enhanced recovery techniques. It is also possible that the operator may choose to resume CO2 injection in that part of the field at a later date.
The operator has taken the position that the remediation costs of the June 2013 fluid release event, which totaled over $130 million on a gross basis, could be charged to our payout account. Accordingly, this action delayed our working interest
2
reversion by more than one year. We dispute the operator's position on the treatment of these costs and have filed suit against the operator over this matter and other issues related to the original 2006 agreements. See Note 17 - Commitments and Contingencies.
Since the June 2013 fluids release, the operator delayed further development of the field and stated its intent not to resume significant capital spending until reversion of our working interest, which became effective on November 1, 2014. In February 2015, subsequent to reversion, we approved an authorization for expenditure ("AFE") for the construction of a natural gas liquids ("NGL") recovery plant in the Delhi Field, which will extract NGL's and methane from the field. We expect that the NGL's will be sold and the recovered methane will be utilized to generate power for the field in order to substantially reduce operating costs, a more economical utilization than selling of the methane. In addition to the value of these hydrocarbon products, the increased purity of the CO2 stream re-injected into the field should result in significant operational benefits to the CO2 flood. The estimated gross costs of the plant is approximately $103 million; our net share of these capital expenditures is $24.6 million, of which we have already expended approximately $5 million. The plant is expected to be operational in the second half of calender 2016.
During the fall of 2014, post-reversion, the operator initiated work on expansion of the CO2 flood in the undeveloped eastern part of the field. These operations were suspended last fall when the operator made significant cuts in its capital budget as a result of declining oil prices. While we believe that expansion is economic at current commodity prices, resumption of this work is likely to be electively delayed due to prevailing oil prices and the partners' allocation of capital for such projects. Since we believe that the NGL plant and further expansion of the CO2 flood have very favorable economics, even in this lower price environment, we expect the expansion of the CO2 flood to resume within the next 2-3 years. The economics of expansion will also be improved subsequent to the completion of the NGL recovery plant.
One of the three remaining development phases, part of which lies under the town of Delhi (population approximately 3,000), has been deferred by the operator. The reserves in this phase were reclassified last year from proved to probable. There are also probable reserves associated with three smaller reservoirs within the Unit in similar formations with similar production history that we expect to be developed as an additional phase of the EOR project early in the next decade. Since such development is currently more than five years from now, these reserves are wholly classified as Probable, in accordance with SEC guidelines.
Artificial Lift Technology (GARP®)
Our artificial lift technology registered as GARP® (Gas Assisted Rod Pump) was developed internally by our Senior Vice President of Operations. Its design is intended to increase production and extend the life of horizontal and vertical wells with gas, oil or associated water production with the expectation of recovering additional reserves at an economically attractive cost per BOE. We received a patent on our GARP® technology on August 30, 2011, which provides U.S. patent protection for the technology through early 2028. We have further filed for a continuation in part to our patent for recent improvements in the technology, including a concentric design which allows the technology to work in narrower diameter casing.
Prior to patent issuance, we tested the GARP® technology on certain marginal producing wells we owned and operated in the Giddings Field. The tests were successful in demonstrating that the process works; however, these candidates were unable to prove commercial viability due to their low primary recoveries as producers.
Subsequent to receiving our patent, we entered into demonstration joint venture projects with two different industry operators during fiscal 2012 to prove commercial application. We further expanded our commercial tests during fiscal 2013 with two additional installations and a third in fiscal 2014. All five of these installations were successful in re-establishing commercial production. One well subsequently ceased oil production when an offset well was hydraulically fractured and the water migrated to our well bore. During fiscal 2014, we entered into a commercial agreement to install our technology on at least five wells in the Giddings Field. Three installations were completed as of the end of fiscal 2014, two of which were successful in increasing production and the balance were unsuccessful due to well bore conditions. During fiscal 2015, we completed installation of our artificial lift technology in an additional two non-operated wells under this contract. In addition, we restored production in one of our operated wells that had been temporarily abandoned and shut-in since March 2014.
We are in discussions with multiple industry operators to further expand the business to other fields during fiscal 2016 and have entered into master service agreements with four companies for potential deployment in the Eagle Ford, Barnett and Permian fields located in Texas. With continued success and industry acceptance, we believe GARP® could be applicable to a large number of horizontal and vertical wells worldwide. However, in the current low commodity price environment and reduced capital spending, the timing for commercial success has been slower than previously anticipated.
3
Based on our production history, DeGolyer & MacNaughton assigned proved reserves of 33 MBOE to three GARP® installations that we operate with PV-10 of $0.4 million. Certain of our third party technology fees, though based on a percentage of net profits from the wells, will generally not result in the assignment of reserves by our petroleum engineers, as we do not own direct mineral interests in the wells.
Other Projects
Giddings Field—Central Texas
We began leasing activities in the Giddings Field in December 2006. In late calendar 2007, we initiated a redevelopment drilling program in the Giddings Field targeting the Austin Chalk and Georgetown formations. During fiscal 2013, we began and completed a series of sale transactions that monetized all of our non-GARP® producing wells and drilling locations.
We retained a 3-5% overriding royalty interest on 2,094 acres on all depths below the base of the Austin Chalk in Brazos, Burleson and Fayette Counties, Texas for the remaining lives of related leases, as extended. We also retained overriding royalty interests of approximately 5% in 900 net acres in the Woodbine formation and a 15% back-in working interest on approximately 258 net acres in Grimes County, Texas. We do not expect to assign any reserves to these residual interests until such time as there are successful drilling results.
Lopez Field—South Texas
We acquired leases covering approximately 782 net acres in the Lopez Field in South Texas as a first effort to test the concept of redeveloping old oil fields utilizing high flow rate production. While our development activity in the Lopez Field confirmed our concept and the potential for developing material oil reserves, the time and effort required to develop material reserves lowered the attractiveness of this project. Consequently, we elected to sell this asset during fiscal 2013 and completed such monetization in fiscal 2014.
Mississippi Lime—Kay County, Oklahoma
In 2012, we acquired a 45% interest in a joint venture with Orion Exploration, a private company based in Tulsa, Oklahoma. The joint venture was operated by Orion and engaged in the horizontal development of the Mississippi Lime reservoir in Kay County, Oklahoma. Our leasehold position, totaling approximately 6,600 acres, was located in the eastern, more oil-prone side of the play. We drilled one gross salt water disposal well and reached total depth on two horizontally drilled wells in the Mississippi Lime formation, the Sneath #1-24 and the Hendrickson #1-1. While both wells produced at the fluid rates expected, the quantities of oil and gas were far less than expected. We subsequently reworked both wells to test the role of structure in production, and determined that this play is a structural play requiring substantial geophysical and geological work and expertise in order to be successful, as opposed to a resource play in which engineering is the primary requirement. Accordingly, we elected in fiscal 2013 to reduce our joint venture interest in undeveloped leases to 33.9%, resulting in a $1.2 million reduction in both our net property and accounts payable. In October 2014, we closed on the sale of all of our leasehold interests, wells and associated assets in the Mississippi Lime reservoir to the operator.
Markets and Customers
We market our production to third parties in a manner consistent with industry practices. In the U.S. market where we operate, crude oil and natural gas liquids are readily transportable and marketable. We do not currently market our share of crude oil production from Delhi. Although we have the right to take our working interest production in-kind, we are currently accepting terms under the Delhi operator's agreement with Plains Marketing LP for the delivery and pricing of our oil there. The oil from Delhi is currently transported from the field by pipeline, which results in better net pricing than the alternative of transportation by truck. Delhi crude oil production sells at Louisiana Light Sweet ("LLS") pricing which generally trades at a premium to West Texas Intermediate ("WTI") crude oil pricing. This positive LLS price differential was approximately $4.00 per barrel during our fiscal year ended June 30, 2015. The differential has narrowed from past years, but we expect that a positive LLS price differential will continue, at least in the near future.
Since 2008, we had been selling crude oil from our Giddings properties (which includes our GARP® wells) to Enterprise Crude Oil LLC, a crude oil gathering, transportation, storage and marketing company. Our agreements with Enterprise Crude Oil LLC are under a normal "evergreen" sales contracts with a thirty day cancellation provision. In June 2014, we began selling crude oil from our Giddings properties to Sunoco Partners. Oil production from our Lopez Field was sold to Flint Hill Resources. We believe that other crude oil purchasers are readily available.
We sold our natural gas and natural gas liquids from our properties in the Giddings Field under the terms of normal evergreen sales contracts at competitive prices with DCP Midstream, LP, and ETC Texas Pipeline, LTD. Gas sold to DCP and ETC was processed for removal of natural gas liquids, and we received the proceeds from the sale of the NGL products less a
4
fee and certain operating expenses. We have no other business relationships with our crude oil, natural gas or natural gas liquids purchasers.
The following table sets forth purchasers of our oil and natural gas production for the years indicated:
Year Ended June 30, | ||||||||
Customer | 2015 | 2014 | 2013 | |||||
Plains Marketing L.P. (includes Delhi production) | 99 | % | 96 | % | 90 | % | ||
Enterprise Crude Oil LLC | — | % | 2 | % | 4 | % | ||
Flint Hills | — | % | 1 | % | 2 | % | ||
ETC Texas Pipeline, LTD. | — | % | 1 | % | — | % | ||
All others | 1 | % | — | % | 4 | % | ||
Total | 100 | % | 100 | % | 100 | % | ||
The loss of our purchaser at the Delhi field or disruption to pipeline transportation from the field could adversely affect our net realized pricing and potentially our near-term production levels. The loss of any of our other purchasers would not be expected to have a material adverse effect on our operations.
Market Conditions
Marketing of crude oil, natural gas, and natural gas liquids is influenced by many factors that are beyond our control, the exact effect of which is difficult to predict. These factors include changes in supply and demand, market prices, government regulation and actions of major foreign producers.
Over the past 30 years, crude oil price fluctuations have been extremely volatile, with crude oil prices varying from less than $10 to in excess of $140 per barrel. Most recently, the price of oil per barrel has dropped dramatically, particularly in the fourth quarter 2014 and continuing in 2015, by more than half since its high in June 2014. Worldwide factors such as geopolitical, macroeconomic, supply and demand, refining capacity, petrochemical production and derivatives trading, among others, influence prices for crude oil. Local factors also influence prices for crude oil and include increasing or decreasing production trends, quality differences, regulation and transportation issues unique to certain producing regions and reservoirs.
Also over the past 30 years, domestic natural gas prices have been extremely volatile, ranging from $1 to $15 per MMBTU. The spot market for natural gas, changes in supply and demand, derivatives trading, pipeline availability, BTU content of the natural gas and weather patterns, among others, cause natural gas prices to be subject to significant fluctuations. Due to the practical difficulties in transporting natural gas, local and regional factors tend to influence product prices more for natural gas than for crude oil.
Competition
The oil and natural gas industry is highly competitive for prospects, acreage and capital. Our competitors include major integrated crude oil and natural gas companies and numerous independent crude oil and natural gas companies, individuals and drilling and income programs. Many of our competitors are large, well-established companies with substantially larger operating staffs and greater capital resources than ours. Competitors are national, regional or local in scope and compete on the basis of financial resources, technical prowess or local knowledge. The principal competitive factors in our industry are expertise in given geographical and geological areas and the abilities to efficiently conduct operations, achieve technological advantages, identify and acquire economically producible reserves and obtain affordable capital.
Government Regulation
Numerous federal and state laws and regulations govern the oil and gas industry. These laws and regulations are often changed in response to changes in the political or economic environment. Compliance with this evolving regulatory burden is often difficult and costly, and substantial penalties may be incurred for noncompliance. To the best of our knowledge, we are in compliance with all laws and regulations applicable to our operations and we believe that continued compliance with existing requirements will not have a material adverse impact on us. The future annual capital cost of complying with the regulations applicable to our operations is uncertain and will be governed by several factors, including future changes to regulatory requirements which are unpredictable. However, we do not currently anticipate that future compliance with existing laws and regulations will have a materially adverse effect on our consolidated financial position or results of operations.
See "Government regulation and liability for environmental matters that may adversely affect our business and results of operations" under Item 1A. Risk Factors of this Form 10-K, for additional information regarding government regulation.
5
Insurance
We maintain insurance on our operated and non-operated properties and operations for risks and in amounts customary in the industry. Such insurance includes general liability, excess liability, control of well, operators extra expense, casualty, fraud and directors & officer's liability coverage. Not all losses are insured, and we retain certain risks of loss through deductibles, limits and self-retentions. We do not carry lost profits coverage and we do not have coverage for consequential damages.
Additional Information
We file Annual Reports on Form 10-K, Quarterly Reports on Form 10-Q, Current Reports on Form 8-K and other reports with the SEC. Our reports filed with the SEC are available free of charge to the general public through our website at www.evolutionpetroleum.com. These reports are accessible on our website as soon as reasonably practicable after being filed with, or furnished to, the SEC. This Annual Report on Form 10-K and our other filings can also be obtained by contacting: Corporate Secretary, 2500 City West Blvd, Suite 1300, Houston, Texas 77042, or calling (713) 935-0122. These reports are also available at the SEC Public Reference Room at 450 Fifth Street, N.W., Washington, D.C. 20549. The public may obtain information on the operation of the Public Reference Room by calling the SEC at 1-800-SEC-0330. The SEC also maintains a website at www.sec.gov that contains reports, proxy and information statements and other information regarding issuers that file electronically with the SEC.
Item 1A. Risk Factors
Our business involves a high degree of risk. If any of the following risks, or any risk described elsewhere in this Annual Report on Form 10-K, actually occurs, our business, financial condition or results of operations could suffer. The risks described below are not the only ones facing us. Additional risks not presently known to us or which we currently consider immaterial also may adversely affect us.
Risks related to the oil and gas industry and our Company
A substantial or extended decline in oil prices may adversely affect our business, financial condition or results of operations and our ability to meet our capital expenditure obligations and financial commitments.
The price we receive for our oil heavily influences our revenue, profitability, access to capital and future rate of growth. Oil is a commodity and its price is subject to wide fluctuations in response to relatively minor changes in supply and demand. For example, average daily prices for WTI crude oil ranged from a high of $108 per barrel to a low of $44 per barrel during our fiscal year ending June 30, 2015. Historically, the markets for oil and natural gas have been volatile. These markets will likely continue to be volatile in the future. The prices we receive for our production, and the levels of our production, depend on numerous factors beyond our control. These factors include the following:
• | worldwide and regional economic conditions impacting the global supply and demand for oil and gas; |
• | actions of OPEC; |
• | the price and quantity of imports of foreign oil and natural gas; |
• | political conditions in or affecting other oil-producing and natural gas-producing countries; |
• | the level of global oil and natural gas exploration and production; |
• | the level of global oil and natural gas inventories; |
• | localized supply and demand fundamentals of regional, domestic and international transportation availability; |
• | weather conditions and natural disasters; |
• | domestic and foreign governmental regulations; |
• | speculation as to the future price of oil and the speculative trading of oil and natural gas futures contracts; |
• | price and availability of competitors' supplies of oil and natural gas; |
• | technological advances effecting energy consumption; and |
• | the price and availability of alternative fuels. |
Substantially all of our production is sold to purchasers under short-term (less than twelve-month) contracts at market-based prices. Low oil and natural gas prices will reduce our cash flows, borrowing ability, the present value of our reserves and our ability to develop future reserves. We may be unable to obtain needed capital or financing on satisfactory terms. Low oil and natural gas prices may also reduce the amount of oil and natural gas that we can produce economically, which could lead to a decline in our oil and natural gas reserves. Because approximately 80% of our proved reserves at June 30, 2015 are crude oil reserves and 20% are natural gas liquids reserves, and almost 100% of our current production is crude oil, we are heavily impacted by movements in crude oil prices, which also influence natural gas liquids prices. To the extent that we have not
6
hedged our production with derivative contracts or fixed-price contracts, any significant and extended decline in oil and natural gas prices may adversely affect our financial position.
Our revenues are concentrated in one asset and declines in production or other events beyond our control could have a material adverse effect on our results of operations and financial results.
Over 99% of our revenues come from our royalty, mineral and working interests in the Delhi field in Louisiana and thus our current revenues are highly concentrated in this field. Any significant downturn in production, oil and gas prices, or other events beyond our control which impact the Delhi field could have a material adverse effect on our results of operations and financial results. We are not the operator of the Delhi field, and our revenues and future growth are heavily dependent on the success of operations, which we do not control.
Operating results from oil and natural gas production may decline; we may be unable to acquire and develop the additional oil and natural gas reserves that are required in order to sustain our business operations.
In general, the volumes of production from crude oil and natural gas properties decline as reserves are depleted, with the rate of decline depending on reservoir characteristics. Except to the extent we acquire additional properties containing proved reserves or conduct successful development activities, or both, our proved reserves will decline. Our production is heavily dependent on our interests in EOR production that began during March 2010 in the Delhi Field. In addition, our production will be impacted by the results of wells in which we have installed our GARP® technology and any future installations in which we are compensated with production or its equivalent. Although EOR production from proved reserves at Delhi has and is expected to grow over time and we expect to grow the number of GARP® installations, environmental or operating problems or lack of future investment at Delhi, lack of success in adding GARP® installations or a change in our GARP® compensation model without further development activities in new or existing projects or without acquisitions of producing properties, our net production of oil and natural gas could decline significantly over time, which could have a material adverse effect on our financial condition.
We have limited control over the activities on properties we do not operate.
Substantially all of our properties, namely our Delhi interests, are operated by other companies and involve third-party working interest owners. As a result, we have limited ability to influence or control the operation or future development of such properties, including compliance with environmental, safety and other regulations, or the amount of capital expenditures that we will be required to fund with respect to such properties. Operators of these properties may act in ways that are not in our best interest. Moreover, we are dependent on the other working interest owners of such projects to fund their contractual share of the capital expenditures of such projects. These limitations and our dependence on the operator and other working interest owners for these projects could cause us to incur unexpected future costs, result in lower production and materially and adversely affect our financial conditions and results of operations.
The types of resources we focus on have substantial operational risks.
Our business plan focuses on the acquisition and development of known resources in partially depleted reservoirs, naturally fractured or low permeability reservoirs, or relatively shallow reservoirs. Shallower reservoirs usually have lower pressure, which translates into fewer natural gas volumes in place. Low permeability reservoirs require more wells and substantial stimulation for development of commercial production. Naturally fractured reservoirs require penetration of sufficient undepleted fractures to establish commercial production. Depleted reservoirs require successful application of newer technology to unlock incremental reserves.
Our CO2-EOR project in the Delhi Field, operated by a subsidiary of Denbury Resources Inc., requires significant amounts of CO2 reserves, development capital and technical expertise, the sources of which to date have been committed by the operator. Although initial CO2 injection began at Delhi in November 2009, initial oil production response began in March 2010 and a large part of the capital budget has already been expended, additional capital remains to be invested to fully develop the EOR project,further increase production and maximize the value of the asset. The operator's failure to manage these and other technical, environmental, operating, strategic, financial and logistical risks may cause ultimate enhanced recoveries from the planned CO2-EOR project to fall short of our expectations in volume and/or timing. Such occurrences would have a material adverse effect on the Company, its results of operations and financial condition.
The existing well bores in which we are installing GARP® were originally drilled years or decades earlier. As such, they contain older casing or debris that could be more subject to failure, or the well files, if available, may be incomplete or incorrect. Such problems can result in the complete loss of a well or much higher costs. Expected results are based on theoretical estimates using historical data, which may not be complete or accurate, and thus such estimates may not prove accurate. Terms of compensation for installing GARP® may well change over time based on results achieved, industry acceptance, marketing efforts and other factors.
7
Our projects generally require that we acquire new leases in and around established fields or other known resources, and drill and complete wells, some of which may be horizontal, as well as negotiate the purchase of existing well bores and production equipment or install our proprietary artificial lift technology that has yet to be universally proven. Leases may not be available and required oil field services may not be obtainable on the desired schedule or at the expected costs. While the projected drilling results may be considered to be low to moderate in risk, there is no assurance as to what productive results may be obtained, if any.
Crude oil and natural gas development, re-completion of wells from one reservoir to another reservoir, restoring wells to production and drilling and completing new wells are speculative activities and involve numerous risks and substantial uncertain costs.
Our growth will be materially dependent upon the success of our future development program. Drilling for crude oil and natural gas and re-working existing wells involve numerous risks, including the risk that no commercially productive crude oil or natural gas reservoirs will be encountered. The cost of drilling, completing and operating wells is substantial and uncertain, and drilling operations may be curtailed, delayed or canceled as a result of a variety of factors beyond our control, including:
• | unexpected drilling conditions; |
• | pressure fluctuations or irregularities in formations; |
• | equipment failures or accidents; |
• | environmental events; |
• | inability to obtain or maintain leases on economic terms, where applicable; |
• | adverse weather conditions; |
• | compliance with governmental requirements; and |
• | shortages or delays in the availability of drilling rigs or crews and the delivery of equipment. |
Drilling or re-working is a highly speculative activity. Even when fully and correctly utilized, modern well completion techniques such as horizontal drilling or CO2 injection or other injectants do not guarantee that we will find and produce crude oil and/or natural gas in our wells in economic quantities. Our future drilling activities may not be successful and, if unsuccessful, such failure would have an adverse effect on our future results of operations and financial condition. We cannot assure you that our overall drilling success rate or our drilling success rate for activities within a particular geographic area will not decline.
We may also identify and develop prospects through a number of methods, some of which do not include horizontal drilling or tertiary injectants, and some of which may be unproven. The drilling and results for these prospects may be particularly uncertain. We cannot assure you that these projects can be successfully developed or that the wells discussed will, if drilled, encounter reservoirs of commercially productive crude oil or natural gas.
The loss of a large single purchaser of our oil and natural gas could reduce the competition of our production.
For the year ended June 30, 2015, one purchaser accounted for 99% of our oil and natural gas revenues. We do not currently market our share of crude oil production from the Delhi field. Although we have the right to take our working interest production in-kind, we are currently accepting terms under the Delhi operator's agreement with Plains Marketing L.P. for the delivery and pricing of our oil there. The loss of such large single purchaser for our oil and natural gas production could negatively impact the revenue we receive. We cannot assure you we could readily find other purchasers for our oil and natural gas production. In addition, the crude oil production from the Delhi field is transported by pipeline and if this pipeline transportation were disrupted and we were forced to use alternative transportation methods, our net realized pricing and potentially our near-term production levels could be adversely affected.
Our patented GARP® technology may not achieve acceptance or widespread adoption by industry.
We have developed, field tested and initiated commercialization of our artificial lift technology, GARP® (Gas Assisted Rod Pump), though it may not generate substantial value. Our further success in commercializing the technology will depend upon additional positive field tests, additional customers, acceptance by industry and our ability to defend the technology from competitors through confidentiality, trade secret and patent protection.
We may be unable to continue licensing from third parties the technologies that we use in our business operations.
As is customary in the crude oil and natural gas industry, we utilize a variety of widely available technologies in the crude oil and natural gas development and drilling process. We do not have any patents or copyrights for the technology we currently utilize, except for the registered trademark and issued patent on our GARP® artificial lift technology that is in the process of commercialization. We generally license or purchase services from the holders of such technology, or outsource the technology integral to our business from third parties. Our commercial success will depend in part on these sources of
8
technology and assumes that such sources will not infringe on the proprietary rights of others. We cannot be certain whether any third-party patents will require us to utilize or develop alternative technology or to alter our business plan, obtain additional licenses, or cease activities that infringe on third-parties' intellectual property rights. Our inability to acquire any third-party licenses, or to integrate the related third-party products into our business plan, could result in delays in development unless and until equivalent products can be identified, licensed, and integrated. Existing or future licenses may not continue to be available to us on commercially reasonable terms or at all. Litigation, which could result in substantial cost to us, may be necessary to enforce any patents licensed to us or to determine the scope and validity of third-party obligations or to protect our patent rights on GARP®.
Our crude oil and natural gas reserves are only estimates and may prove to be inaccurate.
There are numerous uncertainties inherent in estimating crude oil and natural gas reserves and their estimated values. Our reserves are only estimates that may prove to be inaccurate because of these uncertainties. Reservoir engineering is a subjective and inexact process of estimating underground accumulations of crude oil and natural gas that cannot be measured in an exact manner. Estimates of economically recoverable crude oil and natural gas reserves depend upon a number of variable factors, such as historical production from the area compared with production from other producing areas and assumptions concerning effects of regulations by governmental agencies, future crude oil and natural gas product prices, future operating costs, severance and excise taxes, development costs and work-over and remedial costs. Some or all of these assumptions may in fact vary considerably from actual results. For these reasons, estimates of the economically recoverable quantities of crude oil and natural gas attributable to any particular group of properties, classifications of such reserves based on risk of recovery, and estimates of the future net cash flows expected there from prepared by different engineers or by the same engineers but at different times, may vary substantially.
Accordingly, reserve estimates may be subject to downward or upward adjustment. Actual production, revenue and expenditures with respect to our reserves will likely vary from estimates, and such variances may be material. The information regarding discounted future net cash flows included in this report should not be considered as the current market value of the estimated crude oil and natural gas reserves attributable to our properties. The estimated discounted future net cash flows from proved reserves are based on the 12-month average price, calculated as the unweighted arithmetic average of the first-day-of-the-month price for each month within the 12-month period prior to the end of the reporting period, and costs as of the date of the estimate, while actual future prices and costs may be materially higher or lower. Actual future net cash flows also will be affected by factors such as the amount and timing of actual production, supply and demand for crude oil and natural gas, increases or decreases in consumption, and changes in governmental regulations or taxation. In addition, the 10% discount factor, which is required by the SEC to be used in calculating discounted future net cash flows for reporting purposes, is not necessarily the most appropriate discount factor based on interest rates in effect from time to time and risks associated with us or the crude oil and natural gas industry in general. PV-10 does not necessarily correspond to market value.
Regulatory and accounting requirements may require substantial reductions in reporting proven reserves.
We review on a periodic basis the carrying value of our crude oil and natural gas properties under the applicable rules of the various regulatory agencies, including the SEC. Under the full cost method of accounting that we use, the after-tax carrying value of our oil and natural gas properties may not exceed the present value of estimated future net after-tax cash flows from proved reserves, discounted at 10%. Application of this "ceiling" test requires pricing future revenues at the previous 12-month average beginning-of-month price and requires a write down of the carrying value for accounting purposes if the ceiling is exceeded. We may in the future be required to write down the carrying value of our crude oil and natural gas properties when crude oil and natural gas prices are depressed or unusually volatile. Whether we will be required to take such a charge will depend in part on the prices for crude oil and natural gas during the previous period and the effect of reserve additions or revisions and capital expenditures during such period. If a write down is required, it would result in a current charge to our earnings but would not impact our current cash flow from operating activities.
Our derivative activities could result in financial losses or could reduce our income.
To achieve more predictable cash flows and to reduce our exposure to adverse fluctuations in the prices of oil and natural gas, we currently, and may in the future, enter into derivative arrangements for a portion of our oil and natural gas production, including collars and fixed-price swaps. We have not designated any of our derivative instruments as hedges for accounting purposes and record all derivative instruments on our balance sheet at fair value. Changes in the fair value of our derivative instruments are recognized in earnings. Accordingly, our earnings may fluctuate significantly as a result of changes in the fair value of our derivative instruments. Derivative arrangements also expose us to the risk of financial loss in some circumstances, including when:
9
• | production is less than the volume covered by the derivative instruments; |
• | the counterparty to the derivative instrument defaults on its contract obligations; or |
• | there is an increase in the differential between the underlying price in the derivative instrument and actual price received. |
In addition, some of these types of derivative arrangements limit the benefit we would receive from increases in the prices for oil and natural gas and may expose us to cash margin requirements.
We may have difficulty managing future growth and the related demands on our resources and may have difficulty in achieving future growth.
Although we hope to experience growth through acquisitions and development activity, any such growth may place a significant strain on our financial, technical, operational and administrative resources. Our ability to grow will depend upon a number of factors, including:
• | our ability to identify and acquire new development or acquisition projects; |
• | our ability to develop existing properties; |
• | our ability to continue to retain and attract skilled personnel; |
• | the results of our development program and acquisition efforts; |
• | the success of our technologies; |
• | hydrocarbon prices; |
• | drilling, completion and equipment prices; |
• | our ability to successfully integrate new properties; |
• | our access to capital; and |
• | the Delhi Field operator's ability to: (i) deliver sufficient quantities of CO2 from its reserves in the Jackson Dome, secure all of the development capital necessary to fund its and our cost interests and (ii) successfully manage technical, operating, environmental, strategic and logistical development and operating risks, among other things. |
We cannot assure you that we will be able to successfully grow or manage any such growth.
Our operations require significant amounts of capital and additional financing may be necessary in order for us to continue our exploitation activities, including meeting potential future drilling obligations.
Our cash flow from our reserves may not be sufficient to fund our ongoing activities at all times. From time to time, we may require additional financing in order to carry out our oil and gas acquisitions, exploitation and development activities. Certain of our undeveloped leasehold acreage may be subject to leases that will expire unless production is established. If our revenues from our reserves decrease as a result of lower oil and natural gas prices or otherwise, it will affect our ability to expend the necessary capital to replace our reserves or to maintain our current production. If our cash flow from operations is not sufficient to satisfy our capital expenditure requirements, there can be no assurance that additional debt or equity financing will be available to meet these requirements or available to us on favorable terms.
We may be subject to risks in connection with acquisitions because of uncertainties in evaluating recoverable reserves, well performance and potential liabilities, as well as uncertainties in forecasting oil and gas prices and future development, production and marketing costs, and the integration of significant acquisitions may be difficult.
We periodically evaluate acquisitions of reserves, properties, prospects and leaseholds and other strategic transactions that appear to fit within our overall business strategy. The successful acquisition of producing properties requires an assessment of several factors, including:
• | recoverable reserves |
• | future oil and natural gas prices and their appropriate differentials; |
• | development and operating costs |
• | potential for future drilling and production; |
• | validity of the seller's title to properties, which may be less than expected at closing; and |
• | potential environmental issues, litigation and other liabilities. The accuracy of these assessments is inherently uncertain. In connection with these assessments, we perform a review of the subject properties that we believe to be generally consistent with industry practices. Our review will not reveal all existing or potential problems nor will it permit us to become sufficiently familiar with the properties to fully assess their deficiencies and potential recoverable reserves. Inspections may not always be performed on every well, and environmental problems are not necessarily |
10
observable even when an inspection is undertaken. Even when problems are identified, the seller may be unwilling or unable to provide effective contractual protection against all or part of the problems. We often are not entitled to contractual indemnification for environmental liabilities or title defects in excess of the amounts claimed by us before closing and acquire properties on an “as is” basis. Indemnification from the sellers will generally be effective only during the twelve-month period after the closing and subject to certain dollar limitations and minimums. We may not be able to collect on such indemnification because of disputes with the sellers or their inability to pay. Moreover, there is a risk that we could ultimately be liable for unknown obligations related to acquisitions, which could materially adversely affect our financial condition, results of operations or cash flows.
Significant acquisitions and other strategic transactions may involve other risks, including:
• | diversion of management's attention to evaluating, negotiating and integrating significant acquisitions and strategic transactions; |
• | the challenge and cost of integrating acquired operations, information management and other technology systems and business cultures with those of our operations while carrying on our ongoing business; |
• | difficulty associated with coordinating geographically separate organizations; |
• | an inability to secure, on acceptable terms, sufficient financing that my be required in connection with expanded operations and unknown liabilities; and |
• | the challenge of attracting and retaining personnel associated with acquired operations. |
The process of integrating assets could cause an interruption of, or loss of momentum in, the activities of our business. Members of our senior management may be required to devote considerable amounts of time to this integration process, which will decrease the time they will have to manage our business. If our senior management is not able to effectively manage the integration process, or if any significant business activities are interrupted as a result of the integration process, our business could suffer. In addition, even if we successfully integrate the assets acquired in an acquisition, it may not be possible to realize the full benefits we may expect in estimated proved reserves, production volume, cost savings from operating synergies or other benefits anticipated from an acquisition or realize these benefits within the expected time frame.
Government regulation and liability for environmental matters may adversely affect our business and results of operations.
Crude oil and natural gas operations are subject to extensive federal, state and local government regulations, which may be changed from time to time. Matters subject to regulation include discharge permits for drilling operations, drilling bonds, reports concerning operations, the spacing of wells, unitization and pooling of properties and taxation. From time to time, regulatory agencies have imposed price controls and limitations on production by restricting the rate of flow of crude oil and natural gas wells below actual production capacity in order to conserve supplies of crude oil and natural gas. There are federal, state and local laws and regulations primarily relating to protection of human health and the environment applicable to the development, production, handling, storage, transportation and disposal of crude oil and natural gas, by-products thereof and other substances and materials produced or used in connection with crude oil and natural gas operations. In addition, we may inherit liability for environmental damages, whether actual or not, caused by previous owners of property we purchase or lease or nearby properties. As a result, we may incur substantial liabilities to third parties or governmental entities. We are also subject to changing and extensive tax laws, the effects of which cannot be predicted. The implementation of new, or the modification of existing, laws or regulations could have a material adverse effect on us, such as diminishing the demand for our products through legislative enactment of proposed new penalties, fines and/or taxes on carbon that could have the effect of raising prices to the end user.
For example, currently proposed federal legislation, that, if adopted, could adversely affect our business, financial condition and results of operations, includes the following:
• | Taxes. President Obama’s budget proposal for fiscal year 2016 recommended the elimination of certain key United States federal income tax preferences currently available to oil and natural gas exploration and production companies. These changes include, but are not limited to, (i) the repeal of the percentage depletion allowance for oil and gas properties, (ii) the elimination of current deductions for intangible drilling and development costs, (iii) the elimination of the deduction for United States production activities for oil and gas production, and (iv) the extension of the amortization period for certain geological and geophysical expenditures. It is unclear whether any such changes or similar changes will be enacted or, if enacted, how soon any such changes could become effective. The passage of this legislation or any other similar changes in U.S. federal income tax law could affect certain tax deductions that are currently available with respect to oil and gas exploration and production. Any such changes could have an adverse effect on our financial position, results of operations and cash flows; and |
11
• | Hydraulic Fracturing. The U.S. Congress, the EPA and various states are currently considering legislation that could adversely affect the use of the hydraulic-fracturing process. Currently, regulation of hydraulic fracturing is primarily conducted at the state level through permitting and other compliance requirements. Any proposed legislation, if adopted, could establish an additional level of regulation, permitting and restrictions at the federal level that could adversely affect the development of unconventional oil and natural gas resources. |
Our insurance may not protect us against all of the operating risks to which our business is exposed.
The crude oil and natural gas business involves numerous operating hazards such as well blowouts, mechanical failures, explosions, uncontrollable flows of crude oil, natural gas or well fluids, fires, formations with abnormal pressures, hurricanes, flooding, pollution, releases of toxic gas and other environmental hazards and risks, which can result in (i) damage to or destruction of wells and/or production facilities, (ii) damage to or destruction of formations, (iii) injury to persons, (iv) loss of life, or (v) damage to property, the environment or natural resources. While we carry general liability, control of well, and operator's extra expense coverage typical in our industry, we are not fully insured against all risks incident to our business. Environmental events similar to that experienced in the Delhi field in June 2013 could defer revenue, increase operating costs and maintenance capital expenditures.
The loss of key personnel could adversely affect us.
We depend to a large extent on the services of certain key management personnel, including our executive officers, the loss of any of whom could have a material adverse effect on our operations. In particular, our future success is dependent upon Robert S. Herlin, our Chairman and Chief Executive Officer, Randall D. Keys, our President, Chief Financial Officer and Treasurer, and Daryl V. Mazzanti, our Senior Vice President of Operations, for sourcing, evaluating and closing deals, capital raising, and oversight of development and operations. Presently, the Company is not a beneficiary of any key man insurance.
Oil field service and materials' prices may increase, and the availability of such services and materials may be inadequate to meet our needs.
Our business plan to develop or redevelop crude oil and natural gas resources requires third party oilfield service vendors and various material providers, which we do not control. We also rely on third-party carriers for the transportation and distribution of our production. As our production increases, so does our need for such services and materials. Generally, we do not have long-term agreements with our service and materials providers. Accordingly, there is a risk that any of our service providers could discontinue servicing our crude oil and natural gas fields for any reason or we may not be able to source the materials we need. Any delay in locating, establishing relationships, and training our sources could result in production shortages and maintenance problems, with a resulting loss of revenue to us. In addition, if costs for such services and materials increase, it may render certain or all of our projects uneconomic, as compared to the earlier prices we may have assumed when deciding to redevelop newly purchased or existing properties. Further adverse economic outcomes may result from the long lead times often necessary to execute and complete our redevelop plans.
We cannot market the crude oil and natural gas that we produce without the assistance of third parties.
The marketability of the crude oil and natural gas that we produce depends upon the proximity of our reserves to, and the capacity of, facilities and third-party services, including crude oil and natural gas gathering systems, pipelines, trucking or terminal facilities, and processing facilities necessary to make the products marketable for end use. The unavailability or lack of capacity of such services and facilities could result in the shut-in of producing wells or the delay or discontinuance of development plans for properties. A shut-in or delay or discontinuance could adversely affect our financial condition.
We face strong competition from larger oil and gas companies.
Our competitors include major integrated crude oil and natural gas companies and numerous independent crude oil and natural gas companies, individuals and drilling and income programs. Many of our competitors are large, well-established companies with substantially larger operating staffs and greater capital resources than ours. We may not be able to successfully conduct our operations, evaluate and select suitable properties and consummate transactions in this highly competitive environment. Specifically, these larger competitors may be able to pay more for development projects and productive crude oil and natural gas properties and may be able to define, evaluate, bid for and purchase a greater number of properties and prospects than our financial or human resources permit. In addition, such companies may be able to expend greater resources on hiring contract service providers, obtaining oilfield equipment and acquiring the existing and changing technologies that we believe are and will be increasingly important to attaining success in our industry.
12
We are, and in the future may become, involved in legal proceedings related to our Delhi interest or other properties or operations and, as a result, may incur substantial costs in connection with those proceedings.
In December 2013 we filed a lawsuit against the operator of the Delhi field alleging that the operator improperly charged the payout account for capital expenditures and costs of capital, failed to adhere to preferential rights to participate in acquisitions within the defined area of mutual interest, breached the promises to assume environmental liabilities and fully indemnify us from such costs, and other breaches. We are seeking declaration of the validity of the 2006 agreements and recovery of damages and attorneys’ fees. The operator subsequently filed counterclaims, including the assertion that we owed it additional revenue interests pursuant to the 2006 agreements and that the transfer of our reversionary working interest from our wholly owned subsidiary to our parent corporation and subsequently to another wholly owned subsidiary breached their preferential right to purchase. We have denied their counterclaims as being without merit and not timely. We may incur significant legal costs in this matter and the outcome is uncertain.
Ownership of our oil, gas and mineral production depends on good title to our property.
Good and clear title to our oil, gas and mineral properties is important to our business. Although title reviews will generally be conducted prior to the purchase of most oil, gas and mineral producing properties or the commencement of drilling wells, such reviews do not assure that an unforeseen defect in the chain of title will not arise to defeat our claim which could result in a reduction or elimination of the revenue received by us from such properties.
Poor general economic, business, or industry conditions may have a material adverse effect on our results of operations, liquidity, and financial condition.
During the last few years, concerns over inflation, energy costs, declining oil and gas prices, geopolitical issues, the availability and cost of credit, the U.S. mortgage market, uncertainties with regard to European sovereign debt, the slowdown in economic growth in large emerging and developing markets, such as China, and other issues have contributed to increased economic uncertainty and diminished expectations for the global economy. Concerns about global economic conditions have had a significant adverse impact on domestic and international financial markets and commodity prices. If uncertain or poor economic, business or industry conditions in the United States or abroad remain prolonged, demand for petroleum products could diminish or stagnate, which could impact the price at which we can sell our oil, natural gas, and NGLs, affect our vendors', suppliers' and customers' ability to continue operations, and ultimately adversely impact our results of operations, liquidity, and financial condition.
Risks Associated with Our Stock
Our stock price has been and may continue to be volatile.
Our common stock is relatively thinly traded and the market price has been, and is likely to continue to be, volatile. For example, during the fiscal year ending June 30, 2015, our stock price as traded on the NYSE MKT ranged from $5.68 to $11.19. The variance in our stock price makes it difficult to forecast with any certainty the stock price at which an investor may be able to buy or sell shares of our common stock. The market price for our common stock could be subject to fluctuations as a result of factors that are out of our control, such as:
• | actual or anticipated variations in our results of operations; |
• | naked short selling of our common stock and stock price manipulation; |
• | changes or fluctuations in the commodity prices of crude oil and natural gas; |
• | general conditions and trends in the crude oil and natural gas industry; |
• | redemption demands on institutional funds that hold our stock; and |
• | general economic, political and market conditions. |
Our executive officers, directors and affiliates may be able to control the election of our directors and all other matters submitted to our stockholders for approval.
Our executive officers and directors, in the aggregate, beneficially own approximately 3.2 million shares, or approximately 10% of our beneficial common stock base. JVL Advisors LLC controls approximately 4.9 million shares or approximately 15% of our outstanding common stock. As a result, these holders could exercise significant influence over matters submitted to our stockholders for approval (including the election and removal of directors and any merger, consolidation or sale of all or substantially all of our assets). This concentration of ownership may have the effect of delaying, deferring or preventing a change in control of our company, impede a merger, consolidation, takeover or other business combination involving our company or discourage a potential acquirer from making a tender offer or otherwise attempting to obtain control of our company, which in turn could have an adverse effect on the market price of our common stock.
13
The market for our common stock is limited and may not provide adequate liquidity.
Our common stock is relatively thinly traded on the NYSE MKT. In the fiscal year ending June 30, 2015, the actual daily trading volume in our common stock ranged from 20,800 shares of common stock to a high of 759,200 shares of common stock traded. On most days, this trading volume means that there is relatively limited liquidity in our shares of common stock. Selling our shares is more difficult because smaller quantities of shares are bought and sold and news media coverage about us is limited. These factors result in a limited trading market for our common stock and therefore holders of our stock may be unable to sell shares purchased, should they desire to do so.
If securities or industry analyst do not publish research reports about our business, or if they downgrade our stock, the price of our common stock could decline.
Small, relatively unknown companies can achieve visibility in the trading market through research and reports that industry or securities analysts publish. To our knowledge there are three independent analysts that cover our company. The limited number of published reports by independent securities analysts could limit the interest in our common stock and negatively affect our stock price. We do not have any control over the research and reports these analysts publish or whether they will be published at all. If any analyst who does cover us downgrades our stock, our stock price could decline. If any analyst ceases coverage of our company or fails to regularly publish reports on us, we could lose visibility in the financial markets, which in turn could cause our stock price to decline.
The issuance of additional common stock and preferred stock could dilute existing stockholders.
We currently have in place a registration statement which allows the Company to publicly issue up to $500 million of additional securities, including debt, common stock, preferred stock, and warrants. At any time we may make private offerings of our securities. The shelf registration is intended to provide greater flexibility to the company in financing growth or changing our capital structure. We are authorized to issue up to 100,000,000 shares of common stock. To the extent of such authorization, our board of directors has the ability, without seeking stockholder approval, to issue additional shares of common stock in the future for such consideration as our board may consider sufficient. The issuance of additional common stock in the future would reduce the proportionate ownership and voting power of the common stock now outstanding. We are also authorized to issue up to 5,000,000 shares of preferred stock, the rights and preferences of which may be designated in series by our board of directors, of which, at least 317,319 shares of Series A Preferred Stock are issued and outstanding as of September 1, 2015. Such designation of new series of preferred stock may be made without stockholder approval, and could create additional securities which would have dividend and liquidation preferences over the common stock now outstanding. Preferred stockholders could adversely affect the rights of holders of common stock by:
• | exercising voting, redemption and conversion rights to the detriment of the holders of common stock; |
• | receiving preferences over the holders of common stock regarding our surplus funds in the event of our dissolution, liquidation or the payment of dividends to Preferred stockholders; |
• | delaying, deferring or preventing a change in control of our company; and |
• | discouraging bids for our common stock. |
Our Series A Preferred Stock is thinly traded and has no stated maturity date.
The shares of Series A Preferred Stock were listed for trading on the NYSE MKT under the symbol "EPM.PR.A" on July 5, 2011 and are thinly traded on the NYSE MKT. Since the securities have no stated maturity date, investors seeking liquidity will be limited to selling their shares in the secondary market. An active trading market for the shares may not develop or, even if it develops, may not last, in which case the trading price of the shares could be adversely affected and your ability to transfer your shares of Series A Preferred Stock will be limited. We have the right to redeem all shares of Series A Preferred Stock at face value plus accrued dividends at any time.
The market value of our Series A Preferred Stock could be adversely affected by various factors.
The trading price of the shares of Series A Preferred Stock may depend on many factors, including:
• | market liquidity; |
• | prevailing interest rates; |
• | optional redemption by us; |
• | the market for similar securities; |
• | general economic conditions; and |
• | our financial condition, performance and prospects. |
14
For example, higher market interest rates could cause the market price of the Series A Preferred Stock to decrease.
We could be prevented from paying dividends on our Series A Preferred Stock.
Although dividends on the Series A Preferred Stock are cumulative and arrearages will accrue until paid, preferred stockholders will only receive cash dividends on the Series A Preferred Stock if we have funds legally available for the payment of dividends and such payment is not restricted or prohibited by law, the terms of any senior shares or any documents governing our indebtedness. Our business may not generate sufficient cash flow from operations to enable us to pay dividends on the Series A Preferred Stock when payable. In addition, existing or future debt, credit facility arrangements, contractual covenants or arrangements we enter into may restrict or prevent future dividend payments. Accordingly, there is no guarantee that we will be able to pay any cash dividends on our Series A Preferred Stock.
Furthermore, in some circumstances, we may pay dividends in stock rather than cash, and our stock price may be depressed at such time.
Our Series A Preferred Stock has not been rated and will be subordinated to all of our existing and future debt.
Our Series A Preferred Stock has not been rated by any nationally recognized statistical rating organization. In addition, with respect to dividend rights and rights upon our liquidation, winding-up or dissolution, the Series A Preferred Stock will be subordinated to any existing and future debt and all future capital stock designated as senior to the Series A Preferred Stock. We may also incur additional indebtedness in the future to finance potential acquisitions or the development of new properties and the terms of the Series A Preferred Stock do not require us to obtain the approval of the holders of the Series A Preferred Stock prior to incurring additional indebtedness. As a result, our existing and future indebtedness may be subject to restrictive covenants or other provisions that may prevent or otherwise limit our ability to make dividend or liquidation payments on our Series A Preferred Stock. Upon our liquidation, our obligations to our creditors would rank senior to our Series A Preferred Stock and would be required to be paid before any payments could be made to holders of our Series A Preferred Stock.
We could be prevented from continuing to pay dividends on our Common Stock.
Our board of directors declared cash dividends on our common stock for the first time in December 2013 and we have declared and paid quarterly cash dividends since that time. However, there is no certainty that dividends will be declared by the board of directors in the future. Any payment of cash dividends on our common stock in the future will be dependent upon the amount of funds legally available, our earnings, if any, our financial condition and business plan, restrictions contained in our Series A Preferred Stock and any debt instruments, contractual covenants or arrangements we may enter into, our anticipated capital requirements and other factors that our board of directors may think are relevant. Accordingly, there is no guarantee that we will be able to continue to pay cash dividends on our common stock.
Item 1B. Unresolved Staff Comments
None.
Item 2. Properties
Company Location
Our corporate headquarters are located at 2500 CityWest Boulevard, Suite 1300, Houston, Texas. We entered into a sublease agreement, effective on March 1, 2007, to rent approximately 8,400 square feet of Class "A" office space in the Westchase District area in West Houston. The current monthly base rent is $13,251, having escalated from a monthly base rate of $11,507 in August 2011. The sublease expires by its term on July 31, 2016.
Oil & Gas Properties
Additional detailed information describing the types of properties we own can be found in "Business Strategy" under Item 1. Business of this Form 10-K.
Estimated Oil and Natural Gas Reserves and Estimated Future Net Revenues
The SEC sets rules related to reserve estimation and disclosure requirements for oil and natural gas companies. These rules require disclosure of oil and gas proved reserves by significant geographic area, using the 12-month average price, calculated as the unweighted arithmetic average of the first-day-of-the-month price for each month within the 12-month period prior to the end of the reporting period, rather than year-end prices, and allows the use of new technologies in the determination of proved reserves if those technologies have been demonstrated empirically to lead to reliable conclusions about reserve
15
volumes. Subject to limited exceptions, the rules also require that proved undeveloped reserves may only be classified as such if a development plan has been adopted indicating that they are scheduled to be drilled within five years.
There are numerous uncertainties inherent in estimating quantities of proved reserves and estimates of reserves quantities and values must be viewed as being subject to significant change as more data about the properties becomes available.
Estimates of Probable and Possible reserves are inherently imprecise. When producing an estimate of the amount of oil and natural gas that is recoverable from a particular reservoir, Probable reserves are those additional reserves that are less certain to be recovered than Proved reserves but which, together with Proved reserves, are as likely as not to be recovered. Possible reserves are even less certain and generally require only a 10% or greater probability of being recovered. All categories of reserves are continually subject to revisions based on production history, results of additional exploration and development, price changes and other factors. Estimates of Probable and Possible reserves are by their nature much more speculative than estimates of Proved reserves and are subject to greater uncertainties, and accordingly the likelihood of recovering those reserves is subject to substantially greater risk. These three reserve categories and net present worth discounted at 10% relating to each category have not been adjusted to different levels of recovery risk among these categories and are therefore not comparable and not are meaningfully combined.
Estimated future net revenues discounted at 10% or PV-10 is a financial measure that is not recognized by GAAP. We believe that the presentation of the non-GAAP financial measure of PV-10 provides useful information to investors because it is widely used by analysts and investors in evaluating oil and natural gas companies, and that it is relevant and useful for evaluating the relative monetary significance of oil and natural gas properties. Further, analysts and investors may utilize the measure as a basis for comparison of the relative size and value of our reserves to other companies' reserves. We also use this pre-tax measure when assessing the potential return on investment related to oil and natural gas properties and in evaluating acquisition opportunities. Because there are many unique factors that can impact an individual company when estimating the amount of future income taxes to be paid, we believe the use of a pre-tax measure is valuable for evaluating our Company. PV-10 is not a measure of financial or operating performance under GAAP, nor is it intended to represent the current market value of our estimated oil and natural gas reserves. PV-10 should not be considered in isolation or as a substitute for the Standardized Measure as defined under GAAP, and reconciled herein.
Summary of Oil & Gas Reserves for Fiscal Year Ended 2015
Our proved and probable reserves at June 30, 2015, denominated in equivalent barrels using six MCF of gas and 42 gallons of natural gas liquids to one barrel of oil conversion ratio, were estimated by our independent petroleum engineer, DeGolyer and MacNaughton ("D&M"). D&M was selected for our interests in the Delhi Field due to their expertise in CO2-EOR projects and to ensure consistency with the operator who has utilized D&M for their reserves estimates in the Delhi Field. We also chose to have D&M estimate our Giddings properties beginning in 2014 in order to simplify and consolidate our reserve reporting. D&M has significant expertise in this region as well. The scope and results of their procedures are summarized in a letter from the firm, which is included as exhibit 99.4 to this Annual Report on Form 10-K.
The following table sets forth our estimated proved and probable reserves as of June 30, 2015. See Note 22 to the consolidated financial statements, where additional unaudited reserve information is provided. The NYMEX previous 12-month unweighted arithmetic average first-day-of-the-month price used to calculate estimated revenues was $71.88 per barrel of crude oil and $3.44 per MMbtu of natural gas. The price of natural gas liquids was based on the historical price received, if no historical received price is available, historical pricing in the area. Pricing differentials were applied to all properties, on an individual property basis. Quality adjustments have been applied based on actual BTU factors for each well and a shrinkage factor has been applied based on production volumes versus actual sales volumes.
16
June 30, 2015
Reserve Category | Oil (MBbls) | NGLs (MBbls) | Natural Gas (MMcf) | Total Reserves (MBOE) | PV-10 | ||||||||||
PROVED | |||||||||||||||
Developed (59% of Proved) | 7,347 | 2 | 5 | 7,350 | $ | 189,212,263 | |||||||||
Undeveloped (41% of Proved) | 2,665 | 2,432 | — | 5,096 | 29,494,234 | ||||||||||
TOTAL PROVED | 10,012 | 2,434 | 5 | 12,446 | $ | 218,706,497 | |||||||||
Product Mix | 80 | % | 20 | % | — | % | 100 | % | |||||||
PROBABLE | |||||||||||||||
Developed (43% of Probable) | 4,034 | — | — | 4,034 | $ | 38,266,787 | |||||||||
Undeveloped (57% of Probable) | 3,376 | 1,929 | — | 5,305 | 34,029,936 | ||||||||||
TOTAL PROBABLE | 7,410 | 1,929 | — | 9,339 | $ | 72,296,723 | |||||||||
Product Mix | 79 | % | 21 | % | — | % | 100 | % | |||||||
POSSIBLE | |||||||||||||||
Developed (55% of Possible) | 1,625 | — | — | 1,625 | $ | 9,108,736 | |||||||||
Undeveloped (45% of Possible) | 730 | 599 | — | 1,329 | 4,526,868 | ||||||||||
TOTAL POSSIBLE | 2,355 | 599 | — | 2,954 | $ | 13,635,604 | |||||||||
Product Mix | 80 | % | 20 | % | — | % | 100 | % | |||||||
The following tables present a reconciliation of changes in our proved and probable reserves by major property, on the basis of equivalent MBOE quantities.
Reconciliation of Changes in Proved Reserves by Major Property
Delhi Field | Giddings Field | Proved Total | ||||||
Proved reserves, MBOE | MBOE | MBOE | MBOE | |||||
June 30, 2014 | 13,117.4 | 172.1 | 13,289.5 | |||||
Production | (448.2 | ) | (4.6 | ) | (452.8 | ) | ||
Revisions | (255.4 | ) | (134.9 | ) | (390.3 | ) | ||
Sales of minerals in place | — | — | — | |||||
Improved recovery, extensions and discoveries | — | — | — | |||||
June 30, 2015 | 12,413.8 | 32.6 | 12,446.4 | |||||
Reconciliation of Changes in Probable Reserves by Major Property
Delhi Field | Giddings Field | Probable Total | ||||||
Probable reserves, MBOE | MBOE | MBOE | MBOE | |||||
June 30, 2014 | 9,466.9 | — | 9,466.9 | |||||
Revisions | (127.5 | ) | — | (127.5 | ) | |||
Sales of minerals in place | — | — | — | |||||
Improved recovery, extensions and discoveries | — | — | — | |||||
June 30, 2015 | 9,339.4 | — | 9,339.4 | |||||
Reconciliation of PV-10 to the Standardized Measure of Discounted Future Net Cash Flows
The following table provides a reconciliation of PV-10 of our proved properties to the Standardized Measure as shown in Note 22 of the consolidated financial statements.
17
For the Years Ended June 30, | |||||||
2015 | 2014 | ||||||
Estimated future net revenues | $ | 448,113,943 | $ | 671,972,966 | |||
10% annual discount for estimated timing of future cash flows | 229,407,446 | 352,227,569 | |||||
Estimated future net revenues discounted at 10% (PV-10) | 218,706,497 | 319,745,397 | |||||
Estimated future income tax expenses discounted at 10% | (59,509,958 | ) | (93,667,725 | ) | |||
Standardized Measure | $ | 159,196,539 | $ | 226,077,672 | |||
The following table provides a reconciliation of PV-10 of each of our proved properties to the Standardized Measure as shown in Note 22 of the consolidated financial statements.
For the Years Ended June 30, | |||||||
2015 | 2014 | ||||||
Delhi Field | $ | 218,320,579 | $ | 318,076,654 | |||
Giddings Field | 385,918 | 1,668,743 | |||||
Estimated future net revenues discounted at 10% (PV-10) | $ | 218,706,497 | $ | 319,745,397 | |||
Estimated future income tax expenses discounted at 10% | (59,509,958 | ) | (93,667,725 | ) | |||
Standardized Measure | $ | 159,196,539 | $ | 226,077,672 | |||
Additional information about the properties we own can be found in Item 1. Business.
Internal Controls Over Reserves Estimation Process and Qualifications of Technical Persons with Oversight for the Company's Overall Reserve Estimation Process
Our policies regarding internal controls over reserve estimates require reserves to be prepared by an independent engineering firm under the supervision of our Chief Executive Officer and Senior Vice President of Operations and to be in compliance with generally accepted petroleum engineering and evaluation principles and definitions and guidelines established by the SEC. Our Chief Executive Officer holds B.S. and M.E. degrees from Rice University in chemical engineering and earned an M.B.A. from Harvard University. He has over 30 years of experience in engineering, energy transactions, operations and finance with small independents, larger independents and major integrated oil companies. Our Senior Vice President of Operations has over 25 years of experience in oil and gas operations and holds a Bachelor of Science in Petroleum Engineering degree from the University of Oklahoma at Norman. The reserve information in this filing is based on estimates prepared by DeGoyler and MacNaughton, our independent engineering firm. The person responsible for preparing the reserve report is a Registered Professional Engineer in the State of Texas and a firm Senior Vice President. He holds a Bachelor of Science degree in Petroleum Engineering awarded in 1974 from Texas A&M University and has over 40 years of oil and gas reservoir experience. We provide our engineering firm with property interests, production, current operating costs, current production prices and other information. This information is reviewed by our Senior Vice President of Operations and our Chief Executive Officer to ensure accuracy and completeness of the data prior to submission to our independent engineering firm. The scope and results of our independent engineering firm's procedures, as well as their professional qualifications, are summarized in the letter included as exhibit 99.4 to this Annual Report on Form 10-K.
Proved Undeveloped Reserves
Our proved undeveloped reserves were 5,097 MBOE at June 30, 2015 with associated future development costs of approximately $47.6 million. The 222 MBOE decrease in proved undeveloped reserves from 5,319 MBOE as of June 30, 2014 is primarily due to re-designing the gas plant and the economic decision to consume recovered natural gas internally to lower Delhi Field lease operating expense instead of selling to third parties resulting in a 404 MBOE natural gas reserve decrease partially offset by a 185 MBOE increase from better NGL recovery.
The initial assignment of proved undeveloped reserves in the Delhi Field was made on June 30, 2010, which involved a large scale CO2 enhanced oil recovery project. The operator’s development plans for the field have remained essentially unchanged and were originally scheduled to be completed by June 30, 2015, within five years from the initial recording of such proved reserves. The field is approximately 59% developed as of June 30, 2015. However, as a result of the adverse fluid release event in the field in June 2013 and the resultant delay in reversion of our working interest, the full development of the
18
field is now planned to continue over next four fiscal years and is expected to be completed by December 31, 2018, approximately seven and one half years after the initial recording of proved reserves. The addition of the gas plant to recover natural gas liquids and methane has required additional planning and has resulted in a prudent delay in the full development of the field. Given the nature of CO2 EOR projects, we believe that the undeveloped reserves in the Delhi Field satisfy the conditions to continue to be included as proved undeveloped reserves because (1) we have established and continue to follow the previously adopted development plan for this project; (2) we have significant ongoing development activities at this project and (3) the operator has a historical record of completing the development of comparable long-term projects.
Sales Volumes, Average Sales Prices and Average Production Costs
The following table shows the Company's sales volumes and average sales prices received for crude oil, natural gas liquids, and natural gas for the periods indicated:
Year Ended June 30, 2015 | Year Ended June 30, 2014 | Year Ended June 30, 2013 | |||||||||||||||||||||
Product | Volume | Price | Volume | Price | Volume | Price | |||||||||||||||||
Crude oil (Bbls) | 450,713 | $ | 61.59 | 169,783 | $ | 102.84 | 196,379 | $ | 105.34 | ||||||||||||||
Natural gas liquids (Bbls) | 1,358 | $ | 27.43 | 3,516 | $ | 33.32 | 7,272 | $ | 34.81 | ||||||||||||||
Natural gas (Mcf) | 7,981 | $ | 3.33 | 26,655 | $ | 3.60 | 139,006 | $ | 2.95 | ||||||||||||||
Average price per BOE* | 453,401 | $ | 61.37 | 177,742 | $ | 99.43 | 226,819 | $ | 94.13 | ||||||||||||||
Production costs | Amount | per BOE | Amount | per BOE | Amount | per BOE | |||||||||||||||||
Production costs, excluding ad valorem and production taxes | $ | 9,321,271 | $ | 20.56 | $ | 1,156,011 | $ | 6.50 | $ | 1,713,833 | $ | 7.56 | |||||||||||
Total production costs, including ad valorem and production taxes | $ | 9,335,244 | $ | 20.59 | $ | 1,193,573 | $ | 6.72 | $ | 1,780,738 | $ | 7.85 | |||||||||||
* BOE computed on units of production using a six to one conversion ratio of MCF's to barrels.
Drilling Activity
The following table sets forth our drilling activity during the past three fiscal years. During fiscal year 2015 and 2014, we did not drill any new wells. During fiscal 2013, we completed 2 gross and 0.8 net wells in Kay County, Oklahoma.
Year Ended June 30, | |||||||||||||||||
2015 | 2014 | 2013 | |||||||||||||||
Gross | Net | Gross | Net | Gross | Net | ||||||||||||
Productive wells drilled | |||||||||||||||||
Development | — | — | — | — | — | — | |||||||||||
Exploratory | — | — | — | — | 2.0 | 0.8 | |||||||||||
Total | — | — | — | — | 2.0 | 0.8 | |||||||||||
Nonproductive dry wells drilled | |||||||||||||||||
Development | — | — | — | — | 1.0 | 0.2 | |||||||||||
Exploratory | — | — | — | — | — | — | |||||||||||
Total | — | — | — | — | 1.0 | 0.2 | |||||||||||
Present Activities
During fiscal year 2015, we jointly commenced, with the field operator, the construction of a natural gas liquids ("NGL") recovery plant in the Delhi Field, which will extract and sell NGL's from the field. In addition to the value of these hydrocarbon products, the increased purity of the CO2 stream re-injected into the field should result in significant operational benefits to the CO2 flood.
During fiscal year 2015, we plugged and abandoned three legacy wells in the Giddings Field that had been shut-in in past years.
19
For further discussion, see "Highlights for our fiscal year 2015" and "Capital Budget" under Item 7. Management's Discussion and Analysis of Financial Condition and Results of Operations of this Form 10-K.
Delivery Commitments
As of June 30, 2015, we are not committed to provide a fixed and determinable quantity of oil, NGLs or gas under existing agreements.
Productive Wells
The following table sets forth the number of productive oil and gas wells in which we owned a working interest as of June 30, 2015.
Company Operated | Non-Operated | Total | |||||||||||||||
Gross | Net | Gross | Net | Gross | Net | ||||||||||||
Crude oil | 3 | 2.9 | 86 | 20.6 | 89 | 23.5 | |||||||||||
Natural gas | — | — | — | — | — | — | |||||||||||
Total | 3 | 2.9 | 86 | 20.6 | 89 | 23.5 | |||||||||||
Acreage Data
The following table sets forth certain information regarding our developed and undeveloped lease acreage as of June 30, 2015. Developed acreage refers to acreage on which wells have been drilled or completed to a point that would permit production of oil and gas in commercial quantities. Undeveloped acreage refers to acreage on which wells have not been drilled or completed to a point that would permit production of oil and gas in commercial quantities whether or not the acreage contains proved reserves.
Field | Developed Acreage | Undeveloped Acreage | Total | ||||||||||||||
Gross | Net | Gross | Net | Gross | Net | ||||||||||||
Delhi Field, Louisiana* | 13,636 | 3,257 | — | — | 13,636 | 3,257 | |||||||||||
Giddings Field, Texas** | 2,168 | 2,134 | — | — | 2,168 | 2,134 | |||||||||||
Total | 15,804 | 5,391 | — | — | 15,804 | 5,391 | |||||||||||
Our developed acreage includes 13,636 gross (3,257 net) acres in Delhi field, which is being developed using CO2-EOR operations. We own a 23.9% working interest and a 7.4% royalty interest, combined this results in a 26.4% net revenue interest in Delhi. We are not the operator of the EOR project. In addition, our developed acreage includes 2,168 gross (2,134 net) in the Giddings Field comprising of a 100% working interest in two producing wells, 99% working interest in one well subject to a back-in reversion of 22.5%.
*Includes from the surface of the earth to the top of the Massive Anhydride, less and except the Delhi Holt Bryant CO2 and Mengel Units.
**Excludes acreage for overriding royalty interests retained in various formations in the Giddings Field area.
For more complete information regarding current year activities, including crude oil and natural gas production, refer to Item 7. Management's Discussion and Analysis of Financial Condition and Results of Operations of this Form 10-K.
Item 3. Legal Proceedings
See Note 17—Commitments and Contingencies under Item 8. Financial Statements for a description of legal proceedings, which is incorporated herein by reference.
Item 4. Mine Safety Disclosures
Not Applicable.
20
PART II
Item 5. Market for Registrant's Common Equity, Related Stockholder Matters and Issuer Purchases of Equity Securities
Common Stock
Our common stock is currently traded on the NYSE MKT under the ticker symbol "EPM". The following table shows, for each quarter of the fiscal years ended June 30, 2015 and 2014, the high and low sales prices for EPM as reported by the NYSE MKT.
NYSE MKT: EPM
2015: | High | Low | |||||
Fourth quarter ended June 30, 2015 | $ | 7.97 | $ | 5.77 | |||
Third quarter ended March 31, 2015 | $ | 8.10 | $ | 5.68 | |||
Second quarter ended December 31, 2014 | $ | 10.25 | $ | 6.50 | |||
First quarter ended September 30, 2014 | $ | 11.19 | $ | 8.95 | |||
2014: | High | Low | |||||
Fourth quarter ended June 30, 2014 | $ | 13.15 | $ | 9.92 | |||
Third quarter ended March 31, 2014 | $ | 13.83 | $ | 11.56 | |||
Second quarter ended December 31, 2013 | $ | 12.77 | $ | 11.01 | |||
First quarter ended September 30, 2013 | $ | 12.59 | $ | 10.68 | |||
Shares Outstanding and Holders
As of June 30, 2015, there were 32,845,205 shares of common stock issued and outstanding, held by approximately 222 holders of record.
Dividends
We began paying cash quarterly dividends on our common stock in December 2013, at a rate of $0.10 per share and adjusted the rate to $0.05 per share in March 2015. As of June 30, 2015, we had paid seven quarterly dividends on our common stock. All dividends on our Series "A" Perpetual Preferred stock have been timely declared and paid monthly. Any future determination with regard to the payment of dividends will be at the discretion of the board of directors and will be dependent upon our future earnings, financial condition, applicable dividend restrictions and capital requirements and other factors deemed relevant by the board of directors. Under our current revolving credit facility, an existing loan balance and/or letter of credit commitment would restrict our ability to pay common stock dividends.
Performance Graph
The following graph presents a comparison of the yearly percentage change in the cumulative total return on our Common Stock over the period from June 30, 2010 to June 30, 2015 with the cumulative total return of the S&P 500 Index and the SIG Oil Exploration and Production Index of publicly traded companies over the same period. The graph assumes that $100 was invested on June 30, 2010 in our common stock at the closing market price at the beginning of this period and in each of the other two indices and the reinvestment of all dividends, if any. The graph is presented in accordance with requirements of the SEC. Shareholders are cautioned against drawing any conclusions from the data contained therein, as past results are not necessarily indicative of future financial performance.
21
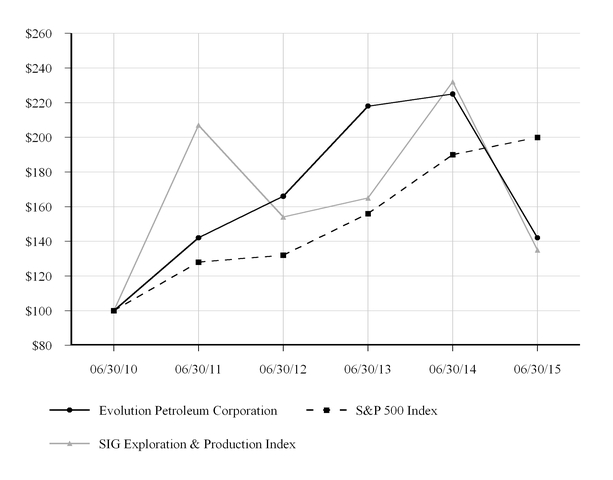
Securities Authorized For Issuance Under Equity Compensation Plans
Plan category | Number of securities to be issued upon exercise of outstanding options, warrants and rights (a) | Weighted-average exercise price of outstanding Options, warrants and rights (b) | Number of securities remaining available for future issuance under equity compensation plans (excluding securities reflected in column (a))(1) | ||||||||
Equity compensation plans approved by security holders: | |||||||||||
Outstanding options | 91,061 | (1) | $ | 2.50 | |||||||
Outstanding contingent rights to shares | 56,286 | (1) | — | ||||||||
Total | 147,347 | $ | 1.55 | 542,529 | |||||||
Equity compensation plans not approved by security holders | — | — | — | ||||||||
Total | 147,347 | $ | 1.55 | 542,529 | |||||||
(1) | As of June 30, 2015, there were 91,061 shares of common stock issuable upon exercise of outstanding stock options. The Amended and Restated 2004 Stock Plan (the "Plan") provides for the issuance of a total of 6,500,000 common shares. Under the Plan as of June 30, 2015, 3,854,134 common shares had been issued upon the exercise of stock options, 1,955,990 shares of restricted common stock had been issued (of which 262,227 were unvested as of June 30, 2015), contingent rights for 56,286 shares had been reserved but not issued (all of which are unvested) and 542,529 shares of common stock remain available for future grants. |
22
Issuer Purchases of Equity Securities
Period | (a) Total Number of Shares (or Units) Purchased (1) (2) | (b) Average Price Paid per Share (or Units) | (c) Total Number of Shares (or Units) Purchased as Part of Publicly Announced Plans or Programs | (d) Maximum Number (or Approximate Dollar Value) of Shares (or Units) that May Yet Be Purchased Under the Plans or Programs | ||||
April 1, 2015 to April 30, 2015 | none | — | — | — | ||||
May 1, 2015 to May 31, 2015 | none | — | — | — | ||||
June 1, 2015 to June 30, 2015 | 64,126 shares of Common Stock | $6.87 | 63,372 | Approximately $4.6 million | ||||
(1) | During the fourth fiscal quarter ended June 30, 2015, the Company received 754 shares of common stock from certain of its employees which were surrendered in exchange for their payroll tax liabilities arising from vestings of restricted stock. The acquisition cost per share reflected the weighted-average market price of the Company's shares at the dates vested. |
(2) | On May 12, 2015, the Board of Directors approved a share repurchase program covering up to $5 million of the Company's common stock. Under the program's terms, shares may be repurchased only on the open market and in accordance with the requirements of the Securities and Exchange Commission. The timing and amount of repurchases will depend upon several factors, including financial resources and market and business conditions. There is no fixed termination date for this repurchase program, and the repurchase program may be suspended or discontinued at any time. Such shares were initially recorded as treasury stock, then subsequently canceled. |
23
Item 6. Selected Financial Data
The selected consolidated financial data, set forth below should be read in conjunction with Item 7. "Management's Discussion and Analysis of Financial Condition and Results of Operations" and with the consolidated financial statements and notes to those consolidated financial statements included elsewhere in this report.
June 30, | |||||||||||||||||||
2015 | 2014 | 2013 | 2012 | 2011 | |||||||||||||||
Income Statement Data | |||||||||||||||||||
Revenues | $ | 27,841,265 | $ | 17,673,508 | $ | 21,349,920 | $ | 17,962,038 | $ | 7,530,875 | |||||||||
Production costs - Delhi field | 8,516,323 | — | — | — | — | ||||||||||||||
Artificial lift technology costs | 743,802 | 609,221 | 390,238 | 124,703 | — | ||||||||||||||
Production costs - other properties | 95,488 | 584,352 | 1,390,500 | 1,650,296 | 1,379,327 | ||||||||||||||
Depreciation, depletion, and amortization | 3,615,737 | 1,228,685 | 1,300,207 | 1,136,974 | 563,104 | ||||||||||||||
Accretion expense | 34,866 | 41,626 | 72,312 | 77,505 | 59,913 | ||||||||||||||
General and administrative expense | 6,256,783 | 8,388,291 | 7,495,309 | 6,143,286 | 5,335,384 | ||||||||||||||
Restructuring charges | (5,431 | ) | 1,293,186 | — | — | — | |||||||||||||
Income from operations | 8,583,697 | 5,528,147 | 10,701,354 | 8,829,274 | 193,147 | ||||||||||||||
Other income (expense) | (147,619 | ) | (38,836 | ) | (43,165 | ) | 3,778 | 14,214 | |||||||||||
Income tax provision | 3,444,221 | 1,891,998 | 4,029,761 | 3,700,922 | 448,914 | ||||||||||||||
Net income (loss) attributable to the Company | $ | 4,991,857 | $ | 3,597,313 | $ | 6,628,428 | $ | 5,132,130 | $ | (241,553 | ) | ||||||||
Dividends on Series A Preferred Stock | 674,302 | 674,302 | 674,302 | 630,391 | — | ||||||||||||||
Net income (loss) attributable to common shareholders | $ | 4,317,555 | $ | 2,923,011 | $ | 5,954,126 | $ | 4,501,739 | $ | (241,553 | ) | ||||||||
Earnings per common share: | |||||||||||||||||||
Basic | $ | 0.13 | $ | 0.09 | $ | 0.21 | $ | 0.16 | $ | (0.01 | ) | ||||||||
Diluted | $ | 0.13 | $ | 0.09 | $ | 0.19 | $ | 0.14 | $ | (0.01 | ) | ||||||||
June 30, 2015 | June 30, 2014 | June 30, 2013 | June 30, 2012 | June 30, 2011 | |||||||||||||||
Balance Sheet Data | |||||||||||||||||||
Total current assets | $ | 23,693,048 | $ | 26,304,803 | $ | 27,436,076 | $ | 16,769,789 | $ | 6,357,840 | |||||||||
Total assets | 69,882,727 | 65,015,752 | 66,556,296 | 58,955,486 | 39,951,953 | ||||||||||||||
Total current liabilities | 9,329,257 | 2,999,726 | 2,632,750 | 5,088,917 | 2,211,932 | ||||||||||||||
Total liabilities | 21,306,150 | 13,138,230 | 11,720,135 | 12,332,698 | 6,487,196 | ||||||||||||||
Stockholders' equity | 48,576,577 | 51,877,522 | 54,836,161 | 46,622,788 | 33,464,757 | ||||||||||||||
Number of common shares outstanding | 32,845,205 | 32,615,646 | 28,608,969 | 27,882,224 | 27,612,916 | ||||||||||||||
24
Item 7. Management's Discussion and Analysis of Financial Condition and Results of Operations
Executive Overview
General
We are engaged primarily in the development of oil and gas reserves within known oil and gas resources for our shareholders and customers utilizing conventional and proprietary technology. We are focused on increasing underlying asset values on a per share basis. In doing so, we depend on a conservative capital structure, allowing us to maintain control of our assets for the benefit of our shareholders, including a substantial ownership by our directors, officers and staff. By policy, every employee and director maintains a beneficial ownership of our common stock.
Our strategy is to grow the value of our Delhi asset to maximize the value realized by our shareholders while commercializing our patented GARP® artificial lift technology for recovering incremental oil and gas reserves. In addition, we plan to return cash to the shareholders in the form of a quarterly cash dividend and also stock buybacks under our previously announced share repurchase program.
We expect to fund our fiscal 2016 capital program from working capital and net cash flows from our properties.
Highlights for our fiscal year 2015
Finances
• | We remained debt free. All of our expenditures and dividends were funded solely by cash flow from operations and working capital and we ended our fiscal year with no funded debt. |
• | We returned $10.5 million to shareholders in the form of cash dividends during fiscal 2015. We paid a total of $9.8 million in common stock dividends and $0.7 million in preferred stock dividends in fiscal year 2015. |
• | We initiated a stock buyback program. We have authorized the purchase of as much as $5.0 million of our common stock under this program. |
• | Working capital was $14.3 million at June 30, 2015 compared to $23.3 million at the prior year end. At June 30, 2015, working capital included $20.1 million of cash on hand. |
• | We entered into hedges for approximately two-thirds of our oil production for the six month period ending December 31, 2015. As of June 30, 2015, we recorded a loss of $109,974 to reflect our derivative position at its then current market value. Based on a subsequent decline in oil prices, we realized gains of $138,787 and $412,985, for July 2015 and August 2015, respectively, for expiring derivative contacts. These derivatives have allowed us to receive the WTI equivalent of approximately $55.00 per barrel for the hedge quantities sold during these periods. |
Operations
• | Our net oil production volumes at Delhi increased by over 173% year over year. Monthly production has been steadily increasing since October 2014 as a result of a production optimization program and the replacement of a well which had experienced mechanical problems. The majority of the increase in our net production stems from the reversion of our 23.9% working interest and associated 19.0% revenue interest in the Delhi field which became effective on November 1, 2014. Combined with our existing royalty and mineral interests of 7.4%, our total net revenue interest in the Delhi field is 26.4%. |
• | We approved AFEs to commence the construction of a NGL recovery plant at Delhi. The gross total costs of the project is $103 million. Our net share of capital expenditures for this project is $24.6 million, and is expected to be funded through cash flow from operations and working capital. |
• | Our fiscal 2015 net income to common shareholders was $4.3 million, a 48% increase from fiscal 2014 net income of $2.9 million. During fiscal 2015, increased Delhi revenues and lower general & administrative expenses led to significantly higher net income, offset in part by increased DD&A expenses and higher income tax expense. This is our fourth consecutive year of reporting net income to common shareholders. |
• | Total revenues in fiscal 2015 were $27.8 million, a 57% increase from $17.7 million in fiscal 2014. During fiscal 2015, reversion of our working interest at Delhi in November 2014 contributed substantially to annual revenues, offset by lower realized oil prices at Delhi and a decrease in artificial lift technology revenues year over year. |
25
Oil & Gas Reserves
• | Delhi proved oil equivalent reserves at June 30, 2015 decreased to 12.4 MMBOE, a 5% decline from the previous year and corresponding PV-10* declined to $219 million, 32% lower than prior year. Proved reserves are 80% oil and 20% natural gas liquids, and 59% of these reserves are developed and producing. |
• | Delhi probable reserves at June 30, 2015 decreased to 9.3 MMBOE, a 1% decrease over the previous year and corresponding PV-10* decreased to $72 million, 47% lower than prior year. |
• | Reserve Life Index** for proved oil reserves at Delhi is approximately 17 years. |
The following table is a summary of our proved and probable reserves for 2015 and 2014:
Proved | Probable | ||||||||||||||||||||
2015 | 2014 | Change | 2015 | 2014 | Change | ||||||||||||||||
Reserves MMBOE | 12.4 | 13.3 | (6.8 | )% | 9.3 | 9.5 | (2.1 | )% | |||||||||||||
% Developed | 59 | % | 60 | % | (1.7 | )% | 43 | % | 43 | % | — | % | |||||||||
Liquids % | 100 | % | 96 | % | 4.2 | % | 100 | % | 97 | % | 3.1 | % | |||||||||
PV-10* ($MM) | $ | 219 | $ | 320 | (31.6 | )% | $ | 72 | $ | 136 | (47.1 | )% | |||||||||
_______________________________________________________________________________
* | PV-10 of Proved reserves is a pre-tax non-GAAP measure. We have included a reconciliation of PV-10 to the unaudited after-tax Standardized Measure of Discounted Future Net Cash Flows, which is the most directly comparable financial measure calculated in accordance with GAAP, in Item 2. "Properties." We believe that the presentation of the non-GAAP financial measure of PV-10 provides useful and relevant information to investors because of its wide use by analysts and investors in evaluating the relative monetary significance of oil and natural gas properties, and as a basis for comparison of the relative size and value of our reserves to other companies’ reserves. We also use this pre-tax measure when assessing the potential return on investment related to oil and natural gas properties and in evaluating acquisition opportunities. Because there are many unique factors that can impact an individual company when estimating the amount of future income taxes to be paid, we believe the use of a pre-tax measure is valuable for evaluating our Company. PV-10 is not a measure of financial or operating performance under GAAP, nor is it intended to represent the current market value of our estimated oil and natural gas reserves. PV-10 should not be considered in isolation or as a substitute for the Standardized Measure as defined under GAAP, and reconciled below. Probable and Possible reserves are not recognized by GAAP, and therefore the PV-10 of Probable and Possible reserves cannot be reconciled to a GAAP measure. |
** Reserve Life Index is a relative measure of the average life of a Company’s reserves calculated as the remaining reserves divided by the current rate of production. In our calculation we have used total Proved oil reserves divided by expected oil production in the first 12 months of the reserve report, calculated on a gross basis. Natural gas and NGL reserves and production were not considered material or relevant for the purpose of this calculation as they are currently undeveloped. We believe that this measure is relevant to understanding and analyzing our reserve base and is useful to investors and analysts in comparing our company to others in the industry. This measure is not an absolute measure of the expected life of our reserves, nor is it intended to convey information about any specific event or time in the future.
Projects
Additional property and project information is included under Item 1. Business, Item 2. Properties, Item 8. Financial Statements - Notes to the Financial Statements and Exhibit 99.4 of this Form 10-K.
Delhi Field EOR—Northeast Louisiana
Our reserves quantities in the Delhi Field were consistent with expectations year over year. Positive revisions in recoveries of NGLs were offset by production from the prior year and plans to more economically utilize our methane reserves to generate power in the field, thereby reducing operating costs, rather than sell them into the market. The reserves report reflects the November 2014 reversion of our 23.9% working interest, together with our 7.4% overriding royalty and mineral interests in the field.
26
Proved reserves volumes totaled 12.4 MMBOE compared to 13.3 MMBOE in the prior year. Prior year proved reserves included 0.5 MMBOE of methane to be produced from the NGL plant currently under development, whereas our current reserves exclude methane volumes and instead account for the methane as contributing to lower projected operating costs through use as fuel. Our PV-10* value of $219 million was consistent with our expectations in this lower price environment. We receive favorable Light Louisiana Sweet crude oil pricing in the field, which continues to trade at a premium to WTI, as well as low pipeline transportation costs to get our production to market.
Additionally, our cost of purchased CO2 in the Delhi field, the largest component of operating costs and the majority of our operating costs, is directly tied to the price of oil sales from the field, so this major operating cost has dropped commensurate with the price of crude. We have also seen reductions in other field operating costs as the operator has focused on initiatives to lower field operating expenses.
Probable reserve volumes at Delhi were 9.3 MMBOE, compared to 9.5 MMBOE in the prior year that included 0.3 MMBOE of methane. Possible reserves volumes at Delhi of 3.0 MMBOE were virtually flat compared to the prior year. In both cases, other positive adjustments substantially offset the reduction in natural gas reserves from the revised plans to utilize this gas for power generation.
Gross production at Delhi in the fourth quarter of fiscal 2015 was 6,328 barrels of oil per day (“BOPD”), up 2% from the third fiscal quarter’s 6,203 BOPD. Production volumes net to the Company were 1,677 BOPD and 1,644 BOPD, respectively. We expect production from the field to average in excess of 6,000 BOPD until we add the additional volumes from the NGL plant in the second half of calendar 2016 and complete the roll-out of the remaining CO2 projects in subsequent years. We expect production growth to continue well into the next decade.
The plans and purchases for construction of the NGL plant are underway and we are anticipating startup in the second half of calendar 2016. The plant has a total estimated cost of $24.6 million net to Evolution, of which approximately $5.0 million had been incurred as of June 30, 2015. The reserves report includes projected peak proved production volumes of approximately 1,850 barrels of liquids per day from the NGL plant over the next five years, and peak probable volumes of 1,140 barrels of liquids per day later next decade. As previously discussed, the methane produced from the plant will be used to generate electricity and other power requirements for the field, which will substantially reduce operating costs. The NGL plant is also expected to increase the efficiency of the CO2 flood, and the reserves report reflects incremental gross crude oil production volumes in the range of 500 BOPD once the plant is operational.
Remaining estimated capital expenditures amount to $9.34 per BOE for proved undeveloped reserves and $4.89 for probable undeveloped reserves. Looking forward, the timing of plans for continued development of the eastern part of the Delhi field is dependent on the operator’s plans for capital allocation within their portfolio. We continue to believe that these high quality and economically viable projects will be executed as planned, subject to oil price volatility.
GARP® - Artificial Lift Technology
Results from our artificial lift technology were adversely affected by declining production in our company operated wells and high production costs due to workovers. Our Gas Assisted Rod Pump (GARP® ) technology continues to face a challenging marketing environment as the industry copes with lower revenues and significantly reduced spending budgets.
During the fiscal year, the GARP® installation in the Appelt #1H well, which had been shut-in for over a year due to solids production, was worked over to install better solids handling capacity and restored to producing status. The Selected Lands #2 well was also restored to economic production in March 2015. Lastly, the Philip #1 well was abandoned after unsuccessful workovers to prevent solids from causing repeated mechanical pump failures. These pump issues were unrelated to our GARP® technology.
We continue to work to advance the development of the GARP® technology and have filed three new GARP® patents and one provisional GARP® patent to solve specific needs identified by customers. Recent GARP® marketing and business development efforts have secured three master service agreements, including with one major, one super-independent and one large independent oil producer and a fourth agreement is pending. Approval as a vendor to provide oil field services is a necessary first step to install our GARP® technology, but the installation is governed by a separate agreement.
Other Fields
In October 2014, we closed on the sale of all of our remaining noncore mineral interests and assets in the Mississippi Lime project for cash proceeds of approximately $389,165, net of customary closing adjustments. This transaction completes the process of divesting of all of our non-core oil and gas properties. No reserves were associated with these assets as of June 30, 2015 or 2014.
27
Liquidity and Capital Resources
We had $20.1 million and $23.9 million in cash and cash equivalents at June 30, 2015 and June 30, 2014, respectively. In addition, we have $5.0 million of availability under our unsecured revolving credit facility at fiscal year end.
During our fiscal year ended June 30, 2015, we financed our operations with cash generated from operations and cash on hand. At June 30, 2015, our working capital was $14.4 million, compared to working capital of $23.3 million at June 30, 2014. The $8.9 million working capital decrease is primarily due to a $7.7 million increase in accounts payable reflecting post-reversion Delhi field operating expenses and capital expenditures together with $3.8 million of lower cash, partially offset by $1.7 million of lower accrued liabilities principally attributable to incentive compensation, restructuring and officer retirement accruals and $1.7 million of increased oil and gas revenue receivables subsequent to our working interest reversion.
Cash Flows from Operating Activities
For the year ended June 30, 2015, cash flows provided by operating activities were $10.4 million, reflecting $10.9 million provided by operations before $0.5 million used by other working capital changes. Of the $10.9 million provided before working capital changes, approximately $5.0 million resulted from net income and $5.9 million was attributable to non-cash expenses.
For the year ended June 30, 2014, cash flows provided by operating activities were $8.1 million, reflecting $7.7 million provided by operations before $0.4 million provided by other working capital changes. Of the $7.7 million provided before working capital changes, $3.6 million resulted from net income and $4.1 million was attributable to non-cash expenses.
For the year ended June 30, 2013, cash flows provided by operating activities were $11.9 million, reflecting $6.6 million of net income together with $5.3 million provided by non-cash expenses, including $2.5 million from deferred income taxes, $1.5 million from stock compensation, and $1.3 million from depreciation, depletion and amortization.
Cash Flows from Investing Activities
For the year ended June 30, 2015, investing activities used $5.0 million of cash, consisting primarily of capital expenditures of approximately $4.9 million for Delhi field, $0.3 million for artificial lift technology together with $0.2 million of other assets comprised primarily of GARP® patent costs, partially offset by $0.4 million of proceeds received for the sale of properties in the Mississippi Lime project in October 2014.
For the year ended June 30, 2014, cash paid for oil and gas capital expenditures was $1.3 million, primarily for development activities related to GARP® wells in Giddings and continuing costs for the Sneath and Hendrickson wells drilled in the Mississippi Lime during the prior year. We received approximately $542,000 of proceeds from asset sales, including $402,500 from the December sale of our South Texas properties, and $250,000 of cash from the maturity of a certificate of deposit.
Cash paid for oil and gas capital expenditures during the year ended June 30, 2013 was $4.9 million. Of these expenditures, $0.7 million was for leasehold acquisitions, principally in the Mississippi Lime, and $4.2 million was for development activities. Development activities were predominantly in the Mississippi Lime, where one salt water disposal well and two wells were drilled. In Giddings, expenditures were centered on adding three new GARP® wells. An inflow of $3.5 million was received for proceeds from the sales of a portion of our Giddings exploration and production properties. In December 2012, an expiring $250,000 certificate of deposit was rolled over beginning a new annual term.
Oil and gas capital expenditures incurred, which includes accrued expenditures, were $11.2 million, $1.2 million, and $3.4 million, respectively, for the years ended June 30, 2015, 2014, and 2013. These amounts can be reconciled to cash capital expenditures on their respective cash flow statements by adjusting them for related non-cash items presented at Note 12, "Supplemental Cash Flow Information".
Cash Flows from Financing Activities
During the year ended June 30, 2015, we used $9.2 million in cash for financing activities, reflecting $9.8 million of common stock dividend payments, $0.7 million of preferred stock dividends and $0.3 million of treasury stock acquired through the surrender of shares by certain officers and employees in satisfaction of payroll liabilities related to stock-based compensation and open market purchases under our stock repurchase program, partially offset by cash inflows of $1.6 million from a tax benefit related to stock-based compensation and $0.1 million from stock option exercises.
During the year ended June 30, 2014, we used $8.3 million in cash for financing activities, reflecting $9.7 million of common stock dividend payments, $0.7 million of preferred stock dividends and $1.7 million of treasury stock acquired through the surrender of shares by certain officers and employees in satisfaction of payroll liabilities related to stock-based
28
compensation, partially offset by cash inflows of $0.5 million from a tax benefit related to stock-based compensation and $3.3 million from stock option exercises.
During the year ended June 30, 2013, we paid preferred dividends of $0.7 million and acquired $0.1 million of treasury stock through the surrender of shares by certain officers and employees in satisfaction of payroll liabilities related to stock-based compensation. A tax benefit related to stock-based compensation provided $0.8 million.
Capital Budget
Delhi Field
With the operator's determination that reversion of our 23.9% working interest and 19.0% net revenue interest in Delhi occurred effective November 1, 2014, we began funding our share of capital expenditures in the field as of that date. From reversion through June 30, 2015, our net share of capital expenditures was approximately $10.4 million, including $5.0 million for the gas processing plant. Capital expenditures also included redrilling a producer well, testing and strengthening of well bore integrity in various wells in the field, including previously plugged wells, and drilling and completion of monitoring wells.
Projected capital expenditures over the next fiscal year are currently expected to total approximately $19.6 million net to our working interest for the balance of the costs of the NGL recovery plant.
Beyond the NGL recovery plant, there are other capital projects to exploit proved undeveloped reserves in the eastern part of the Delhi field. The first phase of this project was underway in the fall of 2014, immediately after reversion of our working interest. However, based on the decline in oil prices, the operator significantly reduced its capital budget and suspended work on this phase. The resumption of this project is dependent on prevailing oil prices, the availability of capital for such projects and the relative economics of this project versus other projects in the operator's portfolio. We believe this project has very favorable economics, even in this lower price environment, and expect the expansion of the CO2 flood to resume within the next 2-3 years. The economics of this expansion will also be improved subsequent to the completion of the NGL recovery plant.
GARP® - Artificial Lift Technology
Based on our current marketing and business plans, we expect that our capital requirements for artificial lift technology operations will be relatively minor over the next fiscal year.
Liquidity Outlook
Our liquidity is highly dependent on the realized prices we receive for the oil, natural gas and natural gas liquids we produce. Commodity prices are market driven and historically volatile, and they are likely to continue to be volatile. In June 2015, the Company began using derivative instruments to reduce its exposure to oil price volatility for a portion of its forecasted production from July 1, 2015 to December 31, 2015 to achieve a more predictable level of cash flows to support the Company’s capital expenditure program. Costless collars used by the Company to manage risk are designed to establish floor and ceiling prices on anticipated future oil production. While the use of these derivative instruments limits the downside risk of adverse price movements, they may also limit future revenues from favorable price movements. Our future revenues, cash flow, profitability, access to capital and future rate of growth are significantly impacted by the prices we receive for our production. Liquidity could also be affected by any litigation outcome, positive or negative.
Funding for our anticipated capital expenditures over the next two fiscal years is expected to be met from cash flows from operations and current working capital. Our preference is to remain debt free under our current operating plans, but we have access to a $5.0 million unsecured revolving line of credit. This facility is intended primarily to provide a standby source of liquidity to meet future capital expenditures at Delhi or other future capital needs.
The Board of Directors and management instituted a cash dividend on our common stock in December 2013 at an initial quarterly rate of $0.10 per common share. However, as a result of the decline in oil prices which began in the fall of 2014, combined with the anticipated $24.6 million cost of building and installing the Delhi NGL gas plant during calendar years 2015 and 2016, the Dividend Committee and the Board of Directors believed it was prudent to adjust the quarterly dividend rate from $0.10 per share to $0.05 per share, effective with the quarter ending March 31, 2015. The reduction in the dividend rate will allow the Company to conserve cash for additional financial flexibility while continuing to reward shareholders with a yield. In addition, in May 2015, we established a stock repurchase plan to allow us acquire up to $5.0 million of our common stock over time. Payment of free cash flow in excess of our operating and capital requirements through cash dividends and repurchases of our common stock remains a priority of our financial strategy, and it is our long term goal to increase our dividends over time as appropriate.
29
Results of Operations
The following table sets forth certain financial information with respect to our oil and natural gas operations:
Year Ended June 30, | |||||||||||
2015 | 2014 | 2013 | |||||||||
Delhi field: | |||||||||||
Crude oil revenues | $ | 27,573,641 | $ | 16,908,666 | $ | 19,219,036 | |||||
Crude oil volumes (Bbl) | 448,187 | 164,224 | 180,658 | ||||||||
Average price per Bbl | $ | 61.52 | $ | 102.96 | $ | 106.38 | |||||
Delhi field production costs | $ | 8,516,323 | $ | — | $ | — | |||||
Delhi field production costs per BOE | $ | 19.00 | $ | — | $ | — | |||||
Artificial lift technology: | |||||||||||
Crude oil revenues | $ | 170,369 | $ | 414,270 | $ | 323,488 | |||||
NGL revenues | 36,480 | 115,172 | 16,661 | ||||||||
Natural gas revenues | 24,260 | 93,890 | 34,914 | ||||||||
Service revenues | 16,146 | — | — | ||||||||
Total revenues | $ | 247,255 | $ | 623,332 | $ | 375,063 | |||||
Crude oil volumes (Bbl) | 2,352 | 4,115 | 3,476 | ||||||||
NGL volumes (Bbl) | 1,335 | 3,460 | 432 | ||||||||
Natural gas volumes (Mcf) | 7,450 | 26,105 | 10,531 | ||||||||
Equivalent volumes (BOE) | 4,929 | 11,927 | 5,664 | ||||||||
Crude oil price per Bbl | $72.44 | $100.67 | $93.06 | ||||||||
NGL price per Bbl | $27.33 | $33.29 | $38.57 | ||||||||
Natural gas price per Mcf | $3.26 | $3.60 | $3.32 | ||||||||
Equivalent price per BOE | $50.16 | $52.26 | $66.22 | ||||||||
Artificial lift production costs | $ | 743,802 | $ | 609,221 | $ | 390,238 | |||||
Production costs per BOE | 150.90 | 51.08 | 68.90 | ||||||||
Other properties: | |||||||||||
Revenues | $ | 20,369 | $ | 141,510 | $ | 1,755,821 | |||||
Equivalent volumes (BOE) | 285 | 1,591 | 40,497 | ||||||||
Equivalent price per BOE | $ | 71.47 | $ | 88.94 | $ | 43.36 | |||||
Production costs | $ | 95,488 | $ | 584,352 | $ | 1,390,500 | |||||
Production costs per BOE | $ | 335.05 | $ | 367.29 | $ | 34.34 | |||||
Combined: | |||||||||||
Oil and gas DD&A (a) | $ | 3,220,990 | $ | 1,192,370 | $ | 1,255,209 | |||||
Oil and gas DD&A per BOE | $ | 7.10 | $ | 6.71 | $ | 5.53 | |||||
(a) Excludes technology equipment impairment of $275,682, depreciation of technology equipment, office furniture, fixtures and equipment, and amortization of other assets totaling $119,065 for the year ended June 30, 2015 and aggregate depreciation and amortization of $36,515 and $44,998 for the years ended June 30, 2014, and 2013, respectively.
30
Year ended June 30, 2015 compared with the Year ended June 30, 2014
Net Income Available to Common Shareholders. For the year ended June 30, 2015, we generated net income of $4.3 million or $0.13 per diluted share on total revenues of $27.8 million. This compares to net income of $2.9 million, or $0.09 per diluted share, on total revenues of $17.7 million for the prior fiscal year. Earning increased $1.4 million reflecting $10.2 million of higher revenue together with $2.1 million of lower G&A and $1.3 million restructuring expenses, partially offset by $8.2 million higher production costs, $2.4 million of increased DD&A and $1.6 million of higher income taxes.
Delhi Field. Revenues increased 63% to $27.6 million as a result of a 173% increase in production volumes from the prior fiscal year primarily due to the November 2014 reversion of our working interest, partially offset by a 40% decline in realized crude oil prices, from $102.96 per barrel to $61.52 per barrel. Gross production decreased 0.6% to 6,038 BOPD compared to 6,076 BOPD for the year-ago period. Production costs for the current fiscal year were $8.5 million, of which $5.1 million was for CO2 purchases and transportation expenses, compared to no production costs in the prior fiscal year as those revenues were derived solely from our mineral and overriding royalty interests, which bear no operating expenses. Under our contract with the operator, purchased CO2 is priced at 1% of the oil price in the field per Mcf plus $0.20 per Mcf transportation costs plus sales taxes. Accordingly, such costs will be reduced in the future if oil prices remain at lower price levels. From our November 1, 2014 working interest reversion to June 30, 2015, total production costs were $29.89 per working interest BOE which includes CO2 costs of $17.72 per working interest BOE.
Artificial Lift Technology. Revenues decreased 60% to $247,000 reflecting a 59% volume decrease, primarily as a result of losing production at the Philip DL #1, together with a 4% decrease in the realized price per BOE, from $52.26 per barrel to $50.16 per barrel. We recorded $16,146 of service revenue from GARP® installations for a third-party customer. Artificial lift production costs were $744,000, which included $571,000 in workover costs incurred in recovering proved reserves by restoring production on the Appelt and the Selected Lands #2 wells and unfruitful attempts to restore production at the Philip DL #1.
Other Properties. The Company began divesting its non-core oil and gas properties in fiscal 2013. Revenues from other properties decreased to $20,000 compared to $142,000 in fiscal 2014. The prior year production costs were high as a result of workover costs in South Texas and high water production in the Mississippi Lime. We completed our divestiture process in the second quarter of our current fiscal year with the sale of the remaining interests in our Mississippi Lime properties.
General and Administrative Expenses (“G&A”). G&A expenses decreased $2.1 million, or 25%, to $6.3 million during the year ended June 30, 2015 from $8.4 million in the prior year primarily due to fiscal 2014 non-recurring charges of $0.8 million related to stock option exercises and $0.6 million related to the retirement of our vice president and chief financial officer, a $0.6 million decrease in personnel-related costs as a result of our December 2013 restructuring, and a $0.7 million decline in accrued incentive compensation, partially offset by $0.4 million of higher legal expenses. This fiscal 2014 restructuring charge of $1.3 million consisted of $0.9 million of termination benefits and $0.4 million non-cash charge for accelerated restricted stock vesting for terminated employees.
Restructuring Charges. The Company recorded $1.3 million of restructuring expense in December 2013 primarily reflecting $956,000 of termination benefits to be paid from January to December 2014 and $376,000 of non-cash stock compensation expense for accelerated restricted stock vesting for terminated employees. All restructuring obligations had been satisfied by December 31, 2014. See Note 7 – Restructuring.
Depletion & Amortization Expense (“DD&A”). DD&A increased $2.4 million, or 194%, to $3.6 million for the year ended June 30, 2015 from $1.2 million for the prior year due to $2.0 million increase in amortization of our full cost oil and gas property cost pool and a $275,682 impairment charge for GARP® equipment installations on three under performing wells of a third party customer together with the remaining expense increase primarily the result of higher other property and equipment depreciation reflecting artificial lift equipment placed in service during fiscal 2015. The $2.0 million increase in full cost pool depletion was primarily due to higher volume generated from the reversionary working interest. For fiscal 2015 the depletion rate was $7.10 per BOE compared to $6.71 in the prior year. The increase in rate was impacted by higher estimated cost for the Delhi Field gas plant at June 30, 2015.
Year ended June 30, 2014 compared with the Year ended June 30, 2013
Net Income Available to Common Shareholders. For the year ended June 30, 2014, we generated net income of $2.9 million or $0.09 per diluted share, (which includes a $1.3 million restructuring charge, $1.4 million of non-recurring charges related to stock option exercises and the retirement of the Company’s chief financial officer) on total oil and natural gas revenues of $17.7 million. For the year ended June 30, 2014, non-cash stock compensation expense was $1.7 million of which $203,861
31
related to the retirement charge. This compares to a net income of $6.0 million, or $0.19 per diluted share, (which includes $1.5 million of non-cash stock-based compensation expense) on total oil and natural gas revenues of $21.3 million for the corresponding prior year period. The earnings decline is due to lower revenue, higher G&A, and a current year restructuring charge, partially offset by lower lease operating expense and income taxes. Additional details of the components of net income are explained in greater detail below.
Delhi Field. Revenue decreased 12% to $16.9 million primarily because of a 9% volume decline attributable to the June 2013 Event, together with a 3% lower price per BOE.
Artificial Lift Technology. Revenue increased 66% to $0.6 million reflecting a 110% BOE volume increase, primarily due to the new Philip well, partially offset by a 21% decrease in price per BOE primarily influenced by a higher percentage of natural gas production.
Other Properties. Revenue decreased by 92% to $0.1 million due to the prior fiscal year sales of non-core Giddings Field properties and the sale of Lopez Field properties in December 2013.
Artificial Lift Production Costs. Expenses increased 56% to $0.6 million due to the new Philip and Appelt wells.
Other Properties Production Costs. Expenses decreased 58% to $0.6 million due the prior fiscal year sales of Giddings Field properties and the December 2013 sale of our South Texas Lopez Field. We had continuing workover and testing costs on our Mississippi Lime project during 2014 which have now been terminated.
General and Administrative Expenses (“G&A”). G&A expenses, including $1.4 million of one-time charges, increased 12% to $8.4 million during the year ended June 30, 2014 from $7.5 million in the prior year. The $0.9 million increase was primarily due to approximately $672,000 of higher compensation and benefits impacted by an officer's retirement, $146,000 of higher transaction expenses, $121,000 of lower absorption to drilling projects and $90,000 in higher consulting expense, partially offset by lower stock compensation expense of $179,000. Stock-based compensation was $1.4 million (16% of total G&A) for the year ended June 30, 2014 compared to $1.5 million (21% of total G&A) for the year ended June 30, 2013.
Restructuring Charges. The Company recorded $1.3 million of restructuring expense in December 2013 primarily reflecting $956,000 of termination benefits to be paid from January to December 2014 and $376,000 of non-cash stock compensation expense for accelerated restricted stock vesting for terminated employees. See Note 7 — Restructuring.
Oil and Gas Depreciation, Depletion & Amortization Expense (“DD&A”). DD&A decreased by 5% to $1.2 million for the year ended June 30, 2014, compared to $1.3 million for the prior year. This change was principally due to a 21% increase in depletion rate to $6.71 per BOE, partially offset by a 22% volume decrease.
Other Economic Factors
Inflation. Although the general inflation rate in the United States, as measured by the Consumer Price Index and the Producer Price Index, has been relatively low in recent years, the oil and gas industry has experienced unusually volatile price movements in commodity prices, vendor goods and oilfield services. Prices for drilling and oilfield services, oilfield equipment, tubulars, labor, expertise and other services greatly impact our lease operating expenses and our capital expenditures. During fiscal 2015 we have not seen material changes in cost. Product prices, operating costs and development costs may not always move in tandem.
Known Trends and Uncertainties. General worldwide economic conditions, as well as economic conditions for the oil and gas industry specifically, continue to be uncertain and volatile. Concerns over uncertain future economic growth are affecting numerous industries, companies, as well as consumers, which impact demand for crude oil and natural gas. If demand continues to decrease with a great oversupply in the future, it may continue to put downward pressure on crude oil and natural gas prices, thereby lowering our revenues and working capital going forward. In addition, our lease operating expenses and their percentage of our revenues are likely to increase as reversion of our back-in interest at Delhi or other additions to our working interest production would dilute extraordinary margins we have enjoyed from our mineral and overriding royalty interests at Delhi.
Seasonality. Our business is generally not directly seasonal, except for instances when weather conditions may adversely affect access to our properties or delivery of our petroleum products. Although we do not generally modify our production for changes in market demand, we do experience seasonality in the product prices we receive, driven by summer cooling and driving, winter heating, and extremes in seasonal weather including hurricanes that may substantially affect oil and natural gas production and imports.
32
Contractual Obligations and Other Commitments
The table below provides estimates of the timing of future payments that, as of June 30, 2015, we are obligated to make under our contractual obligations and commitments. We expect to fund these contractual obligations with cash on hand and cash generated from operations.
Payments Due by Period | |||||||||||||||||||
Total | Less than 1 Year | 1 - 3 Years | 3 - 5 Years | More than 5 Years | |||||||||||||||
Contractual Obligations | |||||||||||||||||||
Operating lease | $ | 172,262 | $ | 159,011 | $ | 13,251 | — | — | |||||||||||
Other Obligations | |||||||||||||||||||
Asset retirement obligations | 772,990 | 57,223 | — | — | 715,767 | ||||||||||||||
Total obligations | $ | 945,252 | $ | 216,234 | $ | 13,251 | $ | — | $ | 715,767 | |||||||||
We have entered into employment agreements with two of the Company's senior executives. The employment contracts provide for severance payments in the event of termination by the Company for any reason other than cause or permanent disability, or in the event of a constructive termination, as defined. The agreements provide for the payment of base pay and certain medical and disability benefits for periods ranging form 6 months to 1 year after termination. The total contingent obligations under the employment contracts as of June 30, 2015 was approximately $473,000.
Critical Accounting Policies and Estimates
The preparation of financial statements in accordance with accounting principles generally accepted in the United States of America requires that we select certain accounting policies and make estimates and assumptions that affect the reported amounts of the assets and liabilities and disclosures of contingent assets and liabilities as of the date of the balance sheet as well as the reported amounts of revenues and expenses during the reporting period. These policies, together with our estimates have a significant effect on our consolidated financial statements. Our significant accounting policies are included in Note 2 to the consolidated financial statements. Following is a discussion of our most critical accounting estimates, judgments and uncertainties that are inherent in the preparation of our consolidated financial statements.
Oil and Natural Gas Properties. Companies engaged in the production of oil and natural gas are required to follow accounting rules that are unique to the oil and gas industry. We apply the full cost accounting method for our oil and natural gas properties as prescribed by SEC Regulation S-X Rule 4-10. Under this method of accounting, the costs of unsuccessful, as well as successful, exploration and development activities are capitalized as properties and equipment. This includes any internal costs that are directly related to property acquisition, exploration and development activities but does not include any costs related to production, general corporate overhead or similar activities. Gain or loss on the sale or other disposition of oil and gas properties is not recognized, unless the gain or loss would significantly alter the relationship between capitalized costs and proved reserves. Oil and natural gas properties include costs that are excluded from costs being depleted or amortized. Oil and natural gas property costs excluded represent investments in unevaluated properties and include non-producing leasehold, geological and geophysical costs associated with leasehold or drilling interests and exploration drilling costs. We exclude these costs until the property has been evaluated. Costs are transferred to the full cost pool as the properties are evaluated. As of June 30, 2015, we had no unevaluated properties costs.
Estimates of Proved Reserves. The estimated quantities of proved oil and natural gas reserves have a significant impact on the underlying financial statements. The estimated quantities of proved reserves are used to calculate depletion expense, and the estimated future net cash flows associated with those proved reserves is the basis in determining impairment under the quarterly ceiling test calculation. The process of estimating oil and natural gas reserves is very complex, requiring significant decisions in the evaluation of all available geological, geophysical, engineering and economic data. Estimated reserves are often subject to future revisions, which could be substantial, based on the availability of additional information, including reservoir performance, additional development activity, new geological and geophysical data, additional drilling, technological advancements, price changes and other economic factors. As a result, material revisions to existing reserve estimates may occur from time to time. Although every reasonable effort is made to ensure that the reported reserve estimates represent the most accurate assessments possible, including the hiring of independent engineers to prepare our reserve estimates, the subjective decisions and variances in available data for the properties make these estimates generally less precise than other estimates included in our financial statements. Material revisions to reserve estimates and / or significant changes in commodity prices could substantially affect our estimated future net cash flows of our proved reserves, affecting our quarterly ceiling test calculation and could significantly affect our depletion rate. A 10% decrease in commodity prices used to determine our proved reserves and Standardized Measure as of June 30, 2015 would not have resulted in an impairment of our oil and natural gas properties. Holding all other factors constant, a reduction in the Company's proved reserve estimates at June 30, 2015 of 5%,
33
10% and 15% would affect depreciation, depletion and amortization expense by approximately $242,000, $509,000 and $808,000, respectively.
On December 31, 2008, the SEC issued its final rule on the modernization of reporting oil and gas reserves. The rule allows consideration of new technologies in evaluating reserves, generally limits the designation of proved reserves to those projects forecast to be commenced within five years of the end of the period, allows companies to disclose their probable and possible reserves to investors, requires reporting of oil and gas reserves using an average price based on the previous 12-month unweighted arithmetic average first-day-of-the-month price rather than year-end prices, revises the disclosure requirements for oil and gas operations, and revises accounting for the limitation on capitalized costs for full cost companies.
Valuation of Deferred Tax Assets. We make certain estimates and judgments in determining our income tax expense for financial reporting purposes. These estimates and judgments occur in the calculation of certain tax assets and liabilities that arise from differences in the timing and recognition of revenue and expense for tax and financial reporting purposes. Our federal and state income tax returns are generally not prepared or filed before the consolidated financial statements are prepared or filed; therefore, we estimate the tax basis of our assets and liabilities at the end of each period as well as the effects of tax rate changes, tax credits, and net operating loss carry backs and carry forwards. Adjustments related to these estimates are recorded in our tax provision in the period in which we file our income tax returns. Further, we must assess the likelihood that we will be able to recover or utilize our deferred tax assets (primarily our net operating loss). If recovery is not likely, we must record a valuation allowance against such deferred tax assets for the amount we would not expect to recover, which would result in an increase to our income tax expense. As of June 30, 2015, we have recorded a valuation allowance for the portion of our net operating loss that is limited by IRS Section 382.
Management considers the scheduled reversal of deferred tax liabilities, projected future taxable income, and tax planning strategies in making the assessment of the ultimate realization of deferred tax assets. Based upon the level of historical taxable income and projections for future taxable income over the periods for which the deferred tax assets are deductible, as of end of the current fiscal year, we believe that it is more likely than not that the Company will realize the benefits of its net deferred tax assets. If our estimates and judgments change regarding our ability to utilize our deferred tax assets, our tax provision would increase in the period it is determined that recovery is not probable.
Stock-based Compensation. We estimate the fair value of stock option awards on the date of grant using the Black-Scholes option pricing model. This valuation method requires the input of certain assumptions, including expected stock price volatility, expected term of the award, the expected risk-free interest rate, and the expected dividend yield of the Company's stock. The risk-free interest rate used is the U.S. Treasury yield for bonds matching the expected term of the option on the date of grant. Because of our limited trading experience of our common stock and limited exercise history of our stock option awards, estimating the volatility and expected term is very subjective. We base our estimate of our expected future volatility on peer companies whose common stock has been trading longer than ours, along with our own limited trading history while operating as an oil and natural gas producer. Future estimates of our stock volatility could be substantially different from our current estimate, which could significantly affect the amount of expense we recognize for our stock-based compensation awards.
Off Balance Sheet Arrangements
The Company has no off-balance sheet arrangements as of June 30, 2015.
Item 7A. Quantitative and Qualitative Disclosures About Market Risks
Interest Rate Risk
We are exposed to changes in interest rates. Changes in interest rates affect the interest earned on our cash and cash equivalents. Under our current policies, we do not use interest rate derivative instruments to manage exposure to interest rate changes.
Commodity Price Risk
Our most significant market risk is the pricing for crude oil, natural gas and NGLs. We expect energy prices to remain volatile and unpredictable. If energy prices decline significantly, revenues and cash flow would significantly decline. In addition, a non-cash write-down of our oil and gas properties could be required under full cost accounting rules if future oil and gas commodity prices sustained a significant decline. Prices also affect the amount of cash flow available for capital expenditures and our ability to borrow and raise additional capital, as, if and when needed. We use derivative instruments to manage our exposure to commodity price risk from time to time based on our assessment of such risk.
34
Item 8. Financial Statements
Index to Consolidated Financial Statements
35
REPORT OF INDEPENDENT REGISTERED PUBLIC ACCOUNTING FIRM
To the Board of Directors and Stockholders
Evolution Petroleum Corporation
We have audited the accompanying consolidated balance sheets of Evolution Petroleum Corporation and subsidiaries (the "Company") as of June 30, 2015 and 2014, and the related consolidated statements of operations, changes in stockholders’ equity, and cash flows for each of the three years in the period ended June 30, 2015. These financial statements are the responsibility of the Company’s management. Our responsibility is to express an opinion on these financial statements based on our audits.
We conducted our audits in accordance with the standards of the Public Company Accounting Oversight Board (United States). Those standards require that we plan and perform the audits to obtain reasonable assurance about whether the financial statements are free of material misstatement. An audit includes examining, on a test basis, evidence supporting the amounts and disclosures in the financial statements. An audit also includes assessing the accounting principles used and significant estimates made by management, as well as evaluating the overall financial statement presentation. We believe that our audits provide a reasonable basis for our opinion.
In our opinion, the consolidated financial statements referred to above present fairly, in all material respects, the financial position of Evolution Petroleum Corporation and subsidiaries as of June 30, 2015 and 2014, and the results of their operations and their cash flows for each of the three years in the period ended June 30, 2015, in conformity with U.S. generally accepted accounting principles.
We have also audited, in accordance with the standards of the Public Company Accounting Oversight Board (United States), Evolution Petroleum Corporation and subsidiaries’ internal control over financial reporting as of June 30, 2015, based on criteria established in Internal Control-Integrated Framework issued by the Committee of Sponsoring Organizations of the Treadway Commission in 2013, and our report dated September 11, 2015 expressed an unqualified opinion on the effectiveness of Evolution Petroleum Corporation’s internal control over financial reporting.
Hein & Associates LLP
Houston, Texas
September 11, 2015
36
REPORT OF INDEPENDENT REGISTERED PUBLIC ACCOUNTING FIRM
To the Board of Directors and Stockholders
Evolution Petroleum Corporation
We have audited Evolution Petroleum Corporation’s internal control over financial reporting as of June 30, 2015, based on criteria established in Internal Control-Integrated Framework issued by the Committee of Sponsoring Organizations of the Treadway Commission in 2013. Evolution Petroleum Corporation’s management is responsible for maintaining effective internal control over financial reporting and for its assessment of the effectiveness of internal control over financial reporting included in the accompanying Management’s Report on Internal Control Over Financial Reporting. Our responsibility is to express an opinion on the Company’s internal control over financial reporting based on our audit.
We conducted our audit in accordance with the standards of the Public Company Accounting Oversight Board (United States). Those standards require that we plan and perform the audit to obtain reasonable assurance about whether effective internal control over financial reporting was maintained in all material respects. Our audit included obtaining an understanding of internal control over financial reporting, assessing the risk that a material weakness exists, and testing and evaluating the design and operating effectiveness of internal control based on the assessed risk. Our audit also included performing such other procedures as we considered necessary in the circumstances. We believe that our audit provides a reasonable basis for our opinion.
A company’s internal control over financial reporting is a process designed to provide reasonable assurance regarding the reliability of financial reporting and the preparation of financial statements for external purposes in accordance with generally accepted accounting principles. A company’s internal control over financial reporting includes those policies and procedures that (a) pertain to the maintenance of records that, in reasonable detail, accurately and fairly reflect the transactions and dispositions of the assets of the company; (b) provide reasonable assurance that transactions are recorded as necessary to permit preparation of financial statements in accordance with generally accepted accounting principles, and that receipts and expenditures of the company are being made only in accordance with authorizations of management and directors of the company; and (c) provide reasonable assurance regarding prevention or timely detection of unauthorized acquisition, use, or disposition of the company’s assets that could have a material effect on the financial statements.
Because of its inherent limitations, internal control over financial reporting may not prevent or detect misstatements. Also, projections of any evaluation of effectiveness to future periods are subject to the risk that controls may become inadequate because of changes in conditions, or that the degree of compliance with the policies or procedures may deteriorate.
In our opinion, Evolution Petroleum Corporation maintained, in all material respects, effective internal control over financial reporting as of June 30, 2015, based on criteria established in Internal Control-Integrated Framework issued by the Committee of Sponsoring Organizations of the Treadway Commission in 2013.
We have also audited, in accordance with the standards of the Public Company Accounting Oversight Board (United States), the consolidated balance sheets of Evolution Petroleum Corporation and subsidiaries as of June 30, 2015 and 2014, and the related consolidated statements of operations, changes in stockholders’ equity, and cash flows for each of the three years in the period ended June 30, 2015, and our report dated September 11, 2015 expressed an unqualified opinion.
Hein & Associates LLP
Houston, Texas
September 11, 2015
37
Evolution Petroleum Corporation and Subsidiaries
Consolidated Balance Sheets
June 30, 2015 | June 30, 2014 | ||||||
Assets | |||||||
Current assets | |||||||
Cash and cash equivalents | $ | 20,118,757 | $ | 23,940,514 | |||
Receivables | 3,122,473 | 1,457,212 | |||||
Deferred tax asset | 82,414 | 159,624 | |||||
Prepaid expenses and other current assets | 369,404 | 747,453 | |||||
Total current assets | 23,693,048 | 26,304,803 | |||||
Property and equipment, net of depreciation, depletion, and amortization | |||||||
Oil and natural gas properties—full-cost method of accounting, of which none were excluded from amortization | 45,186,886 | 37,822,070 | |||||
Other property and equipment, net | 276,756 | 424,827 | |||||
Total property and equipment, net | 45,463,642 | 38,246,897 | |||||
Other assets | 726,037 | 464,052 | |||||
Total assets | $ | 69,882,727 | $ | 65,015,752 | |||
Liabilities and Stockholders' Equity | |||||||
Current liabilities | |||||||
Accounts payable | $ | 8,173,878 | $ | 441,722 | |||
Accrued liabilities and other | 855,373 | 2,558,004 | |||||
Derivative liabilities, net | 109,974 | — | |||||
State and federal taxes payable | 190,032 | — | |||||
Total current liabilities | 9,329,257 | 2,999,726 | |||||
Long term liabilities | |||||||
Deferred income taxes | 11,242,551 | 9,897,272 | |||||
Asset retirement obligations | 715,767 | 205,512 | |||||
Deferred rent | 18,575 | 35,720 | |||||
Total liabilities | 21,306,150 | 13,138,230 | |||||
Commitments and contingencies (Note 17) | |||||||
Stockholders' equity | |||||||
Preferred stock, par value $0.001; 5,000,000 shares authorized: 8.5% Series A Cumulative Preferred Stock, 1,000,000 shares designated, 317,319 shares issued and outstanding at June 30, 2015 and 2014, respectively, with a total liquidation preference of $7,932,975 ($25.00 per share) | 317 | 317 | |||||
Common stock; par value $0.001; 100,000,000 shares authorized: issued and outstanding 32,845,205 and 32,615,646 shares as of June 30, 2015 and 2014, respectively | 32,845 | 32,615 | |||||
Additional paid-in capital | 36,847,289 | 34,632,377 | |||||
Retained earnings | 11,696,126 | 17,212,213 | |||||
Total stockholders' equity | 48,576,577 | 51,877,522 | |||||
Total liabilities and stockholders' equity | $ | 69,882,727 | $ | 65,015,752 | |||
See accompanying notes to consolidated financial statements.
38
Evolution Petroleum Corporation and Subsidiaries
Consolidated Statements of Operations
Years Ended June 30, | |||||||||||
2015 | 2014 | 2013 | |||||||||
Revenues | |||||||||||
Delhi field | $ | 27,573,641 | $ | 16,908,666 | $ | 19,219,036 | |||||
Artificial lift technology | 247,255 | 623,332 | 375,063 | ||||||||
Other properties | 20,369 | 141,510 | 1,755,821 | ||||||||
Total revenues | 27,841,265 | 17,673,508 | 21,349,920 | ||||||||
Operating costs | |||||||||||
Production costs - Delhi field | 8,516,323 | — | — | ||||||||
Production costs - artificial lift technology | 743,802 | 609,221 | 390,238 | ||||||||
Production costs - other properties | 95,488 | 584,352 | 1,390,500 | ||||||||
Depreciation, depletion and amortization | 3,615,737 | 1,228,685 | 1,300,207 | ||||||||
Accretion of discount on asset retirement obligations | 34,866 | 41,626 | 72,312 | ||||||||
General and administrative expenses* | 6,256,783 | 8,388,291 | 7,495,309 | ||||||||
Restructuring charges** | (5,431 | ) | 1,293,186 | — | |||||||
Total operating costs | 19,257,568 | 12,145,361 | 10,648,566 | ||||||||
Income from operations | 8,583,697 | 5,528,147 | 10,701,354 | ||||||||
Other | |||||||||||
(Loss) on derivative instruments, net | (109,974 | ) | — | — | |||||||
Interest income | 35,991 | 30,256 | 22,580 | ||||||||
Interest (expense) | (73,636 | ) | (69,092 | ) | (65,745 | ) | |||||
Income before income tax provision | 8,436,078 | 5,489,311 | 10,658,189 | ||||||||
Income tax provision | 3,444,221 | 1,891,998 | 4,029,761 | ||||||||
Net income attributable to the Company | 4,991,857 | 3,597,313 | 6,628,428 | ||||||||
Dividends on preferred stock | 674,302 | 674,302 | 674,302 | ||||||||
Net income attributable to common shareholders | $ | 4,317,555 | $ | 2,923,011 | $ | 5,954,126 | |||||
Earnings per common share | |||||||||||
Basic | $ | 0.13 | $ | 0.09 | $ | 0.21 | |||||
Diluted | $ | 0.13 | $ | 0.09 | $ | 0.19 | |||||
Weighted average number of common shares outstanding | |||||||||||
Basic | 32,817,456 | 30,895,832 | 28,205,467 | ||||||||
Diluted | 32,924,018 | 32,564,067 | 31,975,131 | ||||||||
_______________________________________________________________________________
* | General and administrative expenses for the years ended June 30, 2015, 2014 and 2013 included non-cash stock-based compensation expense of $943,653, $1,352,322, and $1,531,745, respectively. |
** | Restructuring charges for the year ended June 30, 2014 included non-cash stock-based compensation expense of $376,365. |
See accompanying notes to consolidated financial statements.
39
Evolution Petroleum Corporation and Subsidiaries
Consolidated Statements of Cash Flows
Years Ended June 30, | |||||||||||
2015 | 2014 | 2013 | |||||||||
Cash flows from operating activities | |||||||||||
Net income attributable to the Company | $ | 4,991,857 | $ | 3,597,313 | $ | 6,628,428 | |||||
Adjustments to reconcile net income to net cash provided by operating activities: | |||||||||||
Depreciation, depletion and amortization | 3,664,373 | 1,272,778 | 1,341,055 | ||||||||
Stock-based compensation | 943,653 | 1,352,322 | 1,531,745 | ||||||||
Stock-based compensation related to restructuring | — | 376,365 | — | ||||||||
Accretion of discount on asset retirement obligations | 34,866 | 41,626 | 72,312 | ||||||||
Settlement of asset retirement obligations | (223,564 | ) | (315,952 | ) | (90,531 | ) | |||||
Deferred income taxes | 1,422,489 | 1,344,812 | 2,512,978 | ||||||||
Deferred rent | (17,145 | ) | (17,145 | ) | (17,146 | ) | |||||
Loss on derivative instruments, net | 109,974 | — | — | ||||||||
Changes in operating assets and liabilities: | |||||||||||
Receivables from oil and natural gas sales | (1,666,009 | ) | 176,707 | (289,506 | ) | ||||||
Receivables from income taxes and other | 748 | 281,822 | (189,813 | ) | |||||||
Due from joint interest partners | — | 49,063 | 47,088 | ||||||||
Prepaid expenses and other current assets | 378,049 | (480,899 | ) | (33,121 | ) | ||||||
Accounts payable and accrued expenses | 551,452 | 663,645 | 278,436 | ||||||||
Income taxes payable | 190,032 | (233,548 | ) | 141,581 | |||||||
Net cash provided by operating activities | 10,380,775 | 8,108,909 | 11,933,506 | ||||||||
Cash flows from investing activities | |||||||||||
Proceeds from asset sales | 398,242 | 542,347 | 3,479,976 | ||||||||
Development of oil and natural gas properties | (4,890,909 | ) | (966,931 | ) | (4,163,080 | ) | |||||
Acquisitions of oil and natural gas properties | — | (59,315 | ) | (755,194 | ) | ||||||
Capital expenditures for technology and other equipment | (313,059 | ) | (312,890 | ) | — | ||||||
Maturities of certificates of deposit | — | 250,000 | — | ||||||||
Other assets | (236,559 | ) | (202,017 | ) | (32,160 | ) | |||||
Net cash used by investing activities | (5,042,285 | ) | (748,806 | ) | (1,470,458 | ) | |||||
Cash flows from financing activities | |||||||||||
Proceeds from the exercise of stock options | 141,600 | 3,252,801 | 70,719 | ||||||||
Acquisitions of treasury stock | (333,841 | ) | (1,655,251 | ) | (137,818 | ) | |||||
Common stock dividends paid | (9,833,642 | ) | (9,723,833 | ) | — | ||||||
Preferred stock dividends paid | (674,302 | ) | (674,302 | ) | (674,302 | ) | |||||
Deferred loan costs | (94,075 | ) | (63,535 | ) | (16,211 | ) | |||||
Tax benefits related to stock-based compensation | 1,633,946 | 509,096 | 794,569 | ||||||||
Other | 67 | 6,850 | 32 | ||||||||
Net cash provided (used) by financing activities | (9,160,247 | ) | (8,348,174 | ) | 36,989 | ||||||
Net increase (decrease) in cash and cash equivalents | (3,821,757 | ) | (988,071 | ) | 10,500,037 | ||||||
Cash and cash equivalents, beginning of year | 23,940,514 | 24,928,585 | 14,428,548 | ||||||||
Cash and cash equivalents, end of year | $ | 20,118,757 | $ | 23,940,514 | $ | 24,928,585 | |||||
See accompanying notes to consolidated financial statements.
40
Evolution Petroleum Corporation and Subsidiaries
Consolidated Statement of Changes in Stockholders' Equity
For the Years Ended June 30, 2015, 2014 and 2013
Preferred | Common Stock | ||||||||||||||||||||||||||||
Additional Paid-in Capital | Retained Earnings | Treasury Stock | Total Stockholders' Equity | ||||||||||||||||||||||||||
Shares | Par Value | Shares | Par Value | ||||||||||||||||||||||||||
Balance, June 30, 2012 | 317,319 | $ | 317 | 27,882,224 | $ | 28,670 | $ | 29,416,914 | $ | 18,058,909 | $ | (882,022 | ) | $ | 46,622,788 | ||||||||||||||
Issuance of restricted common stock | — | — | 211,197 | 211 | (179 | ) | — | — | 32 | ||||||||||||||||||||
Exercise of stock options | — | — | 529,237 | 529 | 70,190 | — | — | 70,719 | |||||||||||||||||||||
Stock exchanged for payroll tax liabilities | — | — | (13,689 | ) | — | — | — | (137,818 | ) | (137,818 | ) | ||||||||||||||||||
Stock-based compensation | — | — | — | — | 1,531,745 | — | — | 1,531,745 | |||||||||||||||||||||
Tax benefits related to stock-based compensation | — | — | — | — | 794,569 | — | — | 794,569 | |||||||||||||||||||||
Net income | — | — | — | — | — | 6,628,428 | — | 6,628,428 | |||||||||||||||||||||
Preferred stock cash dividends | — | — | — | — | — | (674,302 | ) | — | (674,302 | ) | |||||||||||||||||||
Balance, June 30, 2013 | 317,319 | 317 | 28,608,969 | 29,410 | 31,813,239 | 24,013,035 | (1,019,840 | ) | 54,836,161 | ||||||||||||||||||||
Issuance of restricted common stock | — | — | 39,732 | 40 | (40 | ) | — | — | — | ||||||||||||||||||||
Exercise of warrants | — | — | 905,391 | 905 | (905 | ) | — | — | — | ||||||||||||||||||||
Exercise of stock options | — | — | 3,299,367 | 3,299 | 3,868,108 | — | — | 3,871,407 | |||||||||||||||||||||
Forfeitures of restricted stock | — | — | (51,099 | ) | (51 | ) | 51 | — | — | — | |||||||||||||||||||
Acquisitions of treasury stock | — | — | (186,714 | ) | — | — | — | (2,273,857 | ) | (2,273,857 | ) | ||||||||||||||||||
Stock-based compensation * | — | — | — | — | 1,728,687 | — | — | 1,728,687 | |||||||||||||||||||||
Retirements of treasury stock | — | — | — | (988 | ) | (3,292,709 | ) | — | 3,293,697 | — | |||||||||||||||||||
Tax benefits related to stock-based compensation | — | — | — | — | 509,096 | — | — | 509,096 | |||||||||||||||||||||
Net income | — | — | — | — | — | 3,597,313 | — | 3,597,313 | |||||||||||||||||||||
Common stock cash dividends | — | — | — | — | — | (9,723,833 | ) | — | (9,723,833 | ) | |||||||||||||||||||
Preferred stock cash dividends | — | — | — | — | — | (674,302 | ) | — | (674,302 | ) | |||||||||||||||||||
Recovery of short swing profits | — | — | — | — | 6,850 | — | — | 6,850 | |||||||||||||||||||||
Balance, June 30, 2014 | 317,319 | 317 | 32,615,646 | 32,615 | 34,632,377 | 17,212,213 | — | 51,877,522 | |||||||||||||||||||||
Issuance of restricted common stock | — | — | 213,466 | 214 | (147 | ) | — | — | 67 | ||||||||||||||||||||
Exercise of stock options | — | — | 87,000 | 87 | 141,513 | — | — | 141,600 | |||||||||||||||||||||
Acquisition of treasury stock | — | — | (70,907 | ) | — | — | — | (504,124 | ) | (504,124 | ) | ||||||||||||||||||
Retirements of treasury stock | — | — | — | (71 | ) | (504,053 | ) | — | 504,124 | — | |||||||||||||||||||
Stock-based compensation | — | — | — | — | 943,653 | — | — | 943,653 | |||||||||||||||||||||
Tax benefits related to stock-based compensation | — | — | — | — | 1,633,946 | — | — | 1,633,946 | |||||||||||||||||||||
Net income | — | — | — | — | — | 4,991,857 | — | 4,991,857 | |||||||||||||||||||||
Common stock cash dividends | — | — | — | — | — | (9,833,642 | ) | — | (9,833,642 | ) | |||||||||||||||||||
Preferred stock cash dividends | — | — | — | — | — | (674,302 | ) | — | (674,302 | ) | |||||||||||||||||||
Balance, June 30, 2015 | 317,319 | $ | 317 | 32,845,205 | $ | 32,845 | $ | 36,847,289 | $ | 11,696,126 | $ | — | $ | 48,576,577 | |||||||||||||||
* Includes $376,365 of stock compensation reflected in restructuring charges.
See accompanying notes to consolidated financial statements.
41
EVOLUTION PETROLEUM CORPORATION AND SUBSIDIARIES
NOTES TO CONSOLIDATED FINANCIAL STATEMENTS
Note 1—Organization and Basis of Preparation
Nature of Operations. Evolution Petroleum Corporation ("EPM") and its subsidiaries (the "Company", "we", "our" or "us"), is an independent petroleum company headquartered in Houston, Texas and incorporated under the laws of the State of Nevada. We are engaged primarily in the development of oil and gas reserves within known oil and gas resources for our shareholders and customers utilizing conventional and proprietary technology.
Principles of Consolidation and Reporting. Our consolidated financial statements include the accounts of EPM and its wholly-owned subsidiaries. All significant intercompany transactions have been eliminated in consolidation. The consolidated financial statements for the previous year include certain reclassifications that were made to conform to the current presentation. Such reclassifications have no impact on previously reported income or stockholders' equity.
Use of Estimates. The preparation of financial statements in conformity with accounting principles generally accepted in the United States of America ("GAAP") requires us to make estimates and assumptions that affect the reported amounts of assets and liabilities at the dates of the financial statements and the reported amounts of revenues and expenses during the reporting periods. Significant estimates include reserve quantities and estimated future cash flows associated with proved reserves, which significantly impact depletion expense and potential impairments of oil and natural gas properties, income taxes and the valuation of deferred tax assets, stock-based compensation and commitments and contingencies. We analyze our estimates based on historical experience and various other assumptions that we believe to be reasonable. While we believe that our estimates and assumptions used in preparation of the consolidated financial statements are appropriate, actual results could differ from those estimates.
Note 2—Summary of Significant Accounting Policies
Cash and Cash Equivalents. We consider all highly liquid investments, with original maturities of 90 days or less when purchased, to be cash and cash equivalents.
Account Receivable and Allowance for Doubtful Accounts. Accounts receivable consist of uncollateralized joint interest owner obligations due within 30 days of the invoice date, uncollateralized accrued revenues due under normal trade terms, generally requiring payment within 30 days of production, and other miscellaneous receivables. No interest is charged on past-due balances. Payments made on accounts receivable are applied to the earliest unpaid items. We establish provisions for losses on accounts receivables if it is determined that collection of all or a part of an outstanding balance is not probable. Collectibility is reviewed regularly and an allowance is established or adjusted, as necessary, using the specific identification method. As of June 30, 2015 and 2014, no allowance for doubtful accounts was considered necessary.
Oil and Natural Gas Properties. We use the full cost method of accounting for our investments in oil and natural gas properties. Under this method of accounting, all costs incurred in the acquisition, exploration and development of oil and natural gas properties, including unproductive wells, are capitalized. This includes any internal costs that are directly related to property acquisition, exploration and development activities but does not include any costs related to production, general corporate overhead or similar activities. Gain or loss on the sale or other disposition of oil and natural gas properties is not recognized, unless the gain or loss would significantly alter the relationship between capitalized costs and proved reserves.
Oil and natural gas properties include costs that are excluded from costs being depleted or amortized. Excluded costs represent investments in unproved and unevaluated properties and include non-producing leasehold, geological and geophysical costs associated with leasehold or drilling interests and exploration drilling costs. We exclude these costs until the project is evaluated and proved reserves are established or impairment is determined. Excluded costs are reviewed at least quarterly to determine if impairment has occurred. The amount of any evaluated or impaired oil and natural gas properties is transferred to capitalized costs being amortized.
Limitation on Capitalized Costs. Under the full-cost method of accounting, we are required, at the end of each fiscal quarter, to perform a test to determine the limit on the book value of our oil and natural gas properties (the "Ceiling Test"). If the capitalized costs of our oil and natural gas properties, net of accumulated amortization and related deferred income taxes, exceed the "Ceiling", this excess or impairment is charged to expense and reflected as additional accumulated depreciation, depletion and amortization or as a credit to oil and natural gas properties. The expense may not be reversed in future periods, even though higher oil and natural gas prices may subsequently increase the Ceiling. The Ceiling is defined as the sum of: (a) the present value, discounted at 10 percent, and assuming continuation of existing economic conditions, of 1) estimated future gross revenues from proved reserves, which is computed using oil and natural gas prices determined as the unweighted
42
EVOLUTION PETROLEUM CORPORATION AND SUBSIDIARIES
NOTES TO CONSOLIDATED FINANCIAL STATEMENTS (Continued)
arithmetic average of the first-day-of-the-month price for each month within the 12-month period prior to the end of the reporting period (with consideration of price changes only to the extent provided by contractual arrangements including hedging arrangements pursuant to SAB 103), less 2) estimated future expenditures (based on current costs) to be incurred in developing and producing the proved reserves; plus (b) the cost of properties not being amortized (pursuant to Reg. S-X Rule 4-10 (c)(3)(ii)); plus (c) the lower of cost or estimated fair value of unproven properties included in the costs being amortized; net of (d) the related tax effects related to the difference between the book and tax basis of our oil and natural gas properties. Our Ceiling Test did not result in an impairment of our oil and natural gas properties during the years ended June 30, 2015, 2014 or 2013.
Other Property and Equipment. Other property and equipment includes leasehold improvements, data processing and telecommunications equipment, office furniture and equipment, and oilfield service equipment related to our artificial lift technology operations. These items are recorded at cost and depreciated over expected lives of the individual assets or group of assets, which range from three to seven years. The assets are depreciated using the straight-line method, except for oilfield service equipment related to our artificial lift technology operations, which is depreciated using a method which approximates the timing and amounts of expected revenues from the contract. Realization of the carrying value of other property and equipment is reviewed for possible impairment whenever events or changes in circumstances indicate that the carrying amount may not be recoverable. Assets are determined to be impaired if a forecast of undiscounted estimated future net operating cash flows directly related to the asset, including disposal value, if any, is less than the carrying amount of the asset. If any asset is determined to be impaired, the loss is measured as the amount by which the carrying amount of the asset exceeds its fair value. Repairs and maintenance costs are expensed in the period incurred.
Deferred Financing Costs. The Company capitalizes costs incurred in connection with obtaining financing. These costs are included in other assets on the Company's consolidated balance sheet and are amortized over the term of the related financing using the straight-line method, which approximates the effective interest method.
Asset Retirement Obligations. An asset retirement obligation associated with the retirement of a tangible long-lived asset is recognized as a liability in the period incurred, with an associated increase in the carrying amount of the related long-lived asset, our oil and natural gas properties. The cost of the tangible asset, including the asset retirement cost, is depleted over the useful life of the asset. The initial recognition or subsequent revision of asset retirement cost is considered a level 3 fair value measurement. The asset retirement obligation is recorded at its estimated fair value, measured by reference to the expected future cash outflows required to satisfy the retirement obligation discounted at our credit-adjusted risk-free interest rate. Accretion expense is recognized over time as the discounted liability is accreted to its expected settlement value. If the estimated future cost of the asset retirement obligation changes, an adjustment is recorded to both the asset retirement obligation and the long-lived asset. Revisions to estimated asset retirement obligations can result from changes in retirement cost estimates, revisions to estimated inflation rates and changes in the estimated timing of abandonment.
Fair Value of Financial Instruments.Our financial instruments consist of cash and cash equivalents, certificates of deposit, accounts receivable, accounts payable and derivative instruments. Except for derivatives, the carrying amounts of these approximate fair value due to the highly liquid nature of these short-term instruments. The fair values of the Company’s derivative assets and liabilities are based on a third-party industry-standard pricing model that uses market data obtained from third-party sources, including quoted forward prices for oil and gas, discount rates and volatility factors.
Stock-based Compensation. Estimated grant date fair value of stock-based compensation awards is determined to provide the basis for future compensation expense. Service-and performance-based Restricted Stock and Contingent Restricted Stock awards are valued using the market price of our common stock on the grant date. For market-based awards, which reflect future returns of our common stock, the fair value and expected vesting period are determined using a Monte Carlo simulation based on the historical volatility of the Company's total return compared to the historical volatilities of the other companies comprising a benchmark index. We used the Black-Scholes option-pricing model to determine grant date fair value of our past Stock Option and Incentive Warrant awards. For service-based awards stock-based compensation equal to grant date fair value is recognized ratably over the requisite service period as the award vests. A performance-based award vests upon attaining the award's operational goal and requires that the recipient remain an employee of the Company upon vesting. Stock-based compensation expense equal to grant date fair value is recognized ratably over the expected vesting period when it is deemed probable, for accounting purposes, that the performance goal will be achieved. The expected vesting period may be deemed to be shorter than the remainder of the award’s term. For a market-based award stock-based compensation expense equal to grant date fair value is recognized ratably over the expected vesting period, so long as the award holder remains an employee of the Company. Total compensation expense is independent of vesting or expiration of the awards, except for termination of service.
43
EVOLUTION PETROLEUM CORPORATION AND SUBSIDIARIES
NOTES TO CONSOLIDATED FINANCIAL STATEMENTS (Continued)
Revenue Recognition - Oil and Gas. We recognize oil and natural gas revenue from our interests in producing wells at the time that title passes to the purchaser. As a result, we accrue revenues related to production sold for which we have not received payment.
Revenue Recognition - Artificial Lift Technology. Our artificial lift technology operations may generate revenues under several forms of operational or contractual arrangements. We have utilized the technology on wells that we develop and operate and on certain wells that we operate under farm-outs from other operators. In these cases, our revenues take the form of net sales of oil and gas production. We have also provided the technology to third parties under contractual arrangements that generate fees for the technology which are based on the net profits from oil and gas production. Under these contracts, we may be required to bear part or all of the incremental installation and capital costs for the technology. In other cases, we may be compensated for our technology through a fixed or variable fee per well, which does not require us to bear any net costs of installation or other capital costs. In the future, we may enter into licensing contracts which allow for the sale and installation of the technology by third parties to their customers or we may license the technology to larger organizations for use in specified geographic areas or on other broad terms. In all cases, we evaluate the substance of the contractual arrangement and recognize revenues over the life of the contract as the earnings process is determined to be complete. We likewise charge our costs, including both capital expenditures and operating expenses, to operating costs in a manner which either matches these costs to the timing of expected revenues, where appropriate, or charges these costs to the accounting period in which they were incurred where it is not appropriate to capitalize or defer them to match with revenues.
Derivative Instruments. In early June 2015, the Company initiated derivative transactions using costless collars to reduce its exposure to oil price volatility for a substantial portion of its forecasted production for the months of July 2015 through December 2015. All derivative instruments are recorded on the consolidated balance sheet as either an asset or liability measured at fair value. The Company nets its derivative instrument fair value amounts executed with the same counterparty pursuant to a ISDA master agreement, which provides for net settlement over the term of the contract and in the event of default or termination of the contract. Although the derivative instruments provide an economic hedge of the Company’s exposure to commodity price volatility, because the Company elected not to meet the criteria to qualify its derivative instruments for hedge accounting treatment, net gains and losses as a result of changes in the fair value of derivative instruments are recognized as gain or (loss) on derivatives in the consolidated statements of operations in the period in which the changes occur. The net cash flows resulting from the payments to and receipts from the counterparty as a result of derivative settlements are classified as cash flows from investing activities. The Company does not intend to enter into derivative instruments for speculative or trading purposes.
Depreciation, Depletion and Amortization. The depreciable base for oil and natural gas properties includes the sum of all capitalized costs net of DD&A, estimated future development costs and asset retirement costs not included in oil and natural gas properties, less costs excluded from amortization. The depreciable base of oil and natural gas properties is amortized using the unit-of-production method over total proved reserves. Other property, consisting of leasehold improvements, office and computer equipment, vehicles and artificial lift equipment is depreciated as described above in Other Property and Equipment.
Intangible Assets - Intellectual Property. The Company capitalizes the external costs, consisting primarily of legal costs, related to securing its patents and trademarks. The costs related to patents are amortized over the remaining patent life which is less than the expected useful life of each patent. Trademarks are perpetual and are not amortized.
Income Taxes. We recognize deferred tax assets and liabilities based on the differences between the tax basis of assets and liabilities and their reported amounts in the financial statements that may result in taxable or deductible amounts in future years. The measurement of deferred tax assets may be reduced by a valuation allowance based upon management's assessment of available evidence if it is deemed more likely than not some or all of the deferred tax assets will not be realizable. We recognize a tax benefit from an uncertain position when it is more likely than not that the position will be sustained upon examination, based on the technical merits of the position and will record the largest amount of tax benefit that is greater than 50% likely of being realized upon settlement with a taxing authority. The Company classifies any interest and penalties associated with income taxes as income tax expense.
Earnings (loss) per share. Basic earnings (loss) per share ("EPS") is computed by dividing earnings or loss by the weighted-average number of common shares outstanding less any non-vested restricted common stock outstanding. The computation of diluted EPS is similar to the computation of basic EPS, except that the denominator is increased to include the number of additional common shares that would have been outstanding if potential dilutive common shares had been issued. Our potential dilutive common shares are our outstanding stock options, warrants, and non-vested restricted common stock. The dilutive effect of our potential dilutive common shares is reflected in diluted EPS by application of the treasury stock method. Under the treasury stock method, exercise of stock options and warrants shall be assumed at the beginning of the period (or at time of issuance, if later) and common shares shall be assumed to be issued; the proceeds from exercise shall be assumed to be
44
EVOLUTION PETROLEUM CORPORATION AND SUBSIDIARIES
NOTES TO CONSOLIDATED FINANCIAL STATEMENTS (Continued)
used to purchase common stock at the average market price during the period; and the incremental shares (the difference between the number of shares assumed issued and the number of shares assumed purchased) shall be included in the denominator of the diluted EPS computation. Potential dilutive common shares are excluded from the computation if their effect is anti-dilutive.
Recent Accounting Pronouncements.
In May 2014, the FASB issued ASU No. 2014-09, Revenue from Contracts with Customers: (Topic 606) to provide guidance on revenue recognition on contracts with customers to transfer goods or services or on contracts for the transfer of nonfinancial assets. ASU 2014-09 requires that revenue recognition on contracts with customers depict the transfer of promised goods or services to customers in an amount that reflects the consideration to which the entity expects to be entitled in exchange for those goods or services. ASU 2014-09 will be effective for fiscal years, and interim periods within those years, beginning after December 15, 2017. The standard provides for either the retrospective or cumulative effect transition method. The Company is currently assessing the impact of the adoption of ASU 2014-09 will have on its consolidated financial statements.
In April 2015, the FASB issued ASU 2015-03 (ASC Subtopic 835-30), Interest-Imputation of Interest: Simplifying the Presentation of Debt Issuance Costs. The amendments in this ASU require that debt issuance costs related to a recognized debt liability be presented in the balance sheet as a direct deduction from the carrying amount of that debt liability. The amendments in this ASU are effective for fiscal years, and interim periods within those years, beginning after December 15, 2015. Early adoption is permitted for financial statements that have not been previously issued. The adoption of this new guidance will not have a material impact on the Company's consolidated financial statements and disclosures.
Note 3—Receivables
As of June 30, 2015 and June 30, 2014 our receivables consisted of the following:
June 30, 2015 | June 30, 2014 | ||||||
Receivables from oil and gas sales | $ | 3,122,155 | $ | 1,456,146 | |||
Other | 318 | 1,066 | |||||
Total receivables | $ | 3,122,473 | $ | 1,457,212 | |||
Note 4—Prepaid Expenses and Other Current Assets
As of June 30, 2015 and June 30, 2014 our prepaid expenses and other current assets consisted of the following:
June 30, 2015 | June 30, 2014 | ||||||
Prepaid insurance | $ | 178,994 | $ | 169,288 | |||
Prepaid federal and state income taxes | 22,542 | 419,999 | |||||
Equipment inventory | 81,538 | 85,888 | |||||
Retainers and deposits | 26,978 | 29,478 | |||||
Other prepaid expenses | 59,352 | 42,800 | |||||
Prepaid expenses and other current assets | $ | 369,404 | $ | 747,453 | |||
45
EVOLUTION PETROLEUM CORPORATION AND SUBSIDIARIES
NOTES TO CONSOLIDATED FINANCIAL STATEMENTS (Continued)
Note 5—Property and Equipment
As of June 30, 2015 and June 30, 2014, our oil and natural gas properties and other property and equipment consisted of the following:
June 30, 2015 | June 30, 2014 | ||||||
Oil and natural gas properties | |||||||
Property costs subject to amortization | $ | 57,718,653 | $ | 47,166,282 | |||
Less: Accumulated depreciation, depletion, and amortization | (12,531,767 | ) | (9,344,212 | ) | |||
Unproved properties not subject to amortization | — | — | |||||
Oil and natural gas properties, net | 45,186,886 | 37,822,070 | |||||
Other property and equipment | |||||||
Furniture, fixtures and office equipment, at cost | 287,680 | 343,178 | |||||
Artificial lift technology equipment, at cost | 319,994 | 377,943 | |||||
Less: Accumulated depreciation | (330,918 | ) | (296,294 | ) | |||
Other property and equipment, net | $ | 276,756 | $ | 424,827 | |||
As of June 30, 2015 and 2014, all oil and gas property costs incurred by the Company were being amortized.
During the year ended June 30, 2014, we incurred $377,943 of costs related to the installation of our artificial lift technology, GARP® on three wells of a five-well program for a third-party customer. Under the contract for these installations, we funded the majority of the incremental equipment and installation costs and receive 25% of the net profits from production, as defined, for as long as the technology remains in the wells.
During the year ended ended June 30, 2015, we incurred $217,733 of additional costs related to the installation on the remaining two wells of this five-well program. Also during the year ended June 30, 2015, we recorded an impairment charge of $275,682 reflecting the unrecovered installation costs of artificial lift equipment, net of estimated residual salvage value, which were associated with three wells of this third-party customer. Artificial lift equipment cost has been reduced by this impairment charge which is included in depreciation, depletion and amortization expense on our consolidated statement of operations.
On October 24, 2014, we sold all of our remaining mineral interest and assets in the Mississippi Lime project for proceeds of $389,165 and the buyer's assumption of all abandonment liabilities.
On December 1, 2013, we sold our producing assets and undeveloped reserves in the Lopez Field in South Texas in return for proceeds of $402,500 and the buyer's assumption of all abandonment liabilities.
The net proceeds from these sales, including the reduction of asset retirement obligations, were recognized as a reduction of the cost of oil and gas properties.
Note 6 — Other Assets
AAs of June 30, 2015 and June 30, 2014 our other assets consisted of the following:
June 30, 2015 | June 30, 2014 | ||||||
Patent costs | 538,276 | 305,592 | |||||
Less: Accumulated amortization of patent costs | (47,063 | ) | (27,050 | ) | |||
Deferred loan costs | 337,078 | 243,003 | |||||
Less: Accumulated amortization of deferred loan costs | (147,057 | ) | (98,421 | ) | |||
Trademarks | 44,803 | 40,928 | |||||
Other assets, net | $ | 726,037 | $ | 464,052 | |||
46
EVOLUTION PETROLEUM CORPORATION AND SUBSIDIARIES
NOTES TO CONSOLIDATED FINANCIAL STATEMENTS (Continued)
Note 7 — Restructuring
On November 1, 2013, we undertook an initiative to refocus our business that resulted in an adjustment of our workforce with less emphasis on engineering and greater emphasis on sales and marketing. In exchange for severance and non-compete agreements with the terminated employees, we recorded a restructuring charge of $1,332,186 representing $376,365 of stock-based compensation from the accelerated vesting of equity awards and $955,821 of severance compensation and benefits to be paid during the twelve months ended December 31, 2014. All of the Company's obligations under these agreements had been fulfilled at December 31, 2014, extinguishing the liability. Our disposition of the accrued restructuring charges is as follows:
Type of Cost | Balance at December 31, 2013 | Payments | Adjustment to Cost | Balance at June 30, 2015 | |||||||||||
Salary continuation liability | $ | 615,721 | $ | (615,721 | ) | $ | — | $ | — | ||||||
Incentive compensation costs | 185,525 | (185,525 | ) | — | — | ||||||||||
Other benefit costs and employer taxes | 154,575 | (110,144 | ) | (44,431 | ) | — | |||||||||
Accrued restructuring charges | $ | 955,821 | $ | (911,390 | ) | $ | (44,431 | ) | $ | — | |||||
Note 8 — Accrued Liabilities and Other
As of June 30, 2015 and June 30, 2014 our other current liabilities consisted of the following:
June 30, 2015 | June 30, 2014 | ||||||
Accrued incentive and other compensation | $ | 578,910 | $ | 1,358,653 | |||
Accrued restructuring charges | — | 530,412 | |||||
Officer retirement costs | — | 288,258 | |||||
Asset retirement obligations due within one year | 57,223 | 146,703 | |||||
Accrued royalties, including suspended accounts | 75,164 | 89,179 | |||||
Accrued franchise taxes | 94,885 | 87,575 | |||||
Accrued - other | 49,191 | 57,224 | |||||
Accrued liabilities and other | $ | 855,373 | $ | 2,558,004 | |||
Note 9—Asset Retirement Obligations
Our asset retirement obligations represent the estimated present value of the amount we will incur to plug, abandon and remediate our producing properties at the end of their productive lives in accordance with applicable laws. The following is a reconciliation of the beginning and ending asset retirement obligation for the years ended June 30, 2015 and 2014:
Years Ended | |||||||
2015 | 2014 | ||||||
Asset retirement obligations—beginning of period | $ | 352,215 | $ | 615,551 | |||
Liabilities incurred (1) | 564,019 | — | |||||
Liabilities settled | (137,604 | ) | (323,665 | ) | |||
Liabilities sold | (52,526 | ) | (48,273 | ) | |||
Accretion of discount | 34,866 | 41,626 | |||||
Revisions to previous estimates | 12,020 | 66,976 | |||||
Less: current asset retirement obligations | (57,223 | ) | (146,703 | ) | |||
Asset retirement obligations—end of period | $ | 715,767 | $ | 205,512 | |||
(1) | Primarily attributable to the reversion of our working interest in the Delhi Field in November 2014. |
47
EVOLUTION PETROLEUM CORPORATION AND SUBSIDIARIES
NOTES TO CONSOLIDATED FINANCIAL STATEMENTS (Continued)
Note 10—Stockholders' Equity
Common Stock
During the year ended June 30, 2014, we issued (i) 1,568,832 shares of our common stock upon the exercise of incentive stock options (ISOs), receiving cash proceeds totaling $3,252,801, and (ii) 2,635,696 of our common shares upon cashless exercises of nonqualified stock options ("NQSOs") and incentive warrants, all being exercised on a net basis, except for 50,956 of previously acquired shares owned by option holders that were swapped in payment of the exercise price. The weighted average cost of these swapped shares was $12.14.
In fiscal 2014, we retired 801,889 shares of treasury stock acquired in previous fiscal years at a cost of $1,019,840 and 186,714 treasury shares acquired during fiscal 2014 from employees and directors at an average cost of $12.18 per share or $2,273,857. The shares acquired in 2014 were received in satisfaction of payroll tax liabilities from the exercise of stock options and vesting of restricted stock (requiring cash outlays by us) and 50,956 shares were received from option holders in cashless stock option exercises, using stock previously owned by the option holder.
Commencing in December 2013, the Board of Directors initiated a quarterly cash dividend on our common stock at a quarterly rate of $0.10 per share and subsequently adjusted this rate to $0.05 per share during the quarter ended March 31, 2015. We paid cash dividends of $9,833,642 and $9,723,833 from retained earnings to our common shareholders during the years ended June 30, 2015, and 2014, respectively.
On May 12, 2015, the Board of Directors approved a share repurchase program covering up to $5,000,000 of the Company's common stock. Under the program's terms, shares may be repurchased only on the open market and in accordance with the requirements of the Securities and Exchange Commission. The timing and amount of repurchases will depend upon several factors, including financial resources and market and business conditions. There is no fixed termination date for this repurchase program, and the repurchase program may be suspended or discontinued at any time. Payment for shares repurchased under the program will be funded using the Company's working capital. The Company intends to retire the repurchased shares. As of June 30, 2015, the Company had purchases of 63,372 shares of stock which had a weighted average price per share of $6.87.
During fiscal 2015, the Company also acquired 7,535 shares of its common stock at a weighted average price per share of $9.16 in exchange for payroll tax liabilities related to stock-based compensation.
Series A Cumulative Perpetual Preferred Stock
During the year ended June 30, 2012, we sold 317,319 shares of our 8.5% Series A Cumulative (perpetual) Preferred Stock at a weighted average sales price of $23.80 per share, with a liquidation preference of $25.00 per share. All shares were underwritten or sold through McNicoll Lewis & Vlak LLC (MLV), 220,000 of which were sold in an underwritten public offering and 97,319 shares of which were sold under an at-the-market sales agreement ("ATM"), providing aggregate net proceeds of $6,930,535 after market discounts, underwriting fees, legal and other expenses of the offerings. The Series A Cumulative Preferred Stock cannot be converted into our common stock and there are no sinking fund or redemption rights available to holders thereof. Optional redemption can be made by us at any time after July 1, 2014 for the stated liquidation value of $25.00 per share plus accrued dividends. With respect to dividend rights and rights upon our liquidation, winding-up or dissolution, the Series A Preferred Stock ranks senior to our common shareholders, but subordinate to any of our existing and future debt. Dividends on the Series A Cumulative Preferred Stock accrue and accumulate at a fixed rate of 8.5% per annum on the $25.00 per share liquidation preference, payable monthly at $0.177083 per share, as, if and when declared by our Board of Directors.
We paid dividends of $674,302, $674,302 and $674,302 to holders of our Series A Preferred Stock during the years ended June 30, 2015, 2014 and 2013, respectively.
Expected Tax Treatment of Dividends to Recipients
Based on our current projections for the fiscal year ending June 30, 2015, we expect preferred dividends will be treated as qualified dividend income to recipients and that a portion of our cash dividends on common stock will be treated as a return of capital and the remainder as qualified dividend income. We will make a preliminary determination regarding the tax treatment of dividends for the current fiscal year when we report this information to recipients. As a result of the difference between our June 30 fiscal year and the calendar year basis of our dividend reporting requirements, it is possible that we will be required to amend these reports when our final taxable income for the fiscal year is determined, as this will potentially affect the
48
EVOLUTION PETROLEUM CORPORATION AND SUBSIDIARIES
NOTES TO CONSOLIDATED FINANCIAL STATEMENTS (Continued)
tax status of our dividends to recipients. For the fiscal year ended June 30, 2014, cash dividends on preferred and common stock were treated for tax purposes as a return of capital to our stockholders.
Note 11—Stock-Based Incentive Plan
We have granted option awards to purchase common stock (the "Stock Options"), restricted common stock awards ("Restricted Stock"), contingent restricted common stock awards ("Contingent Restricted Stock") and/or unrestricted fully vested common stock, to employees, directors, and consultants of the Company under the Evolution Petroleum Corporation Amended and Restated 2004 Stock Plan (the "Plan"). The Plan authorized the issuance of 6,500,000 shares of common stock. As of June 30, 2015, 542,529 shares remain available for grant.
Stock Options and Incentive Warrants
No Stock Options have been granted since August 2008 and all compensation costs attributable to Stock Options have been recognized in prior periods. No Incentive Warrants have been granted since February 2006, all compensation costs attributable to these awards have been recognized in prior periods and all remaining outstanding awards were exercised in November 2013.
The following summary presents information regarding outstanding Stock Options as of June 30, 2015, and the changes during the fiscal year:
Number of Stock Options | Weighted Average Exercise Price | Aggregate Intrinsic Value(1) | Weighted Average Remaining Contractual Term (in years) | |||||||||
Stock Options outstanding at June 30, 2014 | 178,061 | $ | 2.08 | |||||||||
Granted | — | — | ||||||||||
Exercised | (87,000 | ) | $ | 1.63 | ||||||||
Canceled or forfeited | — | — | ||||||||||
Expired | — | — | ||||||||||
Stock Options outstanding at June 30, 2015 | 91,061 | $ | 2.50 | $ | 372,000 | 1.3 | ||||||
Vested or expected to vest at June 30, 2015 | 91,061 | $ | 2.50 | $ | 372,000 | 1.3 | ||||||
Exercisable at June 30, 2015 | 91,061 | $ | 2.50 | $ | 372,000 | 1.3 | ||||||
(1) | Based upon the difference between the market price of our common stock on the last trading date of the period ($6.59 as of June 30, 2015) and the Stock Option exercise price of in-the-money Stock Option. |
For the year ended June 30, 2015, there were 87,000 Stock Options exercised with an aggregate intrinsic value of $501,810. For the year ended June 30, 2014, there were 4,644,759 Stock Options and Incentive Warrants exercised, with an aggregate intrinsic value of $47,504,114. For the year ended June 30, 2013, there were 550,000 Stock Options exercised with an aggregate intrinsic value of $5,233,480.
During the years ended June 30, 2015, 2014, and 2013, there were 0, 0, and 18,922 Stock Options that vested with a total grant date fair value of $0, $0, and $46,359, respectively.
Restricted Stock and Contingent Restricted Stock
Prior to fiscal 2015 all Restricted Stock grants contained a four-year vesting period period based solely on service. During fiscal 2015, the Company awarded grants of both Restricted Stock and Contingent Restricted Stock as part of its long-term incentive plan. Such grants, which expire after four years if unvested, contain service-based, performance-based and market-based vesting provisions. The common shares underlying the Restricted Stock grants were issued on the date of grant, whereas the Contingent Restricted Stock will be issued only upon the attainment of specified performance-based or market-based vesting provisions.
49
EVOLUTION PETROLEUM CORPORATION AND SUBSIDIARIES
NOTES TO CONSOLIDATED FINANCIAL STATEMENTS (Continued)
Market-based awards entitle employees to vest in a fixed number of shares when the three-year trailing total return on the Company’s common stock exceeds the corresponding total returns of various quartiles of companies comprising the SIG Exploration and Production Index (NASDAQ EPX) during defined measurement periods. The fair value and expected vesting period of these awards were determined using a Monte Carlo simulation based on the historical volatility of the Company's total return compared to the historical volatilities of the other companies in the index. Fair values for these market-based awards ranged from $4.26 to $8.40 with expected vesting periods of 3.30 to 2.55 years, based on the various quartiles of comparative market performance. Compensation expense for market-based awards is recognized over the expected vesting period using the straight-line method, so long as the award holder remains an employee of the Company. Total compensation expense is based on the fair value of the awards at the date of grant and is independent of vesting or expiration of the awards, except for termination of service.
The following table sets forth the Restricted Stock transactions for the year ended June 30, 2015:
Number of Restricted Shares | Weighted Average Grant-Date Fair Value | Unamortized Compensation Expense at June 30, 2015 (1) | Weighted Average Remaining Amortization Period (Years) | |||||||||
Unvested at June 30, 2014 | 140,067 | $ | 8.70 | $ | — | |||||||
Service-based awards granted | 100,910 | 9.53 | ||||||||||
Performance-based awards granted | 76,642 | 10.05 | ||||||||||
Market-based awards granted | 35,914 | 7.59 | ||||||||||
Vested | (91,306 | ) | 8.40 | |||||||||
Forfeited | — | — | ||||||||||
Unvested at June 30, 2015 | 262,227 | $ | 9.37 | $ | 1,306,990 | 2.3 | ||||||
(1) | Excludes $770,252 of potential future compensation expense for performance-based awards for which vesting is not considered probable at this time for accounting purposes. |
During the years ended June 30, 2015, 2014, and 2013, there were 91,306, 277,198, and 277,198 shares of Restricted Stock that vested with a total grant date fair value of $766,970, $1,796,243, and $1,427,570, respectively.
The following table summarizes Contingent Restricted Stock activity:
Number of Restricted Stock Units | Weighted Average Grant-Date Fair Value | Unamortized Compensation Expense at June 30, 2015 (1) | Weighted Average Remaining Amortization Period (Years) | |||||||||
Unvested at July 1, 2014 | — | — | ||||||||||
Performance-based awards granted | 38,325 | $ | 10.05 | $ | — | |||||||
Market-based awards granted | 17,961 | 4.26 | — | |||||||||
Unvested at June 30, 2015 | 56,286 | $ | 8.20 | $ | 57,004 | 2.5 | ||||||
(1) Excludes $385,166 of potential future compensation expense for performance-based awards for which vesting is not considered probable at this time for accounting purposes.
Stock-based Compensation Expense
For the years ended June 30, 2015, 2014, and 2013, we recognized stock-based compensation expense related to Restricted Stock, Contingent Restricted Stock grants, and Stock Option grants of $962,813, $1,728,687, and $1,531,745, respectively. For the year ended June 30, 2015, this expense includes $19,160 of cash dividends paid on unvested performance-based awards for which vesting is not considered probable at this time for accounting purposes. See Note 7 – Restructuring, for stock compensation included in Restructuring Charges recorded at December 31, 2014.
50
EVOLUTION PETROLEUM CORPORATION AND SUBSIDIARIES
NOTES TO CONSOLIDATED FINANCIAL STATEMENTS (Continued)
Note 12—Supplemental Disclosure of Cash Flow Information
Our supplemental disclosures of cash flow information for the years ended June 30, 2015, 2014, and 2013 are as follows:
June 30, | |||||||||||
2015 | 2014 | 2013 | |||||||||
Income taxes paid | $ | 220,000 | $ | 755,941 | $ | 699,874 | |||||
Income tax refunds | 331,733 | — | — | ||||||||
Non-cash transactions: | |||||||||||
Change in accounts payable used to acquire property and equipment | 5,422,566 | (183,766 | ) | (1,535,322 | ) | ||||||
Oil and natural gas property costs attributable to the recognition of asset retirement obligations | 576,039 | 66,976 | 65,575 | ||||||||
Accrued purchases of treasury stock | 170,283 | — | — | ||||||||
Previously acquired Company shares swapped by holders to pay stock option exercise price | $ | — | $ | 618,606 | $ | — | |||||
Note 13—Income Taxes
We file a consolidated federal income tax return in the United States and various combined and separate filings in several state and local jurisdictions.
There were no unrecognized tax benefits nor any accrued interest or penalties associated with unrecognized tax benefits during the years ended June 30, 2015, 2014 and 2013. We believe that we have appropriate support for the income tax positions taken and to be taken on the Company's tax returns and that the accruals for tax liabilities are adequate for all open years based on our assessment of many factors including past experience and interpretations of tax law applied to the facts of each matter. The Company's tax returns are open to audit under the statute of limitations for the years ending June 30, 2012 through June 30, 2014 for federal tax purposes and for the years ended June 30, 2011 through June 30, 2014 for state tax purposes.
The components of our income tax provision (benefit) are as follows:
June 30, 2015 | June 30, 2014 | June 30, 2013 | |||||||||
Current: | |||||||||||
Federal | $ | 1,413,296 | $ | 386,018 | $ | 857,480 | |||||
State | 608,436 | 161,168 | 659,303 | ||||||||
Total current income tax provision | 2,021,732 | 547,186 | 1,516,783 | ||||||||
Deferred: | |||||||||||
Federal | 1,282,059 | 1,319,727 | 2,546,495 | ||||||||
State | 140,430 | 25,085 | (33,517 | ) | |||||||
Total deferred income tax provision | 1,422,489 | 1,344,812 | 2,512,978 | ||||||||
$ | 3,444,221 | $ | 1,891,998 | $ | 4,029,761 | ||||||
The following table presents the reconciliation of our income taxes calculated at the statutory federal tax rate, currently 34%, to the income tax provision in our financial statements. The effective tax rate for all years is in excess of the statutory rate as a result of state income taxes, primarily in the state of Louisiana, with smaller adjustments related to stock-based compensation and other permanent differences.
51
EVOLUTION PETROLEUM CORPORATION AND SUBSIDIARIES
NOTES TO CONSOLIDATED FINANCIAL STATEMENTS (Continued)
June 30, 2015 | June 30, 2014 | June 30, 2013 | |||||||||
Income tax provision (benefit) computed at the statutory federal rate: | $ | 2,868,267 | $ | 1,866,366 | $ | 3,623,784 | |||||
Reconciling items: | |||||||||||
State income taxes, net of federal tax benefit | 595,708 | 189,081 | 413,019 | ||||||||
Permanent differences related to stock-based compensation | — | (155,817 | ) | 8,933 | |||||||
Expiring NOLs related to 2004 reverse merger | — | — | 600,964 | ||||||||
Deferred tax asset valuation adjustment | — | — | (600,964 | ) | |||||||
Other permanent differences | (19,754 | ) | (7,632 | ) | (15,975 | ) | |||||
Income tax provision | $ | 3,444,221 | $ | 1,891,998 | $ | 4,029,761 | |||||
Deferred income taxes primarily represent the net tax effect of temporary differences between the carrying amounts of assets and liabilities for financial reporting purposes and the amounts used for income tax purposes. Deferred tax assets and liabilities are classified as either current or noncurrent on the balance sheet based on the classification of the related asset or liability for financial reporting purposes. Deferred tax assets and liabilities not related to specific assets or liabilities on the financial statements are classified according the expected reversal date of the temporary difference or the expected utilization date for tax attribute carryforwards. The change in the NOLs is primarily due to expiring NOLs related to the 2004 reverse merger as well as utilization of NOLs to offset potential current year taxable income. The components of our deferred taxes are detailed in the table below:
June 30, 2015 | June 30, 2014 | June 30, 2013 | |||||||||
Deferred tax assets: | |||||||||||
Non-qualified stock-based compensation | $ | 173,647 | $ | 134,469 | $ | 774,673 | |||||
Net operating loss carry-forwards | 400,288 | 427,249 | 427,249 | ||||||||
AMT credit carry-forward* | 701,254 | 701,254 | 502,466 | ||||||||
Other | 91,113 | 165,775 | 28,170 | ||||||||
Gross deferred tax assets | 1,366,302 | 1,428,747 | 1,732,558 | ||||||||
Valuation allowance | (292,446 | ) | (292,446 | ) | (292,446 | ) | |||||
Total deferred tax assets | 1,073,856 | 1,136,301 | 1,440,112 | ||||||||
Deferred tax liability: | |||||||||||
Oil and natural gas properties | (12,233,993 | ) | (10,873,949 | ) | (9,832,948 | ) | |||||
Total deferred tax liability | (12,233,993 | ) | (10,873,949 | ) | (9,832,948 | ) | |||||
Net deferred tax liability | $ | (11,160,137 | ) | $ | (9,737,648 | ) | $ | (8,392,836 | ) | ||
_______________________________________________________________________________
* | Total AMT credit carry-forward is $901,545. Our net deferred tax liability does not include $200,291 of AMT credit carry-forward associated with the tax benefit related to stock-based compensation. |
As of June 30, 2015, we have a federal tax loss carryforward of approximately $25.8 million, created primarily from tax deductions in excess of book deductions related to the exercise of non-qualified stock options and incentive warrants in fiscal 2014, and $1.2 million of remaining tax loss carryforwards that we acquired through the reverse merger in May 2004. The majority of the tax loss carryforwards from the reverse merger have expired without being utilized. We will be able to utilize a maximum of $0.3 million of these carryforwards in equal annual amounts of $39,648 through 2023 and the balance is not able to be utilized based on the provisions of IRC Section 382. We have recorded a valuation allowance for the portion of our net operating loss that is limited by IRC Section 382.
The remaining fiscal 2014 tax loss carry-forward of $24.6 million and future tax benefits resulting from the fiscal 2014 exercises will not affect our future tax provision for financial reporting purposes, nor are we able to recognize a deferred tax asset for these future benefits. When we receive these tax benefits as a reduction of future cash taxes that would otherwise be payable, we will recognize that benefit as an increase in additional paid in capital.
Based on the carryback of tax losses resulting from the exercise of stock options and incentive warrants in fiscal 2014, we filed a request for refund of cash taxes paid in Louisiana for the previous three fiscal years totaling approximately $1.5 million.
52
EVOLUTION PETROLEUM CORPORATION AND SUBSIDIARIES
NOTES TO CONSOLIDATED FINANCIAL STATEMENTS (Continued)
This refund will not affect our tax provision for financial reporting purposes. When and if received, we will recognize the benefit as an increase in additional paid-in capital. We cannot be certain of the timing or amount of the refund if any. As a result, this potential refund has not been reflected in the accompanying financial statements. This carryback, if realized, will utilize approximately $19.0 million of an estimated $24.2 million net loss for state tax purposes with another $3.8 million expected to be used to offset taxable income in 2015, leaving $1.5 million of tax loss carryforwards remaining for Louisiana tax purposes.
In addition, as of June 30, 2015, the Company has an estimated carryforward of percentage depletion in excess of basis of approximately $11.6 million. These future deductions are limited to 65% of taxable income in any period.
Note 14—Related Party Transactions
On June 30, 2011, we entered into a Technology Assignment Agreement with the Company’s Senior Vice President of Operations to acquire exclusive, perpetual, non-cancelable rights to the patented GARP® technology he developed while employed by the Company. Under the agreement, he is paid a fee when the technology is employed. For the years ended June 30, 2015, 2014 and 2013, we made payments of $26,579, $10,113 and $10,113, respectively, under the agreement.
Note 15—Net Income Per Share
The following table sets forth the computation of basic and diluted net income per share:
June 30, | |||||||||||
2015 | 2014 | 2013 | |||||||||
Numerator | |||||||||||
Net income attributable to common shareholders | $ | 4,317,555 | $ | 2,923,011 | $ | 5,954,126 | |||||
Denominator | |||||||||||
Weighted average number of common shares—Basic | 32,817,456 | 30,895,832 | 28,205,467 | ||||||||
Effect of dilutive securities: | |||||||||||
Contingent restricted stock grants | 4,422 | — | — | ||||||||
Common stock warrants issued in connection with equity and financing transactions | — | — | 878 | ||||||||
Stock Options and Incentive Warrants | 102,140 | 1,668,235 | 3,768,786 | ||||||||
Total weighted average dilutive securities | 106,562 | 1,668,235 | 3,769,664 | ||||||||
Weighted average number of common shares and dilutive potential common shares used in diluted EPS | 32,924,018 | 32,564,067 | 31,975,131 | ||||||||
Net income per common share—Basic | $ | 0.13 | $ | 0.09 | $ | 0.21 | |||||
Net income per common share—Diluted | $ | 0.13 | $ | 0.09 | $ | 0.19 | |||||
The following are reflected in the calculation of diluted earnings per share as of June 30, 2015:
Outstanding Potential Dilutive Securities | Weighted Average Exercise Price | Outstanding at June 30, 2015 | ||||
Contingent Restricted Stock grants | $ | — | 17,961 | |||
Stock Options | 2.50 | 91,061 | ||||
Total | $ | 2.09 | 109,022 | |||
53
EVOLUTION PETROLEUM CORPORATION AND SUBSIDIARIES
NOTES TO CONSOLIDATED FINANCIAL STATEMENTS (Continued)
The following are reflected in the calculation of diluted earnings per share as of June 30, 2014:
Outstanding Potential Dilutive Securities | Weighted Average Exercise Price | Outstanding at June 30, 2014 | ||||
Stock Options | $ | 2.08 | 178,061 | |||
The following are reflected in the calculation of diluted earnings per share as of June 30, 2013:
Outstanding Potential Dilutive Securities | Weighted Average Exercise Price | Outstanding at June 30, 2013 | ||||
Common stock warrants issued in connection with equity and financing transactions | $ | 2.50 | 1,165 | |||
Stock Options and Incentive Warrants | 1.99 | 4,822,820 | ||||
Total | $ | 1.99 | 4,823,985 | |||
Note 16—Unsecured Revolving Credit Agreement
On February 29, 2012, Evolution Petroleum Corporation entered into a Credit Agreement (the "Credit Agreement") with Texas Capital Bank, N.A. (the "Lender"). The Credit Agreement provides the Company with a revolving credit facility (the "facility") in an amount up to $50,000,000 with availability governed by an Initial Borrowing Base of $5,000,000. A portion of the facility not in excess of $1,000,000 is available for the issuance of letters of credit.
The facility is unsecured and has a term of four years, expiring on February 29, 2016. The Company's subsidiaries guarantee the Company's obligations under the facility. The proceeds of any loans under the facility are to be used by the Company for the acquisition and development of oil and gas properties, as defined in the facility, the issuance of letters of credit, and for working capital and general corporate purposes.
Semi-annually, the borrowing base and a monthly reduction amount are re-determined from reserve reports. Requests by the Company to increase the $5,000,000 initial amount are subject to the Lender's credit approval process, and are also limited to 25% of the value our oil and gas properties, as defined.
At the Company's option, borrowings under the facility bear interest at a rate of either (i) an Adjusted LIBOR rate (LIBOR rate divided by the remainder of 1 less the Lender's Regulation D reserve requirement), or (ii) an adjusted Base Rate equal to the greater of the Lender's prime rate or the sum of 0.50% plus the Federal Fund Rate. A maximum of three LIBOR based loans can be outstanding at any time. Allowed loan interest periods are one, two, three and six months. LIBOR interest is payable at the end of the interest period except for six-month loans for which accrued interest is payable at three months and at end of term. Base Rate interest is payable monthly. Letters of credit bear fees of 3.5% per annum rate applied to the principal amount and are due when transacted. The maximum term of letters of credit is one year.
A commitment fee of 0.50% per annum accrues on unutilized availability and is payable quarterly. The Company is responsible for certain administrative expenses of the Lender over the life of the Credit Agreement as well as $50,000 in loan costs incurred upon closing.
The Credit Agreement also contains financial covenants including a requirement that the Company maintain a current ratio of not less than 1.5 to 1; a ratio of total funded Indebtedness to EBITDA of not more than 2.5 to 1, and a ratio of EBITDA to interest expense of not less than 3 to 1. The agreement specifies certain customary covenants, including restrictions on the Company and its subsidiaries from pledging their assets, incurring defined Indebtedness outside of the facility other than permitted indebtedness, and it restricts certain asset sales. Payments of dividends for the Series A Preferred are only restricted by the EBITDA to interest coverage ratio, wherein such dividends are a 1X deduction from EBITDA (as opposed to a 3:1 requirement if dividends were treated as interest expense). The Credit Agreement contains customary events of default. If an event of default occurs and is continuing, the Lender may declare any amounts outstanding under the Credit Agreement to be immediately due and payable.
As of June 30, 2015 and 2014, the Company had no borrowings and no outstanding letters of credit issued under the facility, resulting in an available borrowing base capacity of $5,000,000, and we are in compliance with all the covenants of the Credit Agreement. During early 2014 the Lender waived the provisions of the Credit Agreement pertaining to the past payments
54
EVOLUTION PETROLEUM CORPORATION AND SUBSIDIARIES
NOTES TO CONSOLIDATED FINANCIAL STATEMENTS (Continued)
of cash dividends on our common stock, and the Credit Agreement was amended to permit the payment of cash dividends on common stock in the future if no borrowings are outstanding at the time of such payment.
In connection with this agreement the Company incurred $179,468 of debt issuance costs, which have been capitalized in Other Assets and are being amortized on a straight-line basis over the term of the agreement. The unamortized balance in debt issuance costs related to the Credit Agreement was $32,411 as of June 30, 2015. The Company is in discussions with the Lender and other financial institutions to replace the unsecured Credit Agreement with an expanded secured facility. As of June 30, 2015, the Company had incurred approximately $157,610 in legal and title costs related to this proposed new agreement, which are also capitalized in Other Assets.
Note 17—Commitments and Contingencies
We are subject to various claims and contingencies in the normal course of business. In addition, from time to time, we receive communications from government or regulatory agencies concerning investigations or allegations of noncompliance with laws or regulations in jurisdictions in which we operate. At a minimum we disclose such matters if we believe it is reasonably possible that a future event or events will confirm a loss through impairment of an asset or the incurrence of a liability. We accrue a loss if we believe it is probable that a future event or events will confirm a loss and we can reasonably estimate such loss and we do not accrue future legal costs related to that loss. Furthermore, we will disclose any matter that is unasserted if we consider it probable that a claim will be asserted and there is a reasonable possibility that the outcome will be unfavorable. We expense legal defense costs as they are incurred.
The Company and its wholly-owned subsidiary NGS Sub Corp. are defendants in a lawsuit brought by John C. McCarthy et al in the fifth District Court of Richland Parish, Louisiana in July 2011. The plaintiffs alleged, among other claims, that we fraudulently and wrongfully purchased plaintiffs’ income royalty rights in the Delhi Field Unit in the Holt-Bryant Reservoir in May 2006. The plaintiffs are seeking cancellation of the transaction and monetary damages. On March 29, 2012, the Fifth District Court dismissed the case against the Company and NGS Sub Corp. The Court found that plaintiffs had “no cause of action” under Louisiana law, assuming that the Plaintiffs’ claims were valid on their face. Plaintiffs filed an appeal and the Louisiana Second Circuit Court of Appeal affirmed the dismissal, but allowed the plaintiffs to amend their petition to state a different possible cause of action. The plaintiffs amended their claim and re-filed with the district court. We subsequently filed a second motion pleading “no cause of action,” with which the district court again agreed and dismissed the plaintiffs’ case on September 23, 2013. Plaintiffs again filed an appeal in November 2013. In October 2014, the appellate court reversed the district court. We subsequently filed for a rehearing which was denied. We now have filed an Application for Writ of Review in the Louisiana Supreme Court in which we have asked the Louisiana Supreme Court to reverse the appellate court and reinstate the trial court judgment dismissing plaintiffs’ case. Amicus Curiae Briefs have been filed in support of the writ application by the Louisiana Oil & Gas Association, the Louisiana Mid-Continent Oil and Gas Association and the American Association of Professional Landmen. Our brief and supporting Amicus Curiae Briefs have been filed. Oral arguments were heard on September 1, 2015. Counsel has advised us that, based on developments in the case to date, the risk of a material loss in this matter is remote.
As previously reported, on August 23, 2012, we and our wholly-owned subsidiary, NGS Sub Corp., and Robert S. Herlin, our Chief Executive Officer, were served with a lawsuit filed in federal court by James H. and Kristy S. Jones (the “Jones lawsuit”) in the Western District Court of the Monroe Division, Louisiana. The plaintiffs alleged primarily that we (defendants) wrongfully purchased the plaintiffs’ 4.8119% overriding royalty interest in the Delhi Unit in January 2006 by failing to divulge the existence of an alleged previous agreement to develop the Delhi Field for enhanced oil recovery. The plaintiffs were seeking rescission of the assignment of the overriding royalty interest and monetary damages. We believed that the claims were without merit and not timely, and we vigorously defended against the claims. We filed a motion to dismiss for failure to state a claim under Federal Rule of Civil Procedure 12(b) (6) on April 1, 2013. On September 17, 2013, the federal court in the Western District Court of the Monroe Division, Louisiana, dismissed a portion of the claims and allowed the plaintiffs to pursue the remaining portion of the claims. Our motion to dismiss was for lack of cause of action, assuming that the plaintiffs' claims were valid on their face. On September 25, 2013, plaintiff Jones filed a motion to alter or amend the September 17, 2013 judgment. On December 27, 2013, the court denied said plaintiffs’ motion, and on January 21, 2014, we filed a motion to reconsider the nondismissal of the remaining claims, which was denied. The Court entered a Scheduling Order setting trial of the case for the week of June 15, 2015. Subsequent to depositions of the plaintiffs, in late March 2015, in the United States District Court for the Western District of Louisiana Monroe Division, a joint motion to dismiss with prejudice was entered into by all parties in the lawsuit and the judge signed the judgment of dismissal with prejudice. Further, no compensation or other consideration was paid or provided to the plaintiffs by any of the defendants other than an agreement by us not to sue for
55
EVOLUTION PETROLEUM CORPORATION AND SUBSIDIARIES
NOTES TO CONSOLIDATED FINANCIAL STATEMENTS (Continued)
malicious prosecution or defamation, or seek sanctions, and the plaintiffs agreed to relinquish any and all claims to the 4.8119% overriding royalty interest in the Delhi Unit.
On December 13, 2013, we and our wholly-owned subsidiaries, Tertiaire Resources Company and NGS Sub. Corp., filed a lawsuit in the 133rd Judicial District Court of Harris County, Texas, against Denbury Onshore, LLC (“Denbury”) alleging breaches of certain 2006 agreements between the parties regarding the Delhi Field in Richland Parish, Louisiana. The specific allegations include improperly charging the payout account for capital expenditures and costs of capital, failure to adhere to preferential rights to participate in acquisitions within the defined area of mutual interest, breach of the promises to assume environmental liabilities and fully indemnify us from such costs, and other breaches. We also alleged that Denbury’s gross negligence caused certain environmental damage to the unit. Specifically, we allege that Denbury failed to properly conduct CO2 injection activities. We are seeking declaration of the validity of the 2006 agreements and recovery of damages and attorneys’ fees. Denbury subsequently filed counterclaims, including the assertion that we owe Denbury additional revenue interests pursuant to the 2006 agreements and that our transfers of the reversionary interests from our wholly owned subsidiary to our parent corporation and subsequently to another wholly-owned subsidiary were not timely noticed to Denbury. We subsequently amended and expanded our claims. The Company disagrees with, and is vigorously defending against, Denbury's counterclaims. This matter is scheduled for trial in April of 2016.
On January 26, 2015, Denbury notified us it had withheld and suspended 2.891545% of our overriding royalty revenue interest in the field for the months of November and December 2014. This unilateral suspension of a portion of our overriding royalties by the operator was made without consultation with the Company and, we believe, was without legal basis. On February 26, 2015, we and Denbury executed an agreement under which Denbury agreed to reverse the previously disclosed suspension of our overriding royalty interest revenues and release to Evolution amounts previously suspended totaling approximately $712,000. Denbury further agreed not to suspend any future revenues attributable to any of our revenue interests, except under limited circumstances, such as non-payment of joint interest billings. This agreement did not settle any of the outstanding litigation matters with Denbury, including their counterclaim related to the net revenue interest conveyed in the 2006 Purchase and Sale Agreement.
Lease Commitments. We have a non-cancelable operating lease for office space that expires on July 31, 2016. Future minimum lease commitments as of June 30, 2015 under this operating lease are as follows:
For the fiscal year ended June 30, | |||
2016 | $ | 159,011 | |
2017 | 13,251 | ||
Total | $ | 172,262 | |
Rent expense for the years ended June 30, 2015, 2014, and 2013 was $175,103, $174,229, and $147,233, respectively.
Employment Contracts. We have entered into employment agreements with two of the Company's senior executives. The employment contracts provide for severance payments in the event of termination by the Company for any reason other than cause or permanent disability, or in the event of a constructive termination, as defined. The agreements provide for the payment of base pay and certain medical and disability benefits for periods ranging form 6 months to 1 year after termination. The total contingent obligations under the employment contracts as of June 30, 2015 was approximately $473,000.
Note 18—Concentrations of Credit Risk
Major Customers. We market all of our oil and natural gas production from the properties we operate. We do not currently market our share of crude oil production from Delhi. Although we have the right to take our working interest production at Delhi in-kind, we are currently accepting terms under the Delhi operator's agreement with Plains Marketing L.P. for the delivery and pricing of our oil there. The majority of our operated gas, oil and condensate production is sold to a variety of purchasers under short-term (less than 12 months) contracts at market-based prices. The following table identifies customers from whom we derived 10 percent or more our net oil and natural gas revenues during the years ended June 30, 2015, 2014, and 2013. The loss of our purchaser at the Delhi field or disruption to pipeline transportation from the field could adversely affect our net realized pricing and potentially our near-term production levels. The loss of any of our other purchasers would not be
56
EVOLUTION PETROLEUM CORPORATION AND SUBSIDIARIES
NOTES TO CONSOLIDATED FINANCIAL STATEMENTS (Continued)
expected to have a material adverse effect on our operations.
Year Ended June 30, | ||||||||
Customer | 2015 | 2014 | 2013 | |||||
Plains Marketing L.P. (includes Delhi production) | 99 | % | 96 | % | 90 | % | ||
Enterprise Crude Oil LLC | — | % | 2 | % | 4 | % | ||
Flint Hills | — | % | 1 | % | 2 | % | ||
ETC Texas Pipeline, LTD. | — | % | 1 | % | — | % | ||
All others | 1 | % | — | % | 4 | % | ||
Total | 100 | % | 100 | % | 100 | % | ||
Accounts Receivable. Substantially all of our accounts receivable result from uncollateralized oil and natural gas sales to third parties in the oil and natural gas industry. This concentration of customers may impact our overall credit risk in that these entities may be similarly affected by changes in economic and other conditions.
Cash and Cash Equivalents and Certificates of Deposit. We are subject to concentrations of credit risk with respect to our cash and cash equivalents, which we attempt to minimize by maintaining our cash and cash equivalents in high quality money market funds. At times, cash balances may exceed limits federally insured by the Federal Deposit Insurance Corporation ("FDIC"). Our certificates of deposit are below or at the maximum federally insured limit set by the FDIC.
Note 19—Retirement Plan
Effective February 1, 2007, we implemented a 401(k) Savings Plan which covers all full-time employees. We currently match 100% of employees' contributions to the plan, to a maximum of the first 6% of each participant's compensation, with Company contributions fully vested when made. Our matching contributions to the Savings Plan totaled $85,676, $116,873, and $89,810 for the years ended June 30, 2015, 2014, and 2013, respectively.
Note 20—Derivatives
In early June 2015, the Company began using derivative instruments to reduce its exposure to oil price volatility for a substantial portion of its forecasted production for the months of July 2015 through December 2015 to achieve a more predictable level of cash flows to support the Company’s capital expenditure program. The costless collars the Company uses to manage risk are designed to establish floor and ceiling prices on anticipated future oil production. While the use of these derivative instruments limits the downside risk of adverse price movements, they may also limit future revenues from favorable price movements. The Company does not enter into derivative instruments for speculative or trading purposes.
These derivative instruments can result in both fair value asset and liability positions held with that counterparty, which positions are all offset to a single fair value asset or liability at the end of each reporting period. The Company nets its fair value amounts of derivative instruments executed with the same counterparty pursuant to ISDA master agreements, which provide for net settlement over the term of the contract and in the event of default or termination of the contract. The fair value of derivative instruments where the Company is in a net liability position with its counterparty as of June 30, 2015 totaled $109,974. Refer to Note 21—Fair Value Measurement for derivative asset and derivative liability balances before offsetting.
The Company monitors the credit rating of its counterparty, Cargill, Incorporated, and believes it does not have significant credit risk. Accordingly, we do not currently require our counterparty to post collateral to support the net asset positions of our derivative instruments. As such, the Company is exposed to credit risk to the extent of nonperformance by the counterparty to its derivative instruments.
The Company's collateral obligations are met by a credit line of $5,000,000 provided by the counterparty during the first ninety days of the agreement and thereafter by the Company which is seeking a secured facility to fund collateral obligations.
For the year ended June 30, 2015, the Company recorded in the consolidated statement of operations a loss on unsettled derivatives, net of $109,974.
The following sets forth a summary of the Company’s crude oil derivative positions at average NYMEX WTI prices as of June 30, 2015.
57
EVOLUTION PETROLEUM CORPORATION AND SUBSIDIARIES
NOTES TO CONSOLIDATED FINANCIAL STATEMENTS (Continued)
Period | Type of Contract | Volumes (in Bbls./day) | Weighted Average Floor Price per Bbl. | Weighted Average Ceiling Price per Bbl. | Weighted Average Collar Spread per Bbl. | |||||
Months of July 2015 through December 2015 | Costless Collar | 1,100 | $55.00 | $64.05 | $9.05 | |||||
Subsequent to June 30, 2015, the Company realized gains of $138,787 and $412,985 on derivative contracts expiring in July 2015 and August 2015, respectively.
Note 21—Fair Value Measurement
Accounting guidelines for measuring fair value establish a three-level valuation hierarchy for disclosure of fair value measurements. The valuation hierarchy categorizes assets and liabilities measured at fair value into one of three different levels depending on the observability of the inputs employed in the measurement.
The three levels are defined as follows:
Level 1—Observable inputs such as quoted prices in active markets at the measurement date for identical, unrestricted assets or liabilities.
Level 2—Other inputs that are observable directly or indirectly such as quoted prices in markets that are not active, or inputs which are observable, either directly or indirectly, for substantially the full term of the asset or liability.
Level 3—Unobservable inputs for which there is little or no market data and which the Company makes its own assumptions about how market participants would price the assets and liabilities.
Fair Value of Derivative Instruments. The following table summarize the location and amounts of the Company’s assets and liabilities measured at fair value on a recurring basis as presented in the consolidated balance sheets as of June 30, 2015. All items included in the tables below are Level 2 inputs within the fair value hierarchy:
June 30, 2015 | ||||||||||||
Asset (Liability) | Gross Amounts Recognized | Gross Amounts Offset in the Consolidated Balance Sheet | Net Amounts Presented in the Consolidated Balance Sheets | |||||||||
Current derivative assets | $ | 355,555 | $ | (355,555 | ) | $ | — | |||||
Current derivative liabilities | (465,529 | ) | 355,555 | (109,974 | ) | |||||||
Total | $ | (109,974 | ) | $ | — | $ | (109,974 | ) | ||||
The fair values of the Company’s derivative assets and liabilities are based on a third-party industry-standard pricing model that uses market data obtained from third-party sources, including quoted forward prices for oil and gas, discount rates and volatility factors. The fair values are also compared to the values provided by the counterparty for reasonableness and are adjusted for the counterparty's credit quality for derivative assets and the Company’s credit quality for derivative liabilities. To date, adjustments for credit quality have not had a material impact on the fair values.
Note 22—Supplemental Disclosures about Oil and Natural Gas Producing Properties (unaudited)
Costs incurred for oil and natural gas property acquisition, exploration and development activities
The following table summarizes costs incurred and capitalized in oil and natural gas property acquisition, exploration and development activities. Property acquisition costs are those costs incurred to lease property, including both undeveloped leasehold and the purchase of reserves in place. Exploration costs include costs of identifying areas that may warrant examination and examining specific areas that are considered to have prospects containing oil and natural gas reserves, including costs of drilling exploratory wells, geological and geophysical costs and carrying costs on undeveloped properties. Development costs are incurred to obtain access to proved reserves, including the cost of drilling. Exploration and development costs also include amounts incurred due to the recognition of asset retirement obligations of $576,039, $66,976 and $65,575 during the years ended June 30, 2015, 2014, and 2013, respectively.
58
EVOLUTION PETROLEUM CORPORATION AND SUBSIDIARIES
NOTES TO CONSOLIDATED FINANCIAL STATEMENTS (Continued)
For the Years Ended June 30, | |||||||||||
2015 | 2014 | 2013 | |||||||||
Oil and natural gas activities | |||||||||||
Property acquisition costs: | |||||||||||
Proved property | $ | — | $ | — | $ | 26,449 | |||||
Unproved property | — | 47,344 | 195,599 | ||||||||
Exploration costs | — | 757,423 | 4,356,640 | ||||||||
Development costs | 10,975,637 | 18,566 | 79,035 | ||||||||
Total costs incurred for oil and natural gas activities | $ | 10,975,637 | $ | 823,333 | $ | 4,657,723 | |||||
Estimated Net Quantities of Proved Oil and Natural Gas Reserves
The following estimates of the net proved oil and natural gas reserves of our oil and gas properties located entirely within the United States of America are based on evaluations prepared by third-party reservoir engineers. Reserve volumes and values were determined under the method prescribed by the SEC for our fiscal years ended June 30, 2015, 2014, and 2013, which requires the application of the previous 12 months unweighted arithmetic average first-day-of-the-month price, and current costs held constant throughout the projected reserve life, when estimating whether reserve quantities are economical to produce.
Proved oil and natural gas reserves are estimated quantities of crude oil, natural gas and natural gas liquids that geological and engineering data demonstrate with reasonable certainty to be recoverable in future years from known reservoirs under existing economic and operating conditions. Proved developed oil and natural gas reserves are reserves that can be expected to be recovered through existing wells with existing equipment and operating methods. There are uncertainties inherent in estimating quantities of proved oil and natural gas reserves, projecting future production rates, and timing of development expenditures. Accordingly, reserve estimates often differ from the quantities of oil and natural gas that are ultimately recovered.
59
EVOLUTION PETROLEUM CORPORATION AND SUBSIDIARIES
NOTES TO CONSOLIDATED FINANCIAL STATEMENTS (Continued)
Estimated quantities of proved oil and natural gas reserves and changes in quantities of proved developed and undeveloped reserves for each of the periods indicated were as follows:
Crude Oil (Bbls) | Natural Gas Liquids (Bbls) | Natural Gas (Mcf) | BOE | ||||||||
Proved developed and undeveloped reserves: | |||||||||||
June 30, 2012 | 11,638,618 | 492,473 | 7,860,156 | 13,441,116 | |||||||
Revisions of previous estimates (a) | 1,826,053 | 975,515 | 27,679 | 2,806,181 | |||||||
Sales of minerals in place | (485,536 | ) | (480,832 | ) | (7,726,032 | ) | (2,254,038 | ) | |||
Production (sales volumes) | (196,380 | ) | (7,271 | ) | (139,006 | ) | (226,819 | ) | |||
June 30, 2013 | 12,782,755 | 979,885 | 22,797 | 13,766,440 | |||||||
Revisions of previous estimates (b) | (1,919,052 | ) | 1,269,588 | 2,412,677 | (247,350 | ) | |||||
Improved recovery, extensions and discoveries | 17,146 | 32,731 | 498,044 | 132,884 | |||||||
Sales of minerals in place | (184,722 | ) | — | — | (184,722 | ) | |||||
Production (sales volumes) | (169,783 | ) | (3,516 | ) | (26,655 | ) | (177,742 | ) | |||
June 30, 2014 | 10,526,344 | 2,278,688 | 2,906,863 | 13,289,510 | |||||||
Revisions of previous estimates (c) | (64,074 | ) | 156,195 | (2,894,703 | ) | (390,330 | ) | ||||
Improved recovery, extensions and discoveries | — | — | — | — | |||||||
Sales of minerals in place | — | — | — | — | |||||||
Production (sales volumes) | (450,294 | ) | (1,288 | ) | (7,221 | ) | (452,786 | ) | |||
June 30, 2015 | 10,011,976 | 2,433,595 | 4,939 | 12,446,394 | |||||||
Proved developed reserves: | |||||||||||
June 30, 2012 | 7,670,934 | 111,978 | 1,499,382 | 8,032,809 | |||||||
June 30, 2013 | 10,077,522 | 8,539 | 22,797 | 10,089,861 | |||||||
June 30, 2014 | 7,858,224 | 32,164 | 481,042 | 7,970,562 | |||||||
June 30, 2015 | 7,347,231 | 1,572 | 4,939 | 7,349,626 | |||||||
Proved undeveloped reserves: | |||||||||||
June 30, 2012 | 3,967,684 | 380,495 | 6,360,774 | 5,408,307 | |||||||
June 30, 2013 | 2,705,233 | 971,346 | — | 3,676,579 | |||||||
June 30, 2014 | 2,668,120 | 2,246,524 | 2,425,821 | 5,318,948 | |||||||
June 30, 2015 | 2,664,745 | 2,432,023 | — | 5,096,768 | |||||||
(a) A significant upward reserve revision occurred in the Delhi Field during fiscal 2013 as a result of (1) revised geological maps based on production results and acquired seismic data, (2) inclusion of an additional reservoir with similar features, production history and suitability for EOR, and (3) inclusion of natural gas processing at Delhi.
(b) Significant reserve revisions occurred in the Delhi Field during fiscal 2014. As a result of an adverse fluid release event in the Field, 1,817,224 BBLs of oil reserves were reclassified from proved to probable category based on the operator's decision to defer CO2 injections in certain parts of the Field. There was a positive revision of 1,679,481 BOE, which was comprised of 1,275,178 BBLs of natural gas liquids and 2,425,821 MCF of natural gas as a result of an improved design for the gas plant in the Delhi Field. The plant is expected to significantly increase recoveries of these products, particularly natural gas, which was not previously planned to be extracted from the injection volumes.
(c) The 2,894,703 negative fiscal 2015 revision for natural gas primarily reflects a 2,246,524 MCF negative revision for the Delhi Field gas plant together with a 452,786 MCF negative revision at the Giddings Field for a well that was lost due to excessive formation solids that kept interfering with pumping. The gas plant revision resulted from a decision during the current fiscal year to use the methane production internally to reduce field operating costs rather than selling it into the market. The 156,195 BBL positive natural gas liquids revision primarily reflects 185,499 BBL positive revision for better recovery from the redesigned gas plant, partly offset by a 29,304 BBL negative revision due to the lost Giddings well.
60
EVOLUTION PETROLEUM CORPORATION AND SUBSIDIARIES
NOTES TO CONSOLIDATED FINANCIAL STATEMENTS (Continued)
Standardized Measure of Discounted Future Net Cash Flows
Future oil and natural gas sales and production and development costs have been estimated using prices and costs in effect at the end of the years indicated, as required by ASC 932, Disclosures about Oil and Gas Producing Activities ("ASC 932"). ASC 932 requires that net cash flow amounts be discounted at 10%. Future production and development costs are computed by estimating the expenditures to be incurred in developing and producing our proved oil and natural gas reserves assuming continuation of existing economic conditions. Future income tax expenses are computed by applying the appropriate period-end statutory tax rates to the future pretax net cash flow relating to our proved oil and natural gas reserves, less the tax basis of the related properties. The future income tax expenses do not give effect to tax credits, allowances, or the impact of general and administrative costs of ongoing operations relating to the Company's proved oil and natural gas reserves. Changes in the demand for oil and natural gas, inflation, and other factors make such estimates inherently imprecise and subject to substantial revision. The table below should not be construed to be an estimate of the current market value of our proved reserves.
The standardized measure of discounted future net cash flows related to proved oil and natural gas reserves as of June 30, 2015, 2014, and 2013 are as follows:
For the Years Ended June 30, | |||||||||||
2015 | 2014 | 2013 | |||||||||
Future cash inflows | $ | 807,030,282 | $ | 1,193,515,075 | $ | 1,436,980,607 | |||||
Future production costs and severance taxes | (309,225,333 | ) | (475,387,931 | ) | (510,902,614 | ) | |||||
Future development costs | (49,691,006 | ) | (46,154,178 | ) | (60,742,406 | ) | |||||
Future income tax expenses | (123,888,665 | ) | (195,581,510 | ) | (275,113,560 | ) | |||||
Future net cash flows | 324,225,278 | 476,391,456 | 590,222,027 | ||||||||
10% annual discount for estimated timing of cash flows | (165,028,739 | ) | (250,313,784 | ) | (283,001,328 | ) | |||||
Standardized measure of discounted future net cash flows | $ | 159,196,539 | $ | 226,077,672 | $ | 307,220,699 | |||||
Future cash inflows represent expected revenues from production of period-end quantities of proved reserves based on the previous 12 months unweighted arithmetic average first-day-of-the-month commodity prices for each year and reflect adjustments for lease quality, transportation fees, energy content and regional price differentials.
Year Ended June 30, | |||||||||||||||||||||||
2015 | 2014 | 2013 | |||||||||||||||||||||
Oil (Bbl) | Gas (MMBtu) | Oil (Bbl) | Gas (MMBtu) | Oil (Bbl) | Gas (MMBtu) | ||||||||||||||||||
NYMEX prices used in determining future cash flows | $ | 71.88 | $ | 3.44 | $ | 100.37 | $ | 4.10 | $ | 91.51 | $ | 3.44 | |||||||||||
The NGL price utilized for future cash inflows was based on the historical price received.
A summary of the changes in the standardized measure of discounted future net cash flows applicable to proved crude oil, natural gas liquids, and natural gas reserves is as follows:
61
EVOLUTION PETROLEUM CORPORATION AND SUBSIDIARIES
NOTES TO CONSOLIDATED FINANCIAL STATEMENTS (Continued)
For the Years Ended June 30, | |||||||||||
2015 | 2014 | 2013 | |||||||||
Balance, beginning of year | $ | 226,077,672 | $ | 307,220,699 | $ | 283,597,493 | |||||
Net changes in sales prices and production costs related to future production | (88,043,095 | ) | (73,439,526 | ) | (35,184,725 | ) | |||||
Changes in estimated future development costs | (9,585,405 | ) | 9,848,614 | (566,125 | ) | ||||||
Sales of oil and gas produced during the period, net of production costs | (18,538,016 | ) | (16,479,934 | ) | (19,569,182 | ) | |||||
Net change due to extensions, discoveries, and improved recovery | — | 775,574 | — | ||||||||
Net change due to revisions in quantity estimates | (9,391,321 | ) | (23,757,788 | ) | 64,817,544 | ||||||
Net change due to sales of minerals in place | — | (3,150,277 | ) | (34,119,027 | ) | ||||||
Development costs incurred during the period | 7,785,095 | — | 747,656 | ||||||||
Accretion of discount | 31,974,540 | 45,896,187 | 41,678,733 | ||||||||
Net change in discounted income taxes | 34,157,767 | 58,073,450 | 10,175,957 | ||||||||
Net changes in timing of production and other (a) | (15,240,698 | ) | (78,909,327 | ) | (4,357,625 | ) | |||||
Balance, end of year | $ | 159,196,539 | $ | 226,077,672 | $ | 307,220,699 | |||||
(a) Due to the June 2013 adverse fluid release event in the Delhi Field, the operator had expressed plans to produce the Delhi Field at lower production rates. The decision to produce these reserves at lower rates over a longer period of time did not materially change the total quantities expected to be recovered, but resulted in a significant reduction in the discounted value of these reserves as of June 30, 2014.
Note 23—Selected Quarterly Financial Data (Unaudited)
The following table presents summarized quarterly financial information for the years ended June 30, 2015 and 2014:
2015 | First | Second (1) | Third | Fourth | |||||||||||
Revenues | $ | 4,004,827 | $ | 7,708,067 | $ | 7,064,689 | $ | 9,063,682 | |||||||
Operating income | 1,840,866 | 2,162,294 | 1,245,990 | 3,334,547 | |||||||||||
Net income available to common shareholders | $ | 960,435 | $ | 1,071,342 | $ | 566,011 | $ | 1,719,767 | |||||||
Basic net income per share | $ | 0.03 | $ | 0.03 | $ | 0.02 | $ | 0.05 | |||||||
Diluted net income per share | $ | 0.03 | $ | 0.03 | $ | 0.02 | $ | 0.05 | |||||||
2014 | First | Second (2) | Third (3) | Fourth | |||||||||||
Revenues | $ | 4,633,699 | $ | 4,392,289 | $ | 4,337,006 | $ | 4,310,514 | |||||||
Operating income (loss) | 1,963,897 | (158,095 | ) | 1,357,534 | 2,364,811 | ||||||||||
Net income (loss) available to common shareholders | $ | 1,303,876 | $ | (577,459 | ) | $ | 755,125 | $ | 1,441,469 | ||||||
Basic net income (loss) per share | $ | 0.05 | $ | (0.02 | ) | $ | 0.02 | $ | 0.04 | ||||||
Diluted net income (loss) per share | $ | 0.04 | $ | (0.02 | ) | $ | 0.02 | $ | 0.04 | ||||||
(1) | Impacted by the November 1, 2014 reversion of the Company's 23.9% working interest and 19.0% net revenue interest in the Delhi Field. |
(2) | Reflects a $1.3 million restructuring charge and $0.8 million of non-recurring expenses primarily associated with the exercise of 4.0 million of 4.8 million of previously outstanding stock options and warrants. |
(3) | Includes $608,000 of non-recurring expenses related to the retirement of an officer of the Company. |
62
Item 9. Changes In and Disagreements with Accountants on Accounting and Financial Disclosure
None.
Item 9A. Controls and Procedures
Disclosure Controls and Procedures
We maintain disclosure controls and procedures that are designed to ensure that information required to be disclosed in our Exchange Act reports is recorded, processed, summarized and reported within the time periods specified in the Securities and Exchange Commission's rules and forms and that such information is accumulated and communicated to this Company's management, including our Chief Executive Officer and Chief Financial Officer, as appropriate to allow for timely decisions regarding required disclosure.
As required by Securities and Exchange Commission Rule 13a-15(b), we carried out an evaluation, under the supervision and with the participation of the Company's management, including our Chief Executive Officer and Chief Financial Officer, of the effectiveness of the design and operation of our disclosure controls and procedures as of the end of the period covered by this report. Based on this evaluation, our Chief Executive Officer and Chief Financial Officer concluded that our disclosure controls and procedures are effective in ensuring that the information required to be disclosed in our reports filed or submitted under the Exchange Act is recorded, processed, summarized and reported within the time periods specified in the Securities and Exchange Commission rules and forms.
Management's Report on Internal Control Over Financial Reporting
The Company's management is responsible for establishing and maintaining adequate internal control over financial reporting (as defined in Rules 13a-15(f) and 15d-15(f) of the Exchange Act) as a process designed by, or under the supervision of, the company's principal executive and principal financial officers and effected by the Company's board of directors, management and other personnel, to provide reasonable assurance regarding the reliability of financial reporting and the preparation of financial statements for external purposes in accordance with accounting principles generally accepted in the United States of America and includes those policies and procedures that:
• | Pertain to the maintenance of records that in reasonable detail accurately and fairly reflect the transactions and dispositions of the assets of the company; |
• | Provide reasonable assurance that transactions are recorded as necessary to permit preparation of financial statements in accordance with accounting principles generally accepted in the United States of America and that receipts and expenditures of the company are being made only in accordance with authorizations of management and directors of the company; and |
• | Provide reasonable assurance regarding prevention or timely detection of unauthorized acquisition, use or disposition of the company's assets that could have a material effect on the financial statements. |
Because of its inherent limitations, internal control over financial reporting may not prevent or detect misstatements. Therefore, even those systems determined to be effective can provide only reasonable assurance with respect to financial statement preparation and presentation. Also, projections of any evaluation of effectiveness to future periods are subject to risk that controls may become inadequate because of changes in conditions, or that the degree of compliance with the policies or procedures may deteriorate. Under the supervision and with the participation of management, including the Chief Executive Officer and the Chief Financial Officer, an evaluation was conducted on the effectiveness of the Company's internal control over financial reporting based on criteria established in the Internal Control-Integrated Framework issued by the Committee of Sponsoring Organizations of the Treadway Commission in 2013. Management concluded that the Company maintained effective internal control over financial reporting as of June 30, 2015.
The effectiveness of our internal control over financial reporting at June 30, 2015 has been audited by Hein & Associates LLP, the independent registered public accounting firm that also audited our financial statements. Their report is included in Item 8. "Financial Statements" of this Annual Report on form 10-K under the heading Report of Independent Registered Public Accounting Firm on internal control over financial reporting.
63
Changes in Internal Control Over Financial Reporting
There has been no change in the Company's internal control over financial reporting during the fourth quarter ended June 30, 2015 that has materially affected, or is reasonably likely to materially affect, the Company's internal control over financial reporting.
Item 9B. Other Information
None.
64
PART III
Item 10. Directors, Executive Officers And Corporate Governance
Incorporated by reference to the Company's Proxy Statement to be filed with the Commission pursuant to Regulation 14A within 120 days of the end of the Company's 2015 fiscal year.
Item 11. Executive Compensation
Incorporated by reference to the Company's Proxy Statement to be filed with the Commission pursuant to Regulation 14A within 120 days of the end of the Company's 2015 fiscal year.
Item 12. Security Ownership of Certain Beneficial Owners and Management and Related Stockholder Matters
Incorporated by reference to the Company's Proxy Statement to be filed with the Commission pursuant to Regulation 14A within 120 days of the end of the Company's 2015 fiscal year.
Item 13. Certain Relationships and Related Transactions, Director Independence
Incorporated by reference to the Company's Proxy Statement to be filed with the Commission pursuant to Regulation 14A within 120 days of the end of the Company's 2015 fiscal year.
Item 14. Principal Accountant Fees and Services
Incorporated by reference to the Company's Proxy Statement to be filed with the Commission pursuant to Regulation 14A within 120 days of the end of the Company's 2015 fiscal year.
65
PART IV.
Item 15. Exhibits and Financial Statement Schedules
The following documents are filed as part of this report:
1. Financial Statements.
Our consolidated financial statements are included in Part II, Item 8 of this report:
Report of Independent Registered Public Accounting Firm
Consolidated Balance Sheets
Consolidated Statements of Operations
Consolidated Statements of Cash Flows
Consolidated Statements of Stockholders' Equity
Notes to the Consolidated Financial Statements
2. Financial Statements Schedules and supplementary information required to be submitted:
None.
3. Exhibits
A list of the exhibits filed or furnished with this report on Form 10-K (or incorporated by reference to exhibits previously filed or furnished by us) is provided in the Exhibit Index of this report. Those exhibits incorporated by reference herein are indicated as such by the information supplied in the parenthetical thereafter. Otherwise, the exhibits are filed herewith.
66
GLOSSARY OF SELECTED PETROLEUM TERMS
The following abbreviations and definitions are terms commonly used in the crude oil and natural gas industry and throughout this form 10-K:
"BBL." A standard measure of volume for crude oil and liquid petroleum products; one barrel equals 42 U.S. gallons.
"BCF." Billion Cubic Feet of natural gas at standard temperature and pressure.
"BOE." Barrels of oil equivalent. BOE is calculated by converting 6 MCF of natural gas to 1 BBL of oil.
"BOPD." Barrels of oil per day.
"BTU" or "British Thermal Unit." The standard unit of measure of energy equal to the amount of heat required to raise the temperature of one pound of water 1 degree Fahrenheit. One Bbl of crude is typically 5.8 MMBTU, and one standard MCF is typically one MMBTU.
"CO2." Carbon dioxide, a gas that can be found in naturally occurring reservoirs, typically associated with ancient volcanoes, and also is a major byproduct from manufacturing and power production also utilized in enhanced oil recovery through injection into an oil reservoir.
"Developed Reserves." Reserves of any category that can be expected to be recovered (i) through existing wells with existing equipment and operating methods or in which the cost of the required equipment is relatively minor compared to the cost of a new well; and (ii) through installed extraction equipment and infrastructure operational at the time of the reserves estimate if the extraction is by means not involving a well.
"EOR." Enhanced Oil Recovery projects involve injection of heat, miscible or immiscible gas, or chemicals into oil reservoirs, typically following full primary and secondary waterflood recovery efforts, in order to gain incremental recovery of oil from the reservoir.
"Field." An area consisting of a single reservoir or multiple reservoirs all grouped on or related to the same individual geologic structural feature and/or stratigraphic feature.*
"Farmout." Sale or transfer of all or part of the operating rights from the working interest owner (the assignor or farm-out party), to an assignee (the farm-in party) who assumes all or some of the burden of development, in return for an interest in the property. The assignor may retain an overriding royalty or any other type of interest. For Federal tax purposes, a farm-out may be structured as a sale or lease, depending on the specific rights and carved out interests retained by the assignor.
"Gross Acres or Gross Wells." The total acres or number of wells participated in, regardless of the amount of working interest owned.
"Horizontal Drilling." Involves drilling horizontally out from a vertical well bore, thereby potentially increasing the area and reach of the well bore that is in contact with the reservoir.
"Hydraulic Fracturing." Involves pumping a fluid with or without particulates into a formation at high pressure, thereby creating fractures in the rock and leaving the particulates in the fractures to ensure that the fractures remain open, thereby potentially increasing the ability of the reservoir to produce oil or gas.
"LOE." Means lease operating expense(s), a current period expense incurred to operate a well.
"MBO." One thousand barrels of oil
"MBOE." One thousand barrels of oil equivalent.
"MCF." One thousand cubic feet of natural gas at standard conditions, being approximately sea level pressure and 60 degrees Fahrenheit temperature. Standard pressure in the state of Louisiana is deemed to be 15.025 psi by regulation, but varies in other states.
"MMBOE." One million barrels of oil equivalent.
"MMBTU." One million British thermal units.
"MMCF." One million cubic feet of natural gas at standard temperature and pressure.
67
"Mineral Royalty Interest." A royalty interest that is retained by the owner of the minerals underlying a lease. See "Royalty Interest".
"Net Acres or Net Wells." The sum of the fractional working interests owned in gross acres or gross wells.
"NGL." Natural gas liquids, being the combination of ethane, propane, butane and natural gasoline that can be removed from natural gas through processing, typically through refrigeration plants that utilize low temperatures, or through J-T plants that utilize compression, temperature reduction and expansion to a lower pressure.
"NYMEX." New York Mercantile Exchange.
"OOIP." Original Oil in Place. An estimate of the barrels originally contained in a reservoir before any production therefrom.
"Operator." An oil and gas joint venture participant that manages the joint venture, pays venture costs and bills the venture's non-operators for their share of venture costs. The operator is also responsible to market all oil and gas production, except for those non-operators who take their production in-kind.
"Overriding Royalty Interest or ORRI." A royalty interest that is created out of the operating or working interest. Unlike a royalty interest, an overriding royalty interest terminates with the operating interest from which it was created or carved out of. See "Royalty Interest".
"Permeability." The measure of ease with which a fluid can move through a reservoir. The unit of measure is a darcy, or any metric derivation thereof, such as a millidarcy, where one darcy equals 1,000 millidarcys. Extremely low permeability of 10 millidarcys, or less, are often associated with source rocks, such as shale, making extraction of hydrocarbons more difficult, than say sandstone traps, where permeability can be one to two darcys or more.
"Porosity." (of sand or sandstone). The relative volume of the pore space (or open area) compared to the total bulk volume of the reservoir, stated in percent. Higher porosity rocks provide more storage space for hydrocarbon accumulations than lower porosity rocks in a given cubic volume of reservoir.
“Possible Reserves.” Additional unproved reserves that analysis of geological and engineering data suggests are less likely to be recoverable than Probable Reserves, but have at least a ten percent probability of being recovered.*
"Probable Developed Producing Reserves." Probable Reserves that are Developed and Producing.*
"Probable Reserves." Additional reserves that are less certain to be recovered than Proved Reserves but which, together with Proved Reserves, are as likely as not to be recovered.*
"Producing Reserves." Any category of reserves that have been developed and production has been initiated.*
"Proved Developed Reserves." Proved Reserves that can be expected to be recovered (i) through existing wells with existing equipment and operating methods or in which the cost of the required equipment is relatively minor compared to the cost of a new well; and (ii) through installed extraction equipment and infrastructure operational at the time of the reserves estimate if the extraction is by means not involving a well.
"Proved Developed Nonproducing Reserves ("PDNP")." Proved Reserves that have been developed and no material amount of capital expenditures are required to bring on production, but production has not yet been initiated due to timing, markets, or lack of third party completed connection to a gas sales pipeline.*
"Proved Developed Producing Reserves ("PDP")." Proved Reserves that have been developed and production has been initiated.*
"Proved Reserves." Estimated quantities of crude oil, natural gas, and natural gas liquids which geological and engineering data demonstrate with reasonable certainty to be recoverable in future years from known reservoirs under existing economic, operating methods, and government regulations prior to the time at which contracts providing the right to operate expire, unless evidence indicates that renewal is reasonably certain, regardless of whether deterministic or probabilistic methods are used for the estimation. The project to extract the hydrocarbons must have commenced or the operator must be reasonably certain that it will commence the project within a reasonable time.*
"Proved Undeveloped Reserves ("PUD")." Proved Reserves that are expected to be recovered from new wells on undrilled acreage, or from existing wells where a relatively major expenditure is required for recompletion.*
68
(i) Reserves on undrilled acreage shall be limited to those directly offsetting development spacing areas that are reasonably certain of production when drilled, unless evidence using reliable technology exists that establishes reasonable certainty of economic producibility at greater distances.
(ii) Undrilled locations can be classified as having undeveloped reserves only if a development plan has been adopted indicating that they are scheduled to be drilled within five years, unless the specific circumstances, justify a longer time.
(iii) Under no circumstances shall estimates for undeveloped reserves be attributable to any acreage for which an application of fluid injection or other improved recovery technique is contemplated, unless such techniques have been proved effective by actual projects in the same reservoir or an analogous reservoir or by other evidence using reliable technology establishing reasonable certainty.
"PSI," or pounds per square inch, a measure of pressure. Pressure is typically measured as "psig", or the pressure in excess of standard atmospheric pressure.
"Present Value." When used with respect to oil and gas reserves, present value means the estimated future net revenues computed by applying current prices of oil and gas reserves (with consideration of price changes only to the extent provided by contractual arrangements) to estimated future production of proved oil and gas reserves as of the date of the latest balance sheet presented, less estimated future expenditures (based on current costs to be incurred in developing and producing the proved reserves) computed using a discount factor and assuming continuation of existing economic conditions.
"Productive Well." A well that is producing oil or gas or that is capable of production.
"PV-10." Means the present value, discounted at 10% per annum, of future net revenues (estimated future gross revenues less estimated future costs of production, development, and asset retirement costs) associated with reserves and is not necessarily the same as market value. PV-10 does not include estimated future income taxes. Unless otherwise noted, PV-10 is calculated using the pricing scheme as required by the Securities and Exchange Commission ("SEC"). PV-10 of proved reserves is calculated the same as the standardized measure of discounted future net cash flows, except that the standardized measure of discounted future net cash flows includes future estimated income taxes discounted at 10% per annum. See the definition of standardized measure of discounted future net cash flows.
"Royalty" or "Royalty Interest." 1) The mineral owner's share of oil or gas production (typically between 1/8 and 1/4), free of costs, but subject to severance taxes unless the lessor is a government. In certain circumstances, the royalty owner bears a proportionate share of the costs of making the natural gas saleable, such as processing, compression and gathering. 2) When a royalty interest is coterminous with and carved out of an operating or working interest, it is an "Overriding Royalty Interest," which also may generically be referred to as a Royalty.
"Shut-in Well." A well that is not on production, but has not yet been plugged and abandoned. Wells may be shut-in in anticipation of future utility as a producing well, plugging and abandonment or other use.
"Standardized Measure." The standardized measure of discounted future net cash flows (the "Standardized Measure") is an estimate of future net cash flows associated with proved reserves, discounted at 10% per annum. Future net cash flows is calculated by reducing future net revenues by estimated future income tax expenses and discounting at 10% per annum. The Standardized Measure and the PV-10 of proved reserves is calculated in the same exact fashion, except that the Standardized Measure includes future estimated income taxes discounted at 10% per annum. The Standardized Measure is in accordance with accounting standards generally accepted in the United States of America ("GAAP").
"SWIW." Salt water injection well.
"Undeveloped Reserves." Reserves of any category that are expected to be recovered from new wells on undrilled acreage, or from existing wells where a relatively major expenditure is required for recompletion.*
"Working Interest." The interest in the oil and gas in place which is burdened with the cost of development and operation of the property. Also called the operating interest.
"Workover." A remedial operation on a completed well to restore, maintain or improve the well's production.
______________________________________________________________________________
* This definition may be an abbreviated version of the complete definition as defined by the SEC in Rule 4-10(a) of Regulation S-X.
69
SIGNATURES
In accordance with Section 13 or 15(d) of the Securities Exchange Act of 1934, the registrant caused this report to be signed on its behalf by the undersigned, thereunto duly authorized in the City of Houston, Texas, on the date indicated.
Evolution Petroleum Corporation | ||||
By: | /s/ ROBERT S. HERLIN Robert S. Herlin Chairman of the Board and Chief Executive Officer (Principal Executive Officer) | |||
Date: September 11, 2015 | ||||
In accordance with the Securities Exchange Act of 1934, this report has been signed below by the following persons on behalf of the registrant and in the capacities and on the dates indicated.
Date | Signature | Title | ||
September 11, 2015 | /s/ ROBERT S. HERLIN Robert S. Herlin | Chairman of the Board and Chief Executive Officer (Principal Executive Officer) | ||
September 11, 2015 | /s/ RANDALL D. KEYS Randall D. Keys | President and Chief Financial Officer (Principal Financial Officer and Principal Accounting Officer) | ||
September 11, 2015 | /s/ DAVID JOE David Joe | Vice President, Controller, Chief Administrative Officer and Corporate Secretary | ||
September 11, 2015 | /s/ EDWARD J. DIPAOLO Edward J. DiPaolo | Director | ||
September 11, 2015 | /s/ GENE STOEVER Gene Stoever | Director | ||
September 11, 2015 | /s/ WILLIAM DOZIER William Dozier | Director | ||
September 11, 2015 | /s/ KELLY W. LOYD Kelly W. Loyd | Director | ||
70
INDEX OF EXHIBITS
MASTER EXHIBIT INDEX
EXHIBIT NUMBER | DESCRIPTION | |
3.1 | Articles of Incorporation (Previously filed as an exhibit to the Company's Current Report on Form 8-K on February 7, 2002) | |
3.2 | Certificate of Amendment to Articles of Incorporation (Previously filed as an exhibit to the Company's Current Report on Form 8-K on February 7, 2002) | |
3.3 | Certificate of Amendment to Articles of Incorporation (Previously filed as an exhibit to Form SB 2/A on October 19, 2005) | |
3.4 | Certificate of Designation of Rights and Preferences for 8.5% Series A Cumulative Preferred Stock (Previously filed as an exhibit to the Company's Current Report of Form 8-K on June 29, 2011) | |
3.5 | Bylaws (Previously filed as an exhibit to the Company's Current Report on Form 8-K on February 7, 2002) | |
3.6 | Amended Bylaws (Previously filed as an exhibit to Form 10KSB on March 31, 2004) | |
4.1 | Form of Stock Option Agreement for the Natural Gas Systems 2004 Stock Plan (Previously filed as an exhibit to the Current Report on Form 8-K on April 8, 2005) | |
4.2 | Specimen form of the Company's Common Stock Certificate (Previously filed as an exhibit to Form S-3 on June 19, 2013) | |
4.3 | Specimen form of the Company's 8.5% Series A Cumulative Preferred Stock Certificate (Previously filed as an exhibit to Form 8-A on June 29, 2011) | |
4.4 | 2004 Stock Plan (Previously filed as an exhibit to the Company's Definitive Information Statement on Schedule 14C on August 9, 2004) | |
4.5 | Amended and Restated 2004 Stock Plan, adopted December 4, 2007 (previously filed as an exhibit to the Company's Definitive Information Statement on Schedule 14A on October 29, 2007) | |
4.6 | Amendment to Amended and Restated 2004 Stock Plan, adopted December 5, 2011 (previously filed as an exhibit to the Company's Definitive Information Statement on Schedule 14A on October 28, 2011) | |
4.7 | Form of Restricted Stock Agreement (Previously filed as an exhibit to Form 8-K on May 15, 2009) | |
4.8 | Form of Contingent Performance Stock Grant under the Evolution Petroleum Corporation Amended and Restated 2004 Stock Plan (Previously filed as an exhibit to the Company's Quarterly Report on Form 10-Q on November 7, 2014 ) | |
4.9 | Majority Voting Policy for Directors (Previously filed as an exhibit to the Company's Current Report on Form 8-K on October 31, 2012) | |
10.1 | Executive Employment Agreement of Robert S. Herlin, dated April 4, 2005 (Previously filed as an exhibit to Form 8-K on April 8, 2005) | |
10.2 | Executive Employment Agreement of Sterling H. McDonald, dated April 4, 2005 (Previously filed as an exhibit to Form 8-K on April 8, 2005) | |
10.3 | Executive Employment Agreement of Daryl V. Mazzanti, dated June 23, 2005 (Previously filed as an exhibit to Form 8-K on June 29, 2005) | |
10.4 | Purchase and Sale Agreement I, by and between NGS Sub Corp. and Denbury Onshore, LLC, dated May 8, 2006 (Previously filed as an exhibit to Form 8-K on June 16, 2006) | |
10.5 | Purchase and Sale Agreement II, by and between NGS Sub Corp. and Denbury Onshore, LLC, dated May 8, 2006 (Previously filed as an exhibit to Form 8-K on June 16, 2006) | |
10.6 | Conveyance, Assignment and Bill of Sale Agreement, by and between NGS Sub Corp. and Denbury Onshore, LLC, dated May 8, 2006 (Previously filed as an exhibit to Form 8-K on June 16, 2006) | |
10.7 | Unit Operating Agreement, by and between NGS Sub Corp. and Denbury Onshore, LLC, dated May 8, 2006 (Previously filed as an exhibit to Form 8-K on June 16, 2006) | |
10.8 | Form of Indemnification Agreement for Officers and Directors, as adopted on September 20, 2006 (Previously filed as an exhibit to Form 8-K on September 22, 2006) | |
10.9 | Credit Agreement dated February 29, 2012 among Evolution Petroleum Corporation, the Guarantors and Texas Capital Bank N.A. (incorporated by reference as Exhibit 10.1 to the Company's Form 8-K filed with the SEC on March 6, 2012. | |
10.10 | First Amendment to the Credit Agreement dated February 29, 2012 among Evolution Petroleum Corporation, the Guarantors and Texas Capital Bank N.A effective November 1, 2012 (Filed herein) | |
71
EXHIBIT NUMBER | DESCRIPTION | |
10.11 | Second Amendment to the Credit Agreement dated February 29, 2012 among Evolution Petroleum Corporation, the Guarantors and Texas Capital Bank N.A effective May 14, 2014 (Filed herein) | |
10.12 | Lease Acquisition Agreement Cowboy Prospect by and between Evolution Petroleum OK, Inc. and Orion Exploration Partners, LLC dated April 17, 2012 (incorporated by reference as Exhibit 10.1 to the Company Form 8-K/A filed with the SEC on August 21, 2012) | |
10.13 | Participation and AMI Agreement by and between Orion Exploration Partners, LLC and Evolution Petroleum OK, Inc. dated April 17, 2012 (incorporated by reference as Exhibit 10.2 to the Company Form 8-K/A filed with the SEC on August 21, 2012) | |
10.14 | Technology Assignment Agreement dated June 30, 2011 between Evolution Petroleum Corporation and Daryl Mazzanti (Filed herein) | |
14.1 | Code of Business Conduct and Ethics for Natural Gas Systems, Inc. (Previously filed as an exhibit to Form 8-K on May 4, 2006) | |
21.1 | List of Subsidiaries of Evolution Petroleum Corporation (Filed herein) | |
23.1 | Consent of Hein & Associates, LLP (Filed herein) | |
23.2 | Consent of DeGolyer and MacNaughton (Filed herein) | |
23.3 | Consent of W.D. Von Gonten & Co. (Filed herein) | |
23.4 | Consent of Pinnacle Energy Services, LLC (Filed herein) | |
31.1 | Certification of Chief Executive Officer Robert S. Herlin Pursuant to Rule 15D-14 of the Securities Exchange Act of 1934, as Amended as Adopted Pursuant to Section 302 of the Sarbanes-Oxley Act of 2002 (Filed herein) | |
31.2 | Certification of President and Chief Financial Officer Randall D. Keys Pursuant to Rule 15D-14 of the Securities Exchange Act of 1934, as Amended as Adopted Pursuant to Section 302 of the Sarbanes-Oxley Act of 2002 (Filed herein) | |
32.1 | Certification of Chief Executive Officer Robert S. Herlin Pursuant to 18 U.S.C. Section 1350, as Adopted Pursuant to Section 906 of the Sarbanes-Oxley Act of 2002 (Filed herein) | |
32.2 | Certification of President and Chief Financial Officer Randall D. Keys Pursuant to 18 U.S.C. Section 1350, as Adopted Pursuant to Section 906 of the Sarbanes-Oxley Act of 2002 (Filed herein) | |
99.1 | Audit Committee Charter of the Board of Directors of Natural Gas Systems, Inc. (Previously filed as an exhibit to Form 8-K on May 4, 2006) | |
99.2 | Compensation Committee Charter of the Board of Directors of Natural Gas Systems, Inc. (Previously filed as an exhibit to Form 8-K on May 4, 2006) | |
99.3 | Nominating Committee Charter of the Board of Directors of Natural Gas Systems, Inc. (Previously filed as an exhibit to Form 8-K on May 4, 2006) | |
99.4 | The summary of DeGolyer and MacNaughton's Report as of June 30, 2015, on oil and gas reserves (SEC Case) dated August 14, 2015 and certificate of qualification (Filed herein) | |
101.INS | XBRL Instance Document | |
101.SCH | XBRL Taxonomy Extension Schema Document | |
101.CAL | XBRL Taxonomy Extension Calculation Linkbase Document | |
101.DEF | XBRL Taxonomy Extension Definition Linkbase Document | |
101.LAB | XBRL Taxonomy Extension Label Linkbase Document | |
101.PRE | XBRL Taxonomy Extension Presentation Linkbase Document | |
72