Attached files
| file | filename |
|---|---|
| 8-K - 8-K - Your Community Bankshares, Inc. | a15-19168_18k.htm |
Exhibit 99.1
|
|
Raymond James U.S. Bank Conference Investor Presentation September 9, 2015 Your Community Bankshares, Inc. A NASDAQ Traded Company - Symbol YCB “Achieving Financial Goals with Exceptional People and Exceptional Service” |
|
|
Safe Harbor Statement for Forward-Looking Statements This investor presentation may contain forward-looking statements within the meaning of the federal securities laws. We intend such forward-looking statements to be covered by the safe harbor provisions for forward-looking statements contained in the federal securities laws. These statements are not historical facts, but rather statements based on our current expectations regarding our business strategies and their intended results and our future performance. Forward-looking statements are preceded by terms such as “expects,” “believes,” “anticipates,” “intends,” “may,” “could,” “should” and similar expressions. Forward-looking statements are not guarantees of future performance. Numerous risks and uncertainties could cause or contribute to our actual results, performance, and achievements to be materially different from those expressed or implied by the forward-looking statements. Factors that may cause or contribute to these differences include, without limitation, general economic conditions, including changes in market interest rates and changes in monetary and fiscal policies of the federal government; legislative and regulatory changes; competitive conditions in the banking markets served by our subsidiaries; the adequacy of the allowance for losses on loans and the level of future provisions for losses on loans; costs of integrating acquired operations and realizing benefits of the acquisition and other factors disclosed periodically in our filings with the Securities and Exchange Commission. Because of the significant risks and uncertainties inherent in forward-looking statements, readers should not place undue reliance on them, whether included in this report or made elsewhere from time to time by us or on our behalf. Our forward-looking statements are made as of the date of the presentation and we assume no obligation to update any forward-looking statements or the reasons why actual results could differ from those contained in such forward-looking statements. Page|2 |
|
|
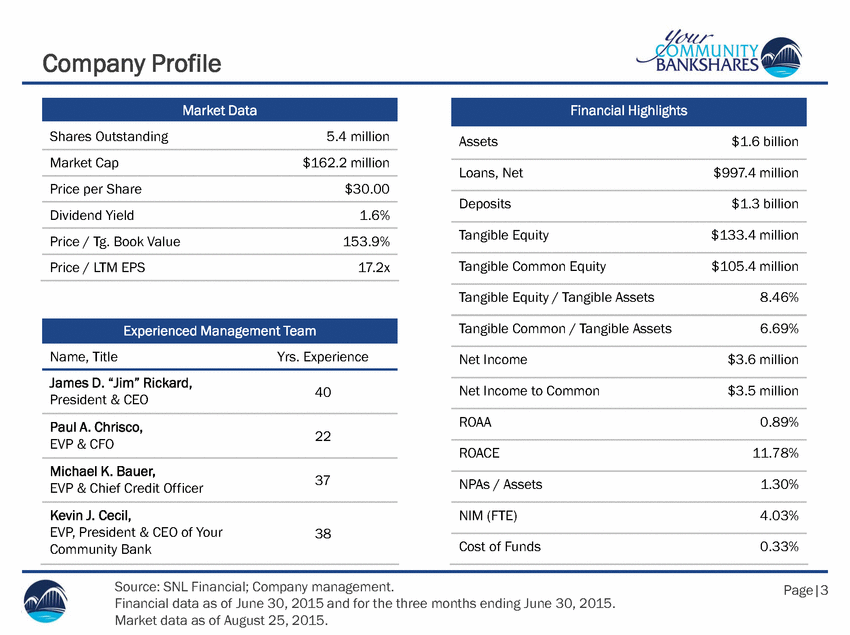
Financial data as of June 30, 2015 and for the three months ending June 30, 2015. Company Profile Name, TitleYrs. Experience President & CEO 22 EVP & Chief Credit Officer37 Community Bank Source: SNL Financial; Company management. Page|3 Market data as of August 25, 2015. James D. “Jim” Rickard,40 Paul A. Chrisco, EVP & CFO Michael K. Bauer, Kevin J. Cecil, EVP, President & CEO of Your38 Experienced Management Team Financial Highlights Assets $1.6 billion Loans, Net $997.4 million Deposits $1.3 billion Tangible Equity $133.4 million Tangible Common Equity $105.4 million Tangible Equity / Tangible Assets 8.46% Tangible Common / Tangible Assets 6.69% Net Income $3.6 million Net Income to Common $3.5 million ROAA 0.89% ROACE 11.78% NPAs / Assets 1.30% NIM (FTE) 4.03% Cost of Funds 0.33% Market Data Shares Outstanding 5.4 million Market Cap $162.2 million Price per Share $30.00 Dividend Yield 1.6% Price / Tg. Book Value 153.9% Price / LTM EPS 17.2x |
|
|
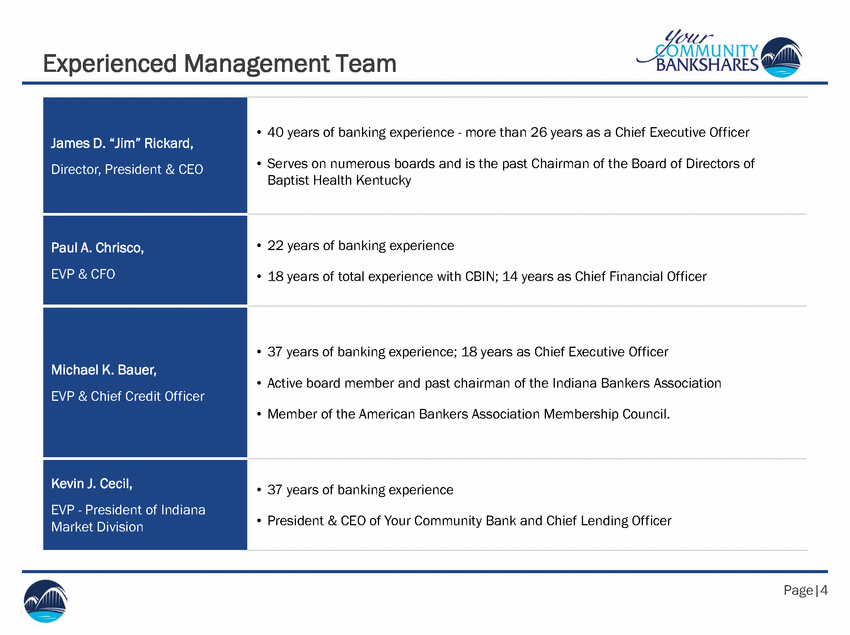
Experienced Management Team Baptist Health Kentucky Page|4 James D. “Jim” Rickard, Director, President & CEO • 40 years of banking experience - more than 26 years as a Chief Executive Officer • Serves on numerous boards and is the past Chairman of the Board of Directors of Paul A. Chrisco, EVP & CFO • 22 years of banking experience • 18 years of total experience with CBIN; 14 years as Chief Financial Officer Michael K. Bauer, EVP & Chief Credit Officer • 37 years of banking experience; 18 years as Chief Executive Officer • Active board member and past chairman of the Indiana Bankers Association • Member of the American Bankers Association Membership Council. Kevin J. Cecil, EVP - President of Indiana Market Division • 37 years of banking experience • President & CEO of Your Community Bank and Chief Lending Officer |
|
|
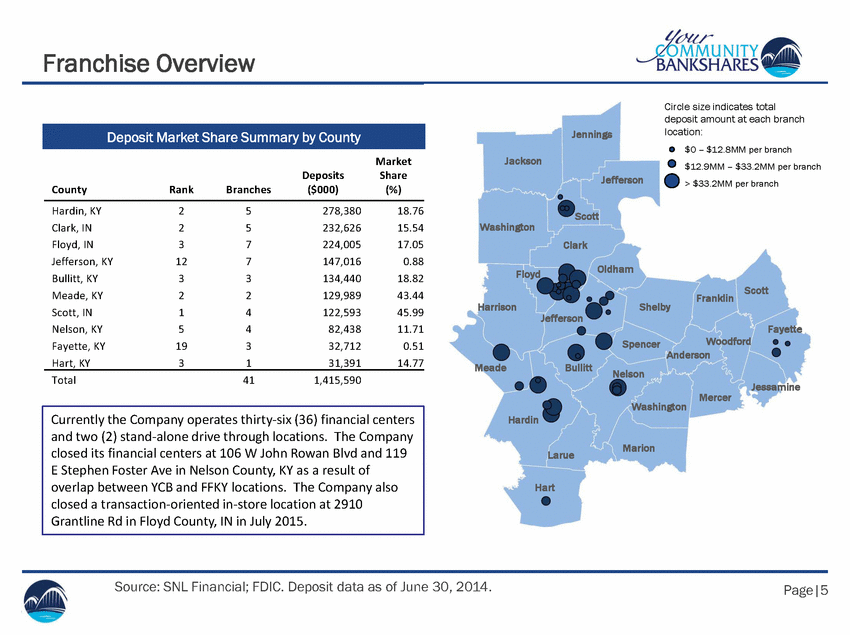
Jefferson > $33.2MM per branch Franklin Jefferson Anderson Jessamine Washington Franchise Overview Circle size indicates total deposit amount at each branch Jenningslocation: $0 – $12.8MM per branch Jackson$12.9MM – $33.2MM per branch Scott Washington Clark FloydOldham Scott HarrisonShelby Fayette SpencerWoodford MeadeBullittNelson Mercer Hardin LarueMarion Hart Source: SNL Financial; FDIC. Deposit data as of June 30, 2014. Page|5 Currently the Company operates thirty-six (36) financial centers and two (2) stand-alone drive through locations. The Company closed its financial centers at 106 W John Rowan Blvd and 119 E Stephen Foster Ave in Nelson County, KY as a result of overlap between YCB and FFKY locations. The Company also closed a transaction-oriented in-store location at 2910 Grantline Rd in Floyd County, IN in July 2015. Deposit Market Share Summary by County County Rank Branches Deposits ($000) Market Share (%) Hardin, KY 2 5 278,380 18.76 Clark, IN 2 5 232,626 15.54 Floyd, IN 3 7 224,005 17.05 Jefferson, KY 12 7 147,016 0.88 Bullitt, KY 3 3 134,440 18.82 Meade, KY 2 2 129,989 43.44 Scott, IN 1 4 122,593 45.99 Nelson, KY 5 4 82,438 11.71 Fayette, KY 19 3 32,712 0.51 Hart, KY 3 1 31,391 14.77 Total 41 1,415,590 |
|
|
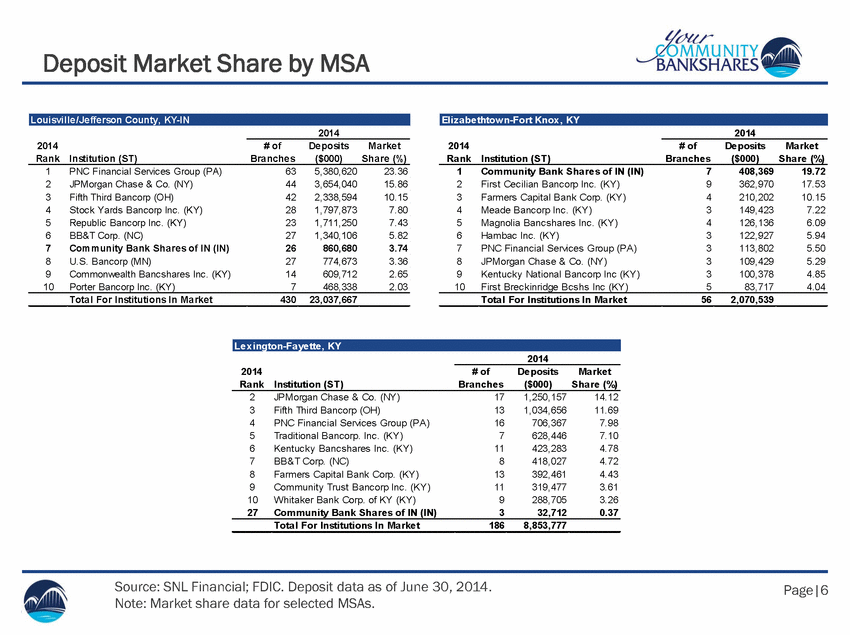
Note: Market share data for selected MSAs. Deposit Market Share by MSA Elizabethtow n-Fort Knox, KY 2014 2014 # of Deposits Market Rank Institution (ST) Branches ($000) Share (%) 1 PNC Financial Services Group (PA) 63 5,380,620 23.36 2 JPMorgan Chase & Co. (NY) 44 3,654,040 15.86 3 Fifth Third Bancorp (OH) 42 2,338,594 10.15 4 Stock Yards Bancorp Inc. (KY) 28 1,797,873 7.80 5 Republic Bancorp Inc. (KY) 23 1,711,250 7.43 6 BB&T Corp. (NC) 27 1,340,106 5.82 7 Community Bank Shares of IN (IN) 26 860,680 3.74 8 U.S. Bancorp (MN) 27 774,673 3.36 9 Commonwealth Bancshares Inc. (KY) 14 609,712 2.65 10 Porter Bancorp Inc. (KY) 7 468,338 2.03 Total For Institutions In Market 430 23,037,667 2014 Rank Institution (ST) 2 JPMorgan Chase & Co. (NY) 3 Fifth Third Bancorp (OH) 4 PNC Financial Services Group (PA) 5 Traditional Bancorp. Inc. (KY) 6 Kentucky Bancshares Inc. (KY) 7 BB&T Corp. (NC) 8 Farmers Capital Bank Corp. (KY) 9 Community Trust Bancorp Inc. (KY) 10 Whitaker Bank Corp. of KY (KY) 27 Community Bank Shares of IN (IN) Total For Institutions In Market 2014 Rank Institution (ST) 2014 # of Deposits Market Branches ($000) Share (%) 1 Community Bank Shares of IN (IN) 7 408,369 19.72 2 First Cecilian Bancorp Inc. (KY) 9 362,970 17.53 3 Farmers Capital Bank Corp. (KY) 4 210,202 10.15 4 Meade Bancorp Inc. (KY) 3 149,423 7.22 5 Magnolia Bancshares Inc. (KY) 4 126,136 6.09 6 Hambac Inc. (KY) 3 122,927 5.94 7 PNC Financial Services Group (PA) 3 113,802 5.50 8 JPMorgan Chase & Co. (NY) 3 109,429 5.29 9 Kentucky National Bancorp Inc (KY) 3 100,378 4.85 10 First Breckinridge Bcshs Inc (KY) 5 83,717 4.04 Total For Institutions In Market 56 2,070,539 2014 # of Deposits Market Branches ($000) Share (%) 17 1,250,157 14.12 13 1,034,656 11.69 16 706,367 7.98 7 628,446 7.10 11 423,283 4.78 8 418,027 4.72 13 392,461 4.43 11 319,477 3.61 9 288,705 3.26 3 32,712 0.37 186 8,853,777 Source: SNL Financial; FDIC. Deposit data as of June 30, 2014. Page|6 Lexington-Fayette, KY Louisville/Jefferson County, KY-IN |
|
|
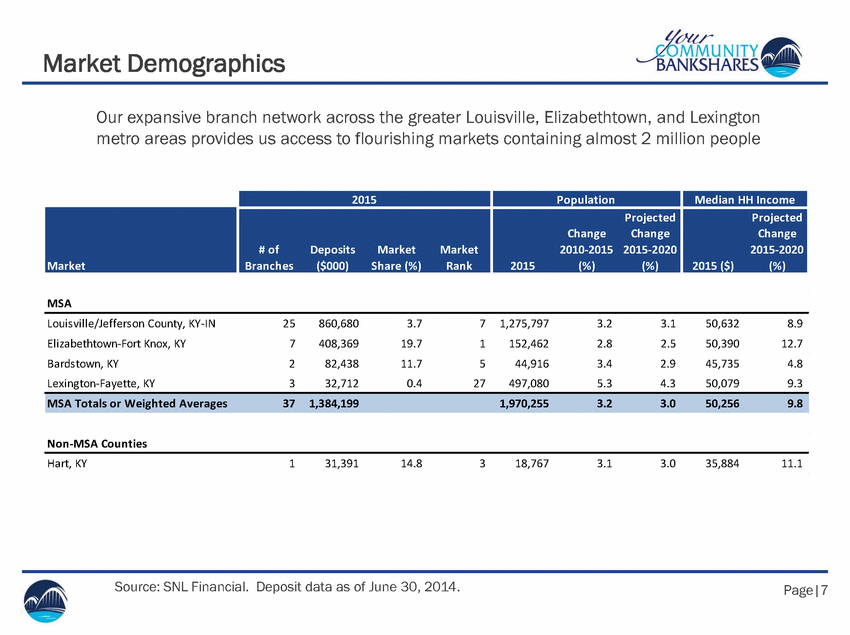
Market Demographics Our expansive branch network across the greater Louisville, Elizabethtown, and Lexington metro areas provides us access to flourishing markets containing almost 2 million people MSA Louisville/Jefferson County, KY-IN25860,6803.771,275,7973.23.150,6328.9 Elizabethtown-Fort Knox, KY7408,36919.71152,4622.82.550,39012.7 Bardstown, KY282,43811.7544,9163.42.945,7354.8 Lexington-Fayette, KY332,7120.427497,0805.34.350,0799.3 Non-MSA Counties Hart, KY131,39114.8318,7673.13.035,88411.1 Source: SNL Financial. Deposit data as of June 30, 2014. Page|7 MSA Totals or Weighted Averages371,384,1991,970,2553.23.050,2569.8 2015 Population Median HH Income Market # ofDepositsMarketMarket Branches($000)Share (%)Rank Projected ChangeChange 2010-2015 2015-2020 2015(%)(%) Projected Change 2015-2020 2015 ($)(%) |
|
|
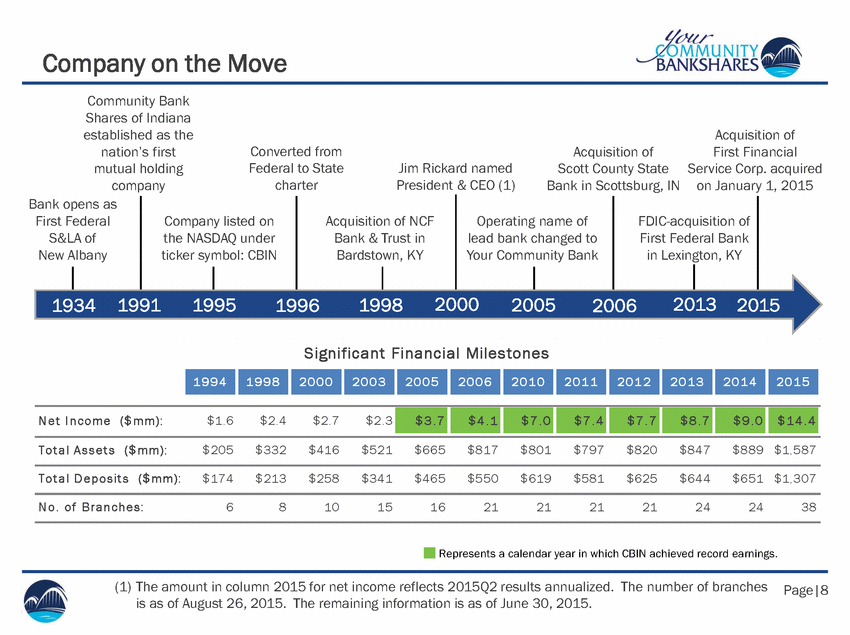
(1) The amount in column 2015 for net income reflects 2015Q2 results annualized. The number of branches is as of August 26, 2015. The remaining information is as of June 30, 2015. Company on the Move Page|8 Acquisition of NCF Bank & Trust in Bardstown, KY 1934 1998 Bank opens as First Federal S&LA of New Albany 1991 Community Bank Shares of Indiana established as the nation’s first mutual holding company 1995 Company listed on the NASDAQ under ticker symbol: CBIN 2013 FDIC-acquisition of First Federal Bank in Lexington, KY 2006 Acquisition of Scott County State Bank in Scottsburg, IN 1996 Converted from Federal to State charter Operating name of lead bank changed to Your Community Bank 2005 Jim Rickard named President & CEO (1) 2000 Represents a calendar year in which CBIN achieved record earnings. 2015 Acquisition of First Financial Service Corp. acquired on January 1, 2015 1994 1998 2000 2003 2005 2006 2010 2011 2012 2013 2014 2015 Net Income ($mm): $1.6 $2.4 $2.7 $2.3 $3.7 $4.1 $7.0 $7.4 $7.7 $8.7 $9.0 $14.4 Total Assets ($mm): $205 $332 $416 $521 $665 $817 $801 $797 $820 $847 $889 $1,587 Total Deposits ($mm): $174 $213 $258 $341 $465 $550 $619 $581 $625 $644 $651 $1,307 No. of Branches: 6 8 10 15 16 21 21 21 21 24 24 38 Significant Financial Milestones |
|
|
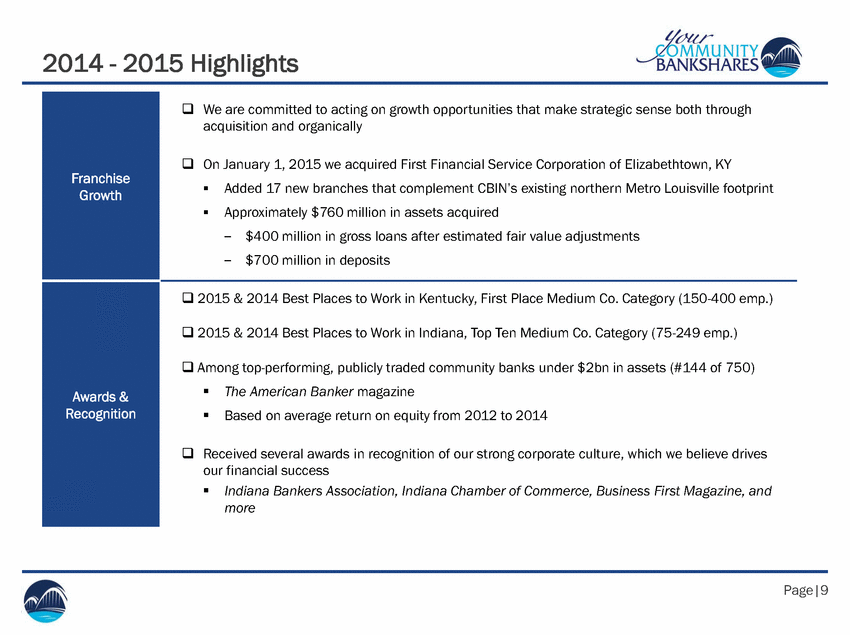
2014 - 2015 Highlights Page|9 Franchise Growth We are committed to acting on growth opportunities that make strategic sense both through acquisition and organically On January 1, 2015 we acquired First Financial Service Corporation of Elizabethtown, KY Added 17 new branches that complement CBIN’s existing northern Metro Louisville footprint Approximately $760 million in assets acquired –$400 million in gross loans after estimated fair value adjustments –$700 million in deposits Awards & Recognition 2015 & 2014 Best Places to Work in Kentucky, First Place Medium Co. Category (150-400 emp.) 2015 & 2014 Best Places to Work in Indiana, Top Ten Medium Co. Category (75-249 emp.) Among top-performing, publicly traded community banks under $2bn in assets (#144 of 750) The American Banker magazine Based on average return on equity from 2012 to 2014 Received several awards in recognition of our strong corporate culture, which we believe drives our financial success Indiana Bankers Association, Indiana Chamber of Commerce, Business First Magazine, and more |
|
|
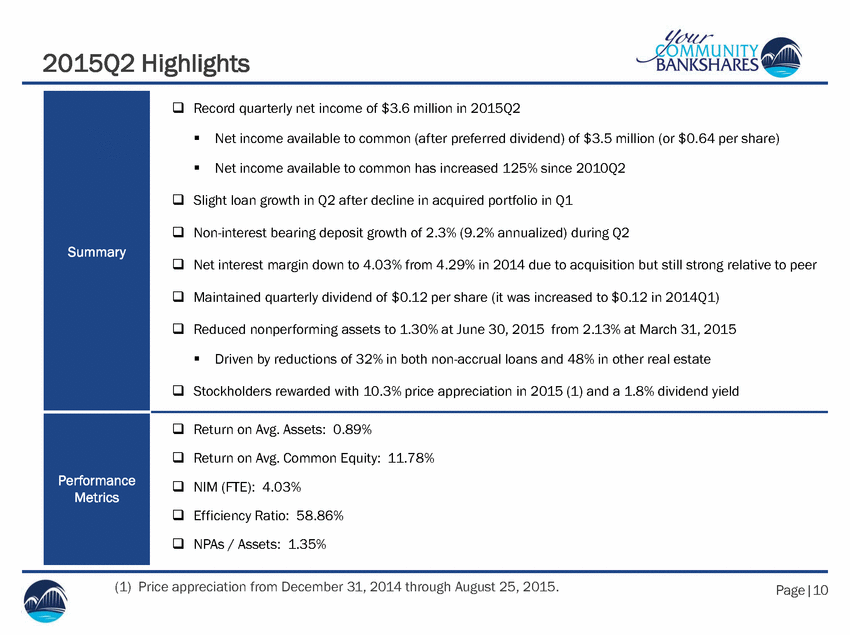
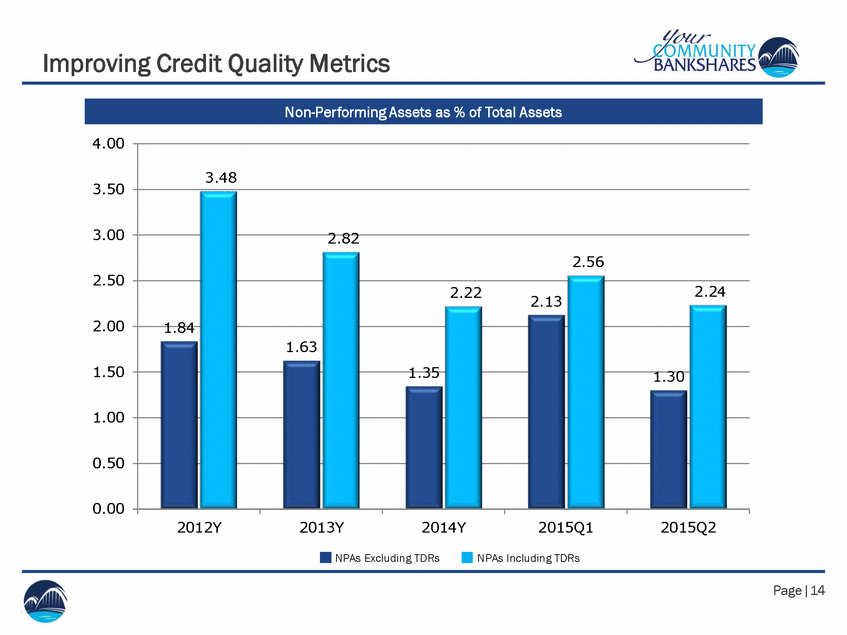
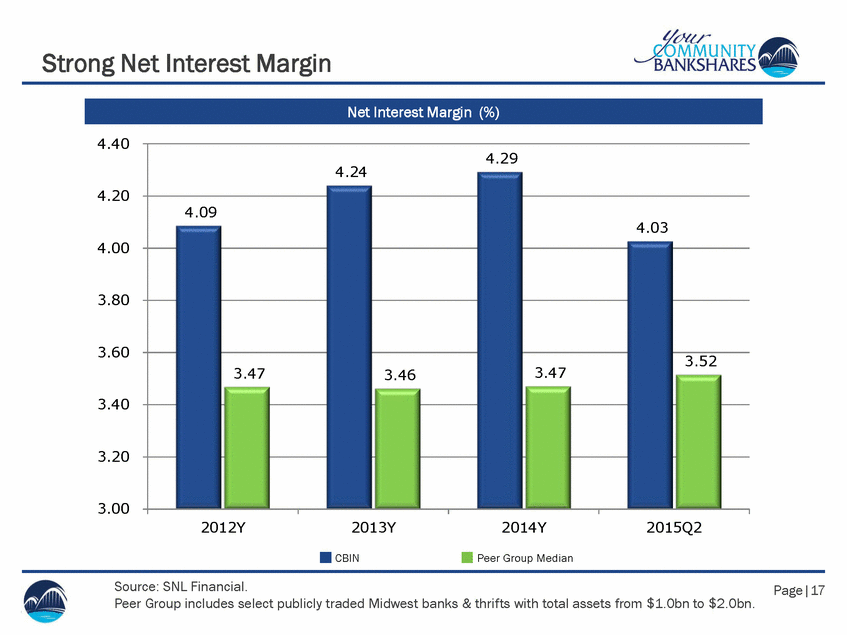
2015Q2 Highlights Summary Record quarterly net income of $3.6 million in 2015Q2 Net income available to common (after preferred dividend) of $3.5 million (or $0.64 per share) Net income available to common has increased 125% since 2010Q2 Slight loan growth in Q2 after decline in acquired portfolio in Q1 Non-interest bearing deposit growth of 2.3% (9.2% annualized) during Q2 Net interest margin down to 4.03% from 4.29% in 2014 due to acquisition but still strong relative to peer Maintained quarterly dividend of $0.12 per share (it was increased to $0.12 in 2014Q1) Reduced nonperforming assets to 1.30% at June 30, 2015 from 2.13% at March 31, 2015 Driven by reductions of 32% in both non-accrual loans and 48% in other real estate Stockholders rewarded with 10.3% price appreciation in 2015 (1) and a 1.8% dividend yield Performance Metrics Return on Avg. Assets: 0.89% Return on Avg. Common Equity: 11.78% NIM (FTE): 4.03% Efficiency Ratio: 58.86% NPAs / Assets: 1.35% (1) Price appreciation from December 31, 2014 through August 25, 2015. Page|10 |
|
|
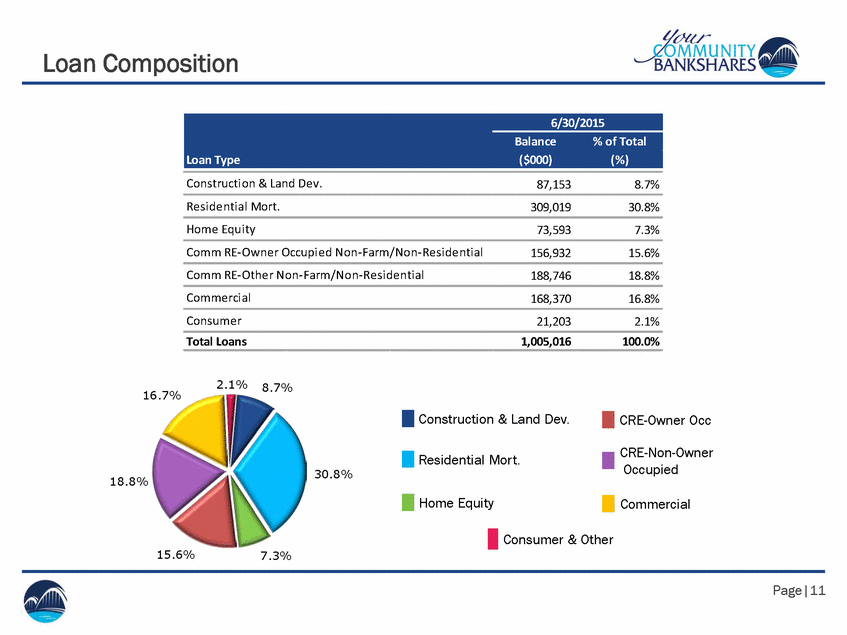
Occupied 30.8% 18.8% Loan Composition Construction & Land Dev. 87,153 8.7% Residential Mort. 309,019 30.8% Home Equity 73,593 7.3% Comm RE-Owner Occupied Non-Farm/Non-Residential 156,932 15.6% Comm RE-Other Non-Farm/Non-Residential 188,746 18.8% Commercial 168,370 16.8% Consumer 21,203 2.1% Total Loans 1,005,016 100.0% 16.7%2.1%8.7% Construction & Land Dev.CRE-Owner Occ Residential Mort.CRE-Non-Owner Home EquityCommercial Consumer & Other 15.6%7.3% Page|11 Loan Type 6/30/2015 Balance % of Total ($000) (%) |
|
|
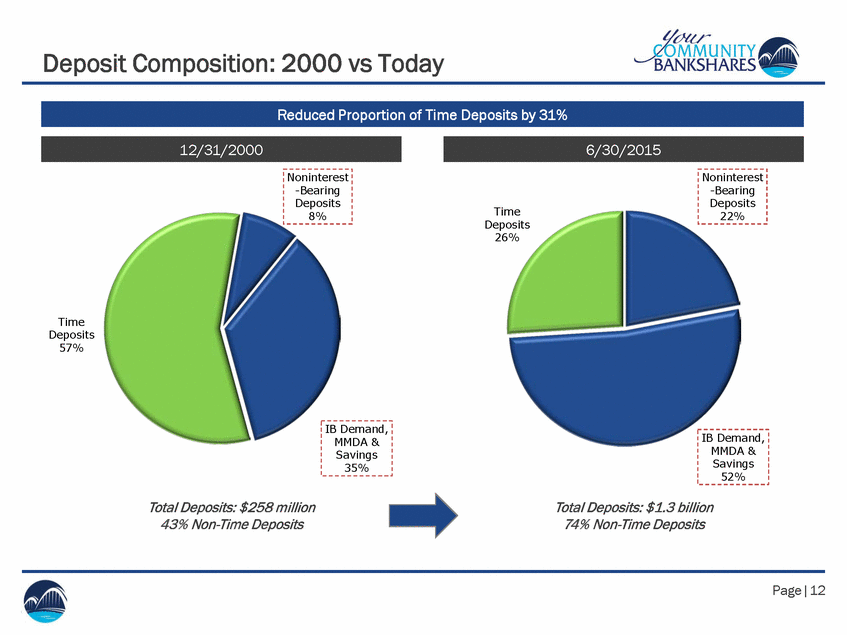
Deposits Deposit Composition: 2000 vs Today Time 26% Time Deposits 57% MMDA & 52% Total Deposits: $258 millionTotal Deposits: $1.3 billion 43% Non-Time Deposits74% Non-Time Deposits Page|12 IB Demand, Savings IB Demand, MMDA & Savings 35% Noninterest -Bearing Deposits 8% Noninterest -Bearing Deposits 22% 6/30/2015 12/31/2000 Reduced Proportion of Time Deposits by 31% |
|
|
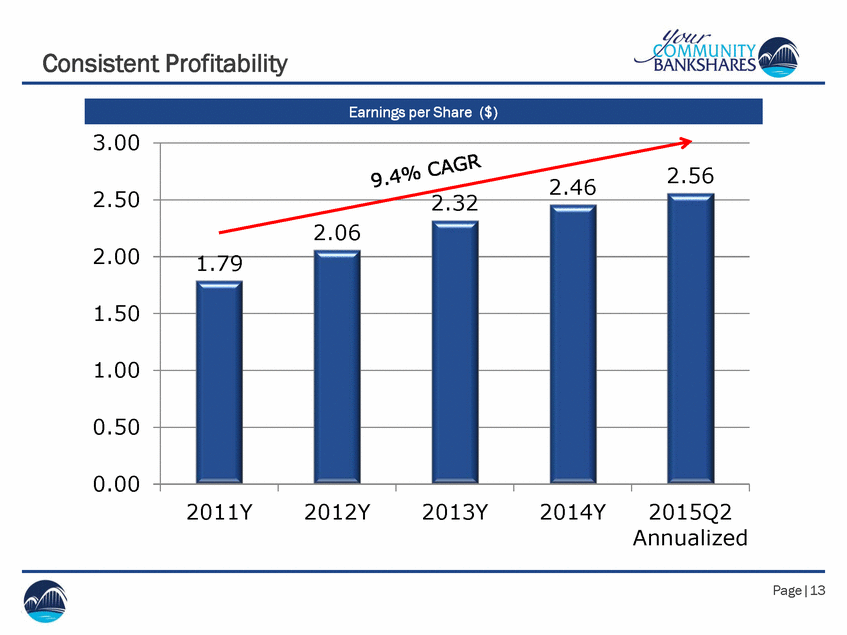
Consistent Profitability 3.00 2.50 2.00 1.50 1.00 0.50 0.00 2011Y2012Y2013Y2014Y2015Q2 Annualized Page|13 2.462.56 2.32 2.06 1.79 Earnings per Share ($) |
|
|
Improving Credit Quality Metrics 4.00 3.50 3.00 2.50 2.001.84 1.50 1.00 0.50 0.00 2012Y2013Y2014Y2015Q12015Q2 NPAs Excluding TDRsNPAs Including TDRs Page|14 3.48 2.82 2.56 2.222.132.24 1.63 1.351.30 Non-Performing Assets as % of Total Assets |
|
|
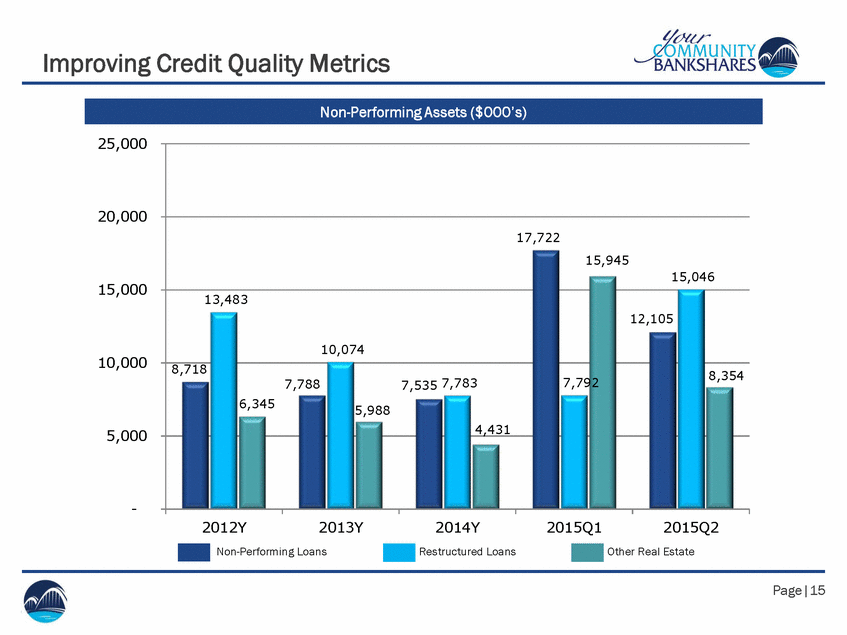
7,535 7,783 7,792 7,788 Improving Credit Quality Metrics 25,000 20,000 15,000 10,000 5,000 - 2012Y2013Y2014Y2015Q12015Q2 Non-Performing LoansRestructured LoansOther Real Estate Page|15 17,722 15,945 15,046 13,483 12,105 10,074 8,7188,354 6,3455,988 4,431 Non-Performing Assets ($000’s) |
|
|
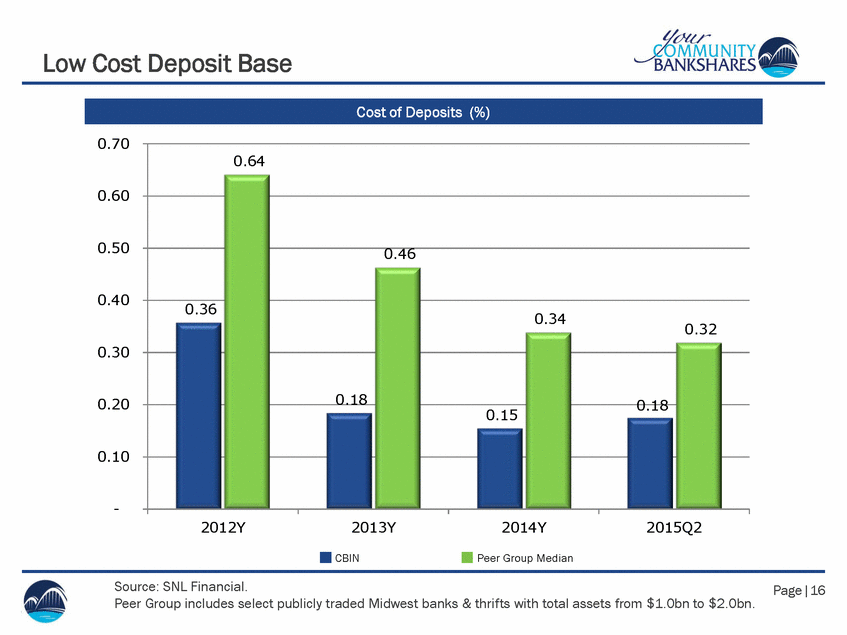
0.34 Peer Group includes select publicly traded Midwest banks & thrifts with total assets from $1.0bn to $2.0bn. Low Cost Deposit Base 0.70 0.60 0.50 0.40 0.30 0.200.180.18 0.10 - 2012Y2013Y2014Y2015Q2 CBINPeer Group Median Source: SNL Financial. Page|16 0.64 0.46 0.36 0.32 0.15 Cost of Deposits (%) |
|
|
3.47 3.47 3.46 Peer Group includes select publicly traded Midwest banks & thrifts with total assets from $1.0bn to $2.0bn. Strong Net Interest Margin 4.40 4.24 4.20 4.00 3.80 3.60 3.40 3.20 3.00 2012Y2013Y2014Y2015Q2 CBINPeer Group Median Source: SNL Financial. Page|17 4.29 4.09 4.03 3.52 Net Interest Margin (%) |
|
|
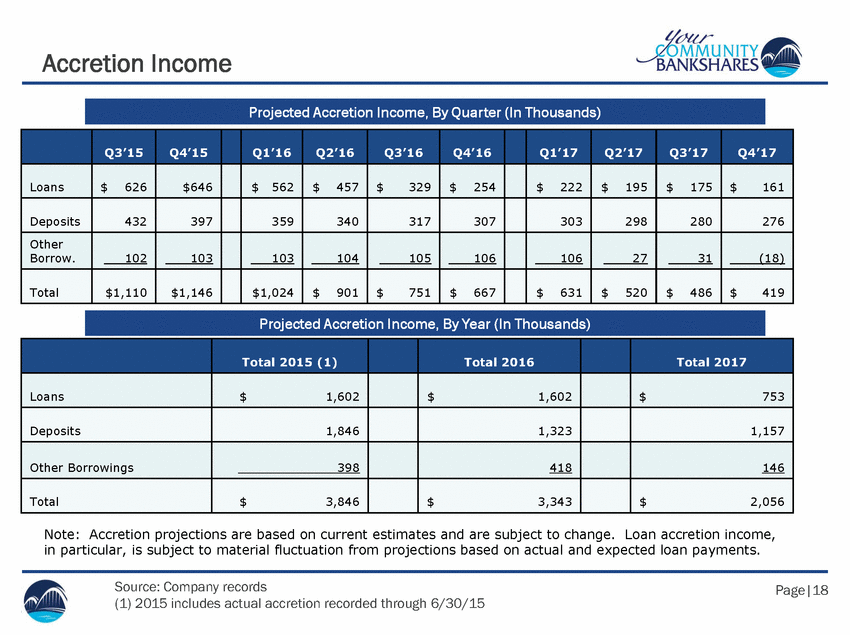
(1) 2015 includes actual accretion recorded through 6/30/15 Accretion Income Q3’15 Q4’15 Q1’16 Q2’16 Q3’16 Q4’16 Q1’17 Q2’17 Q3’17 Q4’17 Loans $626 $646 $562 $457 $329 $254 $222 $195 $175 $161 Deposits 432 397 359 340 317 307 303 298 280 276 Other Borrow. 102 103 103 104 105 106 106 27 31 (18) Total $1,110 $1,146 $1,024 $901 $751 $667 $631 $520 $486 $419 Projected Accretion Income, By Year (In Thousands) Total 2015 (1) Total 2016 Total 2017 Loans $1,602 $1,602 $753 Deposits 1,846 1,323 1,157 Other Borrowings 398 418 146 Total $3,846 $3,343 $2,056 Note: Accretion projections are based on current estimates and are subject to change. Loan accretion income, in particular, is subject to material fluctuation from projections based on actual and expected loan payments. Source: Company records Page|18 Projected Accretion Income, By Quarter (In Thousands) |
|
|
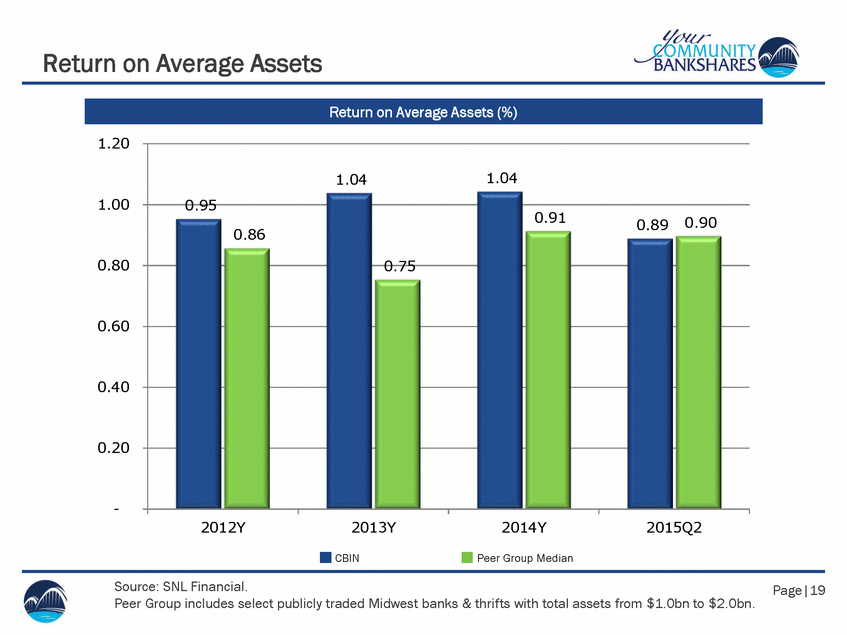
Peer Group includes select publicly traded Midwest banks & thrifts with total assets from $1.0bn to $2.0bn. Return on Average Assets 1.20 1.000.95 0.86 0.800.75 0.60 0.40 0.20 - 2012Y2013Y2014Y2015Q2 CBINPeer Group Median Source: SNL Financial. Page|19 1.041.04 0.910.890.90 Return on Average Assets (%) |
|
|
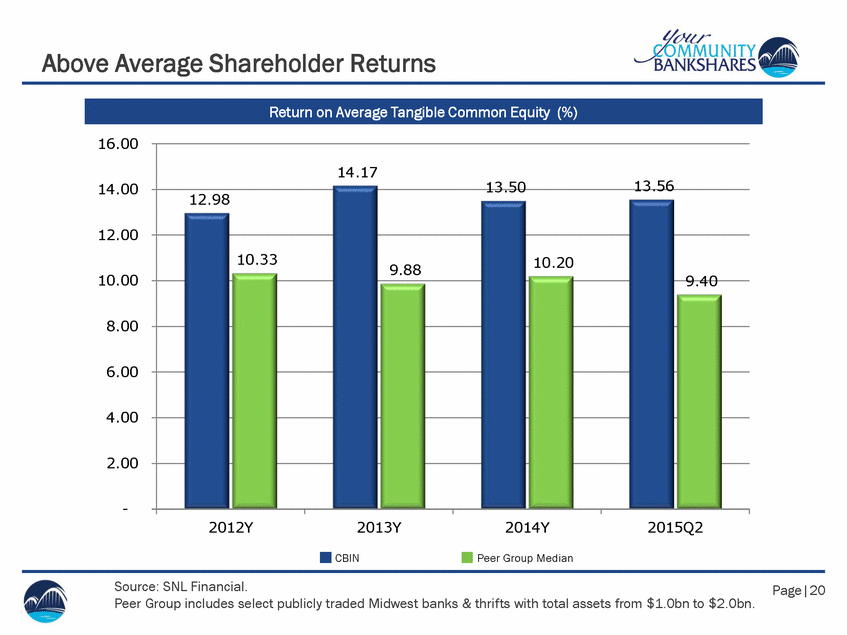
10.00 9.40 Peer Group includes select publicly traded Midwest banks & thrifts with total assets from $1.0bn to $2.0bn. Above Average Shareholder Returns 16.00 14.0013.5013.56 12.00 9.8810.20 8.00 6.00 4.00 2.00 - 2012Y2013Y2014Y2015Q2 CBINPeer Group Median Source: SNL Financial. Page|20 14.17 12.98 10.33 Return on Average Tangible Common Equity (%) |
|
|
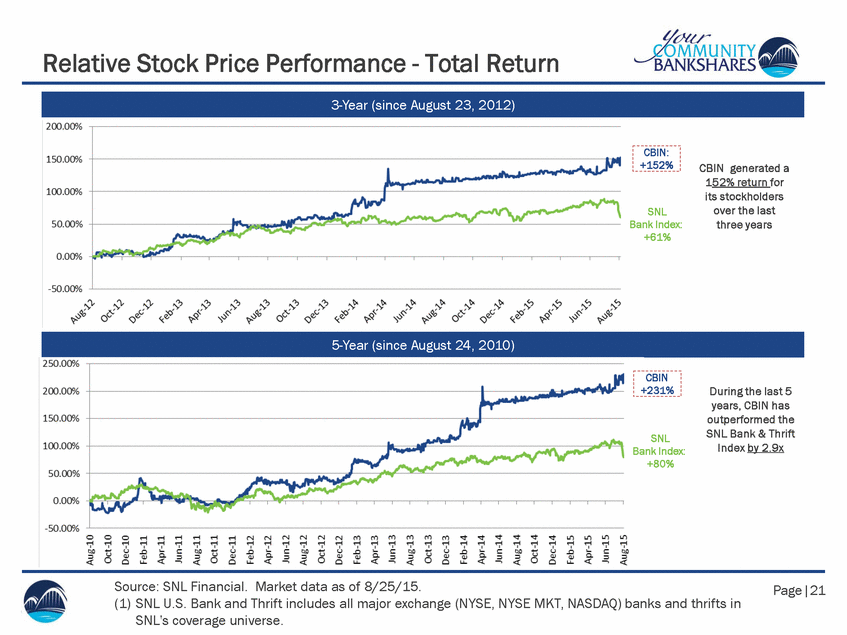
Index by 2.9x Bank Index: (1) SNL U.S. Bank and Thrift includes all major exchange (NYSE, NYSE MKT, NASDAQ) banks and thrifts in Relative Stock Price Performance - Total Return CBIN generated a 152% return for its stockholders SNLover the last Bank Index:three years +61% During the last 5 years, CBIN has outperformed the SNLSNL Bank & Thrift +80% Source: SNL Financial. Market data as of 8/25/15. Page|21 SNL's coverage universe. CBIN +231% 5-Year (since August 24, 2010) CBIN: +152% 3-Year (since August 23, 2012) |
|
|
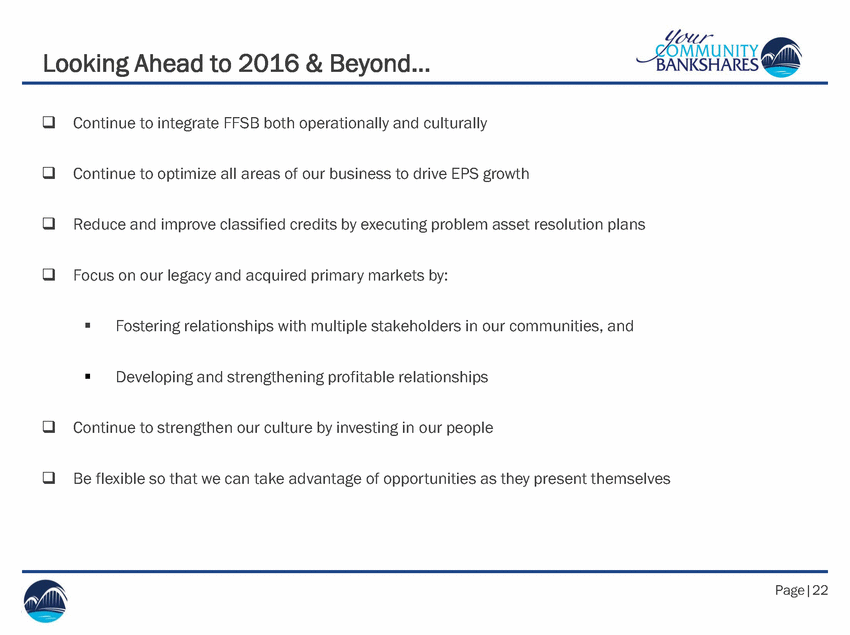
Looking Ahead to 2016 & Beyond… Continue to integrate FFSB both operationally and culturally Continue to optimize all areas of our business to drive EPS growth Reduce and improve classified credits by executing problem asset resolution plans Focus on our legacy and acquired primary markets by: Fostering relationships with multiple stakeholders in our communities, and Developing and strengthening profitable relationships Continue to strengthen our culture by investing in our people Be flexible so that we can take advantage of opportunities as they present themselves Page|22 |
|
|
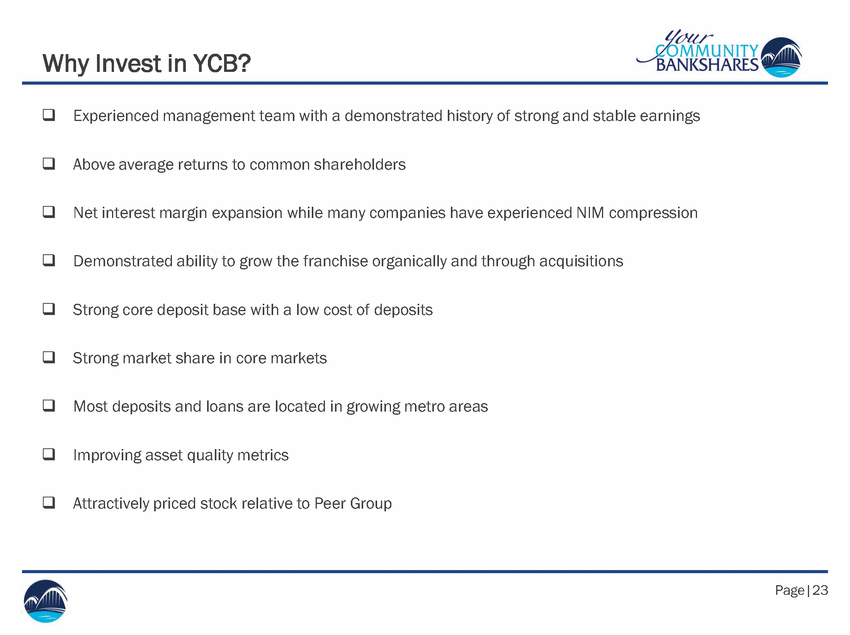
Why Invest in YCB? Experienced management team with a demonstrated history of strong and stable earnings Above average returns to common shareholders Net interest margin expansion while many companies have experienced NIM compression Demonstrated ability to grow the franchise organically and through acquisitions Strong core deposit base with a low cost of deposits Strong market share in core markets Most deposits and loans are located in growing metro areas Improving asset quality metrics Attractively priced stock relative to Peer Group Page|23 |
|
|
Page|24 Thank you. Any Questions? |
|
|
Page|25 Appendix |
|
|
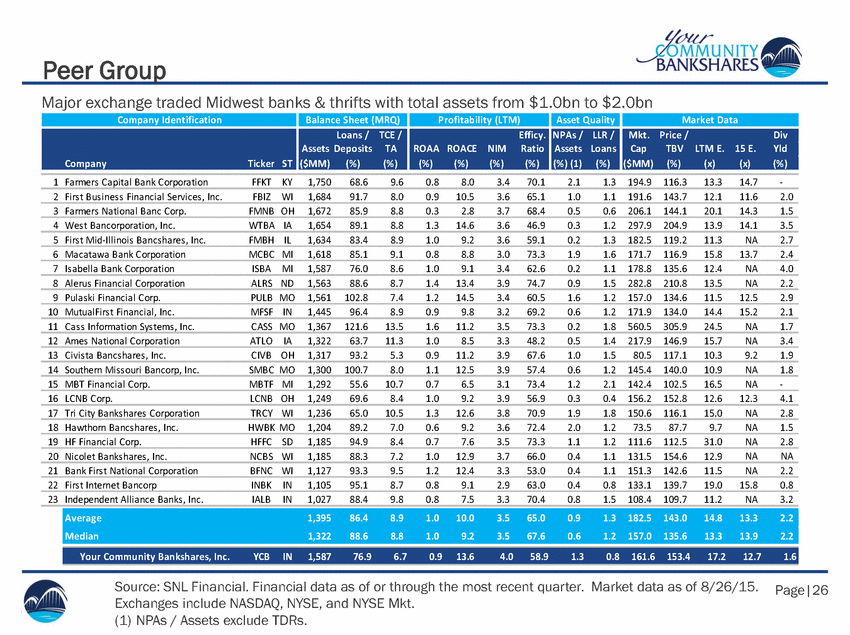
Exchanges include NASDAQ, NYSE, and NYSE Mkt. Peer Group Major exchange traded Midwest banks & thrifts with total assets from $1.0bn to $2.0bn 1 Farmers Capital Bank CorporationFFKT KY1,75068.69.60.88.03.470.12.11.3 194.9 116.313.314.7-2 First Business Financial Services, Inc.FBIZ WI1,68491.78.00.910.53.665.11.01.1 191.6 143.712.111.62.0 3 Farmers National Banc Corp.FMNB OH1,67285.98.80.32.83.768.40.50.6 206.1 144.120.114.31.5 4 West Bancorporation, Inc.WTBA IA1,65489.18.81.314.63.646.90.31.2 297.9 204.913.914.13.5 5 First Mid-Illinois Bancshares, Inc.FMBH IL1,63483.48.91.09.23.659.10.21.3 182.5 119.211.3NA2.7 6 Macatawa Bank CorporationMCBC MI1,61885.19.10.88.83.073.31.91.6 171.7 116.915.813.72.4 7 Isabella Bank CorporationISBA MI1,58776.08.61.09.13.462.60.21.1 178.8 135.612.4NA4.0 8 Alerus Financial CorporationALRS ND1,56388.68.71.413.43.974.70.91.5 282.8 210.813.5NA2.2 9 Pulaski Financial Corp.PULB MO1,561102.87.41.214.53.460.51.61.2 157.0 134.611.512.52.9 10 MutualFirst Financial, Inc.MFSF IN1,44596.48.90.99.83.269.20.61.2 171.9 134.014.415.22.1 11 Cass Information Systems, Inc.CASS MO1,367121.613.51.611.23.573.30.21.8 560.5 305.924.5NA1.7 12 Ames National CorporationATLO IA1,32263.711.31.08.53.348.20.51.4 217.9 146.915.7NA3.4 13 Civista Bancshares, Inc.CIVB OH1,31793.25.30.911.23.967.61.01.580.5 117.110.39.21.9 14 Southern Missouri Bancorp, Inc.SMBC MO1,300100.78.01.112.53.957.40.61.2 145.4 140.010.9NA1.8 15 MBT Financial Corp.MBTF MI1,29255.610.70.76.53.173.41.22.1 142.4 102.516.5NA-16 LCNB Corp.LCNB OH1,24969.68.41.09.23.956.90.30.4 156.2 152.812.612.34.1 17 Tri City Bankshares CorporationTRCY WI1,23665.010.51.312.63.870.91.91.8 150.6 116.115.0NA2.8 18 Hawthorn Bancshares, Inc.HWBK MO1,20489.27.00.69.23.672.42.01.273.587.79.7NA1.5 19 HF Financial Corp.HFFC SD1,18594.98.40.77.63.573.31.11.2 111.6 112.531.0NA2.8 20 Nicolet Bankshares, Inc.NCBS WI1,18588.37.21.012.93.766.00.41.1 131.5 154.612.9NANA 21 Bank First National CorporationBFNC WI1,12793.39.51.212.43.353.00.41.1 151.3 142.611.5NA2.2 22 First Internet BancorpINBK IN1,10595.18.70.89.12.963.00.40.8 133.1 139.719.015.80.8 23 Independent Alliance Banks, Inc.IALBIN1,02788.49.80.87.53.370.40.81.5 108.4 109.711.2NA3.2 Source: SNL Financial. Financial data as of or through the most recent quarter. Market data as of 8/26/15. Page|26 (1) NPAs / Assets exclude TDRs. Average1,39586.48.91.010.03.565.00.91.3 182.5 143.014.813.32.2 Median1,32288.68.81.09.23.567.60.61.2 157.0 135.613.313.92.2 Your Community Bankshares, Inc.YCBIN1,58776.96.70.913.64.058.91.30.8 161.6 153.417.212.71.6 Company Identification Balance Sheet (MRQ) Profitability (LTM) Asset Quality Market Data CompanyTicker ST Loans / TCE / Assets DepositsTA ($MM)(%)(%) Efficy. ROAA ROACE NIM Ratio (%) (%) (%) (%) NPAs / LLR / Assets Loans (%) (1) (%) Mkt. Price / Div CapTBV LTM E. 15 E.Yld ($MM) (%)(x)(x) (%) |

