Attached files
| file | filename |
|---|---|
| 8-K - TRONOX LTD 8-K 9-9-2015 - Tronox Holdings plc | form8k.htm |
Exhibit 99.1

Tom Casey, Chairman and CEOTronox LimitedUBS Global Chemicals ConferenceSeptember 9, 2015 www.tronox.com

Safe Harbor Statement Statements in this release that are not historical are forward-looking statements within the meaning of the safe harbor provisions of the U.S. Private Securities Litigation Reform Act of 1995. These forward-looking statements, which are subject to known and unknown risks, uncertainties and assumptions about us, may include projections of our future financial performance based on our growth strategies and anticipated trends in our business. These statements are only predictions based on our current expectations and projections about future events. There are important factors that could cause our actual results, level of activity, performance or achievements to differ materially from the results, level of activity, performance or achievements expressed or implied by the forward-looking statements. These and other risk factors are discussed in the company's filings with the Securities and Exchange Commission (SEC), including those under the heading entitled “Risk Factors" in our Annual Report on Form 10-K for the year ended December 31, 2014. Moreover, we operate in a very competitive and rapidly changing environment. New risks and uncertainties emerge from time to time, and it is not possible for our management to predict all risks and uncertainties, nor can management assess the impact of all factors on our business or the extent to which any factor, or combination of factors, may cause actual results to differ materially from those contained in any forward-looking statements. Although we believe the expectations reflected in the forward-looking statements are reasonable, we cannot guarantee future results, level of activity, performance or achievements. Moreover, neither we nor any other person assumes responsibility for the accuracy or completeness of any of these forward-looking statements. You should not rely upon forward-looking statements as predictions of future events. Unless otherwise required by applicable laws, we undertake no obligation to update or revise any forward-looking statements, whether as a result of new information or future developments. 2

Tronox TiO2 – $600 million Incremental Cash Flow over 2015-2017 by Reducing Operating Costs and Working Capital Tronox suspended production at 1 of 6 processing lines at our Hamilton pigment plant and 1 of 4 processing lines at our Kwinana pigment plant; curtailments represent ~15% of total pigment production; have also shut down one slag smelter at our KZN Sands operations which has reduced our slag production capacity by ~12%Positive FCF expected in 2016 after capital expenditures, interest expense and dividend payments Cash generating strength of our operating businessesCash sourced from reductions in operating costs, working capital and capital expendituresCash surplus focused on deleveraging and providing for future growth of the company 3 TiO2 Cash Flow Improvement Compared to First Half 2015 Run Rate 2015 2016 2017 Source of Savings P&L Impact after Costs to Execute 60 110 175 Global supply chain savings; low cost country sourcing; restructuring, ~500 operational excellence Kaizen projects; technology driven efficiency and debottlenecking projects Working Capital Reduction 100 130 5 Significant inventory reduction; sale of high quality TiO2 feedstock inventory to non-pigment company to produce $35-37m cash over next 6 quarters Partial Closure of Cooljarloo Mine 20 Partial closure of Cooljarloo mine in Australia planned by end of 2015 Cash Flow 160 260 180 Cumulative Cash Flow 160 420 600

4 Integrated TiO2 Value Chain Titanium-Bearing Mineral Sands Zircon Ilmenite Synthetic Rutile TitaniumSlag Pig Iron Natural Rutile Leucoxene Feedstock TiO2 Pigments Markets

Tronox Alkali Tronox Alkali world’s largest producer of natural soda ash used by customers in the glass, detergent and chemical mfg.Cash costs for US natural producer of soda ash ~35% less than lowest cost synthetic producerEnables U.S. natural soda ash producers to have sustainable competitive advantage on a delivered basis in Asia ex-China, Latin America and many other attractive markets in the world; also economically lessens threat of imports into United StatesCurrent annual EBITDA rate in $175-$200m range; accretive to earnings and free cash flow in 2Q15, its first quarter within TronoxTronox Limited is now a stronger company with:Greater scale and more stable revenue, cash flow and EBITDAHigher net income and free cash flowHigher U.S. income enabling accelerated use of our tax attributesMore diversified end-market exposure and greater participation in faster growing economies 5 Adj. EBITDA(1) ($MM) FMC Corporation basisFCF = Adj. EBITDA - Capex

In first full year following closing, expected to:be more than $0.50 accretive to EPSgenerate ~$130 million incremental operating cash flow; andrealize $30 million after-tax cash savings in year 1; $60 million after-tax cash savings in year 3Essentially 100% of Alkali Chemicals’ revenue is booked in the U.S., enabling us to utilize our U.S. tax attributes to offset Alkali Chemicals’ pre-tax income raising net income and cash flow Alkali Chemicals - Accretion and Cost Savings 6 Year 1$30 million Year 3$60 million Global Supply ChainTransportation - rail, trucking and oceanDistribution efficienciesProcurement - energy, chemicals, packaging, contractor services and MRO Tax SavingsTotal value > $300 million90% of Year 1 savings55% Year 3 savings
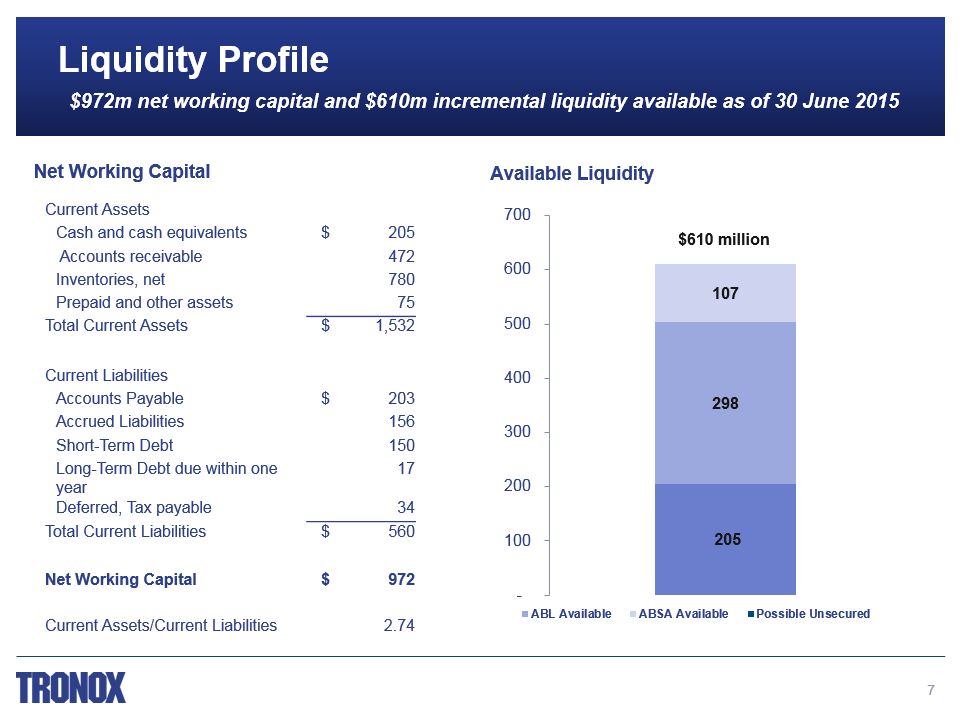
Liquidity Profile 7 $972m net working capital and $610m incremental liquidity available as of 30 June 2015 Available Liquidity Net Working Capital Current Assets Cash and cash equivalents $ 205 Accounts receivable 472 Inventories, net 780 Prepaid and other assets 75 Total Current Assets $ 1,532 Current Liabilities Accounts Payable $ 203 Accrued Liabilities 156 Short-Term Debt 150 Long-Term Debt due within one year 17 Deferred, Tax payable 34 Total Current Liabilities $ 560 Net Working Capital $ 972 Current Assets/Current Liabilities 2.74

Debt Maturities and Financial Maintenance Covenants No meaningful maturities until 2020; annual 1% payment on term loanNo financial maintenance covenants on term loan or high yield notes48% of total indebtedness set at a fixed rate Maturity Rate 2Q15 $500M ABL Revolver 2020 L+1.50% 150 1.3B ZAR ABSA Revolver 2017 J+3.90% - Term Loan 2020 L(1%)+3.25% 1,468 6.375% High Yield Notes 2020 6.38% 900 7.5% High Yield Notes 2022 7.50% 600 Tiwest Cogen 2016 6.50% 2 SA Lease Various 14.39% 21 Total Indebtedness 3,141 1 Excludes unamortized discount 8

Tronox Strategic Focus Tronox has transitioned to stronger model with the operation of two vertically integrated businesses2015 a transitional year for TiO2 -- continued challenges in the global market, however, industry appears to be responding to changes in global demand caused by slowing of Chinese economyProduction facilities for pigment and feedstocks being shut down / others reducing production levels; inventories being reduced upstream / downstream; should accelerate turn to improved supply-demand balanceIncreasing cash generation of TiO2 and Alkali; focused on deleveraging, dividend payment and providing for future growth of the company Tronox today has multiple components to our value proposition:Turn in the TiO2 market -- plus leverage to upturn through positions both upstream and downstreamStability and cash generation of our Alkali businessIncreasing cash generation through reductions in operating costs, working capital and capital expenditures$9.8 billion portfolio of tax attributesRegular quarterly dividend currently yielding 14%View ourselves as a consolidator in the TiO2 market and continue to evaluate opportunities 12th straight quarter, Board declared quarterly dividend of $0.25 per share; currently yielding > 4%

www.tronox.com