Attached files
| file | filename |
|---|---|
| 8-K - Spectrum Brands Legacy, Inc. | sbhi_8k0909.htm |
Exhibit 99.1

Presentation to Hardware &Home Improvement Global Batteries & Appliances Pet, Home& Garden GlobalAuto Care Barclays Global Consumer Staples ConferenceBoston – September 9, 2015 Dave Prichard Vice President, Investor Relations Doug Martin EVP & Chief Financial Officer

Forward-Looking Statements * Certain matters discussed in this presentation, with the exception of historical matters, may be forward-looking statements within the meaning of the Private Securities Litigation Reform Act of 1995. All statements, other than statements of historical facts, regarding our business strategy, future operations, financial condition, estimated revenues, projected costs, projected synergies, prospects, plans and objectives of management, as well as information concerning expected actions of third parties, are forward-looking statements. These statements are subject to a number of risks and uncertainties that could cause results to differ materially from those anticipated as of the date of this presentation. Important factors that could cause our actual results to differ materially from those expressed or implied herein include, without limitation: our ability to manage and otherwise comply with our covenants with respect to our significant outstanding indebtedness or maintain our credit ratings; changes and developments in external competitive market factors, such as introduction of new product features or technological developments; development of new competitors or competitive brands or competitive promotional activity or spending or industry consolidation; the cost and effect of unanticipated legal, tax or regulatory proceedings or new accounting policies, laws or regulations (including environmental, public health and consumer protection regulations); seasonality of our products and changes in consumer demand for the various types of products we offer resulting in the loss of, or a significant reduction in, sales to significant retail customers; our ability to develop and successfully introduce new products, protect our intellectual property and avoid infringing the intellectual property of third parties; public perception regarding the safety of our products, including the potential for environmental liabilities, product liability claims, litigation and other claims; unfavorable developments in the global credit markets; the impact of overall economic conditions, terrorist attacks, acts of war or other unrest in international markets on consumer spending; fluctuations in commodities prices, supply shortages, the costs or availability of raw materials or terms and conditions available from suppliers; changes in the general economic conditions in countries and regions where we do business, such as stock market prices, interest rates, currency exchange rates, inflation and consumer spending; our ability to successfully implement manufacturing, distribution and other cost efficiencies and to continue to benefit from our cost-cutting initiatives; the impact of expenses resulting from the implementation of new business strategies, divestitures or restructuring activities; our ability to integrate, and to realize synergies from, the combined businesses of Spectrum Brands, Inc. and Russell Hobbs, Inc.; our ability to identify, develop and retain key employees; unfavorable weather conditions or climate change and various other risks and uncertainties, including those discussed herein and those set forth in our filings with the Securities and Exchange Commission (“SEC”).We also caution the reader that undue reliance should not be placed on any forward-looking statements, which speak only as of the date of this presentation. We undertake no duty or responsibility to update any of these forward-looking statements to reflect events or circumstances after the date of this presentation or to reflect actual outcomes. Additional factors that may affect future results and conditions are described in our filings with the SEC, which are available at the SEC’s web site at www.sec.gov or at Spectrum Brands’ website at www.spectrumbrands.com.The information contained in this presentation is summary information that is intended to be considered in the context of our SEC filings, and other public announcements that we may make, by press release or otherwise, from time to time. In addition, information related to past performance, while helpful as an evaluative tool, is not necessarily indicative of future results, the achievement of which cannot be assured. You should not view our past performance, or information about the market, as indicative of our future results. Further, performance information respecting investment returns on portfolio transactions is not directly equivalent to returns on an investment in our common stock.

Reconciliation of Non-GAAP Financial Measurements * Management believes that certain non-GAAP financial measures may be useful in certain instances to provide additional meaningful comparisons between current results and results in prior operating periods. Excluding the impact of current exchange rate fluctuations may provide additional meaningful reflection of underlying business trends. In addition, within this presentation, including the tables that follow, reference is made to adjusted earnings before interest, taxes, depreciation and amortization (EBITDA), free cash flow and adjusted gross profit. Adjusted EBITDA is a metric used by management and frequently used by the financial community which provides insight into an organization’s operating trends and facilitates comparisons between peer companies, because interest, taxes, depreciation and amortization can differ greatly between organizations as a result of differing capital structures and tax strategies. Adjusted EBITDA can also be a useful measure of a company’s ability to service debt and is one of the measures used for determining the Company’s debt covenant compliance. Adjusted EBITDA excludes certain items that are unusual in nature or not comparable from period to period. In addition, the Spectrum Brands’ management uses adjusted gross profit as one means of analyzing the Spectrum Brands’ current and future financial performance and identifying trends in its financial condition and results of operations. Management believes that adjusted gross profit is a useful measure for providing further insight into Spectrum Brands’ operating performance because it eliminates the effects of certain items that are not comparable from one period to the next. Also, management believes that free cash flow is useful to both management and investors in their analysis of Spectrum Brands’ ability to service and repay its debt and meet its working capital requirements. Free cash flow should not be considered in isolation or as a substitute for pretax income (loss), net income (loss), cash provided by (used in) operating activities or other statement of operations or cash flow statement data prepared in accordance with GAAP or as a measure of profitability or liquidity. In addition, the calculation of free cash flow does not reflect cash used to service debt and therefore, does not reflect funds available for investment or discretionary uses. Spectrum Brands provides this information to investors to assist in comparisons of past, present and future operating results and to assist in highlighting the results of on-going operations. While Spectrum Brands’ management believes that non-GAAP measurements are useful supplemental information, such adjusted results are not intended to replace the Spectrum Brands’ GAAP financial results and should be read in conjunction with those GAAP results.All GAAP reconciliations are available at www.spectrumbrands.com
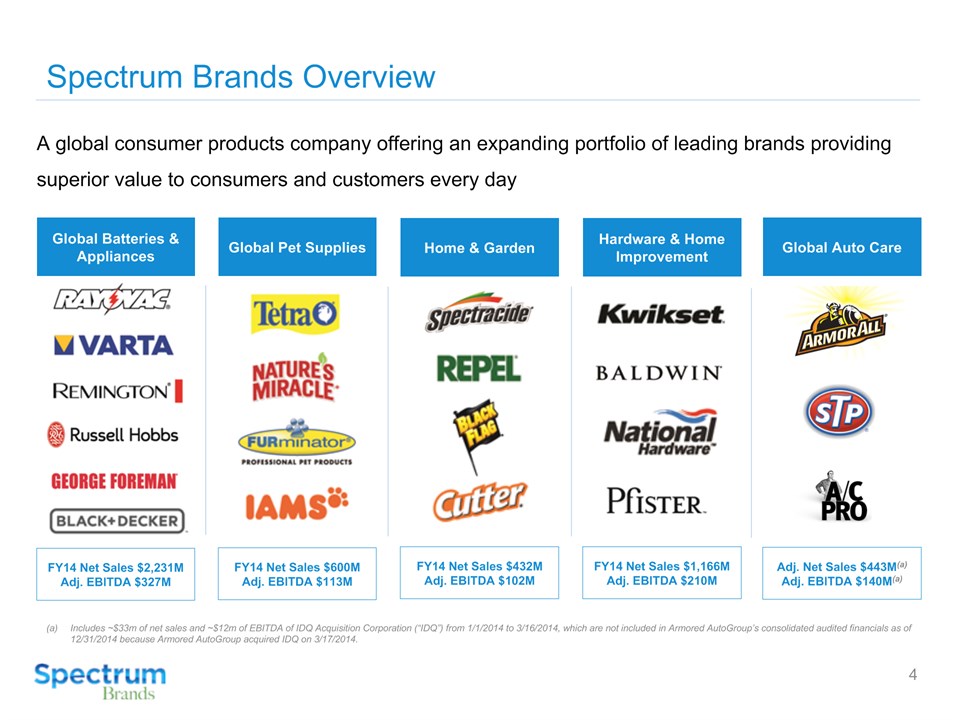
Spectrum Brands Overview A global consumer products company offering an expanding portfolio of leading brands providing superior value to consumers and customers every day Includes ~$33m of net sales and ~$12m of EBITDA of IDQ Acquisition Corporation (“IDQ”) from 1/1/2014 to 3/16/2014, which are not included in Armored AutoGroup’s consolidated audited financials as of 12/31/2014 because Armored AutoGroup acquired IDQ on 3/17/2014. * Global Batteries & Appliances Global Pet Supplies FY14 Net Sales $2,231MAdj. EBITDA $327M FY14 Net Sales $432MAdj. EBITDA $102M FY14 Net Sales $600MAdj. EBITDA $113M FY14 Net Sales $1,166MAdj. EBITDA $210M Adj. Net Sales $443M(a)Adj. EBITDA $140M(a) Home & Garden Hardware & Home Improvement Global Auto Care
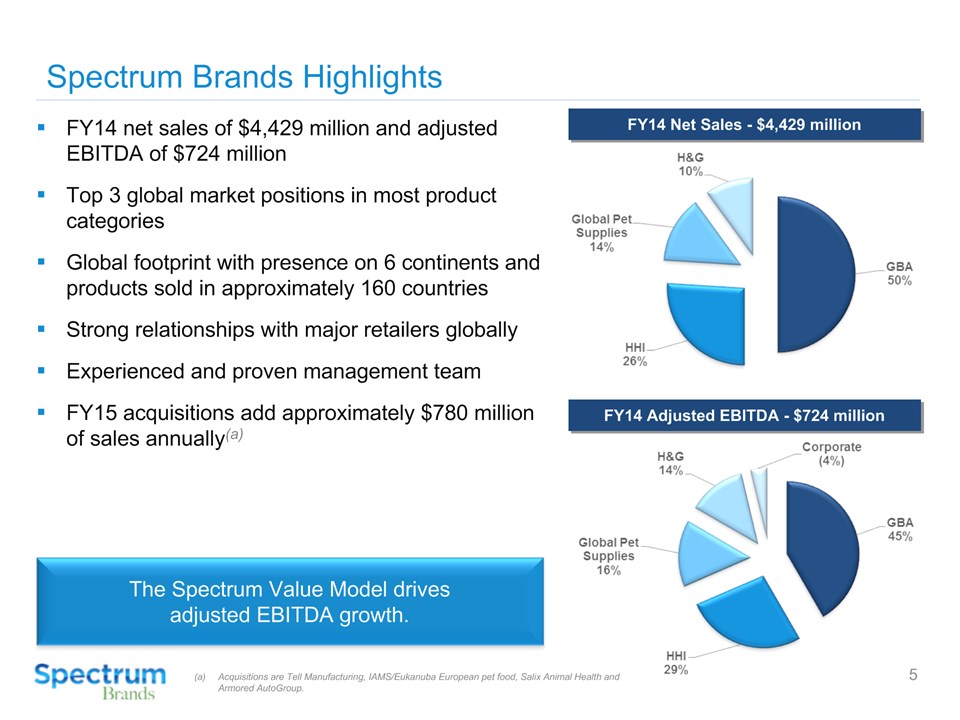
Spectrum Brands Highlights * The Spectrum Value Model drivesadjusted EBITDA growth. FY14 net sales of $4,429 million and adjusted EBITDA of $724 millionTop 3 global market positions in most product categoriesGlobal footprint with presence on 6 continents and products sold in approximately 160 countriesStrong relationships with major retailers globallyExperienced and proven management teamFY15 acquisitions add approximately $780 million of sales annually(a) FY14 Net Sales - $4,429 million FY14 Adjusted EBITDA - $724 million Acquisitions are Tell Manufacturing, IAMS/Eukanuba European pet food, Salix Animal Health and Armored AutoGroup.

Strong Financial Performance Despite a Challenged Consumer * Spectrum Brands has generated robust sales and adjusted EBITDA growthboth organically and through acquisitions. Reflects pro forma as if Russell Hobbs merger completed at beginning of respective period.Reflects pro forma as if HHI acquired at beginning of respective period.The pre-acquisition earnings and capital expenditures of HHI do not include the TLM Taiwan business as stand alone financial data is not available for the periods presented.The TLM Taiwan business is not deemed material to the Company's operating results. (a) (a) (b) (b) ($ in millions) Adjusted EBITDA / Margin Performance
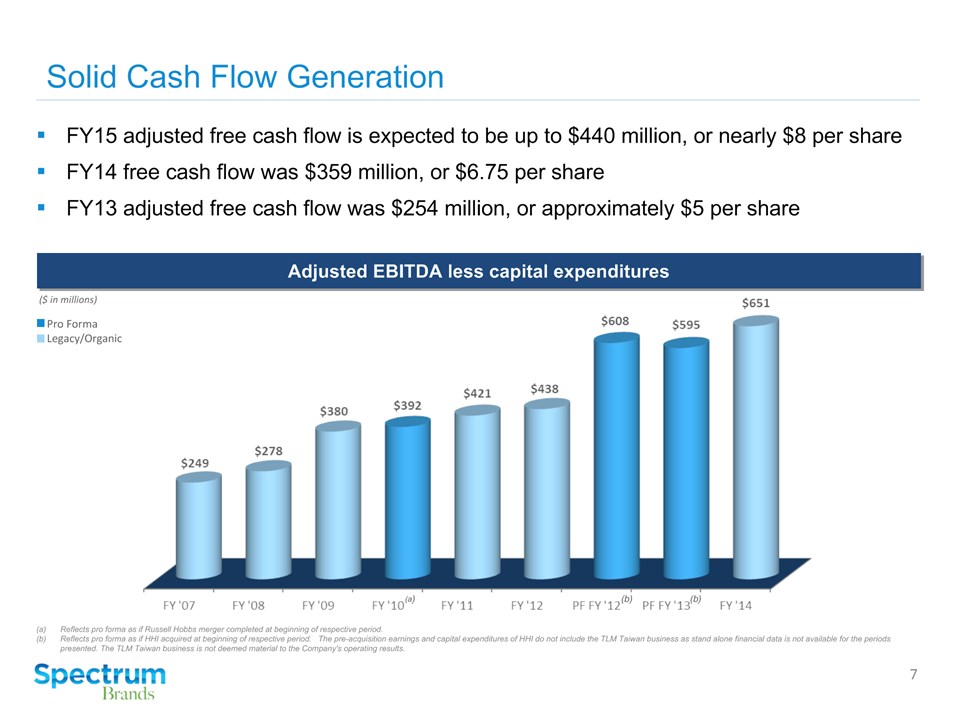
Solid Cash Flow Generation * FY15 adjusted free cash flow is expected to be up to $440 million, or nearly $8 per shareFY14 free cash flow was $359 million, or $6.75 per shareFY13 adjusted free cash flow was $254 million, or approximately $5 per share Reflects pro forma as if Russell Hobbs merger completed at beginning of respective period.Reflects pro forma as if HHI acquired at beginning of respective period. The pre-acquisition earnings and capital expenditures of HHI do not include the TLM Taiwan business as stand alone financial data is not available for the periods presented. The TLM Taiwan business is not deemed material to the Company's operating results.

Strong Cash Flow and Value Creation Flexibility * 2015-2018 Operating Cash Flow = ~$2.0 Billion(a) ($ in billions) Pay down debtAcquisitionsShare repurchasesFurther increase dividends Uncommitted Cash Optionality Excludes Armored AutoGroup acquisition.

FY14 Net Sales by Geographic Region *

Category Estimated Market Position Selected Key Brands Leading Market Share and Strong, Attractive Brands #1 (North America Appearance)#1 (North America Refrigerants)#2 (North America Fuel & Oil Additives) Auto Care Products #3 (North America)#2 (Europe)#1 (Latin America)#2 (North America, Europe, Latin America) Consumer batteriesPortable lighting #3 (North America, Europe)#3 (North America)#2 (Europe) Electrical shaving and groomingElectrical personal care products #1 (U.S. kitchen appliances)#1 (U.S. hand-held irons)#1 (U.K. kitchen/home products) Kitchen & home products #1 (U.S. residential locksets)#1 (Canada locksets)#1 (U.S. luxury locksets) Residential/commercial locksets #2 (Global pet supplies)#1 (Global aquatics) Pet supplies #3 in U.S. retail channel Plumbing & accessories #1 (U.S. animal repellents)#2 (U.S. pest control) Home & garden control products #1 (U.S. builders hardware)#2 (Mexico hardware) Builders hardware *

Spectrum Value ModelPlatform For Lasting Customer Relations * VISION …superior value consumer products for everyday use Be the leader in retailer metrics with… Superior Value INNOVATIONfromGlobal Operations SALES GROWTHwithRegional Sales EFFICIENCYfromShared Services
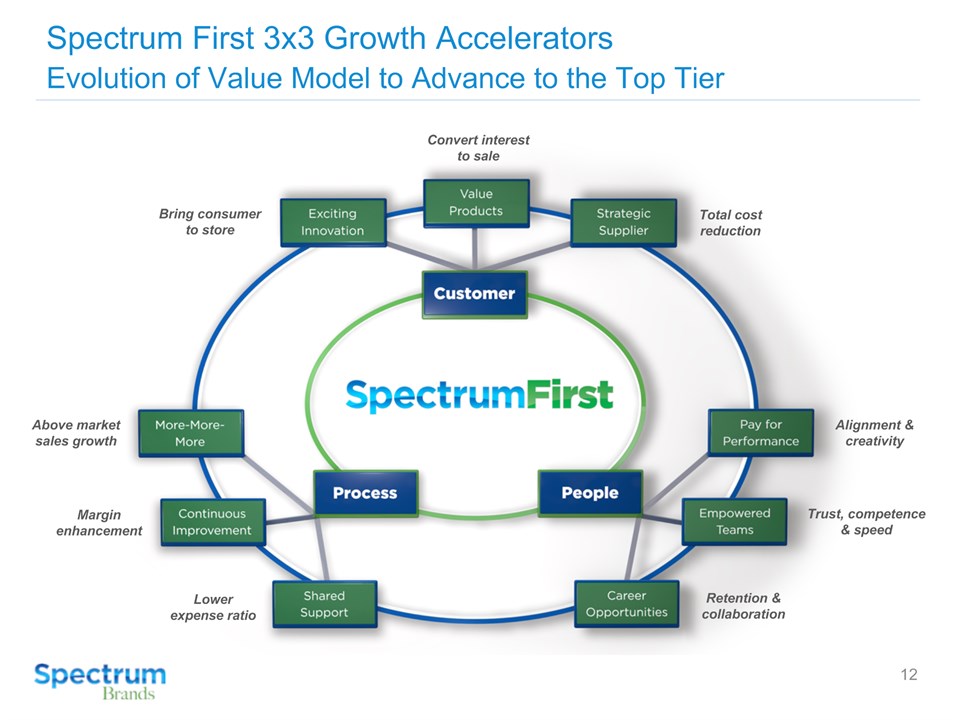
Spectrum First 3x3 Growth AcceleratorsEvolution of Value Model to Advance to the Top Tier * Alignment & creativity Retention & collaboration Trust, competence & speed Above market sales growth Lower expense ratio Margin enhancement Total cost reduction Bring consumer to store Convert interest to sale

Supporting Long-term Growth ThroughSynergistic Bolt-on Acquisitions Spectrum Brands continually evaluates synergistic, bolt-on acquisitions to expandits product lines, extend market penetration and grow its geographic footprint. * KEY ACQUISITION PRIORITIES Global Pet Supplies Home & Garden Hardware &Home Improvement Global Auto Care

Successful Track Record of Acquisition Integration/Delevering * Strong free cash flow used to manage capital structure and drive valueProven integrator – Russell Hobbs, HHI, FURminator, Black Flag/TAT, Tong Lung, Liquid Fence, Tell, Salix, IAMS/Eukanuba Reflects pro forma as if Russell Hobbs merger completed at beginning of respective period. Reflects pro forma as if HHI acquired at the beginning of respective period. Reflects pro forma as if AAG acquired at the beginning of respective period. Fiscal Year-end Total Leverage (a) (b) (c)

* Pro Forma Adjusted EBITDA Performance ($ in millions) Global Auto Care Market-leading auto care brands, including Armor All, STP and A/C PROArmor All and STP enjoy 32% and 19% unaided brand awareness while A/C PRO holds 73% market share in the North America DIY refrigerant categoryHistory of innovation and industry leadership Unmatched shelf space in auto retailers Net Sales by Brand / Category (2014) Global Net Sales by Geography (FY14) Acquired in May 2015

Transaction Rationale Key Brands and Products Substantially increases Spectrum Brands’ scale and product diversification with new category of DIY auto care Adds a portfolio of market-leading brands to Spectrum Brands’ existing, attractive lineupImproves customer mix with unmatched shelf space in complementary channelsOffers substantial international growth potentialEnhances Spectrum Brands’ margins and already robust free cash flow profile Revenue by US Channel (2014) *

Substantially Increases Spectrum Brands’ Margin and Product Diversification * ($ in millions) LTM Q2 2015 Net Sales LTM Q2 2015 Adj. EBITDA +9.5% +18.7% Financial Scale – LTM Q2 2015(a)(b) Product Diversification by Net Sales Pre-transaction Post-transaction Standalone SPB performance pro forma for Tell Manufacturing, IAMS, and Salix acquisitions.Does not include synergies and represents FY14 Armored AutoGroup adjusted performance. Source: Company information, public filings

Global Shared Services, ERP and Centers of Excellence * Cost &Efficiency Commercial /CustomerFocus

Fiscal 2015 Outlook * Planning for 6th consecutive year of record performance Reported sales growth in the mid-single digit rangeContinued cost improvement disciplineFX headwindsAdjusted free cash flow is projected to be up to $440 million

Hardware &Home Improvement Global Batteries & Appliances Pet, Home& Garden GlobalAuto Care NYSE: SPB www.spectrumbrands.cominvestorrelations@spectrumbrands.comdavid.prichard@spectrumbrands.com

Hardware &Home Improvement Global Batteries & Appliances Pet, Home& Garden GlobalAuto Care Appendix

* Long and Successful History of Acquisitions 1999 2002 2003 2004 2010 2011 2012 2015 2014 Initial Public OfferingNOV 1997 Rayovac Reacquires Majority of Latin America Brand (ROV Limited)AUG 1999 AcquisitionJAN 2015 European PetFood AcquisitionDEC 2014 AcquisitionOCT 2014 AcquisitionMAY 2015 2013

Hardware & Home Improvement Overview * Ten consecutive quarters of YOY net sales and adjusted EBITDA increases since December 17, 2012 acquisitionLeading provider of residential locksets, builders hardware and plumbing and accessories Diversified product portfolio with well-recognized brands characterized by outstanding new product innovation and executionLarge installed base – about 900 million locks/66 million householdsLong-standing and highly collaborative relationships with customers across all channels FY14 Net Sales $1,166M; Adj. EBITDA $210M Global Net Sales by Geography (FY14) Net Sales by Segment (FY14) Adjusted EBITDA Performance ($ in millions)
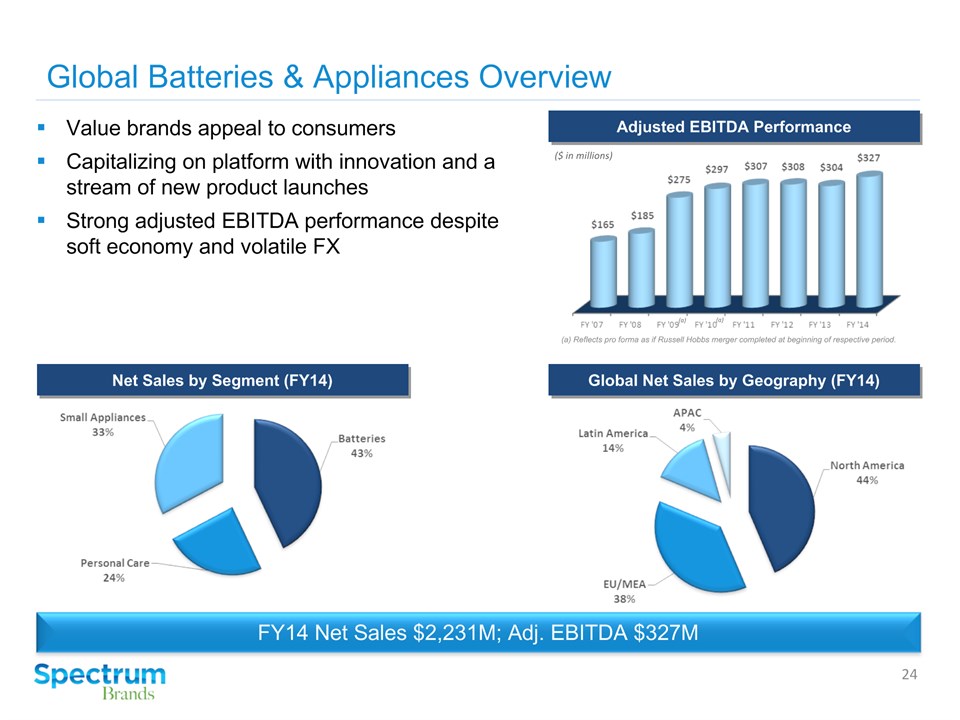
Adjusted EBITDA Performance ($ in millions) Reflects pro forma as if Russell Hobbs merger completed at beginning of respective period. (a) (a) Global Batteries & Appliances Overview * Value brands appeal to consumersCapitalizing on platform with innovation and a stream of new product launchesStrong adjusted EBITDA performance despite soft economy and volatile FX FY14 Net Sales $2,231M; Adj. EBITDA $327M Global Net Sales by Geography (FY14) Net Sales by Segment (FY14)

Global Pet Supplies Overview * FY14 Net Sales $600M; Adj. EBITDA $113M Adjusted EBITDA Performance ($ in millions) Global Net Sales by Geography (FY14) Net Sales by Segment (FY14)

IAMS/Eukanuba and Salix Acquisitions IAMS/Eukanuba European premium pet food brands for dogs and cats acquired on December 31, 2014IAMS: premium brand with broad consumer appeal and leadership share of the premium dry dog food market in the U.K.Eukanuba: premium brand in the pet specialty channel Cross-selling opportunities from our Pet division’s strength in Continental Europe and the strength of the acquired business in the U.K.Modern, highly automated manufacturing plant in the Netherlands and an integrated warehouseSynergies in overhead, SG&A and distribution Salix Animal Health, the world’s leading and largest vertically integrated producer and distributor of premium, natural rawhide dog chews, treats and snacks acquired on January 16, 2015Strengthens, diversifies and expands Pet’s market position in rawhide dog treats, a fast-growing sub-category with estimated annual global retail sales of $2 billionFlagship brands: Healthy-Hide and Digest-eeze Strong patents around flavors and digestibilityFlexible supply chain with manufacturing plants in Brazil, Ecuador, Mexico and Colombia *
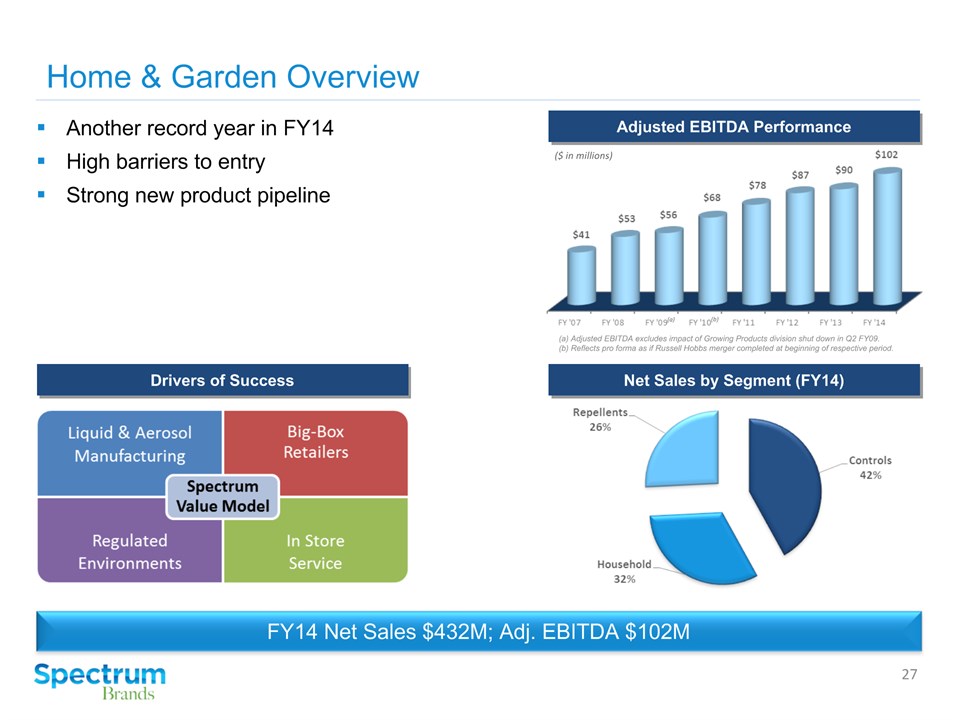
Home & Garden Overview Another record year in FY14High barriers to entryStrong new product pipeline * FY14 Net Sales $432M; Adj. EBITDA $102M Adjusted EBITDA Performance ($ in millions) Net Sales by Segment (FY14) Drivers of Success

Strong #2 Share in the IndustryU.S. Retail Home & Garden Pest Control Market * Source: Home & Garden Management Estimates H&G Change = +2 pts from 2013 to 2014 $3 Billion Retail Category (2014 Estimate) Source: Home & Garden Management Estimates Home & Garden Share Vendor Market Share Estimate

Financial Snapshot * Reflects pro forma as if Russell Hobbs merger completed at beginning of respective period.Reflects pro forma as if HHI acquired at beginning of respective period. The pre-acquisition earnings and capital expenditures of HHI do not include the TLM Taiwan business as stand alone financial data is not available for the periods presented. The TLM Taiwan business is not deemed material to the Company's operating results. Pro forma net sales ($ in millions) (a) (a) (b) (b) Adjusted EBITDA ($ in millions) (a) (a) (b) (b) Capital expenditures ($ in millions) (a) (a) (b) (b) Adjusted EBITDA less capital expenditures ($ in millions) (a) (a) (b) (b) Proven track record of top-line growth and improving profitability.

Reconciliation of Adjusted EBITDA *

Reconciliation of Adjusted EBITDA by Segment * (1) It is the Company’s policy to record income tax expense and interest expense on a consolidated basis. Accordingly, such amounts are not reflected in the operating results of the operating segments.(2) Included within depreciation and amortization is amortization of unearned restricted stock compensation.(3) Included in other are costs associated with onboarding for a key executive.
