Attached files
| file | filename |
|---|---|
| EX-3.4 - EX-3.4 - Pure Storage, Inc. | d895532dex34.htm |
| EX-3.1 - EX-3.1 - Pure Storage, Inc. | d895532dex31.htm |
| EX-3.2 - EX-3.2 - Pure Storage, Inc. | d895532dex32.htm |
| EX-4.1 - EX-4.1 - Pure Storage, Inc. | d895532dex41.htm |
| EX-1.1 - EX-1.1 - Pure Storage, Inc. | d895532dex11.htm |
| EX-10.4 - EX-10.4 - Pure Storage, Inc. | d895532dex104.htm |
| EX-10.7 - EX-10.7 - Pure Storage, Inc. | d895532dex107.htm |
| EX-10.6 - EX-10.6 - Pure Storage, Inc. | d895532dex106.htm |
| EX-23.2 - EX-23.2 - Pure Storage, Inc. | d895532dex232.htm |
Table of Contents
As filed with the U.S. Securities and Exchange Commission on September 9, 2015
Registration No. 333-206312
UNITED STATES
SECURITIES AND EXCHANGE COMMISSION
Washington, D.C. 20549
Amendment No. 1 To
FORM S-1
REGISTRATION STATEMENT
UNDER
THE SECURITIES ACT OF 1933
PURE STORAGE, INC.
(Exact name of registrant as specified in its charter)
| Delaware | 3572 | 27-1069557 | ||
| (State or other jurisdiction of incorporation or organization) |
(Primary Standard Industrial Classification Code Number) |
(I.R.S. Employer Identification Number) |
650 Castro Street, Suite 400
Mountain View, California 94041
(800) 379-7873
(Address, including zip code, and telephone number, including area code, of registrant’s principal executive offices)
Scott Dietzen
Chief Executive Officer
Pure Storage, Inc.
650 Castro Street, Suite 400
Mountain View, California 94041
(800) 379-7873
(Name, address, including zip code, and telephone number, including area code, of agent for service)
Copies to:
| Mark P. Tanoury John T. McKenna Seth J. Gottlieb Cooley LLP 3175 Hanover Street Palo Alto, California 94304 (650) 843-5000 |
Joseph FitzGerald Vice President & General Counsel Todd Wheeler Pure Storage, Inc. 650 Castro Street, Suite 400 Mountain View, California 94041 (800) 379-7873 |
Alan F. Denenberg Davis Polk & Wardwell LLP 1600 El Camino Real Menlo Park, California 94025 (650) 752-2000 |
Approximate date of commencement of proposed sale to the public: As soon as practicable after the effective date of this Registration Statement.
If any of the securities being registered on this Form are to be offered on a delayed or continuous basis pursuant to Rule 415 under the Securities Act of 1933, check the following box. ¨
If this Form is filed to register additional securities for an offering pursuant to Rule 462(b) under the Securities Act, check the following box and list the Securities Act registration statement number of the earlier effective registration statement for the same offering. ¨
If this Form is a post-effective amendment filed pursuant to Rule 462(c) under the Securities Act, check the following box and list the Securities Act registration statement number of the earlier effective registration statement for the same offering. ¨
If this Form is a post-effective amendment filed pursuant to Rule 462(d) under the Securities Act, check the following box and list the Securities Act registration statement number of the earlier effective registration statement for the same offering. ¨
Indicate by check mark whether the registrant is a large accelerated filer, an accelerated filer, a non-accelerated filer, or a smaller reporting company. See the definitions of “large accelerated filer,” “accelerated filer” and “smaller reporting company” in Rule 12b-2 of the Exchange Act. (Check one):
| Large accelerated filer ¨ | Accelerated filer ¨ | Non-accelerated filer þ | Smaller reporting company ¨ | |||
| (Do not check if a smaller reporting company) | ||||||
The Registrant hereby amends this Registration Statement on such date or dates as may be necessary to delay its effective date until the Registrant shall file a further amendment which specifically states that this Registration Statement shall thereafter become effective in accordance with Section 8(a) of the Securities Act of 1933, as amended, or until the Registration Statement shall become effective on such date as the Securities and Exchange Commission acting pursuant to said Section 8(a), may determine.
Table of Contents
The information in this prospectus is not complete and may be changed. We may not sell these securities until the registration statement filed with the Securities and Exchange Commission is effective. This prospectus is not an offer to sell these securities and we are not soliciting offers to buy these securities in any jurisdiction where the offer or sale is not permitted.
PROSPECTUS (Subject to Completion)
Issued September 9, 2015
Shares

CLASS A COMMON STOCK
Pure Storage, Inc. is offering shares of its Class A common stock. This is our initial public offering and no public market currently exists for our shares of Class A common stock. We anticipate that the initial public offering price will be between $ and $ per share.
We have two classes of authorized common stock, Class A common stock and Class B common stock. The rights of the holders of Class A common stock and Class B common stock are identical, except with respect to voting and conversion. Each share of Class A common stock is entitled to one vote. Each share of Class B common stock is entitled to ten votes and is convertible into one share of Class A common stock. Outstanding shares of Class B common stock will represent approximately % of the voting power of our outstanding capital stock immediately following this offering, with our directors, executive officers and principal stockholders representing approximately % of such voting power.
Our Class A common stock has been approved for listing on the New York Stock Exchange under the trading symbol “PSTG.”
We are an “emerging growth company” as defined under the federal securities laws. Investing in our Class A common stock involves risks. See “Risk Factors” beginning on page 10.
PRICE $ A SHARE
| Price to Public |
Underwriting |
Proceeds to |
||||||||||
| Per share |
$ | $ | $ | |||||||||
| Total |
$ | $ | $ | |||||||||
| (1) | See “Underwriting” for a description of the compensation payable to the underwriters. |
We have granted the underwriters the right to purchase up to an additional shares of Class A common stock to cover over-allotments.
The Securities and Exchange Commission and state securities regulators have not approved or disapproved of these securities, or determined if this prospectus is truthful or complete. Any representation to the contrary is a criminal offense.
The underwriters expect to deliver the shares of Class A common stock to purchasers on , 2015.
| MORGAN STANLEY | GOLDMAN, SACHS & CO. | BARCLAYS | ALLEN & COMPANY LLC |
| BofA MERRILL LYNCH | ||||||
| PACIFIC CREST SECURITIES | STIFEL | RAYMOND JAMES | EVERCORE ISI | |||
| a division of KeyBanc Capital Markets | ||||||
, 2015
Table of Contents
In a world that runs on flash
What was complex,
now is simple
What filled data center racks,
now fits in a box
What took days, now takes hours
What became outdated, now is evergreen
Table of Contents
We are responsible for the information contained in this prospectus and in any free writing prospectus we prepare or authorize. We have not authorized anyone to provide you with different information, and we take no responsibility for any other information others may give you. Neither we nor the underwriters are making an offer to sell these securities in any jurisdiction where the offer or sale is not permitted. You should not assume that the information contained in this prospectus is accurate as of any date other than the date on the cover of this prospectus. Our business, financial condition, results of operations and future growth prospects may have changed since that date.
Persons who come into possession of this prospectus and any applicable free writing prospectus in jurisdictions outside the United States are required to inform themselves about and to observe any restrictions as to this offering and the distribution of this prospectus and any such free writing prospectus applicable to that jurisdiction.
Until , 2015 (the 25th day after the date of this prospectus), all dealers that buy, sell or trade shares of our Class A common stock, whether or not participating in this offering, may be required to deliver a prospectus. This delivery is in addition to a dealer’s obligation to deliver a prospectus when acting as an underwriter and with respect to their unsold allotments or subscriptions.
Table of Contents
This summary highlights information contained elsewhere in this prospectus. This summary is not complete and does not contain all the information you should consider before investing in our Class A common stock. You should read this entire prospectus carefully, especially the risks of investing in our Class A common stock discussed under the heading “Risk Factors,” and our consolidated financial statements and related notes included elsewhere in this prospectus before making an investment decision. Except as otherwise indicated herein or as the context otherwise requires, references in this prospectus to “Pure Storage,” “Pure,” “the company,” “we,” “us” and “our” refer to Pure Storage, Inc. and its wholly-owned subsidiaries.
PURE STORAGE, INC.
Overview
Our mission is to deliver data storage that transforms business through a dramatic increase in performance and reduction in complexity and costs. Our innovative technology replaces storage systems designed for mechanical disk with all-flash systems optimized end-to-end for solid-state memory. At the same time, our innovative business model replaces the traditional forklift upgrade cycle with an evergreen storage model of hardware and software upgrades and maintenance.
Our next-generation storage platform and business model are the result of our team’s substantial experience in enterprise storage and web-scale infrastructure, as well as frustration with the industry’s status quo. This deep industry understanding led to the development of our three-part integrated platform: the Purity Operating Environment, our flash-optimized software, FlashArray, our modular and scalable all-flash array hardware, and Pure1, our cloud-based management and support. Our platform can deliver a 10X acceleration in business applications over legacy disk-based storage. It is also designed to be compatible with existing infrastructure, substantially more reliable and power and space efficient.
Our business model builds on our technology innovations to reverse the traditional storage business model. Instead of moving data between old and new systems via forklift upgrades, we keep business data and applications in place and upgrade technology around it. Our platform and business model are designed to add value to customers for a decade or more, reducing total cost of storage ownership while increasing loyalty.
Our innovations help rebalance the datacenter by closing the performance gap between legacy storage technology and servers and networks. But it is the simplicity of our platform and business model that is revolutionizing the enterprise storage experience. Together, our innovations have helped our customers realize the promise of the cloud model for IT and the benefits of Moore’s Law. This has yielded industry-leading Net Promoter scores, based on the results of customer satisfaction surveys we conducted.
Since launching FlashArray in May 2012, our customer base has grown to over 1,100 customers. Our customers include large and mid-size organizations across a diverse set of industry verticals, including cloud-based software and service providers, consumer web, education, energy, financial services, governments, healthcare, manufacturing, media, retail and telecommunications. Our platform is used for a broad set of storage use cases, including database applications, private and public cloud infrastructure, virtual server infrastructure and virtual desktop infrastructure. Our platform helps customers increase employee productivity, improve operational efficiency, make better decisions through faster, more accurate analytics and deliver more compelling user experiences to their customers and partners.
We sell our platform predominantly through a high touch, channel-fulfilled model. Our sales force works collaboratively with our global network of distribution and channel partners, which provides us broad sales reach while maintaining direct customer engagement.
1
Table of Contents
Pure Storage serves the market for enterprise storage and related storage software. According to IDC, the combined worldwide spend by enterprises on external storage hardware priced at more than $50,000 per array and storage and device management, storage infrastructure and storage replication software is estimated to grow from approximately $24.2 billion in 2014 to $27.0 billion in 2018. We believe the benefits of next-generation flash storage will drive flash to ultimately become the predominant form of primary enterprise storage and present a broad market opportunity.
This market opportunity is reflected in our rapid growth. Our revenue increased from $6.1 million for the fiscal year ended January 31, 2013 to $42.7 million for the fiscal year ended January 31, 2014 and to $174.5 million for the fiscal year ended January 31, 2015, representing year-over-year revenue growth of 603% and 308% for our two most recent fiscal years. Our revenue increased from $59.4 million for the six months ended July 31, 2014 to $158.7 million for the six months ended July 31, 2015, representing period-over-period growth of 167% for our most recent interim period. Our net loss was $23.4 million, $78.6 million, and $183.2 million for the fiscal years ended January 31, 2013, 2014 and 2015, respectively and $95.2 million and $113.0 million for the six months ended July 31, 2014 and 2015, respectively. For the fiscal year ended January 31, 2015 and the six months ended July 31, 2015, 77% and 78% of our revenue was from the United States and 23% and 22% from the rest of the world, respectively.
Industry Background
Technology continues to transform business—redefining how products and services are built, how customers and partners are served and how organizations innovate. As a result, organizations face the urgent need to operate with greater speed and to leverage technology to be smarter and more innovative. Indeed, the speed, agility and efficiency of an organization’s information systems contribute to and in many cases define competitive advantage.
Organizations must make technology investments that improve IT performance and in parallel reduce the cost and complexity of their operations. Technology that can quickly adapt to ever-changing requirements and drive these dual and seemingly opposed requirements of improving both performance and efficiency is essential.
Business Transformation through Improved Performance. The speed of servers and networks has dramatically improved over the past several decades, but the performance of disk-based storage has not kept up. Disk-based storage is now an obstacle to application performance.
Flash memory is a solid-state storage technology that can eliminate the storage bottleneck, while providing better performance, greater storage density and improved power efficiency as compared to disk. Flash memory has transformed today’s consumer technology experience—it is the storage media inside smartphones—and it is now time for business to enjoy those same benefits. The price performance of flash technology also has improved dramatically in recent years. Already, leading web-scale companies such as Apple, Facebook and Google are utilizing flash-based storage in their datacenters.
Even when retrofitted with flash, legacy approaches to storage generally fall short. Too often, they rely on legacy storage software, which was optimized for the serial and sequential read and write patterns of disk. They do not take full advantage of the parallelizable and random access nature of flash. Even modern hybrid storage approaches—those that pair flash and disk designs—are inadequate, as they suffer from the speed of the far slower disk operations.
IT Transformation through Reduced Costs and Complexity. Cloud computing has been one of the more compelling IT advances in years. Today, organizations use shared resources in the cloud, significantly reducing the cost and complexity of operations and datacenters. Organizations around the world are now adopting many of the core tenets of this cloud model to transform their own operations and datacenters.
2
Table of Contents
Legacy disk-based storage is generally inconsistent with the design tenets of the cloud. It does not scale easily, and is complex and costly to manage, often requiring expert consultants for routine operations. Most legacy disk-based storage requires organizations to replace their storage systems every 3 to 5 years. This is expensive and worrisome for customers, who must juggle upgrades and downtime during the data migration period. The result is an endless and time-consuming cycle of procurement, provisioning and troubleshooting of data storage.
Next-Generation Storage. With the increased demands of a complex and changing business environment, we believe organizations not only desire but also require a new storage platform that combines the following:
| • | Dramatically improved performance to keep up with the demands of the business; |
| • | Reliability, security and data management services for operating in mission critical environments; |
| • | Seamless interoperability for compatibility with existing IT infrastructure investments; |
| • | Simplicity, agility, easy automation and elasticity to enable the cloud model of IT; and |
| • | Greater price performance and reduced total cost of ownership. |
Our Solution
Pure Storage is defining the next generation of enterprise data storage. We have pioneered the all-flash array category and have coupled that with our customer-centric business model. We believe that our approach is having a profound impact both on our customers and the data storage industry as a whole:
| • | Business Transformation. With Pure Storage, customers’ business applications run faster—helping them to improve yields, employee productivity and customer and partner experiences, allowing them to make smarter decisions, and enabling them to increase innovation across their organizations. |
| • | Technology Transformation. Our platform increases the efficiency, agility and simplicity of IT infrastructure, enabling our customers to reduce the cost and complexity of operations and implement the cloud model. |
The following differentiates our storage platform:
| • | High Performance. Our FlashArray and Purity Operating Environment software were specifically architected for the fast parallelizable and random access of flash. The result is that customers can eliminate more than one year of cumulative application latency every month as compared to legacy disk-based storage in typical deployments. |
| • | Enterprise Resiliency. Our platform, through the Purity Operating Environment, enables customers to maintain continuous access to their data without a loss in performance, even in the event of hardware or software component failures or during upgrades. |
| • | Simplicity. Our platform is simple to deploy, manage and upgrade for a wide variety of customer use cases—the basic operating commands fit on a single, folding business card. Our platform is designed to seamlessly integrate with existing investments in server and application infrastructure. |
| • | Agile Management. Through Pure1, we deliver an integrated cloud-based management and support experience. We originate most of the support interactions we have with our customers, consistent with our proactive focus on helping our customers quickly respond to issues and stay ahead of changes to their storage requirements. |
| • | Evergreen Storage. Our platform is designed to support customer deployments for a decade or more. Through our innovative business model, we provide software updates, any needed hardware replacements, and a controller refresh every three years so the customer can run the latest Purity Operating Environment for predictable maintenance fees. |
3
Table of Contents
| • | Compelling Economics. Our FlashReduce software, combined with consumer-grade flash memory, allows customers to achieve price-performance levels that enable our platform to be deployed across a wide range of use cases. |
| • | Lower Total Cost of Ownership. Our platform reduces the space, power, cooling, management overhead and other associated expenses as compared to disk-based storage. |
Growth Strategies
Key elements of our growth strategy include:
| • | Relentlessly Innovate and Maintain Technology Leadership. We will continue to invest in product innovation and technology leadership and plan to enhance our flash-optimized software, modular and scalable hardware and cloud-based management and support. |
| • | Continue to Drive Large Customer Adoption. We intend to grow our base of customers, including large customers, by promoting our platform, increasing our investment in sales and marketing and leveraging our network of channel partners. |
| • | Further Leverage our Channel Ecosystem. We intend to continue investing in training, demand generation and partner programs. We also believe we can enable many of our partners to independently identify, qualify, sell and upgrade customers, with limited involvement from us. |
| • | Drive Greater Penetration into our Existing Customer Base. We believe our over 1,100 customers represent a significant opportunity for us to realize incremental sales. We sell additional products and services to our customers as the data within their existing application deployments naturally grows and as customers migrate additional applications to our platform. |
| • | Cultivate our Inspirational Culture. We believe our culture is a critical part of our success. We strive to maintain an exciting and supportive atmosphere that attracts great talent and inspires our employees to excel and deliver a differentiated experience for our customers. |
| • | Leverage our Technology Ecosystem. We will continue to develop strategic relationships with technology vendors to allow integration of our platform with their offerings, enabling a streamlined experience for our customers. |
Risks Associated with Our Business
Our business is subject to numerous risks and uncertainties including those highlighted in the section titled “Risk Factors” immediately following this prospectus summary. These risks include, among others, the following:
| • | We have experienced rapid growth in recent periods, and we may not be able to sustain or manage future growth effectively. |
| • | We intend to continue focusing on revenue growth and increasing our market penetration and international presence at the expense of near-term profitability by investing heavily in our business. |
| • | We have a limited operating history, which makes our future operating results difficult to predict. |
| • | The market for all-flash storage products is rapidly evolving, which makes it difficult to forecast customer adoption rates and demand for our products. |
| • | We face intense competition from a number of established companies and new entrants. |
| • | Many of our established competitors have long-standing relationships with key decision makers at many of our current and prospective customers, which may inhibit our ability to compete effectively and maintain or increase our market share. |
4
Table of Contents
| • | Our ability to increase our revenue will substantially depend on our ability to attract, motivate and retain sales, engineering and other key personnel, including our management team, and any failure to attract, motivate and retain these employees could harm our business, operating results and financial condition. |
| • | If we fail to adequately expand our sales force, our growth will be impeded. |
| • | The success of our business depends in part on our ability to protect and enforce our intellectual property rights. |
If we are unable to adequately address these and other risks we face, our business, financial condition, operating results and prospects may be adversely affected.
Emerging Growth Company Status
We are an “emerging growth company” as defined in the Jumpstart Our Business Startups Act, or the JOBS Act, enacted in April 2012, and therefore we intend to take advantage of certain exemptions from various public company reporting requirements, including not being required to have our internal control over financial reporting audited by our independent registered public accounting firm pursuant to Section 404(b) of the Sarbanes-Oxley Act of 2002, reduced disclosure obligations regarding executive compensation in our periodic reports and proxy statements, exemptions from the requirements of holding a nonbinding advisory vote on executive compensation and any golden parachute payments not previously approved. We may take advantage of these exemptions for up to five years or until we are no longer an “emerging growth company,” whichever is earlier.
Corporate Information
We were incorporated in Delaware in October 2009 as OS76, Inc. In January 2010, we changed our name to Pure Storage, Inc. Our principal executive offices are located at 650 Castro Street, Suite 400, Mountain View, California 94041, and our telephone number is (800) 379-7873. Our website address is www.purestorage.com. Information contained on or accessible through our website is not a part of this prospectus and the inclusion of our website address in this prospectus is an inactive textual reference only.
Pure Storage, the “P” logo, Purity Operating Environment, FlashArray, Pure1 and other trade names, trademarks or service marks of Pure Storage appearing in this prospectus are the property of Pure Storage. Trade names, trademarks and service marks of other companies appearing in this prospectus are the property of their respective holders.
5
Table of Contents
THE OFFERING
| Class A common stock offered |
shares | |
| Class A common stock to be outstanding after this offering |
shares | |
| Class B common stock to be outstanding after this offering |
shares | |
| Total Class A and Class B common stock to be outstanding after this offering |
shares | |
| Over-allotment option of Class A common stock offered |
shares | |
| Voting rights |
We have two classes of authorized common stock: Class A common stock and Class B common stock. The rights of the holders of Class A and Class B common stock are identical, except with respect to voting and conversion rights. The holders of Class A common stock are entitled to one vote per share, and the holders of Class B common stock are entitled to ten votes per share, on all matters that are subject to stockholder vote. Following this offering, each share of Class B common stock may be converted into one share of Class A common stock at the option of the holder thereof, and will be converted into one share of Class A common stock upon transfer thereof, subject to certain exceptions. See “Description of Capital Stock” for additional information. | |
| Use of proceeds |
We estimate that the net proceeds from this offering will be approximately $ million, based on an assumed initial public offering price of $ per share, the midpoint of the price range set forth on the cover page of this prospectus, after deducting underwriting discounts and commissions and estimated offering expenses payable by us.
We intend to use the net proceeds from this offering primarily for general corporate purposes, including expansion of our product development and sales and marketing organizations. We may also use a portion of the net proceeds from this offering for acquisitions of, or investments in, technologies, solutions or businesses that complement our business, although we have no commitments or agreements to enter into such acquisitions or investments. See “Use of Proceeds” for additional information. | |
| New York Stock Exchange symbol |
“PSTG” | |
6
Table of Contents
The number of shares of Class A and Class B common stock to be outstanding after this offering is based on no shares of our Class A common stock and 160,056,764 shares of our Class B common stock outstanding as of July 31, 2015, and excludes:
| • | 59,928,620 shares of Class B common stock issuable upon the exercise of outstanding stock options as of July 31, 2015 under our 2009 Equity Incentive Plan with weighted-average exercise price of $4.53 per share; |
| • | 15,102,581 shares of Class B common stock reserved for future issuance under our 2009 Equity Incentive Plan, which shares will cease to be available for issuance at the time our 2015 Equity Incentive Plan becomes effective in connection with this offering; |
| • | 700,000 shares of Class B common stock that we issued in September 2015 to the Pure Good Foundation; |
| • | 27,000,000 shares of Class A common stock reserved for future issuance under our 2015 Equity Incentive Plan, as well as any automatic increases in the number of shares of Class A common stock reserved for future issuance under this plan, which will become effective upon the execution of the underwriting agreement for this offering; and |
| • | 3,500,000 shares of Class A common stock reserved for future issuance under our 2015 Employee Stock Purchase Plan, as well as any automatic increases in the number of shares of Class A common stock reserved for future issuance under this plan, which will become effective upon the execution of the underwriting agreement for this offering. |
In addition, unless we specifically state otherwise, all information in this prospectus assumes:
| • | that our amended and restated certificate of incorporation, which we will file in connection with the closing of this offering, and our amended and restated bylaws adopted in connection with this offering are effective; |
| • | the conversion of all outstanding shares of our preferred stock into an aggregate of 122,280,679 shares of Class B common stock immediately upon the closing of this offering; |
| • | no exercise of outstanding options; and |
| • | no exercise by the underwriters of their right to purchase up to an additional shares of Class A common stock to cover over-allotments. |
7
Table of Contents
SUMMARY CONSOLIDATED FINANCIAL DATA
The following tables summarize our consolidated financial data. We have derived the consolidated statements of operations data for the fiscal years ended January 31, 2014 and 2015 from our audited financial statements included elsewhere in this prospectus. The selected consolidated statements of operations data for the fiscal year ended January 31, 2013 are derived from our unaudited consolidated financial statements not included in this prospectus. We have derived the selected consolidated financial statements of operations data for the six months ended July 31, 2014 and 2015 and consolidated balance sheet data as of July 31, 2015 from our unaudited consolidated financial statements included elsewhere in the prospectus. The unaudited consolidated financial statements were prepared on a basis consistent with our audited financial statements. Our historical results are not necessarily indicative of the results that may be expected in the future and our results for the six months ended July 31, 2015 are not necessarily indicative of the results that may be expected for the full fiscal year.
You should read this data together with our consolidated financial statements and related notes appearing elsewhere in this prospectus and the sections titled “Selected Consolidated Financial Data” and “Management’s Discussion and Analysis of Financial Condition and Results of Operations.”
| Fiscal Year Ended January 31, |
Six Months Ended July 31, |
|||||||||||||||||||
| 2013 | 2014 | 2015 | 2014 | 2015 | ||||||||||||||||
| (unaudited) | ||||||||||||||||||||
| (in thousands, except per share data) | ||||||||||||||||||||
| Consolidated Statements of Operations Data: |
||||||||||||||||||||
| Revenue: |
||||||||||||||||||||
| Product |
$ | 5,474 | $ | 39,228 | $ | 154,836 | $ | 53,253 | $ | 134,810 | ||||||||||
| Support |
603 | 3,505 | 19,615 | 6,159 | 23,928 | |||||||||||||||
|
|
|
|
|
|
|
|
|
|
|
|||||||||||
| Total revenue |
6,077 | 42,733 | 174,451 | 59,412 | 158,738 | |||||||||||||||
| Cost of revenue: |
||||||||||||||||||||
| Product(1) |
3,605 | 19,974 | 63,425 | 22,608 | 50,353 | |||||||||||||||
| Support(1) |
709 | 4,155 | 14,127 | 4,924 | 14,421 | |||||||||||||||
|
|
|
|
|
|
|
|
|
|
|
|||||||||||
| Total cost of revenue |
4,314 | 24,129 | 77,552 | 27,532 | 64,774 | |||||||||||||||
|
|
|
|
|
|
|
|
|
|
|
|||||||||||
| Gross profit |
1,763 | 18,604 | 96,899 | 31,880 | 93,964 | |||||||||||||||
| Operating expenses: |
||||||||||||||||||||
| Research and development(1) |
12,383 | 36,081 | 92,707 | 40,533 | 69,870 | |||||||||||||||
| Sales and marketing(1) |
10,727 | 54,750 | 152,320 | 71,563 | 107,844 | |||||||||||||||
| General and administrative(1) |
2,017 | 5,902 | 32,354 | 14,419 | 27,919 | |||||||||||||||
|
|
|
|
|
|
|
|
|
|
|
|||||||||||
| Total operating expenses |
25,127 | 96,733 | 277,381 | 126,515 | 205,633 | |||||||||||||||
|
|
|
|
|
|
|
|
|
|
|
|||||||||||
| Loss from operations |
(23,364 | ) | (78,129 | ) | (180,482 | ) | (94,635 | ) | (111,669 | ) | ||||||||||
| Other income (expense), net |
(6 | ) | (141 | ) | (1,412 | ) | (307 | ) | (1,074 | ) | ||||||||||
|
|
|
|
|
|
|
|
|
|
|
|||||||||||
| Loss before provision for income taxes |
(23,370 | ) | (78,270 | ) | (181,894 | ) | (94,942 | ) | (112,743 | ) | ||||||||||
| Provision for income taxes |
2 | 291 | 1,337 | 257 | 214 | |||||||||||||||
|
|
|
|
|
|
|
|
|
|
|
|||||||||||
| Net loss |
$ (23,372 | ) | $ | (78,561 | ) | $ | (183,231 | ) | $ | (95,199 | ) | $ | (112,957 | ) | ||||||
|
|
|
|
|
|
|
|
|
|
|
|||||||||||
| Net loss per share attributable to common stockholders, basic and diluted(2) |
$ | (1.28 | ) | $ | (3.24 | ) | $ | (6.56 | ) | $ | (3.66 | ) | $ | (3.41 | ) | |||||
|
|
|
|
|
|
|
|
|
|
|
|||||||||||
| Weighted-average shares used in computing net loss per share attributable to common stockholders, basic and diluted(2) |
18,239 | 24,237 | 27,925 | 25,976 | 33,154 | |||||||||||||||
|
|
|
|
|
|
|
|
|
|
|
|||||||||||
| Pro forma net loss per share attributable to common stockholders, basic and diluted(2) |
$ | (1.26 | ) | $ | (0.73 | ) | ||||||||||||||
|
|
|
|
|
|||||||||||||||||
| Weighted-average shares used in computing pro forma net loss per share attributable to common stockholders, basic and diluted(2) |
145,719 | 155,435 | ||||||||||||||||||
|
|
|
|
|
|||||||||||||||||
8
Table of Contents
| (1) | Includes stock-based compensation expense as follows: |
| Fiscal Year Ended January 31, |
Six Months Ended July 31, |
|||||||||||||||||||
| 2013 | 2014 | 2015 | 2014 | 2015 | ||||||||||||||||
| (unaudited) | ||||||||||||||||||||
| (in thousands) | ||||||||||||||||||||
| Cost of revenue—product |
$ | 66 | $ | 253 | $ | 303 | $ | 229 | $ | 96 | ||||||||||
| Cost of revenue—support |
— | 316 | 1,273 | 898 | 854 | |||||||||||||||
| Research and development |
752 | 11,477 | 22,512 | 15,147 | 10,429 | |||||||||||||||
| Sales and marketing |
342 | 9,014 | 22,466 | 17,361 | 5,980 | |||||||||||||||
| General and administrative |
256 | 506 | 6,479 | 4,508 | 3,300 | |||||||||||||||
|
|
|
|
|
|
|
|
|
|
|
|||||||||||
| Total stock-based compensation expense |
$ | 1,416 | $ | 21,566 | $ | 53,033 | $ | 38,143 | $ | 20,659 | ||||||||||
|
|
|
|
|
|
|
|
|
|
|
|||||||||||
Stock-based compensation expense for the fiscal years ended January 31, 2014 and 2015 and the six months ended July 31, 2014 included $13.3 million, $27.6 million, and $27.6 million, respectively, of cash paid for the repurchase of common stock in excess of fair value. See Note 9 to our consolidated financial statements for additional information.
| (2) | See Note 10 to our consolidated financial statements for an explanation of the method used to calculate our actual and pro forma basic and diluted net loss per share attributable to common stockholders and the weighted-average number of shares used in the computation of the per share amounts. |
| As of July 31, 2015 | ||||||||||
| Actual | Pro Forma(1) |
Pro Forma As Adjusted(2)(3) | ||||||||
| (unaudited) | ||||||||||
| (in thousands) | ||||||||||
| Consolidated Balance Sheet Data: |
||||||||||
| Cash and cash equivalents |
$ | 128,282 | $ | 128,282 | ||||||
| Working capital |
147,554 | 147,554 | ||||||||
| Total assets |
336,563 | 336,563 | ||||||||
| Deferred revenue, current and noncurrent portion |
123,482 | 123,482 | ||||||||
| Convertible preferred stock |
543,940 | — | ||||||||
| Total stockholders’ (deficit) equity |
$ | (388,028 | ) | $ | 155,912 | |||||
| (1) | The pro forma column reflects the conversion of all outstanding shares of convertible preferred stock into 122,280,679 shares of Class B common stock immediately upon the closing of this offering. |
| (2) | The pro forma as adjusted column further reflects the receipt of $ million in net proceeds from our sale of shares of Class A common stock in this offering at an assumed initial public offering price of $ per share, the midpoint of the price range set forth on the cover page of this prospectus, after deducting underwriting discounts and commissions and estimated offering expenses payable by us. |
| (3) | Each $1.00 increase or decrease in the assumed initial public offering price of $ per share would increase or decrease, respectively, the amount of cash and cash equivalents, working capital, total assets and total stockholders’ (deficit) equity by $ million, assuming the number of shares offered by us, as set forth on the cover page of this prospectus, remains the same and after deducting underwriting discounts and commissions and estimated offering expenses payable by us. We may also increase or decrease the number of shares we are offering. An increase or decrease of 1,000,000 in the number of shares we are offering would increase or decrease, respectively, the amount of cash and cash equivalents, working capital, total assets and total stockholders’ (deficit) equity by approximately $ million, assuming the assumed initial public offering price per share, as set forth on the cover page of this prospectus, remains the same after deducting underwriting discounts and commissions. The pro forma as adjusted information is illustrative only, and we will adjust this information based on the actual initial public offering price and other terms of this offering determined at pricing. |
9
Table of Contents
Investing in our Class A common stock involves a high degree of risk. You should carefully consider the risks and uncertainties described below, together with all of the other information contained in this prospectus, including our consolidated financial statements and the related notes appearing at the end of this prospectus, before deciding to invest in our Class A common stock. If any of the following risks actually occur, it could harm our business, prospects, operating results and financial condition. In such event, the trading price of our Class A common stock could decline and you might lose all or part of your investment.
Risks Related to Our Business and Industry
We have experienced rapid growth in recent periods, and we may not be able to sustain or manage future growth effectively.
We have significantly expanded our overall business, customer base, headcount, channel partner relationships and operations in recent periods, and we anticipate that we will continue to expand and may experience rapid growth in future periods. For example, from January 31, 2014 to January 31, 2015, our headcount increased from over 350 to over 800 employees, and to over 1,100 employees as of July 31, 2015. Our future operating results will depend to a large extent on our ability to successfully manage our anticipated expansion and growth. To manage our growth successfully, we believe that we must, among other things, effectively:
| • | maintain and extend our product leadership; |
| • | recruit, hire, train and manage additional personnel; |
| • | maintain and further develop our channel partner relationships; |
| • | enhance and expand our distribution and supply chain infrastructure; |
| • | expand our support capabilities; |
| • | forecast and control expenses; |
| • | enhance and expand our international operations; and |
| • | implement, improve and maintain our internal systems, procedures and controls. |
We expect that our future growth will continue to place a significant strain on our managerial, administrative, operational, financial and other resources. We will incur costs associated with this future growth prior to realizing the anticipated benefits, and the return on these investments may be lower, may develop more slowly than we expect or may never materialize. If we are unable to manage our growth effectively, we may not be able to take advantage of market opportunities or develop new products or enhancements to existing products in a timely manner, and we may fail to satisfy customers’ expectations, maintain product quality, execute on our business plan or adequately respond to competitive pressures, each of which could adversely affect our business and operating results.
We intend to continue focusing on revenue growth and increasing our market penetration and international presence at the expense of near-term profitability by investing heavily in our business.
Our strategy is to increase our investments in marketing, sales, support and research and development at the expense of near-term profitability. We believe our decision to continue investing heavily in our business will be critical to our future success. We anticipate that our operating costs and expenses will increase substantially for the foreseeable future. In addition, we expect to incur significant legal, accounting and other expenses that we did not incur as a private company. Even if we achieve significant revenue growth, we may continue to experience losses, similar or greater than to those we have incurred historically.
10
Table of Contents
We have not achieved profitability for any fiscal year since our inception. We incurred a net loss of approximately $183.2 million for the fiscal year ended January 31, 2015 and $113.0 million for the six months ended July 31, 2015, and we had an accumulated deficit of $341.6 million and $454.5 million as of January 31, 2015 and July 31, 2015, respectively. Our operating expenses largely are based on anticipated revenue, and a high percentage of our expenses are, and will continue to be, fixed in the short term. If we fail to adequately increase revenue and manage costs, we may not achieve or maintain profitability in the future. As a result, our business could be harmed and our operating results could suffer.
We have a limited operating history, which makes our future operating results difficult to predict.
We were founded in October 2009, but have generated substantially all of our revenue since February 1, 2013. We have a limited operating history in an industry characterized by rapid technological change, changing customer needs, evolving industry standards and frequent introductions of new products and services. Our limited operating history makes it difficult to evaluate our current business and our future prospects, including our ability to plan for and model future growth. All of these factors make our future operating results difficult to predict, which may impair our ability to manage our business and reduce your ability to assess our prospects.
You should not consider our revenue growth in prior quarterly or annual periods as indicative of our future performance. In future periods, we do not expect to achieve similar percentage revenue growth rates as we have achieved in some past periods. If we are unable to maintain adequate revenue or revenue growth, our stock price could be volatile, and it may be difficult to achieve and maintain profitability.
The market for all-flash storage products is rapidly evolving, which makes it difficult to forecast customer adoption rates and demand for our products.
The market for all-flash storage products is rapidly evolving. As a result, our future financial performance will depend on the continued growth of this market and on our ability to adapt to emerging customer demands and trends. Sales of our products are currently focused on use cases that require performance storage products such as virtualization and transaction processing. Many of our target customers have never purchased all-flash storage products and may not have the desire or available budget to invest in a new technology such as ours. It is difficult to predict with any precision customer adoption rates, customer demand for our products or the future growth rate and size of our market. Our products may never reach mass adoption, and changes or advances in alternative technologies or adoption of cloud storage offerings not utilizing our storage platform could adversely affect the demand for our products. Further, although flash storage has a number of advantages as compared to other data storage alternatives, such as hard disk drives, flash storage has certain limitations as well, including a higher price per gigabyte of raw storage, more limited methods for data recovery and reduced performance gains for certain uses, including sequential input/output, or I/O, transactions. A slowing in or reduced demand for all-flash storage products caused by lack of customer acceptance, technological challenges, alternative technologies and products or otherwise would result in a lower revenue growth rate or decreased revenue, either of which would negatively impact our business and operating results.
We face intense competition from a number of established companies and new entrants.
We face intense competition from a number of established companies that sell competitive storage products. These competitors include Cisco, Dell, EMC, HP, Hitachi Data Systems, IBM, Lenovo and NetApp. These competitors, as well as other potential competitors, may have:
| • | greater name recognition and longer operating histories; |
| • | larger sales and marketing and customer support budgets and resources; |
| • | broader distribution and established relationships with distribution partners and customers; |
| • | the ability to bundle storage products with other products and services to address customers’ requirements; |
| • | greater resources to make acquisitions; |
11
Table of Contents
| • | larger and more mature intellectual property portfolios; and |
| • | substantially greater financial, technical and other resources. |
We also face competition from a number of other companies, one or more of which may become significant competitors in the future. New competitors could emerge and acquire significant market share. All of our competitors may utilize a broad range of competitive strategies. For example, some of our competitors have offered bundled products and services in order to reduce the initial cost of their storage products. Our competitors may also choose to adopt more aggressive pricing policies than we choose to adopt. Some of our competitors have offered their products either at significant discounts or even for free in response to our efforts to market the overall benefits and technological merits of our products.
Many competitors have developed competing all-flash or hybrid storage technologies. For example, some of our competitors have developed all-flash storage products with data reduction technologies that directly compete with our products. We expect our competitors to continue to improve the performance of their products, reduce their prices and introduce new services and technologies that may, or that they may claim to, offer greater performance and improved total cost of ownership as compared to our products. In addition, our competitors may develop enhancements to, or future generations of, competitive products that may render our products or technologies obsolete or less competitive. These and other competitive pressures may prevent us from competing successfully against current or future competitors.
Many of our established competitors have long-standing relationships with key decision makers at many of our current and prospective customers, which may inhibit our ability to compete effectively and maintain or increase our market share.
Many of our competitors benefit from established brand awareness and long-standing relationships with key decision makers at many of our current and prospective customers. We expect that our competitors will seek to leverage these existing relationships to discourage customers from purchasing our products. In particular, when competing against us, we expect our competitors to emphasize the perceived risks of relying on products from a company with a shorter operating history. Additionally, most of our prospective customers have existing storage systems manufactured by our competitors. This gives an incumbent competitor an advantage in retaining the customer because the incumbent competitor already understands the customer’s network infrastructure, user demands and IT needs. In the event that we are unable to successfully sell our products to new customers or persuade our customers from continuing to purchase our products, we may not be able to maintain or increase our market share and revenue, which could adversely affect our business and operating results.
Our ability to increase our revenue will substantially depend on our ability to attract, motivate and retain sales, engineering and other key personnel, including our management team, and any failure to attract, motivate and retain these employees could harm our business, operating results and financial condition.
Our ability to increase our revenue will substantially depend on our ability to attract and retain qualified sales, engineering and other key employees, including our management. These positions may require candidates with specific backgrounds in software and the storage industry, and competition for employees with such expertise is intense. Our ability to attract, motivate or retain employees may be reduced as we become a public company, as the value of our stock fluctuates and as our employees have the opportunity to sell their equity after this offering. We may not be successful in attracting, motivating and retaining qualified personnel. We have from time to time experienced, and we expect to continue to experience, difficulty in hiring and retaining highly skilled employees with appropriate qualifications. To the extent that we are successful in hiring to fill these positions, we need a significant amount of time to train the new employees before they can become effective and efficient in performing their jobs. From time to time, there may be changes in our management team resulting from the hiring or departure of those individuals. Members of our management team, including our executive officers, are generally employed on an at-will basis, which means that they could terminate their employment with us at any time. If we are unable to attract, motivate and retain qualified sales, engineering and other key employees, including our management, our business and operating results could suffer.
12
Table of Contents
If we fail to adequately expand our sales force our growth will be impeded.
We will need to continue to expand and optimize our sales infrastructure in order to grow our customer base and our business. We plan to continue to expand our sales force, both domestically and internationally. Identifying, recruiting and training qualified sales personnel require significant time, expense and attention. It can take time before our sales representatives are fully trained and productive. Our business may be adversely affected if our efforts to expand and train our sales force do not generate a corresponding increase in revenue. In particular, if we are unable to hire, develop and retain qualified sales personnel or if new sales personnel are unable to achieve desired productivity levels in a reasonable period of time, we may not be able to realize the expected benefits of this investment or increase our revenue.
If we fail to develop and introduce new or enhanced products on a timely basis, our ability to attract and retain customers could be impaired and our competitive position could be harmed.
We operate in a dynamic environment characterized by rapidly changing technologies and industry standards and technological obsolescence. To compete successfully, we must design, develop, market and sell new or enhanced products that provide increasingly higher levels of performance, capacity and reliability and that meet the cost expectations of our customers, which is a complex and uncertain process. The introduction of new products by our competitors, the market acceptance of products based on new or alternative technologies or the emergence of new industry standards could render our existing or future products obsolete or less competitive. As we introduce new or enhanced products, we must successfully manage product launches and transitions to the next generations of our products. For example, in June 2015, we announced our new FlashArray//m product. If we are not able to successfully manage the transition from our FlashArray 400-Series product to our FlashArray//m product, our business, operating results and financial condition could be harmed. Similarly, if we fail to introduce new or enhanced products that meet the needs of our customers in a timely or cost-effective fashion, we will lose market share and our operating results will be adversely affected.
Our research and development efforts may not produce successful products that result in significant revenue in the near future, if at all.
Developing new products and related enhancements is expensive and time intensive. Our investments in research and development may result in products that may not achieve market adoption, are more expensive to develop than anticipated, may take longer to generate revenue or may generate less revenue than we anticipate. Our future plans include significant investments in research and development for new products and related opportunities. We believe that we must continue to dedicate significant resources to our research and development efforts to maintain or expand our competitive position. However, these efforts may not result in significant revenue in the near future, if at all, which could adversely affect our business and operating results.
If we fail to successfully maintain or grow our relationships with channel partners, our business, operating results and financial condition could be harmed.
Our future success is highly dependent upon our ability to establish and maintain successful relationships with a variety of channel partners in markets where we do not have a large direct sales force or direct customer support personnel. In addition to selling our products, our partners may offer installation, post-sale service and support on our behalf in their local markets. In markets where we rely on partners more heavily, we have less contact with our customers and less control over the sales process and the quality and responsiveness of our partners. As a result, it may be more difficult for us to ensure the proper delivery and installation of our products or the quality or responsiveness of the support and services being offered. Any failure on our part to effectively identify, train and manage our channel partners and to monitor their sales activity, as well as the customer support and services being provided to our customers in their local markets, could harm our business, operating results and financial condition.
13
Table of Contents
Our channel partners may choose to discontinue offering our products and services or may not devote sufficient attention and resources toward selling our products and services. We typically enter into non-exclusive, written agreements with our channel partners. These agreements generally have a one-year, self-renewing term, have no minimum sales commitment and do not prohibit our channel partners from offering products and services that compete with ours. Accordingly, our channel partners may choose to discontinue offering our products and services or may not devote sufficient attention and resources toward selling our products and services. Additionally, our competitors may provide incentives to our existing and potential channel partners to use, purchase or offer their products and services or to prevent or reduce sales of our products and services. The occurrence of any of these events could harm our business, operating results and financial condition.
Our gross margins are impacted by a variety of factors, are subject to variation from period to period and are difficult to predict.
Our gross margins fluctuate from period to period due primarily to product costs, customer mix and product mix. Over the fiscal year ended January 31, 2015, and the six months ended July 31, 2015, our quarterly gross margins ranged from 53% to 60%. Our gross margins are likely to continue to fluctuate and may be affected by a variety of factors, including:
| • | demand for our products; |
| • | sales and marketing initiatives, discount levels, rebates and competitive pricing; |
| • | changes in customer, geographic or product mix, including mix of configurations within products; |
| • | the cost of components and freight; |
| • | new product introductions and enhancements, potentially with initial sales at relatively small volumes and higher product costs; |
| • | the timing and amount of revenue recognized and deferred; |
| • | excess inventory levels or purchase commitments as a result of changes in demand forecasts or product transitions; |
| • | an increase in product returns, order rescheduling and cancellations; |
| • | the timing of technical support service contracts and contract renewals; |
| • | inventory stocking requirements to mitigate supply constraints, accommodate unforeseen demand or support new product introductions; and |
| • | product quality and serviceability issues. |
Due to such factors, gross margins are subject to variation from period to period and are difficult to predict. If we are unable to manage these factors effectively, our gross margins may decline, and fluctuations in gross margins may make it difficult to manage our business and achieve or maintain profitability, which could materially harm our business, operating results and financial condition.
Our operating results may fluctuate significantly, which could make our future results difficult to predict and could cause our operating results to fall below expectations.
Our operating results may fluctuate due to a variety of factors, many of which are outside of our control. As a result, comparing our operating results on a period-to-period basis may not be meaningful. You should not rely on our past results as an indication of our future performance. If our revenue or operating results fall below the expectations of investors or any securities analysts that follow our company, the price of our Class A common stock would likely decline.
14
Table of Contents
Factors that are difficult to predict and that could cause our operating results to fluctuate include:
| • | the timing and magnitude of orders, shipments and acceptance of our products in any quarter, including product returns, order rescheduling and cancellations by our customers; |
| • | fluctuations in demand and prices for our products; |
| • | potential seasonality in the markets we serve; |
| • | our ability to control the costs of the components we use in our hardware products; |
| • | our ability to timely adopt subsequent generations of components into our hardware products; |
| • | disruption in our supply chains, component availability and related procurement costs; |
| • | reductions in customers’ budgets for IT purchases; |
| • | changes in industry standards in the data storage industry; |
| • | our ability to develop, introduce and ship in a timely manner new products and product enhancements that meet customer requirements; |
| • | our ability to effectively manage product transitions as we introduce new products; |
| • | any change in the competitive dynamics of our markets, including new entrants or discounting of product prices; |
| • | our ability to control costs, including our operating expenses; and |
| • | future accounting pronouncements and changes in accounting policies. |
The occurrence of any one of these risks could negatively affect our operating results in any particular quarter, which could cause the price of our Class A common stock to decline.
Our sales cycles can be long and unpredictable, particularly with respect to large orders, and our sales efforts require considerable time and expense. As a result, it can be difficult for us to predict when, if ever, a particular customer will choose to purchase our products, which may cause our operating results to fluctuate.
Our sales efforts involve educating our customers about the use and benefits of our products, including their technical capabilities and cost saving potential. Larger customers often undertake an evaluation and testing process that can result in a lengthy sales cycle. We spend substantial time and resources on our sales efforts without any assurance that our efforts will produce any sales. In addition, product purchases are frequently subject to budget constraints, multiple approvals and unplanned administrative, processing and other delays. A substantial portion of our quarterly sales typically occurs during the last several weeks of the quarter, which we believe largely reflects customer buying patterns of products similar to ours and other products in the technology industry generally. Since we do not recognize revenue from a sale until title is transferred for the product, if we have a substantial portion of our sales at the end of a quarter, we may be unable to transfer title and recognize the associated revenue in that quarter. Furthermore, our products come with a 30-day money back guarantee, allowing a customer to return a FlashArray product within 30 days of receipt if the customer is not satisfied with its purchase for any reason. In addition, a portion of our sales in any quarter is generated by sales activity initiated during the quarter. These factors, among others, make it difficult for us to predict when customers may purchase our products. We may expend significant resources on an opportunity without ever achieving a sale, which may adversely affect our operating results and cause our operating results to fluctuate. In addition, if sales expected from a specific customer for a particular quarter are not realized in that quarter or at all, our operating results may suffer.
15
Table of Contents
Our company culture has contributed to our success, and if we cannot maintain this culture as we grow, we could lose the innovation, creativity and teamwork fostered by our culture, and our business may be harmed.
We believe that a critical contributor to our success has been our company culture, which we believe fosters innovation, creativity, teamwork, passion for customers and focus on execution, as well as facilitating critical knowledge transfer and knowledge sharing. As we grow and change, we may find it difficult to maintain these important aspects of our company culture, which could limit our ability to innovate and operate effectively. Any failure to preserve our culture could also negatively affect our ability to retain and recruit personnel, continue to perform at current levels or execute on our business strategy.
Because our long-term success depends, in part, on our ability to expand the sales of our products to customers located outside of the United States, our business is susceptible to risks associated with international operations.
We maintain operations outside of the United States. We have been expanding and intend to continue to expand these operations in the future. We have limited experience operating in foreign jurisdictions. Our inexperience in operating our business outside of the United States increases the risk that our international expansion efforts may not be successful. In addition, conducting and expanding international operations subjects us to new risks that we have not generally faced in the United States. These include:
| • | exposure to foreign currency exchange rate risk; |
| • | difficulties in collecting payments internationally, and managing and staffing international operations; |
| • | establishing relationships with channel partners in international locations; |
| • | the increased travel, infrastructure and legal compliance costs associated with international locations; |
| • | the burdens of complying with a wide variety of laws associated with international operations, including taxes and customs; |
| • | significant fines, penalties and collateral consequences if we fail to comply with anti-bribery laws; |
| • | heightened risk of improper, unfair or corrupt business practices in certain geographies; |
| • | potentially adverse tax consequences, including repatriation of earnings; |
| • | increased financial accounting and reporting burdens and complexities; |
| • | political, social and economic instability abroad, terrorist attacks and security concerns in general; and |
| • | reduced or varied protection for intellectual property rights in some countries. |
The occurrence of any one of these risks could negatively affect our international operations and, consequently, our business, operating results and financial condition generally.
The sales prices of our products and services may decrease, which may reduce our gross profits and adversely impact our financial results.
The sales prices for our products and services may decline for a variety of reasons, including competitive pricing pressures, discounts, a change in our mix of products and services, the introduction of competing products or services or promotional programs. Competition continues to increase in the markets in which we participate, and we expect competition to further increase in the future, thereby leading to increased pricing pressures. Larger competitors with more diverse product and service offerings may reduce the price of products or services that compete with ours or may bundle them with other products and services. Additionally, although we price our products and services predominantly in U.S. dollars, currency fluctuations in certain countries and regions may negatively impact actual prices that partners and customers are willing to pay in those countries and regions. Furthermore, we anticipate that the sales prices for our products will decrease over product life cycles.
16
Table of Contents
We cannot assure you that we will be successful in developing and introducing new offerings with enhanced functionality on a timely basis, or that our new product and services offerings, if introduced, will enable us to maintain or improve our gross margins and achieve profitability.
We derive substantially all of our revenue from a single family of products, and a decline in demand for these products would cause our revenue to grow more slowly or to decline.
Our FlashArray family of products accounts for all of our revenue and will continue to comprise a significant portion of our revenue for the foreseeable future. As a result, our revenue could be reduced by:
| • | the failure of our current products to achieve broad market acceptance; |
| • | any decline or fluctuation in demand for our products, whether as a result of product obsolescence, technological change, customer budgetary constraints or other factors; |
| • | the introduction of competing products and technologies that replace or substitute, or represent an improvement over, our products; and |
| • | our inability to release enhanced versions of our products, including any related software, on a timely basis. |
If the market for all-flash storage products grows more slowly than anticipated or if demand for our products declines, we may not be able to increase our revenue or achieve and maintain profitability.
Our products are highly technical and may contain undetected defects, which could cause data unavailability, loss or corruption that might, in turn, result in liability to our customers and harm to our reputation and business.
Our products are highly technical and complex and are often used to store information critical to our customers’ business operations. Our products may contain undetected errors, defects or security vulnerabilities that could result in data unavailability, loss, corruption or other harm to our customers. Some errors in our products may only be discovered after they have been installed and used by customers. Any errors, defects or security vulnerabilities discovered in our products after commercial release could result in a loss of revenue or delay in revenue recognition, injury to our reputation, a loss of customers or increased service and warranty costs, any of which could adversely affect our business and operating results. In addition, errors or failures in the products of third-party technology vendors may be attributed to us and may harm our reputation.
We could face claims for product liability, tort or breach of warranty. Many of our contracts with customers contain provisions relating to warranty disclaimers and liability limitations, which may be difficult to enforce. Defending a lawsuit, regardless of its merit, would be costly and might divert management’s attention and adversely affect the market’s perception of us and our products. Our business liability insurance coverage could prove inadequate with respect to a claim and future coverage may be unavailable on acceptable terms or at all. These product-related issues could result in claims against us, and our business, operating results and financial condition could be harmed.
Our brand name and our business may be harmed by the marketing strategies of our competitors.
Because of the early stage of our business, we believe that building and maintaining brand recognition and customer goodwill is critical to our success. Our efforts in this area have, on occasion, been hampered by the marketing efforts of our competitors, which have included statements about us and our products. If we are unable to effectively respond to the marketing efforts of our competitors and protect our brand and customer goodwill now or in the future, our business will be adversely affected.
17
Table of Contents
Our products must interoperate with third party operating systems, software applications and hardware, and if we are unable to devote the necessary resources to ensure that our products interoperate with such software and hardware, we may lose or fail to increase our market share and may experience reduced demand for our products.
Our products must interoperate with our customers’ existing infrastructure, specifically their networks, servers, software and operating systems, which may be manufactured by a wide variety of vendors. When new or updated versions of these software operating systems or applications are introduced, we must sometimes develop updated versions of our software so that our products will interoperate properly. For example, our Pure1 cloud-based management and support includes connectors to virtualization platforms, allowing our customers to manage the FlashArray from within the native management tools, including for VMware and OpenStack. We may not deliver or maintain interoperability quickly, cost-effectively or at all. These efforts require capital investment and engineering resources. If we fail to maintain compatibility of our products with these infrastructure components, our customers may not be able to fully utilize our products, and we may, among other consequences, lose or fail to increase our market share and experience reduced demand for our products, which may harm our business, operating results and financial condition.
Our products must conform to industry standards in order to be accepted by customers in our markets.
Generally, our products comprise only a part of a datacenter. The servers, network, software and other components and systems of a datacenter must comply with established industry standards in order to interoperate and function efficiently together. We depend on companies that provide other systems in a datacenter to conform to prevailing industry standards. Often, these companies are significantly larger and more influential in driving industry standards than we are. Some industry standards may not be widely adopted or implemented uniformly, and competing standards may emerge that may be preferred by our customers. If larger companies do not conform to the same industry standards that we do, or if competing standards emerge, market acceptance of our products could be adversely affected, which may harm our business.
Our ability to successfully market and sell our products is dependent in part on ease of use and the quality of our support offerings, and any failure to offer high-quality installation and technical support could harm our business.
Once our products are deployed within our customers’ datacenters, customers depend on our support organization to resolve technical issues relating to our products. Our ability to provide effective support is largely dependent on our ability to attract, train and retain qualified personnel, as well as to engage with qualified support partners that provide a similar level of customer support. In addition, our sales process is highly dependent on our product and business reputation and on recommendations from our existing customers. Although our products are designed to be interoperable with existing servers and systems, we may need to provide customized installation and configuration support to our customers before our products become fully operational in their environments. Any failure to maintain, or a market perception that we do not maintain, high-quality installation and technical support could harm our reputation, our ability to sell our products to existing and prospective customers and our business.
We rely on contract manufacturers to manufacture our products, and if we fail to manage our relationship with our contract manufacturers successfully, our business could be negatively impacted.
We rely on a limited number of contract manufacturers to manufacture our products. Our reliance on contract manufacturers reduces our control over the assembly process, and exposes us to risks, such as reduced control over quality assurance, costs and product supply. If we fail to manage our relationships with these contract manufacturers effectively, or if these contract manufacturers experience delays, disruptions, capacity constraints or quality control problems, our ability to timely ship products to our customers could be impaired and our competitive position and reputation could be harmed. If we are required to change contract manufacturers or assume internal manufacturing operations, we may lose revenue, incur increased costs and damage our customer relationships. Qualifying a new contract manufacturer and commencing production is
18
Table of Contents
expensive and time-consuming. We may need to increase our component purchases, contract manufacturing capacity and internal test and quality functions if we experience increased demand. The inability of our contract manufacturers to provide us with adequate supplies of high-quality products could cause a delay in our order fulfillment, and our business, operating results and financial condition may be harmed.
We rely on a limited number of suppliers, and in some cases single-source suppliers, and any disruption or termination of these supply arrangements could delay shipments of our products and could harm our relationships with current and prospective customers.
We rely on a limited number of suppliers, and in some cases, on single-source suppliers, for several key components of our products, and we have not generally entered into agreements for the long-term purchase of these components. For example, the CPUs utilized in our products are supplied by Intel Corporation, or Intel, and neither we nor our contract manufacturers have an agreement with Intel for the procurement of these CPUs. Instead, we purchase the CPUs either directly from Intel or through a reseller on a purchase order basis. Intel or its resellers could stop selling to us at any time or could raise their prices without notice. This reliance on a limited number of suppliers and the lack of any guaranteed sources of supply exposes us to several risks, including:
| • | the inability to obtain an adequate supply of key components, including solid-state drives; |
| • | price volatility for the components of our products; |
| • | failure of a supplier to meet our quality or production requirements; |
| • | failure of a supplier of key components to remain in business or adjust to market conditions; and |
| • | consolidation among suppliers, resulting in some suppliers exiting the industry or discontinuing the manufacture of components. |
As a result of these risks, we cannot assure you that we will be able to obtain enough of these key components in the future or that the cost of these components will not increase. If our supply of components is disrupted or delayed, or if we need to replace our existing suppliers, there can be no assurance that additional components will be available when required or that components will be available on terms that are favorable to us, which could extend our lead times, increase the costs of our components and harm our business, operating results and financial condition. Even if we are successful in growing our business, we may not be able to continue to procure components at reasonable prices, which may require us to enter into longer-term contracts with component suppliers to obtain these components at competitive prices. This could increase our costs and decrease our gross margins, harming our business, operating results and financial condition.
Managing the supply of our products and their components is complex. Insufficient supply and inventory may result in lost sales opportunities or delayed revenue, while excess inventory may harm our gross margins.
Our third-party manufacturers procure components and build our products based on our forecasts, and we generally do not hold inventory for a prolonged period of time. These forecasts are based on estimates of future demand for our products, which are in turn based on historical trends and analyses from our sales and marketing organizations, adjusted for overall market conditions. In order to reduce manufacturing lead times and plan for adequate component supply, from time to time we may issue forecasts for components and products that are non-cancelable and non-returnable. Our inventory management systems and related supply chain visibility tools may be inadequate to enable us to make accurate forecasts and effectively manage the supply of our products and components. We have, in the past, had to write off inventory in connection with transitions to new product models. If we ultimately determine that we have excess supply, we may have to reduce our prices and write down or write off excess or obsolete inventory, which in turn could result in lower gross margins. Alternatively, insufficient supply levels may lead to shortages that result in delayed revenue or loss of sales opportunities altogether as potential customers turn to competitors’ products that may be more readily available. If we are unable to effectively manage our supply and inventory, our results of operations could be adversely affected.
19
Table of Contents
If we are unable to sell renewals of our maintenance and support services to our customers, our future revenue and operating results will be harmed.
Existing customers may not renew their maintenance and support agreements after the initial period, and given our limited operating history, we may not be able to accurately predict our renewal rates. Our customers’ renewal rates may decline or fluctuate as a result of a number of factors, including their available budget and the level of their satisfaction with our storage platform, customer support and pricing as compared to that offered by our competitors. If our customers renew their contracts, they may renew on terms that are less economically beneficial to us. We cannot assure you that our customers will renew their maintenance and support agreements, and if our customers do not renew their agreements or renew on less favorable terms, our revenue may grow more slowly than expected, if at all.
We expect that revenue from maintenance and support agreements will increase as a percentage of total revenue over time, and because we recognize this revenue over the term of the relevant contract period, downturns or upturns in sales are not immediately reflected in full in our results of operations.
We expect that revenue from maintenance and support agreements will increase as a percentage of total revenue over time. We recognize maintenance and support revenue ratably over the term of the relevant service period. As a result, much of the maintenance and support revenue we report each quarter is derived from maintenance and support agreements that we sold in prior quarters. Consequently, a decline in new or renewed maintenance and support agreements in any one quarter will not be fully reflected in revenue in that quarter but will negatively affect our revenue in future quarters. Accordingly, the effect of significant downturns in sales of maintenance and support is not reflected in full in our results of operations until future periods. Also, it is difficult for us to rapidly increase our maintenance and support revenue through additional sales in any period, as revenue from renewals must be recognized ratably over the applicable service period.
Adverse economic conditions or reduced datacenter spending may adversely impact our revenues and profitability.
Our operations and performance depend in part on worldwide economic conditions and the impact these conditions have on levels of spending on datacenter technology. Our business depends on the overall demand for datacenter infrastructure and on the economic health of our current and prospective customers. Weak economic conditions, or a reduction in datacenter spending, would likely adversely impact our business, operating results and financial condition in a number of ways, including by reducing sales, lengthening sales cycles and lowering prices for our products and services.
Third-party claims that we are infringing the intellectual property rights of others, whether successful or not, could subject us to costly and time-consuming litigation or require us to obtain expensive licenses, and our business could be harmed.
There is a substantial amount of intellectual property litigation in the flash-based storage industry, and we may become party to, or threatened with, litigation or other adversarial proceedings regarding intellectual property rights with respect to our technology, including interference or derivation proceedings before the U.S. Patent and Trademark Office. Third parties may assert infringement claims against us based on existing or future intellectual property rights. The outcome of intellectual property litigation is subject to uncertainties that cannot be adequately quantified in advance. We have in the past received and may in the future receive inquiries from other intellectual property holders and may become subject to claims that we infringe their intellectual property rights, particularly as we expand our presence in the market and face increasing competition.
For example, in November 2013, EMC Corporation, or EMC, filed a complaint against us in the United States District Court for the District of Massachusetts, alleging that our hiring of EMC employees evidences a scheme to misappropriate EMC’s confidential information and trade secrets and to unlawfully interfere with EMC’s business relationships with its customers and contractual relationships with its employees. In addition, in
20
Table of Contents
November 2013, EMC filed a complaint against us in the United States District Court for the District of Delaware, alleging infringement of five patents held by EMC. While we intend to vigorously defend ourselves in these lawsuits, we are unable to predict the ultimate outcome of this litigation. See the section titled “Business—Legal Proceedings” for more information relating to this litigation.
Any intellectual property rights claim, including the lawsuits brought by EMC, against us or our customers, suppliers, and channel partners, with or without merit, could be time-consuming and expensive to litigate or settle, could divert management’s resources and attention from operating our business and could force us to acquire intellectual property rights and licenses, which may involve substantial royalty payments. Further, a party making such a claim, if successful, could secure a judgment that requires us to pay substantial damages, including treble damages and attorneys’ fees if we are found to have willfully infringed a patent. An adverse determination also could invalidate our intellectual property rights and prevent us from manufacturing and offering our products to our customers and may require that we procure or develop substitute products that do not infringe, which could require significant effort and expense. We may not be able to re-engineer our products successfully to avoid infringement, and we may have to seek a license for the infringed technology, which may not be available on reasonable terms or at all, may significantly increase our operating expenses or may require us to restrict our business activities in one or more respects. Even if we were able to obtain a license, it could be non-exclusive, thereby giving our competitors access to the same technologies licensed to us. Claims that we have misappropriated the confidential information or trade secrets of third parties could have a similar negative impact on our business. Any of these events could harm our business and financial condition.
We currently have a number of agreements in effect pursuant to which we have agreed to defend, indemnify and hold harmless our customers, suppliers and channel partners from damages and costs which may arise from the infringement by our products of third-party patents, trademarks or other proprietary rights. The scope of these indemnity obligations varies, but may, in some instances, include indemnification for damages and expenses, including attorneys’ fees. Our insurance may not cover intellectual property infringement claims. A claim that our products infringe a third party’s intellectual property rights could harm our relationships with our customers, deter future customers from purchasing our products and expose us to costly litigation and settlement expenses. Even if we are not a party to any litigation between a customer and a third party relating to infringement by our products, an adverse outcome in any such litigation could make it more difficult for us to defend our products against intellectual property infringement claims in any subsequent litigation in which we are a named party. Any of these results could harm our brand and financial condition.
The success of our business depends in part on our ability to protect and enforce our intellectual property rights.
We rely on a combination of patent, copyright, service mark, trademark and trade secret laws, as well as confidentiality procedures and contractual restrictions, to establish and protect our proprietary rights, all of which provide only limited protection. As of July 31, 2015, we had over 200 issued patents and over 150 patent applications in the United States and foreign countries. We cannot assure you that any patents will issue with respect to our currently pending patent applications in a manner that gives us the protection that we seek, if at all, or that any patents issued to us will not be challenged, invalidated, circumvented or held to be unenforceable in actions against alleged infringers. Our issued patents and any patents that may issue in the future with respect to pending or future patent applications may not provide sufficiently broad protection or they may not prove to be enforceable in actions against alleged infringers. Changes to the patent laws in the United States and other jurisdictions could also diminish the value of our patents and patent applications or narrow the scope of our patent protection. We cannot be certain that the steps we have taken will prevent unauthorized use of our technology or the reverse engineering of our technology. Moreover, others may independently develop technologies that are competitive to ours or infringe our intellectual property. Furthermore, any of our trademarks may be challenged by others or invalidated through administrative process or litigation.
21
Table of Contents
Protecting against the unauthorized use of our intellectual property, products and other proprietary rights is expensive and difficult. Litigation may be necessary in the future to enforce or defend our intellectual property rights or to determine the validity and scope of the proprietary rights of others. Any such litigation could result in substantial costs and diversion of management’s resources and attention, either of which could harm our business, operating results and financial condition. Further, many of our current and potential competitors have the ability to dedicate substantially greater resources to defending intellectual property infringement claims and to enforcing their intellectual property rights than we have. Accordingly, we may not be able to prevent third parties from infringing upon or misappropriating our intellectual property. Effective patent, trademark, service mark, copyright and trade secret protection may not be available in every country in which our products are available. An inability to adequately protect and enforce our intellectual property and other proprietary rights could harm our business and financial condition.
If we are unable to protect the confidentiality of our trade secrets, the value of our technology could be materially adversely affected and our business could be harmed.
In addition to the protection afforded by patents, we rely on confidential proprietary information, including trade secrets and know-how to develop and maintain our competitive position. Any disclosure to or misappropriation by third parties of our confidential proprietary information could enable competitors to quickly duplicate or surpass our technological achievements, thus eroding our competitive position in our market. We seek to protect our confidential proprietary information, in part, by confidentiality agreements and invention assignment agreements with our employees, consultants, scientific advisors, contractors and collaborators. These agreements are designed to protect our proprietary information; however, we cannot be certain that such agreements have been entered into with all relevant parties, and we cannot be certain that our trade secrets and other confidential proprietary information will not be disclosed or that competitors will not otherwise gain access to our trade secrets or independently develop substantially equivalent information and techniques. For example, any of these parties may breach the agreements and disclose our proprietary information, including our trade secrets, and we may not be able to obtain adequate remedies for such breaches. We also seek to preserve the integrity and confidentiality of our confidential proprietary information by maintaining physical security of our premises and physical and electronic security of our IT systems, but it is possible that these security measures could be breached. If any of our confidential proprietary information were to be lawfully obtained or independently developed by a competitor, we would have no right to prevent such competitor from using that technology or information to compete with us, which could harm our competitive position. Further, the laws of some foreign countries do not protect proprietary rights to the same extent or in the same manner as the laws of the United States. As a result, we may encounter significant problems in protecting and defending our intellectual property both in the United States and abroad. If we are unable to prevent material disclosure of the intellectual property related to our technologies to third parties, we will not be able to establish or maintain a competitive advantage in our market, which could harm our business.
Our use of open source software could impose limitations on our ability to commercialize our products.
We use open source software in our products and expect to continue to use open source software in the future. Although we monitor our use of open source software, the terms of many open source licenses have not been interpreted by U.S. or foreign courts, and there is a risk that such licenses could be construed in a manner that imposes unanticipated conditions or restrictions on our ability to market our products. From time to time, we may face claims from third parties claiming ownership of, or demanding release of, the open source software or derivative works that we have developed using such software, which could include our proprietary source code, or otherwise seeking to enforce the terms of the applicable open source license. These claims could result in litigation and could require us to make our software source code freely available, seek licenses from third parties in order to continue offering our products for certain uses or cease offering the implicated solutions unless and until we can re-engineer them to avoid infringement. This re-engineering process could require significant additional research and development resources, and we may be required to discontinue providing some of our software in the event re-engineering cannot be accomplished on a timely basis, any of which could harm our business, operating results and financial condition.
22
Table of Contents
System security risks, data protection breaches and cyber-attacks on our systems or products could compromise our proprietary information (or information of our customers), disrupt our internal operations and harm public perception of our products, which could cause our business and reputation to suffer, create additional liabilities and adversely affect our financial results and stock price.
In the ordinary course of business, we store sensitive data on our internal systems, networks and servers, which may include intellectual property, our proprietary business information and that of our customers, suppliers and business partners and sales data, which may include personally identifiable information. Additionally, we design and sell products that allow our customers to store our customers’ data. The security of our own networks and the intrusion protection features of our product are both critical to our operations and business strategy.
We devote significant resources to network security, data encryption and other security measures to protect our systems and data, but these security measures cannot provide absolute security. For example, we use encryption and authentication technologies to secure the transmission and storage of data and prevent third party access to data or accounts, but these security measures are subject to third-party security breaches, employee error, malfeasance, faulty password management or other irregularities. Any destructive or intrusive breach of our internal systems could result in the information stored on our networks being accessed, publicly disclosed, lost or stolen. Additionally, an effective attack on our products could disrupt the proper functioning of our products, allow unauthorized access to sensitive, proprietary or confidential information of ours or our customers, disrupt or temporarily interrupt customers’ operations or cause other destructive outcomes, including the theft of information sufficient to engage in fraudulent transactions. The risk that these types of events could seriously harm our business is likely to increase as we expand our network of channel partners, resellers and authorized service providers and operate in more countries. The economic costs to us to eliminate or alleviate cyber or other security problems, viruses, worms, malicious software systems and security vulnerabilities could be significant and may be difficult to anticipate or measure because the damage may differ based on the identity and motive of the programmer or hacker, which are often difficult to identify. If any of these types of security breaches, actual or perceived, were to occur and we were to be unable to protect sensitive data, our relationships with our business partners and customers could be materially damaged, our reputation and brand could be materially harmed, use of our products could decrease and we could be exposed to a risk of loss or litigation and possible liability.
We may further expand through acquisitions of, or investments in, other companies, each of which may divert our management’s attention, resulting in additional dilution to our stockholders and consumption of resources that are necessary to sustain and grow our business.
Our business strategy may, from time to time, include acquiring complementary products, technologies or businesses. We also may enter into relationships with other businesses in order to expand our product offerings, which could involve preferred or exclusive licenses, additional channels of distribution or discount pricing or investments in other companies. Negotiating these transactions can be time-consuming, difficult and expensive, and our ability to close these transactions may be subject to third-party or government approvals, which are beyond our control. Consequently, we can make no assurance that these transactions, once undertaken and announced, will close.
These kinds of acquisitions or investments may result in unforeseen operating difficulties and expenditures. In particular, we may encounter difficulties assimilating or integrating the businesses, technologies, products, personnel or operations of the acquired companies, particularly if the key personnel of the acquired business choose not to work for us, and we may have difficulty retaining the customers of any acquired business. Acquisitions may also disrupt our ongoing business, divert our resources and require significant management attention that would otherwise be available for development of our business. Any acquisition or investment could expose us to unknown liabilities. Moreover, we cannot assure you that the anticipated benefits of any acquisition or investment would be realized or that we would not be exposed to unknown liabilities. In connection with these types of transactions, we may issue additional equity securities that would dilute our stockholders, use cash that we may need in the future to operate our business, incur debt on terms unfavorable to us or that we are unable to
23
Table of Contents
repay, incur large charges or substantial liabilities, encounter difficulties integrating diverse business cultures and become subject to adverse tax consequences, substantial depreciation or deferred compensation charges. These challenges related to acquisitions or investments could harm our business and financial condition.
We are an emerging growth company, and any decision on our part to comply only with certain reduced reporting and disclosure requirements applicable to emerging growth companies could make our Class A common stock less attractive to investors.
We are an emerging growth company, and, for as long as we continue to be an emerging growth company, we may choose to take advantage of exemptions from various reporting requirements applicable to other public companies but not to “emerging growth companies,” including: not being required to have our independent registered public accounting firm audit our internal control over financial reporting under Section 404 of the Sarbanes-Oxley Act, reduced disclosure obligations regarding executive compensation in our periodic reports and proxy statements, and exemptions from the requirements of holding a nonbinding advisory vote on executive compensation and stockholder approval of any golden parachute payments not previously approved. We could be an emerging growth company for up to five years following the completion of this offering. We will remain an emerging growth company until the earliest to occur of (i) the last day of the fiscal year in which we have more than $1.0 billion in annual revenue, (ii) the date we qualify as a “large accelerated filer,” with at least $700 million of equity securities held by non-affiliates, (iii) the date on which we have issued, in any three-year period, more than $1.0 billion in non-convertible debt securities, and (iv) the last day of the fiscal year ending after the fifth anniversary of the completion of this offering. We cannot predict if investors will find our Class A common stock less attractive if we choose to rely on these exemptions. If some investors find our Class A common stock less attractive as a result of any choices we make to avail ourselves of these exemptions, there may be a less active trading market for our Class A common stock and the market price of our Class A common stock may be more volatile.
Under the JOBS Act, emerging growth companies can also delay adopting new or revised accounting standards until such time as those standards apply to private companies. We have irrevocably elected not to avail ourselves of this accommodation allowing for delayed adoption of new or revised accounting standards, and, therefore, we will be subject to the same new or revised accounting standards as other public companies that are not emerging growth companies.
We may require additional capital to support business growth, and this capital might not be available on acceptable terms, or at all.
We intend to continue to make investments to support our business growth and may require additional funds to respond to business challenges, including the need to develop new products or enhance our existing products, enhance our operating infrastructure and acquire complementary businesses and technologies. Accordingly, we may need to engage in equity or debt financings to secure additional funds. If we raise additional funds through further issuances of equity or convertible debt securities, our stockholders could suffer significant dilution, and any new equity securities we issue could have rights, preferences and privileges superior to those of holders of our common stock. Any debt financing in the future could involve additional restrictive covenants relating to our capital raising activities and other financial and operational matters, which may make it more difficult for us to obtain additional capital and to pursue business opportunities, including potential acquisitions. We may not be able to obtain additional financing on terms favorable to us, if at all. If we are unable to obtain adequate financing or financing on terms satisfactory to us, when we require it, our ability to support our business growth and to respond to business challenges could be significantly limited and our prospects and financial condition could be harmed.
24
Table of Contents
We are exposed to the credit risk of some of our customers, which could harm our business, operating results and financial condition.
Most of our sales are made on an open credit basis. As a general matter, we monitor individual customer payment capability when we grant open credit arrangements and may limit these open credit arrangements based on perceived creditworthiness. We also maintain allowances we believe are adequate to cover exposure for doubtful accounts. Although we have programs in place that are designed to monitor and mitigate these risks, we cannot assure you these programs will be effective in managing our credit risks, especially as we expand our business internationally. If we are unable to adequately control these risks, our business, operating results and financial condition could be harmed.
Sales to U.S. federal, state and local governments are subject to a number of challenges and risks that may adversely impact our business.
Sales to U.S. federal, state and local governmental agencies may in the future account for a significant portion of our revenue. Sales to such government entities are subject to the following risks:
| • | selling to governmental agencies can be highly competitive, expensive and time consuming, often requiring significant upfront time and expense without any assurance that such efforts will generate a sale; |
| • | government certification requirements applicable to our products may change and in doing so restrict our ability to sell into the U.S. federal government sector until we have attained the revised certification; |
| • | government demand and payment for our products and services may be impacted by public sector budgetary cycles and funding authorizations, with funding reductions or delays adversely affecting public sector demand for our products and services; |
| • | we sell our products to governmental agencies through our channel partners, and these agencies may have statutory, contractual or other legal rights to terminate contracts with our distributors and resellers for convenience or due to a default, and any such termination may adversely impact our future results of operations; |
| • | governments routinely investigate and audit government contractors’ administrative processes, and any unfavorable audit could result in the government refusing to continue buying our products, which would adversely impact our revenue and results of operations, or institute fines or civil or criminal liability if the audit uncovers improper or illegal activities; and |
| • | governments may require certain products to be manufactured in the United States and other relatively high-cost manufacturing locations, and we may not manufacture all products in locations that meet these requirements, affecting our ability to sell these products to governmental agencies. |
We will need to maintain effective internal control over financial reporting in accordance with Section 404 of the Sarbanes-Oxley Act, and the failure to do so could have a material adverse effect on our business and stock price.
The Sarbanes-Oxley Act requires, among other things, that we maintain effective internal control over financial reporting and disclosure controls and procedures. We will be required to perform system and process evaluation and testing of our internal control over financial reporting to allow management to report on the effectiveness of our internal control over financial reporting, as required by Section 404 of the Sarbanes-Oxley Act, or Section 404. When we are no longer an emerging growth company, our independent registered public accounting firm will also need to attest to the effectiveness of our internal control over financial reporting. Over the last year, we have taken and continue to take additional steps to upgrade our finance and accounting function, including the hiring of additional finance and accounting personnel, and implement additional policies and procedures associated with the financial statement close process. Our compliance with Section 404 may require us to continue to incur substantial expense and expend significant management efforts. If we are unable to
25
Table of Contents
comply with the requirements of Section 404 in a timely manner, or if we or our independent registered public accounting firm notes or identifies deficiencies in our internal control over financial reporting that are deemed to be material weaknesses, the market price of our Class A common stock could decline and we could be subject to sanctions or investigations by the Securities and Exchange Commission, or the SEC, or other regulatory authorities, which would require additional financial and management resources.
Our international operations subject us to potentially adverse tax consequences.
We generally conduct our international operations through wholly-owned subsidiaries and report our taxable income in various jurisdictions worldwide based upon our business operations in those jurisdictions. By the end of 2015, we intend to complete the reorganization of our corporate tax structure and intercompany relationships to more closely align our corporate organization with the expansion of our international business activities. Although we anticipate achieving a reduction in our overall effective tax rate in the future as a result of implementing the new corporate structure, our restructuring efforts will require us to incur expenses in the near term for which we may not realize any benefits.
Our intercompany relationships are, and after the implementation of our new corporate tax structure will continue to be, subject to complex transfer pricing regulations administered by taxing authorities in various jurisdictions. The relevant taxing authorities may disagree with our determinations as to the income and expenses attributable to specific jurisdictions. If such a disagreement were to occur, and our position were not sustained, we could be required to pay additional taxes, interest and penalties, which could result in tax charges, higher effective tax rates, reduced cash flows and lower overall profitability of our operations. In addition, following the implementation of our new corporate tax structure, if the intended tax treatment of the structure is not accepted by the applicable taxing authorities, there are changes in tax law that negatively impact the structure or we do not operate our business consistent with the structure and applicable tax laws and regulations, we may fail to achieve any tax advantages as a result of the new corporate structure, and our future operating results and financial condition may be negatively impacted.
Current U.S. tax laws, including limitations on the ability of taxpayers to claim and utilize foreign tax credits and the deferral of certain tax deductions until earnings outside of the United States are repatriated to the United States, as well as changes to U.S. tax laws that may be enacted in the future, could impact the tax treatment of our foreign earnings. Due to expansion of our international business activities, any changes in the U.S. taxation of such activities may increase our worldwide effective tax rate and adversely affect our financial condition and operating results.
Failure to comply with governmental laws and regulations could harm our business.
Our business is subject to regulation by various federal, state, local and foreign governmental agencies, including agencies responsible for monitoring and enforcing employment and labor laws, workplace safety, product safety, environmental laws, consumer protection laws, anti-bribery laws, import/export controls, federal securities laws and tax laws and regulations. In certain jurisdictions, these regulatory requirements may be more stringent than in the United States. For example, the European Union has adopted certain directives to facilitate the recycling of electrical and electronic equipment sold in the European Union, including the Restriction on the Use of Certain Hazardous Substances in Electrical and Electronic Equipment directive and the Waste Electrical and Electronic Equipment directive. Noncompliance with applicable regulations or requirements could subject us to investigations, sanctions, mandatory product recalls, enforcement actions, disgorgement of profits, fines, damages, civil and criminal penalties or injunctions. If any governmental sanctions are imposed, or if we do not prevail in any possible civil or criminal litigation, our business, operating results and financial condition could be harmed. In addition, responding to any action will likely result in a significant diversion of management’s attention and resources and an increase in professional fees. Enforcement actions and sanctions could harm our business, operating results and financial condition.
26
Table of Contents
Governmental regulations affecting the import or export of products could negatively affect our revenue.
The U.S. and various foreign governments have imposed controls, export license requirements and restrictions on the import or export of some technologies, especially encryption technology. From time to time, governmental agencies have proposed additional regulation of encryption technology, such as requiring the escrow of imports or exports. If we fail to obtain required import or export approval for our products, our international and domestic sales could be harmed and our revenue may be adversely affected. In many cases, we rely on vendors and channel partners to handle logistics associated with the import and export of our products, so our visibility and control over these matters may be limited. In addition, failure to comply with such regulations could result in penalties, costs and restrictions on export privileges, which could harm our business, operating results and financial condition.
Our business is subject to the risks of earthquakes and other natural catastrophic events, and to interruption by man-made factors such as computer viruses or terrorism.
We have operations in locations, including our headquarters in California, that are subject to earthquakes and other natural catastrophic events, such as severe weather and geological events, which could disrupt our operations or the operations of those customers and suppliers. Our customers affected by a natural disaster could postpone or cancel orders of our products, which could negatively impact our business. Moreover, should any of our key suppliers fail to deliver components to us as a result of a natural disaster, we may be unable to purchase these components in necessary quantities or may be forced to purchase components in the open market at significantly higher costs. We may also be forced to purchase components in advance of our normal supply chain demand to avoid potential market shortages. We may not have adequate business interruption insurance to compensate us for losses due to a significant natural disaster or due to man-made factors. In addition, acts of terrorism or malicious computer viruses could cause disruptions in our or our customers’ businesses or the economy as a whole. To the extent that these disruptions result in delays or cancellations of customer orders or the deployment of our products, our business, operating results and financial condition could be harmed.
Risks Related to Our Common Stock
The dual class structure of our common stock has the effect of concentrating voting control with those stockholders who held our capital stock prior to the completion of this offering, including our executive officers, employees and directors and their affiliates, which will limit your ability to influence the outcome of important transactions, including a change in control.
Our Class B common stock has ten votes per share, and our Class A common stock, which is the stock we are selling in this offering, has one vote per share. Upon the closing of this offering, stockholders who hold shares of our Class B common stock, including our executive officers, employees and directors and their affiliates, will collectively hold approximately % of the voting power of our outstanding capital stock. Because of the ten-to-one voting ratio between our Class B common stock and Class A common stock, after the completion of this offering, the holders of our Class B common stock will collectively continue to control a majority of the combined voting power of our capital stock and therefore be able to control all matters submitted to our stockholders for approval so long as the shares of our Class B common stock represent at least % of all outstanding shares of our Class A common stock and Class B common stock. These holders of our Class B common stock may also have interests that differ from yours and may vote in a way with which you disagree and which may be adverse to your interests. This concentrated control may have the effect of delaying, preventing or deterring a change in control of our company, could deprive our stockholders of an opportunity to receive a premium for their capital stock as part of a sale of our company and might ultimately affect the market price of our Class A common stock.
Future transfers by holders of our Class B common stock will generally result in those shares converting into shares of our Class A common stock, subject to limited exceptions, such as certain transfers effected for estate planning purposes. The conversion of shares of our Class B common stock into shares of our Class A
27
Table of Contents
common stock will have the effect, over time, of increasing the relative voting power of those holders of Class B common stock who retain their shares in the long term. If, for example, Dr. Dietzen and Messrs. Colgrove and Hatfield retain a significant portion of their holdings of our Class B common stock for an extended period of time, they could control a significant portion of the voting power of our capital stock for the foreseeable future. As board members, Dr. Dietzen and Mr. Colgrove each owe a fiduciary duty to our stockholders and must act in good faith and in a manner they reasonably believe to be in the best interests of our stockholders. However, as stockholders, Dr. Dietzen and Messrs. Colgrove and Hatfield are entitled to vote their shares in their own interests, which may not always be in the interests of our stockholders generally. For a description of the dual class structure, see the section titled “Description of Capital Stock.”
Future sales of shares by existing stockholders could cause our stock price to decline.
If our existing stockholders sell, or indicate an intention to sell, substantial amounts of our Class A common stock in the public market after the lock-up and legal restrictions on resale discussed in this prospectus lapse, the trading price of our Class A common stock could decline. Based on shares outstanding as of July 31, 2015, upon the closing of this offering, we will have outstanding a total of shares of Class A common stock and 160,056,764 shares of Class B common stock, assuming no exercise of the underwriters’ overallotment option and no exercise of outstanding options, after giving effect to the conversion of all outstanding shares of our preferred stock into shares of Class B common stock upon the closing of this offering. Of these shares, only the shares of Class A common stock sold in this offering will be freely tradable, without restriction, in the public market immediately after the offering. Each of our directors and officers and other holders of substantially all of our outstanding shares have entered into lock-up agreements with the underwriters that restrict their ability to sell or transfer their shares. The lock-up agreements pertaining to this offering will expire 180 days from the date of this prospectus. Our underwriters, however, may, in their sole discretion, waive the contractual lock-up prior to the expiration of the lock-up agreements. After the lock-up agreements expire, all 160,056,764 shares outstanding as July 31, 2015 will be eligible for sale in the public market, of which 109,815,640 shares are held by directors, executive officers and other affiliates and will be subject to volume limitations under Rule 144 under the Securities Act of 1933, as amended, or the Securities Act, and various vesting agreements. In addition, 59,928,620 shares of Class B common stock are subject to outstanding options as of July 31, 2015. These shares will become eligible for sale in the public market to the extent permitted by the provisions of various vesting agreements, the lock-up agreements and Rules 144 and 701 under the Securities Act. We intend to file a registration statement on Form S-8 under the Securities Act covering all of the shares of Class A and Class B common stock subject to options outstanding and reserved for issuance under our stock plans. This registration statement will become effective immediately upon filing, and shares covered by this registration statement will be eligible for sale in the public markets, subject to Rule 144 limitations applicable to affiliates and any lock-up agreements described above. If these additional shares are sold, or if it is perceived that they will be sold, in the public market, the trading price of our Class A common stock could decline.
There has been no prior market for our Class A common stock. An active market may not develop or be sustained and investors may not be able to resell their shares at or above the initial public offering price.
Our Class A common stock has been approved for listing on the New York Stock Exchange, or NYSE, under the trading symbol “PSTG.” However, we cannot assure you that an active trading market for our Class A common stock will develop on such exchange or elsewhere or, if developed, that any market will be sustained. We cannot predict the prices at which our Class A common stock will trade. The initial public offering price of our Class A common stock was determined by negotiations with the underwriters and may not bear any relationship to the market price at which our Class A common stock will trade after this offering or to any other established criteria of the value of our business.
28
Table of Contents
The trading price of our Class A common stock may be highly volatile, and an active, liquid, and orderly market for our Class A common stock may not be sustained.
The trading price of our Class A common stock may be highly volatile and could be subject to wide fluctuations in response to various factors, some of which are beyond our control. Some of the factors affecting our volatility may include:
| • | price and volume fluctuations in the overall stock market from time to time; |
| • | significant volatility in the market price and trading volume of technology companies in general and of companies in our industry; |
| • | actual or anticipated changes in our results of operations or fluctuations in our operating results; |
| • | whether our operating results meet the expectations of securities analysts or investors; |
| • | actual or anticipated changes in the expectations of investors or securities analysts; |
| • | actual or anticipated developments in our competitors’ businesses or the competitive landscape generally; |
| • | litigation involving us, our industry or both; |
| • | general economic conditions and trends; |
| • | major catastrophic events; |
| • | sales of large blocks of our stock; or |
| • | departures of key personnel. |
The stock markets in general, and market prices for the securities of technology-based companies like ours in particular, have from time to time experienced volatility that often has been unrelated to the operating performance of the underlying companies. A certain degree of stock price volatility can be attributed to being a newly public company. These broad market and industry fluctuations may adversely affect the market price of our Class A common stock, regardless of our operating performance. In several recent situations where the market price of a stock has been volatile, holders of that stock have instituted securities class action litigation against the company that issued the stock. If any of our stockholders were to bring a lawsuit against us, the defense and disposition of the lawsuit could be costly and divert the time and attention of our management and harm our business, operating results and financial condition.
Purchasers in this offering will experience immediate and substantial dilution in the tangible net book value of their investment.
The assumed initial public offering price of our Class A common stock is substantially higher than the net tangible book value per share of our Class A common stock immediately after this offering. Therefore, if you purchase our Class A common stock in this offering, you will incur an immediate dilution of $ in net tangible book value per share from the price you paid, based on the assumed initial public offering price of $ per share. In addition, new investors who purchase shares in this offering will have contributed approximately % of the total amount of equity capital raised by us through the date of this offering, but will only own approximately % of our outstanding shares. The exercise of outstanding options will result in further dilution. For a further description of the dilution that you will experience immediately after this offering, see the section titled “Dilution.”
If securities analysts do not publish research or reports about our business, or if they downgrade our stock, the price of our stock could decline.
The trading market for our Class A common stock will likely be influenced by research and reports that securities or industry analysts publish about us or our business. In the event securities or industry analysts cover our company and one or more of these analysts downgrade our stock or publish inaccurate or unfavorable
29
Table of Contents
research about our business, our stock price would likely decline. If one or more of these analysts ceases coverage of our company or fails to publish reports on us regularly, demand for our stock could decrease, which could cause our stock price and trading volume to decline.
We have never paid dividends on our common stock and we do not anticipate paying any cash dividends in the foreseeable future.
We have never declared or paid any dividends on our common stock. We intend to retain any earnings to finance the operation and expansion of our business, and we do not anticipate paying any cash dividends in the future. As a result, you may only receive a return on your investment in our Class A common stock if the market price of our common stock increases.
We will continue to incur increased costs as a result of being a public company.
As a public company, we expect to incur significant legal, accounting and other expenses that we did not incur as a private company. In addition, new rules implemented by the SEC and NYSE require changes in corporate governance practices of public companies. We expect these rules and regulations to continue to increase our legal and financial compliance costs and to make some activities more time-consuming and costly. We will continue to incur additional costs associated with our public company reporting requirements. We expect these rules and regulations to make it more difficult and more expensive for us to obtain director and officer liability insurance, and we may be required to accept reduced policy limits and coverage or incur substantially higher costs to obtain the same or similar coverage. As a result, it may be more difficult for us to attract and retain qualified people to serve on our board of directors or as executive officers.
We may invest or spend the proceeds of this offering in ways with which you may not agree or in ways which may not yield a return.
Our net proceeds from the sale of shares of our Class A common stock in this offering will be used for general corporate purposes, including working capital, operating expenses and capital expenditures. Additionally, we may use a portion of the net proceeds to acquire businesses, products, services or technologies. However, we do not have agreements or commitments for any specific material acquisitions at this time. Our management will have considerable discretion in the application of the net proceeds, and you will not have the opportunity, as part of your investment decision, to assess whether the proceeds are being used appropriately. Until the net proceeds are used, they may be placed in investments that do not produce significant income or that may lose value.
Provisions in our amended and restated certificate of incorporation and amended and restated bylaws and under Delaware law might discourage, delay or prevent a change of control of our company or changes in our management and, therefore, depress the trading price of our Class A common stock.
Our amended and restated certificate of incorporation and amended and restated bylaws contain provisions that could depress the trading price of our Class A common stock by acting to discourage, delay or prevent a change of control of our company or changes in our management that the stockholders of our company may deem advantageous. These provisions:
| • | provide for a dual class common stock structure, so that certain stockholders will have significant influence over all matters requiring stockholder approval, including the election of directors and significant corporate transactions, such as a merger or other sale of our company or its assets and which could discourage others from initiating any potential merger, takeover or other change of control transaction that other stockholders may view as beneficial; |
| • | establish a classified board of directors so that not all members of our board of directors are elected at one time; |
| • | authorize the issuance of “blank check” preferred stock that our board of directors could issue to increase the number of outstanding shares to discourage a takeover attempt; |
30
Table of Contents
| • | prohibit stockholder action by written consent, which requires all stockholder actions to be taken at a meeting of our stockholders; |
| • | prohibit stockholders from calling a special meeting of our stockholders; |
| • | provide that the board of directors is expressly authorized to make, alter or repeal our bylaws; and |
| • | establish advance notice requirements for nominations for elections to our board of directors or for proposing matters that can be acted upon by stockholders at stockholder meetings. |
Additionally, we are subject to Section 203 of the Delaware General Corporation Law, which generally prohibits a Delaware corporation from engaging in any of a broad range of business combinations with any “interested” stockholder for a period of three years following the date on which the stockholder became an “interested” stockholder and which may discourage, delay, or prevent a change of control of our company.
Any provision of our amended and restated certificate of incorporation, bylaws or Delaware law that has the effect of delaying or deterring a change in control could limit the opportunity for our stockholders to receive a premium for their shares of our common stock, and could also affect the price that some investors are willing to pay for our Class A common stock.
Our amended and restated certificate of incorporation will provide that the Court of Chancery of the State of Delaware will be the exclusive forum for substantially all disputes between us and our stockholders, which could limit our stockholders’ ability to obtain a favorable judicial forum for disputes with us or our directors, officers or employees.
Our amended and restated certificate of incorporation provides that the Court of Chancery of the State of Delaware is the exclusive forum for any derivative action or proceeding brought on our behalf; any action asserting a breach of fiduciary duty; any action asserting a claim against us arising pursuant to the Delaware General Corporation Law, our amended and restated certificate of incorporation or our bylaws; or any action asserting a claim against us that is governed by the internal affairs doctrine. The choice of forum provision may limit a stockholder’s ability to bring a claim in a judicial forum that it finds favorable for disputes with us or our directors, officers or other employees, which may discourage such lawsuits against us and our directors, officers and other employees. If a court were to find the choice of forum provision contained in our amended and restated certificate of incorporation to be inapplicable or unenforceable in an action, we may incur additional costs associated with resolving such action in other jurisdictions, which could harm our business and financial condition.
31
Table of Contents
SPECIAL NOTE REGARDING FORWARD-LOOKING STATEMENTS
This prospectus contains forward-looking statements about us and our industry that involve substantial risks and uncertainties. All statements other than statements of historical facts contained in this prospectus, including statements regarding our future results of operations and financial condition, business strategy and plans and objectives of management for future operations, are forward-looking statements. In some cases, you can identify forward-looking statements by words such as “anticipate,” “believe,” “continue,” “could,” “design,” “estimate,” “expect,” “intend,” “may,” “plan,” “potentially,” “predict,” “project,” “should,” “will” or the negative of these terms or other similar expressions.
We have based these forward-looking statements largely on our current expectations and projections about future events and financial trends that we believe may affect our financial condition, results of operations, business strategy and financial needs. These forward-looking statements are subject to a number of known and unknown risks, uncertainties and assumptions, including risks described in the section titled “Risk Factors.” These risks are not exhaustive. Other sections of this prospectus include additional factors that could harm our business and financial performance. Moreover, we operate in a very competitive and rapidly changing environment. New risk factors emerge from time to time, and it is not possible for our management to predict all risk factors nor can we assess the impact of all factors on our business or the extent to which any factor, or combination of factors, may cause actual results to differ from those contained in, or implied by, any forward-looking statements.
You should not rely upon forward-looking statements as predictions of future events. We cannot assure you that the events and circumstances reflected in the forward-looking statements will be achieved or occur. Although we believe that the expectations reflected in the forward-looking statements are reasonable, we cannot guarantee future results, levels of activity, performance or achievements. Except as required by law, we undertake no obligation to update publicly any forward-looking statements for any reason after the date of this prospectus or to conform these statements to actual results or to changes in our expectations.
You should read this prospectus and the documents that we reference in this prospectus and have filed as exhibits to the registration statement of which this prospectus is a part with the understanding that our actual future results, levels of activity, performance and achievements may be materially different from what we expect. We qualify all of our forward-looking statements by these cautionary statements.
32
Table of Contents
Unless otherwise indicated, information contained in this prospectus concerning our industry and the market in which we operate, including our general expectations and market position, market opportunity and market size, is based on information from various sources including the independent industry publications set forth below, and is subject to a number of assumptions and limitations. Although we are responsible for all of the disclosure contained in this prospectus and we believe the information from the industry publication and other third-party sources included in this prospectus is reliable, such information is inherently imprecise. The content of the below sources, except to the extent specifically set forth in this prospectus, do not constitute a portion of this prospectus and are not incorporated herein.
| • | IDC Worldwide Enterprise Storage Systems 2014-2018 Forecast Update (May 2015) |
| • | IDC Worldwide Semiannual Software Tracker 2014H1 (November 2014) |
| • | IDC Worldwide All-Flash Array and Hybrid Flash Array 2014-2018 Forecast and 1H14 Vendor Shares (November 2014) |
The industry in which we operate is subject to a high degree of uncertainty and risk due to a variety of factors, including those described in the section titled “Risk Factors” and elsewhere in this prospectus. These and other factors could cause results to differ materially from those expressed in the estimates made by the independent parties and by us.
33
Table of Contents
We estimate that the net proceeds from the sale of shares of Class A common stock in this offering will be approximately $ million at an assumed initial public offering price of $ per share, the midpoint of the price range set forth on the cover page of this prospectus, after deducting underwriting discounts and commissions and estimated offering expenses payable by us. If the underwriters exercise their over-allotment option in full, we estimate that the net proceeds will be approximately $ million after deducting underwriting discounts and commissions and estimated offering expenses payable by us.
Each $1.00 increase or decrease in the assumed initial public offering price of $ per share would increase or decrease, respectively, our net proceeds by $ million, assuming the number of shares offered by us, as set forth on the cover page of this prospectus, remains the same and after deducting underwriting discounts and commissions and estimated offering expenses payable by us. We may also increase or decrease the number of shares we are offering. An increase or decrease of 1,000,000 in the number of shares we are offering would increase or decrease, respectively, the net proceeds from this offering by approximately $ million, assuming the assumed initial public offering price remains the same and after deducting underwriting discounts and commissions.
The principal purposes of this offering are to increase our capitalization and financial flexibility, increase our visibility in the marketplace and create a public market for our Class A common stock. As of the date of this prospectus, we cannot specify with certainty all of the particular uses for the net proceeds to us from this offering. However, we currently intend to use the net proceeds from this offering primarily for general corporate purposes, including expansion of our product development and sales and marketing organizations. We may also use a portion of the net proceeds from this offering for the acquisition of, or investment in, technologies, solutions or businesses that complement our business, although we have no commitments or agreements to enter into any such acquisitions or investments at this time. Accordingly, we will have broad discretion over the uses of the net proceeds from this offering. Pending these uses, we intend to invest the net proceeds from this offering in short-term, investment-grade interest-bearing securities such as money market funds, certificates of deposit, commercial paper and guaranteed obligations of the U.S. government.
We have never declared or paid cash dividends on our capital stock. We intend to retain all available funds and future earnings, if any, to fund the development and expansion of our business and we do not anticipate paying any cash dividends in the foreseeable future. The terms of our outstanding loan and security agreement also restrict our ability to pay dividends, and we may also enter into credit agreements or other borrowing arrangements in the future that will restrict our ability to declare or pay cash dividends on our common stock. Any future determination related to dividend policy will be made at the discretion of our board of directors and will be dependent on a number of factors, including our earnings, capital requirements and overall financial conditions.
34
Table of Contents
The following table sets forth our cash and cash equivalents and capitalization as of July 31, 2015 on:
| • | an actual basis; |
| • | a pro forma basis, to reflect (i) the conversion of all outstanding shares of preferred stock into 122,280,679 shares of Class B common stock upon the closing of this offering and (ii) the filing and effectiveness of our amended and restated certificate of incorporation; and |
| • | a pro forma as adjusted basis, to give further effect to the sale by us of shares of Class A common stock in this offering at an assumed initial public offering price of $ per share, the midpoint of the price range set forth on the cover page of this prospectus, after deducting underwriting discounts and commissions and estimated offering expenses payable by us. |
You should read this information together with our consolidated financial statements and related notes appearing elsewhere in this prospectus and the sections titled “Selected Consolidated Financial Data” and “Management’s Discussion and Analysis of Financial Condition and Results of Operations.”
| As of July 31, 2015 | ||||||||||||
| Actual | Pro Forma | Pro Forma As Adjusted(1) |
||||||||||
| (in thousands, except share and per share data) |
||||||||||||
| Cash and cash equivalents |
$ | 128,282 | $ | 128,282 | $ | |||||||
|
|
|
|
|
|
|
|||||||
| Convertible preferred stock, $0.0001 par value: 123,879,952 shares authorized, 122,280,679 shares issued and outstanding, actual; no shares authorized, issued and outstanding, pro forma and pro forma as adjusted |
$ | 543,940 | $ | — | $ | — | ||||||
| Stockholders’ (deficit) equity: |
||||||||||||
| Preferred stock, $0.0001 par value: no shares authorized, issued and outstanding, actual; 20,000,000 shares authorized, no shares issued and outstanding, pro forma and pro forma as adjusted |
— | — | ||||||||||
| Class A common stock, $0.0001 par value: 1,000 shares authorized, no shares issued and outstanding, actual; 2,000,000,000 shares authorized, no shares issued and outstanding, pro forma; 2,000,000,000 shares authorized, shares issued and outstanding, pro forma as adjusted |
— | — | ||||||||||
| Class B common stock, $0.0001 par value: 252,811,295 shares authorized, 37,776,085 shares issued and outstanding, actual; 250,000,000 shares authorized, 160,056,764 shares issued and outstanding, pro forma and pro forma as adjusted |
4 | 16 | ||||||||||
| Additional paid-in capital |
66,508 | 610,436 | ||||||||||
| Accumulated deficit |
(454,540 | ) | (454,540 | ) | ||||||||
|
|
|
|
|
|
|
|||||||
| Total stockholders’ (deficit) equity |
(388,028 | ) | 155,912 | |||||||||
|
|
|
|
|
|
|
|||||||
| Total capitalization |
$ | 155,912 | $ | 155,912 | $ | |||||||
|
|
|
|
|
|
|
|||||||
| (1) | Each $1.00 increase or decrease in the assumed initial public offering price of $ per share, the midpoint of the price range set forth on the cover page of this prospectus, would increase or decrease, respectively, the amount of cash and cash equivalents, additional paid-in capital, total stockholders’ (deficit) equity and total capitalization by $ million, assuming the number of shares offered by us, as set forth on the cover page of this prospectus, remains the same and after deducting underwriting discounts and commissions and estimated offering expenses payable by us. We may also increase or decrease the number of shares we are offering. An increase or decrease of 1,000,000 in the number of shares we are offering would increase or decrease, respectively, the amount of cash and cash equivalents, stockholders’ (deficit) equity and total capitalization by approximately $ million, assuming the assumed initial public |
35
Table of Contents
| offering price per share remains the same, and after deducting underwriting discounts and commissions. The pro forma as adjusted information is illustrative only, and we will adjust this information based on the actual initial public offering price and other terms of this offering determined at pricing. |
The table above excludes the following shares:
| • | 59,928,620 shares of Class B common stock issuable upon the exercise of outstanding stock options as of July 31, 2015 under our 2009 Equity Incentive Plan with a weighted-average exercise price of $4.53 per share; |
| • | 15,102,581 shares of Class B common stock reserved for future issuance under our 2009 Equity Incentive Plan, which shares will cease to be available for issuance at the time our 2015 Equity Incentive Plan becomes effective in connection with this offering; |
| • | 700,000 shares of Class B common stock that we issued in September 2015 to the Pure Good Foundation; |
| • | 27,000,000 shares of Class A common stock reserved for future issuance under our 2015 Equity Incentive Plan, as well as any automatic increases in the number of shares of Class A common stock reserved for future issuance under this plan, which will become effective upon the execution of the underwriting agreement for this offering; and |
| • | 3,500,000 shares of Class A common stock reserved for future issuance under our 2015 Employee Stock Purchase Plan, as well as any automatic increases in the number of shares of Class A common stock reserved for future issuance under this plan, which will become effective upon the execution of the underwriting agreement for this offering. |
36
Table of Contents
If you invest in our Class A common stock in this offering, your interest will be diluted to the extent of the difference between the initial public offering price per share of our Class A common stock and the pro forma as adjusted net tangible book value per share of our common stock immediately after the closing of this offering.
Our pro forma net tangible book value of our common stock as of July 31, 2015 was $148.3 million, or $0.93 per share, based on the total number of shares of our common stock outstanding as of July 31, 2015. Pro forma net tangible book value per share represents our total tangible assets less our total liabilities, divided by the number of outstanding shares of Class A and Class B common stock, after giving effect to the conversion of all outstanding shares of preferred stock into 122,280,679 shares of Class B common stock immediately upon the closing of this offering.
After giving effect to the receipt of the net proceeds from our sale of shares of Class A common stock in this offering at an assumed initial public offering price of $ per share, the midpoint of the price range set forth on the cover page of this prospectus, after deducting underwriting discounts and commissions and estimated offering expenses payable by us, our pro forma as adjusted net tangible book value as of July 31, 2015, would have been $ million, or $ per share. This represents an immediate increase in pro forma as adjusted net tangible book value of $ per share to our existing stockholders and an immediate dilution of $ per share to investors purchasing Class A common stock in this offering.
The following table illustrates this dilution on a per share basis to new investors:
| Assumed initial public offering price per share |
$ | |||||||
| Pro forma net tangible book value per share as of July 31, 2015 |
$ | 0.93 | ||||||
| Increase in pro forma net tangible book value per share attributable to new investors in this offering |
||||||||
|
|
|
|||||||
| Pro forma as adjusted net tangible book value per share after this offering |
||||||||
|
|
|
|||||||
| Dilution in net tangible book value per share to new investors in this offering |
$ | |||||||
|
|
|
Each $1.00 increase (decrease) in the assumed initial public offering price of $ would increase (decrease) our pro forma as adjusted net tangible book value per share after this offering by $ per share and the dilution to new investors by $ per share, assuming the number of shares offered by us, as set forth on the cover page of this prospectus, remains the same and after deducting underwriting discounts and commissions and estimated offering expenses payable by us. Similarly, each increase (decrease) of 1,000,000 shares in the number of shares of Class A common stock offered by us would increase (decrease) the pro forma as adjusted net tangible book value by $ per share and the dilution to new investors by $ per share, assuming the assumed initial public offering price remains the same and after deducting underwriting discounts and commissions.
If the underwriters’ option to purchase additional shares to cover over-allotments is exercised in full, the pro forma as adjusted net tangible book value per share after giving effect to this offering would be $ per share, representing an immediate increase to existing stockholders of $ per share, and immediate dilution to new investors in this offering of $ per share.
The following table summarizes, as of July 31, 2015, on the pro forma as adjusted basis described above:
| • | the total number of shares of Class A common stock purchased from us by our existing stockholders and by new investors purchasing shares in this offering; |
| • | the total consideration paid to us by our existing stockholders and by new investors purchasing Class A common stock in this offering, assuming an initial public offering price of $ per share, which is |
37
Table of Contents
| the midpoint of the price range set forth on the cover page of this prospectus, before deducting underwriting discounts and commissions and estimated offering expenses payable by us in connection with this offering; and |
| • | the average price per share paid by existing stockholders and by new investors purchasing shares in this offering. |
| Shares Purchased | Total Consideration | Average Price Per Share |
||||||||||||||||||
| Number | Percent | Amount | Percent | |||||||||||||||||
| Existing stockholders |
160,056,764 | % | $ | % | $ | |||||||||||||||
| New investors |
||||||||||||||||||||
|
|
|
|
|
|
|
|
|
|||||||||||||
| Total |
100.0 | % | $ | 100.0 | % | |||||||||||||||
|
|
|
|
|
|
|
|
|
|||||||||||||
The total number of shares of our common stock reflected in the discussion and tables above is based on no shares of Class A common stock and 160,056,764 shares of Class B common stock outstanding, as of July 31, 2015, and excludes:
| • | 59,928,620 shares of Class B common stock issuable upon the exercise of outstanding stock options as of July 31, 2015 under our 2009 Equity Incentive Plan with a weighted-average exercise price of $4.53 per share; |
| • | 15,102,581 shares of Class B common stock reserved for future issuance under our 2009 Equity Incentive Plan, which shares will cease to be available for issuance at the time our 2015 Equity Incentive Plan becomes effective in connection with this offering; |
| • | 700,000 shares of Class B common stock that we issued in September 2015 to the Pure Good Foundation; |
| • | 27,000,000 shares of Class A common stock reserved for future issuance under our 2015 Equity Incentive Plan, as well as any automatic increases in the number of shares of Class A common stock reserved for future issuance under this plan, which we plan to adopt in connection with this offering and will become effective upon the signing of the underwriting agreement for this offering; and |
| • | 3,500,000 shares of Class A common stock reserved for future issuance under our 2015 Employee Stock Purchase Plan, as well as any automatic increases in the number of shares of Class A common stock reserved for future issuance under this plan, which will become effective upon the execution of the underwriting agreement for this offering. |
A $1.00 increase (decrease) in the assumed initial public offering price of $ per share would increase (decrease) total consideration paid by new investors by $ million and increase (decrease) the total consideration paid to us by new investors by %, assuming the number of shares offered by us, as set forth on the cover page of this prospectus, remains the same and after deducting underwriting discounts and commissions and estimated offering expenses payable by us.
To the extent that any outstanding options are exercised, new options are issued under our stock-based compensation plans or we issue additional shares of common stock in the future, there will be further dilution to investors participating in this offering. If all outstanding options under our 2009 Equity Incentive Plan as of July 31, 2015 were exercised, then our existing stockholders, including the holders of these options, would own % and our new investors would own % of the total number of shares of common stock outstanding upon the closing of this offering.
38
Table of Contents
SELECTED CONSOLIDATED FINANCIAL DATA
The selected consolidated statements of operations data for the fiscal years ended January 31, 2014 and 2015 and the consolidated balance sheet data as of January 31, 2014 and 2015 are derived from our audited consolidated financial statements included elsewhere in this prospectus. The selected consolidated statements of operations data for the fiscal year ended January 31, 2013 and the consolidated balance sheet data as of January 31, 2013 are derived from our unaudited consolidated financial statements not included in this prospectus. The selected consolidated statements of operations data for the six months ended July 31, 2014 and 2015 and the consolidated balance sheet data as of July 31, 2015 are derived from our unaudited consolidated financial statements included elsewhere in this prospectus. The unaudited consolidated financial statements were prepared on a basis consistent with our audited financial statements. Our historical results are not necessarily indicative of the results that may be expected in any future period and our results for the six months ended July 31, 2015 are not necessarily indicative of the results that may be expected for the full fiscal year. The selected consolidated financial data below should be read in conjunction with the section entitled “Management’s Discussion and Analysis of Financial Condition and Results of Operations” and our consolidated financial statements and related notes included elsewhere in this prospectus.
| Fiscal Year Ended January 31, |
Six Months Ended July 31, |
|||||||||||||||||||
| 2013 | 2014 | 2015 | 2014 | 2015 | ||||||||||||||||
| (unaudited) | ||||||||||||||||||||
| (in thousands, except per share data) | ||||||||||||||||||||
| Consolidated Statements of Operations Data: |
||||||||||||||||||||
| Revenue: |
||||||||||||||||||||
| Product |
$ | 5,474 | $ | 39,228 | $ | 154,836 | $ | 53,253 | $ | 134,810 | ||||||||||
| Support |
603 | 3,505 | 19,615 | 6,159 | 23,928 | |||||||||||||||
|
|
|
|
|
|
|
|
|
|
|
|||||||||||
| Total revenue |
6,077 | 42,733 | 174,451 | 59,412 | 158,738 | |||||||||||||||
| Cost of revenue: |
||||||||||||||||||||
| Product(1) |
3,605 | 19,974 | 63,425 | 22,608 | 50,353 | |||||||||||||||
| Support(1) |
709 | 4,155 | 14,127 | 4,924 | 14,421 | |||||||||||||||
|
|
|
|
|
|
|
|
|
|
|
|||||||||||
| Total cost of revenue |
4,314 | 24,129 | 77,552 | 27,532 | 64,774 | |||||||||||||||
|
|
|
|
|
|
|
|
|
|
|
|||||||||||
| Gross profit |
1,763 | 18,604 | 96,899 | 31,880 | 93,964 | |||||||||||||||
| Operating expenses: |
||||||||||||||||||||
| Research and development(1) |
12,383 | 36,081 | 92,707 | 40,533 | 69,870 | |||||||||||||||
| Sales and marketing(1) |
10,727 | 54,750 | 152,320 | 71,563 | 107,844 | |||||||||||||||
| General and administrative(1) |
2,017 | 5,902 | 32,354 | 14,419 | 27,919 | |||||||||||||||
|
|
|
|
|
|
|
|
|
|
|
|||||||||||
| Total operating expenses |
25,127 | 96,733 | 277,381 | 126,515 | 205,633 | |||||||||||||||
|
|
|
|
|
|
|
|
|
|
|
|||||||||||
| Loss from operations |
(23,364 | ) | (78,129 | ) | (180,482 | ) | (94,635 | ) | (111,669 | ) | ||||||||||
| Other income (expense), net |
(6 | ) | (141 | ) | (1,412 | ) | (307 | ) | (1,074 | ) | ||||||||||
|
|
|
|
|
|
|
|
|
|
|
|||||||||||
| Loss before provision for income taxes |
(23,370 | ) | (78,270 | ) | (181,894 | ) | (94,942 | ) | (112,743 | ) | ||||||||||
| Provision for income taxes |
2 | 291 | 1,337 | 257 | 214 | |||||||||||||||
|
|
|
|
|
|
|
|
|
|
|
|||||||||||
| Net loss |
$ | (23,372 | ) | $ | (78,561 | ) | $ | (183,231 | ) | $ | (95,199 | ) | $ | (112,957 | ) | |||||
|
|
|
|
|
|
|
|
|
|
|
|||||||||||
| Net loss per share attributable to common stockholders, basic and diluted(2) |
$ | (1.28 | ) | $ | (3.24 | ) | $ | (6.56 | ) | $ | (3.66 | ) | $ | (3.41 | ) | |||||
|
|
|
|
|
|
|
|
|
|
|
|||||||||||
| Weighted-average shares used in computing net loss per share attributable to common stockholders, basic and diluted(2) |
18,239 | 24,237 | 27,925 | 25,976 | 33,154 | |||||||||||||||
|
|
|
|
|
|
|
|
|
|
|
|||||||||||
| Pro forma net loss per share attributable to common stockholders, basic and diluted(2) |
$ | (1.26 | ) | $ | (0.73 | ) | ||||||||||||||
|
|
|
|
|
|||||||||||||||||
| Weighted-average shares used in computing pro forma net loss per share attributable to common stockholders, basic and diluted(2) |
145,719 | 155,435 | ||||||||||||||||||
|
|
|
|
|
|||||||||||||||||
| (1) | Includes stock-based compensation expense as follows: |
39
Table of Contents
| Fiscal Year Ended January 31, |
Six Months Ended July 31, |
|||||||||||||||||||
| 2013 | 2014 | 2015 | 2014 | 2015 | ||||||||||||||||
| (unaudited) | ||||||||||||||||||||
| (in thousands) | ||||||||||||||||||||
| Cost of revenue—product |
$ | 66 | $ | 253 | $ | 303 | $ | 229 | $ | 96 | ||||||||||
| Cost of revenue—support |
— | 316 | 1,273 | 898 | 854 | |||||||||||||||
| Research and development |
752 | 11,477 | 22,512 | 15,147 | 10,429 | |||||||||||||||
| Sales and marketing |
342 | 9,014 | 22,466 | 17,361 | 5,980 | |||||||||||||||
| General and administrative |
256 | 506 | 6,479 | 4,508 | 3,300 | |||||||||||||||
|
|
|
|
|
|
|
|
|
|
|
|||||||||||
| Total stock-based compensation expense |
$ | 1,416 | $ | 21,566 | $ | 53,033 | $ | 38,143 | $ | 20,659 | ||||||||||
|
|
|
|
|
|
|
|
|
|
|
|||||||||||
Stock-based compensation expense for the fiscal years ended January 31, 2014 and 2015 and the six months ended July 31, 2014 included $13.3 million, $27.6 million, and $27.6 million, respectively, of cash paid for the repurchase of common stock in excess of fair value. See Note 9 to our consolidated financial statements for additional information.
| (2) | See Note 10 to our consolidated financial statements for an explanation of the method used to calculate our actual and pro forma basic and diluted net loss per share attributable to common stockholders and the weighted-average number of shares used in the computation of the per share amounts. |
| As of January 31, | As of July 31, 2015 |
|||||||||||||||
| 2013 | 2014 | 2015 | ||||||||||||||
| (unaudited) | ||||||||||||||||
| (in thousands) | ||||||||||||||||
| Consolidated Balance Sheet Data: |
||||||||||||||||
| Cash and cash equivalents |
$ | 50,120 | $ | 130,885 | $ | 192,707 | $ | 128,282 | ||||||||
| Working capital |
52,621 | 134,779 | 218,533 | 147,554 | ||||||||||||
| Total assets |
61,600 | 185,004 | 361,819 | 336,563 | ||||||||||||
| Deferred revenue, current and noncurrent portion |
1,686 | 16,827 | 73,669 | 123,482 | ||||||||||||
| Convertible preferred stock |
95,137 | 262,970 | 543,940 | 543,940 | ||||||||||||
| Total stockholders’ deficit |
$ | (39,150 | ) | $ | (116,087 | ) | $ | (299,830 | ) | $ | (388,028 | ) | ||||
40
Table of Contents
MANAGEMENT’S DISCUSSION AND ANALYSIS OF FINANCIAL CONDITION
AND RESULTS OF OPERATIONS
The following discussion and analysis of our financial condition and results of operations should be read in conjunction with the section titled “Selected Consolidated Financial Data” and our consolidated financial statements and related notes included elsewhere in this prospectus. This discussion contains forward-looking statements that involve risks and uncertainties. Our actual results could differ materially from those discussed below. Factors that could cause or contribute to such differences include, but are not limited to, those identified below and those discussed in the section titled “Risk Factors” included elsewhere in this prospectus. Our fiscal year end is January 31.
Overview
Our mission is to deliver data storage that transforms business through a dramatic increase in performance and reduction in complexity and costs. Our innovative technology replaces storage systems designed for mechanical disk with all-flash systems optimized end-to-end for solid-state memory. At the same time, our innovative business model replaces the traditional forklift upgrade cycle with an evergreen storage model of hardware and software upgrades and maintenance.
Our next-generation storage platform and business model are the result of our team’s substantial experience in enterprise storage and web-scale infrastructure, as well as frustration with the industry’s status quo. Our platform can deliver a 10X acceleration in business applications over legacy disk-based storage. It is also designed to be compatible with existing infrastructure, substantially more reliable and power and space efficient.
Our business model builds on our technology innovations to reverse the traditional storage business model. Instead of moving data between old and new systems via forklift upgrades, we keep business data and applications in place and upgrade technology around it. Our platform and business model are designed to add value to customers for a decade or more, reducing total cost of storage ownership while increasing loyalty.
We were incorporated in 2009 with a vision to define the next generation of enterprise storage by pioneering the all-flash array category and innovating a customer-centric business model. We deliver our three-part integrated platform as the Purity Operating Environment, our flash-optimized software, FlashArray, our modular and scalable all-flash array hardware, and Pure1, our cloud-based management and support. Since inception we have consistently expanded our technology and business model:
| • | In 2012, we launched our first FlashArray and established our All Software Included model, which entitles customers to all Purity Operating Environment functionality in the base purchase price of a FlashArray. |
| • | In 2013, we released Purity 3.0, which included writable snapshots and introduced our Love Your Storage Guarantee, a 30-day return guarantee program. |
| • | In 2014, we expanded our product family to address a broader series of customer requirements and workloads, and released Purity 4.0, which included replication. We also launched our Forever Flash program to provide ongoing hardware upgrades as part of our maintenance and support agreements. |
| • | In 2015, we launched FlashArray//m and Pure1, our next-generation all-flash array hardware and cloud-based management and support, respectively. |
Since launching FlashArray in May 2012, our customer base has grown to over 1,100 customers. Our customers include large and mid-size organizations across a diverse set of industry verticals, including cloud-based software and service providers, consumer web, education, energy, financial services, governments, healthcare, manufacturing, media, retail and telecommunications. We define a customer as an end user that purchases our products and services either from one of our channel partners or from us directly. No customer represented over 10% of revenue for the fiscal years ended January 31, 2014 and 2015, and the six months ended July 31, 2014 and 2015.
41
Table of Contents
We have experienced significant growth, with revenue increasing from $6.1 million for the fiscal year ended January 31, 2013 to $42.7 million for the fiscal year ended January 31, 2014 and to $174.5 million for the fiscal year ended January 31, 2015, representing year-over-year revenue growth of 603% and 308% for our two most recent fiscal years. Our revenue increased from $59.4 million for the six months ended July 31, 2014 to $158.7 million for the six months ended July 31, 2015, representing period-over-period growth of 167% for our most recent interim period. Our net loss was $23.4 million, $78.6 million, and $183.2 million, respectively, for the fiscal years ended January 31, 2013, 2014 and 2015 and $95.2 million and $113.0 million for the six months ended July 31, 2014 and 2015, respectively.
Since our founding, we have invested heavily in growing our business. Our headcount increased from approximately 100 employees as of January 31, 2013 to over 350 employees as of January 31, 2014 to over 800 employees as of January 31, 2015 and to over 1,100 employees as of July 31, 2015. We intend to continue to invest in our research and development organization to extend our technology leadership, enhance the functionality of our existing storage platform and introduce new products. By investing in research and development, we believe we will be well positioned to continue our rapid growth and take advantage of our large market opportunity. Our investments in research and development may result in enhancements or products that may not achieve adequate levels of market adoption, are more expensive to develop than anticipated, may take longer to generate revenue or may generate less revenue than we anticipate. We expect that our results of operations and cash flows will be impacted by the timing, size and level of success of these product development investments.
We also intend to continue to invest and expand our sales and marketing functions and channel programs, including expanding our global network of channel partners and carrying out associated marketing activities in key geographies. By investing in sales and technical training, demand generation and partner programs, we believe we can enable many of our partners to independently identify, qualify, sell and upgrade customers, with limited involvement from us. However, if we fail to effectively identify, train and manage our channel partners and to monitor their sales activity, as well as the customer support and services being provided to our customers in their local markets, our business, operating results, financial condition and cash flows could be harmed.
In addition, we intend to expand and continue to invest in our international operations, which we believe will be an important factor in our continued growth. However, even though our revenue generated from customers outside of the United States was 23% and 22% of our total revenue for the fiscal year ended January 31, 2015 and for the six months ended July 31, 2015, respectively, our international operations are relatively new and we have limited experience operating in foreign jurisdictions. Our inexperience in operating our business outside of the United States increases the risk that our international expansion efforts may not be successful.
As a result of our strategy to increase our investments in research and development, sales, marketing, support and international expansion, we expect to continue to incur operating losses and negative cash flows from operations at least in the near future and may require additional capital resources to execute strategic initiatives to grow our business.
Our Business Model
Currently, we sell our platform predominantly through a high touch, channel-fulfilled model. Our global sales force works collaboratively with our channel partners. Our channel partners typically place orders with us upon receiving an order from a customer and do not stock inventory. Our sales organization is supported by systems engineers with deep technical expertise and responsibility for pre-sales technical support and engineering for our customers. We support our channel partners through product education and sales and support training. We intend to continue to invest in the channel to add more partners and to expand our reach to customers through our channel partners’ relationships. No channel partner represented over 10% of revenue for the fiscal years ended January 31, 2014 and 2015, and the six months ended July 31, 2014 and 2015.
42
Table of Contents
Our business model enables customers to broadly adopt flash for a wide variety of workloads in their datacenter, with some of our most innovative customers adopting all-flash datacenters. We do not charge separately for software, meaning that when a customer buys a FlashArray, all software functionality of the Purity Operating Environment is included in the base purchase price, and the customer is entitled to updates and new features as long as the customer maintains an active maintenance and support agreement. Product revenue is recognized at the time title and risk of loss have transferred. Support revenue is recognized ratably over the term of the related maintenance and support agreement, generally ranging from 1 to 3 years. By keeping our business model simple and efficient, we allow customers to buy more products and expand their footprint more easily while allowing us to reduce our sales and marketing costs.
To deliver on the next level of operational simplicity and support excellence, we designed Pure1, our integrated cloud-based management and support. Pure1 enables our customers, support staff and partners to collaborate to achieve the best customer experience and is included with an active maintenance and support agreement. In addition, our Forever Flash program provides our customers who continually maintain active maintenance and support for three years with an included controller refresh with each additional three year maintenance and support renewal. In this way, our customers improve and extend the service life of their arrays, we reduce our cost of support by keeping the array modern and we encourage capacity expansion. In accordance with multiple-element arrangement accounting guidance, we recognize the allocated revenue of the controllers and expense the related cost in the period in which we ship these controllers.
The combination of our high-performance, all-flash products, our exceptional support and our innovative business model has had a substantial impact on customer success and loyalty and are strong drivers of both initial purchase and additional purchases of our products. As of July 31, 2015, more than half of our customers had made additional purchases within 12 months of their initial purchase. For all customers that have been with us for at least 12 months as of July 31, 2015, for every $1 of initial product purchase, our top 25 customers on average spent $5.50 on new product purchases in the first 12 months following their initial purchase and on average spent more than $8 on new product purchases in the first 18 months following their initial purchase. Across all customers that have been with us for at least 12 months as of July 31, 2015, for every $1 of initial product purchase, our customers on average spent more than $1 on new product purchases in the first 12 months following their initial purchase.
Factors Affecting Our Performance
Adoption of All-Flash Storage Systems
Organizations are increasingly replacing traditional disk-based systems with all-flash storage systems to achieve the performance they need. Our success depends on the adoption of all-flash storage systems in IT infrastructures. Although flash is expected to penetrate the datacenter at a rapid rate, a lack of demand for all-flash storage systems for any reason, including technological challenges associated with the use of all-flash memory, the cost or availability of all-flash memory or the adoption of competing technologies and products, would adversely affect our growth prospects. To the extent more organizations recognize the benefits of all-flash memory in datacenter storage systems and as the adoption of all-flash memory storage technology increases, our target customer base will expand. Our business and results of operations will be significantly affected by the speed with which organizations implement all-flash storage systems.
Adding New Customers and Expanding Sales to Our Existing Customer Base
We believe that the all-flash storage market is still in the early stages of adoption. We intend to target new customers by continuing to invest in our field sales force and extending our relationships with channel partners. We also intend to continue to target large customers including enterprises, service providers and government organizations who have yet to adopt all-flash storage throughout their IT environment. A typical initial order
43
Table of Contents
involves educating prospective customers about the technical merits and capabilities and potential cost savings of our products as compared to our competitors’ products. We believe that customer references have been, and will continue to be, an important factor in winning new business. The average size of arrays deployed by our customers has increased over time. We expect this trend to continue and that a substantial portion of our future sales will be sales to existing customers, including expansion of their arrays. We sell additional products and services to our customers as the data within their existing application deployments naturally grows and they migrate additional applications to our all-flash storage platform. Our business and results of operations will depend on our ability to continue to add new customers and sell additional products to our growing base of customers.
Leveraging Channel Partners
We sell our products predominantly through a channel-fulfilled model. Our sales force supports our channel partners and is responsible for large account penetration, global account coordination and overall market development. Our channel partners help market and sell our products, typically with assistance from our sales force. This joint sales approach provides us with the benefit of direct relationships with substantially all of our customers and expands our reach through the relationships of our channel partners. We intend to continue to expand our partner relationships to further extend our distribution coverage and to invest in education, training and programs to increase the ability of our channel partners to sell our products independently. Our business and results of operations will be materially affected by our success in leveraging our channel partners.
Investing in Research and Development for Growth
Our future performance will also depend on our ability to continue to innovate, improve functionality in our products and adapt to new technologies or changes to existing technologies. We intend to continue to invest for long-term growth. Accordingly, we expect to continue to invest heavily in our product development efforts, including software development in the Purity Operating Environment and Pure1 to further expand the capabilities and performance of our storage platform, hardware development in our FlashArray and future hardware platforms, and to introduce new products including new releases and upgrades to our software and hardware. We expect that our results of operations will be impacted by the timing, size and level of success of these product development investments.
Components of Results of Operations
Revenue
We derive revenue from the sale of our storage products and support services. Provided that all other revenue recognition criteria have been met, we typically recognize product revenue upon shipment, as title and risk of loss are transferred to our channel partners at that time. Products are typically shipped directly by us to customers, and our channel partners do not stock our inventory. We expect our product revenue may vary from period to period based on, among other things, the timing and size of orders and delivery of products and the impact of significant transactions.
We provide our support services pursuant to maintenance and support agreements, which involve customer support, hardware maintenance and software upgrades for a period of generally 1 to 3 years. We recognize revenue from maintenance and support agreements over the contractual service period. We expect our support revenue to increase as we add new customers and our existing customers renew maintenance and support agreements.
Cost of Revenue
Cost of product revenue primarily consists of costs paid to our third-party contract manufacturers, which includes the costs of our components, and personnel costs associated with our manufacturing operations. Personnel costs consist of salaries, bonuses and stock-based compensation. Our cost of product revenue also
44
Table of Contents
includes freight, allocated overhead costs and inventory write-offs. Allocated overhead costs consist of certain facilities and IT costs. We expect our cost of product revenue to increase in absolute dollars as our product revenue increases.
Cost of support revenue includes personnel costs associated with our customer support organization and allocated overhead costs. Cost of support revenue also includes parts replacement costs. We expect our cost of support revenue to increase in absolute dollars as our support revenue increases.
Operating Expenses
Our operating expenses consist of research and development, sales and marketing and general and administrative expenses. Salaries and personnel-related costs, including stock-based compensation, are the most significant component of each category of operating expenses. Operating expenses also include allocated overhead costs for facilities and IT costs.
Research and Development. Research and development expense consists primarily of employee compensation and related expenses, prototype expenses, depreciation associated with assets acquired for research and development, third-party engineering and contractor support costs, as well as allocated overhead. We expect our research and development expense to increase in absolute dollars, as we continue to invest in new products and existing products and build upon our technology leadership.
Sales and Marketing. Sales and marketing expense consists primarily of employee compensation and related expenses, sales commissions, marketing programs, travel and entertainment expenses, as well as allocated overhead. Marketing programs consist of advertising, events, corporate communications and brand-building activities. We expect our sales and marketing expense to increase in absolute dollars over time as we expand our sales force and increase our marketing resources, expand into new markets and further develop our channel program.
General and Administrative. General and administrative expense consists primarily of compensation and related expenses for administrative functions including finance, legal, human resources and fees for third-party professional services, as well as allocated overhead. We expect our general and administrative expense to increase in absolute dollars as we incur additional costs related to operating as a publicly-traded company and continue to invest in the growth of our business.
Other Income (Expense), Net
Other income (expense), net consists primarily of gains and losses from foreign currency transactions and other income (expense).
Provision for Income Taxes
Provision for income taxes consists primarily of income taxes in certain foreign jurisdictions in which we conduct business and state income taxes in the United States. We have recorded no U.S. federal income tax and provided a full valuation allowance for U.S. deferred tax assets, which includes net operating loss, or NOL, carryforwards and tax credits related primarily to research and development. We expect to maintain this full valuation allowance for the foreseeable future as it is more likely than not that the assets will not be realized based on our history of losses.
45
Table of Contents
Results of Operations
The following tables set forth our results of operations for the periods presented in dollars and as a percentage of our revenue (in thousands):
| Fiscal Year Ended January 31, |
Six Months Ended July 31, |
|||||||||||||||
| 2014 | 2015 | 2014 | 2015 | |||||||||||||
| (unaudited) | ||||||||||||||||
| Consolidated Statements of Operations Data: |
||||||||||||||||
| Revenue: |
||||||||||||||||
| Product |
$ | 39,228 | $ | 154,836 | $ | 53,253 | $ | 134,810 | ||||||||
| Support |
3,505 | 19,615 | 6,159 | 23,928 | ||||||||||||
|
|
|
|
|
|
|
|
|
|||||||||
| Total revenue |
42,733 | 174,451 | 59,412 | 158,738 | ||||||||||||
| Cost of revenue: |
||||||||||||||||
| Product(1) |
19,974 | 63,425 | 22,608 | 50,353 | ||||||||||||
| Support(1) |
4,155 | 14,127 | 4,924 | 14,421 | ||||||||||||
|
|
|
|
|
|
|
|
|
|||||||||
| Total cost of revenue |
24,129 | 77,552 | 27,532 | 64,774 | ||||||||||||
|
|
|
|
|
|
|
|
|
|||||||||
| Gross profit |
18,604 | 96,899 | 31,880 | 93,964 | ||||||||||||
| Operating expenses: |
||||||||||||||||
| Research and development(1) |
36,081 | 92,707 | 40,533 | 69,870 | ||||||||||||
| Sales and marketing(1) |
54,750 | 152,320 | 71,563 | 107,844 | ||||||||||||
| General and administrative(1) |
5,902 | 32,354 | 14,419 | 27,919 | ||||||||||||
|
|
|
|
|
|
|
|
|
|||||||||
| Total operating expenses |
96,733 | 277,381 | 126,515 | 205,633 | ||||||||||||
|
|
|
|
|
|
|
|
|
|||||||||
| Loss from operations |
(78,129 | ) | (180,482 | ) | (94,635 | ) | (111,669 | ) | ||||||||
| Other income (expense), net |
(141 | ) | (1,412 | ) | (307 | ) | (1,074 | ) | ||||||||
|
|
|
|
|
|
|
|
|
|||||||||
| Loss before provision for income taxes |
(78,270 | ) | (181,894 | ) | (94,942 | ) | (112,743 | ) | ||||||||
| Provision for income taxes |
291 | 1,337 | 257 | 214 | ||||||||||||
|
|
|
|
|
|
|
|
|
|||||||||
| Net loss |
$ | (78,561 | ) | $ | (183,231 | ) | $ | (95,199 | ) | $ | (112,957 | ) | ||||
|
|
|
|
|
|
|
|
|
|||||||||
| (1) | Includes stock-based compensation expense as follows: |
| Fiscal Year Ended January 31, |
Six Months Ended July 31, |
|||||||||||||||
| 2014 | 2015 | 2014 | 2015 | |||||||||||||
| (unaudited) | ||||||||||||||||
| (in thousands) | ||||||||||||||||
| Cost of revenue—product |
$ | 253 | $ | 303 | $ | 229 | $ | 96 | ||||||||
| Cost of revenue—support |
316 | 1,273 | 898 | 854 | ||||||||||||
| Research and development |
11,477 | 22,512 | 15,147 | 10,429 | ||||||||||||
| Sales and marketing |
9,014 | 22,466 | 17,361 | 5,980 | ||||||||||||
| General and administrative |
506 | 6,479 | 4,508 | 3,300 | ||||||||||||
|
|
|
|
|
|
|
|
|
|||||||||
| Total stock-based compensation expense |
$ | 21,566 | $ | 53,033 | $ | 38,143 | $ | 20,659 | ||||||||
|
|
|
|
|
|
|
|
|
|||||||||
| Stock-based compensation expense for the fiscal years ended January 31, 2014 and 2015 and the six months ended July 31, 2014 included $13.3 million, $27.6 million, and $27.6 million, respectively, of cash paid for the repurchase of common stock in excess of fair value. See Note 9 to our consolidated financial statements for additional information. |
46
Table of Contents
| Fiscal Year Ended January 31, |
Six Months Ended July 31, |
|||||||||||||||
| 2014 | 2015 | 2014 | 2015 | |||||||||||||
| Percentage of Revenue Data: |
||||||||||||||||
| Revenue: |
||||||||||||||||
| Product |
92 | % | 89 | % | 90 | % | 85 | % | ||||||||
| Support |
8 | 11 | 10 | 15 | ||||||||||||
|
|
|
|
|
|
|
|
|
|||||||||
| Total revenue |
100 | 100 | 100 | 100 | ||||||||||||
| Cost of revenue: |
||||||||||||||||
| Product |
47 | 36 | 38 | 32 | ||||||||||||
| Support |
10 | 8 | 8 | 9 | ||||||||||||
|
|
|
|
|
|
|
|
|
|||||||||
| Total cost of revenue |
57 | 44 | 46 | 41 | ||||||||||||
|
|
|
|
|
|
|
|
|
|||||||||
| Gross profit |
43 | 56 | 54 | 59 | ||||||||||||
| Operating expenses: |
||||||||||||||||
| Research and development |
84 | 53 | 68 | 44 | ||||||||||||
| Sales and marketing |
128 | 87 | 120 | 68 | ||||||||||||
| General and administrative |
14 | 19 | 25 | 18 | ||||||||||||
|
|
|
|
|
|
|
|
|
|||||||||
| Total operating expenses |
226 | 159 | 213 | 130 | ||||||||||||
|
|
|
|
|
|
|
|
|
|||||||||
| Loss from operations |
(183 | ) | (103 | ) | (159 | ) | (71 | ) | ||||||||
| Other income (expense), net |
— | (1 | ) | (1 | ) | — | ||||||||||
|
|
|
|
|
|
|
|
|
|||||||||
| Loss before provision for income taxes |
(183 | ) | (104 | ) | (160 | ) | (71 | ) | ||||||||
| Provision for income taxes |
1 | 1 | — | — | ||||||||||||
|
|
|
|
|
|
|
|
|
|||||||||
| Net loss |
(184 | )% | (105 | )% | (160 | )% | (71 | )% | ||||||||
|
|
|
|
|
|
|
|
|
|||||||||
Comparison of the Six Months Ended July 31, 2014 and 2015
Revenue
| Six Months Ended July 31, |
Change | |||||||||||||||
| 2014 | 2015 | $ | % | |||||||||||||
| (dollars in thousands) | ||||||||||||||||
| Product revenue |
$ | 53,253 | $ | 134,810 | $ | 81,557 | 153% | |||||||||
| Support revenue |
6,159 | 23,928 | 17,769 | 289% | ||||||||||||
|
|
|
|
|
|
|
|||||||||||
| Total revenue |
$ | 59,412 | $ | 158,738 | $ | 99,326 | 167% | |||||||||
|
|
|
|
|
|
|
|||||||||||
Total revenue increased by $99.3 million, or 167%, during the six months ended July 31, 2015 compared to the six months ended July 31, 2014. The increase in product revenue was driven by higher sales to a growing number of new and existing customers. The number of customers grew from over 450 as of July 31, 2014 to over 1,100 as of July 31, 2015. The increase in support revenue was driven primarily by an increase in maintenance and support agreements sold with increased product sales, as well as increased recognition of deferred support revenue.
47
Table of Contents
Cost of Revenue and Gross Margin
| Six Months Ended July 31, |
Change | |||||||||||||||
| 2014 | 2015 | $ | % | |||||||||||||
| (dollars in thousands) | ||||||||||||||||
| Product cost of revenue |
$ | 22,608 | $ | 50,353 | $ | 27,745 | 123 | % | ||||||||
| Support cost of revenue |
4,924 | 14,421 | 9,497 | 193 | % | |||||||||||
|
|
|
|
|
|
|
|||||||||||
| Total cost of revenue |
$ | 27,532 | $ | 64,774 | $ | 37,242 | 135 | % | ||||||||
|
|
|
|
|
|
|
|||||||||||
| Product gross margin |
58 | % | 63 | % | ||||||||||||
| Support gross margin |
20 | % | 40 | % | ||||||||||||
| Total gross margin |
54 | % | 59 | % | ||||||||||||
Cost of revenue increased by $37.2 million, or 135%, for the six months ended July 31, 2015 compared to the six months ended July 31, 2014. The increase in product cost of revenue was primarily driven by increased product sales and, to a lesser extent, by the increased costs in our manufacturing operations, including increased personnel costs associated with increased headcount. The increase in support cost of revenue was primarily attributable to higher costs in our customer support organization primarily driven by personnel costs associated with increased headcount and an increase in parts replacement in support of our maintenance and support agreements. Total headcount in these functions increased 165% from July 31, 2014 to July 31, 2015.
Total gross margin increased from 54% during the six months ended July 31, 2014 to 59% during the six months ended July 31, 2015. Product gross margin increased 5 points from the six months ended July 31, 2014 to the six months ended July 31, 2015, primarily driven by a shift in the mix of products sold to our customers, as well as higher sales volume and lower average component costs. Support gross margin increased 20 points from the six months ended July 30, 2014 to the six months ended July 31, 2015 primarily due to increased recognition of deferred support revenue resulting from the increase in our customer base, as well as operational efficiencies.
Operating Expenses
Research and Development
| Six Months Ended July 31, |
Change | |||||||||||||||
| 2014 | 2015 | $ | % | |||||||||||||
| (dollars in thousands) | ||||||||||||||||
| Research and development |
$ | 40,533 | $ | 69,870 | $ | 29,337 | 72 | % | ||||||||
Research and development expense increased by $29.3 million, or 72%, during the six months ended July 31, 2015 compared to the six months ended July 31, 2014, as we continued to develop new and enhanced product offerings. The increase was primarily driven by an increase of $19.7 million in salary and related costs, as headcount increased by 108% from July 31, 2014 to July 31, 2015. The remainder of the increase was primarily attributable to $6.0 million in depreciation expense on test equipment, $4.1 million in prototype expenses and $1.9 million in professional services. These increases were partially offset by a decrease of $4.7 million in stock-based compensation expense. The decrease in stock-based compensation expense was due to additional expense of $9.5 million recognized for the repurchase of common stock in connection with a tender offer during the six months ended July 31, 2014. There was no similar repurchase during the six months ended July 31, 2015.
48
Table of Contents
Sales and Marketing
| Six Months Ended July 31, |
Change | |||||||||||||||
| 2014 | 2015 | $ | % | |||||||||||||
| (dollars in thousands) | ||||||||||||||||
| Sales and marketing |
$ | 71,563 | $ | 107,844 | $ | 36,281 | 51 | % | ||||||||
Sales and marketing expense increased by $36.3 million, or 51%, during the six months ended July 31, 2015 compared to the six months ended July 31, 2014, as we grew our sales force and expanded our geographic footprint. The increase was primarily driven by an increase of $19.1 million in salary and related costs, an increase of $7.1 million in commission expense, as headcount increased by 67% from July 31, 2014 to July 31, 2015. The remainder of the increase was primarily attributable to $8.3 million in marketing programs partly related to a new product launch, $4.9 million in professional services and $3.6 million in travel and entertainment expense. These increases were partially offset by a decrease of $11.4 million in stock-based compensation expense. The decrease in stock-based compensation expense was due to additional expense of $13.9 million recognized for the repurchase of common stock in connection with a tender offer during the six months ended July 31, 2014. There was no similar repurchase during the six months ended July 31, 2015.
General and Administrative
| Six Months Ended July 31, |
Change | |||||||||||||||
| 2014 | 2015 | $ | % | |||||||||||||
| (dollars in thousands) | ||||||||||||||||
| General and administrative |
$ | 14,419 | $ | 27,919 | $ | 13,500 | 94 | % | ||||||||
General and administrative expense increased by $13.5 million, by 94%, during the six months ended July 31, 2015 compared to the six months ended July 31, 2014. The increase was primarily due to an increase of $3.2 million in salary and related costs, as we increased our headcount by 153% from July 31, 2014 to July 31, 2015. Additionally, legal, consulting, accounting and audit fees increased by $9.7 million as we expanded internationally and prepared to become a public company. These increases were partially offset by a decrease of $1.2 million in stock-based compensation expense. The decrease in stock-based compensation expense was due to additional expense of $3.4 million recognized for the repurchase of common stock in connection with a tender offer during the six months ended July 31, 2014. There was no similar repurchase during the six months ended July 31, 2015.
In September 2015, we issued 700,000 shares of Class B common stock to the Pure Good Foundation. As a result, we expect to incur a non-cash general and administrative expense in the three months ending October 31, 2015 equal to the fair value of the shares of Class B common stock issued to the Pure Good Foundation.
Other Income (Expense), Net
| Six Months Ended July 31, |
Change | |||||||||||||||
| 2014 | 2015 | $ | % | |||||||||||||
| (dollars in thousands) | ||||||||||||||||
| Other income (expense), net |
$ | (307 | ) | $ | (1,074 | ) | $ | (767 | ) | (250% | ) | |||||
Other income (expense), net decreased during the six months ended July 31, 2015 compared to the six months ended July 31, 2014 primarily due to an increase in foreign currency transactions and related expenses as we expanded internationally.
49
Table of Contents
Provision for Income Taxes
| Six Months Ended July 31, |
Change | |||||||||||||||
| 2014 | 2015 | $ | % | |||||||||||||
| (dollars in thousands) | ||||||||||||||||
| Provision for income taxes |
$ | 257 | $ | 214 | $ | (43 | ) | (17% | ) | |||||||
The provision for income taxes was primarily related to foreign taxes as we continued our global expansion.
Comparison of the Fiscal Years Ended January 31, 2014 and 2015
Revenue
| Fiscal Year Ended January 31, |
Change | |||||||||||||||
| 2014 | 2015 | $ | % | |||||||||||||
| (dollars in thousands) | ||||||||||||||||
| Product revenue |
$ | 39,228 | $ | 154,836 | $ | 115,608 | 295% | |||||||||
| Support revenue |
3,505 | 19,615 | 16,110 | 460% | ||||||||||||
|
|
|
|
|
|
|
|||||||||||
| Total revenue |
$ | 42,733 | $ | 174,451 | $ | 131,718 | 308% | |||||||||
|
|
|
|
|
|
|
|||||||||||
Total revenue increased by $131.7 million, or 308%, during the fiscal year ended January 31, 2015 compared to the fiscal year ended January 31, 2014. The increase in product revenue was driven by higher sales to a growing number of customers. The number of customers grew from approximately 200 as of January 31, 2014 to over 700 as of January 31, 2015. The increase in support revenue was driven primarily by an increase in maintenance and support agreements sold with higher product sales, as well as the full year revenue impact from such agreements sold in the previous year.
Cost of Revenue and Gross Margin
| Fiscal Year Ended January 31, |
Change | |||||||||||||||
| 2014 | 2015 | $ | % | |||||||||||||
| (dollars in thousands) | ||||||||||||||||
| Product cost of revenue |
$ | 19,974 | $ | 63,425 | $ | 43,451 | 218% | |||||||||
| Support cost of revenue |
4,155 | 14,127 | 9,972 | 240% | ||||||||||||
|
|
|
|
|
|
|
|||||||||||
| Total cost of revenue |
$ | 24,129 | $ | 77,552 | $ | 53,423 | 221% | |||||||||
|
|
|
|
|
|
|
|||||||||||
| Product gross margin |
49% | 59% | ||||||||||||||
| Support gross margin |
(19 | )% | 28% | |||||||||||||
| Total gross margin |
43% | 56% | ||||||||||||||
Cost of revenue increased by $53.4 million, or 221%, for the fiscal year ended January 31, 2015 compared to the fiscal year ended January 31, 2014. The increase in product cost of revenue was primarily driven by increased product sales and, to a lesser extent, by the increased costs in our manufacturing operations, including increased personnel costs associated with increased headcount. The increase in support cost of revenue was primarily attributable to higher costs in our customer support organization primarily driven by personnel costs associated with increased headcount and an increase in parts replacement in support of our maintenance and support agreements. Total headcount in these functions increased 176% from January 31, 2014 to January 31, 2015.
50
Table of Contents
Total gross margin increased from 43% during the fiscal year ended January 31, 2014 to 56% during the fiscal year ended January 31, 2015. Product gross margin increased 10 points from the fiscal year ended January 31, 2014 to the fiscal year ended January 31, 2015, primarily driven by higher sales volume and lower average component costs. Support gross margin increased 47 points from the fiscal year ended January 31, 2014 to the fiscal year ended January 31, 2015 primarily due to increased recognition of deferred support revenue resulting from the increase in our customer base as well as operational efficiencies.
Operating Expenses
Research and Development
| Fiscal Year Ended January 31, |
Change | |||||||||||||||
| 2014 | 2015 | $ | % | |||||||||||||
| (dollars in thousands) | ||||||||||||||||
| Research and development |
$ | 36,081 | $ | 92,707 | $ | 56,626 | 157 | % | ||||||||
Research and development expense increased by $56.6 million, or 157%, during the fiscal year ended January 31, 2015 compared to the fiscal year ended January 31, 2014, as we continued to develop new and enhanced product offerings. The increase was primarily driven by an increase of $33.0 million in employee and related costs, including an increase of $11.0 million in stock-based compensation expense, as we increased our headcount by 115% from January 31, 2014 to January 31, 2015. The remainder of the increase was primarily attributable to $9.7 million in prototype expenses, $6.6 million in depreciation expense on test equipment and $3.6 million in professional services.
Sales and Marketing
| Fiscal Year Ended January 31, |
Change | |||||||||||||||
| 2014 | 2015 | $ | % | |||||||||||||
| (dollars in thousands) | ||||||||||||||||
| Sales and marketing |
$ | 54,750 | $ | 152,320 | $ | 97,570 | 178 | % | ||||||||
Sales and marketing expense increased by $97.6 million, or 178%, during the fiscal year ended January 31, 2015 compared to the fiscal year ended January 31, 2014, as we grew our sales force and expanded our geographic footprint. The increase was primarily driven by an increase of $69.5 million in employee and related costs, including an increase of $16.7 million in commission expense and an increase of $13.5 million in stock-based compensation expense, as we increased our headcount by 115% from January 31, 2014 to January 31, 2015. The remainder of the increase was primarily attributable to $10.6 million in marketing programs, $6.2 million in travel and entertainment expense, $6.2 million in allocated overhead costs for facilities and $3.3 million in professional services.
General and Administrative
| Fiscal Year Ended January 31, |
Change | |||||||||||||||
| 2014 | 2015 | $ | % | |||||||||||||
| (dollars in thousands) | ||||||||||||||||
| General and administrative |
$ | 5,902 | $ | 32,354 | $ | 26,452 | 448 | % | ||||||||
General and administrative expense increased by $26.5 million, or 448%, during the fiscal year ended January 31, 2015 compared to the fiscal year ended January 31, 2014. The increase was primarily due to an increase of $12.2 million in employee and related costs, including an increase of $6.0 million in stock-based compensation expense, as we increased our headcount by 188% from January 31, 2014 to January 31, 2015.
51
Table of Contents
Additionally, legal, consulting, accounting and audit fees increased by $9.7 million as we expanded internationally and prepared to become a public company. The remainder of the increase was primarily attributable to an increase of $2.9 million in allocated overhead costs for facilities.
Other Income (Expense), Net
| Fiscal Year Ended January 31, |
Change | |||||||||||||||
| 2014 | 2015 | $ | % | |||||||||||||
| (dollars in thousands) | ||||||||||||||||
| Other income (expense), net |
$ | (141 | ) | $ | (1,412 | ) | $ | (1,271 | ) | 901% | ||||||
Other income (expense), net decreased during the fiscal year ended January 31, 2015 compared to the fiscal year ended January 31, 2014 primarily due to an increase in foreign currency transactions and related expenses.
Provision for Income Taxes
| Fiscal Year Ended January 31, |
Change | |||||||||||||||
| 2014 | 2015 | $ | % | |||||||||||||
| (dollars in thousands) | ||||||||||||||||
| Provision for income taxes |
$ | 291 | $ | 1,337 | $ | 1,046 | 359% | |||||||||
The provision for income taxes increased during the fiscal year ended January 31, 2015 compared to the fiscal year ended January 31, 2014 primarily due to an increase in foreign taxes as we continued our global expansion.
52
Table of Contents
Quarterly Results of Operations
The following tables summarize our selected unaudited quarterly consolidated statements of operations data for each of the six quarters in the period ended July 31, 2015. The information for each of these quarters has been prepared on a basis consistent with our audited annual financial statements and, in the opinion of management, includes all adjustments of a normal, recurring nature that are necessary for the fair presentation of the results of operations for these periods in accordance with generally accepted accounting principles in the United States. This data should be read in conjunction with our audited consolidated financial statements included elsewhere in this prospectus. Our historical results are not necessarily indicative of the results that may be expected in the future and our results for the three months ended July 31, 2015 are not necessarily indicative of the results that may be expected for the full fiscal year.
| Three Months Ended | ||||||||||||||||||||||||
| April 30, 2014 |
July 31, 2014 |
October 31, 2014 |
January 31, 2015 |
April 30, 2015 |
July 31, 2015 |
|||||||||||||||||||
| (unaudited) | ||||||||||||||||||||||||
| (in thousands) | ||||||||||||||||||||||||
| Consolidated Statements of Operations Data: |
||||||||||||||||||||||||
| Revenue: |
||||||||||||||||||||||||
| Product |
$ | 22,166 | $ | 31,087 | $ | 43,753 | $ | 57,830 | $ | 63,618 | $ | 71,192 | ||||||||||||
| Support |
2,482 | 3,677 | 5,436 | 8,020 | 10,459 | 13,469 | ||||||||||||||||||
|
|
|
|
|
|
|
|
|
|
|
|
|
|||||||||||||
| Total revenue |
24,648 | 34,764 | 49,189 | 65,850 | 74,077 | 84,661 | ||||||||||||||||||
|
|
|
|
|
|
|
|
|
|
|
|
|
|||||||||||||
| Cost of revenue: |
||||||||||||||||||||||||
| Product (1) |
9,793 | 12,815 | 16,676 | 24,141 | 22,712 | 27,641 | ||||||||||||||||||
| Support (1) |
1,795 | 3,129 | 3,827 | 5,376 | 6,924 | 7,497 | ||||||||||||||||||
|
|
|
|
|
|
|
|
|
|
|
|
|
|||||||||||||
| Total cost of revenue |
11,588 | 15,944 | 20,503 | 29,517 | 29,636 | 35,138 | ||||||||||||||||||
|
|
|
|
|
|
|
|
|
|
|
|
|
|||||||||||||
| Gross profit |
13,060 | 18,820 | 28,686 | 36,333 | 44,441 | 49,523 | ||||||||||||||||||
| Operating expenses: |
||||||||||||||||||||||||
| Research and development (1) |
12,807 | 27,726 | 22,863 | 29,311 | 31,682 | 38,188 | ||||||||||||||||||
| Sales and marketing (1) |
25,115 | 46,448 | 38,224 | 42,533 | 48,327 | 59,517 | ||||||||||||||||||
| General and administrative (1) |
4,925 | 9,494 | 7,415 | 10,520 | 12,692 | 15,227 | ||||||||||||||||||
|
|
|
|
|
|
|
|
|
|
|
|
|
|||||||||||||
| Total operating expenses |
42,847 | 83,668 | 68,502 | 82,364 | 92,701 | 112,932 | ||||||||||||||||||
|
|
|
|
|
|
|
|
|
|
|
|
|
|||||||||||||
| Loss from operations |
(29,787 | ) | (64,848 | ) | (39,816 | ) | (46,031 | ) | (48,260 | ) | (63,409 | ) | ||||||||||||
| Other income (expense), net |
(122 | ) | (185 | ) | (410 | ) | (695 | ) | (703 | ) | (371 | ) | ||||||||||||
|
|
|
|
|
|
|
|
|
|
|
|
|
|||||||||||||
| Loss before provision for income taxes |
(29,909 | ) | (65,033 | ) | (40,226 | ) | (46,726 | ) | (48,963 | ) | (63,780 | ) | ||||||||||||
| Provision for income taxes |
139 | 118 | 171 | 909 | 157 | 57 | ||||||||||||||||||
|
|
|
|
|
|
|
|
|
|
|
|
|
|||||||||||||
| Net loss |
$ | (30,048 | ) | $ | (65,151 | ) | $ | (40,397 | ) | $ | (47,635 | ) | $ | (49,120 | ) | $ | (63,837 | ) | ||||||
|
|
|
|
|
|
|
|
|
|
|
|
|
|||||||||||||
| (1) | Includes stock-based compensation expense as follows: |
| Cost of revenue—product |
$ | 73 | $ | 156 | $ | 35 | $ | 39 | $ | 56 | $ | 40 | ||||||||||||
| Cost of revenue—support |
86 | 812 | 160 | 216 | 333 | 521 | ||||||||||||||||||
| Research and development |
2,432 | 12,715 | 3,399 | 3,966 | 3,625 | 6,804 | ||||||||||||||||||
| Sales and marketing |
1,436 | 15,925 | 2,315 | 2,790 | 3,444 | 2,536 | ||||||||||||||||||
| General and administrative |
424 | 4,084 | 823 | 1,148 | 1,401 | 1,899 | ||||||||||||||||||
|
|
|
|
|
|
|
|
|
|
|
|
|
|||||||||||||
| Total stock-based compensation expense |
$ | 4,451 | $ | 33,692 | $ | 6,731 | $ | 8,159 | $ | 8,859 | $ | 11,800 | ||||||||||||
|
|
|
|
|
|
|
|
|
|
|
|
|
Stock-based compensation expense for the three months ended July 31, 2014 included $27.6 million of cash paid for the repurchase of common stock in excess of fair value. See Note 9 to our consolidated financial statements for additional information.
53
Table of Contents
| Three Months Ended | ||||||||||||||||||||||||
| April 30, 2014 |
July 31, 2014 |
October 31, 2014 |
January 31, 2015 |
April 30, 2015 |
July 31, 2015 |
|||||||||||||||||||
| Percentage of Revenue Data: |
||||||||||||||||||||||||
| Revenue: |
||||||||||||||||||||||||
| Product |
90 | % | 89 | % | 89 | % | 88 | % | 86 | % | 84 | % | ||||||||||||
| Support |
10 | 11 | 11 | 12 | 14 | 16 | ||||||||||||||||||
|
|
|
|
|
|
|
|
|
|
|
|
|
|||||||||||||
| Total revenue |
100 | 100 | 100 | 100 | 100 | 100 | ||||||||||||||||||
|
|
|
|
|
|
|
|
|
|
|
|
|
|||||||||||||
| Cost of revenue: |
||||||||||||||||||||||||
| Product |
40 | 37 | 34 | 37 | 31 | 33 | ||||||||||||||||||
| Support |
7 | 9 | 8 | 8 | 9 | 9 | ||||||||||||||||||
|
|
|
|
|
|
|
|
|
|
|
|
|
|||||||||||||
| Total cost of revenue |
47 | 46 | 42 | 45 | 40 | 42 | ||||||||||||||||||
|
|
|
|
|
|
|
|
|
|
|
|
|
|||||||||||||
| Gross margin |
53 | 54 | 58 | 55 | 60 | 58 | ||||||||||||||||||
| Operating expenses: |
||||||||||||||||||||||||
| Research and development |
52 | 80 | 46 | 45 | 43 | 45 | ||||||||||||||||||
| Sales and marketing |
102 | 134 | 78 | 65 | 65 | 70 | ||||||||||||||||||
| General and administrative |
20 | 27 | 15 | 15 | 17 | 18 | ||||||||||||||||||
|
|
|
|
|
|
|
|
|
|
|
|
|
|||||||||||||
| Total operating expenses |
174 | 241 | 139 | 125 | 125 | 133 | ||||||||||||||||||
|
|
|
|
|
|
|
|
|
|
|
|
|
|||||||||||||
| Loss from operations |
(121 | ) | (187 | ) | (81 | ) | (70 | ) | (65 | ) | (75 | ) | ||||||||||||
| Other income (expense), net |
— | — | (1 | ) | (1 | ) | (1 | ) | — | |||||||||||||||
|
|
|
|
|
|
|
|
|
|
|
|
|
|||||||||||||
| Loss before provision for income taxes |
(121 | ) | (187 | ) | (82 | ) | (71 | ) | (66 | ) | (75 | ) | ||||||||||||
| Provision for income taxes |
1 | — | — | 1 | — | — | ||||||||||||||||||
|
|
|
|
|
|
|
|
|
|
|
|
|
|||||||||||||
| Net loss |
(122 | %) | (187 | %) | (82 | %) | (72 | %) | (66 | %) | (75 | %) | ||||||||||||
|
|
|
|
|
|
|
|
|
|
|
|
|
|||||||||||||
Quarterly Revenue Trends
Our quarterly revenue increased sequentially for all periods presented due primarily to higher sales reflecting increased demand for our products and related support services. The sequential growth in product revenue was driven primarily by higher sales of our storage products to new and existing customers. The sequential growth in support revenue was primarily driven by a higher number of maintenance and support agreements sold with increased product sales, as well as increased recognition of deferred support revenue. We expect to experience seasonal fluctuations in our revenue from time to time with the fourth quarter historically being our strongest quarter for sales as a result of large enterprise buying patterns.
Quarterly Gross Profit and Gross Margin Trends
Gross profit in absolute dollar terms increased sequentially for all periods presented, primarily due to growth in revenue. Sequential fluctuations in gross margin was primarily driven by a shift in the mix of products sold to our customers, as well as timing of employee hiring as we continued to build out our customer support organization. During the three months ended July 31, 2014, cost of revenue included stock-based compensation expense of $855,000 related to the repurchase of common stock from employees in a tender offer.
Quarterly Expense Trends
Total operating expenses generally increased sequentially for all periods presented primarily due to the addition of personnel in connection with the expansion of our business. Sales and marketing expense increased from the three months ended April 30, 2015 to the three months ended July 31, 2015 primarily due to expenditures on marketing programs related to the launch of FlashArray//m. During the three months ended July 31, 2014, total operating expenses included stock-based compensation expense of $26.8 million related to the repurchase of common stock from employees in a tender offer, of which $9.5 million, $13.9 million, and
54
Table of Contents
$3.4 million were allocated to research and development, sales and marketing, general and administrative expenses, respectively.
Liquidity and Capital Resources
As of July 31, 2015, we had cash and cash equivalents of $128.3 million. Our cash and cash equivalents primarily consist of bank deposits and money market funds. We have generated significant operating losses and negative cash flows from operations as reflected in our accumulated deficit of $454.5 million. We expect to continue to incur operating losses and negative cash flows from operations at least in the near future and may require additional capital resources to execute strategic initiatives to grow our business.
To date, we have financed our operations principally through private placements of our convertible preferred stock. Through July 31, 2015, we have received net proceeds of $543.9 million from the issuance of shares of our convertible preferred stock and we have repurchased $78.2 million of shares of common stock from our employees. We believe our existing cash and cash equivalents, our credit facility and cash provided by this offering will be sufficient to fund our operating and capital needs for at least the next 12 months. Our future capital requirements will depend on many factors including our growth rate, the timing and extent of spending to support development efforts, the expansion of sales and marketing and international operation activities, the timing of new product introductions and the continuing market acceptance of our products and services. We may in the future enter into arrangements to acquire or invest in complementary businesses, services and technologies, including intellectual property rights. We may be required to seek additional equity or debt financing. In the event that additional financing is required from outside sources, we may not be able to raise it on terms acceptable to us or at all. If we are unable to raise additional capital when desired, our business, operating results and financial condition would be adversely affected.
In August 2014, we entered into a two-year revolving line of credit facility to provide up to $15.0 million based on 80% of qualifying accounts receivable. Borrowings under the line of credit bear interest at the lender’s prime rate plus 1%. The revolving line of credit facility is collateralized by substantially all of our assets, excluding any intellectual property. It also contains various covenants, including covenants related to the delivery of financial and other information, as well as limitations on dispositions, mergers, consolidations and other corporate activities. As of January 31, 2015 and July 31, 2015, we had no borrowings from this line of credit and we were in compliance with all financial covenants.
As of January 31, 2015 and July 31, 2015, we had letters of credit in the aggregate amount of $4.6 million and $4.6 million, respectively, in connection with our headquarter facility lease. The letters of credit are collateralized by restricted cash in the same amount and mature at various dates through January 2021.
The following table summarizes our cash flows for the periods presented:
| Fiscal Year Ended January 31, | Six Months Ended July 31, |
|||||||||||||||
| 2014 | 2015 | 2014 | 2015 | |||||||||||||
| (in thousands) | ||||||||||||||||
| Net cash used in operating activities |
$ | (67,229 | ) | $ | (143,695 | ) | $ | (82,958 | ) | $ | (44,490 | ) | ||||
| Net cash used in investing activities |
(15,307 | ) | (52,965 | ) | (28,874 | ) | (21,823 | ) | ||||||||
| Net cash provided by financing activities |
163,301 | 258,482 | 255,500 | 1,888 | ||||||||||||
Operating Activities
Net cash used in operating activities during the six months ended July 31, 2015 was $44.5 million, which resulted from a net loss of $113.0 million, partially offset by non-cash charges of $20.7 million for stock-based compensation expense and $14.3 million for depreciation and amortization and net cash inflows of $33.5 million
55
Table of Contents
from changes in operating assets and liabilities. The net cash inflows from changes in operating assets and liabilities was primarily the result of a $49.8 million increase in deferred revenue and a $13.9 million increase in accrued compensation and other liabilities and accounts payable. The inflows were partially offset by a $21.0 million increase in accounts receivable, $4.9 million increase in deferred commissions and $2.6 million increase in prepaid expenses and other assets. The increase in deferred revenue was primarily due to new sales order growth during the six months ended July 31, 2015. The increases in accounts receivable, accrued compensation and other liabilities and accounts payable were primarily attributed to revenue growth and increased activities to support overall business growth.
Net cash used in operating activities during the six months ended July 31, 2014 was $83.0 million, which resulted from a net loss of $95.2 million, partially offset by non-cash charges of $10.5 million for stock-based compensation expense, $5.4 million for depreciation and amortization and net cash outflows of $3.7 million from changes in operating assets and liabilities. The net cash outflows from changes in operating assets and liabilities was primarily the result of increases of $19.5 million in accounts receivable and $9.3 million in inventory, as well as an increase of $2.1 million in deferred commissions, partially offset by an increase of $21.2 million in deferred revenue and an increase of $7.4 million in accrued compensation and other liabilities and accounts payable. The increases in accounts receivable, deferred commissions and deferred revenue were primarily due to revenue and new sales order growth during the year. The increase in inventory was a result of increased purchases to meet higher demand for our products. Net cash used in operating activities also included $27.6 million of cash paid for the repurchase of common stock from our employees in excess of fair value.
Net cash used in operating activities during the fiscal year ended January 31, 2015 was $143.7 million, which resulted from a net loss of $183.2 million and net cash outflows of $1.5 million from changes in operating assets and liabilities, partially offset by non-cash charges of $25.4 million for stock-based compensation and $15.4 million for depreciation and amortization. The net cash outflows from changes in operating assets and liabilities was primarily the result of increases of $44.2 million in accounts receivable, $13.7 million in inventory, $9.8 million in deferred commissions and $6.6 million in prepaid expenses and other assets, partially offset by increases of $56.8 million in deferred revenue and $15.9 million in accrued compensation and other liabilities and accounts payable. The increase in accounts receivable, deferred revenue and deferred commissions was primarily due to revenue and new sales order growth during the year. The increase in inventory, accrued compensation and other liabilities and accounts payable was primarily attributed to increased activities to support overall business growth. Net cash used in operating activities also included $27.6 million of cash paid for the repurchase of common stock from our employees in excess of fair value.
Net cash used in operating activities during the fiscal year ended January 31, 2014 was $67.2 million, which resulted from a net loss of $78.6 million and net cash outflows of $1.5 million from changes in operating assets and liabilities, partially offset by non-cash charges of $8.3 million for stock-based compensation and $4.4 million for depreciation and amortization. The net cash outflows from changes in operating assets and liabilities was primarily the result of increases of $12.0 million in accounts receivable, $7.1 million in deferred commissions, $5.1 million in inventory and $4.4 million in prepaid expenses and other assets, partially offset by increases of $15.1 million in deferred revenue and $12.0 million in accrued compensation and other liabilities and accounts payable. The increase in accounts receivable, deferred revenue and deferred commissions was primarily due to revenue and new sales order growth during the year. The increase in inventory, accrued compensation and other liabilities and accounts payable was primarily attributed to increased activities to support overall business growth. Net cash used in operating activities also included $13.3 million of cash paid for the repurchase of common stock from our employees in excess of fair value.
Investing Activities
Net cash used in investing activities during the six months ended July 31, 2015 of $21.8 million resulted from capital expenditures.
56
Table of Contents
Net cash used in investing activities during the six months ended July 31, 2014 of $28.9 million resulted from capital expenditures of $19.2 million, purchases of intangible assets of $8.0 million and a $1.6 million increase in restricted cash related to a security deposit for new office space.
Net cash used in investing activities during the fiscal year ended January 31, 2015 of $53.0 million resulted from capital expenditures of $42.2 million, purchases of intangible assets of $9.1 million and $1.6 million increase in restricted cash related to a security deposit for new office space.
Net cash used in investing activities during the fiscal year ended January 31, 2014 of $15.3 million resulted from $12.3 million of capital expenditures and $3.0 million of restricted cash related to a security deposit for new office space.
Financing Activities
Net cash provided by financing activities of $1.9 million during the six months ended July 31, 2015 was primarily due to $3.0 million of proceeds from the exercise of stock options, which was partially offset by payments of deferred offering costs of $1.1 million.
Net cash provided by financing activities of $255.5 million during the six months ended July 31, 2014 was primarily due to $280.7 million in proceeds primarily from the issuances of our Series F convertible preferred stock and $5.0 million of proceeds from the exercise of stock options. These increases were partially offset by $30.1 million of repurchases of common stock from our employees.
Net cash provided by financing activities of $258.5 million during the fiscal year ended January 31, 2015 was primarily due to $281.0 million in net proceeds from the issuances of our Series E, Series F and Series F-1 convertible preferred stock and $7.7 million of proceeds from the exercise of stock options including proceeds from repayment of promissory notes, partially offset by $30.1 million of repurchases of common stock from our employees.
Net cash provided by financing activities of $163.3 million during the fiscal year ended January 31, 2014 was primarily due to $167.8 million in net proceeds from the issuance of our Series E convertible preferred stock and $2.7 million of proceeds from the exercise of stock options, partially offset by $7.2 million repurchase of common stock from our employees.
Contractual Obligations and Commitments
The following table summarizes our non-cancellable contractual obligations as of January 31, 2015.
| Payment Due by Period | ||||||||||||||||||||
| Total | Less Than 1 Year |
1-3 Years | 3-5 Years | More Than 5 Years |
||||||||||||||||
| (in thousands) | ||||||||||||||||||||
| Operating leases |
$ | 30,523 | $ | 7,872 | $ | 12,719 | $ | 8,965 | $ | 967 | ||||||||||
| Purchase obligations(1) |
626 | 313 | 313 | — | — | |||||||||||||||
|
|
|
|
|
|
|
|
|
|
|
|||||||||||
| Total |
$ | 31,149 | $ | 8,185 | $ | 13,032 | $ | 8,965 | $ | 967 | ||||||||||
|
|
|
|
|
|
|
|
|
|
|
|||||||||||
| (1) | Purchase obligations consist of non-cancellable software service contracts. |
Purchase orders are not included in the table above. Our purchase orders represent authorizations to purchase rather than binding agreements. The contractual commitment amounts in the table above are associated with agreements that are enforceable and legally binding. Obligations under contracts that we can cancel without a significant penalty are not included in the table above.
During the six months ended July 31, 2015, we entered into a non-cancelable contract of $1.1 million related to certain software services payable through 2018.
57
Table of Contents
In August 2015, we entered into certain lease agreements for office facilities with total lease obligations of approximately $19.7 million with lease periods expiring through 2023. In connection with these leases, we are required to maintain letters of credit of up to $3.3 million.
Off Balance Sheet Arrangements
During the fiscal years ended January 31, 2014 and 2015 and the six months ended July 31, 2015, we did not have any relationships with any entities or financial partnerships, such as structured finance or special purpose entities established for the purpose of facilitating off-balance sheet arrangements or other purposes.
Provision for Income Taxes
As of January 31, 2015, we had U.S. federal and state NOL carryforwards of $300.0 million and $308.4 million that expire commencing in 2029. Under Section 382 of the U.S. Internal Revenue Code of 1986, or the Code, a corporation that undergoes an “ownership change” is subject to limitations on its ability to utilize its pre-change NOLs to offset future taxable income. In December 2014, we completed an analysis through July 2014 to evaluate whether there are any limitations of our NOLs and concluded no limitations currently exist. While we do not believe that we have experienced, or will experience in connection with this offering, an ownership change that would result in limitations, regulatory changes, such as suspension on the use of NOLs, could result in the expiration of our NOLs or otherwise cause them to be unavailable to offset future income tax liabilities.
Quantitative and Qualitative Disclosures about Market Risk
We have operations both within the United States and internationally, and we are exposed to market risk in the ordinary course of our business.
Interest Rate Risk
Our cash and cash equivalents primarily consist of bank deposits and money market funds. As of January 31, 2015 and July 31, 2015, we had cash and cash equivalents of $192.7 million and $128.3 million. The carrying amount of our cash equivalents reasonably approximates fair value, due to the short maturities of these instruments. The primary objectives of our investment activities are the preservation of capital, the fulfillment of liquidity needs and the fiduciary control of cash and investments. We do not enter into investments for trading or speculative purposes. Our investments are exposed to market risk due to a fluctuation in interest rates, which may affect our interest income and the fair market value of our investments. However, due to the short-term nature of our investment portfolio, we do not believe an immediate 10% increase or decrease in interest rates would have a material effect on the fair market value of our portfolio. We therefore do not expect our operating results or cash flows to be materially affected by a sudden change in market interest rates.
Foreign Currency Risk
Our sales contracts are primarily denominated in U.S. dollars with a small number of contracts denominated in foreign currencies. A portion of our operating expenses are incurred outside the United States and denominated in foreign currencies and are subject to fluctuations due to changes in foreign currency exchange rates, particularly changes in the British pound and Euro. Additionally, fluctuations in foreign currency exchange rates may cause us to recognize transaction gains and losses in our statement of operations. Given the impact of foreign currency exchange rates has not been material to our historical operating results, we have not entered into derivative or hedging transactions, but we may do so in the future if our exposure to foreign currency should become more significant.
58
Table of Contents
Critical Accounting Policies and Estimates
Our financial statements are prepared in accordance with U.S. generally accepted accounting principles, or GAAP. The preparation of these financial statements requires us to make estimates and assumptions that affect the reported amounts of assets, liabilities, revenue, expenses, and related disclosures. We evaluate our estimates and assumptions on an ongoing basis. Our estimates are based on historical experience and various other assumptions that we believe to be reasonable under the circumstances. Our actual results could differ from these estimates.
The critical accounting estimates, assumptions and judgments that we believe have the most significant impact on our consolidated financial statements are described below.
Revenue Recognition
We derive revenue from two sources: (1) product revenue which includes hardware and embedded software and (2) support revenue which includes customer support, hardware maintenance and software upgrades on a when-and-if-available basis.
We recognize revenue when:
| • | Persuasive evidence of an arrangement exists—We rely upon sales agreements and/or purchase orders to determine the existence of an arrangement. |
| • | Delivery has occurred—We typically recognize product revenue upon shipment, as title and risk of loss are transferred to our channel partners at that time. Products are typically shipped directly by us to customers, and our channel partners do not stock our inventory. |
| • | The fee is fixed or determinable—We assess whether the fee is fixed or determinable based on the payment terms associated with the transaction. |
| • | Collection is reasonably assured—We assess collectability based on credit analysis and payment history. |
Our product revenue is derived from the sale of hardware and operating system software that is integrated into the hardware and therefore deemed essential to its functionality. The hardware and the operating system software essential to the functionality of the hardware are considered non-software deliverables and, therefore, are not subject to industry-specific software revenue recognition guidance.
Support revenue is derived from the sale of maintenance and support agreements. Maintenance and support agreements include the right to receive unspecified software upgrades and enhancements on a when-and-if-available basis, bug fixes, parts replacement services related to the hardware, as well as access to our cloud-based management and support platform. Revenue related to maintenance and support agreements are recognized ratably over the contractual term, which generally range from 1 to 3 years. Costs related to maintenance and support agreements are expensed as incurred. In addition, our Forever Flash program provides our customers who continually maintain active maintenance and support for three years with an included controller refresh with each additional three year maintenance and support renewal. In accordance with multiple-element arrangement accounting guidance, the controller refresh represents an additional deliverable that is a separate unit of accounting. The allocated revenue is recognized and the related cost is expensed in the period in which these controllers are shipped.
Most of our arrangements, other than stand-alone renewals of maintenance and support agreements, are multiple-element arrangements with a combination of product and support related deliverables (as defined above). Under multiple-element arrangements, we allocate consideration at the inception of an arrangement to all deliverables based on the relative selling price method in accordance with the hierarchy provided by the multiple-element arrangement accounting guidance, which includes (i) vendor-specific objective evidence, or VSOE, of selling price, if available; (ii) third-party evidence, or TPE, of selling price, if VSOE is not available; and
59
Table of Contents
(iii) best estimate of selling price, or BESP, if neither VSOE nor TPE is available. As discussed below, because we have not established VSOE for any of our deliverables and TPE typically cannot be obtained, we typically allocate consideration to all deliverables based on BESP.
| • | VSOE—We determine VSOE based on our historical pricing and discounting practices for the specific products and services when sold separately. In determining VSOE, we require that a substantial majority of the stand-alone selling prices fall within a reasonably narrow pricing range. We have not established VSOE for any of our hardware and support related deliverables given that our pricing is not sufficiently concentrated (based on an analysis of separate sales of the deliverables) to conclude that we can demonstrate VSOE of selling prices. |
| • | TPE—When VSOE cannot be established for deliverables in multiple-element arrangements, we apply judgment with respect to whether we can establish a selling price based on TPE. TPE is determined based on competitor prices for interchangeable products or services when sold separately to similarly situated customers. However, because our products contain a significant element of proprietary technology and our solutions offer substantially different features and functionality, the comparable pricing of products with similar functionality typically cannot be obtained. |
| • | BESP—When neither VSOE nor TPE can be established, we utilize BESP to allocate consideration to deliverables in a multiple element arrangement. Our process to determine our BESP for products and services is based on qualitative and quantitative considerations of multiple factors, which primarily include historical sales, margin objectives and discount behavior. Additional considerations are given to other factors such as customer demographics, costs to manufacture products or provide services, pricing practices and market conditions. |
Deferred Commissions
Deferred commissions consist of direct and incremental costs paid to our sales force related to customer contracts. The deferred commission amounts are recoverable through the revenue streams that will be recognized under the related customer contracts. Direct sales commissions are deferred when earned and amortized over the same period that revenue is recognized from the related customer contract. Amortization of deferred commissions is included in sales and marketing expense in the consolidated statements of operations.
Stock-Based Compensation
We measure and recognize compensation expense for all stock-based awards granted to our employees and other service providers, including stock options and restricted stock awards, based on the estimated fair value of the award on the grant date. We use the Black-Scholes option pricing model to estimate the fair value of stock option awards. The fair value of restricted stock awards is determined based on the fair value of our Class B common stock estimated as part of the capital stock and business enterprise valuation process. The fair value is recognized as an expense, net of estimated forfeitures, on a straight line basis over the requisite service period. For stock-based awards granted to employees with a performance condition, we recognize stock-based compensation expense for these awards under the accelerated attribution method over the requisite service period when management determines it is probable that the performance condition will be satisfied.
Our use of the Black-Scholes option pricing model requires the input of highly subjective assumptions, including the fair value of the underlying common stock, expected term of the option, expected volatility of the price of our common stock, risk-free interest rates and the expected dividend yield of our Class B common stock. The assumptions used in our option pricing model represent management’s best estimates. These estimates involve inherent uncertainties and the application of management’s judgment. If factors change and different assumptions are used, our stock-based compensation expense could be materially different in the future.
These assumptions and estimates are as follows:
| • | Fair Value of Class B Common Stock. As our stock is not publicly traded, we must estimate the fair value of our common stock, as discussed in “Common Stock Valuations” below. |
60
Table of Contents
| • | Expected Term. The expected term represents the period that our stock-based awards are expected to be outstanding. The expected term assumptions were determined based on the vesting terms, exercise terms and contractual lives of the options. |
| • | Expected Volatility. Since we do not have a trading history of our Class B common stock, the expected volatility is determined based on the historical stock volatilities of our comparable companies. Comparable companies consist of public companies in our industry which are similar in size, stage of life cycle and financial leverage. We intend to continue to apply this process using the same or similar public companies until a sufficient amount of historical information regarding the volatility of our own share price becomes available, or unless circumstances change such that the identified companies are no longer similar to us, in which case, more suitable companies whose share prices are publicly available would be used in the calculation. |
| • | Risk-Free Interest Rate. The risk-free interest rate is based on the implied yield available on U.S. Treasury zero-coupon issues with remaining terms similar to the expected term on the options. |
| • | Dividend Rate. We have never declared or paid any cash dividends and do not plan to pay cash dividends in the foreseeable future, and, therefore, use an expected dividend yield of zero. |
The following table summarizes the assumptions used in the Black-Scholes option-pricing model to determine the fair value of our stock options for employees and non-employees:
| Fiscal Year Ended January 31, | Six Months Ended July 31, | |||||||||||||||
| 2014 | 2015 | 2014 | 2015 | |||||||||||||
| (unaudited) | ||||||||||||||||
| Expected term (in years) |
5.3 - 10.0 | 5.0 - 10.0 | 5.4 - 10.0 | 6.0 - 7.4 | ||||||||||||
| Expected volatility |
62% - 69% | 55% - 68% | 62% - 68% | 48% - 52% | ||||||||||||
| Risk-free interest rate |
0.8% - 2.6% | 1.3% - 2.6% | 2.0% - 2.5% | 1.5% - 1.9% | ||||||||||||
| Dividend rate |
— | — | — | — | ||||||||||||
| Fair value of common stock |
$1.46 - $2.98 | $4.81 - $12.65 | $4.81 - $9.40 | $14.12 - $18.16 | ||||||||||||
In addition, we are required to estimate the expected forfeiture rate and only recognize expense for those shares that are expected to vest. We estimate the expected forfeiture rate based on historical experience and our expectations regarding future pre-vesting termination behavior of employees and other service providers. To the extent our actual forfeiture rate is different from our estimate, stock-based compensation expense is adjusted accordingly.
We will continue to use judgment in evaluating the assumptions related to our stock-based compensation on a prospective basis. As we continue to accumulate additional data related to our Class B common stock, we may refine our estimation process, which could materially impact our future stock-based compensation expense.
Common Stock Valuations
The fair value of the Class B common stock underlying our stock options was determined by our board of directors. The valuations of our Class B common stock were determined in accordance with the guidelines outlined in the American Institute of Certified Public Accountants Practice Aid, Valuation of Privately-Held-Company Equity Securities Issued as Compensation. In the absence of a public trading market, our board of directors, with input from management, exercised significant judgment and considered numerous objective and subjective factors to determine the fair value of our Class B common stock as of the date of each option grant, including the following factors:
| • | contemporaneous valuations performed by unrelated third-party valuation firms; |
| • | the prices, rights, preferences and privileges of our convertible preferred stock relative to those of our Class B common stock; |
| • | the lack of marketability of our Class B common stock; |
| • | our actual operating and financial performance; |
61
Table of Contents
| • | current business conditions and projections; |
| • | our hiring key personnel and the experience of our management; |
| • | our history and the timing of the introduction of new products and services; |
| • | our stage of development; |
| • | the likelihood of achieving a liquidity event, such as an initial public offering or a merger or acquisition of our business given prevailing market conditions; |
| • | the illiquidity of stock-based awards involving securities in a private company; |
| • | the market performance of comparable publicly traded companies; |
| • | recent private stock sales transactions; and |
| • | U.S. and global capital market conditions. |
In valuing our Class B common stock, the fair value of our business, or Enterprise Value, was determined using an income approach and a market approach. The Enterprise Value determined was then adjusted to: (1) add back cash on hand and tax benefits from NOLs and (2) remove certain long-term liabilities in order to determine an equity value, or Equity Value. The resulting Equity Value was then allocated to the Class B common stock using combination of the option pricing method and a Probability Weighted Expected Return Method. After the Equity Value is determined and allocated to the various classes of shares, a discount for lack of marketability, or DLOM is applied to arrive at the fair value of the Class B common stock. A DLOM is applied based on the theory that as a private company an owner of the stock has limited opportunities to sell this stock and any such sale would involve significant transaction costs, thereby reducing overall fair market value.
Our assessments of the fair value of the Class B common stock for grant dates between the dates of the valuations were based in part on the current available financial and operational information and the Class B common stock value provided in the most recent valuation as compared to the timing of each grant. For financial reporting purposes, we considered the amount of time between the valuation date and the grant date to determine whether to use the latest Class B common stock valuation or a straight-line calculation between the two valuation dates. This determination included an evaluation of whether the subsequent valuation indicated that any significant change in valuation had occurred between the previous valuation and the grant date.
Once we are operating as a public company, we will rely on the closing price of our Class A common stock as reported by the NYSE on the date of grant to determine the fair value of our Class A common stock.
Based on the assumed initial public offering price per share of $ , which is the midpoint of the offering price range set forth on the cover page of this prospectus, the aggregate intrinsic value of our outstanding stock awards as of July 31, 2015 was $ million, of which $ million related to vested awards and $ million related to unvested awards.
Recent Accounting Pronouncement
In May 2014, the Financial Accounting Standards Board, or FASB, issued Accounting Standards Update No. 2014-09 Revenue from Contracts with Customers, or ASU 2014-09. ASU 2014-09 supersedes the revenue recognition requirements in Revenue Recognition (Topic 605), and requires entities to recognize revenue when it transfers promised goods or services to customers in an amount that reflects the consideration to which the entity expects to be entitled to in exchange for those goods or services. In August 2015, the FASB issued Accounting Standards update No. 2015-14 Revenue from Contracts with Customers, or ASU 2015-14. ASU 2015-14 defers the effective date for ASU 2014-09, and accordingly the effective date for us commences on February 1, 2018 and early adoption is allowed for our fiscal year beginning February 1, 2017. This standard will be applied using either the full or modified retrospective adoption methods. We are currently evaluating adoption methods and the impact of this standard on our consolidated financial statements.
62
Table of Contents
A NOTE FROM THE FOUNDERS AND CEO
Most storage companies are beginning to use flash memory to try to deliver higher performance data storage. At Pure, we are transforming the storage industry. Yes, we are delivering faster storage, but we are also delivering radically simpler storage—imagine storage with the ease of use of a smartphone. At the same time, we are changing the way storage is sold and maintained, delivering a dramatically better customer experience at a lower overall cost. We have focused on making storage so fast and so economical that organizations can do things with their data and applications that would never have been possible with their existing storage.
We call ourselves Puritans, and we proudly wear orange. In addition to assembling an outstanding team, we have built a special company culture, which we call the entrepreneurial workforce:
| • | Everyone at Pure is an owner and is empowered like one—We strive for transparency, sharing as much information as possible with the whole company. We communicate the bad news as well as the good, so that all can contribute to making our products, our customers’ experiences and our company better; |
| • | We emphasize team rather than individual success—We win together and we lose and learn together. We focus on growing the pie rather than playing politics to carve it up; |
| • | We behave more like missionaries than mercenaries—Puritans are striving to make the world of IT better. We focus on doing the right thing for the long term, not on looking for short cuts; and |
| • | Most of all, we focus on supreme customer and partner satisfaction—When a customer has an issue, even if the problem lies outside of Pure, Puritans pitch in to make things right. We endeavor to do our jobs so well that customers and partners love our storage platform and love working with our company. |
As we recruit new Puritans, we look for and reinforce these values. The quality of our team is by far our most valuable asset.
We believe that the market opportunity in front of Pure Storage is substantial. While we have executed well to date, we are even more excited about the road ahead:
| • | We are investing heavily in research and development to deliver the multiple and substantive storage innovations we believe are necessary to accomplish our mission and execute on the opportunity before us; |
| • | We are going the extra mile to make our storage platform so simple and easy to use that it will continue to delight our customers; |
| • | We are striving to replace the 3 to 5 year rip-and-replace storage cycle with evergreen storage and cloud-based management and support; and |
| • | We are investing aggressively in sales, marketing and our channel to maximize growth and market share. |
In short, we plan to continue to manage Pure in the same fashion as we have managed Pure as a private company—striving to do the right thing for the long term rather than optimizing for the near term.
We are thrilled to welcome those of you who will join us on our journey, as customers, partners, employees or as shareholders. We have the opportunity to build a large and enduring independent company, which we see as the best outcome for all of our constituencies.
Thank you for your consideration.
Cheers,
|
|

|

| ||
| John “Coz” Colgrove Founder |
John Hayes Founder |
Scott Dietzen CEO |

63
Table of Contents
Overview
Our mission is to deliver data storage that transforms business through a dramatic increase in performance and reduction in complexity and costs. Our innovative technology replaces storage systems designed for mechanical disk with all-flash systems optimized end-to-end for solid-state memory. At the same time, our innovative business model replaces the traditional forklift upgrade cycle with an evergreen storage model of hardware and software upgrades and maintenance.
Our next-generation storage platform and business model are the result of our team’s substantial experience in enterprise storage and web-scale infrastructure, as well as frustration with the industry’s status quo. This deep industry understanding led to the development of our three-part integrated platform: the Purity Operating Environment, our flash-optimized software, FlashArray, our modular and scalable all-flash array hardware, and Pure1, our cloud-based management and support. Our platform can deliver a 10X acceleration in business applications over legacy disk-based storage. It is also designed to be compatible with existing infrastructure, substantially more reliable, and power and space efficient.
Our business model builds on our technical innovations to reverse the traditional storage business model. Instead of moving data between old and new systems via forklift upgrades, we keep business data and applications in place and upgrade technology around it. Our platform and business model are designed to add value to customers for a decade or more, reducing total cost of storage ownership while increasing loyalty.
Our innovations help rebalance the datacenter by closing the performance gap between legacy storage technology and servers and networks. But it is the simplicity of our platform and business model that is revolutionizing the enterprise storage experience. Together, our innovations have helped our customers realize the promise of the cloud model for IT and the benefits of Moore’s Law. This has yielded industry-leading Net Promoter scores, based on the results of customer satisfaction surveys we conducted.
Since launching FlashArray in May 2012, our customer base has grown to over 1,100 customers. Our customers include large and mid-size organizations across a diverse set of industry verticals, including cloud-based software and service providers, consumer web, education, energy, financial services, governments, healthcare, manufacturing, media, retail and telecommunications. Our platform is used for a broad set of storage use cases, including database applications, private and public cloud infrastructure, virtual server infrastructure and virtual desktop infrastructure. Our platform helps customers increase employee productivity, improve operational efficiency, make better decisions through faster, more accurate analytics and deliver more compelling user experiences to their customers and partners.
We sell our platform predominantly through a high touch, channel-fulfilled model. Our sales force works collaboratively with our global network of distribution and channel partners, which provides us broad sales reach while maintaining direct customer engagement.
We have experienced significant growth. Our revenue increased from $6.1 million for the fiscal year ended January 31, 2013 to $42.7 million for the fiscal year ended January 31, 2014 and to $174.5 million for the fiscal year ended January 31, 2015, representing year-over-year revenue growth of 603% and 308% for our two most recent fiscal years. Our revenue increased from $59.4 million for the six months ended July 31, 2014 to $158.7 million for the six months ended July 31, 2015, representing period-over-period growth of 167% for our most recent interim period. Our net loss was $23.4 million, $78.6 million and $183.2 million for the fiscal years ended January 31, 2013, 2014 and 2015, respectively, and $95.2 million and $113.0 million for the six months ended July 31, 2014 and 2015, respectively. For the fiscal year ended January 31, 2015 and the six months ended July 31, 2015, 77% and 78% of our revenue was from the United States, and 23% and 22% from the rest of the world, respectively.
64
Table of Contents
Industry Background
Technology continues to transform business—redefining how products and services are built, how customers and partners are served and how organizations innovate. As a result, organizations face the urgent need to operate with greater speed and to leverage technology to be smarter and more innovative. Indeed, the speed, agility and efficiency of an organization’s information systems contribute to and, in many cases, even define competitive advantage.
Organizations must make technology investments that improve IT performance and in parallel reduce the cost and complexity of their operations. Technology that can quickly adapt to ever-changing requirements and drive these dual and seemingly opposed requirements of improving both performance and efficiency is essential.
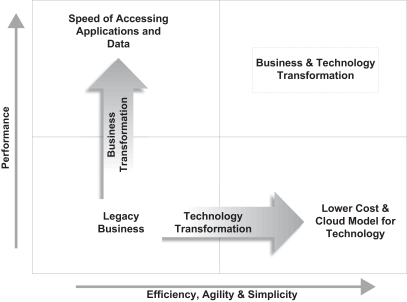
Business Transformation through Improved Performance
The speed of servers and networks has dramatically improved over the past several decades, but the performance of disk-based storage has not kept up. Mechanical disk has fundamental physical limitations in reading and writing data and typically operates in milliseconds, 1,000 times slower than the microsecond processing speed of today’s computing and networking systems. Disk-based storage is now an obstacle to application performance, squandering investments in fast servers that may spend a substantial portion of processing time waiting for disks to seek and rotate to deliver data.
Flash memory is a solid-state storage technology that can eliminate this storage bottleneck while providing better performance, greater storage density and improved power efficiency as compared to disk. For instance, a 1TB flash device can perform 64 operations in parallel while a 1TB disk can only perform a single operation at a time. Flash memory has transformed today’s consumer technology experience—it is the storage media inside smartphones—and now it is time for business to enjoy those same benefits. The price performance of flash technology, too, has improved dramatically in recent years. Already, leading web-scale companies such as Apple, Facebook and Google are utilizing flash-based storage in their datacenters.
Even when retrofitted with flash, legacy approaches to storage generally fall short. Too often, they rely on legacy storage software, which was optimized for the serial and sequential read and write patterns of disk. They do not take full advantage of the parallelizable and random access nature of flash. Even modern hybrid storage approaches—those that pair flash and disk designs—are inadequate, as they suffer from the speed of the far
65
Table of Contents
slower disk operations. For example, even if 90% of data read and write operations are processed on flash technology and 10% of operations are processed on disk, applications can suffer from nearly a 5X performance reduction as compared to all-flash storage.
IT Transformation through Reduced Costs and Complexity
Cloud computing has been one of the more compelling IT advances in years. Today, organizations use shared resources in the cloud, significantly reducing the cost and complexity of operations and datacenters. Organizations around the world are now adopting many of the core tenets of this cloud model to transform their own operations and datacenters.
Legacy disk-based storage is generally inconsistent with the design tenets of the cloud. It does not scale easily, and is complex and costly to manage, often requiring expert consultants for routine operations. Most legacy disk-based storage requires organizations to replace their storage systems every 3 to 5 years. This is expensive and worrisome for customers, who must juggle upgrades and downtime during the data migration period. The result is an endless and time-consuming cycle of procurement, provisioning and troubleshooting of data storage.
Next-Generation Storage
With the increased demands of a complex and changing business environment, we believe organizations not only desire but also require a new storage platform that combines the following:
| • | Dramatically improved performance to keep up with the demands of the business; |
| • | Reliability, security and data management services for operating in mission critical environments; |
| • | Seamless interoperability for compatibility with existing IT infrastructure investments; |
| • | Simplicity, agility, easy automation and elasticity to enable the cloud model of IT; and |
| • | Greater price performance and reduced total cost of ownership. |
Market Opportunity
Pure Storage serves the market for enterprise storage and related storage software. According to IDC, the combined worldwide spend by enterprises on external storage hardware priced at more than $50,000 per array and storage and device management, storage infrastructure and storage replication software is estimated to grow from approximately $24.2 billion in 2014 to $27.0 billion in 2018. Hardware spend in this area alone will grow from $16.5 billion in 2014 to $18.0 billion in 2018, while software spend will grow from $7.7 billion in 2014 to $9.0 billion in 2018. Customers are increasingly replacing traditional disk-based systems with all-flash storage, and spend on all-flash solutions is expected to grow from $1.3 billion in 2014 to $3.3 billion in 2018, representing a 26.6% compounded annual growth rate. We believe the benefits of next-generation flash storage will drive flash to ultimately become the predominant form of primary enterprise data storage.
66
Table of Contents
Our Solution
Pure Storage is defining the next generation of enterprise data storage. We have pioneered the all-flash array category and have coupled that with our customer-centric business model. Our storage platform integrates the Purity Operating Environment, our flash-optimized software, FlashArray, our modular and scalable all-flash array hardware, and Pure1, our cloud-based management and support. This platform, combined with ongoing maintenance and support, provides an evergreen storage solution that enables our customers to both accelerate business performance and increase the efficiency, agility and simplicity of their operations. We believe that our approach is having a profound impact both on our customers and on the data storage industry as a whole:
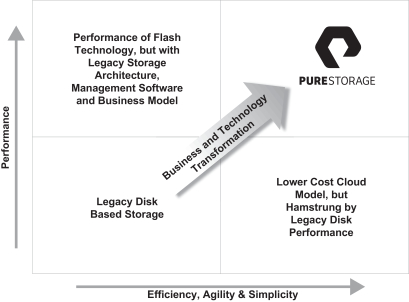
| • | Business Transformation. With Pure Storage, customers’ business applications run faster—helping them to improve yields, employee productivity, and customer and partner experiences, allowing them to make smarter decisions, and enabling them to increase innovation across their organizations. |
| • | Faster Business. A provider of cardiac-monitoring services can have its technicians analyze more patient data—65 patient records per day versus 35 per day, gaining operational efficiency that positively impacts its bottom line. |
| • | Smarter Business. An auto parts retailer can run reports to optimize inventory across over one hundred locations and millions of products in about 12 hours, down from seven days, allowing it to reduce inventory on hand while increasing the breadth of products held in inventory. |
| • | More Innovative Business. A web-based image publishing service can eliminate a storage bottleneck with a 5x improvement in performance, giving it confidence to deploy new products without fear that user experience would suffer. |
| • | Technology Transformation. Our platform increases the efficiency, agility and simplicity of IT infrastructure, enabling our customers to reduce the cost and complexity of operations and implement the cloud model. Technology transformations for customers who adopt our storage platform include: |
| • | Reduced Cost and Complexity. Our customers can adopt our evergreen storage model, which we have designed to eliminate disruptive technology refreshes and extend the life of storage investments. We estimate that, over a six year period, our customers can save an average of more than $500,000 annually for every 250TB of tier-1 performance disk storage replaced with our storage platform. |
67
Table of Contents
| • | Implement the Cloud Model. The combination of our modular and scalable FlashArray hardware and our software-defined management capabilities allows customers to consolidate a variety of workloads on a single storage platform. The operational simplicity, quick provisioning, easy programmability, low management overhead and linear, low-cost scaling of our platform enable a more cloud-style model for storage. |
The following differentiates our storage platform:
| • | High Performance. Our FlashArray and Purity Operating Environment software were specifically architected for the fast parallelizable and random access of flash. The result is that customers can eliminate more than one year of cumulative application latency every month as compared to legacy disk-based storage in typical deployments. |
| • | Enterprise Resiliency. Our platform, through the Purity Operating Environment, enables customers to maintain continuous access to their data without a loss in performance. The Purity Operating Environment efficiently and redundantly stores data, ensuring that data is available at all times, even in the event of hardware or software component failures or during upgrades. In addition, the Purity Operating Environment allows customers to recover from disasters using near zero overhead snapshots, which can be replicated to multiple locations globally. All of these resiliency features are built-in and do not require additional licenses. |
| • | Simplicity. Our platform is simple to deploy, manage, and upgrade for a wide variety of customer use cases—the basic operating commands fit on a single, folding business card. Our platform is designed to seamlessly integrate with existing investments in server and application infrastructure. |
| • | Agile Management. Through Pure1, we deliver an integrated cloud-based management and support experience. We originate most of the support interactions we have with our customers, consistent with our proactive focus on helping our customers quickly respond to issues and stay ahead of changes to their storage requirements. We offer multiple software interfaces for customers to automate the operation of our storage platform at cloud scale. By combining simplicity, automation and proactive support, we reduce the administrative burden and the risk of human error. |
| • | Evergreen Storage. Our platform is designed to support customer deployments for a decade or more. Our modular all-flash array hardware and software enable enterprises to start as small as 10TBs and to scale storage deployments to petabyte levels. Through our innovative business model, we provide software updates, any needed hardware replacements, and a controller refresh every three years so customers can run the latest Purity Operating Environment for predictable maintenance fees. |
| • | Compelling Economics. Our FlashReduce software achieves on average greater than 5-to-1 data reduction for a wide range of enterprise applications. We utilize consumer-grade flash memory, which is more cost effective and reliable than enterprise-grade flash memory. Consumer-grade flash prices are now approaching those of performance disk on a raw capacity basis. As a result, customers can achieve price-performance levels that enable our platform to be deployed across a wide range of use cases. |
| • | Lower Total Cost of Ownership. Our platform reduces the space, power, cooling, management overhead and other associated expenses as compared to disk-based storage. A study commissioned by us from Forrester Consulting found that a composite organization could expect to recoup its investment in our storage system within 14 months and achieve a 102% risk-adjusted return on investment from reduced operational costs and increased business benefits over a three-year period. |
Growth Strategies
Key elements of our growth strategy include:
| • | Relentlessly Innovate and Maintain Technology Leadership. We will continue to invest in product innovation and technology leadership and plan to enhance our flash-optimized software, modular and scalable hardware and cloud-based management and support. We have released multiple generations of our FlashArray products since our founding in 2009 and release enhanced software versions of our |
68
Table of Contents
| Purity Operating Environment with new features approximately every six months. We believe that continued innovation is critical to addressing the complex and changing requirements of data storage and that maintaining our technology leadership will help us expand our addressable market. |
| • | Continue to Drive Large Customer Adoption. We believe that our market is large and untapped as a significant number of enterprises, service providers and government organizations have yet to adopt all-flash storage throughout their technology infrastructure. We intend to grow our base of customers by promoting our platform, increasing our investment in sales and marketing and leveraging our network of channel partners. We are investing in our account teams to cultivate strong relationships with our larger customers, which, in collaboration with our channel partners, should allow us to further penetrate large enterprises across all verticals, industries and geographies. |
| • | Further Leverage our Channel Ecosystem. We have been successful in using a channel-focused model to drive our sales, and we continue to believe that by partnering with the channel and service providers, we can reach the broadest number of customers. By investing in training, demand generation and partner programs, we believe we can enable many of our partners to independently identify, qualify, sell and upgrade customers, with limited involvement from us. We intend to continue to invest in our channel to add scalable distribution partners, systems integration partners and service provider partners, including providers of cloud-based infrastructure offerings. |
| • | Drive Greater Penetration into our Existing Customer Base. We believe our over 1,100 customers represent a significant opportunity for us to realize incremental sales. We sell additional products and services to our customers as the data within their existing application deployments naturally grows and as customers migrate additional applications to our platform. As of January 31, 2015, more than half of our customers had made additional purchases within 12 months of their initial purchase. In addition, we estimate that we have only penetrated a small portion of the total footprint in many of our larger customers. |
| • | Cultivate our Inspirational Culture. We believe our culture is a critical part of our success. We strive to maintain an exciting and supportive atmosphere that attracts great talent and inspires our employees to excel and deliver a differentiated experience for our customers. The five core values upon which our Puritan company culture is based are customer-first, creativity, teamwork, persistence and ownership. These values permeate our company and help define our business, customer, shareholder and employee objectives. |
| • | Leverage our Technology Ecosystem. We have developed strategic relationships with a number of technology vendors to allow integration of our platform with their offerings, enabling a streamlined experience for our customers. We have developed FlashStack, our converged infrastructure offering which incorporates best of breed solutions from Cisco, VMware, Citrix and Microsoft, and we also have developed a variety of application-specific solutions, including optimizing our platform for high performance database applications such as Oracle, SAP and Microsoft and virtual infrastructure such as VMware, Citrix and OpenStack. |
Innovative Technology and Business Model
Our next-generation storage platform is comprised of three integrated components, all designed from the ground-up for solid-state storage: the Purity Operating Environment, our flash-optimized software; FlashArray, our modular and scalable all-flash array hardware; and Pure1, our cloud-based management and support. These three components are complemented by our innovative business model, which is designed to improve our customers’ experience related to the procurement, upgrade, expansion and ownership of storage.
69
Table of Contents
Purity Operating Environment
The heart of our storage platform is the Purity Operating Environment, our proprietary software that runs across all FlashArray generations and is included with the purchase of our hardware. Key features of our Purity Operating Environment include:
| • | FlashReduce: Data reduction technologies to reduce the effective cost of flash. FlashReduce combines inline deduplication, inline compression, and background reduction technologies to maximize the amount of data that can be stored on the flash media, thereby reducing its effective cost per gigabyte. Our proprietary FlashReduce technology employs a variable block size reduction and can deliver up to 2X better data reduction as compared to the leading competitive products, resulting in an average of greater than 5-to-1 data reduction across a wide range of use cases and data types. |
| • | FlashProtect: Enterprise-grade reliability and data protection. FlashProtect implements high availability, or HA, enabling the FlashArray to self heal in the face of hardware or software failures, and RAID-3D dual parity protection to ensure that flash device failures, latent bit errors or slow response within a particular flash device do not have any impact on the overall array. FlashProtect is designed to maintain performance through these failures and enables our arrays to be easily upgraded without scheduled downtime, setting new expectations for storage resiliency. The Purity Operating Environment also implements strong data-at-rest encryption of all data, all the time. |
| • | FlashRecover: Local and remote data protection built-in. FlashRecover provides a comprehensive and tightly integrated backup and disaster recovery solution, including local snapshots, replication, remote snapshots and automated policy management, thereby decreasing cost and complexity of data protection. |
| • | FlashCare: Extends life and ensures performance of consumer-grade flash. FlashCare extends the life expectancy and improves the performance and reliability of flash by writing data in a manner that is optimized for the geometry of flash. FlashCare enables a FlashArray to effectively mix multiple generations, types and suppliers of flash, allowing flexibility and expandability over time for our customers as well as providing supplier flexibility for Pure. |
FlashArray Hardware
FlashArray is a modular all-flash storage array designed to maximize the performance and density of flash, optimize the advanced software services that the Purity Operating Environment provides, and minimize overall solution cost for customers. We have brought four generations of FlashArray to market, and we are currently selling both the FlashArray 400-Series and the newer FlashArray//m, which we announced in June 2015. The FlashArray 400-Series features independent controllers and storage shelves, while the latest generation FlashArray//m features a chassis-based design, fully integrating HA controllers and flash in a single appliance. FlashArray//m is based upon an in-house hardware design enabling us to further optimize performance, density and cost. FlashArray is built around the following principles and innovations:
| • | Modularity and Upgradability. All FlashArrays are designed to be modular and upgradable over time, enabling our vision of evergreen storage and eliminating the 3 to 5 year forklift refresh cycle of legacy storage systems. We have advanced this modular design in FlashArray//m, which, similar to blade servers, provides a long-lived chassis that affords easy customization to serve growing deployments, evolving use cases and incremental improvement over time. Our compute-efficient design enables the non-disruptive introduction of new modules and expansion of arrays. |
| • | Rapid Innovation. Our FlashArrays are based upon two core technologies, Intel CPUs and consumer-grade flash memory, both of which have historically improved consistent with Moore’s Law. Consumer-grade flash has been the first to introduce improved features and functionality and continues to lead flash memory innovations. The FlashArray’s modular design allows us to deliver both processor and flash upgrades approximately every 9 to 12 months, and enables customers to adopt these advances within their existing FlashArrays without data migration, downtime or performance |
70
Table of Contents
| impact. We intend to continue to release new hardware modules and software features and updates for the FlashArray on a more rapid pace than our legacy competitors. |
| • | Maximum Performance. Our FlashArrays are designed to maximize the performance of flash. FlashArray//m leverages native high bandwidth and low latency PCIe/NVMe networking to modules and controllers, a SAS fabric for external expansion and high-performance non-volatile RAM and flash modules. As a result, our FlashArrays deliver hundreds of thousands of storage input/output operations per second at less than 1 millisecond average latency, which is generally at least 10X faster than traditional disk-based storage. |
| • | High Density, Low Cost. We have introduced cost and density improvements in each succeeding generation of our FlashArray. FlashArray//m fully-integrates controller and flash modules inside the three rack unit chassis, allowing for significant component cost reduction and increase density. More importantly, the FlashArray//m often utilizes one-tenth the power and space as compared to the legacy disk-based storage it replaces. |
| • | Simplicity and Reliability. Our FlashArray//m consolidates all components into an appliance-like form factor to improve simplicity and reliability. With a single component to rack, install and service, the FlashArray//m is designed to be extremely simple without sacrificing the scalability and upgradability of an enterprise array. Overall system reliability is also improved by removing unnecessary components, such as cables, cards and shelves, each of which adds failure risk to the system. Uptime across our FlashArray install base is approaching 99.9999% based on a three month rolling average and has exceeded 99.999% since early 2013. |
| • | End-to-End Flash Optimization. Because we both design our FlashArray chassis, controllers and flash modules in-house, and develop all of our Purity Operating Environment software specifically for our hardware, we are able to realize end-to-end optimizations between software and flash. This allows us to deliver solutions with high density and power efficiency, tight integration for simplicity and at a lower cost. We expect further synergies in this regard as we continue our innovation more deeply in end-to-end hardware and software optimization. |
Pure1 Management and Support
Pure1 is a cloud-based management and support platform that enables our customers, our support staff and our partners to seamlessly and securely collaborate to maximize the reliability of the Pure Storage platform while minimizing management overhead and cost to the customer. Our cloud-based platform removes the need for dedicated storage management infrastructure, enables customers to monitor a global storage deployment from a mobile device and simplifies integration with other datacenter management solutions. Our FlashArrays embed our Pure1 technology, which creates an “always-on” support connection to Pure Storage, sending telemetric data to Pure to help us deliver a more proactive management and support experience. This approach has helped to drive high levels of customer satisfaction. We have a Net Promoter score of approximately 80, based on customer satisfaction surveys we conducted through August 2015. Pure1 consists of three integrated modules:
| • | Pure1 Manage is an integrated suite of on-array and cloud-based management tools that perform multi-array monitoring and management tasks. In addition, Pure1 maintains detailed performance and capacity utilization information for years, allowing customers to analyze historical performance and capacity growth to plan for future deployments. The Pure1 management model is dramatically simpler than that of the legacy storage platforms—the basic operating commands fit on a single, folding business card. In our view, only by removing decades of accumulated complexity from the management model of legacy storage can we achieve the promise of the software-defined, cloud-friendly datacenter. |
71
Table of Contents
| • | Pure1 Connect includes a comprehensive set of automation interfaces, with both full command-line interface and REST API access to all management functions of the FlashArray. Pure1 also includes connectors to popular virtualization platforms such as VMware vSphere and OpenStack, allowing our customers to natively manage the FlashArray from within their virtualization management tools. |
| • | Pure1 Support couples our innovative support technology and cloud automation with highly skilled engineers to proactively deliver a superior support experience. By using automated analytics to monitor our customers’ arrays, we can detect and alert customers proactively of potential problems and ensure that when one customer has an issue, other customers at risk are identified and notified. With Pure1, we initiate most support calls to the customer. When issues are identified we can often resolve them in conjunction with the customer before they have an impact on overall array health. Pure1 also includes a RemoteAssist capability, which enables our support personnel, with customer approval, to log in to a FlashArray and perform resolution and even routine maintenance tasks, removing even more of the storage management burden from customers. |
Pure1 Support is offered in two levels: Advanced and Premium. We do not offer “basic” support service, as we believe that every customer deployment is critical and deserves 24x7 support. Pure1 Support Advanced includes 24x7 phone support with 30-minute maximum response time for critical issues, proactive monitoring, and a next-business-day service level for on-site replacement of failed hardware components. Pure1 Support Premium expands upon the service level of Advanced by reducing the maximum response time to 15 minutes for critical issues and reducing the service level for on-site parts replacement to 4 hours.
Business Model Innovation
In addition to our product leadership and differentiated customer experience, our business model innovation helps us achieve our vision of evergreen storage. We believe that the traditional storage business model is expensive, resource intensive and detrimentally impacts customer operations. Pure’s alternative approach is designed to eliminate this pain. We believe that it will be difficult for legacy storage vendors to copy our business model innovations given their dependence on complex licensing programs and regular forklift array replacement upgrades. We have created the following business model innovations and programs:
| • | All Software Included. All software functionality of the Purity Operating Environment is included in the base purchase price of a FlashArray, and our customers receive software updates and new features at no additional cost, so long as the customer maintains an active maintenance and support agreement. This approach is attractive to customers for its simplicity and fairness. |
| • | Forever Flash. Our Forever Flash program is a new approach to the storage array purchase and expansion lifecycle, which is enabled by our modular FlashArray hardware. Forever Flash provides an alternative to the traditional 3 to 5 year replacement cycle, instead allowing customers to incrementally improve array performance and capacity as needed, dramatically reducing cost and risk while increasing predictability. This enables customers to both extend the useful life of their hardware and avoid the cost and risk of recurring data migration. The Forever Flash program has three components that encourage ongoing ownership, expansion and continuous improvements in performance: |
| • | Flat and Fair. Our maintenance and support renewal rates are flat over time for a given array purchased by a customer, effectively serving as a promise that we will not increase the cost of maintenance in “out years” as many other vendors do. |
| • | Free Every Three. Customers who continually maintain active maintenance and support for three years are entitled to an included controller refresh with each additional three year maintenance and support renewal. This modernizes a deployed FlashArray, enables the latest performance, features and scale and encourages capacity expansion while reducing our support costs. |
72
Table of Contents
| • | Forever Maintenance. We will replace any failed hardware components, including flash media, indefinitely as long as a customer maintains active maintenance and support. This alleviates customer concerns over flash wear-out over time. We have seen low failure rates of our flash hardware during actual use, and we have designed this hardware to sustain more than a decade of operation. |
| • | Love Your Storage Guarantee. Our Love Your Storage Guarantee program was designed to help customers avoid the need to conduct proof of concept testing before purchase. Instead customers can buy a FlashArray for a given deployment with the assurance that if they are not satisfied with the purchase for any reason, they can return it for a full refund within 30 days. |
Our Customers
We target large and medium-sized enterprises, state, local and federal governments, schools and healthcare organizations globally. Our customer base includes over 1,100 organizations as of July 31, 2015 and included over 30, 200 and 700 organizations as of January 31, 2013, 2014 and 2015, respectively. We have deployed our storage platform with customers across multiple industry verticals. Our storage platform has been deployed in some of the largest and most sophisticated enterprise infrastructures in the world as well as smaller organizations with limited IT expertise or budget, such as hospitals, municipalities and school districts. Actual customer deployments range from a single FlashArray that can store a few terabytes of data to dozens of FlashArrays that, in the aggregate, can store multiple petabytes of data. Our customers include over 10% of the Fortune 500, and more than 100 of our customers have purchased over $1 million of our products and support. No individual customer represented more than 10% of our revenue in the fiscal year ended January 31, 2015 and the six months ended July 31, 2015.
The following is a list of representative customers by industry segment:
| Internet and Media |
Consumer and Retail |
Telecommunications and Service Providers | ||
| Lamar Media Rakuten Shutterfly SurveyMonkey |
Nordstrom Peet’s Coffee & Tea Picard Frozen Foods Sierra Nevada Brewing Co. |
Armor Defense LG CNS Softbank T-Mobile USA | ||
| Technology |
Healthcare |
Finance and Insurance | ||
| Avago Technologies Global Foundries Samsung Xerox |
Adventist Health Cord Blood Registry Hanger Methodist Hospitals |
Barclays PLC Farm Bureau of Michigan First Tennessee Bank Investec Asset Management | ||
| Software/SaaS |
Energy |
Government and Education | ||
| Dassault Systemes Intuit Symantec Xactly |
Duke Energy Guadalupe Valley Electric Cooperative Legacy Reserves Source Gas |
Carnegie Mellon University City of Austin Federal Deposit Insurance Corporation Sacramento City Unified School District | ||
73
Table of Contents
Customer Case Studies
The following are representative examples of how some of our customers have benefited from typical deployments of our storage platform:
Situation: LinkedIn is the leading social network for business professionals worldwide, with more than 364 million members globally. By 2012, LinkedIn’s rapid growth necessitated a new storage solution that would allow it to better deliver a seamless web experience to its users and run the internal applications critical to its business.
Solution and Benefit: For LinkedIn, the implementation of the FlashArray has driven long-term cost reductions, improved efficiency for its IT team and provided better business analytics for its internal teams. Since deploying the FlashArray, LinkedIn has decreased data access times to consistently less than 1 millisecond, for a total reduction of 3-5 milliseconds, resulting in a dramatic improvement in experience for both LinkedIn members and internal teams. With an average of 5.5:1 data reduction and upwards of 20:1 data reduction on read replicas and Oracle development environments, LinkedIn was able to decrease its storage footprint by 10X, while decreasing operational costs for power, cooling and rack space by 8X.
With the snapshot and cloning functionality of the Purity Operating Environment, LinkedIn has optimized its process for database refreshes, taking the process from over 24 hours to minutes. Since the initial deployment in 2012, LinkedIn has continued to expand the use of the FlashArray from front-end applications such as LinkedIn.com to Oracle testing and development, data warehouse and virtual server and virtual desktop deployments.
ConocoPhillips
Situation: ConocoPhillips is the world’s largest independent exploration and production company, based on proved reserves and production of liquids and natural gas. In 2014, ConocoPhillips was faced with increasing maintenance bills and complexity with its existing storage system. ConocoPhillips wanted a simple solution that was within its budget and would allow it to be faster and more agile, while reducing space, power and cooling requirements.
Solution and Benefit: After extensive testing, ConocoPhillips purchased multiple FlashArrays based on its simplicity and performance advantages, and its cost effectiveness. The ease of deployment and native replication were key factors relative to more complex alternative solutions that required installation of external software. The FlashArrays provided consistently high performance, enabling ConocoPhillips to confidently run financial reports 2X more frequently. In addition, with overall data reduction rates of over 4:1, the implementation of the FlashArrays enabled ConocoPhillips to reduce space requirements for the relevant systems by about 80%, condensing 14 data center floor tiles down to 3, with related power requirements decreased by over 90%, as compared to its existing disk-based storage systems. In fact, the switch to the FlashArray dropped the temperature by two degrees and the total power consumption by 2% across the entire data center. ConocoPhillips saw all of these benefits at a price at or below the cost of equivalent disk-based systems.
New York-Presbyterian Hospital
Situation: New York-Presbyterian Hospital (NYPH) is an academic medical center located in New York City and is ranked among the top ten hospitals in the United States. In 2014, NYPH was seeking to upgrade the storage underlying its virtual desktop and virtual server infrastructure, as well as the storage underlying a reporting application for its outpatient practices, and decided to test the FlashArray against an all-flash array from a legacy storage vendor. As a busy, leading hospital, NYPH was sensitive to any disruption or downtime, so selection of the right solution was critical.
74
Table of Contents
Solution and Benefit: After an extensive six-month proof of concept trial, NYPH selected the FlashArray for its resiliency and data reduction capabilities, as well as its ability to scale to support thousands of virtual desktop users and virtual server workloads. Only the FlashArray met NYPH’s failure and upgrade requirements and it had 2X better data reduction rates as compared to the competitive solution. NYPH transitioned its reporting application for its out-patient practices to the FlashArray with impressive results: the nightly batch report ran in just 2 hours, down from 10 hours on the hospital’s existing storage—a 5X reduction.
NYPH later purchased additional capacity to add more workloads to the FlashArray. The installation was completed in minutes, without any downtime or performance interruption. The FlashArray’s data reduction rates have allowed NYPH to realize the benefits of flash at or below the cost of disk-based storage, while the simplicity of the FlashArray allowed NYPH to eliminate the complex tiering associated with spinning disk. With the FlashArray, NYPH is ensuring an improved end user experience for doctors, nurses and staff and timely report generation to enable prompt and accurate decision making by NYPH leadership.
Nielsen
Situation: With a presence in more than 100 countries and services covering more than 90 percent of the world’s GDP and population, Nielsen is a global consumer research firm that major consumer brands rely on for insights into how they should manage their business. Data is the lifeblood of Nielsen’s business, which is why, in 2014, it made the decision to modernize some of its legacy disk-based storage to FlashArray, which handles this data more quickly, efficiently and effectively.
Solution and Benefit: FlashArray has given Nielsen a 3X reduction in latency—it has also replaced 50 racks of disk-based storage with just 5 racks of FlashArrays.
Sales and Marketing
Sales. We sell our storage platform predominantly through a high touch, channel-fulfilled sales model. Our sales organization supports our channel partners and is responsible for large-account penetration, global account coordination and overall market development. Our channel partners help market and sell our products, typically with assistance from our sales force. This joint sales approach provides us with the benefit of direct relationships with substantially all of our customers and expands our reach through the relationships of our channel partners. In certain geographies we sell through a two-tier distribution model. We also sell to service providers that deploy our products and offer cloud-based storage services to their customers.
We intend to continue to expand our partner relationships to further extend our sales coverage and to invest in education, training and programs to increase the ability of our channel partners to sell our products independently. We expect to continue to grow our sales organization and expand our international sales presence. Generally, our sales representatives have become more productive the longer they are with us, with limited productivity in their first few quarters as they learn to sell our products and participate in classroom and field training. We optimize our sales management efforts to help our sales representatives optimize their productivity throughout their tenure. Our sales organization is supported by sales engineers with deep technical expertise and responsibility for pre-sales technical support, solutions engineering for our customers and technical training for our channel partners. No individual channel partner represented more than 10% of our revenue in the fiscal year ended January 31, 2015 and the six months ended July 31, 2015.
Technology Alliances. We work closely with technology partners that help us deliver world-class solutions to our customers and ensure the efficient deployment and support of their datacenter infrastructure. Our technology partners include application partners such as Microsoft, Oracle and SAP and infrastructure partners such as Arista, Brocade, Cisco, Citrix, CommVault, RedHat, Symantec and VMware. In addition, we work closely with our technology partners through co-marketing and lead-generation activities in an effort to broaden our marketing reach and help us win new and retain existing customers.
75
Table of Contents
Marketing. Our marketing is focused on building our brand reputation and market awareness, communicating product advantages, driving customer demand and generating leads for our sales force and channel partners. Our marketing effort consists primarily of product, field, channel, solutions and digital marketing and public relations.
Research and Development
Our research and development efforts are focused primarily on improving our existing products and developing new products. Our products integrate both software and hardware innovations, and accordingly, our research and development teams employ both software and hardware engineers in the design, development, testing, certification and support of our products. Most of our research and development team is based in Mountain View, California. We also design, test and certify our products to ensure interoperability with a variety of third-party software, servers, operating systems and network components. We plan to dedicate significant resources to our continued research and development efforts.
Research and development expenses were $12.4 million, $36.1 million and $92.7 million for the fiscal years ended January 31, 2013, 2014 and 2015, and $40.5 million and $69.9 million for the six months ended July 31, 2014 and 2015, respectively.
Manufacturing
Our contract manufacturers, Avnet, Inc., or Avnet, and Hon Hai Precision Industry Co., Ltd., known as Foxconn, manufacture, assemble, test and package our products in accordance with our specifications. Our contract manufacturers generally procure the hardware components for final assembly of our products. Most of the components are purchased from sources that we believe are readily available from other suppliers.
We provide our contract manufacturers a rolling forecast for anticipated orders, which our contract manufacturers use to build finished products. The product mix and volumes are adjusted based on anticipated demand and actual sales and shipments in prior periods. Our contract manufacturers are generally able to respond to changes in our product mix or volume without significant delay or increased costs. Our agreement with Avnet is terminable at any time by either party upon 90 days written notice and does not provide for any specific purchase volumes. Our agreement with Foxconn has a three-year term that is subject to optional extensions absent notice of termination by either party. This agreement is terminable at any time by either party with 180-days’ prior notice. Our agreements with our contract manufacturers do not provide for any specific volume purchase commitments and orders are placed on a purchase order basis. We work closely with our contract manufacturers to meet our product delivery requirements and to manage the manufacturing process and quality control.
Backlog
We typically accept and ship orders within a short time frame. In general, customers may cancel or reschedule orders without penalty, and delivery schedules requested by customers in their purchase orders vary based upon each customer’s particular needs. As a result, we do not believe that our backlog at any particular time is a reliable indicator of future revenue.
Competition
We operate in the intensely competitive data storage market that is characterized by constant change and innovation. Changes in the application requirements, datacenter infrastructure trends and the broader technology landscape result in evolving customer requirements for capacity, performance scalability and enterprise features of storage systems. Our main competitors fall into two categories:
| • | large storage system vendors such as EMC, Hitachi Data Systems and NetApp that offer a broad range of storage systems targeting various use cases and end markets; and |
76
Table of Contents
| • | large systems companies such as Cisco, Dell, HP, Lenovo and IBM that have acquired or licensed specialist storage technology in recent years to complement their internally-developed storage offerings and have the technical and financial resources to bring competitive products to market. |
In addition, we compete against smaller specialized storage companies, including next-generation vendors of hybrid storage as well as vendors of hyper-converged products, defined as server compute and storage combined within a single chassis. As our market grows, it will attract new startups, more highly specialized vendors as well as larger vendors that may continue to acquire or bundle their products more effectively.
We believe the principal competitive factors in the storage market are as follows:
| • | Product features and enhancements, including ease of use, performance, reliability and scalability; |
| • | Product pricing and total cost of ownership; |
| • | Product interoperability with customer networks and backup software; |
| • | Global sales and distribution capability; |
| • | Ability to take advantage of improvements in industry standard components; and |
| • | Customer support and service. |
We believe we generally compete favorably with our competitors on the basis of these factors as a result of our hardware and software, product capabilities, ability to deliver the benefits of all-flash storage to a broad set of customers, management simplicity, ease of use and differentiated customer support. However, many of our competitors have substantially greater financial, technical and other resources, greater name recognition, larger sales and marketing budgets, broader distribution and larger and more mature intellectual property portfolios.
Intellectual Property
Our success depends in part upon our ability to protect our core technology and intellectual property. To establish and protect our proprietary rights, we rely on a combination of intellectual property rights, including patents, trademarks, copyrights, trade secret laws, license agreements, confidentiality procedures, employee disclosure and invention assignment agreements and other contractual rights.
As of July 31, 2015, we had over 200 total issued patents and over 150 patent applications in the United States and foreign countries. Our issued patents have expiration dates ranging from 2015 to 2034. We also license technology from third parties when we believe it will facilitate our product offerings or business. We have adopted a policy under which we will not assert patents acquired to date from third parties offensively, other than as part of a counterclaim.
We generally control access to and use of our proprietary software and other confidential information through the use of internal and external controls, including contractual protections with employees, contractors, customers and partners. Unauthorized parties may still copy or otherwise obtain and use our software and technology, despite our efforts to protect our trade secrets and proprietary rights through intellectual property rights, licenses and confidentiality agreements. We intend to expand our international operations, and effective patent, copyright, trademark and trade secret protection may not be available or may be limited in foreign countries.
The data storage industry is characterized by the existence of a large number of patents, trademarks, copyrights and other intellectual property rights, and by frequent litigation based on allegations of infringement or other violations of intellectual property rights. From time to time, third parties, including our competitors and non-practicing entities, may claim that our products or technologies infringe their proprietary rights and may assert patent, copyright, trade secret and other intellectual property rights against us and our customers, suppliers and channel partners. We are party to a number of agreements pursuant to which we are obligated to indemnify our customers, suppliers and channel partners against such claims. We expect that infringement claims may increase as
77
Table of Contents
the number of products and competitors in our market increase. In addition, to the extent that we gain greater visibility and market exposure as a public company, we face a higher risk of being the subject of intellectual property infringement claims from third parties. See the section titled “Risk Factors” for additional information.
Facilities
Our corporate headquarters are located in Mountain View, California. We also maintain offices in multiple locations in the United States and internationally in Europe, Asia, Australia, South America and Africa. We lease all of our facilities and do not own any real property. We expect to add facilities as we grow our employee base and expand geographically. We believe that our facilities are adequate to meet our needs for the immediate future, and that, should it be needed, suitable additional space will be available to accommodate expansion of our operations.
Employees
We believe the expertise of our people and our culture is a key enabler of our technology leadership. We had over 1,100 employees worldwide as of July 31, 2015. None of our employees is represented by a labor organization or is a party to any collective bargaining arrangement.
Legal Proceedings
On November 4, 2013, EMC filed a complaint against us in the United States District Court for the District of Massachusetts, alleging that our hiring of EMC employees evidences a scheme to misappropriate EMC’s confidential information and trade secrets and to unlawfully interfere with EMC’s business relationships with its customers and contractual relationships with its employees. The complaint seeks damages and injunctive relief. On November 26, 2013, we answered and counterclaimed, denying EMC’s allegations and alleging that EMC surreptitiously obtained and tested our product in a manner that constituted misappropriation of our trade secrets, a breach of contract, breach of the covenant of good faith and fair dealing, unlawful interference with our contractual and business relationships as well as unfair competition and a violation of Massachusetts General Law 93A, Sections 2 and 11. On November 18, 2014, we amended our counterclaim, additionally alleging that EMC has engaged in commercial disparagement, violated the Lanham Act and engaged in defamation. Our counterclaim seeks damages and declaratory and injunctive relief. Fact discovery has commenced and is currently scheduled to end on October 16, 2015. Expert discovery is scheduled to end on February 5, 2016, and the deadline for filing dispositive motions is March 31, 2016. The district court has scheduled a trial date for October 17, 2016.
In a separate litigation matter, on November 26, 2013, EMC filed a complaint against us in the United States District Court for the District of Delaware, alleging infringement of five patents held by EMC. The five patents are U.S. Patent 6,904,556 entitled “Systems and Methods Which Utilize Parity Sets,” U.S. Patent 6,915,475 entitled “Data Integrity Management for Data Storage Systems,” U.S. Patent 7,373,464 entitled “Efficient Data Storage System” and the related U.S. Patent 7,434,015 entitled “Efficient Data Storage System” and U.S. Patent 8,375,187 entitled “I/O Scheduling For Flash Drives.” The complaint seeks damages and injunctive and equitable relief. On January 17, 2014, we filed a response to the complaint, denying all claims and asserting that EMC’s patents are invalid. Fact discovery has been concluded, and expert discovery has ended. The deadline for filing dispositive motions is October 6, 2015. Trial is currently scheduled for March 7, 2016.
In addition, we may, from time to time, be involved in various legal proceedings arising from the normal course of business, and an unfavorable resolution of any of these matters could materially affect our future results of operations, cash flows or financial position.
78
Table of Contents
Pure Good Foundation
In August 2015, we established the Pure Good Foundation as a non-profit organization, and in September 2015 we issued 700,000 shares of our Class B common stock to this foundation. We anticipate that the proposed programs of the Pure Good Foundation will include grants, humanitarian relief, volunteerism and social development projects. We believe that the Pure Good Foundation will foster employee morale, strengthen our community presence and provide increased brand visibility.
79
Table of Contents
Executive Officers and Directors
The following table sets forth information regarding our executive officers and directors as of July 31, 2015:
| Name |
Age |
Position | ||
| Executive Officers |
||||
| Scott Dietzen |
53 | Chief Executive Officer and Director | ||
| John “Coz” Colgrove |
52 | Founder, Chief Technology Officer and Co-Chairman | ||
| David Hatfield |
47 | President | ||
| Timothy Riitters |
42 | Chief Financial Officer | ||
| Non-Employee Directors |
||||
| Mike Speiser |
44 | Co-Chairman | ||
| Aneel Bhusri(2) |
49 | Director | ||
| Mark Garrett(1) |
57 | Director | ||
| Anita Sands(1)(3) |
39 | Director | ||
| Frank Slootman(2) |
56 | Director | ||
| Michelangelo Volpi(1)(3) |
48 | Director | ||
| (1) | Member of the Audit Committee. |
| (2) | Member of the Compensation Committee. |
| (3) | Member of the Nominating and Corporate Governance Committee. |
Executive Officers
Scott Dietzen has served as our Chief Executive Officer and as a member of our board of directors since October 2010. From 2007 to 2009, Dr. Dietzen served in various roles at Yahoo! Inc., an internet technology company, including as interim Senior Vice President of Yahoo! Communications and Communities. From 2005 to 2007, Dr. Dietzen served as President and Chief Technology Officer of Zimbra, Inc., a provider of open source messaging and collaboration software until its sale to Yahoo! in 2007. From 1998 to 2004, Dr. Dietzen served in various roles at BEA Systems, Inc., including as BEA Systems’ Chief Technology Officer. He had served as Vice President, Marketing at WebLogic, Inc., a provider of web application servers, which BEA Systems acquired in 1998. Dr. Dietzen previously served as Principal Technologist at Transarc Corporation, a filesystem software company, which was acquired by IBM. Dr. Dietzen currently serves on the board of directors of Cloudera, Inc. He earned a B.S. in Applied Mathematics and Computer Science and a M.S. and Ph.D. in Computer Science from Carnegie Mellon University. We believe that Dr. Dietzen is qualified to serve as a member of our board of directors because of his deep technology background and his extensive leadership experience across a range of technology companies.
John “Coz” Colgrove has served as our Chief Technology Officer and as a member of our board of directors since founding Pure Storage in October 2009. Since May 2014, Mr. Colgrove has served as Co-Chairman of our board of directors. In 2009, Mr. Colgrove served as an Entrepreneur in Residence at Sutter Hill Ventures, a venture capital firm. From 2005 to 2008, Mr. Colgrove served as a Fellow and Chief Technology Officer for the Datacenter Management Group of Symantec Corporation, an information security firm. Mr. Colgrove was one of the founding engineers and a Fellow at Veritas Software Corp., a provider of storage management solutions, which merged with Symantec in 2005. Mr. Colgrove earned his B.S. in Computer Science from Rutgers University and holds over 100 patents in the areas of computer system and data storage design. We believe that Mr. Colgrove is qualified to serve as a member of our board of directors because of his industry knowledge and his experience as a founder of Pure Storage, as well as his leadership experience and deep technical expertise.
80
Table of Contents
David Hatfield has served as our President since January 2013. From March 2007 to January 2013, Mr. Hatfield served as Senior Vice President of Worldwide Sales, Marketing, Products and Services and President of SaaS at Limelight Networks, Inc., a digital presence management software company, where he was responsible for establishing their customer operations and global channel. From 2006 to 2007, Mr. Hatfield served as Vice President-General Manager of Professional Services for the Americas at Symantec and as Symantec’s Vice President of Sales from 2005 to 2006. From 2003 to 2005, Mr. Hatfield served as Vice President of Sales at Veritas Software. Mr. Hatfield earned a B.S. in Political Science from Santa Clara University.
Timothy Riitters has served as our Chief Financial Officer since August 2014. From January 2010 to August 2014, Mr. Riitters served as Senior Director of Corporate Finance at Google, Inc., an internet technology company, where he was responsible for overseeing their annual planning and budget process. From 2007 to 2010, Mr. Riitters served as Director, EMEA Financial Operations at Google, and from 2004 to 2007, as Finance Process Manager. From 2002 to 2004, Mr. Riitters served as a Senior Product Manager at Siebel Systems, Inc., a software company. Mr. Riitters previously worked at Deloitte & Touche LLP, an accounting firm. Mr. Riitters is a certified public accountant (inactive) and earned a B.S. in Accounting from the University of Minnesota and an M.B.A. from Northwestern University.
Non-Employee Directors
Mike Speiser has served on our board of directors since October 2009 and as Co-Chairman of our board of directors since May 2014. Since 2008, Mr. Speiser has served as a Managing Director at Sutter Hill Ventures, a venture capital firm. From 2007 to 2008, Mr. Speiser served as Vice President of Community Products at Yahoo! Inc. From 2006 to 2007, Mr. Speiser served as President and Chief Executive Officer of Bix, Inc., an internet company that Mr. Speiser founded. From 2005 to 2006, Mr. Speiser served as a technical advisor to Symantec. From 2001 to 2005, Mr. Speiser served as Vice President of Product Management and Product Marketing at Veritas Software. Mr. Speiser earned a B.A. in Political Science from the University of Arizona and an M.B.A. from Harvard Business School. We believe that Mr. Speiser is qualified to serve as a member of our board of directors because of his early and active involvement with Pure Storage and his extensive leadership and operational experience, as well as his perspective as a venture investor.
Aneel Bhusri has served on our board of directors since July 2010. Since 1999, Mr. Bhusri has served as a partner at Greylock Partners, a venture capital firm. Since 2005, Mr. Bhusri has served as a member of the board of directors of Workday, Inc., an enterprise cloud application provider that he co-founded, as Co-Chief Executive Officer from September 2009 to May 2014, as Chairman from January 2012 to May 2014 and as Chief Executive Officer since May 2014. From 1993 to 2004, Mr. Bhusri held a number of senior management positions with PeopleSoft, Inc., a human resource management systems company, including Senior Vice President, Product Strategy, Marketing and Business Development and from 1999 to 2002 and in 2004, as Vice Chairman of the Board of Directors of PeopleSoft. Mr. Bhusri currently serves on the board of directors of Intel Corporation. From 2002 to 2009, Mr. Bhusri was a member of the board of directors of Data Domain Corporation, where he held the position of Chairman from 2007 to 2009. Mr. Bhusri earned a B.S. in Electrical Engineering and a B.A. in Economics from Brown University and an M.B.A. from Stanford University. Mr. Bhusri currently serves on the board of directors of a number of privately held companies. We believe that Mr. Bhusri is qualified to serve as a member of our board of directors because of his extensive executive leadership and operational experience, including his service as an executive and director of multiple high growth technology companies.
Mark Garrett has served on our board of directors since July 2015. Since 2007, Mr. Garrett has served as Executive Vice President and Chief Financial Officer of Adobe Systems Incorporated. From 2004 to 2007, Mr. Garrett served as Senior Vice President and Chief Financial Officer of the Software Group of EMC Corporation, an information technology company. From 2002 to 2004 and from 1997 to 1999, Mr. Garrett served as Executive Vice President and Chief Financial Officer of Documentum, Inc., including throughout its acquisition by EMC in December 2003. Mr. Garrett currently serves on the board of directors of Model N, Inc. From October 2008 to August 2015, Mr. Garrett served on the board of directors of Informatica Corporation.
81
Table of Contents
Mr. Garrett earned a B.S. in accounting and marketing from Boston University and an M.B.A. from Marist College. We believe that Mr. Garrett is qualified to serve as a member of our board of directors because of his extensive management and financial experience, as well as his relevant industry knowledge.
Anita Sands has served on our board of directors since July 2015. From April 2012 to September 2013, Dr. Sands served as Group Managing Director and Head of Change Leadership and a member of the Wealth Management Americas Executive Committee of UBS Financial Services, a global financial services firm. From April 2010 to April 2012, Dr. Sands served as Group Managing Director and Chief Operating Officer of Wealth Management Americas at UBS Financial Services. From October 2009 to April 2010, Dr. Sands served as Transformation Consultant at UBS Financial Services. From 2008 to 2009, Dr. Sands served as Managing Director, Head of Transformation Management at Citigroup’s Global Operations and Technology organization. Prior to that, Dr. Sands also held several leadership positions with RBC Financial Group and CIBC. Dr. Sands currently serves on the board of directors of Symantec Corporation, ServiceNow, Inc. and a non-profit organization. Dr. Sands earned a B.S. in Physics and Applied Mathematics from The Queen’s University of Belfast, Northern Ireland, a Ph.D. in Atomic and Molecular Physics from The Queen’s University of Belfast, Northern Ireland and a M.S. in Public Policy and Management from Carnegie Mellon University. We believe that Dr. Sands is qualified to serve as a member of our board of directors because of her extensive leadership and operational experience at global financial services firms, as well as her service as a director of multiple large technology companies.
Frank Slootman has served on our board of directors since May 2014. Since May 2011, Mr. Slootman has served as President and Chief Executive Officer, and as a member of the board of directors, of ServiceNow, Inc., an enterprise IT cloud company. From January 2011 to April 2011, Mr. Slootman served as a Partner with Greylock Partners, a venture capital firm. From 2011 to 2012, Mr. Slootman served as an advisor to EMC Corporation. From 2009 to 2011, Mr. Slootman served as President of the Backup Recovery Systems Division at EMC. From 2003 to 2009, Mr. Slootman served as President and Chief Executive Officer of Data Domain Corporation, an information technology company, which was acquired by EMC in 2009. Since August 2011, Mr. Slootman has served as a member of the board of directors of Imperva, Inc. Mr. Slootman earned undergraduate and graduate degrees in Economics from the Netherlands School of Economics, Erasmus University Rotterdam. We believe that Mr. Slootman is qualified to serve as a member of our board of directors because of his extensive executive leadership and operational experience, as well as his relevant industry knowledge.
Michelangelo Volpi has served on our board of directors since April 2014. Since July 2009, Mr. Volpi has served as a partner at Index Ventures, a venture capital firm. From 2007 to 2009, Mr. Volpi served as Chief Executive Officer for Joost Inc., an internet video services company. From 1994 to 2007, Mr. Volpi served in various executive roles at Cisco Systems, Inc., a technology company, including Chief Strategy Officer and Senior Vice President and General Manager, Routing and Service Provider Group. Mr. Volpi currently serves on the board of directors of Hortonworks, Inc., Exor S.p.A. and a number of privately held companies. From April 2010 to April 2013, Mr. Volpi served on the board of directors of Telefonaktiebolaget L.M. Ericsson. Mr. Volpi earned a B.S. in Mechanical Engineering, an M.S. in Manufacturing Systems Engineering and an M.B.A. from Stanford University. We believe that Mr. Volpi is qualified to serve as a member of our board of directors because of his leadership experience, expertise as a venture capital investor and knowledge regarding the technology industry.
Family Relationships
There are no family relationships among any of the directors or executive officers.
Board Composition
Certain members of our board of directors were elected pursuant to the provisions of a voting agreement. Under the terms of this voting agreement, the stockholders who are party to the voting agreement have agreed to vote their respective shares so as to elect: (1) one director designated by Sutter Hill Ventures, currently Mr. Speiser; (2) one director designated by Greylock XIII Limited Partnership, currently Mr. Bhusri; (3) one
82
Table of Contents
director designated by Redpoint Ventures IV, L.P., currently not designated; (4) one director designated by Index Ventures VI (Jersey), L.P., currently Mr. Volpi; and (5) one director designated by the holders of a majority of shares held by key holders providing services to us, currently Mr. Colgrove. The holders of a majority of our preferred stock and common stock, voting together as a single class, further designated Dr. Dietzen and Mr. Slootman for election to our board of directors. The voting agreement will terminate upon the closing of this offering and none of our stockholders will have any special rights regarding the election or designation of members of our board of directors. There is no contractual arrangement by which Mr. Garrett and Dr. Sands were appointed to our board of directors.
Our board of directors will consist of eight members upon the closing of this offering. In accordance with the amended and restated certificate of incorporation to be filed in connection with this offering, immediately after this offering, our board of directors will be divided into three classes. At each annual general meeting of stockholders, the successors to directors whose terms then expire will be elected to serve from the time of election and qualification until the third annual meeting following the election. Our directors will be divided among the three classes as follows:
| • | The Class I directors will be Mr. Colgrove and Dr. Dietzen, and their terms will expire at the annual meeting of stockholders to be held in 2016; |
| • | The Class II directors will be Messrs. Garrett, Slootman and Speiser, and their terms will expire at the annual meeting of stockholders to be held in 2017; and |
| • | The Class III directors will be Dr. Sands and Messrs. Bhusri and Volpi, and their terms will expire at the annual meeting of stockholders to be held in 2018. |
We expect that any additional directorships resulting from an increase in the number of directors will be distributed among the three classes so that, as nearly as possible, each class will consist of one-third of the directors. The division of our board of directors into three classes with staggered three-year terms may delay or prevent a change of our management or a change in control.
Director Independence
Under the listing requirements and rules of the NYSE, independent directors must comprise a majority of our board of directors as a listed company within one year of the closing of this offering.
Our board of directors has undertaken a review of its composition, the composition of its committees and the independence of each director. Based upon information requested from and provided by each director concerning his background, employment and affiliations, including family relationships, our board of directors has determined that Dr. Sands and Messrs. Bhusri, Garrett, Slootman and Volpi do not have any relationships that would interfere with the exercise of independent judgment in carrying out the responsibilities of a director and that each of these directors is “independent” as that term is defined under the applicable rules and regulations of the SEC and the listing requirements and rules of the NYSE. Dr. Dietzen is not independent due to his position as our Chief Executive Officer, Mr. Colgrove is not independent due to his position as our Chief Technology Officer, and Mr. Speiser is not independent due to his stock option grant in exchange for his interim oversight of a portion of our research and development team from April 2013 to November 2013. Accordingly, a majority of our directors are independent, as required under applicable NYSE rules. In making this determination, our board of directors considered the current and prior relationships that each non-employee director has with our company and all other facts and circumstances our board of directors deemed relevant in determining their independence, including their beneficial ownership of our capital stock, and with respect to Mr. Bhusri, his position as the Chief Executive Officer of Workday, Inc., Mr. Slootman, his position as President and Chief Executive Officer of ServiceNow, Inc. and Mr. Garrett, his position as the Chief Financial Officer of Adobe Systems Incorporated. In the ordinary course of business, each of Workday, Inc., ServiceNow, Inc. and Adobe Systems Incorporated, have purchased our products and related services, and we have purchased products and related services from Workday, Inc., ServiceNow, Inc. and Adobe Systems Incorporated.
83
Table of Contents
Board Committees
Our board of directors has established an audit committee, a compensation committee and a nominating and corporate governance committee. Our board of directors may establish other committees to facilitate the management of our business. The composition and functions of each committee are described below. Members serve on these committees until their resignation or until otherwise determined by our board of directors.
Audit Committee
Our audit committee consists of Dr. Sands and Messrs. Volpi and Garrett. Our board of directors has determined that Dr. Sands and Messrs. Volpi and Garrett are independent under NYSE listing standards and Rule 10A-3(b)(1) of the Exchange Act. The chair of our audit committee is Mr. Garrett. Our board of directors has determined that Mr. Garrett is an “audit committee financial expert” within the meaning of SEC regulations. Our board of directors has also determined that each member of our audit committee can read and understand fundamental financial statements in accordance with applicable requirements. In arriving at these determinations, the board of directors has examined each audit committee member’s scope of experience and the nature of their employment in the corporate finance sector.
The primary purpose of the audit committee is to discharge the responsibilities of our board of directors with respect to our accounting, financial and other reporting and internal control practices and to oversee our independent registered accounting firm. Specific responsibilities of our audit committee include:
| • | selecting a qualified firm to serve as the independent registered public accounting firm to audit our financial statements; |
| • | helping to ensure the independence and performance of the independent registered public accounting firm; |
| • | discussing the scope and results of the audit with the independent registered public accounting firm, and reviewing, with management and the independent accountants, our interim and year-end operating results; |
| • | developing procedures for employees to submit concerns anonymously about questionable accounting or audit matters; |
| • | reviewing our policies on risk assessment and risk management; |
| • | reviewing related party transactions; |
| • | obtaining and reviewing a report by the independent registered public accounting firm at least annually, that describes our internal quality control procedures, any material issues with such procedures, and any steps taken to deal with such issues when required by applicable law; and |
| • | approving (or, as permitted, pre-approving) all audit and all permissible non-audit services, other than de minimis non-audit services, to be performed by the independent registered public accounting firm. |
Compensation Committee
Our compensation committee consists of Messrs. Bhusri and Slootman. Our board of directors has determined that Messrs. Bhusri and Slootman are independent under NYSE listing standards, are “non-employee directors” as defined in Rule 16b-3 promulgated under the Exchange Act and are “outside directors” as that term is defined in Section 162(m) of the Code. The chair of our compensation committee is Mr. Bhusri.
The primary purpose of our compensation committee is to discharge the responsibilities of our board of directors to oversee our compensation policies, plans and programs and to review and determine the compensation to be paid to our executive officers, directors and other senior management, as appropriate. Specific responsibilities of our compensation committee include:
| • | reviewing and approving, or recommending that our board of directors approve, the compensation of our executive officers; |
84
Table of Contents
| • | reviewing and recommending to our board of directors the compensation of our directors; |
| • | reviewing and approving, or recommending that our board of directors approve, the terms of compensatory arrangements with our executive officers; |
| • | administering our stock and equity incentive plans; |
| • | selecting independent compensation consultants and assessing whether there are any conflicts of interest with any of the committees compensation advisers; |
| • | reviewing and approving, or recommending that our board of directors approve, incentive compensation and equity plans, severance agreements, change-of-control protections and any other compensatory arrangements for our executive officers and other senior management, as appropriate; and |
| • | reviewing and establishing general policies relating to compensation and benefits of our employees and reviewing our overall compensation philosophy. |
Nominating and Corporate Governance Committee
Our nominating and corporate governance committee consists of Dr. Sands and Mr. Volpi. The chair of our nominating and corporate governance committee is Dr. Sands. Each member of the nominating and corporate governance committee is independent within the meaning of applicable listing standards, is a non-employee director and is free from any relationship that would interfere with the exercise of his or her independent judgment, as determined by the board of directors in accordance with the applicable NYSE listing standards.
Specific responsibilities of our nominating and corporate governance committee include:
| • | identifying, evaluating and selecting, or recommending that our board of directors approve, nominees for election to our board of directors; |
| • | evaluating the performance of our board of directors and of individual directors; |
| • | considering and making recommendations to our board of directors regarding the composition of the committees of the board of directors; |
| • | reviewing developments in corporate governance practices; |
| • | evaluating the adequacy of our corporate governance practices and reporting; |
| • | reviewing management succession plans; |
| • | developing and making recommendations to our board of directors regarding corporate governance guidelines and matters; and |
| • | overseeing an annual evaluation of the board of directors’ performance. |
Code of Conduct
We have adopted a code of conduct that applies to all of our employees, officers, including our principal executive officer, principal financial officer and principal accounting officer or controller, or persons performing similar functions and agents and representatives, including directors and consultants. The full text of our code of conduct will be posted on our website at www.purestorage.com. We intend to disclose future amendments to certain provisions of our code of conduct, or waivers of such provisions applicable to any principal executive officer, principal financial officer, principal accounting officer or controller, or persons performing similar functions, and our directors, on our website identified above.
85
Table of Contents
Compensation Committee Interlocks and Insider Participation
None of the members of the compensation committee is currently, or has been at any time, one of our officers or employees. None of our executive officers currently serves, or has served during the last year, as a member of the board of directors or compensation committee of any entity that has one or more executive officers serving as a member of our board of directors or compensation committee.
Non-Employee Director Compensation
The following table sets forth information concerning the compensation paid to our non-employee directors during the fiscal year ended January 31, 2015.
| Name |
Option Awards(1) | |||
| Aneel Bhusri |
$ | — | ||
| Satish Dharmaraj(2) |
— | |||
| Mark Garrett(3) |
— | |||
| Anita Sands(4) |
— | |||
| Frank Slootman(5) |
856,698 | (6) | ||
| Mike Speiser(7) |
— | |||
| Michelangelo Volpi |
— | |||
| (1) | The amount shown in this column does not reflect dollar amount actually received by the director. Instead, this amount reflects the aggregate grant date fair value of this stock option granted in the fiscal year ended January 31, 2015, computed in accordance with the provisions of FASB ASC Topic 718. Assumptions used in the calculation of this amount are included in Note 9 to our consolidated financial statements included in this prospectus. As required by SEC rules, the amount shown excludes the impact of estimated forfeitures related to service-based vesting conditions. Our director will only realize compensation to the extent the trading price of our common stock is greater than the exercise price of this stock option. |
| (2) | Mr. Dharmaraj resigned from our board of directors in July 2015. |
| (3) | Mr. Garrett joined our board of directors in July 2015. In July 2015, we granted Mr. Garrett an option to purchase 300,000 shares of our Class B common stock with an exercise price of $18.16 per share. The shares vest monthly over six years, with 5,000 of the shares vesting monthly over the first three years and 3,333 of the shares vesting monthly over the subsequent three years, subject to continued service on our board of directors through each relevant vesting date. |
| (4) | Dr. Sands joined our board of directors in July 2015. In July 2015, we granted Dr. Sands an option to purchase 300,000 shares of our Class B common stock with an exercise price of $18.16 per share. The shares vest monthly over six years, with 5,000 of the shares vesting monthly over the first three years and 3,333 of the shares vesting monthly over the subsequent three years, subject to continued service on our board of directors through each relevant vesting date. |
| (5) | Mr. Slootman joined our board of directors in May 2014. |
| (6) | Represents an option to purchase 160,000 shares of our Class B common stock with an exercise price of $8.46 per share, which vests monthly over two years. In April 2013, we granted Mr. Slootman an option to purchase 360,000 shares of our Class B common stock with an exercise price of $1.50 per share, which vests monthly over three years, subject to continued service on our board of directors through each relevant vesting date. |
| (7) | In June 2013, we granted Mr. Speiser an option to purchase 1,444,820 shares of our Class B common stock with an exercise price of $1.50 per share in exchange for his interim oversight of a portion of our research and development team from April 2013 to November 2013. The shares subject to this option vest upon the occurrence of a performance based milestone tied to bookings of products developed by this team. In June 2013, Mr. Speiser early exercised this option and transferred the shares to Sutter Hill Ventures and certain general partners of Sutter Hill Ventures in accordance with the terms of his employment. The shares of Class B common stock issued upon exercise of the option remain subject to a right of repurchase in favor of us. |
Dr. Sands and Messrs. Garrett and Slootman are the only non-employee directors who currently hold options to purchase shares of Class B common stock. We currently reimburse our directors for their reasonable out-of-pocket expenses in connection with attending board of directors and committee meetings. From time to time, we have granted stock options to certain of our non-employee directors as compensation for their services.
Non-Employee Director Compensation Policy
We intend to adopt a non-employee director compensation policy following the closing of this offering and on terms to be determined at a later date by our board of directors, pursuant to which our non-employee directors will be eligible to receive compensation for service on our board of directors and committees of our board of directors.
86
Table of Contents
Our named executive officers, consisting of our principal executive officer and the next two most highly compensated executive officers as of January 31, 2015, were:
| • | Scott Dietzen, Chief Executive Officer; |
| • | David Hatfield, President; and |
| • | Timothy Riitters, Chief Financial Officer. |
Fiscal 2015 Summary Compensation Table
The following table presents all of the compensation awarded to or earned by our named executive officers during the fiscal year ended January 31, 2015.
| Name and Principal Position |
Year | Salary | Option Awards(1) |
Nonequity Incentive Plan Compensation |
All Other Compensation |
Total | ||||||||||||||||||
| Scott Dietzen |
2015 | $ | 250,000 | $ | 3,189,524 | $ | 111,864 | (2) | $ | 1,404,388 | (3) | $ | 4,955,776 | |||||||||||
| Chief Executive Officer |
||||||||||||||||||||||||
| David Hatfield |
2015 | 300,000 | 2,657,937 | 425,332 | (4) | 7,274,645 | (5) | 10,657,914 | ||||||||||||||||
| President |
||||||||||||||||||||||||
| Timothy Riitters |
2015 | 108,333 | (6) | 8,965,770 | 60,411 | (2) | 2,385 | (7) | 9,136,899 | |||||||||||||||
| Chief Financial Officer |
||||||||||||||||||||||||
| (1) | The amount shown in this column does not reflect dollar amount actually received by our named executive officers. Instead, this amount reflects the aggregate grant date fair value of this stock option granted in the fiscal year ended January 31, 2015, computed in accordance with the provisions of FASB ASC Topic 718. Assumptions used in the calculation of this amount are included in Note 9 to our consolidated financial statements included in this prospectus. As required by SEC rules, the amount shown excludes the impact of estimated forfeitures related to service-based vesting conditions. Our named executive officers will only realize compensation to the extent the trading price of our common stock is greater than the exercise price of such stock options. |
| (2) | Represents quarterly bonuses earned by Dr. Dietzen and Mr. Riitters under our incentive compensation plan for officers for the fiscal year ended January 31, 2015. The amounts reported represent performance-based cash incentives earned by each named executive officer based on the achievement of certain company and individual and departmental management goals and the individual’s target incentive compensation amount. Incentive compensation awards are paid quarterly, based on the achievement of the objectives agreed to at the beginning of each quarter. |
| (3) | Includes (i) $1,395,423 of shares sold by Dr. Dietzen in our July 2014 tender offer, which is the difference between the purchase price per share of $15.7259 paid by us and $8.46 per share, the fair market value of the shares as of the date of repurchase; (ii) $4,500 in employer contributions to Dr. Dietzen’s health savings account; (iii) $3,832 in travel expenses associated with Dr. Dietzen’s spouse attending a company-sponsored event; and (iv) $633 in life insurance premiums. |
| (4) | Represents sales commissions earned by Mr. Hatfield during the fiscal year ended January 31, 2015. |
| (5) | Includes (i) $7,265,900 of shares sold by Mr. Hatfield in our July 2014 tender offer, which is the difference between the purchase price per share of $15.7259 paid by us and $8.46 per share, the fair market value of the shares as of the date of repurchase; (ii) $4,500 in employer contributions to Mr. Hatfield’s health savings account; (iii) $3,832 in travel expenses associated with Mr. Hatfield’s spouse attending a company-sponsored event; and (iv) $413 in life insurance premiums. |
| (6) | Mr. Riitters commenced his employment with us in August 2014. |
| (7) | Includes (i) $2,250 in employer contributions to Mr. Riitters’ health savings account and (ii) $135 in life insurance premiums. |
87
Table of Contents
Outstanding Equity Awards as of January 31, 2015
The following table presents information regarding outstanding equity awards held by our named executive officers as of January 31, 2015. All awards were granted under our 2009 Equity Incentive Plan.
| Option Awards | ||||||||||||||||||||||||
| Name |
Grant Date | Vesting Commencement Date |
Number of Securities Underlying Unexercised Options Exercisable (#) |
Number of Securities Underlying Unexercised Options Unexercisable (#) |
Option Exercise Price |
Option Expiration Date |
||||||||||||||||||
| Scott Dietzen |
01/30/2014 | 03/20/2017 | — | 300,000 | (1)(2) | $ | 2.5750 | 01/29/2024 | ||||||||||||||||
| 03/28/2014 | 04/01/2018 | — | 600,000 | (2)(3) | 2.9800 | 03/27/2024 | ||||||||||||||||||
| David Hatfield |
02/06/2013 | 01/15/2013 | 1,052,112 | (2)(4) | — | 1.2250 | 02/05/2023 | |||||||||||||||||
| 01/30/2014 | 07/15/2016 | — | 400,000 | (2)(5) | 2.5750 | 01/29/2024 | ||||||||||||||||||
| 03/28/2014 | 01/01/2018 | — | 500,000 | (2)(3) | 2.9800 | 03/27/2024 | ||||||||||||||||||
| Timothy Riitters |
10/08/2014 | 08/26/2014 | — | 1,050,000 | (2)(6) | 9.6500 | 10/07/2024 | |||||||||||||||||
| 10/08/2014 | 08/26/2018 | — | 350,000 | (2)(3) | 9.6500 | 10/07/2024 | ||||||||||||||||||
| (1) | 1/12th of the total shares subject to this option grant will vest monthly measured from the vesting commencement date, subject to executive officer’s continued service. No shares were vested as of January 31, 2015. |
| (2) | The unvested shares subject to this option are subject to accelerated vesting upon a qualifying termination, as described in the section titled “Employment, Severance and Change in Control Agreements.” |
| (3) | 1/24th of the total shares subject to this option grant will vest monthly measured from the vesting commencement date, subject to executive officer’s continued service. No shares were vested as of January 31, 2015. |
| (4) | 1/48th of the total shares subject to this option will vest monthly measured from the vesting commencement date, subject to executive officer’s continued service. No shares were vested as of January 31, 2015. The shares subject to this option are early exercisable by Mr. Hatfield, subject to our right to repurchase unvested shares in the event Mr. Hatfield’s employment terminates. |
| (5) | 1/18th of the total shares subject to this option grant will vest monthly measured from the vesting commencement date, subject to executive officer’s continued service. No shares were vested as of January 31, 2015. |
| (6) | 1/4th of the total shares subject to this option grant will vest one year after the vesting commencement date; 1/48th of the total shares subject to this option grant will vest monthly thereafter over the following three years, subject to executive officer’s continued service. No shares were vested as of January 31, 2015. |
Emerging Growth Company Status
We are an “emerging growth company,” as defined in the JOBS Act. As an emerging growth company we will be exempt from certain requirements related to executive compensation, including, but not limited to, the requirements to hold a nonbinding advisory vote on executive compensation and to provide information relating to the ratio of total compensation of our Chief Executive Officer to the median of the annual total compensation of all of our employees, each as required by the Investor Protection and Securities Reform Act of 2010, which is part of the Dodd-Frank Wall Street Reform and Consumer Protection Act.
Pension Benefits
Our named executive officers did not participate in, or otherwise receive any benefits under, any pension or retirement plan sponsored by Pure during the fiscal year ended January 31, 2015.
Nonqualified Deferred Compensation
Our named executive officers did not participate in, or earn any benefits under, a non-qualified deferred compensation plan sponsored by Pure during the fiscal year ended January 31, 2015.
Employment, Severance and Change in Control Agreements
We have offer letters with each of our executive officers other than Mr. Colgrove. The offer letters generally provide for at-will employment and set forth the executive officer’s initial base salary, initial equity grant
88
Table of Contents
amount, eligibility for employee benefits and in some cases severance benefits upon a qualifying termination of employment. In addition, each of our named executive officers has executed of our standard proprietary information and inventions agreement. The key terms of employment with our executive officers are described below.
Scott Dietzen
In September 2010, we entered into an offer letter agreement with Scott Dietzen, our Chief Executive Officer. Dr. Dietzen’s annual base salary as of January 31, 2015 was $250,000. Under the terms of his offer letter, Dr. Dietzen was granted an option to purchase 6,344,208 shares of Class B common stock with an exercise price of $0.1350 per share vesting monthly over 48 months from September 2010. In June 2012, Dr. Dietzen was granted an option to purchase 1,153,926 shares of Class B common stock with an exercise price of $0.49 per share vesting monthly over 30 months from September 2014. In January 2014, Dr. Dietzen was granted an option to purchase 300,000 shares of Class B common stock with an exercise price of $2.575 per share vesting monthly over 12 months from March 2017. In March 2014, Dr. Dietzen was granted an option to purchase 600,000 shares of Class B common stock with an exercise price of $2.98 per share vesting monthly over 24 months from April 2018. Dr. Dietzen is eligible to earn a bonus with an annual target of $100,000 paid in quarterly installments based on the achievement of certain Company and individual goals.
If Dr. Dietzen’s employment is terminated without cause or he terminates his employment for good reason, on or within 12 months following a change in control, all outstanding shares subject to his outstanding equity awards shall vest in full as of his termination date. Dr. Dietzen must sign a release of claims agreement as a pre-condition of receiving this termination benefit.
David Hatfield
In November 2012, we entered into an offer letter agreement with David Hatfield, our President. Mr. Hatfield’s annual base salary as of January 31, 2015 was $300,000 and we paid him a signing and retention bonus of $250,000. Under the terms of his offer letter, Mr. Hatfield was granted (i) an option to purchase 3,347,054 shares of Class B common stock with an exercise price of $1.225 per share vesting monthly over 48 months from January 2013, (ii) an option to purchase 334,704 shares of Class B common stock with an exercise price of $1.225 vesting upon the achievement of certain milestones during the fiscal year ended January 31, 2014, which milestones the board determined were met, and (iii) an option to purchase 334,704 shares of Class B common stock with an exercise price of $1.225 vesting upon the achievement of certain milestones during the fiscal year ended January 31, 2015, which milestones the board determined were met. In January 2014, Mr. Hatfield was granted an option to purchase 400,000 shares of Class B common stock with an exercise price of $2.575 per share vesting monthly over 18 months from July 2016. In March 2014, Mr. Hatfield was granted an option to purchase 500,000 shares of Class B common stock with an exercise price of $2.98 per share vesting monthly over 24 months from January 2018. In March 2015, Mr. Hatfield was granted an option to purchase 150,000 shares of Class B common stock with an exercise price of $13.20 per share vesting monthly over 12 months from February 2020. Mr. Hatfield is entitled to earn sales commissions based on his and our performance against annual targets with quarterly objectives, with a target commission of $300,000.
Pursuant to the terms of his offer letter, if Mr. Hatfield’s employment is terminated without cause or he terminates his employment for good reason, and other than as result of his death or disability, he will be eligible to receive certain severance benefits, the conditions of which vary depending on whether such termination occurs in connection with a change in control. If termination of employment occurs absent a change in control, Mr. Hatfield will be eligible to receive continuation of his base salary and reimbursement of COBRA payments for a period of nine months and vesting of 25% of the then-unvested shares subject to any then-outstanding stock options. If termination of employment occurs on or within 18 months following a change in control, Mr. Hatfield will be eligible to receive the salary and COBRA payments as described in the preceding sentence and vesting of all of the then-unvested shares subject to any then outstanding stock options. Mr. Hatfield must sign a release of claims agreement as a pre-condition of receiving these termination benefits.
89
Table of Contents
Timothy Riitters
In August 2014, we entered into an offer letter agreement with Timothy Riitters, our Chief Financial Officer. Mr. Riitters’ annual base salary as of January 31, 2015 was $250,000. Under the terms of his offer letter, Mr. Riitters was granted an option to purchase 1,050,000 shares of Class B common stock with an exercise price of $9.65 per share with 25% of the shares vesting in August 2015 and the remainder vesting monthly over 36 months from August 2015, and an option to purchase 350,000 shares of Class B common stock with an exercise price of $9.65 per share vesting monthly over 24 months from August 2018. In March 2015, Mr. Riitters was granted an option to purchase 75,000 shares of Class B common stock with an exercise price of $13.20 per share vesting monthly over 12 months from September 2020. Mr. Riitters is eligible to earn a bonus with an annual target of $125,000, paid in quarterly installments, based on our achievement of our global bookings target for that quarter, as determined by our Chief Executive Officer.
Pursuant to the terms of his offer letter, if Mr. Riitters’ employment is terminated without cause or if he terminates his employment for good reason, and other than as result of his death or disability, he will be eligible to receive certain severance benefits, the conditions of which vary depending on whether such termination occurs in connection with a change in control. If termination of employment occurs absent a change in control, Mr. Riitters will be eligible to receive continuation of his base salary and reimbursement of COBRA payments for a period of nine months and he will continue to vest in his option for six months after the date of such termination. If termination of employment occurs on or within 12 months following a change in control, Mr. Riitters will be eligible to receive the salary and COBRA payments as described in the preceding sentence and vesting of all of the then-unvested shares subject to any then outstanding stock options. Mr. Riitters must sign a release of claims agreement as a pre-condition of receiving these termination benefits.
John Colgrove
If Mr. Colgrove’s employment is terminated without cause or he terminates his employment for good reason on or within 18 months following a change in control, all unvested shares of stock subject to his outstanding equity awards shall immediately become fully vested. In connection with the formation of our Company, in June 2012, Mr. Colgrove was granted an option to purchase 1,153,926 shares of Class B common stock with an exercise price of $0.49 per share vesting monthly over 30 months from October 2013. In January 2014, Mr. Colgrove was granted an option to purchase 600,000 shares of Class B common stock with an exercise price of $2.575 per share vesting monthly over 24 months from April 2016. In March 2014, Mr. Colgrove was granted an option to purchase 600,000 shares of Class B common stock with an exercise price of $2.98 per share vesting monthly over 24 months from April 2018. Mr. Colgrove is eligible to earn a bonus with an annual target of $100,000 paid in quarterly installments based on the achievement of certain Company and individual goals.
Employee Benefit Plans
We believe that our ability to grant equity-based awards is a valuable and necessary compensation tool that aligns the long-term financial interests of our employees, consultants and directors with the financial interests of our stockholders. In addition, we believe that our ability to grant options and other equity-based awards helps us to attract, retain and motivate employees, consultants and directors and encourages them to devote their best efforts to our business and financial success. The principal features of our equity incentive plans and our 401(k) plan are summarized below. These summaries are qualified in their entirety by reference to the actual text of the plans, which, other than the 401(k) plan, are filed as exhibits to the registration statement of which this prospectus is a part.
2015 Equity Incentive Plan
Our board of directors adopted our 2015 Equity Incentive Plan, or our 2015 Plan, in August 2015 and our stockholders approved our 2015 Plan in September 2015. Our 2015 Plan provides for the grant of incentive stock
90
Table of Contents
options to our employees and for the grant of nonstatutory stock options, stock appreciation rights, restricted stock awards, restricted stock unit awards, performance stock awards, performance cash awards, and other forms of stock awards to our employees, directors and consultants.
Authorized Shares. The maximum number of shares of our Class A common stock that may be issued under our 2015 Plan is 27,000,000. In addition, the number of shares of our Class A common stock reserved for issuance under our 2015 Plan will automatically increase on February 1st of each calendar year, from February 1, 2016 through February 1, 2025, in an amount equal to 5% of the total number of shares of our capital stock outstanding on the last day of the calendar month prior to the date of each automatic increase, or a lesser number of shares determined by our board of directors. The maximum number of shares of our Class A common stock that may be issued upon the exercise of incentive stock options under our 2015 Plan is 135,000,000.
Shares subject to stock awards granted under our 2015 Plan that expire or terminate without being exercised in full, or that are paid out in cash rather than in shares, do not reduce the number of shares available for issuance under our 2015 Plan. Additionally, shares issued pursuant to stock awards under our 2015 Plan that we repurchase or that are forfeited, as well as shares used to pay the exercise price of a stock award or to satisfy the tax withholding obligations related to a stock award, become available for future grant under our 2015 Plan.
Plan Administration. Our board of directors, or a duly authorized committee of our board of directors, will administer our 2015 Plan. Our board of directors may also delegate to one or more of our officers the authority to (1) designate employees (other than officers) to receive specified stock awards and (2) determine the number of shares subject to such stock awards. Under the 2015 Plan, our board of directors has the authority to determine the terms of awards, including recipients, the exercise, purchase or strike price of stock awards, if any, the number of shares subject to each stock award, the fair market value of a share of our Class A common stock, the vesting schedule applicable to the awards, together with any vesting acceleration, the form of consideration, if any, payable upon exercise or settlement of the award and the terms of the award agreements.
Section 162(m) Limits. At such time as necessary for compliance with Section 162(m) of the Code, no participant may be granted stock awards covering more than 3,000,000 shares (6,000,000 shares in the year of hire) of our common stock under the 2015 Plan during any calendar year pursuant to stock options, stock appreciation rights and other stock awards whose value is determined by reference to an increase over an exercise price or strike price of at least 100% of the fair market value of our common stock on the date of grant. Additionally, no participant may be granted in a calendar year a performance stock award covering more than 3,000,000 shares (6,000,000 shares in the year of hire) of our Class A common stock or a performance cash award having a maximum value in excess of $5,000,000 under our 2015 Plan. The limitations are designed to allow us to grant compensation that will not be subject to the $1,000,000 annual limitation on the income tax deductibility of compensation paid to a covered executive officer imposed by Section 162(m) of the Code.
Stock Options. Incentive stock options and nonstatutory stock options are granted pursuant to stock option agreements adopted by the plan administrator. The plan administrator determines the exercise price for stock options, within the terms and conditions of the 2015 Plan, provided that the exercise price of a stock option generally cannot be less than 100% of the fair market value of our common stock on the date of grant. Options granted under the 2015 Plan vest at the rate specified in the stock option agreement as determined by the plan administrator.
Restricted Stock Unit Awards. Restricted stock unit awards are granted pursuant to restricted stock unit award agreements adopted by the plan administrator. Restricted stock unit awards may be granted in consideration for any form of legal consideration that may be acceptable to our board of directors and permissible under applicable law. A restricted stock unit award may be settled by cash, delivery of stock, a combination of cash and stock as deemed appropriate by the plan administrator or in any other form of consideration set forth in the restricted stock unit award agreement. Additionally, dividend equivalents may be credited in respect of shares covered by a restricted stock unit award. Except as otherwise provided in the applicable award agreement, restricted stock units that have not vested will be forfeited upon the participant’s cessation of continuous service for any reason.
91
Table of Contents
Restricted Stock Awards. Restricted stock awards are granted pursuant to restricted stock award agreements adopted by the plan administrator. A restricted stock award may be awarded in consideration for cash, check, bank draft or money order, past services to us or any other form of legal consideration that may be acceptable to our board of directors and permissible under applicable law. The plan administrator determines the terms and conditions of restricted stock awards, including vesting and forfeiture terms. If a participant’s service relationship with us ceases for any reason, we may receive through a forfeiture condition or a repurchase right any or all of the shares of Class A common stock held by the participant that have not vested as of the date the participant terminates service with us.
Stock Appreciation Rights. Stock appreciation rights are granted pursuant to stock appreciation grant agreements adopted by the plan administrator. The plan administrator determines the purchase price or strike price for a stock appreciation right, which generally cannot be less than 100% of the fair market value of our common stock on the date of grant. A stock appreciation right granted under the 2015 Plan vests at the rate specified in the stock appreciation right agreement as determined by the plan administrator.
Performance Awards. The 2015 Plan permits the grant of performance-based stock and cash awards that may qualify as performance-based compensation that is not subject to the $1,000,000 limitation on the income tax deductibility imposed by Section 162(m) of the Code. Our compensation committee may structure awards so that the stock or cash will be issued or paid only following the achievement of certain pre-established performance goals during a designated performance period.
Other Stock Awards. The plan administrator may grant other awards based in whole or in part by reference to our Class A common stock. The plan administrator will set the number of shares under the stock award and all other terms and conditions of such awards.
Changes to Capital Structure. In the event there is a specified type of change in our capital structure, such as a stock split, reverse stock split or recapitalization, appropriate adjustments will be made to (1) the class and maximum number of shares reserved for issuance under the 2015 Plan, (2) the class and maximum number of shares by which the share reserve may increase automatically each year, (3) the class and maximum number of shares that may be issued upon the exercise of incentive stock options, (4) the class and maximum number of shares subject to stock awards that can be granted in a calendar year (as established under the 2015 Plan pursuant to Section 162(m) of the Code) and (5) the class and number of shares and exercise price, strike price or purchase price, if applicable, of all outstanding stock awards.
Corporate Transactions. Our 2015 Plan provides that in the event of certain specified significant corporate transactions, including: (1) a sale of all or substantially all of our assets, (2) the sale or disposition of at least 90% of our outstanding securities, (3) the consummation of a merger or consolidation where we do not survive the transaction and (4) the consummation of a merger or consolidation where we do survive the transaction but the shares of our common stock outstanding prior to such transaction are converted or exchanged into other property by virtue of the transaction, unless otherwise provided in an award agreement or other written agreement between us and the award holder, each outstanding award will terminate and be cancelled to the extent not vested or exercised prior to the effective time of the transaction. The administrator may instead take one or more of the following actions with respect to such stock awards: (1) arrange for the assumption, continuation or substitution of a stock award by a successor corporation, (2) arrange for the assignment of any reacquisition or repurchase rights held by us to a successor corporation, (3) accelerate the vesting, in whole or in part, of the stock award and provide for its termination prior to the transaction, (4) arrange for the lapse, in whole or in part, of any reacquisition or repurchase rights held by us, (5) cancel or arrange for the cancellation of the stock award prior to the transaction in exchange for a cash payment, if any, determined by the board or (6) make a payment, in the form determined by the board, equal to the excess, if any, of the value of the property the participant would have received upon exercise of the awards prior to the transaction over any exercise price payable by the participant in connection with the exercise. The plan administrator is not obligated to treat all stock awards or portions of stock awards, even those that are of the same type, in the same manner.
92
Table of Contents
In the event of a change in control, awards granted under the 2015 Plan will not receive automatic acceleration of vesting and exercisability, although this treatment may be provided for in an award agreement. Under the 2015 Plan, a change in control is defined to include (1) the acquisition by any person or company of more than 50% of the combined voting power of our then outstanding stock, (2) a merger, consolidation or similar transaction in which our stockholders immediately prior to the transaction do not own, directly or indirectly, more than 50% of the combined voting power of the surviving entity (or the parent of the surviving entity), (3) a sale, lease, exclusive license or other disposition of all or substantially all of our assets to an entity that did not previously hold more than 50% of the voting power over company stock, (4) our stockholders approve and the Board approves a plan of complete dissolution or liquidation or a complete dissolution or liquidation of Pure Storage otherwise occurs except for a liquidation into a parent corporation and (5) individuals who constitute our incumbent board of directors ceasing to constitute at least a majority of our board of directors.
Transferability. A participant may not transfer stock awards under our 2015 Plan other than by will, the laws of descent and distribution or as otherwise provided under our 2015 Plan.
Plan Amendment or Termination. Our board of directors has the authority to amend, suspend or terminate our 2015 Plan, provided that such action does not materially impair the existing rights of any participant without such participant’s written consent. Certain material amendments also require the approval of our stockholders. No incentive stock options may be granted after the tenth anniversary of the date our board of directors adopted our 2015 Plan. No stock awards may be granted under our 2015 Plan while it is suspended or after it is terminated.
2009 Equity Incentive Plan
Our board of directors adopted, and our stockholders approved, our 2009 Equity Incentive Plan, or our 2009 Plan, in October 2009. Our 2009 Plan was amended most recently in February 2015. Our 2009 Plan allows for the grant of incentive stock options to our employees and any of our subsidiary corporations’ employees, and for the grant of nonstatutory stock options, restricted stock awards to our employees, officers, directors and consultants.
Our 2015 Plan will become effective upon the execution of the underwriting agreement related to this offering. As a result, we do not expect to grant any additional awards under the 2009 Plan following that date, although any awards granted under the 2009 Plan will remain subject to the terms of our 2009 Plan and applicable award agreements, until such outstanding awards that are stock options are exercised, or until they terminate or expire by their terms, and until any restricted stock awards become vested, terminate or are forfeited.
Authorized Shares. The maximum number of shares of our Class B common stock that may be issued under our 2009 Plan is 97,539,696. The maximum number of shares of Class B common stock that may be issued upon the exercise of Incentive Stock Options under our 2009 Plan is 195,079,392. Shares subject to stock awards granted under our 2009 Plan that expire or terminate without being exercised in full or are settled in cash do not reduce the number of shares available for issuance under our 2009 Plan. Additionally, shares issued pursuant to stock awards under our 2009 Plan that we repurchase or that are forfeited, as well as shares used to pay the exercise price of a stock award or to satisfy the tax withholding obligations related to a stock award, become available for future grant under our 2009 Plan, although such shares may not be subsequently issued pursuant to the exercise of an Incentive Stock Option.
Plan Administration. Our board of directors or a duly authorized committee of our board of directors administers our 2009 Plan and the stock awards granted under it. Under our 2009 Plan, the board of directors has the authority to determine and amend the terms of awards, including recipients, the exercise, purchase or strike price of stock awards, if any, the number of shares subject to each stock award, the vesting schedule applicable to the awards, together with any vesting acceleration, and the form of consideration, if any, payable upon exercise or settlement of the award and the terms of the award agreements for use under our 2009 Plan. The board may amend the 2009 Plan in these and other respects with the consent of any adversely affected participant, although certain material amendments to the 2009 Plan require stockholder approval.
93
Table of Contents
Under the 2009 Plan, the board of directors also has the authority to modify outstanding awards, reprice any outstanding option, cancel any outstanding stock award in exchange for new stock awards, cash or other consideration, or take any other action that is treated as a repricing under GAAP, although if any such action adversely affects a participant, the written consent of that participant is required.
Corporate Transactions. Our 2009 Plan provides that in the event of certain specified significant corporate transactions, including: (1) a sale of all or substantially all of our assets, (2) the sale or disposition of at least 90% of our outstanding securities, (3) the consummation of a merger or consolidation where we do not survive the transaction and (4) the consummation of a merger or consolidation where we do survive the transaction but the shares of our Class B common stock outstanding prior to such transaction are converted or exchanged into other property by virtue of the transaction, under otherwise provided in an award agreement or other written agreement between us and the award holder, each outstanding award will terminate and be cancelled to the extent not vested or exercised prior to the effective time of the transaction. The administrator may instead take one or more of the following actions with respect to such stock awards: (1) arrange for the assumption, continuation or substitution of a stock award by a successor corporation, (2) arrange for the assignment of any reacquisition or repurchase rights held by us to a successor corporation, (3) accelerate the vesting, in whole or in part, of the stock award and provide for its termination prior to the transaction, (4) arrange for the lapse, in whole or in part, of any reacquisition or repurchase rights held by us or (5) make a payment, in the form determined by the board, equal to the excess, if any, of the value of the property the participant would have received upon exercise of the stock award prior to the transaction over any exercise price payable by the participant in connection with the exercise. The plan administrator is not obligated to treat all stock awards, even those that are of the same type, or all participants in the same manner.
In the event of a change in control, awards granted under the 2009 Plan will not receive automatic acceleration of vesting and exercisability, although this treatment may be provided for in an award agreement. Under the 2009 Plan, a change in control is defined to include (1) the acquisition by any person of more than 50% of the combined voting power of our then outstanding stock, (2) a merger, consolidation or similar transaction in which our stockholders immediately prior to the transaction do not own, directly or indirectly, more than 50% of the combined voting power of the surviving entity (or the parent of the surviving entity), (3) our stockholders approve or our board of directors approves a plan of complete dissolution or liquidation or a complete dissolution or liquidation of Pure Storage otherwise occurs except for a liquidation into a parent corporation and (4) a sale, lease, exclusive license or other disposition of all or substantially all of the assets to an entity that did not previously hold more than 50% of the voting power of our stock.
Transferability. Under our 2009 Plan, the board of directors may provide for limitations on the transferability of awards, in its sole discretion. Option awards are generally not transferable other than by will or the laws of descent and distribution, except as otherwise provided under our 2009 Plan.
Plan Amendment or Termination. Our board of directors has the authority to amend, suspend or terminate our 2009 Plan, although certain material amendments require the approval of our stockholders, and amendments that would impair the rights of any participant require the consent of that participant.
2015 Employee Stock Purchase Plan
Our board of directors adopted, and our stockholders approved, our 2015 Employee Stock Purchase Plan, or ESPP, in August 2015. The ESPP will become effective immediately upon the execution and delivery of the underwriting agreement related to this offering. The purpose of the ESPP is to secure the services of new employees, to retain the services of existing employees and to provide incentives for such individuals to exert maximum efforts toward our success and that of our affiliates. The ESPP is intended to qualify as an “employee stock purchase plan” within the meaning of Section 423 of the Code for U.S. employees.
94
Table of Contents
Share Reserve. Following this offering, the ESPP authorizes the issuance of 3,500,000 shares of our Class A common stock pursuant to purchase rights granted to our employees or to employees of any of our designated affiliates. The number of shares of our Class A common stock reserved for issuance will automatically increase on February 1st of each calendar year, from February 1, 2016 (assuming the ESPP becomes effective in fiscal year ending January 31, 2016) through February 1, 2025, by the lesser of (1) 1% of the total number of shares of our common stock outstanding on the last day of the calendar month prior to the date of the automatic increase, and (2) 3,500,000 shares; provided that prior to the date of any such increase, our board of directors may determine that such increase will be less than the amount set forth in clauses (1) and (2). As of the date hereof, no shares of our common stock have been purchased under the ESPP.
Administration. Our board of directors has delegated its authority to administer the ESPP to our compensation committee. The ESPP is implemented through a series of offerings under which eligible employees are granted purchase rights to purchase shares of our common stock on specified dates during such offerings. Under the ESPP, we may specify offerings with durations of not more than 27 months, and may specify shorter purchase periods within each offering. Each offering will have one or more purchase dates on which shares of our common stock will be purchased for employees participating in the offering. We currently intend to have 24-month offerings with multiple purchase periods (of approximately six months in duration) per offering, except that the first purchase period under our first offering may be shorter or longer than six months, depending on the date on which the underwriting agreement relating to this offering becomes effective. An offering under the ESPP may be terminated under certain circumstances.
Payroll Deductions. Generally, all regular employees, including executive officers, employed by us or by any of our designated affiliates, may participate in the ESPP and may contribute, normally through payroll deductions, up to 30% of their earnings (as defined in the ESPP) for the purchase of our common stock under the ESPP. Unless otherwise determined by our board of directors, common stock will be purchased for the accounts of employees participating in the ESPP at a price per share equal to the lower of (1) 85% of the fair market value of a share of our common stock on the first date of an offering or (2) 85% of the fair market value of a share of our common stock on the date of purchase. For the initial offering, which we expect will commence upon the execution and delivery of the underwriting agreement relating to this offering, the fair market value on the first day of the offering period will be the price at which shares are first sold to the public.
Limitations. Employees may have to satisfy one or more of the following service requirements before participating in the ESPP, as determined by our board of directors, including: (1) being customarily employed for more than 20 hours per week, (2) being customarily employed for more than five months per calendar year or (3) continuous employment with us or one of our affiliates for a period of time (not to exceed two years). No employee may purchase shares under the ESPP at a rate in excess of $25,000 worth of our common stock based on the fair market value per share of our common stock at the beginning of an offering for each year such a purchase right is outstanding and the maximum number of shares an employee may purchase during a single purchase period is 3,000. Finally, no employee will be eligible for the grant of any purchase rights under the ESPP if immediately after such rights are granted, such employee has voting power over 5% or more of our outstanding capital stock measured by vote or value pursuant to Section 424(d) of the Code.
Changes to Capital Structure. In the event that there occurs a change in our capital structure through such actions as a stock split, merger, consolidation, reorganization, recapitalization, reincorporation, stock dividend, dividend in property other than cash, large nonrecurring cash dividend, liquidating dividend, combination of shares, exchange of shares, change in corporate structure or similar transaction, the board of directors will make appropriate adjustments to (1) the number of shares reserved under the ESPP, (2) the maximum number of shares by which the share reserve may increase automatically each year, (3) the number of shares and purchase price of all outstanding purchase rights and (4) the number of shares that are subject to purchase limits under ongoing offerings.
95
Table of Contents
Corporate Transactions. In the event of certain significant corporate transactions, including: (1) a sale of all or substantially all of our assets, (2) the sale or disposition of 90% of our outstanding securities, (3) the consummation of a merger or consolidation where we do not survive the transaction and (4) the consummation of a merger or consolidation where we do survive the transaction but the shares of our common stock outstanding immediately prior to such transaction are converted or exchanged into other property by virtue of the transaction, any then-outstanding rights to purchase our stock under the ESPP may be assumed, continued or substituted for by any surviving or acquiring entity (or its parent company). If the surviving or acquiring entity (or its parent company) elects not to assume, continue or substitute for such purchase rights, then the participants’ accumulated payroll contributions will be used to purchase shares of our common stock within 10 business days prior to such corporate transaction, and such purchase rights will terminate immediately.
ESPP Amendment or Termination. Our board of directors has the authority to amend or terminate our ESPP, provided that except in certain circumstances such amendment or termination may not materially impair any outstanding purchase rights without the holder’s consent. We will obtain stockholder approval of any amendment to our ESPP as required by applicable law or listing requirements.
401(k) Plan
We maintain a tax-qualified retirement plan that provides eligible U.S. employees with an opportunity to save for retirement on a tax advantaged basis. Eligible employees are able to defer eligible compensation up to certain Code limits, which are updated annually. We have the ability to make matching and discretionary contributions to the 401(k) plan but have not done so to date. Employee contributions are allocated to each participant’s individual account and are then invested in selected investment alternatives according to the participants’ directions. Employees are immediately and fully vested in their own contributions. The 401(k) plan is intended to be qualified under Section 401(a) of the Code, with the related trust intended to be tax exempt under Section 501(a) of the Code. As a tax-qualified retirement plan, contributions to the 401(k) plan are deductible by us when made, and contributions and earnings on those amounts are not taxable to the employees until withdrawn or distributed from the 401(k) plan.
Insurance Premiums
We pay premiums for medical insurance and dental insurance for all full-time employees, including our named executive officers. We also pay premiums for life insurance and long-term disability insurance benefits for all full-time employees, including our named executive officers. We also offer high deductible plan options that include a healthcare flexible spending account component for all full-time employees, including our named executive officers. These benefits are available to all full-time employees, subject to applicable laws.
Limitations on Liability and Indemnification Matters
Upon the closing of this offering, our amended and restated certificate of incorporation will contain provisions that limit the liability of our current and former directors for monetary damages to the fullest extent permitted by Delaware law. Delaware law provides that directors of a corporation will not be personally liable for monetary damages for any breach of fiduciary duties as directors, except liability for:
| • | any breach of the director’s duty of loyalty to the corporation or its stockholders; |
| • | any act or omission not in good faith or that involves intentional misconduct or a knowing violation of law; |
| • | unlawful payments of dividends or unlawful stock repurchases or redemptions; or |
| • | any transaction from which the director derived an improper personal benefit. Such limitation of liability does not apply to liabilities arising under federal securities laws and does not affect the availability of equitable remedies such as injunctive relief or rescission. |
96
Table of Contents
Our amended and restated certificate of incorporation will authorize us to indemnify our directors, officers, employees and other agents to the fullest extent permitted by Delaware law. Our amended and restated bylaws will provide that we are required to indemnify our directors and officers to the fullest extent permitted by Delaware law and may indemnify our other employees and agents. Our amended and restated bylaws will also provide that, upon satisfaction of certain conditions, we shall advance expenses incurred by a director or officer in advance of the final disposition of any action or proceeding, and permit us to secure insurance on behalf of any officer, director, employee or other agent for any liability arising out of his or her actions in that capacity regardless of whether we would otherwise be permitted to indemnify him or her under the provisions of Delaware law. We have entered and expect to continue to enter into agreements to indemnify our directors, executive officers and other employees as determined by the board of directors. With certain exceptions, these agreements provide for indemnification for related expenses including, among other things, attorneys’ fees, judgments, fines and settlement amounts incurred by any of these individuals in any action or proceeding. We believe that these amended and restated certificate of incorporation and amended and restated bylaw provisions and indemnification agreements are necessary to attract and retain qualified persons as directors and officers. We also maintain customary directors’ and officers’ liability insurance.
The limitation of liability and indemnification provisions in our amended and restated certificate of incorporation and amended and restated bylaws may discourage stockholders from bringing a lawsuit against our directors for breach of their fiduciary duty. They may also reduce the likelihood of derivative litigation against our directors and officers, even though an action, if successful, might benefit us and other stockholders. Further, a stockholder’s investment may be adversely affected to the extent that we pay the costs of settlement and damage awards against directors and officers as required by these indemnification provisions.
At present, there is no pending litigation or proceeding involving any of our directors, officers or employees for which indemnification is sought and we are not aware of any threatened litigation that may result in claims for indemnification.
Insofar as indemnification for liabilities arising under the Securities Act of 1933, as amended, may be permitted for directors, executive officers or persons controlling us, we have been informed that, in the opinion of the SEC, such indemnification is against public policy as expressed in the Securities Act and is therefore unenforceable.
Rule 10b5-1 Sales Plans
Our directors and officers may adopt written plans, known as Rule 10b5-1 plans, in which they will contract with a broker to buy or sell shares of our Class A and Class B common stock on a periodic basis. Under a Rule 10b5-1 plan, a broker executes trades pursuant to parameters established by the director or officer when entering into the plan, without further direction from them. The director or officer may amend a Rule 10b5-1 plan in some circumstances and may terminate a plan at any time. Our directors and executive officers also may buy or sell additional shares outside of a Rule 10b5-1 plan when they are not in possession of material nonpublic information, subject to compliance with the terms of our insider trading policy. Prior to 180 days after the date of this offering, the sale of any shares under such plan would be subject to the lock-up agreement that the director or officer has entered into with the underwriters.
97
Table of Contents
CERTAIN RELATIONSHIPS AND RELATED PERSON TRANSACTIONS
The following is a summary of transactions since February 1, 2012 to which we have been a participant, in which the amount involved exceeded or will exceed $120,000 and in which any of our directors, executive officers or holders of more than 5% of our capital stock, or any member of the immediate family of the foregoing persons, had or will have a direct or indirect material interest, other than compensation and other arrangements that are described in the section titled “Executive Compensation” or that were approved by our compensation committee.
We believe the terms obtained or consideration that we paid or received, as applicable, in connection with the transactions described below were comparable to terms available or the amounts that would be paid or received, as applicable, in arm’s-length transactions.
Sales of Preferred Stock
In August 2012, we issued an aggregate of 10,584,066 shares of our Series D preferred stock at a purchase price of $3.7713 per share for an aggregate purchase price of $39.9 million. In August, September and October 2013 and June, September and November 2014, we issued an aggregate of 24,761,984 shares of our Series E preferred stock at a purchase price of $6.9315 per share for an aggregate purchase price of $171.6 million. In April 2014, we issued an aggregate of 14,307,603 shares of our Series F preferred stock at a purchase price of $15.7259 per share for an aggregate purchase price of $225.0 million. The following table summarizes purchases of preferred stock by holders of more than 5% of our capital stock and their affiliated entities and our directors. None of our executive officers purchased shares of preferred stock.
| Name |
Series D Preferred Stock |
Series E Preferred Stock |
Series F Preferred Stock |
Aggregate Purchase Price |
||||||||||||
| Entities affiliated with Redpoint Ventures(1) |
1,325,784 | 1,046,796 | 635,893 | $ | 22,255,829 | |||||||||||
| Entities affiliated with Greylock(2) |
1,839,660 | 3,204,872 | 1,589,734 | 54,152,539 | ||||||||||||
| Entities affiliated with Index Ventures(3) |
3,977,376 | 1,580,232 | 1,271,787 | 45,953,383 | ||||||||||||
| Entities and individuals affiliated with Sutter Hill Ventures(4) |
2,918,502 | 5,110,470 | 2,543,574 | 86,429,857 | ||||||||||||
| (1) | Includes shares of preferred stock purchased by Redpoint Ventures IV, L.P. and Redpoint Associates IV, LLC. Mr. Dharmaraj, a former member of our board of directors, is a partner at Redpoint Ventures. |
| (2) | Includes shares of preferred stock purchased by Greylock XIII Limited Partnership, Greylock XIII-A Limited Partnership and Greylock XIII Principals LLC. Mr. Bhusri, a member of our board of directors, is a partner at Greylock. |
| (3) | Includes shares of preferred stock purchased by Index Ventures VI (Jersey), L.P., Index Ventures VI Parallel Entrepreneur Fund (Jersey), L.P. and Yucca (Jersey) SLP. Mr. Volpi, a member of our board of directors, is a partner at Index Ventures. |
| (4) | Includes shares purchased by Sutter Hill Ventures, shares purchased by Mr. Speiser and entities affiliated with Mr. Speiser, and shares purchased by individuals other than Mr. Speiser who are affiliated with Sutter Hill Ventures or entities affiliated with such individuals. Mr. Speiser, a member of our board of directors, is a Managing Director at Sutter Hill Ventures. Mr. Speiser may also be deemed to have shared voting and investment power with respect to the shares purchased by Sutter Hill Ventures. |
Upon the closing of this offering, each share of preferred stock will convert into one share of Class B common stock. For a description of the material rights and privileges of the preferred stock, please see Note 7 to our consolidated financial statements included elsewhere in this prospectus.
2013 Tender Offer
In November 2013, we repurchased an aggregate of 3,045,634 shares of our outstanding Class B common stock at a purchase price of $6.9315 per share for an aggregate purchase price of $21.1 million, of which 557,842 shares of common stock were repurchased from David Hatfield, our President, for an aggregate price of $3.9 million. Mr. Hatfield was the only executive officer to participate in this tender offer.
98
Table of Contents
2014 Tender Offer
In July 2014, we repurchased an aggregate of 3,803,336 shares of our outstanding Class B common stock at a purchase price of $15.7259 per share for an aggregate purchase price of $59.8 million. The following table summarizes our repurchases of common stock from our directors and executive officers in this tender offer.
| Name |
Shares of Common Stock |
Purchase Price |
||||||
| Scott Dietzen(1) |
192,051 | $ | 3,020,174 | |||||
| John Colgrove(2) |
200,000 | 3,145,180 | ||||||
| David Hatfield(3) |
1,000,000 | 15,725,900 | ||||||
| (1) | Dr. Dietzen is our Chief Executive Officer and a member of our board of directors. |
| (2) | Mr. Colgrove is our Chief Technology Officer and a member of our board of directors. |
| (3) | Mr. Hatfield is our President. |
Investor Rights Agreement
In April 2014, we entered into an amended and restated investor rights agreement with certain holders of our outstanding preferred stock, including Mike Speiser and Frank Slootman (members of our board of directors) and entities affiliated with Greylock Partners, Index Ventures, Redpoint Ventures and Sutter Hill Ventures, with certain registration rights, including the right to demand that we file a registration statement or request that their shares be covered by a registration statement that we are otherwise filing. Aneel Bhusri, Michelangelo Volpi and Mike Speiser, members of our board of directors, are affiliated with Greylock Partners, Index Ventures and Sutter Hill Ventures, respectively. Satish Dharmaraj, a former member of our board of directors, is affiliated with Redpoint Ventures. The investor rights agreement also provides these stockholders with information rights, which will terminate upon the closing of this offering, and a right of first refusal with regard to certain issuances of our capital stock, which will not apply to, and will terminate upon, the closing of, this offering. After the closing of this offering, the holders of 122,280,679 shares of our Class B common stock issuable upon conversion of outstanding preferred stock, will be entitled to rights with respect to the registration of their shares of Class B common stock under the Securities Act pursuant to this agreement. For a description of these registration rights, see the section titled “Description of Capital Stock—Registration Rights.”
Offer Letter Agreements
We have entered into offer letter agreements with our executive officers. For more information regarding these agreements, see the section titled “Executive Compensation—Employment, Severance and Change of Control Agreements.”
Equity Grants
We have granted stock options to our executive officers and certain members of our board of directors. For a description of these stock options, see the section titled “Executive Compensation” and “Management—Non-Employee Director Compensation.”
Employee Loans
In June 2012, we loaned Dr. Dietzen, our Chief Executive Officer, $282,710 in connection with his exercise of options to purchase 576,963 shares of Class B common stock. The loan was evidenced by a full recourse promissory note, which accrued interest at the rate of 1.59% per annum and was secured by a pledge of such exercised shares. The loan was repaid in full in September 2014.
99
Table of Contents
In June 2012, we loaned Mr. Colgrove, our Chief Technology Officer, $282,710 in connection with his exercise of options to purchase 576,963 shares of Class B common stock. The loan was evidenced by a full recourse promissory note, which accrued interest at the rate of 1.59% per annum and was secured by a pledge of such exercised shares. The loan was repaid in full in September 2014.
In June 2013, we loaned Mr. Hatfield, our President, $2,050,069 in connection with his exercise of options to purchase 1,673,526 shares of Class B common stock. The loan was evidenced by a full recourse promissory note, which accrued interest at the rate of 0.95% per annum and was secured by a pledge of such exercised shares. The loan was repaid in full in July 2014.
In March 2014, we loaned Mr. Colgrove, our Chief Technology Officer, $772,500 in connection with his exercise of options to purchase 300,000 shares of Class B common stock. The loan was evidenced by a full recourse promissory note, which accrued interest at the rate of 1.84% per annum and was secured by a pledge of such exercised shares. The loan was repaid in full in September 2014.
Indemnification Agreements
Our amended and restated certificate of incorporation will contain provisions limiting the liability of directors, and our amended and restated bylaws will provide that we will indemnify each of our directors and officers to the fullest extent permitted under Delaware law. Our amended and restated certificate of incorporation and bylaws will also provide our board of directors with discretion to indemnify our employees and other agents when determined appropriate by the board. In addition, we have entered into an indemnification agreement with each of our directors and executive officers, which requires us to indemnify them. For more information regarding these agreements, see the section titled “Executive Compensation—Limitations on Liability and Indemnification Matters.”
Related-Party Transaction Policy
We intend to adopt a formal written policy that our executive officers, directors, holders of more than 5% of any class of our voting securities, and any member of the immediate family of and any entity affiliated with any of the foregoing persons, will not be permitted to enter into a related-party transaction with us without the prior consent of our audit committee, or other independent members of our board of directors in the event it is inappropriate for our audit committee to review such transaction due to a conflict of interest. Any request for us to enter into a transaction with an executive officer, director, principal stockholder or any of their immediate family members or affiliates, in which the amount involved exceeds $120,000 must first be presented to our audit committee for review, consideration and approval. In approving or rejecting any such proposal, our audit committee will consider the relevant facts and circumstances available and deemed relevant to our audit committee, including, but not limited to, whether the transaction will be on terms no less favorable than terms generally available to an unaffiliated third-party under the same or similar circumstances and the extent of the related-party’s interest in the transaction.
All of the transactions described in this section were entered into prior to the adoption of this policy. Although we have not had a written policy for the review and approval of transactions with related persons, our board of directors has historically reviewed and approved any transaction where a director or officer had a financial interest, including the transactions described above. Prior to approving such a transaction, the material facts as to a director’s or officer’s relationship or interest in the agreement or transaction were disclosed to our board of directors. Our board of directors took this information into account when evaluating the transaction and in determining whether such transaction was fair to us and in the best interest of all our stockholders.
100
Table of Contents
The following table sets forth certain information with respect to the beneficial ownership of our common stock as of July 31, 2015:
| • | each person, or group of affiliated persons, known by us to beneficially own more than five percent of our Class A common stock or Class B common stock; |
| • | each of our named executive officers; |
| • | each of our directors; and |
| • | all of our executive officers and directors as a group. |
The percentage of shares beneficially owned before the offering shown in the table is based on 160,056,764 shares of Class B common stock outstanding as of July 31, 2015, after giving effect to the conversion of all of our outstanding preferred stock into shares of Class B common stock upon the closing of this offering. The information relating to the number and percentage of shares beneficially owned after the offering assumes the sale by us of shares of common stock in this offering. The percentage ownership information assumes no exercise of the underwriters’ over-allotment option to purchase additional shares of our Class A common stock.
Beneficial ownership is determined in accordance with the rules of the SEC and generally includes any shares over which a person exercises sole or shared voting or investment power. Unless otherwise indicated, the persons or entities identified in this table have sole voting and investment power with respect to all shares shown beneficially owned by them, subject to applicable community property laws. Shares of Class B common stock issuable under options that are exercisable within 60 days after July 31, 2015 are deemed beneficially owned and such shares are used in computing the percentage ownership of the person holding the options, but are not deemed outstanding for the purpose of computing the percentage ownership of any other person. The information contained in the following table is not necessarily indicative of beneficial ownership for any other purpose, and the inclusion of any shares in the table does not constitute an admission of beneficial ownership of those shares.
Except as otherwise noted below, the address for persons listed in the table is c/o Pure Storage, Inc., 650 Castro Street, Suite 400, Mountain View, California 94041.
| Name and Address of Beneficial Owner |
Beneficial Ownership Prior to the Offering |
Beneficial Ownership After the Offering | ||||||||||||||||||||||||||||||||
| Class A Common Stock |
Class B Common Stock |
% of Total Voting Power † |
Class A Common Stock |
Class B Common Stock |
% of Total Voting Power † | |||||||||||||||||||||||||||||
| Shares | % | Shares | % | Shares | % | Shares | % | |||||||||||||||||||||||||||
| Executive Officers |
||||||||||||||||||||||||||||||||||
| Scott Dietzen(1) |
— | — | 7,306,083 | 4.6 | % | 4.6 | % | — | — | |||||||||||||||||||||||||
| David Hatfield(2) |
— | — | 2,458,620 | 1.5 | 1.5 | — | — | |||||||||||||||||||||||||||
| Timothy Riitters |
— | — | 284,375 | * | * | — | — | |||||||||||||||||||||||||||
| John Colgrove (3) |
— | — | 13,553,926 | 8.5 | 8.5 | — | — | |||||||||||||||||||||||||||
| Directors |
||||||||||||||||||||||||||||||||||
| Aneel Bhusri(4) |
— | — | 26,838,635 | 16.8 | 16.8 | — | — | |||||||||||||||||||||||||||
| Mark Garrett(5) |
— | — | 300,000 | * | * | — | — | |||||||||||||||||||||||||||
| Anita Sands(6) |
— | — | 300,000 | * | * | — | — | |||||||||||||||||||||||||||
| Frank Slootman(7) |
— | — | 486,208 | * | * | — | — | |||||||||||||||||||||||||||
| Mike Speiser(8) |
— | — | 29,992,045 | 18.7 | 18.7 | — | — | |||||||||||||||||||||||||||
| Michelangelo Volpi(9) |
— | — | 6,829,395 | 4.3 | 4.3 | — | — | |||||||||||||||||||||||||||
| All directors and executive officers as a group (10 persons)(10) |
— | — | 90,464,767 | 55.7 | 55.7 | — | — | |||||||||||||||||||||||||||
| Principal Stockholders |
||||||||||||||||||||||||||||||||||
| Entities affiliated with Greylock(11) |
— | — | 27,625,981 | 17.3 | 17.3 | — | — | |||||||||||||||||||||||||||
| Persons affiliated with Sutter Hill Ventures(12) |
— | — | 43,822,460 | 27.4 | 27.4 | — | — | |||||||||||||||||||||||||||
| Entities affiliated with Redpoint Ventures(13) |
— | — | 9,095,089 | 5.7 | 5.7 | — | — | |||||||||||||||||||||||||||
101
Table of Contents
| * | Denotes less than 1% |
| † | Represents the voting power with respect to all shares of our Class A common stock and Class B common stock, voting as a single class. Each share of Class A common stock will be entitled to one vote per share and each share of Class B common stock will be entitled to ten votes per share. The Class A common stock and Class B common stock will vote together on all matters (including the election of directors) submitted to a vote of stockholders, except under limited circumstances described in the section titled “Description of Capital Stock—Class A and Class B Common Stock—Voting Rights.” |
| (1) | Includes (i) 5,906,083 shares held by Scott Dietzen and Katherine Dietzen, Co-Trustees of the Dietzen Living Trust, dated January 16, 2009, over which Dr. Dietzen shares voting and dispositive power, 884,677 shares of which are unvested and subject to our right of repurchase; and (ii) 1,400,000 shares held by JP Morgan Trust Company of Delaware, as Trustee of the Dietzen Family 2014 Irrevocable Trust GST Exempt Trust under agreement dated March 25, 2014, over which Dr. Dietzen shares voting and dispositive power. |
| (2) | Includes (i) 18,666 shares held by DMH 2013 Irrevocable Trust; (ii) 18,666 shares held by JHH 2013 Irrevocable Trust, 18,666 shares held by KGH 2013 Irrevocable Trust, over which Mr. Hatfield has voting and dispositive power; (iii) 1,350,510 shares held directly by Mr. Hatfield, 412,226 shares of which are unvested and subject to our right of repurchase; and (iv) 1,052,112 shares issuable pursuant to stock options exercisable within 60 days after July 31, 2015. |
| (3) | Includes (i) 2,250,000 shares held by Eric Edward Colgrove Irrevocable Trust DTD Feb 8, 2011, Jeff Rothschild TTEE; (ii) 2,250,000 shares held by Richard Winston Colgrove Irrevocable Trust DTD Feb 8, 2011, Jeff Rothschild TTEE; (iii) 1,553,926 shares held by the Colgrove Family Living Trust, over which Mr. Colgrove shares voting and dispositive power, 1,061,571 shares of which are unvested and subject to our right of repurchase; and (iv) 7,500,000 shares held directly by Mr. Colgrove. |
| (4) | Mr. Bhusri does not own shares in his individual capacity. Mr. Bhusri is a Partner at Greylock Partners and shares voting and investment power over the shares held by Greylock XIII Limited Partnership and Greylock XIII-A Limited Partnership. See Footnote 10. |
| (5) | Includes 10,000 shares issuable pursuant to stock options exercisable within 60 days after July 31, 2015. |
| (6) | Includes 10,000 shares issuable pursuant to stock options exercisable within 60 days after July 31, 2015. |
| (7) | Includes 176,208 shares held by the Slootman Living Trust, dated September 8, 1999 and 310,000 shares issuable pursuant to stock options exercisable within 60 days after July 31, 2015. |
| (8) | Includes: (i) 2,938,406 shares held by Speiser Trust Agreement Dated 7/19/06, of which Mr. Speiser is a trustee, 60,848 shares of which are unvested and subject to our right of repurchase; (ii) 377,173 shares held by Chatter Peak Partners, L.P., of which Mr. Speiser is a trustee of the general partner, 44,590 shares of which are unvested and subject to our right of repurchase; (iii) 6,000 shares held by Wells Fargo Bank, N.A. FBO Michael L. Speiser Roth IRA, Mr. Speiser’s Roth IRA account; and (iv) 43,800 shares held by Wells Fargo Bank, N.A. FBO SHV Profit Sharing Plan FBO Michael L. Speiser, a retirement trust for the benefit of Mr. Speiser. Mr. Speiser is a managing director and member of the management committee of the general partner of Sutter Hill Ventures and shares voting and investment power over the shares held of record by Sutter Hill Ventures. See Footnote 12. |
| (9) | Mr. Volpi does not own shares in his individual capacity. Mr. Volpi is a partner with Index Ventures. Mr. Volpi is involved in making investment recommendations to the entities affiliated with Index Ventures, but does not hold voting or dispositive power over the shares held by these entities. |
| (10) | Includes 23,914,040 shares held by our current directors and executive officers, 1,669,770 shares of which are unvested and subject to our right of repurchase, 2,246,487 shares issuable pursuant to stock options exercisable within 60 days after July 31, 2015, 64,304,240 shares held by entities affiliated with certain of our directors, 1,237,204 shares of which are unvested and subject to our right of repurchase. |
| (11) | Includes (i) 24,621,929 shares held of record by Greylock XIII Limited Partnership; (ii) 787,346 shares held of record by Greylock XIII Principals LLC; and (iii) 2,216,706 shares of record held by Greylock XIII-A Limited Partnership. Greylock XIII GP LLC is the general partner of Greylock XIII Limited Partnership and Greylock XIII-A Limited Partnership and as such may be deemed to have indirect beneficial ownership of an indeterminate amount of such shares. Aneel Bhusri (a member of our board of directors), William Helman, David Sze and Donald Sullivan are the senior managing members of Greylock XIII GP LLC and share |
| voting and investment power over the shares held by Greylock XIII Limited Partnership and Greylock XIII-A Limited Partnership. Mr. Bhusri does not have voting or investment power over the shares held by Greylock XIII Principals LLC. The address for Greylock Partners is 2550 Sand Hill Road, Menlo Park, CA 94025. |
| (12) | Mr. Speiser is a managing director and member of the management committee (the “Management Committee”) of the general partner of Sutter Hill Ventures, a California Limited Partnership (“Sutter Hill Ventures”), which holds of record 26,626,666 shares, 855,425 shares of which are unvested and subject to our right of repurchase. In such capacity, Mr. Speiser shares, with each of the other members of the Management Committee named below (each, a “Management Committee Member”), voting and investment power over the shares held of record by Sutter Hill Ventures. In addition, this amount also includes: (i) 2,938,406 shares held by Speiser Trust Agreement Dated 7/19/06, of which Mr. Speiser is a trustee, 60,848 shares of which are unvested and subject to our right of repurchase; (ii) 377,173 shares held by Chatter Peak Partners, L.P., of which Mr. Speiser is a trustee of the general partner, 44,590 shares of which are unvested and subject to our right of repurchase; (iii) 6,000 shares held by Wells Fargo Bank, N.A. FBO Michael L. Speiser Roth IRA, Mr. Speiser’s Roth IRA account; and (iv) 43,800 shares held by Wells Fargo Bank, N.A. FBO SHV Profit Sharing Plan FBO Michael L. Speiser, a retirement trust for the benefit of Mr. Speiser. This amount also includes: (i) an aggregate of 2,093,370 shares held by entities controlled by Jeffrey W. Bird, a Management Committee Member, 64,578 shares of which are unvested and subject to our right of repurchase; (ii) an aggregate of 4,418,966 shares held by entities controlled by Tench Coxe, a Management Committee Member, 134,357 shares of which are unvested and subject to our right of repurchase; (iii) an aggregate of 308,179 shares held by entities controlled by Stefan A. Dyckerhoff, a Management Committee Member, 21,425 shares of which are unvested and subject to our right of repurchase; (iv) an aggregate of 444,979 shares held by entities controlled by Samuel J. Pullara III, a Management Committee Member, 21,425 shares of which are unvested and subject to our right of repurchase; (v) an aggregate of 2,289,773 shares held by entities controlled by James N. White, a Management Committee Member, 70,388 shares of which are unvested and subject to our right of repurchase; and (vi) an aggregate of 4,275,148 shares held by other managing directors of Sutter Hill Ventures who are not Management Committee Members, or entities controlled by such individuals, 132,482 shares of which are unvested and subject to our right of repurchase. This amount gives effect to a distribution of shares by Sutter Hill Ventures to certain of its general partners in August 2015. The address for Sutter Hill Ventures is 755 Page Mill Road, A200, Palo Alto, CA 94304. |
102
Table of Contents
| (13) | Includes (i) 227,377 shares held of record by Redpoint Associates IV, LLC (“RA IV”) and (ii) 8,867,712 shares held of record by Redpoint Ventures IV, L.P. (“RV IV”). Redpoint Ventures IV, LLC (“RV IV LLC”) serves as the sole general partner of RV IV and the managers of RV IV LLC commonly control RA IV. As such, RV IV LLC possesses power to direct the voting and disposition of the shares owned by RV IV and RA IV and may be deemed to have indirect beneficial ownership of the shares held by RV IV and RA IV. RV IV LLC does not own any shares directly. Allen Beasley, Jeffrey D. Brody, Satish Dharmaraj, R. Thomas Dyal, Timothy M. Haley, Christopher B. Moore, Scott C. Raney, John L. Walecka and Geoffrey Y. Yang are the managers of RV IV LLC and share voting and investment power over the shares held by RA IV and RV IV. The address for the entities affiliated with Redpoint is 3000 Sand Hill Road, Building 2, Suite 290, Menlo Park, CA 94025. |
103
Table of Contents
General
The following description of our capital stock summarizes the most important terms of our capital stock as they are expected to be in effect upon the closing of this offering. The descriptions of our capital stock and certain provisions of our amended and restated certificate of incorporation and amended and restated bylaws are summaries and are qualified by reference to the amended and restated certificate of incorporation and the amended and restated bylaws that will be in effect upon the closing of this offering. Copies of these documents will be filed with the SEC as exhibits to our registration statement, of which this prospectus forms a part.
Our amended and restated certificate of incorporation provides for two classes of common stock: Class A common stock and Class B common stock. In addition, our amended and restated certificate of incorporation will authorize shares of undesignated preferred stock, the rights, preferences and privileges of which may be designated from time to time by our board of directors.
Upon the closing of this offering, our authorized capital stock will consist of 2,270,000,000 shares, all with a par value of $0.0001 per share, of which:
| • | 2,000,000,000 shares are designated as Class A common stock; |
| • | 250,000,000 shares are designated as Class B common stock; and |
| • | 20,000,000 shares are designated as preferred stock. |
As of July 31, 2015, we had 37,776,085 shares of Class B common stock and 122,280,679 shares of preferred stock outstanding. After giving effect to the conversion of all outstanding shares of our preferred stock into shares of Class B common stock upon the closing of this offering, there would have been 160,056,764 shares of Class B common stock outstanding on that date held by 402 stockholders of record. As of July 31, 2015, we also had outstanding options to acquire 59,928,620 shares of Class B common stock.
Class A and Class B Common Stock
Except as otherwise expressly provided in our amended and restated certificate of incorporation or required by applicable law, shares of Class A common stock and Class B common stock will have the same rights and privileges and rank equally, share ratably and be identical in all respects as to all matters, including, without limitation, those described below.
Dividend and Distribution Rights. Subject to the prior rights of holders of all classes and series of stock at the time outstanding having prior rights as to dividends, the holders of Class A common stock and Class B common stock will be entitled to receive, when, as and if declared by the board of directors, out of any assets of the Company legally available therefor, such dividends as may be declared from time to time by the board of directors. Any dividends paid to the holders of Class A common stock and Class B common stock shall be paid pro rata, on an equal priority, pari passu basis, unless different treatment of the shares of each such class is approved by the affirmative vote of the holders of the majority of the outstanding shares of the applicable class of common stock treated adversely, voting separately as a class. The Company shall not declare or pay any dividend or make any other distribution to the holders of Class A common stock or Class B common stock payable in securities of the Company unless the same dividend or distribution with the same record date and payment date shall be declared and paid on all shares of common stock; provided, however, that (i) dividends or other distributions payable in shares of Class A common stock or rights to acquire shares of Class A common stock may be declared and paid to the holders of Class A common stock without the same dividend or distribution being declared and paid to the holders of the Class B common stock if, and only if, a dividend payable in shares of Class B common stock, or rights to acquire shares of Class B common stock, as applicable, are declared and paid to the holders of Class B common stock at the same rate and with the same record date and payment date and (ii) dividends or other distributions payable in shares of Class B common stock or rights to acquire shares
104
Table of Contents
Class B common stock may be declared and paid to the holders of Class B common stock without the same dividend or distribution being declared and paid to the holders of the Class A common stock if, and only if, a dividend payable in shares of Class A common stock, or rights to acquire shares of Class A common stock, as applicable, are declared and paid to the holders of Class A common stock at the same rate and with the same record date and payment date.
Voting Rights. Holders of our Class A common stock and Class B common stock have identical rights, provided that, except as otherwise expressly provided in our amended and restated certificate of incorporation or required by applicable law, on any matter that is submitted to a vote of our stockholders, holders of our Class A common stock are entitled to one vote per share of Class A common stock and holders of our Class B common stock are entitled to ten votes per share of Class B common stock. Holders of shares of Class A common stock and Class B common stock will vote together as a single class on all matters (including the election of directors) submitted to a vote of stockholders, except that there will be a separate vote of our Class A common stock in order for us to, directly or indirectly, effect an asset transfer, acquisition or liquidation event (each as defined in our amended and restated certificate of incorporation) pursuant to which the Class A common stock would not receive equivalent consideration (as defined in our amended and restated certificate of incorporation) to the Class B common stock, and there will be a separate vote of our Class B common stock in order for us to, directly or indirectly, take action in the following circumstances:
| • | if we propose to amend, alter or repeal any provision of our amended and restated certificate of incorporation or our amended and restated bylaws that modifies the voting, conversion or other powers, preferences or other special rights or privileges or restrictions of the Class B common stock; or |
| • | if we reclassify any outstanding shares of Class A common stock into shares having rights as to dividends or liquidation that are senior to the Class B common stock or the right to more than one vote for each share thereof. |
Upon the closing of this offering, under our amended and restated certificate of incorporation, we may not increase or decrease the authorized number of shares of Class A common stock or Class B common stock without the affirmative vote of the holders of a majority of the combined voting power of the outstanding shares of Class A common stock and Class B common stock, voting together as a single class. In addition, we may not issue any shares of Class B common stock, unless that issuance is approved by the affirmative vote of the holders of a majority of the outstanding shares of Class B common stock.
We have not provided for cumulative voting for the election of directors in our amended and restated certificate of incorporation.
No Preemptive or Similar Rights. Our common stock is not entitled to preemptive rights and is not subject to conversion, redemption or sinking fund provisions. The rights, preferences and privileges of the holders of our common stock are subject to, and may be adversely affected by, the rights of the holders of any series of our preferred stock that we may designate and issue in the future.
Liquidation Rights. In the event of our liquidation, dissolution or winding-up, upon the completion of the distributions required with respect to any series of preferred stock that may then be outstanding, the remaining assets of the Company legally available for distribution to stockholders shall be distributed on an equal priority, pro rata basis to the holders of Class A common stock and Class B common stock.
Subdivisions and Combinations. If we subdivide or combine in any manner outstanding shares of Class A common stock or Class B common stock, then the outstanding shares of all common stock will be subdivided or combined in the same proportion and manner.
Conversion. Shares of Class B common stock may be converted to Class A common stock at any time immediately following the closing of this offering at the option of the stockholder. Shares of Class B common stock automatically convert to Class A common stock upon the following: (i) sale or transfer of such share of
105
Table of Contents
Class B common stock; (ii) the death of the Class B common stockholder (or nine months after the date of death if the stockholder is one of our founders); and (iii) on the final conversion date, defined as the earlier of (a) the first trading day on or after the date on which the outstanding shares of Class B common stock represent less than 10% of the then outstanding Class A and Class B common stock; (b) the tenth anniversary of this offering; or (c) the date specified by vote of the holders of a majority of the outstanding shares of Class B common stock, voting as a single class.
Preferred Stock
As of July 31, 2015, there were 122,280,679 shares of our preferred stock outstanding. Immediately prior to the closing of this offering, each outstanding share of our preferred stock will convert into one share of our Class B common stock.
Upon the closing of this offering, our board of directors may, without further action by our stockholders, fix the rights, preferences, privileges and restrictions of up to an aggregate of 20,000,000 shares of preferred stock in one or more series and authorize their issuance. These rights, preferences and privileges could include dividend rights, conversion rights, voting rights, terms of redemption, liquidation preferences, sinking fund terms and the number of shares constituting any series or the designation of such series, any or all of which may be greater than the rights of our common stock. The issuance of our preferred stock could adversely affect the voting power of holders of our common stock, and the likelihood that such holders will receive dividend payments and payments upon liquidation. In addition, the issuance of preferred stock could have the effect of delaying, deferring or preventing a change of control or other corporate action. Upon the closing of this offering, no shares of preferred stock will be outstanding, and we have no present plan to issue any shares of preferred stock.
Registration Rights
Stockholder Registration Rights
We are party to an investor rights agreement which provides that holders of our preferred stock, including certain holders of 5% of our capital stock and entities affiliated with certain of our directors, have certain registration rights, as set forth below. This investor rights agreement was entered into in April 2014 and has been amended and restated from time to time in connection with our preferred stock financings. The registration of shares of our Class B common stock pursuant to the exercise of registration rights described below would enable the holders to sell these shares without restriction under the Securities Act when the applicable registration statement is declared effective. We will pay the registration expenses, other than underwriting discounts and selling commissions, of the shares registered pursuant to the demand, piggyback and Form S-3 registrations described below.
Generally, in an underwritten offering, the managing underwriter, if any, has the right, subject to specified conditions, to limit the number of shares such holders may include. The demand, piggyback and Form S-3 registration rights described below will expire three years after the effective date of the registration statement, of which this prospectus forms a part, or with respect to any particular stockholder, such time as that stockholder holds less than 1% of the number of shares of our common stock then outstanding and that stockholder can sell all of its shares under Rule 144 of the Securities Act during any three-month period.
Demand Registration Rights
The holders of an aggregate of 122,280,679 shares of Class B common stock, issuable upon conversion of outstanding preferred stock, will be entitled to certain demand registration rights. At any time beginning 180 days after the consummation of this offering, the holders of at least 70% of these shares may, on not more than two occasions, request that we register all or a portion of their shares. Such request for registration must cover 20% of such shares then outstanding.
106
Table of Contents
Piggyback Registration Rights
In connection with this offering, the holders of an aggregate of 122,280,679 shares of Class B common stock, issuable upon conversion of outstanding preferred stock, were entitled to, and the necessary percentage of holders waived, their rights to notice of this offering and to include their shares of registrable securities in this offering. In the event that we propose to register any of our securities under the Securities Act, either for our own account or for the account of other security holders, the holders of these shares will be entitled to certain “piggyback” registration rights allowing the holder to include their shares in such registration, subject to certain marketing and other limitations. As a result, whenever we propose to file a registration statement under the Securities Act, other than with respect to a demand registration or a registration statement on Forms S-4 or S-8, the holders of these shares are entitled to notice of the registration and have the right, subject to limitations that the underwriters may impose on the number of shares included in the registration, to include their shares in the registration.
Form S-3 Registration Rights
The holders of an aggregate of 122,280,679 shares of Class B common stock, issuable upon conversion of outstanding preferred stock, will be entitled to certain Form S-3 registration rights. The holders of these shares can make a request that we register their shares on Form S-3 if we are qualified to file a registration statement on Form S-3 and if the reasonably anticipated aggregate gross proceeds of the shares offered would equal or exceed $1,000,000. We will not be required to effect more than two registrations on Form S-3.
Anti-Takeover Provisions
Amended and Restated Certificate of Incorporation and Amended and Restated Bylaws
Among other things, our amended and restated certificate of incorporation and amended and restated bylaws will:
| • | permit our board of directors to issue up to 20,000,000 shares of preferred stock, with any rights, preferences and privileges as they may designate, including the right to approve an acquisition or other change of control; |
| • | provide that the authorized number of directors may be changed only by resolution of our board of directors; |
| • | provide that our board of directors will be classified into three classes of directors; |
| • | provide that, subject to the rights of any series of preferred stock to elect directors, directors may only be removed for cause, which removal may be effected, subject to any limitation imposed by law, by the holders of at least a majority of the voting power of all of our then-outstanding shares of the capital stock entitled to vote generally at an election of directors; |
| • | provide that all vacancies, including newly created directorships, may, except as otherwise required by law, be filled by the affirmative vote of a majority of directors then in office, even if less than a quorum; |
| • | require that any action to be taken by our stockholders must be effected at a duly called annual or special meeting of stockholders and not be taken by written consent or electronic transmission; |
| • | provide that stockholders seeking to present proposals before a meeting of stockholders or to nominate candidates for election as directors at a meeting of stockholders must provide advance notice in writing, and also specify requirements as to the form and content of a stockholder’s notice; |
| • | provide that special meetings of our stockholders may be called only by the chairman of our board of directors, our chief executive officer or by our board of directors pursuant to a resolution adopted by a majority of the total number of authorized directors; and |
107
Table of Contents
| • | not provide for cumulative voting rights, therefore allowing the holders of a majority of the shares of common stock entitled to vote in any election of directors to elect all of the directors standing for election, if they should so choose. |
The amendment of any of these provisions would require approval by the holders of at least 66 2/3% of the voting power of all of our then-outstanding capital stock entitled to vote generally in the election of directors, voting together as a single class.
The combination of these provisions will make it more difficult for our existing stockholders to replace our board of directors as well as for another party to obtain control of us by replacing our board of directors. Since our board of directors has the power to retain and discharge our officers, these provisions could also make it more difficult for existing stockholders or another party to effect a change in management. In addition, the authorization of undesignated preferred stock makes it possible for our board of directors to issue preferred stock with voting or other rights or preferences that could impede the success of any attempt to change our control.
These provisions are intended to enhance the likelihood of continued stability in the composition of our board of directors and its policies and to discourage coercive takeover practices and inadequate takeover bids. These provisions are also designed to reduce our vulnerability to hostile takeovers and to discourage certain tactics that may be used in proxy fights. However, such provisions could have the effect of discouraging others from making tender offers for our shares and may have the effect of delaying changes in our control or management. As a consequence, these provisions may also inhibit fluctuations in the market price of our stock.
Section 203 of the Delaware General Corporation Law
We are subject to Section 203 of the Delaware General Corporation Law, which prohibits a Delaware corporation from engaging in any business combination with any interested stockholder for a period of three years after the date that such stockholder became an interested stockholder, with the following exceptions:
| • | before such date, the board of directors of the corporation approved either the business combination or the transaction that resulted in the stockholder becoming an interested stockholder; |
| • | upon closing of the transaction that resulted in the stockholder becoming an interested stockholder, the interested stockholder owned at least 85% of the voting stock of the corporation outstanding at the time the transaction began, excluding for purposes of determining the voting stock outstanding (but not the outstanding voting stock owned by the interested stockholder) those shares owned (i) by persons who are directors and also officers and (ii) employee stock plans in which employee participants do not have the right to determine confidentially whether shares held subject to the plan will be tendered in a tender or exchange offer; or |
| • | on or after such date, the business combination is approved by the board of directors and authorized at an annual or special meeting of the stockholders, and not by written consent, by the affirmative vote of at least 66 2/3% of the outstanding voting stock that is not owned by the interested stockholder. |
In general, Section 203 defines business combination to include the following:
| • | any merger or consolidation involving the corporation and the interested stockholder; |
| • | any sale, transfer, pledge or other disposition of 10% or more of the assets of the corporation involving the interested stockholder; |
| • | subject to certain exceptions, any transaction that results in the issuance or transfer by the corporation of any stock of the corporation to the interested stockholder; |
| • | any transaction involving the corporation that has the effect of increasing the proportionate share of the stock or any class or series of the corporation beneficially owned by the interested stockholder; or |
| • | the receipt by the interested stockholder of the benefit of any loss, advances, guarantees, pledges or other financial benefits by or through the corporation. |
108
Table of Contents
In general, Section 203 defines an “interested stockholder” as an entity or person who, together with the person’s affiliates and associates, beneficially owns, or within three years prior to the time of determination of interested stockholder status did own, 15% or more of the outstanding voting stock of the corporation.
Choice of Forum
Our amended and restated certificate of incorporation will provide that the Court of Chancery of the State of Delaware will be the exclusive forum for any derivative action or proceeding brought on our behalf; any action asserting a breach of fiduciary duty; any action asserting a claim against us arising pursuant to the Delaware General Corporation Law, our amended and restated certificate of incorporation or our amended and restated bylaws; or any action asserting a claim against us that is governed by the internal affairs doctrine. The enforceability of similar choice of forum provisions in other companies’ certificates of incorporation has been challenged in legal proceedings, and it is possible that, in connection with one or more actions or proceedings described above, a court could find the choice of forum provisions contained in our amended and restated certificate of incorporation to be inapplicable or unenforceable.
Limitations of Liability and Indemnification
See the section titled “Executive Compensation—Limitation on Liability and Indemnification.”
Transfer Agent and Registrar
Upon the closing of this offering, the transfer agent and registrar for our Class A and Class B common stock will be American Stock Transfer & Trust Company, LLC. The transfer agent’s address is 6201 15th Avenue, Brooklyn, New York 11219, and its telephone number is (800) 937-5449.
Exchange Listing
Our Class A common stock has been approved for listing on the NYSE under the trading symbol “PSTG.”
109
Table of Contents
SHARES ELIGIBLE FOR FUTURE SALE
Prior to this offering, no public market for our Class A common stock existed, and a liquid trading market for our Class A common stock may not develop or be sustained after this offering. Future sales of substantial amounts of our Class A common stock in the public market could adversely affect prevailing market prices of our Class A common stock from time to time and could impair our future ability to raise equity capital in the future. Furthermore, because only a limited number of shares of our Class A common stock will be available for sale shortly after this offering due to certain contractual and legal restrictions on resale described below, sales of substantial amounts of our Class A common stock in the public market after such restrictions lapse, or the anticipation of such sales, could adversely affect the prevailing market price of our Class A common stock and our ability to raise equity capital in the future.
Based upon the number of shares outstanding as of July 31, 2015, upon the closing of this offering, we will have outstanding an aggregate of shares of Class A common stock and 160,056,764 shares of Class B common stock, assuming no exercise of the underwriters’ over-allotment option and no exercise of outstanding options, after giving effect to the conversion of all outstanding shares of our preferred stock into 122,280,679 shares of Class B common stock immediately prior to the closing of this offering. All of the shares sold in this offering by us will be freely tradable without restrictions or further registration under the Securities Act, unless held by our affiliates, as that term is defined under Rule 144 under the Securities Act, or subject to lock-up agreements. The remaining shares of Class B common stock outstanding upon the closing of this offering are restricted securities as defined in Rule 144. Restricted securities may be sold in the U.S. public market only if registered or if they qualify for an exemption from registration, including by reason of Rule 144 or Rule 701 under the Securities Act, which rules are summarized below. These remaining shares will generally become available for sale in the public market as follows:
| • | no shares will be eligible for sale in the public market on the date of this prospectus; and |
| • | approximately shares will be eligible for sale in the public market upon expiration of lock-up agreements 181 days after the date of this prospectus, subject in certain circumstances to the volume, manner of sale and other limitations of Rule 144 and Rule 701. |
As of July 31, 2015, of the 59,928,620 shares of Class B common stock issuable upon exercise of options outstanding, approximately 33,766,022 shares will be vested and eligible for sale 181 days after the date of this prospectus.
We may issue shares of common stock from time to time as consideration for future acquisitions, investments or other corporate purposes. In the event that any such acquisition, investment or other transaction is significant, the number of shares of common stock that we may issue may in turn be significant. We may also grant registration rights covering those shares of common stock issued in connection with any such acquisition and investment.
In addition, the shares of Class A common stock reserved for future issuance under our 2015 Plan will become eligible for sale in the public market to the extent permitted by the provisions of various vesting schedules, the lock-up agreements, a registration statement under the Securities Act or an exemption from registration, including Rule 144 and Rule 701.
Rule 144
In general, persons who have beneficially owned restricted shares of our common stock for at least six months, and any affiliate of the company who owns either restricted or unrestricted shares of our common stock, are entitled to sell their securities without registration with the SEC under an exemption from registration provided by Rule 144 under the Securities Act.
110
Table of Contents
In general, a person who has beneficially owned restricted shares of our common stock for at least six months would be entitled to sell their securities provided that (1) such person is not deemed to have been one of our affiliates at the time of, or at any time during the 90 days preceding, a sale, (2) we have been subject to the Exchange Act periodic reporting requirements for at least 90 days before the sale and (3) we are current in our Exchange Act reporting at the time of sale.
Persons who have beneficially owned restricted shares of our common stock for at least six months, but who are our affiliates at the time of, or any time during the 90 days preceding, a sale, would be subject to additional restrictions, by which such person would be entitled to sell within any three-month period only a number of securities that does not exceed the greater of either of the following:
| • | 1% of the number of shares of our Class A common stock then outstanding, which will equal approximately shares immediately after the closing of this offering based on the number of common shares outstanding as of July 31, 2015. |
| • | the average weekly trading volume of our Class A common stock on the NYSE during the four calendar weeks preceding the filing of a notice on Form 144 with respect to the sale. |
Such sales by affiliates must also comply with the manner of sale, current public information and notice provisions of Rule 144.
Rule 701
In general, under Rule 701, a person who purchased shares of our common stock pursuant to a written compensatory plan or contract and who is not deemed to have been one of our affiliates during the immediately preceding 90 days may sell these shares in reliance upon Rule 144, but without being required to comply with the notice, manner of sale, public information requirements or volume limitation provisions of Rule 144. Rule 701 also permits affiliates to sell their Rule 701 shares under Rule 144 without complying with the holding period requirements of Rule 144. All holders of Rule 701 shares, however, are required to wait until 90 days after the date of this prospectus before selling such shares pursuant to Rule 701. As of July 31, 2015, 12,758,171 shares of our outstanding Class B common stock had been issued in reliance on Rule 701 as a result of exercises of stock options and issuance of restricted stock. However, substantially all Rule 701 shares are subject to lock-up agreements as described below and will become eligible for sale upon the expiration of the restrictions set forth in those agreements.
Form S-8 Registration Statements
We intend to file with the SEC one or more registration statements on Form S-8 under the Securities Act to register the offer and sale of shares of our common stock that are issuable pursuant to our 2009 Plan and 2015 Plan. These registration statements will become effective immediately upon filing. Shares covered by these registration statements will then be eligible for sale in the public markets, subject to vesting restrictions, any applicable lock-up agreements described below and Rule 144 limitations applicable to affiliates.
Lock-Up Arrangements
We, and all of our directors and executive officers and the holders of substantially all of our common stock and securities exercisable for or convertible into our Class A and Class B common stock outstanding immediately upon the closing of this offering, have agreed with the underwriters that, for a period of 180 days following the date of this prospectus, subject to certain exceptions, we and they will not, directly or indirectly, offer, sell, contract to sell, pledge, grant any option to purchase, make any short sale, or otherwise dispose of or hedge any of our shares of common stock, any options, or any securities convertible into, or exchangeable for or that represent the right to receive shares of our common stock. These agreements are described in the section of this prospectus titled “Underwriting.”
111
Table of Contents
In addition to the restrictions contained in the lock-up agreements described above, we have entered into agreements with certain security holders, including the investor rights agreement and our standard form of option agreement, that contain market stand-off provisions imposing restrictions on the ability of such security holders to offer, sell or transfer our equity securities for a period of 180 days following the date of this prospectus.
Registration Rights
Upon the closing of this offering, the holders of 120,886,513 shares of our Class B common stock issuable upon conversion of outstanding preferred stock, or their transferees, will be entitled to certain rights with respect to the registration of the offer and sale of their shares under the Securities Act. Registration of these shares under the Securities Act would result in the shares becoming freely tradable without restriction under the Securities Act immediately upon the effectiveness of the registration. See the section titled “Description of Capital Stock—Registration Rights” for additional information.
112
Table of Contents
MATERIAL UNITED STATES FEDERAL INCOME TAX CONSEQUENCES TO NON-U.S. HOLDERS OF OUR CLASS A COMMON STOCK
The following discussion describes the material U.S. federal income and estate tax consequences of the acquisition, ownership and disposition of our Class A common stock acquired in this offering by Non-U.S. Holders (as defined below). This discussion does not address all aspects of U.S. federal income and estate taxes, does not discuss the potential application of the alternative minimum or Medicare Contribution tax, and does not deal with state, local or non-U.S. tax consequences that may be relevant to Non-U.S. Holders in light of their particular circumstances, nor does it address U.S. federal tax consequences other than income and estate taxes. Rules different from those described below may apply to certain Non-U.S. Holders that are subject to special treatment under the Internal Revenue Code of 1986, as amended (the “Code”), such as financial institutions, insurance companies, tax-exempt organizations, “foreign governments,” international organizations, broker-dealers and traders in securities, U.S. expatriates, “controlled foreign corporations,” “passive foreign investment companies,” corporations that accumulate earnings to avoid U.S. federal income tax, persons that hold our Class A common stock as part of a “straddle,” “conversion transaction,” or other risk reduction strategy, partnerships and other pass-through entities, and investors in such partnerships or pass-through entities (regardless of their places of organization or formation). Such Non-U.S. Holders are urged to consult their own tax advisors to determine the U.S. federal, state, local and other tax consequences that may be relevant to them. Furthermore, the discussion below is based upon the provisions of the Code, and Treasury regulations, rulings and judicial decisions thereunder as of the date hereof, and such authorities may be repealed, revoked or modified, perhaps retroactively, so as to result in U.S. federal income or estate tax consequences different from those discussed below. We have not requested a ruling from the IRS with respect to the statements made and the conclusions reached in the following summary. This discussion assumes that the Non-U.S. Holder holds our Class A common stock as a “capital asset” within the meaning of Section 1221 of the Code (generally, property held for investment).
Persons considering the purchase of our Class A common stock pursuant to this offering should consult their own tax advisors concerning the U.S. federal income and estate tax consequences of acquiring, owning and disposing of our Class A common stock in light of their particular situations as well as any consequences arising under the laws of any other taxing jurisdiction, including any state, local and non-U.S. tax consequences and any U.S. federal non-income tax consequences.
For the purposes of this discussion, a “Non-U.S. Holder” is, for U.S. federal income tax purposes, a beneficial owner of Class A common stock that is not a U.S. Holder. A “U.S. Holder” means a beneficial owner of our Class A common stock that is for U.S. federal income tax purposes (a) an individual who is a citizen or resident of the United States, (b) a corporation or other entity treated as a corporation created or organized in or under the laws of the United States, any state thereof or the District of Columbia, (c) an estate the income of which is subject to U.S. federal income taxation regardless of its source or (d) a trust if it (1) is subject to the primary supervision of a court within the United States and one or more U.S. persons have the authority to control all substantial decisions of the trust or (2) has a valid election in effect under applicable U.S. Treasury regulations to be treated as a U.S. person. Also, partnerships, or other entities that are treated as partnerships for U.S. federal income tax purposes (regardless of their place of organization or formation) and entities that are treated as disregarded entities for U.S. federal income tax purposes (regardless of their place of organization or formation) are not addressed by this discussion and are, therefore, not considered to be Non-U.S. Holders for the purposes of this discussion.
Distributions
Subject to the discussion below, distributions, if any, made on our Class A common stock to a Non-U.S. Holder generally will constitute dividends for U.S. federal income tax purposes to the extent made out of our current or accumulated earnings and profits (as determined under U.S. federal income tax principles) and generally will be subject to withholding tax at a 30% rate or such lower rate as may be specified by an applicable
113
Table of Contents
income tax treaty. To obtain a reduced rate of withholding under a treaty, a Non-U.S. Holder generally will be required to provide us with a properly executed Internal Revenue Service (“IRS”) Form W-8BEN, W-BEN-E or other appropriate form, certifying the Non-U.S. Holder’s entitlement to benefits under that treaty. In the case of a Non-U.S. Holder that is an entity, Treasury Regulations and the relevant tax treaty provide rules to determine whether, for purposes of determining the applicability of that treaty, dividends will be treated as paid to the entity or to those holding an interest in that entity. If a Non-U.S. Holder holds stock through a financial institution or other agent acting on the holder’s behalf, the holder will be required to provide appropriate documentation to such agent. The holder’s agent may then be required to provide certification to the applicable withholding agent, either directly or through other intermediaries. If you are eligible for a reduced rate of U.S. federal withholding tax under an income tax treaty, you should consult with your own tax advisor to determine if you are able to obtain a refund or credit of any excess amounts withheld by timely filing an appropriate claim for a refund with the IRS.
Withholding tax is generally not imposed on dividends paid to a Non-U.S. Holder that are effectively connected with the Non-U.S. Holder’s conduct of a trade or business within the United States (and, if required by an applicable income tax treaty, are attributable to a permanent establishment that such holder maintains in the United States) if a properly executed IRS Form W-8ECI, stating that the dividends are so connected, is furnished to the applicable withholding agent. In general, such effectively connected dividends will be subject to U.S. federal income tax, on a net income basis at the regular graduated rates. A Non-U.S. Holder that is a corporation for U.S. federal income tax purposes that receives effectively connected dividends may also be subject to an additional “branch profits tax,” which is imposed, under certain circumstances, at a rate of 30% (or such lower rate as may be specified by an applicable tax treaty) on the corporate Non-U.S. Holder’s effectively connected earnings and profits, subject to certain adjustments.
To the extent distributions on our Class A common stock, if any, exceed our current and accumulated earnings and profits, they will first reduce your adjusted basis in our Class A common stock as a non-taxable return of capital, but not below zero, and then any excess will be treated as gain and taxed in the same manner as gain realized from a sale or other disposition of Class A common stock as described in the next section.
Gain on Disposition of Our Class A Common Stock
Subject to the discussions below regarding backup withholding and foreign accounts, a Non-U.S. Holder generally will not be subject to U.S. federal income tax with respect to gain realized on a sale or other taxable disposition of our Class A common stock unless (a) the gain is effectively connected with a trade or business of such holder in the United States (and, if required by an applicable income tax treaty, is attributable to a permanent establishment that such holder maintains in the United States), (b) the Non-U.S. Holder is a nonresident alien individual and is present in the United States for 183 or more days in the taxable year of the disposition and certain other conditions are met, or (c) we are or have been a “United States real property holding corporation” within the meaning of Section 897(c)(2) of the Code at any time within the shorter of the five-year period preceding such disposition or such holder’s holding period.
If you are a Non-U.S. Holder described in (a) above, you generally will be required to pay tax on the net gain derived from the sale at regular graduated U.S. federal income tax rates and corporate Non-U.S. Holders described in (a) above may be subject to the additional branch profits tax at a 30% rate or such lower rate as may be specified by an applicable income tax treaty. If you are an individual Non-U.S. Holder described in (b) above, you will be required to pay a flat 30% tax on the gain derived from the sale, which gain may be offset by certain U.S. source capital losses (even though you are not considered a resident of the United States). With respect to (c) above, in general, we would be a United States real property holding corporation if interests in U.S. real estate constituted (by fair market value) at least half of our total worldwide real property interests plus business assets. We believe that we are not, and do not anticipate becoming, a United States real property holding corporation; however, there can be no assurance that we will not become a United States real property holding corporation in the future. Even if we are treated as a United States real property holding corporation, such treatment will not
114
Table of Contents
cause gain realized by a Non-U.S. Holder on a disposition of our Class A common stock to be subject to U.S. federal income tax so long as (1) the Non-U.S. Holder owned, directly, indirectly and constructively, no more than 5% of our Class A common stock at all times within the shorter of (i) the five-year period preceding the disposition or (ii) the holder’s holding period and (2) our Class A common stock is regularly traded on an established securities market. There can be no assurance that our Class A common stock will continue to qualify as regularly traded on an established securities market.
Information Reporting Requirements and Backup Withholding
Generally, we or certain financial intermediaries must report information to the IRS with respect to any dividends we pay on our Class A common stock including the amount of any such dividends, the name and address of the recipient, and the amount, if any, of tax withheld. A similar report is sent to the holder to whom any such dividends are paid. Pursuant to tax treaties or certain other agreements, the IRS may make its reports available to tax authorities in the recipient’s country of residence.
Dividends paid by us (or certain financial intermediaries ) to a Non-U.S. Holder may also be subject to U.S. backup withholding. U.S. backup withholding generally will not apply to a Non-U.S. Holder who provides a properly executed appropriate IRS Form W-8 or otherwise establishes an exemption.
Under current U.S. federal income tax law, U.S. information reporting and backup withholding requirements generally will apply to the proceeds of a disposition of our Class A common stock effected by or through a U.S. office of any broker, U.S. or non-U.S., unless the holder provides a properly executed IRS Form W-8BEN or W-8BEN-E, as applicable, or otherwise establishes an exemption. Generally, U.S. information reporting and backup withholding requirements will not apply to a payment of disposition proceeds to a Non-U.S. Holder where the transaction is considered effected outside the United States through a non-U.S. office of a non-U.S. broker. Information reporting and backup withholding requirements may, however, apply to a payment of disposition proceeds if the broker has actual knowledge, or reason to know, that the holder is, in fact, a U.S. person. For information reporting purposes, certain brokers with substantial U.S. ownership or operations will generally be treated in a manner similar to U.S. brokers.
Amounts withheld under the backup withholding rules are not additional taxes and may be refunded or credited against your U.S. federal income tax liability, provided the required information is timely furnished to the IRS. If backup withholding is applied to you, you should consult with your own tax advisor to determine if you are able to obtain a tax refund or credit with respect to the amount withheld.
Foreign Accounts
A U.S. federal withholding tax of 30% may apply to dividends and, for any disposition occurring on or after January 1, 2017, the gross proceeds of a disposition of our Class A common stock paid to a foreign financial institution (as specifically defined by applicable rules), including when the foreign financial institution holds our Class A common stock on behalf of a Non-U.S. Holder, unless such institution enters into an agreement with the U.S. government to withhold on certain payments and to collect and provide to the U.S. tax authorities substantial information regarding U.S. account holders of such institution (which includes certain equity holders of such institution, as well as certain account holders that are foreign entities with U.S. owners). This U.S. federal withholding tax of 30% will also apply to dividends and, for any disposition occurring on or after January 1, 2017, the gross proceeds of a disposition of our Class A common stock paid to a non-financial foreign entity unless such entity provides the withholding agent with either a certification that it does not have any substantial direct or indirect U.S. owners or provides information regarding direct and indirect U.S. owners of the entity. The withholding tax described above will not apply if the foreign financial institution or non-financial foreign entity otherwise qualifies for an exemption from the rules. An intergovernmental agreement between the United States and an applicable foreign country may modify these requirements. Under certain circumstances, a Non-U.S. Holder might be eligible for refunds or credits of such taxes. Holders are encouraged to consult with their own tax advisors regarding the possible implications of this withholding tax on their investment in our Class A common stock.
115
Table of Contents
Federal Estate Tax
An individual who at the time of death is not a citizen or resident of the United States and who is treated as the owner of, or has made certain lifetime transfers of, an interest in our Class A common stock will be required to include the value thereof in his or her taxable estate for U.S. federal estate tax purposes, and may be subject to U.S. federal estate tax unless an applicable estate tax treaty provides otherwise. The test for whether an individual is a resident of the United States for federal estate tax purposes differs from the test used for U.S. federal income tax purposes. Some individuals, therefore, may be “Non-U.S. Holders” for U.S. federal income tax purposes, but not for U.S. federal estate tax purposes, and vice versa.
EACH PROSPECTIVE INVESTOR SHOULD CONSULT HIS, HER OR ITS OWN TAX ADVISOR REGARDING THE TAX CONSEQUENCES OF PURCHASING, HOLDING AND DISPOSING OF OUR CLASS A COMMON STOCK, INCLUDING THE CONSEQUENCES OF ANY PROPOSED CHANGE IN APPLICABLE LAW, AS WELL AS TAX CONSEQUENCES ARISING UNDER ANY STATE, LOCAL, NON-U.S. OR U.S. FEDERAL NON-INCOME TAX LAWS.
116
Table of Contents
Under the terms and subject to the conditions in an underwriting agreement dated the date of this prospectus, the underwriters named below, for whom Morgan Stanley & Co. LLC and Goldman, Sachs & Co. are acting as representatives, have severally agreed to purchase, and we have agreed to sell to them, severally, the number of shares of our Class A common stock indicated below:
| Name |
Number of Shares | |
| Morgan Stanley & Co. LLC |
||
| Goldman, Sachs & Co. |
||
| Barclays Capital Inc. |
||
| Allen & Company LLC |
||
| Merrill Lynch, Pierce, Fenner & Smith Incorporated |
||
| Pacific Crest Securities, a division of KeyBanc Capital Markets Inc. |
||
| Stifel, Nicolaus & Company, Incorporated |
||
| Raymond James & Associates, Inc. |
||
| Evercore Group L.L.C. |
||
|
| ||
|
Total |
||
|
|
The underwriters and the representatives are collectively referred to as the “underwriters” and the “representatives,” respectively. The underwriters are offering the shares of Class A common stock subject to their acceptance of the shares from us and subject to prior sale. The underwriting agreement provides that the obligations of the several underwriters to pay for and accept delivery of the shares of Class A common stock offered by this prospectus are subject to the approval of certain legal matters by their counsel and to certain other conditions. The underwriters are obligated to take and pay for all of the shares of Class A common stock offered by this prospectus if any such shares are taken. However, the underwriters are not required to take or pay for the shares covered by the underwriters’ over-allotment option described below.
The underwriters initially propose to offer part of the shares of Class A common stock directly to the public at the offering price listed on the cover page of this prospectus and part to certain dealers. After the initial offering of the shares of Class A common stock, the offering price and other selling terms may from time to time be varied by the representatives. Sales of Class A common stock made outside of the United States may be made by affiliates of the underwriters.
We have granted to the underwriters an option, exercisable for 30 days from the date of this prospectus, to purchase up to additional shares of Class A common stock at the public offering price listed on the cover page of this prospectus, less underwriting discounts and commissions. The underwriters may exercise this option solely for the purpose of covering over-allotments, if any, made in connection with the offering of the shares of Class A common stock offered by this prospectus. To the extent the option is exercised, each underwriter will become obligated, subject to certain conditions, to purchase about the same percentage of the additional shares of Class A common stock as the number listed next to the underwriter’s name in the preceding table bears to the total number of shares of Class A common stock listed next to the names of all underwriters in the preceding table.
117
Table of Contents
The following table shows the per share and total public offering price, underwriting discounts and commissions, and proceeds before expenses to us. These amounts are shown assuming both no exercise and full exercise of the underwriters’ option to purchase up to an additional shares of our Class A common stock.
| Total | ||||||||||||
| Per Share |
No Exercise |
Full Exercise |
||||||||||
| Public offering price |
$ | $ | $ | |||||||||
| Underwriting discounts and commissions to be paid by us |
$ | $ | $ | |||||||||
| Proceeds, before expenses, to us |
$ | $ | $ | |||||||||
The estimated offering expenses payable by us, exclusive of the underwriting discounts and commissions, are approximately $ . We have agreed to reimburse the underwriters for expense relating to clearance of this offering with the Financial Industry Regulatory Authority up to $35,000.
The underwriters have informed us that they do not intend sales to discretionary accounts to exceed 5% of the total number of shares of our Class A common stock offered by them.
Our Class A common stock has been approved for listing on the NYSE under the trading symbol “PSTG.”
We and all of our directors and officers and the holders of substantially all of our outstanding stock and stock options have agreed that, without the prior written consent of the representatives on behalf of the underwriters, we and they will not, during the period ending 180 days after the date of this prospectus (the “restricted period”):
| • | offer, pledge, sell, contract to sell, sell any option or contract to purchase, purchase any option or contract to sell, grant any option, right or warrant to purchase, lend or otherwise transfer or dispose of, directly or indirectly, any shares of common stock or any securities convertible into or exercisable or exchangeable for shares of common stock; |
| • | file any registration statement with the Securities and Exchange Commission relating to the offering of any shares of common stock or any securities convertible into or exercisable or exchangeable for common stock; or |
| • | enter into any swap or other arrangement that transfers to another, in whole or in part, any of the economic consequences of ownership of the common stock |
whether any such transaction described above is to be settled by delivery of common stock or such other securities, in cash or otherwise. In addition, we and each such person agrees that, without the prior written consent of the representatives on behalf of the underwriters, we or such other person will not, during the restricted period, make any demand for, or exercise any right with respect to, the registration of any shares of common stock or any security convertible into or exercisable or exchangeable for common stock.
Subject to limited exceptions, the restrictions described in the immediately preceding paragraph do not apply to:
| (1) | transactions relating to shares of our common stock or other securities acquired in this offering or in open market transactions after the completion of this offering; |
| (2) | transfers of shares of our common stock or any security convertible into our common stock as a bona fide gift or charitable contribution; |
| (3) | transfers of shares of our common stock or any security convertible into our common stock to an immediate family member or a trust for the direct or indirect benefit of the party subject to the lock-up agreement or such immediate family member of the party subject to the lock-up agreement (for purposes of the lock-up agreement, “immediate family” shall mean any relationship by blood, marriage or adoption, not more remote than first cousin); |
118
Table of Contents
| (4) | transfers of shares of our common stock or any security convertible into our common stock by will or intestacy; |
| (5) | transfers of shares of our common stock or any security convertible into our common stock pursuant to a domestic relations order, divorce decree or court order; |
| (6) | distributions of shares of our common stock or any security convertible into our common stock to limited partners, members, stockholders or holders of similar equity interests in the party subject to the lock-up agreement; |
| (7) | transfers or distributions of shares of our common stock or any securities convertible into or exercisable or exchangeable for our common stock by a stockholder that is a trust to a trustor or beneficiary of the trust or to the estate of a beneficiary of such trust; |
| (8) | transfers to us in connection with the repurchase of our common stock in connection with the termination of the employment with us of the party subject to the lock-up agreement pursuant to contractual agreements with us; |
| (9) | the disposition of shares of our common stock to us, or the withholding of shares of our common stock by us, in a transaction exempt from Section 16(b) of the Exchange Act solely in connection with the payment of taxes due with respect to the vesting of restricted stock granted under a stock incentive plan, stock purchase plan or pursuant to a contractual employment arrangement described in this prospectus, insofar as such restricted stock is outstanding as of the date of this prospectus; |
| (10) | the exercise of a stock option granted under a stock incentive plan or stock purchase plan described in this prospectus by the party subject to the lock-up agreement, and the receipt by the party subject to the lock-up agreement of shares of our common stock from us upon such exercise, insofar as such option is outstanding as of the date of this prospectus, provided that the underlying shares shall continue to be subject to the restrictions on transfer set forth in the lock-up agreement and, provided, further that, if required, any public report or filing under Section 16 of the Exchange Act shall clearly indicate in the footnotes thereto that the filing relates to the exercise of a stock option, that no shares were sold by the reporting person and that the shares received upon exercise of the stock option are subject to a lock-up agreement with the underwriters of this offering; |
| (11) | a merger, consolidation or other similar transaction involving a change of control that has been approved by our board of directors, provided that, in the event that such change of control transaction is not completed, this clause (11) shall not be applicable and the shares of the party subject to the lock-up agreement shall remain subject to the restrictions contained in the lock-up agreement; |
| (12) | the establishment of a trading plan pursuant to Rule 10b5-1 under the Exchange Act for the transfer of shares of our common stock provided that (i) such plan does not provide for the transfer of our common stock during the restricted period and (ii) to the extent a public announcement or filing under the Exchange Act, if any, is required of or voluntarily made by or on behalf of the party subject to the lock-up agreement or us regarding the establishment of such plan, such announcement or filing shall include a statement to the effect that no transfer of our common stock may be made under such plan during the restricted period; |
provided, that, in the case of clauses (2), (3), (4), (5), (6) or (7) above each transferee, donee or distributee shall sign and deliver a lock-up agreement; and, provided, further that in the case of clauses (1), (2), (3), (4), (5), (6), (7), (8) or (9) above no filing under Section 16(a) of the Exchange Act, reporting a reduction in beneficial ownership of shares of our common stock, shall be required or shall be voluntarily made during the restricted period.
119
Table of Contents
The representatives, in their sole discretion, may release the common stock and other securities subject to the lock-up agreements described above in whole or in part at any time.
In order to facilitate the offering of the Class A common stock, the underwriters may engage in transactions that stabilize, maintain or otherwise affect the price of the Class A common stock. Specifically, the underwriters may sell more shares than they are obligated to purchase under the underwriting agreement, creating a short position. A short sale is covered if the short position is no greater than the number of shares available for purchase by the underwriters under the over-allotment option. The underwriters can close out a covered short sale by exercising the over-allotment option or purchasing shares in the open market. In determining the source of shares to close out a covered short sale, the underwriters will consider, among other things, the open market price of shares compared to the price available under the over-allotment option. The underwriters may also sell shares in excess of the over-allotment option, creating a naked short position. The underwriters must close out any naked short position by purchasing shares in the open market. A naked short position is more likely to be created if the underwriters are concerned that there may be downward pressure on the price of the Class A common stock in the open market after pricing that could adversely affect investors who purchase in this offering. As an additional means of facilitating this offering, the underwriters may bid for, and purchase, shares of Class A common stock in the open market to stabilize the price of the Class A common stock. These activities may raise or maintain the market price of the Class A common stock above independent market levels or prevent or retard a decline in the market price of the Class A common stock. The underwriters are not required to engage in these activities and may end any of these activities at any time.
We and the underwriters have agreed to indemnify each other against certain liabilities, including liabilities under the Securities Act.
A prospectus in electronic format may be made available on websites maintained by one or more underwriters, or selling group members, if any, participating in this offering. The representatives may agree to allocate a number of shares of Class A common stock to underwriters for sale to their online brokerage account holders. Internet distributions will be allocated by the representatives to underwriters that may make Internet distributions on the same basis as other allocations.
Other Relationships
The underwriters and their respective affiliates are full service financial institutions engaged in various activities, which may include securities trading, commercial and investment banking, financial advisory, investment management, investment research, principal investment, hedging, financing and brokerage activities. Certain of the underwriters and their respective affiliates have, from time to time, performed, and may in the future perform, various financial advisory and investment banking services for us, for which they received or will receive customary fees and expenses.
In addition, in the ordinary course of their various business activities, the underwriters and their respective affiliates may make or hold a broad array of investments and actively trade debt and equity securities (or related derivative securities) and financial instruments (including bank loans) for their own account and for the accounts of their customers and may at any time hold long and short positions in such securities and instruments. Such investment and securities activities may involve our securities and instruments. The underwriters and their respective affiliates may also make investment recommendations or publish or express independent research views in respect of such securities or instruments and may at any time hold, or recommend to clients that they acquire, long or short positions in such securities and instruments.
Pricing of the Offering
Prior to this offering, there has been no public market for our Class A common stock. The initial public offering price will be determined by negotiations between us and the representatives. Among the factors to be considered in determining the initial public offering price will be our future prospects and those of our industry in
120
Table of Contents
general, our sales, earnings and certain other financial and operating information in recent periods, and the price-earnings ratios, price-sales ratios, market prices of securities and certain financial and operating information of companies engaged in activities similar to ours.
Selling Restrictions
European Economic Area
In relation to each Member State of the European Economic Area which has implemented the Prospectus Directive (each, a “Relevant Member State”) an offer to the public of any shares of our Class A common stock may not be made in that Relevant Member State, except that an offer to the public in that Relevant Member State of any shares of our Class A common stock may be made at any time under the following exemptions under the Prospectus Directive, if they have been implemented in that Relevant Member State:
| • | to any legal entity which is a qualified investor as defined in the Prospectus Directive; |
| • | to fewer than 100 or, if the Relevant Member State has implemented the relevant provision of the 2010 PD Amending Directive, 150, natural or legal persons (other than qualified investors as defined in the Prospectus Directive), as permitted under the Prospectus Directive, subject to obtaining the prior consent of the representatives for any such offer; or |
| • | in any other circumstances falling within Article 3(2) of the Prospectus Directive, provided that no such offer of shares of our Class A common stock shall result in a requirement for the publication by us or any underwriter of a prospectus pursuant to Article 3 of the Prospectus Directive. |
For the purposes of this provision, the expression an “offer to the public” in relation to any shares of our Class A common stock in any Relevant Member State means the communication in any form and by any means of sufficient information on the terms of the offer and any shares of our Class A common stock to be offered so as to enable an investor to decide to purchase any shares of our Class A common stock, as the same may be varied in that Member State by any measure implementing the Prospectus Directive in that Member State, the expression “Prospectus Directive” means Directive 2003/71/EC (and amendments thereto, including the 2010 PD Amending Directive, to the extent implemented in the Relevant Member State), and includes any relevant implementing measure in the Relevant Member State, and the expression “2010 PD Amending Directive” means Directive 2010/73/EU.
United Kingdom
Each underwriter has represented and agreed that:
| • | it has only communicated or caused to be communicated and will only communicate or cause to be communicated an invitation or inducement to engage in investment activity (within the meaning of Section 21 of the Financial Services and Markets Act 2000 (“FSMA”) received by it in connection with the issue or sale of the shares of our Class A common stock in circumstances in which Section 21(1) of the FSMA does not apply to us; and |
| • | it has complied and will comply with all applicable provisions of the FSMA with respect to anything done by it in relation to the shares of our Class A common stock in, from or otherwise involving the United Kingdom. |
Hong Kong
Each underwriter has represented and agreed that:
| • | it has not offered or sold and will not offer or sell in Hong Kong, by means of any document, any of our Class A common stock other than (i) to “professional investors” as defined in the Securities and Futures Ordinance (Cap. 571) of Hong Kong and any rules made under that Ordinance; or (ii) in other |
121
Table of Contents
| circumstances which do not result in the document being a “prospectus” as defined in the Companies Ordinance (Cap. 32) of Hong Kong or which do not constitute an offer to the public within the meaning of that Ordinance; and |
| • | it has not issued or had in its possession for the purposes of issue, and will not issue or have in its possession for the purposes of issue, whether in Hong Kong or elsewhere, any advertisement, invitation or document relating to our Class A common stock, which is directed at, or the contents of which are likely to be accessed or read by, the public of Hong Kong (except if permitted to do so under the securities laws of Hong Kong) other than with respect to shares of our Class A common stock which are or are intended to be disposed of only to persons outside Hong Kong or only to “professional investors” as defined in the Securities and Futures Ordinance and any rules made under that Ordinance. |
Singapore
This prospectus has not been registered as a prospectus with the Monetary Authority of Singapore. Accordingly, this prospectus and any other document or material in connection with the offer or sale, or invitation for subscription or purchase, of the shares may not be circulated or distributed, nor may the shares be offered or sold, or be made the subject of an invitation for subscription or purchase, whether directly or indirectly, to persons in Singapore other than (i) to an institutional investor under Section 274 of the Securities and Futures Act, Chapter 289 of Singapore (the “SFA”), (ii) to a relevant person pursuant to Section 275(1), or any person pursuant to Section 275(1A), and in accordance with the conditions specified in Section 275 of the SFA or (iii) otherwise pursuant to, and in accordance with the conditions of, any other applicable provision of the SFA, in each case subject to compliance with conditions set forth in the SFA.
Where the shares are subscribed or purchased under Section 275 of the SFA by a relevant person which is:
| • | a corporation (which is not an accredited investor (as defined in Section 4A of the SFA)) the sole business of which is to hold investments and the entire share capital of which is owned by one or more individuals, each of whom is an accredited investor; or |
| • | a trust (where the trustee is not an accredited investor) whose sole purpose is to hold investments and each beneficiary of the trust is an individual who is an accredited investor, |
| • | shares, debentures and units of shares and debentures of that corporation or the beneficiaries’ rights and interest (howsoever described) in that trust shall not be transferred within six months after that corporation or that trust has acquired the shares pursuant to an offer made under Section 275 of the SFA except: |
| • | to an institutional investor (for corporations, under Section 274 of the SFA) or to a relevant person defined in Section 275(2) of the SFA, or to any person pursuant to an offer that is made on terms that such shares, debentures and units of shares and debentures of that corporation or such rights and interest in that trust are acquired at a consideration of not less than $200,000 (or its equivalent in a foreign currency) for each transaction, whether such amount is to be paid for in cash or by exchange of securities or other assets, and further for corporations, in accordance with the conditions specified in Section 275 of the SFA; |
| • | where no consideration is or will be given for the transfer; or |
| • | where the transfer is by operation of law. |
Japan
No registration pursuant to Article 4, paragraph 1 of the Financial Instruments and Exchange Law of Japan (Law No. 25 of 1948, as amended) (the “FIEL”) has been made or will be made with respect to the solicitation of the application for the acquisition of the shares of Class A common stock.
122
Table of Contents
Accordingly, the shares of Class A common stock have not been, directly or indirectly, offered or sold and will not be, directly or indirectly, offered or sold in Japan or to, or for the benefit of, any resident of Japan (which term as used herein means any person resident in Japan, including any corporation or other entity organized under the laws of Japan) or to others for re-offering or re-sale, directly or indirectly, in Japan or to, or for the benefit of, any resident of Japan except pursuant to an exemption from the registration requirements, and otherwise in compliance with, the FIEL and the other applicable laws and regulations of Japan.
Switzerland
The shares may not be publicly offered in Switzerland and will not be listed on the SIX Swiss Exchange (“SIX”) or on any other stock exchange or regulated trading facility in Switzerland. This document has been prepared without regard to the disclosure standards for issuance prospectuses under art. 652a or art. 1156 of the Swiss Code of Obligations or the disclosure standards for listing prospectuses under art. 27 ff. of the SIX Listing Rules or the listing rules of any other stock exchange or regulated trading facility in Switzerland. Neither this document nor any other offering or marketing material relating to the shares or the offering may be publicly distributed or otherwise made publicly available in Switzerland.
Neither this document nor any other offering or marketing material relating to the offering, the Company, the shares have been or will be filed with or approved by any Swiss regulatory authority. In particular, this document will not be filed with, and the offer of shares will not be supervised by, the Swiss Financial Market Supervisory Authority FINMA (“FINMA”), and the offer of shares has not been and will not be authorized under the Swiss Federal Act on Collective Investment Schemes (“CISA”). The investor protection afforded to acquirers of interests in collective investment schemes under the CISA does not extend to acquirers of shares.
Dubai International Financial Centre
This prospectus relates to an Exempt Offer in accordance with the Offered Securities Rules of the Dubai Financial Services Authority (“DFSA”). This prospectus is intended for distribution only to persons of a type specified in the Offered Securities Rules of the DFSA. It must not be delivered to, or relied on by, any other person. The DFSA has no responsibility for reviewing or verifying any documents in connection with Exempt Offers. The DFSA has not approved this prospectus nor taken steps to verify the information set forth herein and has no responsibility for the prospectus. The shares to which this prospectus relates may be illiquid and/or subject to restrictions on their resale. Prospective purchasers of the shares offered should conduct their own due diligence on the shares. If you do not understand the contents of this prospectus you should consult an authorized financial advisor.
Australia
No placement document, prospectus, product disclosure statement or other disclosure document has been lodged with the Australian Securities and Investments Commission (“ASIC”), in relation to the offering. This prospectus does not constitute a prospectus, product disclosure statement or other disclosure document under the Corporations Act 2001 (the “Corporations Act”), and does not purport to include the information required for a prospectus, product disclosure statement or other disclosure document under the Corporations Act.
Any offer in Australia of the shares may only be made to persons (the “Exempt Investors”) who are “sophisticated investors” (within the meaning of section 708(8) of the Corporations Act), “professional investors” (within the meaning of section 708(11) of the Corporations Act) or otherwise pursuant to one or more exemptions contained in section 708 of the Corporations Act so that it is lawful to offer the shares without disclosure to investors under Chapter 6D of the Corporations Act.
The shares applied for by Exempt Investors in Australia must not be offered for sale in Australia in the period of 12 months after the date of allotment under the offering, except in circumstances where disclosure to
123
Table of Contents
investors under Chapter 6D of the Corporations Act would not be required pursuant to an exemption under section 708 of the Corporations Act or otherwise or where the offer is pursuant to a disclosure document which complies with Chapter 6D of the Corporations Act. Any person acquiring shares must observe such Australian on-sale restrictions.
This prospectus contains general information only and does not take account of the investment objectives, financial situation or particular needs of any particular person. It does not contain any securities recommendations or financial product advice. Before making an investment decision, investors need to consider whether the information in this prospectus is appropriate to their needs, objectives and circumstances, and, if necessary, seek expert advice on those matters.
Canada
The securities may be sold only to purchasers purchasing, or deemed to be purchasing, as principal that are accredited investors, as defined in National Instrument 45-106 Prospectus Exemptions or subsection 73.3(1) of the Securities Act (Ontario), and are permitted clients, as defined in National Instrument 31-103 Registration Requirements, Exemptions and Ongoing Registrant Obligations. Any resale of the securities must be made in accordance with an exemption from, or in a transaction not subject to, the prospectus requirements of applicable securities laws.
Securities legislation in certain provinces or territories of Canada may provide a purchaser with remedies for rescission or damages if this prospectus (including any amendment thereto) contains a misrepresentation, provided that the remedies for rescission or damages are exercised by the purchaser within the time limit prescribed by the securities legislation of the purchaser’s province or territory. The purchaser should refer to any applicable provisions of the securities legislation of the purchaser’s province or territory for particulars of these rights or consult with a legal advisor.
Pursuant to section 3A.3 (or, in the case of securities issued or guaranteed by the government of a non-Canadian jurisdiction, section 3A.4) of National Instrument 33-105 Underwriting Conflicts (“NI 33-105”), the underwriters are not required to comply with the disclosure requirements of NI 33-105 regarding underwriter conflicts of interest in connection with this offering.
124
Table of Contents
The validity of the shares of Class A common stock offered hereby will be passed upon for us by Cooley LLP, Palo Alto, California. As of the date of this prospectus, GC&H Investments, LLC and GC&H Investments, entities comprised of partners and associates of Cooley LLP, beneficially own an aggregate of 550,055 shares of our preferred stock, all of which will be converted into 550,055 shares of Class B common stock upon the closing of this offering. Davis Polk & Wardwell LLP, Menlo Park, California is acting as counsel to the underwriters.
The consolidated financial statements as of January 31, 2014 and 2015, and for each of the two years in the period ended January 31, 2015, included in this prospectus have been audited by Deloitte & Touche LLP, an independent registered public accounting firm, as stated in their report appearing herein. Such consolidated financial statements have been included in reliance upon the report of such firm given upon their authority as experts in accounting and auditing.
WHERE CAN YOU FIND ADDITIONAL INFORMATION
We have filed with the SEC a registration statement on Form S-1 under the Securities Act with respect to the shares of Class A common stock being offered by this prospectus. This prospectus does not contain all of the information in the registration statement and its exhibits. For further information about us and the Class A common stock offered by this prospectus, we refer you to the registration statement and its exhibits. Statements contained in this prospectus as to the contents of any contract or any other document referred to are not necessarily complete, and in each instance, we refer you to the copy of the contract or other document filed as an exhibit to the registration statement. Each of these statements is qualified in all respects by this reference.
You can read our SEC filings, including the registration statement, over the Internet at the SEC’s website at http://www.sec.gov. You may also read and copy any document we file with the SEC at its public reference facilities at 100 F Street, NE, Washington, D.C. 20549. You may also obtain copies of these documents at prescribed rates by writing to the Public Reference Section of the SEC at 100 F Street, NE, Washington, D.C. 20549. Please call the SEC at 1-800-SEC-0330 for further information on the operation of the public reference facilities.
Upon the closing of this offering, we will be subject to the information reporting requirements of the Exchange Act, and we will file reports, proxy statements and other information with the SEC. These reports, proxy statements and other information will be available for inspection and copying at the public reference room and web site of the SEC referred to above. We also maintain a website at www.purestorage.com, at which you may access these materials free of charge as soon as reasonably practicable after they are electronically filed with, or furnished to, the SEC. The information contained on, or that can be accessed through, our website is not a part of this prospectus. Investors should not rely on any such information in deciding whether to purchase our Class A common stock. We have included our website address in this prospectus solely as an inactive textual reference.
125
Table of Contents
INDEX TO CONSOLIDATED FINANCIAL STATEMENTS
| Page | ||||
| F-2 | ||||
| F-3 | ||||
| F-4 | ||||
| Consolidated Statements of Convertible Preferred Stock and Stockholders’ Deficit |
F-5 | |||
| F-6 | ||||
| F-7 | ||||
F-1
Table of Contents
REPORT OF INDEPENDENT REGISTERED PUBLIC ACCOUNTING FIRM
The Board of Directors and Stockholders of
Pure Storage, Inc.
Mountain View, California
We have audited the accompanying consolidated balance sheets of Pure Storage, Inc. and subsidiaries (the “Company”) as of January 31, 2014 and 2015, and the related consolidated statements of operations, convertible preferred stock and stockholders’ deficit, and cash flows for each of the two years in the period ended January 31, 2015. These financial statements are the responsibility of the Company’s management. Our responsibility is to express an opinion on these financial statements based on our audits.
We conducted our audits in accordance with the standards of the Public Company Accounting Oversight Board (United States). Those standards require that we plan and perform the audit to obtain reasonable assurance about whether the financial statements are free of material misstatement. The Company is not required to have, nor were we engaged to perform, an audit of its internal control over financial reporting. Our audits included consideration of internal control over financial reporting as a basis for designing audit procedures that are appropriate in the circumstances, but not for the purpose of expressing an opinion on the effectiveness of the Company’s internal control over financial reporting. Accordingly, we express no such opinion. An audit also includes examining, on a test basis, evidence supporting the amounts and disclosures in the financial statements, assessing the accounting principles used and significant estimates made by management, as well as evaluating the overall financial statement presentation. We believe that our audits provide a reasonable basis for our opinion.
In our opinion, such consolidated financial statements present fairly, in all material respects, the financial position of Pure Storage, Inc. and subsidiaries as of January 31, 2014 and 2015, and the results of their operations and their cash flows for each of the two years in the period ended January 31, 2015, in conformity with accounting principles generally accepted in the United States of America.
/S/ DELOITTE & TOUCHE LLP
San Jose, California
May 15, 2015
F-2
Table of Contents
Consolidated Balance Sheets
(in thousands, except per share data)
|
January 31, |
July 31, 2015 |
Pro Forma Stockholders’ Equity July 31, 2015 |
||||||||||||||
| 2014 | 2015 | |||||||||||||||
| (unaudited) | (unaudited) | |||||||||||||||
| ASSETS |
||||||||||||||||
| Current assets: |
||||||||||||||||
| Cash and cash equivalents |
$ | 130,885 | $ | 192,707 | $ | 128,282 | ||||||||||
| Accounts receivable, net of allowance of $160, $210 and $778 as of January 31, 2014 and 2015 and July 31, 2015 (unaudited) |
14,835 | 59,032 | 80,049 | |||||||||||||
| Inventory |
7,892 | 21,605 | 23,739 | |||||||||||||
| Deferred commissions, current |
4,292 | 9,431 | 11,928 | |||||||||||||
| Prepaid expenses and other current assets |
6,032 | 11,195 | 14,696 | |||||||||||||
|
|
|
|
|
|
|
|||||||||||
| Total current assets |
163,936 | 293,970 | 258,694 | |||||||||||||
| Property and equipment, net |
12,153 | 39,859 | 48,004 | |||||||||||||
| Intangible assets, net |
— | 8,284 | 7,632 | |||||||||||||
| Deferred income taxes, non-current |
2,525 | 5,529 | 4,120 | |||||||||||||
| Other long-term assets |
6,390 | 14,177 | 18,113 | |||||||||||||
|
|
|
|
|
|
|
|||||||||||
| Total assets |
$ | 185,004 | $ | 361,819 | $ | 336,563 | ||||||||||
|
|
|
|
|
|
|
|||||||||||
| LIABILITIES, CONVERTIBLE PREFERRED STOCK, AND STOCKHOLDERS’ (DEFICIT) EQUITY |
||||||||||||||||
| Current liabilities: |
||||||||||||||||
| Accounts payable |
$ | 7,518 | $ | 11,007 | $ | 13,631 | ||||||||||
| Accrued compensation and benefits |
6,782 | 13,811 | 20,344 | |||||||||||||
| Accrued expenses and other liabilities |
1,278 | 6,106 | 12,286 | |||||||||||||
| Deferred revenue, current |
7,933 | 32,199 | 55,070 | |||||||||||||
| Liability related to early exercised stock options |
3,029 | 6,485 | 5,389 | |||||||||||||
| Deferred income taxes, current |
2,617 | 5,829 | 4,420 | |||||||||||||
|
|
|
|
|
|
|
|||||||||||
| Total current liabilities |
29,157 | 75,437 | 111,140 | |||||||||||||
| Deferred revenue—non-current |
8,894 | 41,470 | 68,412 | |||||||||||||
| Other long-term liabilities |
70 | 802 | 1,099 | |||||||||||||
|
|
|
|
|
|
|
|||||||||||
| Total liabilities |
38,121 | 117,709 | 180,651 | |||||||||||||
|
|
|
|
|
|
|
|||||||||||
| Commitments and contingencies (Note 5) |
||||||||||||||||
| Convertible preferred stock, par value of $0.0001 per share—104,759, 123,880 and 123,880 shares authorized as of January 31, 2014 and 2015 and July 31, 2015 (unaudited); 104,106, 122,281 and 122,281 shares issued and outstanding as of January 31, 2014 and 2015 and July 31, 2015 (unaudited); aggregate liquidation preference of $266,622, $551,858 and $551,858 as of January 31, 2014 and 2015 and July 31, 2015 (unaudited); no shares issued and outstanding as of July 31, 2015, pro forma (unaudited). |
262,970 | 543,940 | 543,940 | — | ||||||||||||
| Stockholders’ (deficit) equity: |
||||||||||||||||
| Class A and Class B common stock, par value of $0.0001 per share—200,000 (Class B 200,000), 230,812 (Class A 1, Class B 230,811) and 252,812 (Class A 1, Class B 252,811) shares authorized as of January 31, 2014 and 2015 and July 31, 2015 (unaudited); 28,439 (Class B 28,439), 36,465 (Class B 36,465) and 37,776 (Class B 37,776) shares issued and outstanding as of January 31, 2014 and 2015 and July 31, 2015 (unaudited); 160,057 (Class B 160,057) shares issued and outstanding as of July 31, 2015, pro forma (unaudited). |
3 | 4 | 4 | 16 | ||||||||||||
| Additional paid-in capital |
12,143 | 41,749 | 66,508 | 610,436 | ||||||||||||
| Accumulated deficit |
(128,233 | ) | (341,583 | ) | (454,540 | ) | (454,540 | ) | ||||||||
|
|
|
|
|
|
|
|
|
|||||||||
| Total stockholders’ (deficit) equity |
(116,087 | ) | (299,830 | ) | (388,028 | ) | $ |
155,912 |
| |||||||
|
|
|
|
|
|
|
|
|
|||||||||
| Total liabilities, convertible preferred stock, and stockholders’ deficit |
$ | 185,004 | $ | 361,819 | $ | 336,563 | ||||||||||
|
|
|
|
|
|
|
|||||||||||
See the accompanying notes to the consolidated financial statements.
F-3
Table of Contents
Consolidated Statements of Operations
(in thousands, except per share data)
| Fiscal Year Ended January 31, |
Six Months Ended July 31, |
|||||||||||||||
| 2014 | 2015 | 2014 | 2015 | |||||||||||||
| (unaudited) | ||||||||||||||||
| Revenue: |
||||||||||||||||
| Product |
$ | 39,228 | $ | 154,836 | $ | 53,253 | $ | 134,810 | ||||||||
| Support |
3,505 | 19,615 | 6,159 | 23,928 | ||||||||||||
|
|
|
|
|
|
|
|
|
|||||||||
| Total revenue |
42,733 | 174,451 | 59,412 | 158,738 | ||||||||||||
| Cost of revenue: |
||||||||||||||||
| Product |
19,974 | 63,425 | 22,608 | 50,353 | ||||||||||||
| Support |
4,155 | 14,127 | 4,924 | 14,421 | ||||||||||||
|
|
|
|
|
|
|
|
|
|||||||||
| Total cost of revenue |
24,129 | 77,552 | 27,532 | 64,774 | ||||||||||||
|
|
|
|
|
|
|
|
|
|||||||||
| Gross profit |
18,604 | 96,899 | 31,880 | 93,964 | ||||||||||||
|
|
|
|
|
|
|
|
|
|||||||||
| Operating expenses: |
||||||||||||||||
| Research and development |
36,081 | 92,707 | 40,533 | 69,870 | ||||||||||||
| Sales and marketing |
54,750 | 152,320 | 71,563 | 107,844 | ||||||||||||
| General and administrative |
5,902 | 32,354 | 14,419 | 27,919 | ||||||||||||
|
|
|
|
|
|
|
|
|
|||||||||
| Total operating expenses |
96,733 | 277,381 | 126,515 | 205,633 | ||||||||||||
|
|
|
|
|
|
|
|
|
|||||||||
| Loss from operations |
(78,129 | ) | (180,482 | ) | (94,635 | ) | (111,669 | ) | ||||||||
| Other income (expense), net |
(141 | ) | (1,412 | ) | (307 | ) | (1,074 | ) | ||||||||
|
|
|
|
|
|
|
|
|
|||||||||
| Loss before provision for income taxes |
(78,270 | ) | (181,894 | ) | (94,942 | ) | (112,743 | ) | ||||||||
| Provision for income taxes |
291 | 1,337 | 257 | 214 | ||||||||||||
|
|
|
|
|
|
|
|
|
|||||||||
| Net loss |
$ | (78,561 | ) | $ | (183,231 | ) | $ | (95,199 | ) | $ | (112,957) | |||||
|
|
|
|
|
|
|
|
|
|||||||||
| Net loss per share attributable to common stockholders, basic and diluted |
$ | (3.24 | ) | $ | (6.56 | ) | $ | (3.66 | ) | $ | (3.41 | ) | ||||
|
|
|
|
|
|
|
|
|
|||||||||
| Weighted-average shares used in computing net loss per share attributable to common stockholders, basic and diluted |
24,237 | 27,925 | 25,976 | 33,154 | ||||||||||||
|
|
|
|
|
|
|
|
|
|||||||||
| Pro forma net loss per share attributable to common stockholders, basic and diluted (unaudited) |
$ | (1.26 | ) | $ | (0.73 | ) | ||||||||||
|
|
|
|
|
|||||||||||||
| Weighted-average shares used in computing pro forma net loss per share attributable to common stockholders, basic and diluted (unaudited) |
145,719 | 155,435 | ||||||||||||||
|
|
|
|
|
|||||||||||||
See the accompanying notes to the consolidated financial statements.
F-4
Table of Contents
Consolidated Statements of Convertible Preferred Stock and Stockholders’ Deficit
(in thousands, except per share data)
| Convertible Preferred Stock |
Common Stock | Additional Paid-In Capital |
Accumulated Deficit |
Total Stockholders’ Deficit |
||||||||||||||||||||||||||
| Shares | Amount | Shares | Amount | |||||||||||||||||||||||||||
| Balance—February 1, 2013 |
79,409 | $ | 95,137 | 27,438 | $ | 3 | $ | 3,317 | $ | (42,470 | ) | $ | (39,150 | ) | ||||||||||||||||
| Issuance of Series E convertible preferred stock at $6.93 per share, net of issuance costs of $3,354 |
24,697 | 167,833 | — | — | — | — | — | |||||||||||||||||||||||
| Issuance of common stock upon exercise of stock options |
— | — | 4,047 | — | 336 | — | 336 | |||||||||||||||||||||||
| Repurchase of common stock in connection with tender offer (Note 9) |
— | — | (3,046 | ) | — | — | (7,202 | ) | (7,202 | ) | ||||||||||||||||||||
| Stock-based compensation expense |
— | — | — | — | 8,298 | — | 8,298 | |||||||||||||||||||||||
| Vesting of early exercised stock options |
— | — | — | — | 192 | — | 192 | |||||||||||||||||||||||
| Net loss |
— | — | — | — | — | (78,561 | ) | (78,561 | ) | |||||||||||||||||||||
|
|
|
|
|
|
|
|
|
|
|
|
|
|
|
|||||||||||||||||
| Balance—January 31, 2014 |
104,106 | 262,970 | 28,439 | $ | 3 | $ | 12,143 | $ | (128,233 | ) | $ | (116,087 | ) | |||||||||||||||||
| Issuance of Series E convertible preferred stock at $6.93 per share |
65 | 450 | — | — | — | — | — | |||||||||||||||||||||||
| Issuance of Series F convertible preferred stock at $15.73 per share, net of issuance costs of $4,197 |
14,308 | 220,803 | — | — | — | — | — | |||||||||||||||||||||||
| Issuance of Series F-1 convertible preferred stock at $15.73 per share, net of issuance costs of $69 |
3,802 | 59,717 | — | — | — | — | — | |||||||||||||||||||||||
| Issuance of common stock upon exercise of stock options, including stock options exercised via promissory notes (Note 9) |
— | — | 11,879 | 2 | 3,045 | — | 3,047 | |||||||||||||||||||||||
| Repurchase of common stock in connection with tender offer (Note 9) |
— | — | (3,803 | ) | (1 | ) | — | (30,119 | ) | (30,120 | ) | |||||||||||||||||||
| Repurchase of common stock from early exercised stock options |
— | — | (50 | ) | — | — | — | — | ||||||||||||||||||||||
| Stock-based compensation expense |
— | — | — | — | 25,399 | — | 25,399 | |||||||||||||||||||||||
| Vesting of early exercised stock options |
— | — | — | — | 1,162 | — | 1,162 | |||||||||||||||||||||||
| Net loss |
— | — | — | — | — | (183,231 | ) | (183,231 | ) | |||||||||||||||||||||
|
|
|
|
|
|
|
|
|
|
|
|
|
|
|
|||||||||||||||||
| Balance—January 31, 2015 |
122,281 | $ | 543,940 | 36,465 | $ | 4 | $ | 41,749 | $ | (341,583 | ) | $ | (299,830 | ) | ||||||||||||||||
| Issuance of common stock upon exercise of stock options (unaudited) |
— | — | 1,311 | — | 3,004 | — | 3,004 | |||||||||||||||||||||||
| Stock-based compensation expense (unaudited) |
— | — | — | — | 20,659 | — | 20,659 | |||||||||||||||||||||||
| Vesting of early exercised stock options (unaudited) |
— | — | — | — | 1,096 | — | 1,096 | |||||||||||||||||||||||
| Net loss (unaudited) |
— | — | — | — | — | (112,957 | ) | (112,957 | ) | |||||||||||||||||||||
|
|
|
|
|
|
|
|
|
|
|
|
|
|
|
|
||||||||||||||||
| Balance—July 31, 2015 (unaudited) |
122,281 | $ | 543,940 | 37,776 | $ | 4 | $ | 66,508 | $ | (454,540 | ) | $ | (388,028 | ) | ||||||||||||||||
|
|
|
|
|
|
|
|
|
|
|
|
|
|
|
|||||||||||||||||
See the accompanying notes to the consolidated financial statements.
F-5
Table of Contents
Consolidated Statements of Cash Flows
(in thousands)
| Fiscal Year Ended January 31, | Six Months Ended July 31, |
|||||||||||||||
| 2014 | 2015 | 2014 | 2015 | |||||||||||||
| (unaudited) | ||||||||||||||||
| CASH FLOWS FROM OPERATING ACTIVITIES |
||||||||||||||||
| Net loss |
$ | (78,561 | ) | $ | (183,231 | ) | $ | (95,199 | ) | $ | (112,957 | ) | ||||
| Adjustments to reconcile net loss to net cash used in operating activities: |
||||||||||||||||
| Depreciation and amortization |
4,431 | 15,392 | 5,383 | 14,268 | ||||||||||||
| Stock-based compensation expense |
8,298 | 25,399 | 10,510 | 20,659 | ||||||||||||
| Other |
92 | 277 | 3 | — | ||||||||||||
| Changes in operating assets and liabilities: |
||||||||||||||||
| Accounts receivable, net |
(12,038 | ) | (44,197 | ) | (19,470 | ) | (21,017 | ) | ||||||||
| Inventory |
(5,077 | ) | (13,713 | ) | (9,327 | ) | (1,653 | ) | ||||||||
| Deferred commissions |
(7,129 | ) | (9,838 | ) | (2,055 | ) | (4,865 | ) | ||||||||
| Prepaid expenses and other assets |
(4,400 | ) | (6,550 | ) | (1,390 | ) | (2,634 | ) | ||||||||
| Accounts payable |
5,243 | 3,474 | 1,225 | 2,417 | ||||||||||||
| Accrued compensation and other liabilities |
6,771 | 12,450 | 6,157 | 11,479 | ||||||||||||
| Deferred revenue |
15,141 | 56,842 | 21,205 | 49,813 | ||||||||||||
|
|
|
|
|
|
|
|
|
|||||||||
| Net cash used in operating activities |
(67,229 | ) | (143,695 | ) | (82,958 | ) | (44,490 | ) | ||||||||
|
|
|
|
|
|
|
|
|
|||||||||
| CASH FLOWS FROM INVESTING ACTIVITIES |
||||||||||||||||
| Purchases of property and equipment |
(12,273 | ) | (42,227 | ) | (19,235 | ) | (21,823 | ) | ||||||||
| Purchases of intangible assets |
— | (9,125 | ) | (8,025 | ) | — | ||||||||||
| Increase in restricted cash |
(3,034 | ) | (1,613 | ) | (1,614 | ) | — | |||||||||
|
|
|
|
|
|
|
|
|
|||||||||
| Net cash used in investing activities |
(15,307 | ) | (52,965 | ) | (28,874 | ) | (21,823 | ) | ||||||||
|
|
|
|
|
|
|
|
|
|||||||||
| CASH FLOWS FROM FINANCING ACTIVITIES |
||||||||||||||||
| Proceeds from issuance of convertible preferred stock, net of issuance costs |
167,833 | 280,970 | 280,670 | — | ||||||||||||
| Net proceeds from exercise of stock options, including proceeds from repayment of promissory notes |
2,670 | 7,665 | 4,950 | 3,004 | ||||||||||||
| Repurchase of common stock in connection with tender offers (Note 9) |
(7,202 | ) | (30,120 | ) | (30,120 | ) | — | |||||||||
| Payments of deferred offering costs |
— | (33 | ) | — | (1,116 | ) | ||||||||||
|
|
|
|
|
|
|
|
|
|||||||||
| Net cash provided by financing activities |
163,301 | 258,482 | 255,500 | 1,888 | ||||||||||||
|
|
|
|
|
|
|
|
|
|||||||||
| Net increase (decrease) in cash and cash equivalents |
80,765 | 61,822 | 143,668 | (64,425 | ) | |||||||||||
| Cash and cash equivalents, beginning of period |
50,120 | 130,885 | 130,885 | 192,707 | ||||||||||||
|
|
|
|
|
|
|
|
|
|||||||||
| Cash and cash equivalents, end of period |
$ | 130,885 | $ | 192,707 | $ | 274,553 | $ | 128,282 | ||||||||
|
|
|
|
|
|
|
|
|
|||||||||
| SUPPLEMENTAL DISCLOSURES OF CASH FLOW INFORMATION |
||||||||||||||||
| Cash paid for income taxes |
$ | 87 | $ | 429 | $ | 144 | $ | 333 | ||||||||
|
|
|
|
|
|
|
|
|
|||||||||
| SUPPLEMENTAL DISCLOSURES OF NON-CASH INVESTING AND FINANCING INFORMATION |
||||||||||||||||
| Purchase of equipment included in accounts payable |
$ | 1,224 | $ | 1,323 | $ | 764 | $ | 1,742 | ||||||||
|
|
|
|
|
|
|
|
|
|||||||||
| Vesting of early exercised stock options and restricted stock awards |
$ | 192 | $ | 1,162 | $ | 336 | $ | 1,096 | ||||||||
|
|
|
|
|
|
|
|
|
|||||||||
| Cashless exercise of stock options during tender offers (Note 9) |
$ | 640 | $ | 2,057 | $ | 2,057 | — | |||||||||
|
|
|
|
|
|
|
|
|
|||||||||
| Unpaid deferred offering costs |
$ | — | $ | 55 | $ | — | $ | 1,373 | ||||||||
|
|
|
|
|
|
|
|
|
|||||||||
See the accompanying notes to the consolidated financial statements.
F-6
Table of Contents
Notes to Consolidated Financial Statements
Note 1. Organization
Organization and Description of Business
Pure Storage, Inc. was originally incorporated in the state of Delaware in October 2009 under the name OS76, Inc. In January 2010, we changed our name to Pure Storage, Inc. We provide an enterprise data storage platform that transforms business through a dramatic increase in performance and reduction in complexity and costs. We are headquartered in Mountain View, California and have wholly owned subsidiaries throughout the world, including Europe and Asia.
Note 2. Basis of Presentation and Summary of Significant Accounting Policies
Principles of Consolidation
The consolidated financial statements include the accounts of Pure Storage, Inc. and our wholly owned subsidiaries and have been prepared in conformity with accounting principles generally accepted in the United States, or U.S. GAAP. All intercompany balances and transactions have been eliminated in consolidation.
Unaudited Interim Consolidated Financial Information
The accompanying interim consolidated balance sheet as of July 31, 2015 and the consolidated statements of operations and cash flows for the six months ended July 31, 2014 and 2015, and the consolidated statement of convertible preferred stock and stockholders’ deficit for the six months ended July 31, 2015, and the related footnote disclosures are unaudited. These unaudited interim financial statements have been prepared in accordance with U.S. GAAP. In management’s opinion, the unaudited interim financial statements have been prepared on the same basis as the audited financial statements and include all adjustments, which include only normal recurring adjustments, necessary for the fair presentation of our statement of financial position as of July 31, 2015 and our results of operations and cash flows for the six months ended July 31, 2014 and 2015. The results for the six months ended July 31, 2015 are not necessarily indicative of the results expected for the full fiscal year or any other period.
Stock Split
In November 2013, we effected a 2-for-1 stock split. We also effected a 3-for-1 stock split in a prior fiscal year. All references to common stock and convertible preferred stock shares and per share amounts including options to purchase common stock have been retroactively restated to reflect these stock splits.
Foreign Currency
The functional currency of our foreign subsidiaries is the U.S. dollar. Transactions denominated in currencies other than the functional currency are remeasured to the functional currency at the average exchange rate in effect during the period. At the end of each reporting period, monetary assets and liabilities are remeasured using exchange rates in effect at the balance sheet date. Non-monetary assets and liabilities are remeasured at historical exchange rates. Foreign currency transaction gains and losses are recorded in other income (expense), net in the consolidated statements of operations. For the fiscal years ended January 31, 2014 and 2015 and the six months ended July 31, 2014 and 2015, we recorded net foreign currency transaction losses of $16,000, $648,000, $51,000 and $1.1 million, respectively.
F-7
Table of Contents
PURE STORAGE, INC.
Notes to Consolidated Financial Statements
Use of Estimates
The preparation of financial statements in conformity with U.S. GAAP requires management to make estimates and assumptions that affect the amounts reported and disclosed in the financial statements and accompanying notes. Actual results could differ from these estimates. Such estimates include, but are not limited to, the determination of best estimate of selling price included in multiple-deliverable revenue arrangements, sales commissions, useful lives of intangible assets and property and equipment, fair values of stock-based awards, provision for income taxes, including related reserves, among others. Management bases its estimates on historical experience and on various other assumptions which management believes to be reasonable, the results of which form the basis for making judgments about the carrying values of assets and liabilities.
Unaudited Pro Forma Stockholders’ Equity
Upon the completion of an initial public offering, or IPO, all outstanding shares of convertible preferred stock will automatically convert into shares of Class B common stock. The pro forma stockholders’ equity data as of July 31, 2015 has been prepared assuming the automatic conversion of all outstanding shares of convertible preferred stock into 122,280,679 shares of Class B common stock.
Concentration Risk
Financial instruments that are exposed to concentration of credit risk consist primarily of cash and cash equivalents and accounts receivable. As of January 31, 2014 and 2015 and July 31, 2015, substantially all of our cash and cash equivalents have been invested in money market funds with one financial institution, and such deposits exceed federally insured limits. Management believes that the financial institutions that hold our investments are financially sound and, accordingly, are subject to minimal credit risk. We define a customer as an end user that purchases our products and services from one of our channel partners or from us directly. Our revenue and accounts receivable are derived substantially from the United States across a multitude of industries. We perform ongoing evaluations to determine customer credit. As of January 31, 2014, we had one channel partner that individually represented 27% of total accounts receivable. As of January 31, 2015, we had another channel partner that individually represented 13% of total accounts receivable. No single channel partner or customer represented over 10% of total accounts receivable as of July 31, 2015. No single channel partner or customer represented over 10% of revenue for the fiscal years ended January 31, 2014 and 2015 and the six months ended July 31, 2014 and 2015. We rely on a limited number of suppliers for our contract manufacturing and certain raw material components. In instances where suppliers fail to perform their obligations, we may be unable to find alternative suppliers or satisfactorily deliver our products to our customers on time.
Cash and Cash Equivalents
Cash and cash equivalents consist of cash in banks and highly liquid investments, primarily money market funds, purchased with an original maturity of three months or less.
Restricted Cash
Restricted cash is comprised of certificates of deposit related to one of our leases. As of January 31, 2014 and 2015 and July 31, 2015, we had restricted cash of $3.0 million, $4.6 million and $4.6 million, respectively, which was included in other long-term assets in the consolidated balance sheets.
Fair Value of Financial Instruments
The carrying value of our financial instruments, including cash equivalents, accounts receivable, accounts payable and accrued liabilities, approximates fair value.
F-8
Table of Contents
PURE STORAGE, INC.
Notes to Consolidated Financial Statements
Accounts Receivable and Allowance
Accounts receivable are recorded at the invoiced amount, and stated at realizable value, net of an allowance for doubtful accounts. Credit is extended to customers based on an evaluation of their financial condition and other factors. We generally do not require collateral or other security to support accounts receivable. We perform ongoing credit evaluations of our customers and maintain an allowance for doubtful accounts.
We assess the collectability of the accounts by taking into consideration the aging of our trade receivables, historical experience, and management judgment. We write off trade receivables against the allowance when management determines a balance is uncollectible and no longer actively pursues collection of the receivable.
The following table presents the changes in the allowance for doubtful accounts:
| Fiscal Year Ended January 31, |
Six Months Ended July 31, |
|||||||||||||||
| 2014 | 2015 | 2014 | 2015 | |||||||||||||
| (unaudited) | ||||||||||||||||
| (in thousands) | ||||||||||||||||
| Allowance for doubtful accounts, beginning balance |
$ | — | $ | 160 | $ | 160 | $ | 210 | ||||||||
| Provision (recovery) |
160 | 50 | (110 | ) | 568 | |||||||||||
|
|
|
|
|
|
|
|
|
|||||||||
| Allowance for doubtful accounts, ending balance |
$ | 160 | $ | 210 | $ | 50 | $ | 778 | ||||||||
|
|
|
|
|
|
|
|
|
|||||||||
Inventory
Inventory consists of finished goods and component parts, which are purchased from contract manufacturers. Product demonstration units, which we regularly sell, are the primary component of our inventories. Inventories are stated at the lower of cost or market. Cost is determined using the specific identification method for finished goods and weighted-average method for component parts. We account for excess and obsolete inventory by reducing the carrying value to the estimated net realizable value of the inventory based upon management’s assumptions about future demand and market conditions. In addition, we record a liability for firm, non-cancelable and unconditional purchase commitments with contract manufacturers and suppliers for quantities in excess of future demand forecasts consistent with excess and obsolete inventory valuations. Inventory write-offs were insignificant for the fiscal years ended January 31, 2014, 2015 and the six months ended July 31, 2014 and 2015.
Property and Equipment
Property and equipment are stated at cost less accumulated depreciation and amortization. Depreciation and amortization is computed using the straight-line method over the estimated useful lives of the respective assets (test equipment—2 years, computer, equipment and software—2 to 3 years, furniture and fixtures—7 years). Leasehold improvements are amortized over the shorter of their estimated useful lives or the remaining lease term. Depreciation commences once the asset is placed in service.
Intangible Assets
Intangible assets are stated at cost, net of accumulated amortization. During the fiscal year ended January 31, 2015, we acquired certain technology patents for $9.1 million. This amount is being amortized on a straight-line basis over an estimated useful life of seven years.
F-9
Table of Contents
PURE STORAGE, INC.
Notes to Consolidated Financial Statements
Impairment of Long-Lived Assets
We review our long-lived assets, including property and equipment, and finite-lived intangible assets for impairment whenever events or changes in circumstances indicate the carrying amount of an asset may not be recoverable. We measure the recoverability of these assets by comparing the carrying amounts to the future undiscounted cash flows the assets are expected to generate. If the total of the future undiscounted cash flows is less than the carrying amount of an asset, we record an impairment charge for the amount by which the carrying amount of the asset exceeds its fair market value. There have been no impairment charges recorded in any of the periods presented in the consolidated financial statements.
Deferred Commissions
Deferred commissions consist of direct and incremental costs paid to our sales force related to customer contracts. The deferred commission amounts are recoverable through the revenue streams that will be recognized under the related customer contracts. Direct sales commissions are deferred when earned and amortized over the same period that revenue is recognized from the related customer contract. Amortization of deferred commissions is included in sales and marketing expense in the consolidated statements of operations.
As of January 31, 2014 and 2015 and July 31, 2015, we recorded short-term deferred commissions of $4.3 million, $9.4 million and $11.9 million, respectively, and long-term deferred commissions of $2.8 million, $7.5 million and $9.9 million, respectively, in other long-term assets in the consolidated balance sheets. During the fiscal years ended January 31, 2014 and 2015 and the six months ended July 31, 2014 and 2015, we recognized sales commission expenses of $11.0 million, $27.7 million, $10.1 million and $18.6 million, respectively.
Deferred Offering Costs
Deferred offering costs, consisting of legal, accounting and filing fees directly relating to our initial public offering, are capitalized. The deferred offering costs will be offset against the IPO proceeds upon the completion of the offering. In the event the offering is terminated, deferred offering costs will be expensed immediately. As of January 31, 2015 and July 31, 2015, we capitalized $88,000 and $2.5 million of deferred offering costs. No amounts were capitalized as of January 31, 2014.
Revenue Recognition
We derive revenue from two sources: (1) product revenue which includes hardware and embedded software and (2) support revenue which includes customer support, hardware maintenance and software upgrades on a when-and-if-available basis.
We recognize revenue when:
| • | Persuasive evidence of an arrangement exists—We rely upon sales agreements and/or purchase orders to determine the existence of an arrangement. |
| • | Delivery has occurred—We typically recognize product revenue upon shipment, as title and risk of loss are transferred to our channel partners at that time. Products are typically shipped directly by us to customers, and our channel partners do not stock our inventory. |
| • | The fee is fixed or determinable—We assess whether the fee is fixed or determinable based on the payment terms associated with the transaction. |
| • | Collection is reasonably assured—We assess collectability based on credit analysis and payment history. |
F-10
Table of Contents
PURE STORAGE, INC.
Notes to Consolidated Financial Statements
Our product revenue is derived from the sale of hardware and operating system software that is integrated into the hardware and therefore deemed essential to its functionality. The hardware and the operating system software essential to the functionality of the hardware are considered non-software deliverables and, therefore, are not subject to industry-specific software revenue recognition guidance.
Support revenue is derived from the sale of maintenance and support agreements. Maintenance and support agreements include the right to receive unspecified software upgrades and enhancements on a when-and-if-available basis, bug fixes, parts replacement services related to the hardware, as well as access to our cloud-based management and support platform. Revenue related to maintenance and support agreements are recognized ratably over the contractual term, which generally range from one to three years. Costs related to maintenance and support agreements are expensed as incurred. In addition, our Forever Flash program provides our customers who continually maintain active maintenance and support for three years with an included controller refresh with each additional three year maintenance and support renewal. In accordance with multiple-element arrangement accounting guidance, the controller refresh represents an additional deliverable that is a separate unit of accounting and the allocated revenue is recognized in the period in which these controllers are shipped.
Most of our arrangements, other than stand-alone renewals of maintenance and support agreements, are multiple-element arrangements with a combination of product and support related deliverables (as defined above). Under multiple-element arrangements, we allocate consideration at the inception of an arrangement to all deliverables based on the relative selling price method in accordance with the hierarchy provided by the multiple-element arrangement accounting guidance, which includes (i) vendor-specific objective evidence, or VSOE, of selling price, if available; (ii) third-party evidence, or TPE, of selling price, if VSOE is not available; and (iii) best estimate of selling price, or BESP, if neither VSOE nor TPE is available. As discussed below, because we have not established VSOE for any of our deliverables and TPE typically cannot be obtained, we typically allocate consideration to all deliverables based on BESP.
| • | VSOE—We determine VSOE based on our historical pricing and discounting practices for the specific products and services when sold separately. In determining VSOE, we require that a substantial majority of the stand-alone selling prices fall within a reasonably narrow pricing range. We have not established VSOE for any of our hardware and support related deliverables given that our pricing is not sufficiently concentrated (based on an analysis of separate sales of the deliverables) to conclude that we can demonstrate VSOE of selling prices. |
| • | TPE—When VSOE cannot be established for deliverables in multiple-element arrangements, we apply judgment with respect to whether we can establish a selling price based on TPE. TPE is determined based on competitor prices for interchangeable products or services when sold separately to similarly situated customers. However, because our products contain a significant element of proprietary technology and our solutions offer substantially different features and functionality, the comparable pricing of products with similar functionality typically cannot be obtained. |
| • | BESP—When neither VSOE nor TPE can be established, we utilize BESP to allocate consideration to deliverables in a multiple-element arrangement. Our process to determine BESP for products and support is based on qualitative and quantitative considerations of multiple factors, which primarily include historical sales, margin objectives and discount behavior. Additional considerations are given to other factors such as customer demographics, costs to manufacture products or provide support, pricing practices and market conditions. |
F-11
Table of Contents
PURE STORAGE, INC.
Notes to Consolidated Financial Statements
Deferred Revenue
Deferred revenue consists of amounts that have been invoiced but that have not yet been recognized as revenue and primarily consists of support. The current portion of deferred revenue represents the amounts that are expected to be recognized as revenue within one year of the consolidated balance sheet date.
Warranty Costs
We generally provide a three-year warranty on hardware and a 90-day warranty on our software embedded in the hardware. Our hardware warranty provides for parts replacement for defective components and our software warranty provides for bug fixes. With respect to our hardware warranty obligation, we have a warranty agreement with our contract manufacturer under which our contract manufacturer is generally required to replace defective hardware within three years of shipment. Furthermore, our maintenance and support agreement provides for the same parts replacement that customers are entitled to under our warranty program, except that replacement parts are delivered according to targeted response times to minimize disruption to our customers’ critical business applications. Substantially all customers purchase maintenance and support agreements.
Therefore, given the warranty agreement with our contract manufacturer and that substantially all our products sales are sold together with maintenance and support agreements, we generally do not have exposure related to warranty costs and no warranty reserve has been recorded.
Research and Development
Research and development costs are expensed as incurred. Research and development costs consist primarily of personnel costs including stock-based compensation expense, expensed prototype, to the extent there is no alternative use for that equipment, consulting services, depreciation of equipment used in research and development and allocated overhead costs.
Software Development Costs
We expense software development costs before technological feasibility is reached. We have determined that technological feasibility is reached shortly before the release of our products and as a result, the development costs incurred after the establishment of technological feasibility and before the release of those products have not been significant and accordingly, all software development costs have been expensed as incurred.
Software development costs also include costs incurred related to our hosted applications used to deliver our support services. Capitalization begins when the preliminary project stage is complete, management with the relevant authority authorizes and commits to the funding of the software project, and it is probable the project will be completed and the software will be used to perform the intended function. Total costs related to our hosted applications incurred to date have been insignificant and as a result no software development costs were capitalized during the fiscal years ended January 31, 2014 and 2015, and the six months ended July 31, 2014 and 2015.
Advertising Expenses
Advertising costs are expensed as incurred. Advertising expenses were $195,000 and $1.4 million for the fiscal years ended January 31, 2014 and 2015, respectively, and $410,000 and $2.0 million for the six months ended July 31, 2014 and 2015, respectively.
F-12
Table of Contents
PURE STORAGE, INC.
Notes to Consolidated Financial Statements
Stock-Based Compensation
We determine the fair value of our stock options issued to employees on the date of grant utilizing the Black-Scholes option pricing model, which is impacted by the fair value of our common stock, as well as changes in assumptions regarding a number of subjective variables. These variables include the expected common stock price volatility over the term of the option awards, the expected term of the awards, risk-free interest rates and expected dividend yield.
We recognize stock-based compensation expense for stock-based awards on a straight-line basis over the period during which an employee is required to provide services in exchange for the award (generally the vesting period of the award). Stock-based compensation expense is recognized only for those awards expected to vest. We estimate future forfeitures at the date of grant and revise the estimates, if necessary, in subsequent periods if actual forfeitures differ from those estimates. For stock-based awards granted to employees with a performance condition, we recognize stock-based compensation expense for these awards under the accelerated attribution method over the requisite service period when management determines it is probable that the performance condition will be satisfied.
We determine the fair value of our stock options issued to non-employees on the date of grant utilizing the Black-Scholes option pricing model. Stock-based compensation expense for stock options issued to nonemployees is recognized over the requisite service period or when it is probable that the performance condition will be satisfied. Options subject to vesting are periodically remeasured to current fair value over the vesting period.
Comprehensive Loss
We did not have any other comprehensive income or loss during the periods presented and therefore comprehensive loss was the same as net loss.
Income Taxes
We account for income taxes using the asset and liability method. Deferred income taxes are recognized by applying enacted statutory tax rates applicable to future years to differences between the financial statement carrying amounts of existing assets and liabilities and their respective tax bases and operating loss and tax credit carryforwards. The effect on deferred tax assets and liabilities of a change in tax rates is recognized in income in the period that includes the enactment date. The measurement of deferred tax assets is reduced, if necessary, by a valuation allowance to amounts that are more likely than not to be realized.
We recognize tax benefits from uncertain tax positions only if we believe that it is more likely than not that the tax position will be sustained on examination by the taxing authorities based on the technical merits of the position. The tax benefits recognized in the financial statements from such positions are then measured based on the largest benefit that has a greater than 50% likelihood of being realized upon settlement.
Recent Accounting Pronouncement
In May 2014, the Financial Accounting Standards Board, or FASB, issued Accounting Standards Update No. 2014-09, or ASU 2014-09, Revenue from Contracts with Customers. ASU 2014-09 supersedes the revenue recognition requirements in Revenue Recognition (Topic 605), and requires entities to recognize revenue when it transfers promised goods or services to customers in an amount that reflects the consideration to which the entity expects to be entitled to in exchange for those goods or services. In August 2015, the FASB issued Accounting Standards update No. 2015-14 Revenue from Contracts with Customers or ASU 2015-14. ASU 2015-14 defers the effective date for ASU 2014-09, and accordingly the effective date for us commences on February 1, 2018
F-13
Table of Contents
PURE STORAGE, INC.
Notes to Consolidated Financial Statements
and early adoption is allowed for our fiscal year beginning February 1, 2017. This standard will be applied using either the full or modified retrospective adoption methods. We are currently evaluating adoption methods and the impact of this standard on our consolidated financial statements.
Note 3. Fair Value Measurements
We define fair value as the exchange price that would be received from sale of an asset or paid to transfer a liability in the principal or most advantageous market for the asset or liability in an orderly transaction between market participants on the measurement date. We measure our financial assets and liabilities at fair value at each reporting period using a fair value hierarchy which requires us to maximize the use of observable inputs and minimize the use of unobservable inputs when measuring fair value. A financial instrument’s classification within the fair value hierarchy is based upon the lowest level of input that is significant to the fair value measurement. Three levels of inputs may be used to measure fair value:
| • | Level I—Observable inputs are unadjusted quoted prices in active markets for identical assets or liabilities; |
| • | Level II—Observable inputs are quoted prices for similar assets and liabilities in active markets or inputs other than quoted prices that are observable for the assets or liabilities, either directly or indirectly through market corroboration, for substantially the full term of the financial instruments; and |
| • | Level III—Unobservable inputs that are supported by little or no market activity and that are significant to the fair value of the assets or liabilities. These inputs are based on our own assumptions used to measure assets and liabilities at fair value and require significant management judgment or estimation. |
We classify our money market funds within Level I because they are valued using quoted market prices. We classify our restricted cash within Level II because they are valued using inputs other than quoted prices which are directly or indirectly observable in the market, including readily-available pricing sources for the identical underlying security which may not be actively traded.
The following tables set forth the fair value of our financial assets measured at fair value on a recurring basis as of January 31, 2014 and 2015 and July 31, 2015 using the above input categories (in thousands):
| January 31, 2014 | ||||||||||||||||
| Level I | Level II | Level III | Total | |||||||||||||
| Financial Assets: |
||||||||||||||||
| Cash and cash equivalents: |
||||||||||||||||
| Money market funds |
$ | 126,248 | $ | — | $ | — | $ | 126,248 | ||||||||
| Restricted cash: |
||||||||||||||||
| Certificates of deposit |
— | 3,034 | — | 3,034 | ||||||||||||
|
|
|
|
|
|
|
|
|
|||||||||
| Total assets measured at fair value |
$ | 126,248 | $ | 3,034 | $ | — | $ | 129,282 | ||||||||
|
|
|
|
|
|
|
|
|
|||||||||
| January 31, 2015 | ||||||||||||||||
| Level I | Level II | Level III | Total | |||||||||||||
| Financial Assets: |
||||||||||||||||
| Cash and cash equivalents: |
||||||||||||||||
| Money market funds |
$ | 190,621 | $ | — | $ | — | $ | 190,621 | ||||||||
| Restricted cash: |
||||||||||||||||
| Certificates of deposit |
— | 4,648 | — | 4,648 | ||||||||||||
|
|
|
|
|
|
|
|
|
|||||||||
| Total assets measured at fair value |
$ | 190,621 | $ | 4,648 | $ | — | $ | 195,269 | ||||||||
|
|
|
|
|
|
|
|
|
|||||||||
F-14
Table of Contents
PURE STORAGE, INC.
Notes to Consolidated Financial Statements
| July 31, 2015 (unaudited) | ||||||||||||||||
| Level I | Level II | Level III | Total | |||||||||||||
| Financial Assets: |
||||||||||||||||
| Cash and cash equivalents: |
||||||||||||||||
| Money market funds |
$ | 75,615 | $ | — | $ | — | $ | 75,615 | ||||||||
| Restricted cash: |
||||||||||||||||
| Certificates of deposit |
— | 4,648 | — | 4,648 | ||||||||||||
|
|
|
|
|
|
|
|
|
|||||||||
| Total assets measured at fair value |
$ | 75,615 | $ | 4,648 | $ | — | $ | 80,263 | ||||||||
|
|
|
|
|
|
|
|
|
|||||||||
Note 4. Balance Sheet Components
Property and Equipment, Net
Property and equipment, net consists of the following (in thousands):
| January 31, | July 31, 2015 |
|||||||||||
| 2014 | 2015 | |||||||||||
| (unaudited) | ||||||||||||
| Test equipment |
$ | 15,024 | $ | 37,059 | $ | 53,622 | ||||||
| Computer, equipment and software |
4,693 | 19,022 | 23,083 | |||||||||
| Furniture and fixtures |
279 | 2,460 | 2,638 | |||||||||
| Leasehold improvements |
278 | 3,776 | 4,392 | |||||||||
|
|
|
|
|
|
|
|||||||
| Total property and equipment |
20,274 | 62,317 | 83,735 | |||||||||
| Less: accumulated depreciation and amortization |
(8,121 | ) | (22,458 | ) | (35,731 | ) | ||||||
|
|
|
|
|
|
|
|||||||
| Property and equipment, net |
$ | 12,153 | $ | 39,859 | $ | 48,004 | ||||||
|
|
|
|
|
|
|
|||||||
Depreciation and amortization expense for the fiscal years ended January 31, 2014 and 2015 was $4.4 million and $14.6 million, respectively, and was $5.2 million and $13.4 million for the six months ended July 31, 2014 and 2015, respectively.
Intangible Assets, Net
Intangible assets, net consist of the following (in thousands):
| January 31, 2015 | July 31, 2015 | |||||||
| (unaudited) | ||||||||
| Technology patents |
$ | 9,125 | $ | 9,125 | ||||
| Accumulated amortization |
(841 | ) | (1,493 | ) | ||||
|
|
|
|
|
|||||
| Intangible assets, net |
$ | 8,284 | $ | 7,632 | ||||
|
|
|
|
|
|||||
Intangible assets amortization expense was $841,000 and $652,000 for the fiscal year ended January 31, 2015, and the six months ended July 31, 2015, respectively. Due to the defensive nature of these patents, the amortization is included in general and administrative expenses in the consolidated statements of operations.
F-15
Table of Contents
PURE STORAGE, INC.
Notes to Consolidated Financial Statements
As of January 31, 2015, expected amortization expense for intangible assets for each of the next five years and thereafter is as follows (in thousands):
| Year Ending January 31, |
Estimated Future Amortization Expense |
|||
| 2016 |
$ | 1,304 | ||
| 2017 |
1,304 | |||
| 2018 |
1,304 | |||
| 2019 |
1,304 | |||
| 2020 |
1,304 | |||
| Thereafter |
1,764 | |||
|
|
|
|||
| Total |
$ | 8,284 | ||
|
|
|
|||
Accrued Expenses and Other Liabilities
Accrued expenses and other liabilities consist of the following (in thousands):
| January 31, | July 31, 2015 |
|||||||||||
| 2014 | 2015 | |||||||||||
| (unaudited) | ||||||||||||
| Sales and use tax payable |
$ | 411 | $ | 591 | $ | 407 | ||||||
| Accrued professional fees |
128 | 1,502 | 2,936 | |||||||||
| Accrued travel and entertainment expenses |
169 | 1,138 | 1,727 | |||||||||
| Income tax payable |
150 | 779 | 682 | |||||||||
| Other accrued liabilities |
420 | 2,096 | 5,312 | |||||||||
| Accrued deferred offering costs |
— | — | 1,222 | |||||||||
|
|
|
|
|
|
|
|||||||
| Total accrued expenses and other liabilities |
$ | 1,278 | $ | 6,106 | $ | 12,286 | ||||||
|
|
|
|
|
|
|
|||||||
Note 5. Commitments and Contingencies
Operating Leases
We lease our office facilities under operating lease agreements expiring through January 2021. Certain of these lease agreements have escalating rent payments. We recognize rent expense under such agreements on a straight-line basis over the lease term, and the difference between the rent paid and the straight-line rent is recorded in accrued expenses and other liabilities and other long-term liabilities in the accompanying consolidated balance sheets.
As of January 31, 2015, the aggregate future minimum payments under non-cancelable operating leases consist of the following (in thousands):
| Fiscal Year Ending January 31, |
Operating Leases | |||
| 2016 |
$ | 7,872 | ||
| 2017 |
6,437 | |||
| 2018 |
6,282 | |||
| 2019 |
4,973 | |||
| 2020 |
3,992 | |||
| Thereafter |
967 | |||
|
|
|
|||
| Total |
$ | 30,523 | ||
|
|
|
|||
F-16
Table of Contents
PURE STORAGE, INC.
Notes to Consolidated Financial Statements
Rent expense recognized under our operating leases were $1.8 million and $7.5 million for the fiscal years ended January 31, 2014 and 2015, respectively, and $2.9 million and $5.2 million for the six months ended July 31, 2014 and 2015, respectively.
Purchase Obligations
As of January 31, 2015, we had $626,000 of non-cancelable contractual purchase obligations related to certain software service contracts. As of July 31, 2015, we had $1.8 million of non-cancelable contracts related to certain software services.
Letters of Credit
As of January 31, 2014 and 2015 and July 31, 2015, we had letters of credit in the aggregate amount of $3.0 million, $4.6 million and $4.6 million, respectively, in connection with our headquarter facility lease. The letters of credit are collateralized by restricted cash in the same amount and mature at various dates through April 2020.
Legal Matters
On November 4, 2013, EMC Corporation, or EMC, filed a complaint against us, alleging that our hiring of EMC employees evidences a scheme to misappropriate EMC’s confidential information and trade secrets and to unlawfully interfere with EMC’s business relationships with its customers and contractual relationships with its employees. The complaint seeks damages and injunctive relief. On November 26, 2013, we answered and counterclaimed, denying EMC’s allegations and alleging that EMC surreptitiously obtained and tested our product in a manner that constituted misappropriation of our trade secrets, a breach of contract, breach of the covenant of good faith and fair dealing, unlawful interference with our contractual and business relationships as well as unfair competition and a violation of Massachusetts General Law 93A, Sections 2 and 11. On November 18, 2014, we amended our counterclaim, additionally alleging that EMC has engaged in commercial disparagement, violated the Lanham Act and engaged in defamation. Our counterclaim seeks damages and declaratory and injunctive relief. Fact discovery has commenced and is currently scheduled to end October 16, 2015. Expert discovery is scheduled to end on February 5, 2016 and the deadline for filing dispositive motions is March 31, 2016. The court has scheduled a trial date for October 17, 2016.
On November 26, 2013, EMC filed a complaint against us, alleging infringement of five patents held by EMC. The complaint seeks damages and injunctive and equitable relief. On January 17, 2014, we filed a response to the complaint, denying all claims and asserting that EMC’s patents are invalid. Fact discovery has been concluded, and expert discovery has ended. The deadline for filing dispositive motions is October 6, 2015. Trial is currently scheduled for March 7, 2016.
We intend to defend these lawsuits vigorously. The outcome, including our liability, if any, with respect to this litigation, is uncertain. At present, we are unable to estimate a reasonably possible range of loss, if any, that may result from this matter. If an unfavorable outcome were to occur in this litigation, the impact could be material to our business, financial condition or results of operations.
From time to time, we have become involved in claims and other legal matters arising in the normal course of business. We investigate these claims as they arise. Although claims are inherently unpredictable, we currently are not aware of any matters that may have a material adverse effect on our business, financial position, results of operations or cash flows. Accordingly we have not recorded any loss contingency on our consolidated balance sheets as of January 31, 2014 and 2015 and July 31, 2015.
F-17
Table of Contents
PURE STORAGE, INC.
Notes to Consolidated Financial Statements
Indemnification
Our arrangements generally include certain provisions for indemnifying customers against liabilities if our products or services infringe a third party’s intellectual property rights. Other guarantees or indemnification arrangements include guarantees of product and service performance and standby letters of credit for lease facilities. It is not possible to determine the maximum potential amount under these indemnification obligations due to the limited history of prior indemnification claims and the unique facts and circumstances involved in each particular agreement. To date, we have not incurred any material costs as a result of such obligations and have not accrued any liabilities related to such obligations in the consolidated financial statements. In addition, we indemnify our officers, directors and certain key employees while they are serving in good faith in their respective capacities. To date, there have been no claims under any indemnification provisions.
Note 6. Line of Credit
In August 2014, we entered into a two-year loan and security agreement with a financial institution to provide up to $15.0 million on a revolving line based on 80% of qualifying accounts receivable. Borrowings under this revolving line of credit bear interest at prime rate plus 1%. Interest expense is paid on a monthly basis based on the principle amount outstanding under the line of credit. The revolving line of credit matures in August 2016. Early termination is allowed but subject to a non-refundable termination fee of $300,000 if terminated within the first year or $150,000 if terminated on or after the first year from the effective date of the credit facility.
Borrowings under this line of credit are collateralized by substantially all of our assets, excluding any intellectual property. We are also required to comply with certain financial covenants, including a minimum quarterly revenue target, delivery of financial and other information, as well as limitations on dispositions, mergers, or consolidations and other corporate activities. The terms of our outstanding loan and security agreements also restrict our ability to pay dividends.
As of January 31, 2015 and July 31, 2015, we had no borrowings from this line of credit and we were in compliance with our financial covenants.
Note 7. Convertible Preferred Stock
Convertible preferred stock outstanding as of January 31, 2014 and 2015, and July 31, 2015 consisted of the following:
| January 31, 2014 | ||||||||||||||||
| Convertible Preferred Stock: |
Shares Authorized |
Shares Issued and Outstanding |
Aggregate Liquidation Preference |
Net Proceeds |
||||||||||||
| (in thousands, except share data) | ||||||||||||||||
| Series A |
24,360,000 | 24,360,000 | $ | 5,075 | $ | 5,038 | ||||||||||
| Series B |
30,211,506 | 30,211,506 | 20,000 | 19,925 | ||||||||||||
| Series C |
14,253,774 | 14,253,774 | 30,444 | 30,346 | ||||||||||||
| Series D |
10,584,066 | 10,584,066 | 39,916 | 39,828 | ||||||||||||
| Series E |
25,350,000 | 24,697,064 | 171,187 | 167,833 | ||||||||||||
|
|
|
|
|
|
|
|
|
|||||||||
| Total convertible preferred stock |
104,759,346 | 104,106,410 | $ | 266,622 | $ | 262,970 | ||||||||||
|
|
|
|
|
|
|
|
|
|||||||||
F-18
Table of Contents
PURE STORAGE, INC.
Notes to Consolidated Financial Statements
| January 31, 2015 and July 31, 2015 (unaudited) | ||||||||||||||||
| Convertible Preferred Stock: |
Shares Authorized |
Shares Issued and Outstanding |
Aggregate Liquidation Preference |
Net Proceeds |
||||||||||||
| (in thousands, except share data) | ||||||||||||||||
| Series A |
24,360,000 | 24,360,000 | $ | 5,075 | $ | 5,038 | ||||||||||
| Series B |
30,211,506 | 30,211,506 | 20,000 | 19,925 | ||||||||||||
| Series C |
14,253,774 | 14,253,774 | 30,444 | 30,346 | ||||||||||||
| Series D |
10,584,066 | 10,584,066 | 39,916 | 39,828 | ||||||||||||
| Series E |
24,761,984 | 24,761,984 | 171,637 | 168,283 | ||||||||||||
| Series F |
15,897,337 | 14,307,603 | 225,000 | 220,803 | ||||||||||||
| Series F-1 |
3,811,285 | 3,801,746 | 59,786 | 59,717 | ||||||||||||
|
|
|
|
|
|
|
|
|
|||||||||
| Total convertible preferred stock |
123,879,952 | 122,280,679 | $ | 551,858 | $ | 543,940 | ||||||||||
|
|
|
|
|
|
|
|
|
|||||||||
We recorded the convertible preferred stock at fair value on the dates of issuance, net of issuance costs. Shares of our convertible preferred stock are not currently redeemable. We classify our preferred stock outside of stockholders’ deficit because, in the event of certain “liquidation events” that are not solely within our control (including a greater than 50% change in control, or sale of all or substantially all of our assets), the shares would become redeemable at the option of the holders. We did not adjust the carrying values of the convertible preferred stock to the deemed liquidation values of such shares since a liquidation event was not probable at any of the balance sheet dates. Subsequent adjustments to increase or decrease the carrying values to the ultimate liquidation values will be made only if and when it becomes probable that such a liquidation event will occur.
The holders of our convertible preferred stock have various rights, preferences, and privileges as follows:
Conversion Rights
Each share of Series A, Series B, Series C, Series D, Series E, Series F and Series F-1 convertible preferred stock is convertible, at the option of the holder, into shares of Class B common stock, based on the then-effective applicable conversion rate for each series of convertible preferred stock (1-for-1 but subject to adjustment for certain diluting issuances, as defined). Shares of Series A, Series B, Series C, Series D, Series E, Series F and Series F-1 convertible preferred stock will be automatically converted: (i) upon the election of the holders of at least 70% of the then-outstanding shares of convertible preferred stock, voting together as a single class on an as-converted basis to Class B common stock or (ii) immediately upon the closing of the sale of our Class A common stock in a firm commitment underwritten public offering with gross proceeds to us (before underwriting discounts, commissions, and fees) of at least $30.0 million where our shares have been listed for trading on the New York Stock Exchange, NASDAQ Global Select Market or NASDAQ Global Market.
Adjustment of Conversion Price for Qualifying Dilutive Issuances
In the event we issue additional shares of Class B common stock after the Series F-1 convertible preferred stock original issue date without consideration or for a consideration per share less than the conversion price in effect immediately prior to such issuance, then and in each such event the conversion price would have been reduced to a price equal to such conversion price multiplied by the following fraction:
| • | the numerator of which is equal to the sum of (i) the product of the number of shares of Class B common stock outstanding or deemed to be outstanding immediately prior to such issuance and the conversion price in effect immediately prior to such issuance) and (ii) the product of the number of additional shares of Class B common stock so issued and the average price per share received by us for the additional shares of Class B common stock so issued); and |
F-19
Table of Contents
PURE STORAGE, INC.
Notes to Consolidated Financial Statements
| • | the denominator of which is equal to the number of shares of Class B common stock outstanding or deemed to be outstanding immediately prior to such issuance plus the number of additional shares of Class B common stock so issued. |
Voting Rights
The holders of the convertible preferred stock are entitled to the number of votes equal to the number of shares of Class B common stock into which such convertible preferred stock is convertible.
The holders of convertible preferred stock, voting as a class as-if-converted to common stock, are entitled to elect four members of the board of directors. The holders of common stock, voting as a separate class, are entitled to elect one member of the board of directors. The holders of convertible preferred stock and common stock, voting together as a single class on an as-if-converted basis, are entitled to elect remaining members of the board of directors.
Dividend Rights
Holders of convertible preferred stock are entitled to receive noncumulative dividends at the rate of 8% of their applicable original issue price per share (as adjusted for any stock dividends, combinations, recapitalizations, or stock splits), on a pari passu basis when, as, and if, declared by the board of directors. No dividends will be paid to holders of common stock until the aforementioned dividends on convertible preferred stock have been paid. No dividends have been declared by the board of directors.
Liquidation Preference
Upon our liquidation, dissolution, or winding up or a change in control, whether voluntary or involuntary, the holders of Series F-1 will receive $15.73 per share, plus all declared but unpaid dividends thereon, the holders of Series F will receive $15.73 per share, plus all declared but unpaid dividends thereon, the holders of Series E will receive $6.93 per share, plus all declared but unpaid dividends thereon, the holders of Series D will receive $3.77 per share, plus all declared but unpaid dividends thereon, the holders of Series C will receive $2.14 per share, plus all declared but unpaid dividends thereon, the holders of Series B will receive $0.66 per share, plus all declared but unpaid dividends thereon, and the holders of Series A will receive $0.21 per share, plus all declared but unpaid dividends thereon, on a pari passu basis and prior and in preference to any payment or distribution to holders of common stock. After the aforementioned liquidation preference on the convertible preferred stock have been paid, the remaining assets will be distributed to the holders of the then outstanding common stock.
Redemption Rights
Our convertible preferred stock does not contain any date-certain redemption features.
Note 8. Common Stock and Stockholders’ Deficit
Class A and Class B Common Stock
Our certificate of incorporation authorizes two classes of common stock, Class A and Class B. The rights of the holders of Class A and Class B common stock are identical, except with respect to voting. Each share of Class A common stock is entitled to one vote per share. Each share of Class B common stock is entitled to 10 votes per share. Shares of Class B common stock may be converted to Class A common stock at any time immediately following the closing of the IPO at the option of the stockholder. Shares of Class B common stock
F-20
Table of Contents
PURE STORAGE, INC.
Notes to Consolidated Financial Statements
automatically convert to Class A common stock upon the following: (i) sale or transfer of such share of Class B common stock; (ii) the death of the Class B common stockholder (or nine months after the date of death if the stockholder is one of our founders); and (iii) on the final conversion date, defined as the earlier of (a) the first trading day on or after the date on which the outstanding shares of Class B common stock represent less than 10% of the then outstanding Class A and Class B common stock; (b) the tenth anniversary of the IPO; or (c) the date specified by vote of the holders of a majority of the outstanding shares of Class B common stock, voting as a single class.
Class A and Class B common stock are referred to as common stock throughout the notes to the consolidated financial statements, unless otherwise noted.
Class B Common Stock Reserved for Issuance
We had reserved shares of Class B common stock, on an as-if-converted basis, for future issuance as follows:
| January 31, 2015 | July 31, 2015 | |||||||
| (unaudited) | ||||||||
| Conversion of convertible preferred stock |
122,280,679 | 122,280,679 | ||||||
| Shares underlying outstanding stock options |
54,284,474 | 59,928,620 | ||||||
| Shares reserved for future option grants |
357,884 | 15,102,581 | ||||||
|
|
|
|
|
|||||
| Total |
176,923,037 | 197,311,880 | ||||||
|
|
|
|
|
|||||
Note 9. Equity Incentive Plans
2009 Equity Incentive Plan
In October 2009, we adopted the 2009 Equity Incentive Plan, or the 2009 Plan, for the purpose of granting stock-based awards to employees, directors, and consultants. Stock-based awards granted under the 2009 Plan may be incentive stock options, nonstatutory stock options, restricted stock awards, restricted stock unit awards, and stock appreciation rights. We grant stock options with an exercise price equal to the fair market value of our common stock on the date of the grant, as determined by the board. Our equity awards vest over a period of time as determined by the board, generally two to four years, and expire no later than ten years from the date of grant.
Early Exercise of Stock Options and Promissory Notes
Certain employees and directors have exercised options granted under the 2009 Plan prior to vesting. The unvested shares are subject to a repurchase right held by us at the original purchase price. The proceeds initially are recorded as liability related to early exercised stock options and reclassified to additional paid in capital as the repurchase right lapses. We issued 1,672,320, 642,248 and 642,248 shares of common stock upon early exercise of stock options during the fiscal years ended January 31, 2014 and 2015 and the six months ended July 31, 2014, respectively, for a total exercise proceeds of $2.3 million, $1.9 million and $1.9 million, respectively. No unvested stock options were exercised during the six months ended July 31, 2015. For the fiscal year ended January 31, 2015, we repurchased 50,000 shares of unvested common stock, respectively, related to early exercised stock options at the original purchase price due to the termination of an employee. No shares of common stock related to unvested stock options were repurchased during the fiscal year ended January 31, 2014 and the six months ended July 31, 2015. As of January 31, 2014 and 2015 and July 31, 2015, 3,255,770, 4,710,454 and 3,590,384 shares, respectively, held by employees and directors were subject to repurchase at an aggregate price of $3.0 million, $6.5 million. and $5.4 million, respectively.
F-21
Table of Contents
PURE STORAGE, INC.
Notes to Consolidated Financial Statements
We entered into promissory notes with certain of our executives and employees in connection with the exercise of their stock option awards. These notes bore fixed interest rates ranging from 0.95% to 1.84% per annum. As of January 31, 2014, outstanding promissory notes were $3.2 million and 6,295,056 shares of common stock were outstanding from stock options exercised via promissory notes. As the promissory notes were solely collateralized by the underlying common stock, they are considered nonrecourse from an accounting standpoint and therefore, stock options exercised via nonrecourse promissory notes are not considered outstanding shares. Accordingly, as of January 31, 2014, we did not record these transactions related to promissory notes. During the fiscal year ended January 31, 2015, an additional 300,000 stock options were early exercised via a nonrecourse promissory note in the amount of $773,000, which was also not recorded in our financial statements. All outstanding promissory notes and the related accrued interest, which totaled $4.0 million, were repaid in full as of January 31, 2015, and accordingly, the underlying common stock was recorded as outstanding shares. Proceeds from the repayment of promissory notes were included in additional paid-in capital for the portion of the underlying common stock that was vested, and in liability related to early exercised stock options for the portion of the underlying common stock that was unvested.
A summary of activity under the 2009 Plan and related information is as follows:
| Options Outstanding | ||||||||||||||||
| Number of Shares |
Weighted- Average Exercise Price |
Weighted- Average Remaining Contractual Life (Years) |
Aggregate Intrinsic Value |
|||||||||||||
| (in thousands) | ||||||||||||||||
| Balance as of January 31, 2014 |
44,984,410 | $ | 1.35 | 8.8 | $ | 73,376 | ||||||||||
| Options granted |
17,026,000 | 6.82 | ||||||||||||||
| Options exercised |
(5,583,934 | ) | 1.16 | |||||||||||||
| Options canceled |
(2,142,002 | ) | 2.89 | |||||||||||||
|
|
|
|||||||||||||||
| Balance as of January 31, 2015 |
54,284,474 | $ | 3.02 | 8.3 | $ | 523,654 | ||||||||||
| Options granted (unaudited) |
8,396,325 | 14.33 | ||||||||||||||
| Options exercised (unaudited) |
(1,311,157 | ) | 2.29 | |||||||||||||
| Options canceled (unaudited) |
(1,441,022 | ) | 7.03 | |||||||||||||
|
|
|
|||||||||||||||
| Balance as of July 31, 2015 (unaudited) |
59,928,620 | $ | 4.53 | 8.1 | $ | 816,992 | ||||||||||
|
|
|
|||||||||||||||
| Vested and exercisable as of January 31, 2015 |
15,541,142 | $ | 0.91 | 7.2 | $ | 182,688 | ||||||||||
| Vested and expected to vest as of January 31, 2015 |
52,787,432 | $ | 3.00 | |
8.3 |
|
$ | 510,479 | ||||||||
| Vested and exercisable as of July 31, 2015 (unaudited) |
19,530,313 | $ | 1.32 | 6.9 | $ | 328,967 | ||||||||||
| Vested and expected to vest as of July 31, 2015 (unaudited) |
58,130,895 | $ | 4.48 | 8.1 | $ | 795,276 | ||||||||||
Of the 5,583,934 shares of common stock issued upon the exercise of stock options during the fiscal year ended January 31, 2015, 2,216,024 shares were exercised with cash, 300,000 shares were exercised with nonrecourse promissory notes and 3,067,910 shares were cashless exercised during the tender offer (see “Repurchase of Common Stock in Connection with Tender Offers”). All common stock issued upon the exercise of stock options during the six months ended July 31, 2015 were exercised with cash.
The aggregate intrinsic value of options exercised for the fiscal years ended January 31, 2014 and 2015 and six months ended July 31, 2014 and 2015 was $8.5 million, $43.2 million, $39.3 million and $16.8 million, respectively.
F-22
Table of Contents
PURE STORAGE, INC.
Notes to Consolidated Financial Statements
The weighted-average grant date fair value of options granted was $1.50, $5.71, $5.11 and $8.36 per share for the fiscal years ended January 31, 2014 and 2015 and the six months ended July 31, 2014 and 2015, respectively. The total grant date fair value of options vested for the fiscal years ended January 31, 2014 and 2015 and the six months ended July 31, 2014 and 2015 was $3.5 million, $9.9 million, $4.2 million and $14.3 million, respectively.
As of January 31, 2015 and July 31, 2015, total unrecognized employee compensation cost, net of estimated forfeitures, was $110.1 million and $146.7 million, which is expected to be recognized over a weighted-average period of approximately 3.58 years and 3.61 years. To the extent the actual forfeiture rate is different from what we have estimated, stock-based compensation related to these awards will be different from our expectations.
During the fiscal years ended January 31, 2014 and 2015 and the six months ended July 31, 2014 and 2015, we granted options to purchase 3,883,654, 499,750, 325,000 and 83,000 shares of common stock, respectively, that vest upon satisfaction of a performance condition. For all the options that vest upon satisfaction of a performance condition, management determined it is probable that the performance condition will be satisfied and, accordingly, the related stock-based compensation of $596,000, $1.7 million, $727,000 and $954,000 was recognized during the fiscal years ended January 31, 2014 and 2015 and the six months ended July 31, 2014 and 2015, respectively.
Determination of Fair Value
The fair value of stock options granted to employees is estimated on the grant date using the Black-Scholes option pricing model. This valuation model for stock-based compensation expense requires us to make assumptions and judgments about the variables used in the calculation including the fair value of the underlying common stock, expected term, the expected volatility of the common stock, a risk-free interest rate and expected dividend yield.
We estimate the fair value of employee stock options using a Black-Scholes option pricing model with the following assumptions:
| Fiscal Year Ended January 31, | Six Months Ended July 31, | |||||||||||||||
| 2014 | 2015 | 2014 | 2015 | |||||||||||||
| (unaudited) | ||||||||||||||||
| Expected term (in years) |
5.3 - 7.3 | 5.0 - 6.9 | 5.4 - 6.9 | 6.0 - 7.4 | ||||||||||||
| Expected volatility |
65% - 69% | 55% - 68% | 67% - 68% | 48% - 52% | ||||||||||||
| Risk-free interest rate |
0.8% - 2.1% | 1.3% - 2.2% | 2.0% - 2.2% | 1.5% - 1.9% | ||||||||||||
| Dividend rate |
— | — | — | — | ||||||||||||
| Fair value of common stock |
$1.46 - $2.98 | $4.81 - $12.65 | $4.81 - $9.40 | $14.12 - $18.16 | ||||||||||||
The assumptions used in the Black-Scholes option pricing model were determined as follows.
Fair Value of Common Stock—Given the absence of a public trading market, our board of directors considered numerous objective and subjective factors to determine the fair value of our common stock at each grant date. These factors included, but were not limited to (i) contemporaneous third-party valuations of common stock; (ii) the prices for our preferred stock sold to outside investors; (iii) the rights and preferences of convertible preferred stock relative to common stock; (iv) the lack of marketability of our common stock; (v) developments in the business; and (vi) the likelihood of achieving a liquidity event, such as an IPO or sale of Pure Storage, given prevailing market conditions.
F-23
Table of Contents
PURE STORAGE, INC.
Notes to Consolidated Financial Statements
Expected Term—The expected term represents the period that our stock-based awards are expected to be outstanding. The expected term assumptions were determined based on the vesting terms, exercise terms and contractual lives of the options.
Expected Volatility—Since we do not have a trading history of our common stock, the expected volatility is derived from the average historical stock volatilities of several public companies within the same industry that we consider to be comparable to our business over a period equivalent to the expected term of the stock option grants.
Risk-Free Interest Rate—The risk-free interest rate is based on the U.S. Treasury yield curve in effect at the time of grant for zero-coupon U.S. Treasury notes with maturities approximately equal to the option’s expected term.
Dividend Rate—We have never declared or paid any cash dividends and do not plan to pay cash dividends in the foreseeable future, and, therefore, use an expected dividend yield of zero.
Non-Employee Stock Option Awards
We estimate the fair value of non-employee stock options on the date of grant using a Black-Scholes option pricing model with the following assumptions:
| Fiscal Year Ended January 31, |
Six Months Ended July 31, |
|||||||||||
| 2014 | 2015 | 2014 | ||||||||||
| Expected term (in years) |
10.0 | 10.0 | 10.0 | |||||||||
| Expected volatility |
62% - 65% | 62% - 63% | 62% | |||||||||
| Risk-free interest rate |
1.1% - 2.6% | 1.6% - 2.6% | 2.5% | |||||||||
| Dividend rate |
— | — | — | |||||||||
| Fair value of common stock |
$1.79 - $2.98 | $9.40 - $12.40 | $9.40 | |||||||||
For the fiscal years ended January 31, 2014 and 2015 and six months ended July 31, 2014, we granted non-employee stock options to purchase 1,126,400, 83,500, and 7,500 shares of common stock, respectively. No stock options were granted to non-employee during the six months ended July 31, 2015. We recognized stock-based compensation related to non-employee stock options of $1.1 million, $2.5 million, $1.4 million and $882,000 for the fiscal years ended January 31, 2014 and 2015 and the six months ended July 31, 2014 and 2015, respectively.
Restricted Stock Awards
At the inception of Pure Storage, we issued 18,300,000 shares of common stock to our founders under restricted stock agreements at a grant date fair value of $0.0005 per share that vested over four years. The unvested shares are subject to a repurchase right held by us at the original purchase price.
For the fiscal year ended January 31, 2014, 2,812,500 shares of our restricted stock awards vested, and the related stock-based compensation was immaterial. All restricted stock awards were fully vested as of January 31, 2014.
Repurchase of Common Stock in Connection with Tender Offers
In November 2013, our board of directors approved a tender offer which allowed our employees to sell fully vested shares of common stock or unexercised stock options to the company. We repurchased 1,442,098 shares
F-24
Table of Contents
PURE STORAGE, INC.
Notes to Consolidated Financial Statements
of common stock and 1,603,536 vested stock options from participating employees for a total consideration of $20.5 million, net of exercise proceeds of $640,000. The common stock repurchased was retired immediately thereafter. Of the $20.5 million total consideration, the fair value of the shares tendered net of exercise proceeds, was recorded in accumulated deficit, which totaled $7.2 million, while the amounts paid in excess of the fair value of our common stock at the time of repurchase were recorded as stock-based compensation expense, which totaled $13.3 million.
In July 2014, our board of directors approved another tender offer which allowed our employees to sell fully vested shares of common stock or unexercised stock options to the company. We repurchased 735,426 shares of common stock and 3,067,910 vested stock options from participating employees for a total consideration of $57.7 million, net of exercise proceeds of $2.1 million. The common stock repurchased was retired immediately thereafter. Of the $57.7 million total consideration, the fair value of the shares tendered net of exercise proceeds, was recorded in accumulated deficit, which totaled $30.1 million, while the amounts paid in excess of the fair value of our common stock at the time of repurchase were recorded as stock-based compensation expense, which totaled $27.6 million.
Stock-Based Compensation Expense
The following table summarizes the components of stock-based compensation expense recognized in the consolidated statements of operations (in thousands):
| Fiscal Year Ended January 31, |
Six Months Ended July 31, |
|||||||||||||||
| 2014 | 2015 | 2014 | 2015 | |||||||||||||
| (unaudited) | ||||||||||||||||
| Cost of revenue—product |
$ | 253 | $ | 303 | $ | 229 | $ | 96 | ||||||||
| Cost of revenue—support |
316 | 1,273 | 898 | 854 | ||||||||||||
| Research and development |
11,477 | 22,512 | 15,147 | 10,429 | ||||||||||||
| Sales and marketing |
9,014 | 22,466 | 17,361 | 5,980 | ||||||||||||
| General and administrative |
506 | 6,479 | 4,508 | 3,300 | ||||||||||||
|
|
|
|
|
|
|
|
|
|||||||||
| Total stock-based compensation |
$ | 21,566 | $ | 53,033 | $ | 38,143 | $ | 20,659 | ||||||||
|
|
|
|
|
|
|
|
|
|||||||||
The stock-based compensation expense for the fiscal years ended January 31, 2014 and 2015 and the six months ended July 31, 2014 had two primary components: (1) stock-based compensation of $8.3 million, $25.4 million, and $10.5 million related to the granting of stock options and restricted stock awards and (2) stock-based compensation of $13.3 million, $27.6 million, and $27.6 million related to the repurchase of common stock in excess of fair value related to the tender offers. The stock-based compensation expense for the six months ended July 31, 2015 were related to the granting of stock options and restricted stock awards.
Note 10. Net Loss Per Share Attributable to Common Stockholders
Basic and diluted net loss per share attributable to common stockholders is presented in conformity with the two-class method required for participating securities. We consider all series of our convertible preferred stock to be participating securities. Under the two-class method, the net loss attributable to common stockholders is not allocated to the convertible preferred stock as the holders of our convertible preferred stock do not have a contractual obligation to share in our losses.
Basic net loss per share attributable to common stockholders is computed by dividing the net loss by the weighted-average number of shares of common stock outstanding during the period, less shares subject to
F-25
Table of Contents
PURE STORAGE, INC.
Notes to Consolidated Financial Statements
repurchase. The diluted net loss per share attributable to common stockholders is computed by giving effect to all potential dilutive common stock equivalents outstanding for the period. For purposes of this calculation, convertible preferred stock, stock options, restricted stock awards and early exercised stock options are considered to be common stock equivalents but have been excluded from the calculation of diluted net loss per share attributable to common stockholders as their effect is anti-dilutive.
The rights, including the liquidation and dividend rights, of the holders of our Class A and Class B common stock are identical, except with respect to voting. As the liquidation and dividend rights are identical, the undistributed earnings are allocated on a proportionate basis and the resulting net loss per share attributed to common stockholders will, therefore, be the same for both Class A and Class B common stock on an individual or combined basis. We did not present dilutive net loss per share on an if-converted basis because the impact was not dilutive.
The following table sets forth the computation of basic and diluted net loss per share attributable to common stockholders (in thousands, except per share data):
| Fiscal Year Ended January 31, |
Six Months Ended July 31, |
|||||||||||||||
| 2014 | 2015 | 2014 | 2015 | |||||||||||||
| (unaudited) | ||||||||||||||||
| Net loss |
$ | (78,561 | ) | $ | (183,231 | ) | $ | (95,199) | $ | (112,957) | ||||||
|
|
|
|
|
|
|
|
|
|||||||||
| Weighted-average shares used in computing net loss per share attributable to common stockholders, basic and diluted |
24,237 | 27,925 | 25,976 | 33,154 | ||||||||||||
|
|
|
|
|
|
|
|
|
|||||||||
| Net loss per share attributable to common stockholders, basic and diluted |
$ | (3.24 | ) | $ | (6.56 | ) | $ | (3.66 | ) | $ | (3.41 | ) | ||||
|
|
|
|
|
|
|
|
|
|||||||||
The following weighted-average outstanding shares of common stock equivalents were excluded from the computation of diluted net loss per share attributable to common stockholders for the periods presented because including them would have been anti-dilutive (in thousands):
| Fiscal Year Ended January 31, |
Six Months Ended July 31, |
|||||||||||||||
| 2014 | 2015 | 2014 | 2015 | |||||||||||||
| (unaudited) | ||||||||||||||||
| Convertible preferred stock (on an if-converted basis) |
90,103 | 117,794 | 113,247 | 122,281 | ||||||||||||
| Stock options to purchase common stock |
33,715 | 50,429 | 49,138 | 57,358 | ||||||||||||
| Early exercised stock options and restricted stock awards |
9,768 | 8,047 | 9,741 | 4,119 | ||||||||||||
|
|
|
|
|
|
|
|
|
|||||||||
| Total |
133,586 | 176,270 | 172,126 | 183,758 | ||||||||||||
|
|
|
|
|
|
|
|
|
|||||||||
Unaudited Pro Forma Net Loss per Share Attributable to Common Stockholders
In contemplation of an IPO, we have presented the unaudited pro forma basic and diluted net loss per share attributable to common stockholders for the fiscal year ended January 31, 2015 and the six months ended July 31, 2015 which has been computed to give effect to the conversion of our convertible preferred stock into Class B common stock (using the if-converted method) as though the conversion had occurred as of the beginning of the period or on the original date of issuance, if later. The pro forma net loss per share attributable to common stockholders does not include shares being offered in the assumed IPO.
F-26
Table of Contents
PURE STORAGE, INC.
Notes to Consolidated Financial Statements
The following table sets forth the computation of our unaudited pro forma basic and diluted net loss per share attributable to common stockholders for the fiscal year ended January 31, 2015 and the six months ended July 31, 2015 (in thousands, except per share data):
| Fiscal Year Ended January 31, 2015 |
Six Months Ended July 31, 2015 |
|||||||
| (unaudited) | ||||||||
| Net loss used in computing pro forma net loss per share attributable to common stockholders, basic and diluted |
$ | (183,231 | ) | $ | (112,957) | |||
|
|
|
|
|
|||||
| Weighted-average shares used in computing net loss per share attributable to common stockholders, basic and diluted |
27,925 | 33,154 | ||||||
| Pro forma adjustment to reflect assumed conversion of convertible preferred stock |
117,794 | 122,281 | ||||||
|
|
|
|
|
|||||
| Weighted-average shares used in computing pro forma net loss per share attributable to common stockholders, basic and diluted |
145,719 | 155,435 | ||||||
|
|
|
|
|
|||||
| Pro forma net loss per share attributable to common stockholders, basic and diluted |
$ | (1.26 | ) | $ | (0.73 | ) | ||
|
|
|
|
|
|||||
Note 11. Income Taxes
The geographical breakdown of income (loss) before provision for income taxes is as follows (in thousands):
| Fiscal Year Ended January 31, | Six Months Ended July 31, | |||||||||||||||
| 2014 | 2015 | 2014 | 2015 | |||||||||||||
| (unaudited) | ||||||||||||||||
| Domestic |
$ | (79,588 | ) | $ | (186,922 | ) | $ | (95,840) | $ | (109,480) | ||||||
| International |
1,318 | 5,028 | 898 | (3,263 | ) | |||||||||||
|
|
|
|
|
|
|
|
|
|||||||||
| Total |
$ | (78,270 | ) | $ | (181,894 | ) | $ | (94,942 | ) | $ | (112,743 | ) | ||||
|
|
|
|
|
|
|
|
|
|||||||||
The components of the provision for income taxes are as follows (in thousands):
| Fiscal Year Ended January 31, | Six Months Ended July 31, | |||||||||||||||
| 2014 | 2015 | 2014 | 2015 | |||||||||||||
| (unaudited) | ||||||||||||||||
| Current: |
||||||||||||||||
| Federal |
$ | — | $ | — | $ | — | $ | — | ||||||||
| State |
37 | 56 | 28 | 54 | ||||||||||||
| Foreign |
162 | 1,073 | 229 | 160 | ||||||||||||
|
|
|
|
|
|
|
|
|
|||||||||
| Total |
199 | 1,129 | 257 | 214 | ||||||||||||
|
|
|
|
|
|
|
|
|
|||||||||
| Deferred: |
||||||||||||||||
| Foreign |
92 | 208 | — | — | ||||||||||||
|
|
|
|
|
|
|
|
|
|||||||||
| Total provision for income taxes |
$ | 291 | $ | 1,337 | $ | 257 | $ | 214 | ||||||||
|
|
|
|
|
|
|
|
|
|||||||||
F-27
Table of Contents
PURE STORAGE, INC.
Notes to Consolidated Financial Statements
The reconciliation of the statutory federal statutory income tax and effective income tax rate is as follows:
| Fiscal Year Ended January 31, | ||||||||
| 2014 | 2015 | |||||||
| (in thousands) | ||||||||
| Tax at federal statutory rate |
$ | (26,611 | ) | $ | (61,844 | ) | ||
| State tax, net of federal benefit |
32 | 44 | ||||||
| Stock-based compensation expense |
1,570 | 5,328 | ||||||
| Research and development tax credits |
(1,036 | ) | (1,999 | ) | ||||
| Foreign rate differential |
(194 | ) | (429 | ) | ||||
| Change in valuation allowance |
26,152 | 60,042 | ||||||
| Other |
378 | 195 | ||||||
|
|
|
|
|
|||||
| Provision for income taxes |
$ | 291 | $ | 1,337 | ||||
|
|
|
|
|
|||||
Deferred income taxes reflect the net effects of temporary differences between the carrying amounts of assets and liabilities for financial reporting purposes and the amounts used for income tax purposes. The significant component of our deferred tax assets and liabilities were as follows:
| January 31, | ||||||||
| 2014 | 2015 | |||||||
| (in thousands) | ||||||||
| Deferred tax assets: |
||||||||
| Net operating loss carryforwards |
$ | 43,769 | $ | 101,815 | ||||
| Tax credit carryover |
2,865 | 6,136 | ||||||
| Accruals and reserves |
332 | 729 | ||||||
| Deferred revenue |
272 | 3,538 | ||||||
| Stock-based compensation |
1,146 | 4,258 | ||||||
| Depreciation and amortization |
445 | 2,054 | ||||||
|
|
|
|
|
|||||
| Total deferred tax assets |
48,829 | 118,530 | ||||||
| Deferred tax liabilities: |
||||||||
| Deferred commissions |
(2,641 | ) | (5,924 | ) | ||||
|
|
|
|
|
|||||
| Total deferred tax liabilities |
(2,641 | ) | (5,924 | ) | ||||
| Valuation allowance |
(46,280 | ) | (112,906 | ) | ||||
|
|
|
|
|
|||||
| Net deferred tax liabilities, net of valuation allowance |
$ | (92 | ) | $ | (300 | ) | ||
|
|
|
|
|
|||||
As of January 31, 2015, the undistributed earnings of $2.2 million from non-U.S. operations held by our foreign subsidiaries are designated as permanently reinvested outside the U.S. Accordingly, no additional U.S. income taxes or additional foreign withholding taxes have been provided thereon. Determination of the amount of unrecognized deferred tax liability related to these earnings is not practicable.
As of January 31, 2015, we had net operating loss carryforwards for federal income tax purposes of approximately $300.0 million and state income tax purposes of approximately $308.4 million. These net operating loss carryforwards will expire, if not utilized, beginning in 2029 for federal and state income tax purposes. As of January 31, 2015, approximately $26.1 million of federal net operating loss carryforwards and $28.8 million of state net operating loss carryforwards are related to excess tax benefits from stock-based compensation. The tax benefits associated with net operating losses attributed to stock-based compensation will be credited to additional paid-in capital when realized.
F-28
Table of Contents
PURE STORAGE, INC.
Notes to Consolidated Financial Statements
We had federal and state research and development tax credit carryforwards of approximately $4.9 million and $4.9 million as of January 31, 2015. The federal research and development tax credit carryforwards will expire commencing in 2029, while the state tax credit carryforwards have no expiration date.
Realization of deferred tax assets is dependent on future taxable income, the existence and timing of which is uncertain. Based on our history of losses, management has determined it cannot conclude that it is more likely than not that the U.S. deferred tax assets will not be realized, and accordingly has placed a full valuation allowance on the net U.S. deferred tax assets. The valuation allowance increased by $28.8 million and $66.6 million during the fiscal years ended January 31, 2014 and 2015.
Utilization of the net operating loss carryforwards and credits may be subject to substantial annual limitation due to the ownership change limitations provided by Section 382 of the Internal Revenue Code of 1986, as amended, and similar state provisions. The annual limitation may result in the expiration of net operating losses and credits before utilization.
Uncertain Tax Positions
The activity related to the unrecognized tax benefits is as follows:
| January 31, | ||||||||
| 2014 | 2015 | |||||||
| (in thousands) | ||||||||
| Gross unrecognized tax benefits—beginning balance |
$ | 479 | $ | 4,676 | ||||
| Decreases related to tax positions taken during prior years |
(10 | ) | — | |||||
| Increases related to tax positions taken during current year |
4,207 | 9,198 | ||||||
|
|
|
|
|
|||||
| Gross unrecognized tax benefits—ending balance |
$ | 4,676 | $ | 13,874 | ||||
|
|
|
|
|
|||||
As of January 31, 2015, our gross unrecognized tax benefit is approximately $13.9 million and if recognized, it would have no impact to the effective tax rate.
As of January 31, 2015, we had no current or cumulative interest and penalties related to uncertain tax positions.
It is difficult to predict the final timing and resolution of any particular uncertain tax position. Based on our assessment, including experience and complex judgments about future events, we do not expect that changes in the liability for unrecognized tax benefits during the next twelve months will have a significant impact on our consolidated financial position or results of operations.
We file income tax returns in the U.S. federal jurisdiction as well as many U.S. states and foreign jurisdictions. The tax years 2011 to 2013 remain open to examination by the major jurisdictions in which we are subject to tax. Fiscal years outside the normal statute of limitation remain open to audit by tax authorities due to tax attributes generated in those early years, which have been carried forward and may be audited in subsequent years when utilized.
Note 12. Segment Information
Our chief operating decision maker is a group which is comprised of our Chief Executive Officer, our President and our Chief Financial Officer. This group reviews financial information presented on a consolidated
F-29
Table of Contents
PURE STORAGE, INC.
Notes to Consolidated Financial Statements
basis for purposes of allocating resources and evaluating financial performance. We have one business activity and there are no segment managers who are held accountable for operations or operating results. Accordingly, we have a single reportable segment.
The following table sets forth revenue by geographic area based on the billing address of our customers:
| Fiscal Year Ended January 31, |
Six Months Ended July 31, |
|||||||||||||||
| 2014 | 2015 | 2014 | 2015 | |||||||||||||
| (unaudited) | ||||||||||||||||
| (in thousands) | ||||||||||||||||
| United States |
$ | 32,301 | $ | 134,920 | $ | 45,270 | $ | 124,277 | ||||||||
| Rest of the world |
10,432 | 39,531 | 14,142 | 34,461 | ||||||||||||
|
|
|
|
|
|
|
|
|
|||||||||
| Total revenue |
$ | 42,733 | $ | 174,451 | $ | 59,412 | $ | 158,738 | ||||||||
|
|
|
|
|
|
|
|
|
|||||||||
No country outside of the United States comprised 10% or greater of our revenue for the fiscal years ended January 31, 2014 and 2015 and the six months ended July 31, 2014 and 2015.
Long-lived assets by geographic area are summarized as follows:
| January 31, | July 31, 2015 |
|||||||||||
| 2014 | 2015 | |||||||||||
| (unaudited) | ||||||||||||
| (in thousands) | ||||||||||||
| United States |
$ | 12,019 | $ | 39,069 | $ | 46,903 | ||||||
| Rest of the world |
134 | 790 | 1,101 | |||||||||
|
|
|
|
|
|
|
|||||||
| Total long-lived assets |
$ | 12,153 | $ | 39,859 | $ | 48,004 | ||||||
|
|
|
|
|
|
|
|||||||
Note 13. 401(k) Plan
We have a 401(k) savings plan (the 401(k) plan) which qualifies as a deferred salary arrangement under section 401(k) of the internal revenue code. Under the 401(k) plan, participating employees may elect to contribute up to 100% of their eligible compensation, subject to certain limitations. We have not made any matching contributions to date.
Note 14. Related-Party Transactions
In the normal course of business, we enter into transactions with related parties.
Relationship with Workday
Mr. Bhusri, a member of our board of directors, is the Chief Executive Officer and a member of the board of directors of Workday, Inc. Workday has purchased products and related support from us through a channel partner and we recognized revenue of $2.1 million and $199,000 during the fiscal year ended January 31, 2015 and the six months ended July 31, 2015, respectively. We purchased approximately $370,000 and $330,000 of Workday’s products and related services in the fiscal year ended January 31, 2015 and the six months ended July 31, 2015.
F-30
Table of Contents
PURE STORAGE, INC.
Notes to Consolidated Financial Statements
Relationship with ServiceNow
Mr. Slootman, a member of our board of directors, is the President, Chief Executive Officer and a member of the board of directors of ServiceNow, Inc. ServiceNow has purchased products and related support from us through a channel partner and we recognized revenue of $165,000, $37,500 and $605,000 during the fiscal years ended January 31, 2014 and 2015 and the six months ended July 31, 2015, respectively. We purchased approximately $50,000 and $50,000 of ServiceNow’s products and related services in the fiscal year ended January 31, 2015 and the six months ended July 31, 2015, respectively.
Note 15. Subsequent Events
We evaluated subsequent events through May 15, 2015, the date on which consolidated financial statements for the fiscal year ended January 31, 2015 were issued.
For the six months ended July 31, 2015, we evaluated subsequent events through September 9, 2015, the date on which the interim consolidated financial statements were issued (unaudited).
In August 2015, our board of directors and stockholders approved, and we filed, a certificate of amendment to our amended and restated certificate of incorporation, or the certificate of amendment, to increase the number of authorized shares of Class A common stock to 2,000,000,000.
In August 2015, our board of directors adopted, and in September 2015 our stockholders approved, the 2015 Equity Incentive Plan, or the 2015 Plan, which will become effective upon the execution of the underwriting agreement in connection with an initial public offering. A total of 27,000,000 shares of our Class A common stock have been reserved for issuance under the 2015 Plan.
In August 2015, our board of directors adopted and our stockholders approved, the 2015 Employee Stock Purchase Plan, or the ESPP, which will become effective upon the execution of the underwriting agreement in connection with an initial public offering. A total of 3,500,000 shares of our Class A common stock have been reserved for issuance under the ESPP.
In August 2015, we entered into certain lease agreements for office facilities with total lease obligations of approximately $19.7 million with lease periods expiring through 2023. In connection with these leases, we are required to maintain letters of credit up to $3.3 million.
In September 2015, we issued 700,000 shares of our Class B common stock to the Pure Good Foundation. We anticipate that we will incur a non-cash general and administrative expense in the quarter ending October 31, 2015 equal to the fair value of the shares of Class B common stock issued to the Pure Good Foundation.
F-31
Table of Contents

We are over 1,000 passionate entrepreneurs
on
a mission to prove that storage
isn’t just a place to put things —
it’s a powerful force to
be unleashed with flash.
Table of Contents

Table of Contents
PART II
INFORMATION NOT REQUIRED IN PROSPECTUS
Item 13. Other Expenses of Issuance and Distribution
The following table sets forth all expenses, other than underwriting discounts and commissions, payable by us in connection with the sale of the Class A common stock being registered. All the amounts shown are estimates except the SEC registration fee, the FINRA filing fee and the exchange listing fee.
| Item |
Amount | |||
| SEC registration fee |
$ | 34,860 | ||
| FINRA filing fee |
45,500 | |||
| Exchange listing fee |
* | |||
| Legal fees and expenses |
* | |||
| Accounting fees and expenses |
* | |||
| Printing and engraving expenses |
* | |||
| Transfer agent and registrar fees |
* | |||
| Miscellaneous fees and expenses |
* | |||
|
|
|
|||
| Total |
$ | * | ||
|
|
|
|||
| * | To be filed by amendment. |
Item 14. Indemnification of Directors and Officers
Section 145 of the Delaware General Corporation Law authorizes a court to award, or a corporation’s board of directors to grant, indemnity to directors and officers in terms sufficiently broad to permit such indemnification under certain circumstances for liabilities, including reimbursement for expenses incurred, arising under the Securities Act. Our amended and restated certificate of incorporation that will be in effect upon the closing of this offering permits indemnification of our directors, officers, employees and other agents to the maximum extent permitted by the Delaware General Corporation Law, and our amended and restated bylaws that will be in effect upon the closing of this offering provide that we will indemnify our directors and officers and permit us to indemnify our employees and other agents, in each case to the maximum extent permitted by the Delaware General Corporation Law.
We have entered into indemnification agreements with our directors and officers, whereby we have agreed to indemnify our directors and officers to the fullest extent permitted by law, including indemnification against expenses and liabilities incurred in legal proceedings to which the director or officer was, or is threatened to be made, a party by reason of the fact that such director or officer is or was a director, officer, employee or agent of Pure Storage, provided that such director or officer acted in good faith and in a manner that the director or officer reasonably believed to be in, or not opposed to, the best interest of Pure Storage. At present, there is no pending litigation or proceeding involving a director or officer of Pure Storage regarding which indemnification is sought, nor is the registrant aware of any threatened litigation that may result in claims for indemnification.
We maintain insurance policies that indemnify our directors and officers against various liabilities arising under the Securities Act and the Securities Exchange Act of 1934, as amended, that might be incurred by any director or officer in his capacity as such.
The underwriters are obligated, under certain circumstances, pursuant to the underwriting agreement to be filed as Exhibit 1.1 hereto, to indemnify us and our officers and directors against liabilities under the Securities Act.
II-1
Table of Contents
Item 15. Recent Sales of Unregistered Securities
The following sets forth information regarding all unregistered securities sold since February 1, 2012:
Sales of Preferred Stock
| (1) | In August 2012, we sold an aggregate of 10,584,066 shares of Series D preferred stock to a total of 53 accredited investors at a purchase price per share of $3.7713 for an aggregate purchase price of $39,916,041. |
| (2) | In August 2013, we sold an aggregate of 21,640,332 shares of Series E preferred stock to a total of 57 accredited investors at a purchase price per share of $6.9315 for an aggregate purchase price of $149,999,961. |
| (3) | In September 2013, we sold 68,928 shares of Series E preferred stock to one accredited investor at a purchase price of $6.2384 for an aggregate purchase price of $429,997. |
| (4) | In September 2013, we sold 1,969,266 shares of Series E preferred stock to a total of seven accredited investors at a purchase price of $6.9315 for an aggregate purchase price of $13,649,967. |
| (5) | In October 2013, we sold an aggregate of 1,018,538 shares of Series E preferred stock to a total of three accredited investors at a purchase price per share of $6.9315 for an aggregate purchase price of $7,059,996. |
| (6) | In April 2014, we sold an aggregate of 14,307,603 shares of Series F preferred stock to a total of 84 accredited investors at a purchase price per share of $15.7259 for an aggregate purchase price of $224,999,934. |
| (7) | In June 2014, we sold 21,640 shares of Series E preferred stock to one accredited investor at a purchase price per share of $6.9315 for an aggregate purchase price of $149,998. |
| (8) | In June 2014, we sold an aggregate of 3,795,388 shares of Series F-1 preferred stock to a total of nine accredited investors at a purchase price per share of $15.7259 for an aggregate purchase price of $59,685,892. |
| (9) | In July 2014, we sold an aggregate of 6,358 shares of Series F-1 preferred stock to a total of two accredited investors at a purchase price per share of $15.7259 for an aggregate purchase price of $99,985. |
| (10) | In September 2014, we sold 21,640 shares of Series E preferred stock to one accredited investor at a purchase price per share of $6.9315 for an aggregate purchase price of $149,998. |
| (11) | In November 2014, we sold 21,640 shares of Series E preferred stock to one accredited investor at a purchase price per share of $6.9315 for an aggregate purchase price of $149,998. |
Option and Common Stock Issuances
| (12) | In September, 2015, we issued 700,000 shares of our Class B common stock to the Pure Good Foundation. |
| (13) | From February 1, 2012 through July 31, 2015, we granted to certain employees, consultants and directors options to purchase an aggregate of 66,116,609 shares of Class B common stock under our 2009 Plan, at exercise prices ranging from $0.49 to $18.16 per share. |
| (14) | From February 1, 2012 through July 31, 2015, we issued and sold an aggregate of 17,881,318 shares of Class B common stock upon the exercise of options under our 2009 Plan at exercise prices ranging from $0.0002 to $9.65, per share, for an aggregate exercise price of $16,790,736. |
II-2
Table of Contents
The offers, sales, and issuances of the securities described in paragraphs 1 through 12 above were deemed to be exempt from registration under the Securities Act in reliance on Section 4(2) of the Securities Act or Regulation D promulgated thereunder as transactions by an issuer not involving a public offering. The recipients of securities in each of these transactions acquired the securities for investment only and not with a view to or for sale in connection with any distribution thereof and appropriate legends were affixed to the securities issued in these transactions. Each of the recipients of securities in these transactions was an accredited or sophisticated person and had adequate access, through employment, business or other relationships, to information about us.
The offers, sales and issuances of the securities described in paragraphs 13 and 14 above were deemed to be exempt from registration under the Securities Act under Rule 701 promulgated under the Securities Act as offers and sale of securities pursuant to certain compensatory benefit plans and contracts relating to compensation in compliance with Rule 701.
Item 16. Exhibits and Financial Statement Schedules.
(a) Exhibits.
See Exhibit Index immediately following the signature page.
(b) Financial Statement Schedules.
See index to financial statements on page F-1. All schedules have been omitted because they are not required or are not applicable.
Item 17. Undertakings
The undersigned Registrant hereby undertakes to provide to the underwriters at the closing specified in the underwriting agreement, certificates in such denominations and registered in such names as required by the underwriters to permit prompt delivery to each purchaser.
Insofar as indemnification for liabilities arising under the Securities Act may be permitted to directors, officers and controlling persons of the Registrant pursuant to the foregoing provisions, or otherwise, the Registrant has been advised that in the opinion of the Securities and Exchange Commission such indemnification is against public policy as expressed in the Securities Act and is, therefore, unenforceable. In the event that a claim for indemnification against such liabilities (other than the payment by the Registrant of expenses incurred or paid by a director, officer or controlling person of the Registrant in the successful defense of any action, suit or proceeding) is asserted by such director, officer or controlling person in connection with the securities being registered, the Registrant will, unless in the opinion of its counsel the matter has been settled by controlling precedent, submit to a court of appropriate jurisdiction the question whether such indemnification by it is against public policy as expressed in the Securities Act and will be governed by the final adjudication of such issue.
The undersigned Registrant hereby undertakes that:
| (1) | For purposes of determining any liability under the Securities Act of 1933, the information omitted from the form of prospectus filed as part of this Registration Statement in reliance upon Rule 430A and contained in a form of prospectus filed by the Registrant pursuant to Rule 424(b)(1) or (4) or 497(h) under the Securities Act shall be deemed to be part of this Registration Statement as of the time it was declared effective. |
| (2) | For the purpose of determining any liability under the Securities Act of 1933, each post-effective amendment that contains a form of prospectus shall be deemed to be a new registration statement relating to the securities offered therein, and the offering of such securities at that time shall be deemed to be the initial bona fide offering thereof. |
II-3
Table of Contents
| (3) | For the purpose of determining liability of the registrant under the Securities Act of 1933 to any purchaser in the initial distribution of the securities: The undersigned registrant undertakes that in a primary offering of securities of the undersigned registrant pursuant to this registration statement, regardless of the underwriting method used to sell the securities to the purchaser, if the securities are offered or sold to such purchaser by means of any of the following communications, the undersigned registrant will be a seller to the purchaser and will be considered to offer or sell such securities to such purchaser: |
(i) Any preliminary prospectus or prospectus of the undersigned registrant relating to the offering required to be filed pursuant to Rule 424;
(ii) Any free writing prospectus relating to the offering prepared by or on behalf of the undersigned registrant or used or referred to by the undersigned registrant;
(iii) The portion of any other free writing prospectus relating to the offering containing material information about the undersigned registrant or its securities provided by or on behalf of the undersigned registrant; and
(iv) Any other communication that is an offer in the offering made by the undersigned registrant to the purchaser.
| (4) | If the registrant is subject to Rule 430C, each prospectus filed pursuant to Rule 424(b) as part of a registration statement relating to an offering, other than registration statements relying on Rule 430B or other than prospectuses filed in reliance on Rule 430A, shall be deemed to be part of and included in the registration statement as of the date it is first used after effectiveness. Provided, however, that no statement made in a registration statement or prospectus that is part of the registration statement or made in a document incorporated or deemed incorporated by reference into the registration statement or prospectus that is part of the registration statement will, as to a purchaser with a time of contract of sale prior to such first use, supersede or modify any statement that was made in the registration statement or prospectus that was part of the registration statement or made in any such document immediately prior to such date of first use. |
II-4
Table of Contents
SIGNATURES
Pursuant to the requirements of the Securities Act of 1933, the Registrant has duly caused this Amendment No. 1 to the Registration Statement to be signed on its behalf by the undersigned, thereunto duly authorized, in the City of Mountain View, State of California, on the 9th day of September, 2015.
| PURE STORAGE, INC. | ||
| By: |
/s/ Scott Dietzen | |
| Scott Dietzen Chief Executive Officer | ||
Pursuant to the requirements of the Securities Act of 1933, as amended, this Amendment No. 1 to the Registration Statement has been signed by the following persons in the capacities and on the dates indicated.
| Signature |
Title |
Date | ||
| /s/ Scott Dietzen Scott Dietzen |
Chief Executive Officer and Director (Principal Executive Officer) |
September 9, 2015 | ||
| /s/ Timothy Riitters Timothy Riitters |
Chief Financial Officer (Principal Financial and Accounting Officer) |
September 9, 2015 | ||
| * John Colgrove |
Chief Technology Officer and Co-Chairman | September 9, 2015 | ||
| * Mike Speiser |
Co-Chairman | September 9, 2015 | ||
| * Aneel Bhusri |
Director | September 9, 2015 | ||
| * Mark Garrett |
Director | September 9, 2015 | ||
| * Anita M. Sands |
Director | September 9, 2015 | ||
| * Frank Slootman |
Director | September 9, 2015 | ||
| * Michelangelo Volpi |
Director | September 9, 2015 | ||
| *By: |
/s/ Timothy Riitters | |
| Timothy Riitters | ||
| Attorney-in-Fact | ||
II-5
Table of Contents
EXHIBIT INDEX
| Exhibit |
Description of Exhibit | |
| 1.1 | Form of Underwriting Agreement. | |
| 3.1 | Amended and Restated Certificate of Incorporation of Pure Storage, Inc., as amended, as currently in effect. | |
| 3.2 | Form of Amended and Restated Certificate of Incorporation of Pure Storage, Inc., to be in effect upon the closing of the offering. | |
| 3.3# | Amended and Restated Bylaws of Pure Storage, Inc., as currently in effect. | |
| 3.4 | Form of Amended and Restated Bylaws of Pure Storage, Inc., to be in effect upon the closing of the offering. | |
| 4.1 | Form of Class A Common Stock Certificate. | |
| 5.1* | Form of Opinion of Cooley LLP. | |
| 10.1# | Amended and Restated Investor Rights Agreement, by and between Pure Storage, Inc., and the investors listed on Exhibit A thereto, dated April 17, 2014, as amended. | |
| 10.2+# | Pure Storage, Inc. Amended and Restated 2009 Equity Incentive Plan. | |
| 10.3+# | Forms of Grant Notice, Stock Option Agreement and Notice of Exercise under the Pure Storage, Inc. 2009 Equity Incentive Plan. | |
| 10.4+ | Pure Storage, Inc. 2015 Equity Incentive Plan. | |
| 10.5+* | Forms of Grant Notice, Stock Option Agreement and Notice of Exercise under the Pure Storage, Inc. 2015 Equity Incentive Plan. | |
| 10.6+ | Pure Storage, Inc. 2015 Employee Stock Purchase Plan. | |
| 10.7+ | Form of Indemnity Agreement, by and between Pure Storage, Inc. and each director and executive officer. | |
| 10.8+# | Offer Letter, by and between Pure Storage, Inc. and Scott Dietzen, dated September 14, 2010. | |
| 10.9+# | Offer Letter, by and between Pure Storage, Inc. and David Hatfield, dated November 13, 2012. | |
| 10.10+# | Offer Letter, by and between Pure Storage, Inc. and Timothy Riitters, dated July 14, 2014. | |
| 10.11# | Net Office Lease, by and between Pure Storage, Inc. and Eagle Square Partners, dated September 12, 2013, as amended. | |
| 21.1# | List of Subsidiaries. | |
| 23.1* | Consent of Cooley LLP (included in Exhibit 5.1). | |
| 23.2 | Consent of Deloitte & Touche LLP, independent registered public accounting firm. | |
| 24.1# | Power of Attorney (see signature pages). | |
| * | To be filed by amendment. |
| + | Indicates management contract or compensatory plan. |
| # | Previously filed. |