Attached files
| file | filename |
|---|---|
| 8-K - HOWARD BANCORP, INC. 8-K - Howard Bancorp Inc | a51175606.htm |
Exhibit 99.1
HOWARD BANCORP Investor Presentation September 2015
Forward-Looking Statements This presentation contains statements that are forward-looking, as that term is defined by the Private Securities Litigation Reform Act of 1995 or the Securities and Exchange Commission in its rules, regulations and releases. The Company intends that such forward-looking statements be subject to the safe harbors created thereby. Such forward-looking statements are based on current expectations regarding results of operations and various risk factors, including but not limited to the successful integration of acquired businesses, real estate values, local and national economic conditions, and the impact of interest rates, as well as other risks and uncertainties, as more fully described in Howard Bancorp, Inc.’s Annual Report on Form 10-K for the year ended December 31, 2014, Howard’s Form 8-K filed on March 2, 2015, and Howard’s recent Registration Statement on Form S-4, as amended, and other reports filed with the Securities and Exchange Commission. Accordingly, actual results may differ from those expressed in the forward-looking statements, and the making of such statements should not be regarded as a representation by the Company or any other person that results expressed therein will be achieved. The Company does not undertake, and specifically disclaims any obligation, to publicly release the result of any revisions that may be made to any forward-looking statements to reflect events or circumstances after the date of such statements or to reflect the occurrence of anticipated or unanticipated events. To supplement its consolidated financial statements presented in accordance with Generally Accepted Accounting Principles (GAAP), Howard provides additional measures of operating results, net income and earnings per share (EPS) adjusted to exclude certain costs, expenses, and gains and losses. Howard believes that these non-GAAP financial measures are appropriate to enhance the understanding of its past performance as well as prospects for its future performance. In the event of such a disclosure or release, the Securities and Exchange Commission’s Regulation G requires: (i) the presentation of the most directly comparable financial measure calculated and presented in accordance with GAAP and (ii) a reconciliation of the differences between the non-GAAP financial measure presented and the most directly comparable financial measure calculated and presented in accordance with GAAP. 1
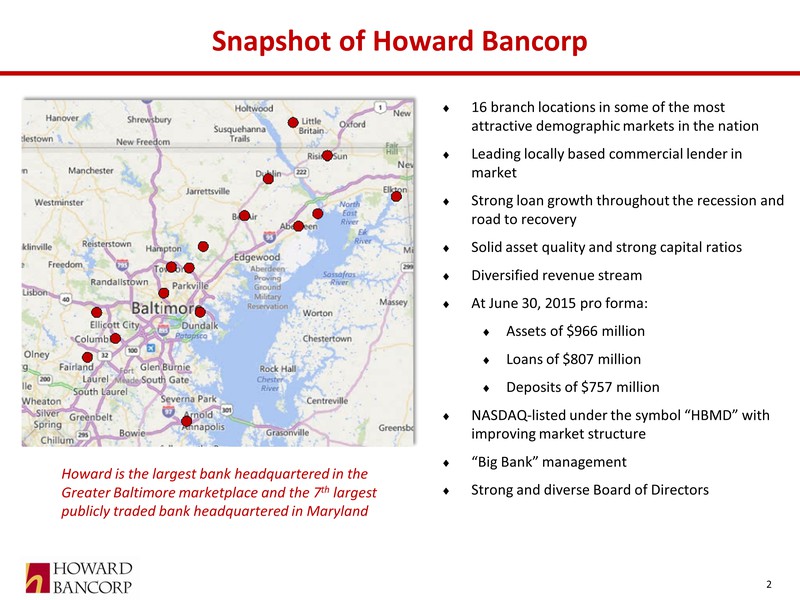
Snapshot of Howard Bancorp 16 branch locations in some of the most attractive demographic markets in the nation Leading locally based commercial lender in market Strong loan growth throughout the recession and road to recovery Solid asset quality and strong capital ratios Diversified revenue stream At June 30, 2015 pro forma: Assets of $966 million Loans of $807 million Deposits of $757 million NASDAQ-listed under the symbol “HBMD” with improving market structure “Big Bank” management Strong and diverse Board of Directors Howard is the largest bank headquartered in the Greater Baltimore marketplace and the 7th largest publicly traded bank headquartered in Maryland 2
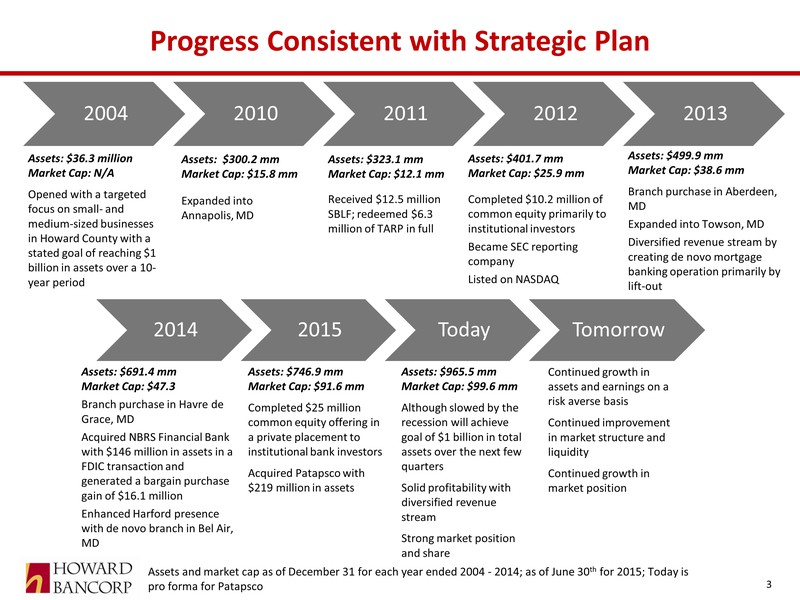
Progress Consistent with Strategic Plan 2004 2010 2011 2012 2013 Assets: $36.3 million Market Cap: N/A Opened with a targeted focus on small- and medium-sized businesses in Howard County with a stated goal of reaching $1 billion in assets over a 10-year period Assets: $300.2 mm Market Cap: $15.8 mm Expanded into Annapolis, MD Assets: $323.1 mm Market Cap: $12.1 mm Received $12.5 million SBLF; redeemed $6.3 million of TARP in full Assets: $401.7 mm Market Cap: $25.9 mm Completed $10.2 million of common equity primarily to institutional investors Became SEC reporting company Listed on NASDAQ Assets: $499.9 mm Market Cap: $38.6 mm Branch purchase in Aberdeen, MD Expanded into Towson, MD Diversified revenue stream by creating de novo mortgage banking operation primarily by lift-out 2014 2015 Today Tomorrow Assets: $691.4 mm Market Cap: $47.3 Branch purchase in Havre de Grace, MD Acquired NBRS Financial Bank with $146 million in assets in a FDIC transaction and generated a bargain purchase gain of $16.1 million Enhanced Harford presence with de novo branch in Bel Air, MD Assets: $746.9 mm Market Cap: $91.6 mm Completed $25 million common equity offering in a private placement to institutional bank investors Acquired Patapsco with $219 million in assets Assets: $965.5 mm Market Cap: $99.6 mm Although slowed by the recession will achieve goal of $1 billion in total assets over the next few quarters Solid profitability with diversified revenue stream Strong market position and share Continued growth in assets and earnings on a risk averse basis Continued improvement in market structure and liquidity Continued growth in market position Assets and market cap as of December 31 for each year ended 2004 - 2014; as of June 30th for 2015; Today is pro forma for Patapsco 3
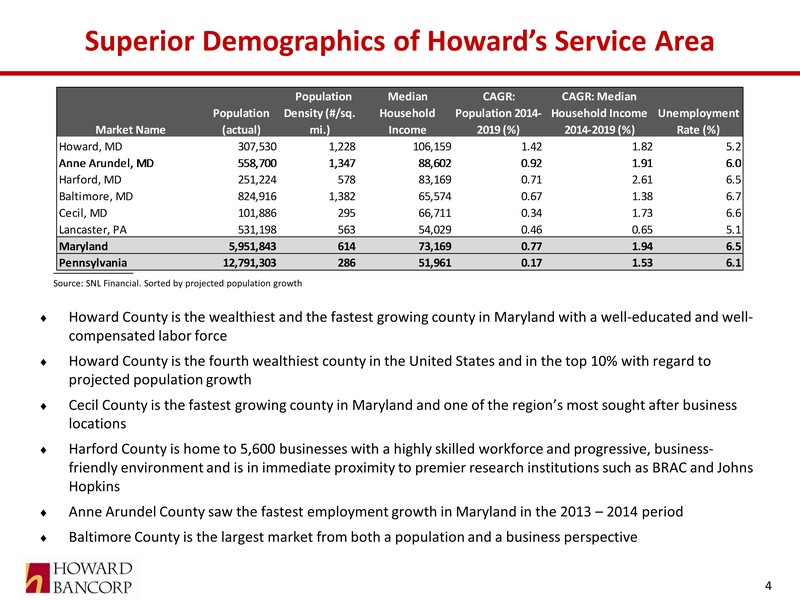
Superior Demographics of Howard’s Service Area Source: SNL Financial. Sorted by projected population growth Howard County is the wealthiest and the fastest growing county in Maryland with a well-educated and well-compensated labor force Howard County is the fourth wealthiest county in the United States and in the top 10% with regard to projected population growth Cecil County is the fastest growing county in Maryland and one of the region’s most sought after business locations Harford County is home to 5,600 businesses with a highly skilled workforce and progressive, business-friendly environment and is in immediate proximity to premier research institutions such as BRAC and Johns Hopkins Anne Arundel County saw the fastest employment growth in Maryland in the 2013 – 2014 period Baltimore County is the largest market from both a population and a business perspective Market Name Population (actual) Population Density (#/sq. mi.) Median Household IncomeCAGR: Population 2014-2019 (%)CAGR: Median Household Income 2014-2019 (%)Unemployment Rate (%)Howard, MD307,5301,228 106,1591.421.825.2Anne Arundel, MD558,7001,347 88,6020.921.916.0Harford, MD251,224578 83,1690.712.616.5Baltimore, MD824,9161,382 65,5740.671.386.7Cecil, MD101,886295 66,7110.341.736.6Lancaster, PA531,198563 54,0290.460.655.1Maryland5,951,843614 73,1690.771.946.5Pennsylvania12,791,303286 51,9610.171.536.1 4
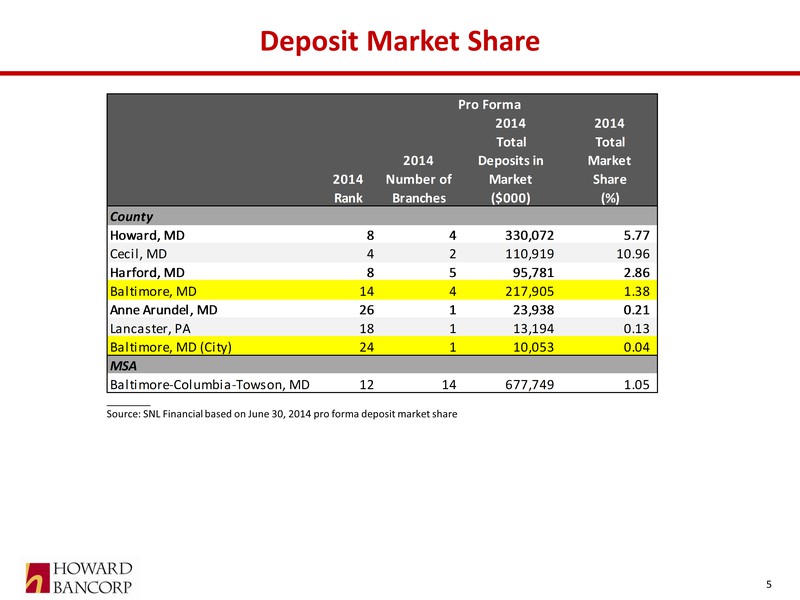
Deposit Market Share ________ Source: SNL Financial based on June 30, 2014 pro forma deposit market share Pro Forma2014 Rank2014 Number of Branches 2014 Total Deposits in Market ($000)2014 Total Market Share (%)CountyHoward, MD84330,072 5.77 Cecil, MD42110,919 10.96 Harford, MD8595,781 2.86 Baltimore, MD144217,905 1.38 Anne Arundel, MD26123,938 0.21 Lancaster, PA18113,194 0.13 Baltimore, MD (City)24110,053 0.04 MSABaltimore-Columbia-Towson, MD1214677,749 1.05 5
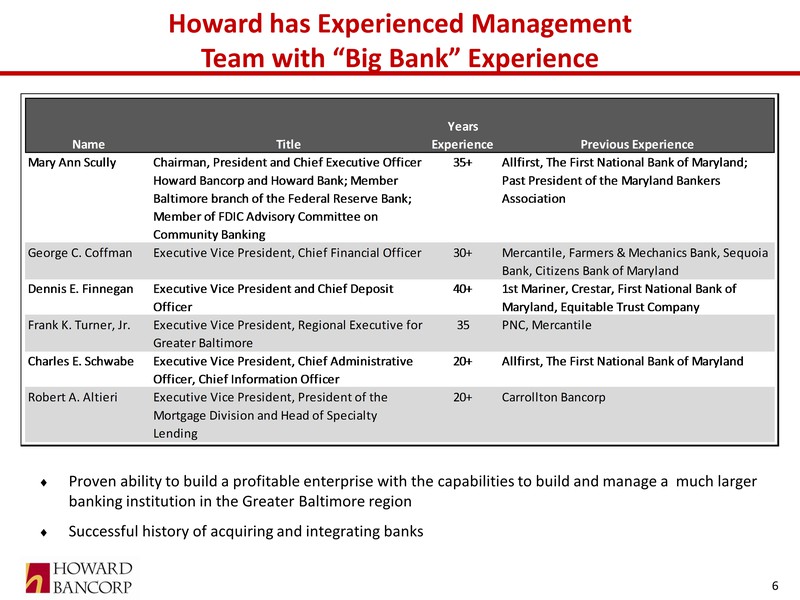
Howard has Experienced Management Team with “Big Bank” Experience Proven ability to build a profitable enterprise with the capabilities to build and manage a much larger banking institution in the Greater Baltimore region Successful history of acquiring and integrating banks NameTitleYears ExperiencePrevious ExperienceMary Ann ScullyChairman, President and Chief Executive Officer Howard Bancorp and Howard Bank; Member Baltimore branch of the Federal Reserve Bank; Member of FDIC Advisory Committee on Community Banking35+Allfirst, The First National Bank of Maryland; Past President of the Maryland Bankers AssociationGeorge C. CoffmanExecutive Vice President, Chief Financial Officer30+Mercantile, Farmers & Mechanics Bank, Sequoia Bank, Citizens Bank of MarylandDennis E. FinneganExecutive Vice President and Chief Deposit Officer40+1st Mariner, Crestar, First National Bank of Maryland, Equitable Trust CompanyFrank K. Turner, Jr.Executive Vice President, Regional Executive for Greater Baltimore35PNC, MercantileCharles E. SchwabeExecutive Vice President, Chief Administrative Officer, Chief Information Officer20+Allfirst, The First National Bank of MarylandRobert A. AltieriExecutive Vice President, President of the Mortgage Division and Head of Specialty Lending20+Carrollton Bancorp 6
Strong and Diverse Board of Directors M&A and Strategic – Head of Global Corporate practice of large international law firm and others with M&A experience Banking: Regulatory – Former and Present members of regional board of Federal Reserve Bank of Maryland and Former member of the Richmond Federal Reserve Bank board Banking: Operations – Former Founders, Chairmen and Board Members of a number of regional financial institutions Technology – Senior executive managers of software solution and IT service firms Accounting – Former senior partners and other senior accounting professionals of both national and regional accounting firms with diverse financial, tax accounting and employee benefits experience Legal – Former and practicing multidisciplinary lawyers from both national and regional law firms Governance – several members who served or advised both small- and mid-cap public company boards with corporate governance and public company policies, procedures and processes awareness and experience Strong Regional Business Affiliations – Members of the regional business community with strong relationships who provide us with referrals and introductions to new customers, as well as, information on the regional business and economic environment and knowledge of real estate and real estate development in our market areas 7
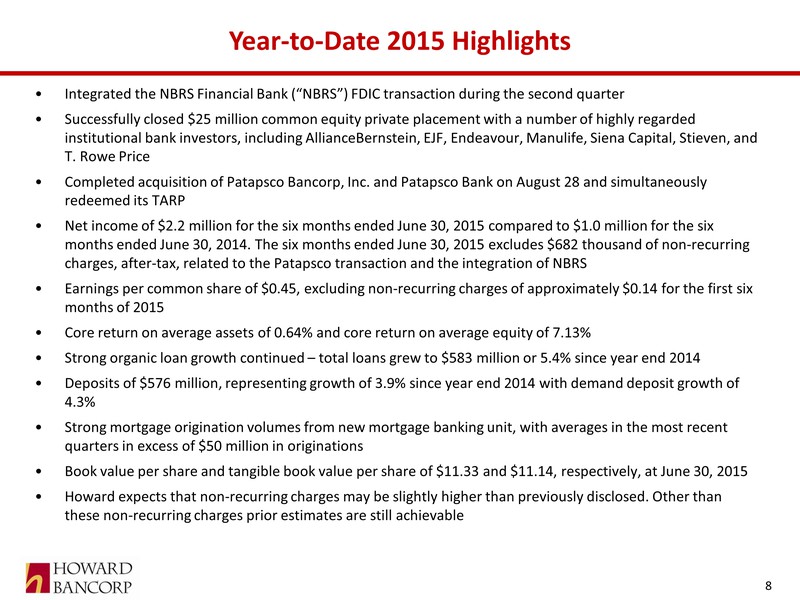
Year-to-Date 2015 Highlights Integrated the NBRS Financial Bank (“NBRS”) FDIC transaction during the second quarter Successfully closed $25 million common equity private placement with a number of highly regarded institutional bank investors, including AllianceBernstein, EJF, Endeavour, Manulife, Siena Capital, Stieven, and T. Rowe Price Completed acquisition of Patapsco Bancorp, Inc. and Patapsco Bank on August 28 and simultaneously redeemed its TARP Net income of $2.2 million for the six months ended June 30, 2015 compared to $1.0 million for the six months ended June 30, 2014. The six months ended June 30, 2015 excludes $682 thousand of non-recurring charges, after-tax, related to the Patapsco transaction and the integration of NBRS Earnings per common share of $0.45, excluding non-recurring charges of approximately $0.14 for the first six months of 2015 Core return on average assets of 0.64% and core return on average equity of 7.13% Strong organic loan growth continued – total loans grew to $583 million or 5.4% since year end 2014 Deposits of $576 million, representing growth of 3.9% since year end 2014 with demand deposit growth of 4.3% Strong mortgage origination volumes from new mortgage banking unit, with averages in the most recent quarters in excess of $50 million in originations Book value per share and tangible book value per share of $11.33 and $11.14, respectively, at June 30, 2015 Howard expects that non-recurring charges may be slightly higher than previously disclosed. Other than these non-recurring charges prior estimates are still achievable 8
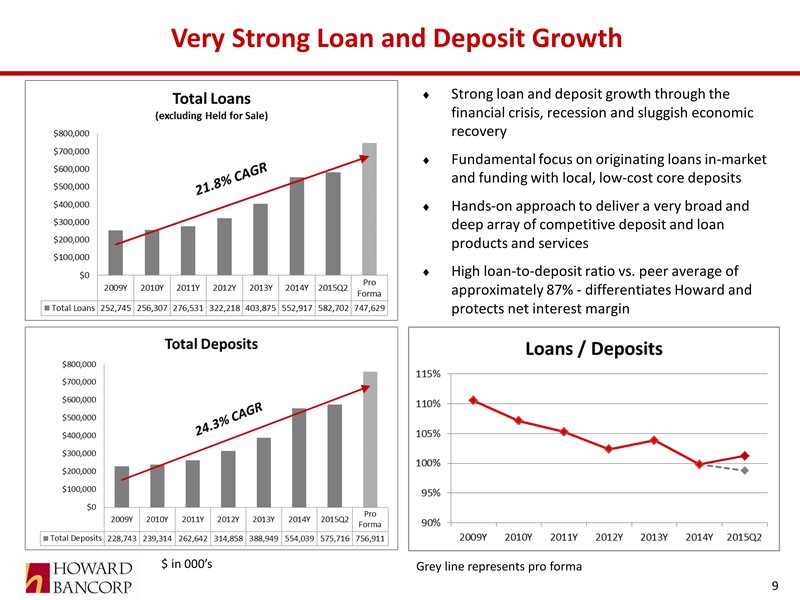
Very Strong Loan and Deposit Growth Strong loan and deposit growth through the financial crisis, recession and sluggish economic recovery Fundamental focus on originating loans in-market and funding with local, low-cost core deposits Hands-on approach to deliver a very broad and deep array of competitive deposit and loan products and services High loan-to-deposit ratio vs. peer average of approximately 87% - differentiates Howard and protects net interest margin $ in 000’s Grey line represents pro forma 9
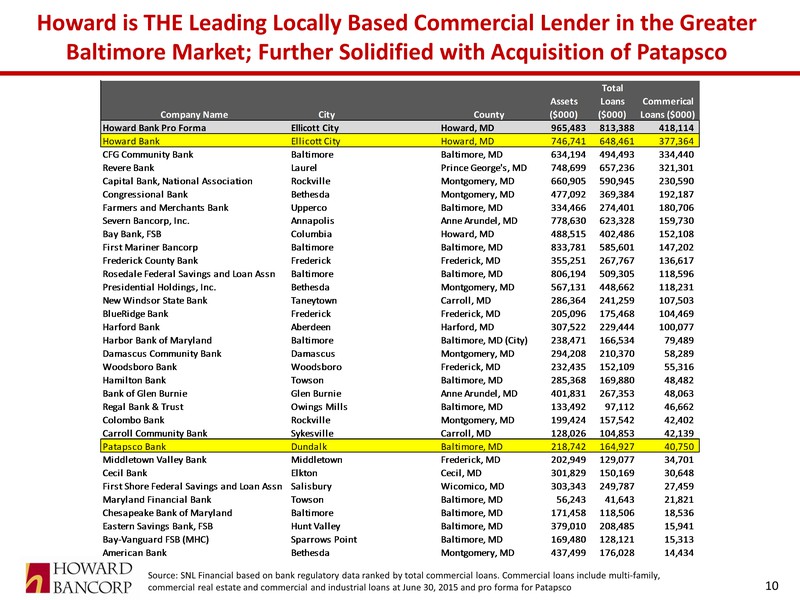
Howard is THE Leading Locally Based Commercial Lender in the Greater Baltimore Market; Further Solidified with Acquisition of Patapsco Source: SNL Financial based on bank regulatory data ranked by total commercial loans. Commercial loans include multi-family, commercial real estate and commercial and industrial loans at June 30, 2015 and pro forma for Patapsco Company NameCity CountyAssets ($000)Total Loans ($000)Commerical Loans ($000)Howard Bank Pro FormaEllicott CityHoward, MD965,483813,388418,114 Howard BankEllicott CityHoward, MD746,741648,461377,364 CFG Community BankBaltimoreBaltimore, MD634,194494,493334,440 Revere BankLaurelPrince George's, MD748,699657,236321,301 Capital Bank, National AssociationRockvilleMontgomery, MD660,905590,945230,590 Congressional BankBethesdaMontgomery, MD477,092369,384192,187 Farmers and Merchants BankUppercoBaltimore, MD334,466274,401180,706 Severn Bancorp, Inc.AnnapolisAnne Arundel, MD778,630623,328159,730 Bay Bank, FSBColumbiaHoward, MD488,515402,486152,108 First Mariner BancorpBaltimoreBaltimore, MD833,781585,601147,202 Frederick County BankFrederickFrederick, MD355,251267,767136,617 Rosedale Federal Savings and Loan AssnBaltimoreBaltimore, MD806,194509,305118,596 Presidential Holdings, Inc.BethesdaMontgomery, MD567,131448,662118,231 New Windsor State BankTaneytownCarroll, MD286,364241,259107,503 BlueRidge BankFrederickFrederick, MD205,096175,468104,469 Harford BankAberdeenHarford, MD307,522229,444100,077 Harbor Bank of MarylandBaltimoreBaltimore, MD (City)238,471166,53479,489 Damascus Community BankDamascusMontgomery, MD294,208210,37058,289 Woodsboro BankWoodsboroFrederick, MD232,435152,10955,316 Hamilton BankTowsonBaltimore, MD285,368169,88048,482 Bank of Glen BurnieGlen BurnieAnne Arundel, MD401,831267,35348,063 Regal Bank & TrustOwings MillsBaltimore, MD133,49297,11246,662 Colombo BankRockvilleMontgomery, MD199,424157,54242,402 Carroll Community BankSykesvilleCarroll, MD128,026104,85342,139 Patapsco BankDundalkBaltimore, MD218,742164,92740,750 Middletown Valley BankMiddletownFrederick, MD202,949129,07734,701 Cecil BankElktonCecil, MD301,829150,16930,648 First Shore Federal Savings and Loan AssnSalisburyWicomico, MD303,343249,78727,459 Maryland Financial BankTowsonBaltimore, MD56,24341,64321,821 Chesapeake Bank of MarylandBaltimoreBaltimore, MD171,458118,50618,536 Eastern Savings Bank, FSBHunt ValleyBaltimore, MD379,010208,48515,941 Bay-Vanguard FSB (MHC)Sparrows PointBaltimore, MD169,480128,12115,313 American BankBethesdaMontgomery, MD437,499176,02814,434 10
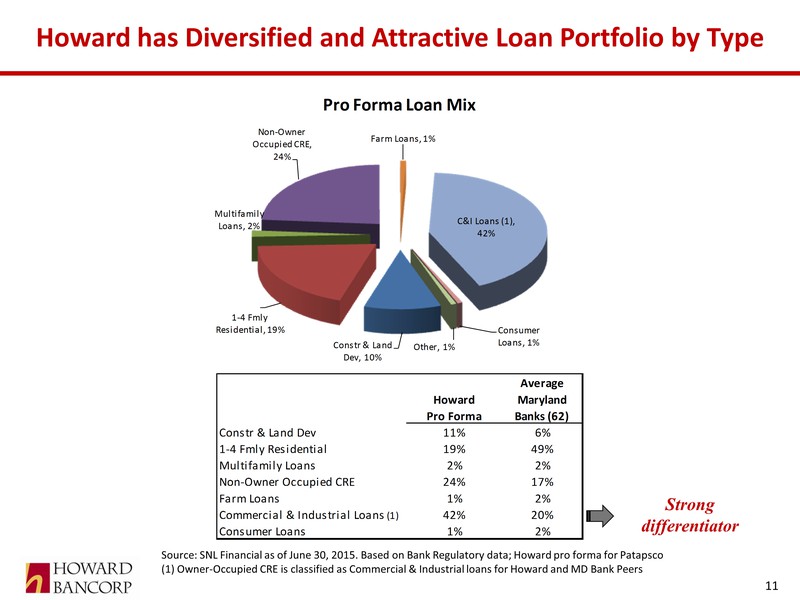
Howard has Diversified and Attractive Loan Portfolio by Type Source: SNL Financial as of June 30, 2015. Based on Bank Regulatory data; Howard pro forma for Patapsco (1) Owner-Occupied CRE is classified as Commercial & Industrial loans for Howard and MD Bank Peers Constr & Land Dev, 10%1-4 Fmly Residential, 19%Multifamily Loans, 2%Non-Owner Occupied CRE, 24%Farm Loans, 1%C&I Loans (1), 42%Consumer Loans, 1%Other, 1%Pro Forma Loan MixHoward Pro FormaAverage Maryland Banks (62)Constr & Land Dev11%6%1-4 Fmly Residential19%49%Multifamily Loans2%2%Non-Owner Occupied CRE24%17%Farm Loans1%2%Commercial & Industrial Loans (1)42%20%Consumer Loans1%2% Strong differentiator 11
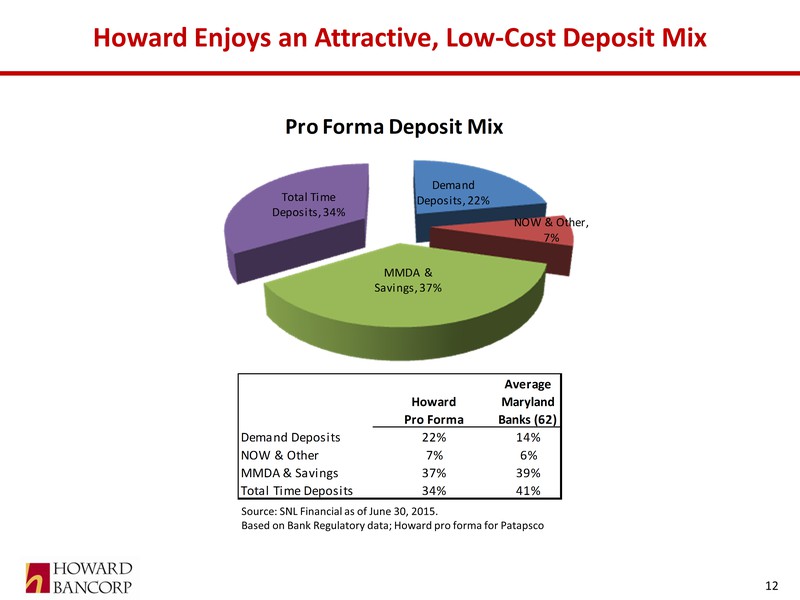
Howard Enjoys an Attractive, Low-Cost Deposit Mix Source: SNL Financial as of June 30, 2015. Based on Bank Regulatory data; Howard pro forma for Patapsco Demand Deposits, 22%NOW & Other, 7%MMDA & Savings, 37%Total Time Deposits, 34%Pro Forma Deposit MixHoward Pro FormaAverage Maryland Banks (62)Demand Deposits22%14%NOW & Other7%6%MMDA & Savings37%39%Total Time Deposits34%41% 12
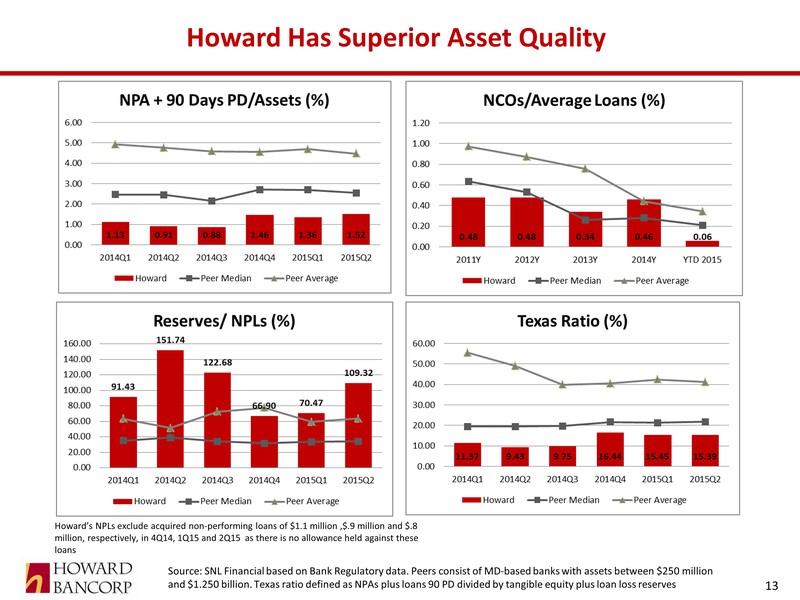
Howard Has Superior Asset Quality Source: SNL Financial based on Bank Regulatory data. Peers consist of MD-based banks with assets between $250 million and $1.250 billion. Texas ratio defined as NPAs plus loans 90 PD divided by tangible equity plus loan loss reserves Howard’s NPLs exclude acquired non-performing loans of $1.1 million ,$.9 million and $.8 million, respectively, in 4Q14, 1Q15 and 2Q15 as there is no allowance held against these loans 13
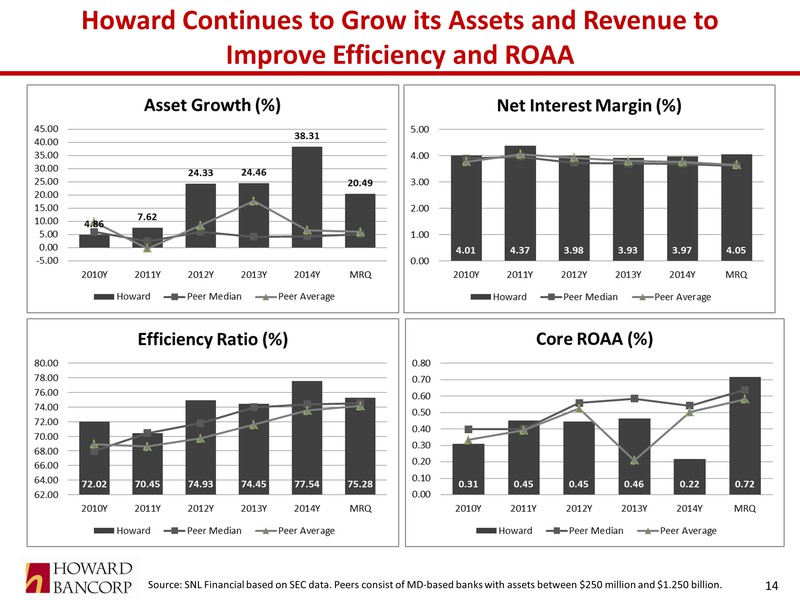
Howard Continues to Grow its Assets and Revenue to Improve Efficiency and ROAA Source: SNL Financial based on SEC data. Peers consist of MD-based banks with assets between $250 million and $1.250 billion. 14
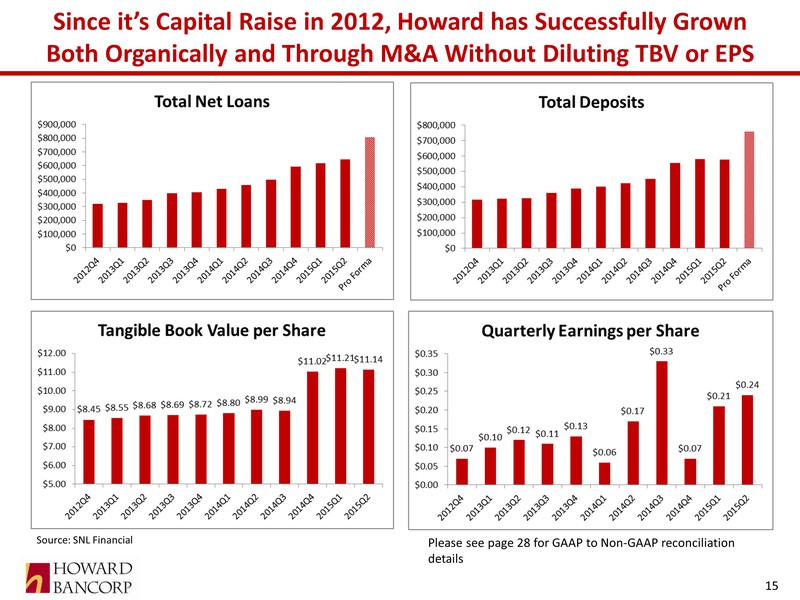
Since it’s Capital Raise in 2012, Howard has Successfully Grown Both Organically and Through M&A Without Diluting TBV or EPS Source: SNL Financial Please see page 28 for GAAP to Non-GAAP reconciliation details 15
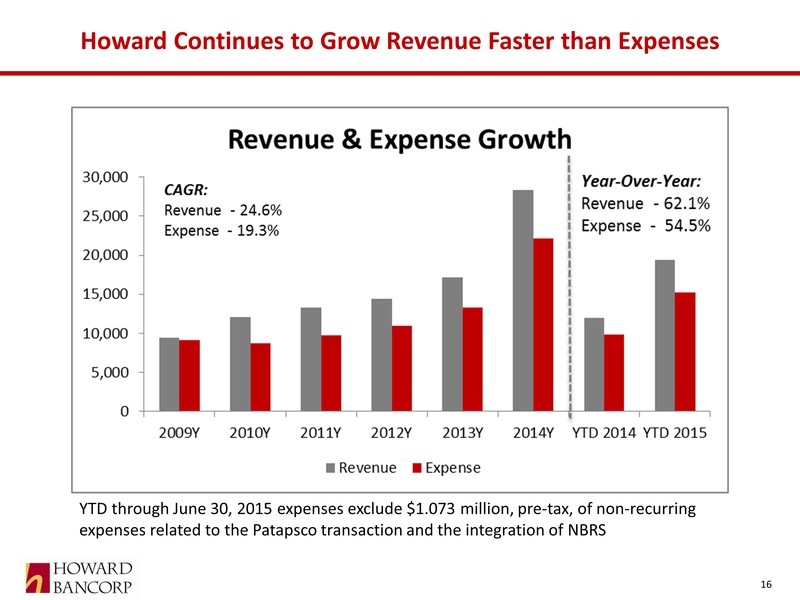
Howard Continues to Grow Revenue Faster than Expenses YTD through June 30, 2015 expenses exclude $1.073 million, pre-tax, of non-recurring expenses related to the Patapsco transaction and the integration of NBRS 16
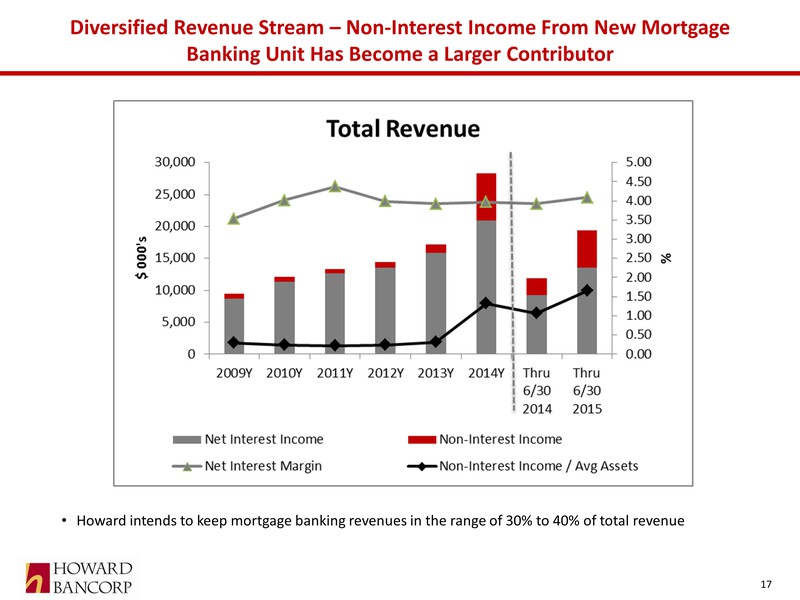
Diversified Revenue Stream – Non-Interest Income From New Mortgage Banking Unit Has Become a Larger Contributor Howard intends to keep mortgage banking revenues in the range of 30% to 40% of total revenue 17
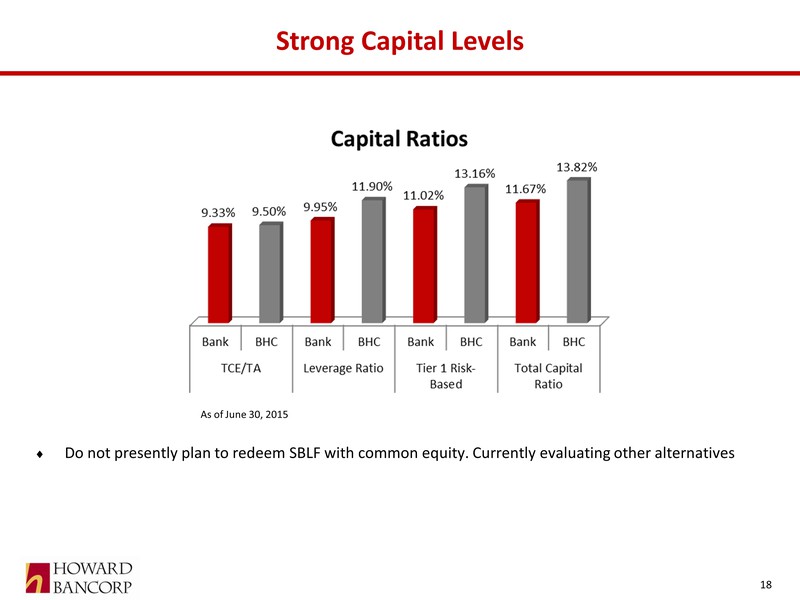
Strong Capital Levels As of June 30, 2015 Do not presently plan to redeem SBLF with common equity. Currently evaluating other alternatives 18
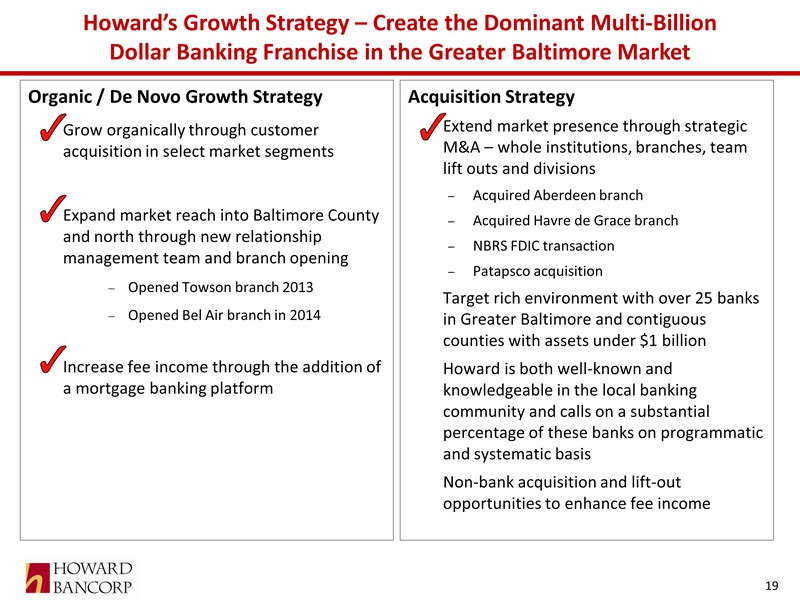
Howard’s Growth Strategy – Create the Dominant Multi-Billion Dollar Banking Franchise in the Greater Baltimore Market Organic / De Novo Growth Strategy Grow organically through customer acquisition in select market segments Expand market reach into Baltimore County and north through new relationship management team and branch opening −Opened Towson branch 2013 −Opened Bel Air branch in 2014 Increase fee income through the addition of a mortgage banking platform Acquisition Strategy Extend market presence through strategic M&A – whole institutions, branches, team lift outs and divisions Acquired Aberdeen branch Acquired Havre de Grace branch NBRS FDIC transaction Patapsco acquisition Target rich environment with over 25 banks in Greater Baltimore and contiguous counties with assets under $1 billion Howard is both well-known and knowledgeable in the local banking community and calls on a substantial percentage of these banks on programmatic and systematic basis Non-bank acquisition and lift-out opportunities to enhance fee income 19
Howard De Novo Mortgage Bank Continues to Grow Designed initiative to diversify revenue streams, reduce exclusive reliance on balance sheet growth for earnings, and improve ROA and ROE Howard believes the addition of the mortgage banking division is an extremely positive factor Hired seasoned commercial bank CEO with substantial mortgage banking experience during the second quarter 2013 Strategic focus and initiative of the mortgage division is to maintain diversity and sustainability during the normal business cycles of the mortgage industry/housing market. This was accomplished by hiring both Retail (purchase money mortgages) and Consumer Direct (nationwide non-interest rate driven refinances) seasoned mortgage professionals Obtained regulatory and licensing approvals (FHA, VA, USDA) during the second and third quarters of 2013 as well as expanded mortgage investor relationships to add additional products and pricing models Established Retail mortgage office, which was designed to focus on purchase money mortgages, in a highly desirable location in Timonium, Maryland and commenced building of operational infrastructure during the fourth quarter of 2013 Added Consumer Direct group in first quarter of 2014 which has provided, for six consecutive quarters, the diversity and sustainability a retail origination unit would not have Steadily increased origination and sales volumes each month now averaging $55 to $60 million per month in originations Year-to-date June 30, 2015, the mortgage banking operation generated $4.8 million in revenue, compared to $2.0 million for the same period in 2014 The mortgage banking division achieved profitability in the second quarter of 2014 and has had continuous profitability since Howard intends to keep mortgage banking revenues in the range of 30% to 40% of total revenue 20
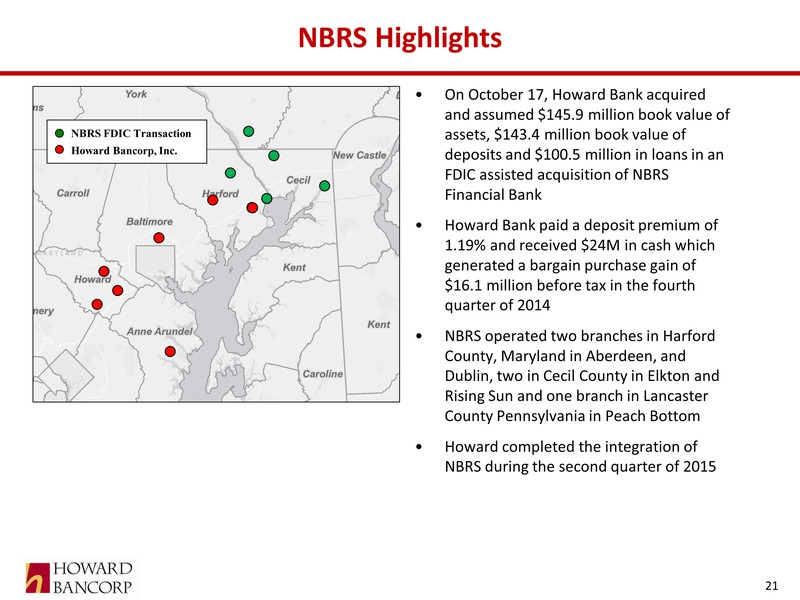
NBRS Highlights On October 17, Howard Bank acquired and assumed $145.9 million book value of assets, $143.4 million book value of deposits and $100.5 million in loans in an FDIC assisted acquisition of NBRS Financial Bank Howard Bank paid a deposit premium of 1.19% and received $24M in cash which generated a bargain purchase gain of $16.1 million before tax in the fourth quarter of 2014 NBRS operated two branches in Harford County, Maryland in Aberdeen, and Dublin, two in Cecil County in Elkton and Rising Sun and one branch in Lancaster County Pennsylvania in Peach Bottom Howard completed the integration of NBRS during the second quarter of 2015 NBRS FDIC Transaction Howard Bancorp, Inc. 21
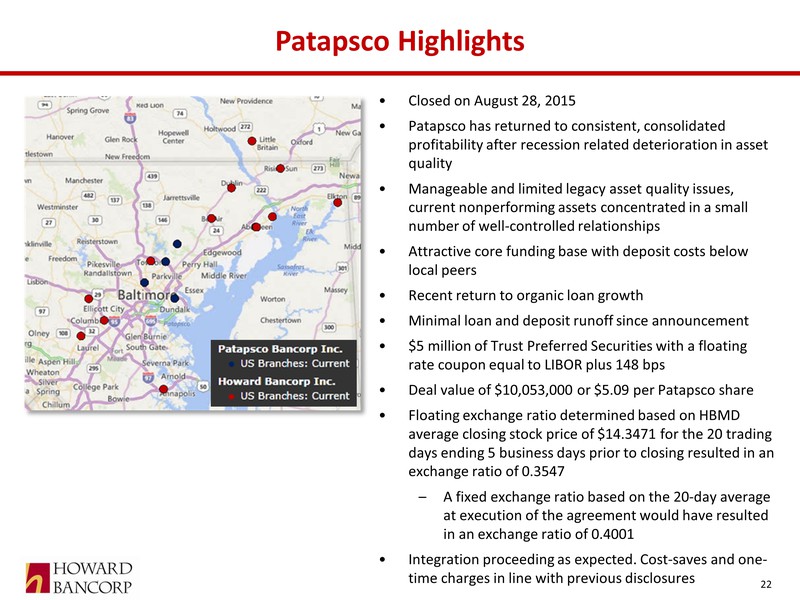
Patapsco Highlights Closed on August 28, 2015 Patapsco has returned to consistent, consolidated profitability after recession related deterioration in asset quality Manageable and limited legacy asset quality issues, current nonperforming assets concentrated in a small number of well-controlled relationships Attractive core funding base with deposit costs below local peers Recent return to organic loan growth Minimal loan and deposit runoff since announcement $5 million of Trust Preferred Securities with a floating rate coupon equal to LIBOR plus 148 bps Deal value of $10,053,000 or $5.09 per Patapsco share Floating exchange ratio determined based on HBMD average closing stock price of $14.3471 for the 20 trading days ending 5 business days prior to closing resulted in an exchange ratio of 0.3547 A fixed exchange ratio based on the 20-day average at execution of the agreement would have resulted in an exchange ratio of 0.4001 Integration proceeding as expected. Cost-saves and one-time charges in line with previous disclosures 22
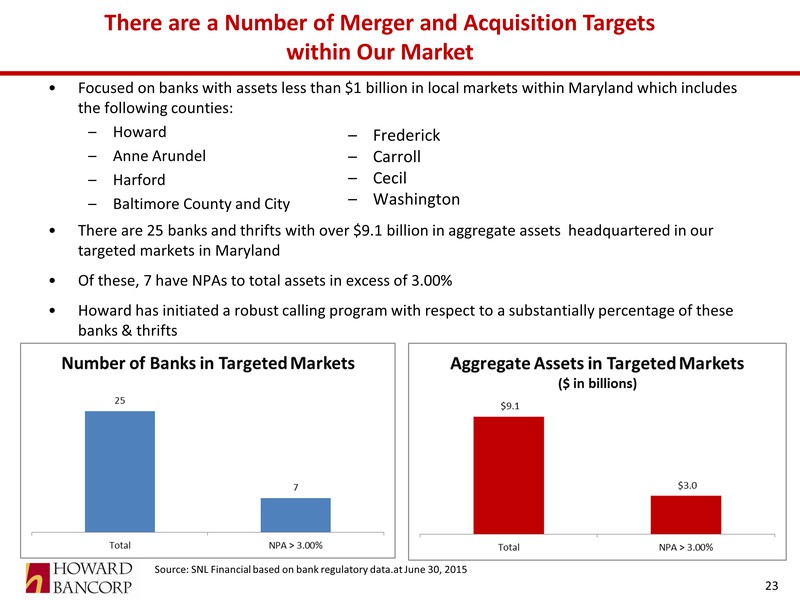
There are a Number of Merger and Acquisition Targets within Our Market Focused on banks with assets less than $1 billion in local markets within Maryland which includes the following counties: Howard Anne Arundel Harford Baltimore County and City There are 25 banks and thrifts with over $9.1 billion in aggregate assets headquartered in our targeted markets in Maryland Of these, 7 have NPAs to total assets in excess of 3.00% Howard has initiated a robust calling program with respect to a substantially percentage of these banks & thrifts Source: SNL Financial based on bank regulatory data.at June 30, 2015 Frederick Carroll Cecil Washington 23
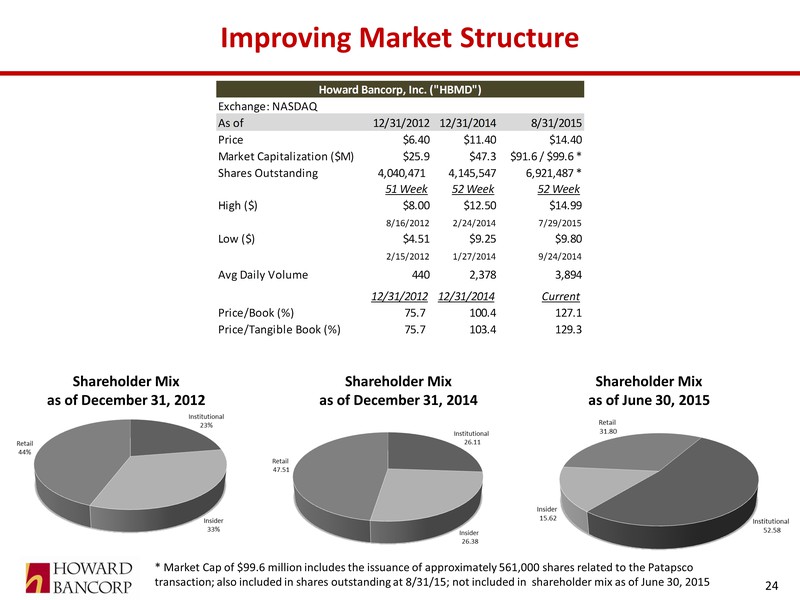
Improving Market Structure Shareholder Mix as of June 30, 2015 Howard Bancorp, Inc. ("HBMD")Exchange: NASDAQAs of 12/31/2012 12/31/2014 8/31/2015 Price $6.40$11.40$14.40Market Capitalization ($M)$25.9$47.3$91.6 / $99.6 *Shares Outstanding4,040,471 4,145,5476,921,487 *51 Week 52 Week 52 WeekHigh ($)$8.00$12.50$14.998/16/20122/24/20147/29/2015Low ($) $4.51 $9.25 $9.802/15/2012 1/27/2014 9/24/2014 Avg Daily Volume4402,3783,89412/31/201212/31/2014CurrentPrice/Book (%)75.7 100.4127.1Price/Tangible Book (%)75.7 103.4129.3Shareholder Mix as of December 31, 2012 Shareholder Mix as of December 31, 2014 * Market Cap of $99.6 million includes the issuance of approximately 561,000 shares related to the Patapsco transaction; also included in shares outstanding at 8/31/15; not included in shareholder mix as of June 30, 2015 24
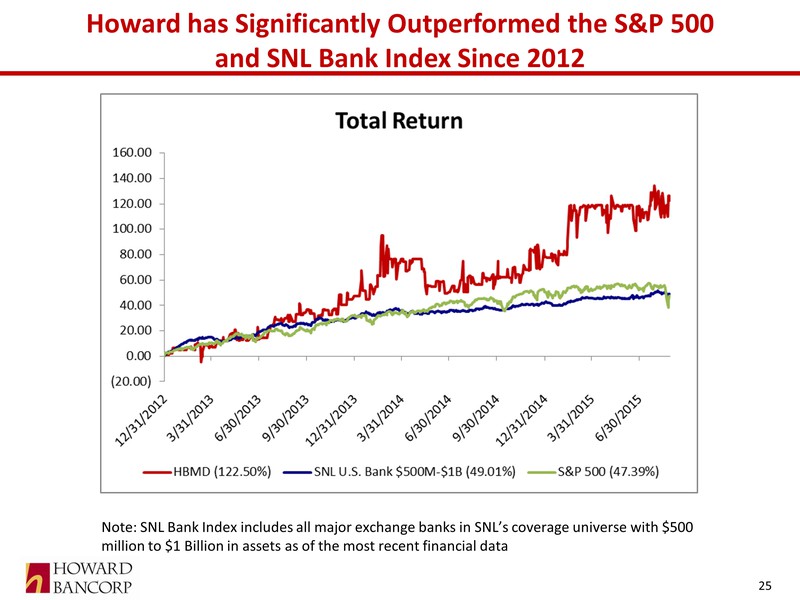
Howard has Significantly Outperformed the S&P 500 and SNL Bank Index Since 2012 Note: SNL Bank Index includes all major exchange banks in SNL’s coverage universe with $500 million to $1 Billion in assets as of the most recent financial data 25
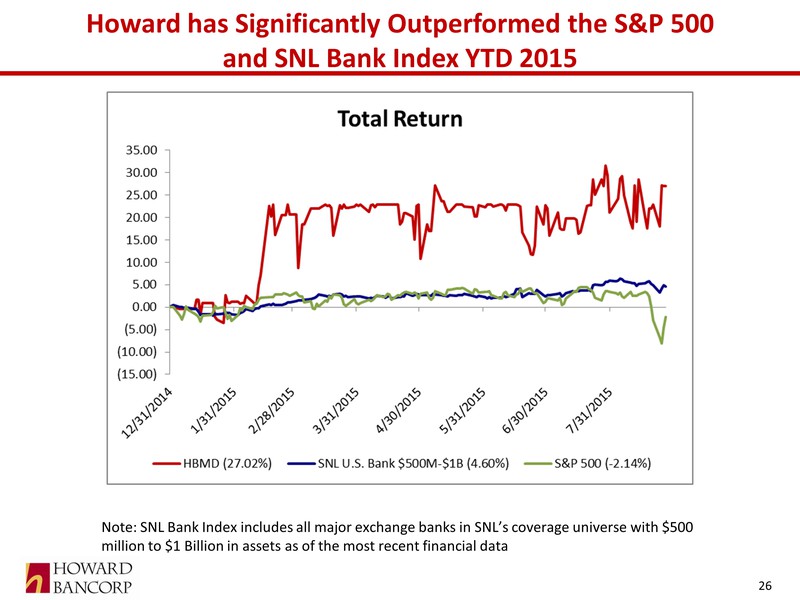
Howard has Significantly Outperformed the S&P 500 and SNL Bank Index YTD 2015 Note: SNL Bank Index includes all major exchange banks in SNL’s coverage universe with $500 million to $1 Billion in assets as of the most recent financial data Announcement of Patapsco acquisition and common equity raise 26
Summary Howard has focused on sustainable growth – balance sheet, capital, revenue and earnings – since its inception, and has performed well during the financial crisis, and sluggish economic recovery – all without TBV or earnings dilution Competitively advantaged franchise in some of the most attractive markets in the nation with a balanced business mix and a moderate credit risk profile Diversified revenue stream SEC registration, NASDAQ listing, improved market structure and growing market, shareholder returns and liquidity There are no public “Greater Baltimore” based banks with the capital and size and scale as Howard’s There are a number of additional potential partners in the Greater Baltimore-market Howard enjoys Big Bank management and an strong and diverse board Howard is committed to further growth – organic and acquired – to achieve the size and scale sufficient to continue to generate superior returns for its investors notwithstanding the still sluggish state of the national and regional economies, interest rate issues, Dodd Frank, and competitive pressures Howard is well on its way to fill the current void in the marketplace by building a super regional “Greater Baltimore” bank via both organic growth and acquisition on a profitable basis 27
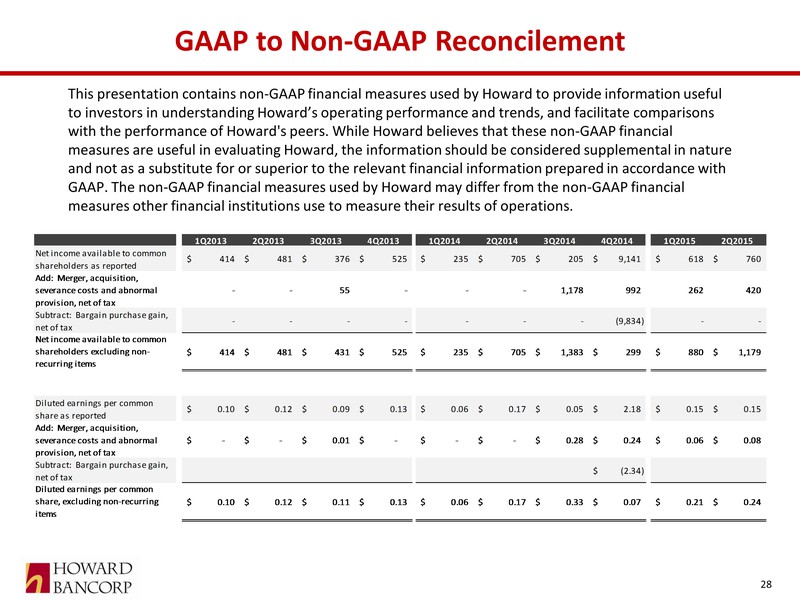
GAAP to Non-GAAP Reconcilement This presentation contains non-GAAP financial measures used by Howard to provide information useful to investors in understanding Howard’s operating performance and trends, and facilitate comparisons with the performance of Howard's peers. While Howard believes that these non-GAAP financial measures are useful in evaluating Howard, the information should be considered supplemental in nature and not as a substitute for or superior to the relevant financial information prepared in accordance with GAAP. The non-GAAP financial measures used by Howard may differ from the non-GAAP financial measures other financial institutions use to measure their results of operations. 1Q2013 2Q2013 3Q2013 4Q2013 1Q2014 2Q2014 3Q2014 4Q2014 1Q2015 2Q2015 Net income available to common shareholders as reported414$ 481$ 376$ 525$ 235$ 705$ 205$ 9,141$ 618$ 760$ Add: Merger, acquisition, severance costs and abnormal provision, net of tax- - 55 - - - 1,178 992 262 420 Subtract: Bargain purchase gain, net of tax- - - - - - - (9,834) - - Net income available to common shareholders excluding non-recurring items414$ 481$ 431$ 525$ 235$ 705$ 1,383$ 299$ 880$ 1,179$ Diluted earnings per common share as reported0.10$ 0.12$ 0.09$ 0.13$ 0.06$ 0.17$ 0.05$ 2.18$ 0.15$ 0.15$ Add: Merger, acquisition, severance costs and abnormal provision, net of tax-$ -$ 0.01$ -$ -$ -$ 0.28$ 0.24$ 0.06$ 0.08$ Subtract: Bargain purchase gain, net of tax(2.34)$ Diluted earnings per common share, excluding non-recurring items0.10$ 0.12$ 0.11$ 0.13$ 0.06$ 0.17$ 0.33$ 0.07$ 0.21$ 0.24$ 28
Thank You 29