Attached files
| file | filename |
|---|---|
| EX-99.1 - EXHIBIT 99.1 - ROI Acquisition Corp. II | v419869_ex99-1.htm |
| EX-99.2 - EXHIBIT 99.2 - ROI Acquisition Corp. II | v419869_ex99-2.pdf |
| 8-K - FORM 8-K - ROI Acquisition Corp. II | v419869_8-k.htm |
Exhibit 99.2
September 2015 Ascend Telecom Holdings Limited ROI Acquisition Corp. II Investor Presentation
1 Important Information In connection with the proposed business combination, Ascend Telecom Holdings Limited (“Ascend Holdings”) has filed a Registration Statement on Form F - 4 (the “Registration Statement”) with the United States Securities and Exchange Commission (“SEC”) which includes the related preliminary proxy statement/prospectus, that is both the proxy statement to be distributed to holders of ROI’s co mmo n stock and public warrants in connection with the solicitation by ROI of proxies for the vote by the stockholders on the transaction and the vote by the warrantholders on the proposed amendment to the warrant agreement, as well as the prospectus covering the registration of the proposed issuance of ordinary shares to be issued in the transaction. ROI will mail a definitive proxy statement/prospectus and other relevant documents to its stockholders and warrantholders . ROI’s stockholders and warrantholders and other interested persons are advised to read the Ascend Holdings preliminary proxy statement/prospectus included in the Registration Statement, and amendments thereto, and the definitive proxy statement /prospectus because the proxy statement/prospectus will contain important information about Ascend Telecom Infrastructure Private Limited (“Ascend”), ROI, the proposed transaction and the proposed warrant agreement amendment. The definitive proxy statement/prospectus will be mailed to stockholders and warrantholders of ROI as of a record date to be established for voting on the transaction and the warrant agreement amendment. Stockholders and warrantholders will also be able to obtain copies of the Registration Statement which includes the proxy statement/prospectus, without charge , at the SEC's Internet site at http://www.sec.gov or by directing a request to: ROI Acquisition Corp. II, 601 Lexington Avenue, 5 1st Floor, New York, New York 10022, tel. (212) 825 - 0400, Attention: Joseph A. De Perio. This presentation includes "forward looking statements" within the meaning of the "safe harbor" provisions of the United States Pr iva te Securities Litigation Reform Act of 1995. Forward - looking statements may be identified by the use of words such as "anticipate", "believe", "expect", "estimate", "plan", "outlook", and "project" and other similar expressions that predict or indicate future events or trends or that are not statements of historical matters and includes statements regarding future financial and operating performance. Such forward looking statements include statements with respect to financial and operati ng performance, strategies, prospects and other aspects of the businesses of ROI, Ascend and the combined company after completion of the proposed business combination, and are based on current expectations that are subject to risks and un certainties. A number of factors could cause actual results or outcomes to differ materially from those indicated by such forward looking statements. These factors include, but are not limited to: (1) the occurrence of any event, change or other circumstances that could give rise to the termination of the merger agreement; (2) the outcome of any legal proceedings that may be instituted against ROI, Ascend or others following announcement of the merger agreement and transactions contemplated therein; (3) the inability to complete the transactions contemplated by the merger agreement due to the failure to obtain approval of the stockholders of ROI to extend the deadline by which to complete a business combination or to approve the business combination, or satisfy other conditions to closing in the merger agreement; (4) the ability to meet Nasdaq’s listing standards following the merger; (5) the risk that the proposed transaction disrupts current plans and operations as a result of the announcement and consummation of the transactions described herein; (6) the ability to recognize the anticipated benefits of the business combination, which may be affected by, among other things, competition, the ability of t he combined company to grow and manage growth profitably, maintain relationships with suppliers and obtain adequate supply of products and retain its management and key employees; (7) costs related to the proposed business combination; (8) changes in applicable laws or regulations; (9) the possibility that Ascend may be adversely affected by other economic, business, and/or competitive factors; and (10) other risks and uncertainties indicated in the Registration Statement, including those under “Risk Factors” therein, and other filings with the SEC by ROI. You are cautioned not to place undue reliance upon any forward - looking statements, which speak only as of the date made, and ROI and Ascend undertake no obligation to update or revise the forward - looking statements, whether as a result of new information, future events or otherwise. Historical Financial Information. The balance sheet and results of operations information presented herein is presented on a predecessor basis, as described in more detail in the proxy statement/prospectus. Non - IFRS Financial Measures. This presentation also includes forecasted 2016 and reported 2015, 2014 and 2013 EBITDA, which are non - IFRS financial measures. EBITDA is calculated as earnings before interest and taxes plus depreciation and amortization. Ascend’s management uses these non - IFRS measures to compare the Company’s performance to that of prior periods for trend analyses, for purposes of determining management incentive compensation, and for budgeting and planning purposes. These measures are used in monthly financial reports prepared for management and Ascend’s board of directors. Ascend believes that the use of these non - IFRS financial measures provides an additional tool for investors to use in evaluating ongoing operating results and trends and in comparing the Company’s financial measures with other telecom infrastructure companies, many of which present similar non - IFRS financial measures to investors. Management of Ascend does not consider these non - IFRS measures in isolation or as an alternative to financial measures determined in accordance with IFRS. The principal limitation of these non - IFRS financial measures is that they exclude significant expenses and income that are required by IFRS to be recorded in the Predecessor Ascend’s financial statements. In addition, they are subject to inherent limitations as they reflect the exercise of judgments by management about which expenses and income are excluded or included in determining these non - IFRS financial measures. In order to compensate for these limitations, management presents non - IFRS financial measures in connection with IFRS results. You should review the financial statements and other financial information of Predecessor Ascend in the proxy statement / prospectus included in the Registration Statement and not rely on any single financial measure to evaluate Ascend’s business. Please refer to the Appendix for a reconciliation of these non - IFRS financial measures to the most directly comparable IFRS financial measures. Market & Industry Data. The market and industry data contained in this presentation are based on Ascend’s own estimates, internal research, surveys and studies conducted by third parties and industry and general publications and, in each case, are believed by Ascend’s management to be reasonable estimates. This data is subject to change and cannot always be verified with complete certainty due to limits on the availability and reliability of raw data, the voluntary nature of the data gathering process and other limitations and uncertainties inherent in any statistical survey of market or industry data. As a result, we do not guarantee the accuracy and completeness of this data. Disclaimer . This communication shall not constitute an offer to sell or the solicitation of an offer to buy any securities, nor shall there be any sale of securities in any jurisdiction in which the offer, solicitation or sale would be unlawful prior to the registration or qualification under the securities laws of any such jurisdiction. No offering of securities shall be made except by means of a prospectus meeting the requirements of Section 10 of the Securities Act of 1933, as amended. Participants in the Solicitation. ROI and its directors and officers may be deemed participants in the solicitation of proxies to ROI’s stockholders with respect to the transaction and ROI’s public unitholders in connection with the proposed amendment to the warrant agreement. A list of the names of those directors and officers and a description of their interests in ROI is contained in ROI’s prospectus dated September 16, 2013, which was filed with the SEC on September 18, 2013, and will also be contained in the definitive proxy statement/prospectus for the proposed business combination when available. Exchange rate used throughout presentation: 1US$ = INR 63.3 as of 7/10/15. Source: Federal Reserve Statistical Release, Board of Governors of the Federal Reserve System. Exchange rates are subject to fluctuation, which may be significant. See "Exchange Rates” in the proxy statement / prospectus.
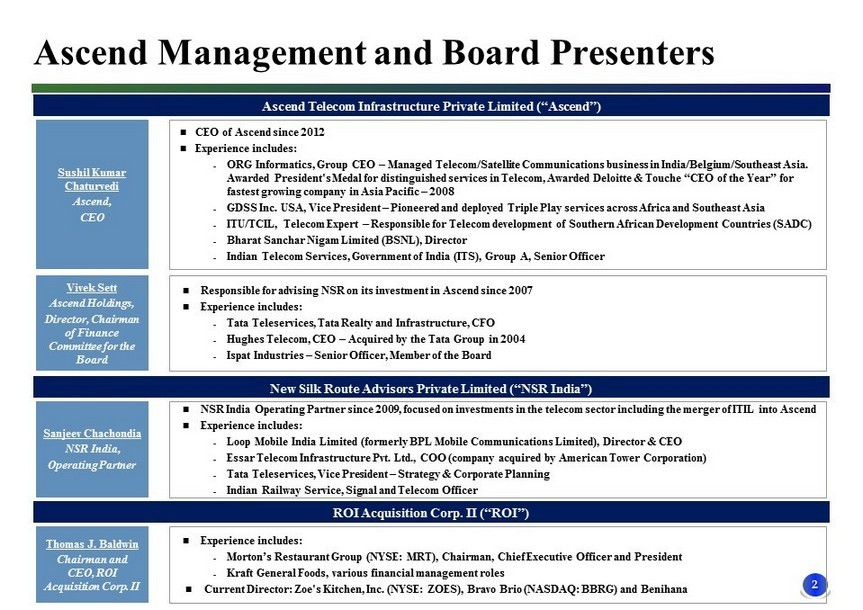
2 Ascend Management and Board Presenters Vivek Sett Ascend Holdings, Director, Chairman of Finance Committee for the Board Responsible for advising NSR on its investment in Ascend since 2007 Experience includes: ˗ Tata Teleservices, Tata Realty and Infrastructure, CFO ˗ Hughes Telecom, CEO – Acquired by the Tata Group in 2004 ˗ Ispat Industries – Senior Officer, Member of the Board Sanjeev Chachondia NSR India, Operating Partner NSR India Operating Partner since 2009, focused on investments in the telecom sector including the merger of ITIL into Ascend Experience includes: ˗ Loop Mobile India Limited (formerly BPL Mobile Communications Limited), Director & CEO ˗ Essar Telecom Infrastructure Pvt. Ltd., COO (company acquired by American Tower Corporation) ˗ Tata Teleservices, Vice President – Strategy & Corporate Planning ˗ Indian Railway Service, Signal and Telecom Officer Sushil Kumar Chaturvedi Ascend, CEO CEO of Ascend since 2012 Experience includes: ˗ ORG Informatics, Group CEO – Managed Telecom/Satellite Communications business in India/Belgium/Southeast Asia. Awarded President's Medal for distinguished services in Telecom, Awarded Deloitte & Touche “CEO of the Year” for fastest growing company in Asia Pacific – 2008 ˗ GDSS Inc. USA, Vice President – Pioneered and deployed Triple Play services across Africa and Southeast Asia ˗ ITU/TCIL, Telecom Expert – Responsible for Telecom development of Southern African Development Countries (SADC) ˗ Bharat Sanchar Nigam Limited (BSNL), Director ˗ Indian Telecom Services, Government of India (ITS), Group A, Senior Officer Ascend Telecom Infrastructure Private Limited (“Ascend”) New Silk Route Advisors Private Limited (“NSR India”) ROI Acquisition Corp. II (“ROI”) Thomas J. Baldwin Chairman and CEO, ROI Acquisition Corp. II Experience includes: ˗ Morton’s Restaurant Group (NYSE: MRT ), Chairman , Chief Executive Officer and President ˗ Kraft General Foods, various financial management roles Current Director: Zoe's Kitchen, Inc. (NYSE : ZOES ), Bravo Brio (NASDAQ: BBRG ) and Benihana
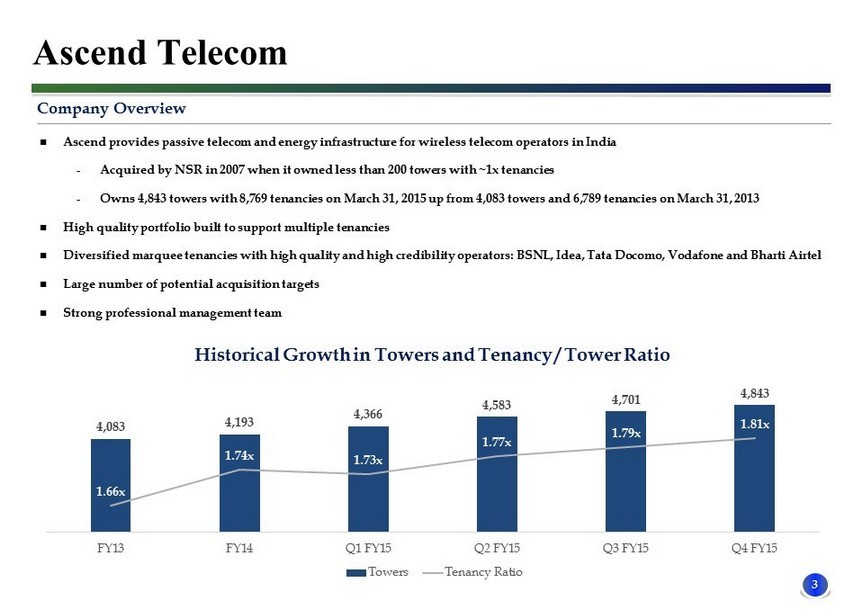
3 Company Overview Ascend provides passive telecom and energy infrastructure for wireless telecom operators in India ˗ Acquired by NSR in 2007 when it owned less than 200 towers with ~1x tenancies ˗ Owns 4,843 towers with 8,769 tenancies on March 31, 2015 up from 4,083 towers and 6,789 tenancies on March 31, 2013 High quality portfolio built to support multiple tenancies Diversified marquee tenancies with high quality and high credibility operators: BSNL, Idea, Tata Docomo , Vodafone and Bharti Airtel Large number of potential acquisition targets Strong professional management team Ascend Telecom
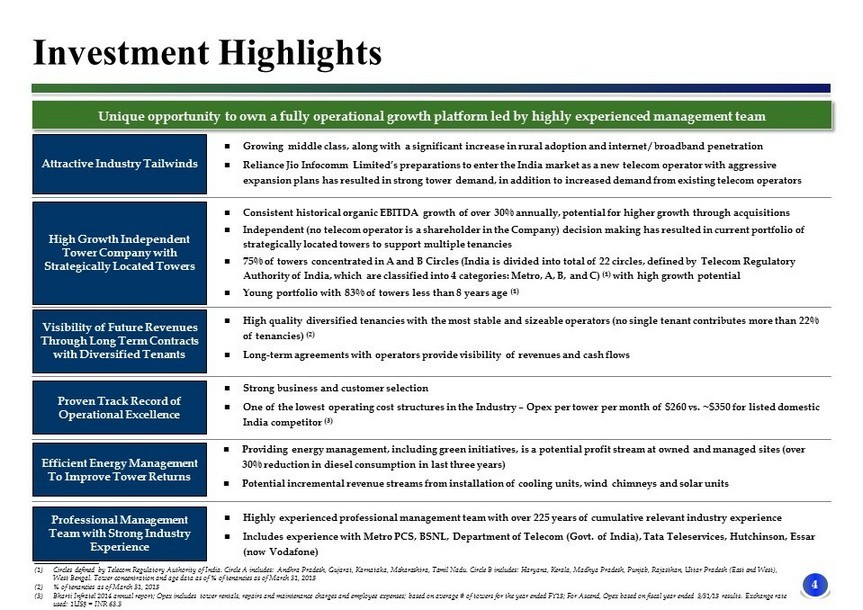
4 __________________ (1) Circles defined by Telecom Regulatory Authority of India. Circle A includes: Andhra Pradesh, Gujarat, Karnataka, Maharashtra, Ta mil Nadu. Circle B includes: Haryana, Kerala, Madhya Pradesh, Punjab, Rajasthan, Uttar Pradesh (East and West), West Bengal. Tower concentration and age data as of % of tenancies as of March 31, 2015 (2) % of tenancies as of March 31, 2015 (3) Bharti Infratel 2014 annual report; Opex includes tower rentals, repairs and maintenance charges and employee expenses; based on average # of towers for the year ended FY15; For Ascend, Opex based on fiscal year ended 3/31/15 results. Exchange rate used: 1US$ = INR 63.3 Consistent historical organic EBITDA growth of over 30% annually, potential for higher growth through acquisitions Independent (no telecom operator is a shareholder in the Company) decision making has resulted in current portfolio of strategically located towers to support multiple tenancies 75% of towers concentrated in A and B Circles (India is divided into total of 22 circles, defined by Telecom Regulatory Authority of India, which are classified into 4 categories: Metro, A, B, and C) (1) with high growth potential Young portfolio with 83% of towers less than 8 years age (1) High quality diversified tenancies with the most stable and sizeable operators (no single tenant contributes more than 22% of tenancies) (2) Long - term agreements with operators provide visibility of revenues and cash flows Strong business and customer selection One of the lowest operating cost structures in the Industry – Opex per tower per month of $260 vs. ~$350 for listed domestic India competitor (3) Providing energy management, including green initiatives, is a potential profit stream at owned and managed sites (over 30% reduction in diesel consumption in last three years) Potential incremental revenue streams from installation of cooling units, wind chimneys and solar units Highly experienced professional management team with over 225 years of cumulative relevant industry experience Includes experience with Metro PCS, BSNL, Department of Telecom (Govt. of India), Tata Teleservices, Hutchinson, Essar (now Vodafone) Unique opportunity to own a fully operational growth platform led by highly experienced management team Investment Highlights Efficient Energy Management To Improve Tower Returns Proven Track Record of Operational Excellence Professional Management Team with Strong Industry Experience High Growth Independent Tower Company with Strategically Located Towers Visibility of Future Revenues Through Long Term Contracts with Diversified Tenants Growing middle class, along with a significant increase in rural adoption and internet / broadband penetration Reliance Jio Infocomm Limited’s preparations to enter the India market as a new telecom operator with aggressive expansion plans has resulted in strong tower demand, in addition to increased demand from existing telecom operators Attractive Industry Tailwinds
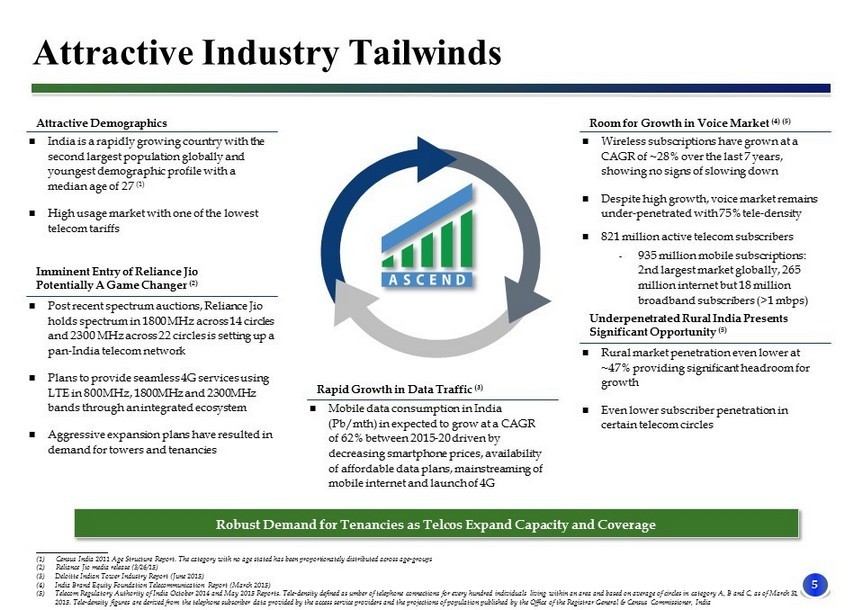
5 ____________________ (1) Census India 2011 Age Structure Report. The category with no age stated has been proportionately distributed across age - groups (2) Reliance Jio media release (3/26/15) (3) Deloitte Indian Tower Industry Report (June 2015) (4) India Brand Equity Foundation Telecommunication Report (March 2015) (5) Telecom Regulatory Authority of India October 2014 and May 2015 Reports. Tele - density defined as umber of telephone connections for every hundred individuals living within an area and based on average of circles in category A, B and C, as of March 31, 2015. Tele - density figures are derived from the telephone subscriber data provided by the access service providers and the proje ctions of population published by the Office of the Registrar General & Census Commissioner, India Robust Demand for Tenancies as Telcos Expand Capacity and Coverage Attractive Demographics India is a rapidly growing country with the second largest population globally and youngest demographic profile with a median age of 27 (1) High usage market with one of the lowest telecom tariffs Room for Growth in Voice Market (4) (5) Wireless subscriptions have grown at a CAGR of ~28% over the last 7 years, showing no signs of slowing down Despite high growth, voice market remains under - penetrated with 75% tele - density 821 million active telecom subscribers ˗ 935 million mobile subscriptions: 2nd largest market globally, 265 million internet but 18 million broadband subscribers (>1 mbps) Underpenetrated Rural India Presents Significant Opportunity (5) Rural market penetration even lower at ~47% providing significant headroom for growth Even lower subscriber penetration in certain telecom circles Rapid Growth in Data Traffic (3) Mobile data consumption in India (Pb/mth) in expected to grow at a CAGR of 62% between 2015 - 20 driven by decreasing smartphone prices, availability of affordable data plans, mainstreaming of mobile internet and launch of 4G Imminent Entry of Reliance Jio Potentially A Game Changer (2) Post recent spectrum auctions, Reliance Jio holds spectrum in 1800 MHz across 14 circles and 2300 MHz across 22 circles is setting up a pan - India telecom network Plans to provide seamless 4G services using LTE in 800MHz, 1800MHz and 2300MHz bands through an integrated ecosystem Aggressive expansion plans have resulted in demand for towers and tenancies Attractive Industry Tailwinds
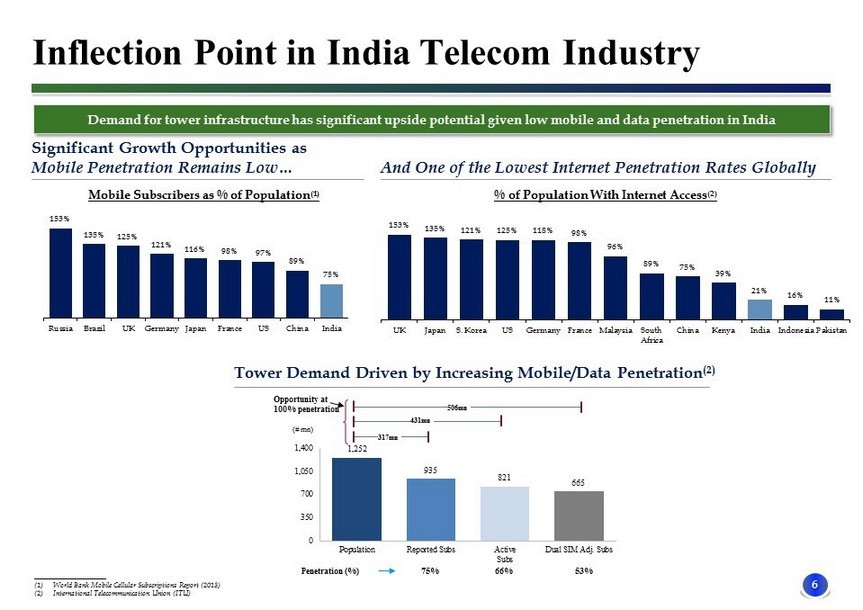
6 ____________________ (1) World Bank Mobile Cellular Subscriptions Report (2013) (2) International Telecommunication Union (ITU) Significant Growth Opportunities as Mobile Penetration Remains Low… Mobile Subscribers as % of Population (1) Inflection Point in India Telecom Industry And One of the Lowest Internet Penetration Rates Globally % of Population With Internet Access (2) Penetration (%) 75% 66% 53% Opportunity at 100% penetration 317mn 431mn 506mn (# mn) Tower Demand Driven by Increasing Mobile/Data Penetration (2) Demand for tower infrastructure has significant upside potential given low mobile and data penetration in India
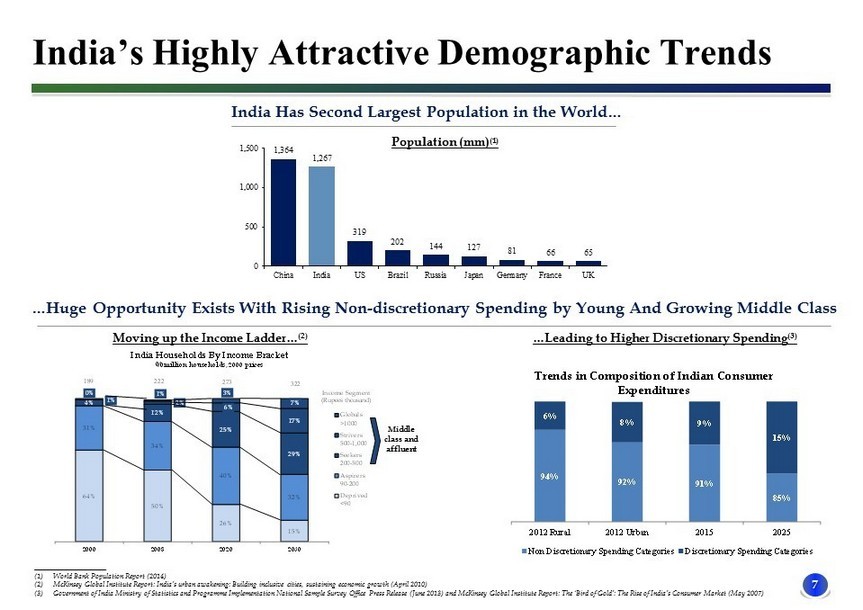
7 ____________________ (1) World Bank Population Report (2014) (2) McKinsey Global Institute Report: India’s urban awakening: Building inclusive cities, sustaining economic growth (April 2010) (3) Government of India Ministry of Statistics and Programme Implementation National Sample Survey Office Press Release (June 2013) and McKinsey Global Institute Report: The ‘Bird of Gol d’ : The Rise of India’s Consumer Market (May 2007) India Has Second Largest Population in the World… …Huge Opportunity Exists With Rising Non - discretionary Spending by Young And Growing Middle Class …Leading to Higher Discretionary Spending (3) Moving up the Income Ladder… (2) Population (mm) (1) India’s Highly Attractive Demographic Trends 64% 50% 26% 15% 31% 34% 40% 32% 4% 12% 25% 29% 1% 2% 6% 17% 0% 1% 3% 7% 2000 2008 2020 2030 India Households By Income Bracket % million households, 2000 prices Globals >1000 Strivers 500-1,000 Seekers 200-500 Aspirers 90-200 Deprived <90 Income Segment (Rupees thousand) 189 322 273 222 Middle class and affluent 94% 92% 91% 85% 6% 8% 9% 15% 2012 Rural 2012 Urban 2015 2025 Trends in Composition of Indian Consumer Expenditures Non Discretionary Spending Categories Discretionary Spending Categories
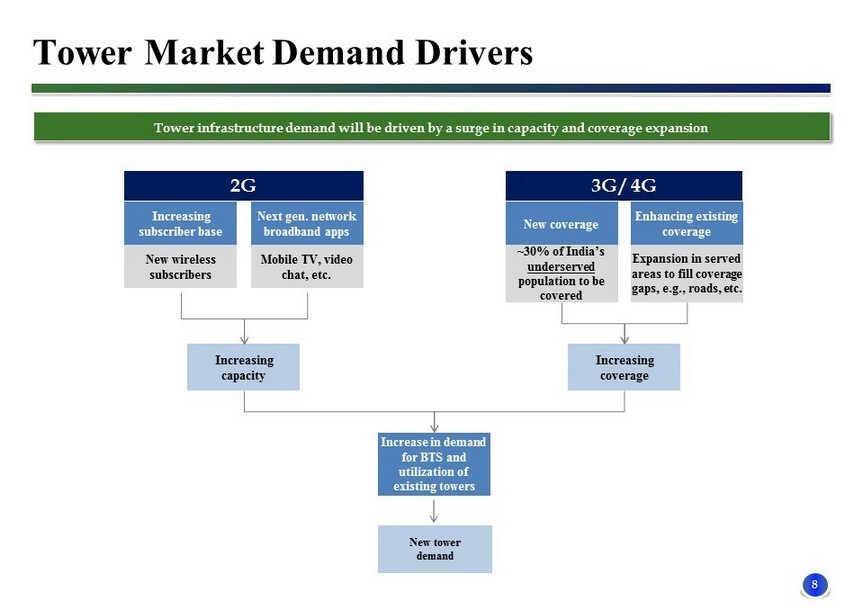
8 Tower Market Demand Drivers Increasing subscriber base New wireless subscribers Next gen. network broadband apps Mobile TV, video chat, etc. New coverage ~30% of India’s underserved population to be covered Enhancing existing coverage Expansion in served areas to fill coverage gaps, e.g., roads, etc. Increasing capacity Increasing coverage New tower demand Increase in demand for BTS and utilization of existing towers 2G 3G / 4G Tower infrastructure demand will be driven by a surge in capacity and coverage expansion
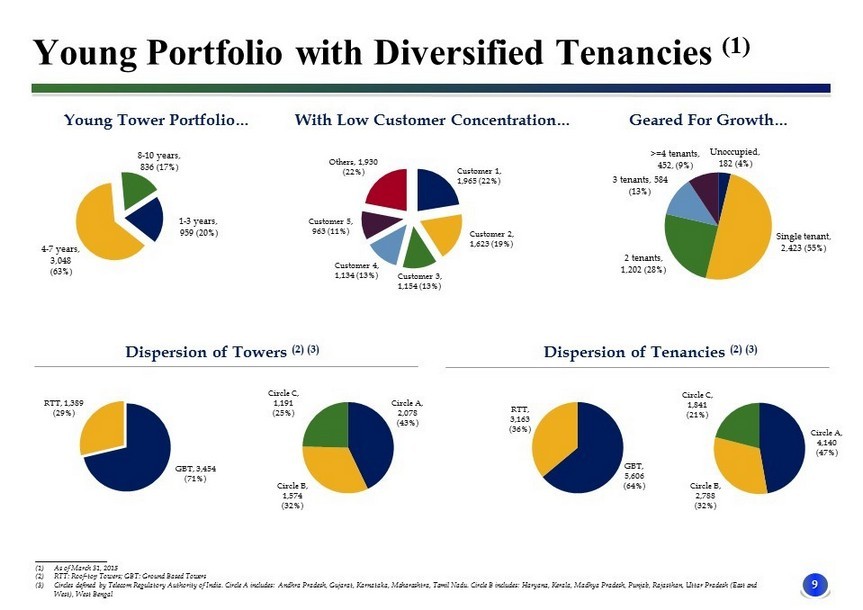
9 Young Tower Portfolio… With Low Customer Concentration… Geared For Growth… Dispersion of Towers (2) (3) Dispersion of Tenancies (2) (3) Young Portfolio with Diversified Tenancies (1) ____________________ (1) As of March 31, 2015 (2) RTT: Roof - top Towers; GBT: Ground Based Towers (3) Circles defined by Telecom Regulatory Authority of India. Circle A includes: Andhra Pradesh, Gujarat, Karnataka, Maharashtra, Ta mil Nadu. Circle B includes: Haryana, Kerala, Madhya Pradesh, Punjab, Rajasthan, Uttar Pradesh (East and West), West Bengal
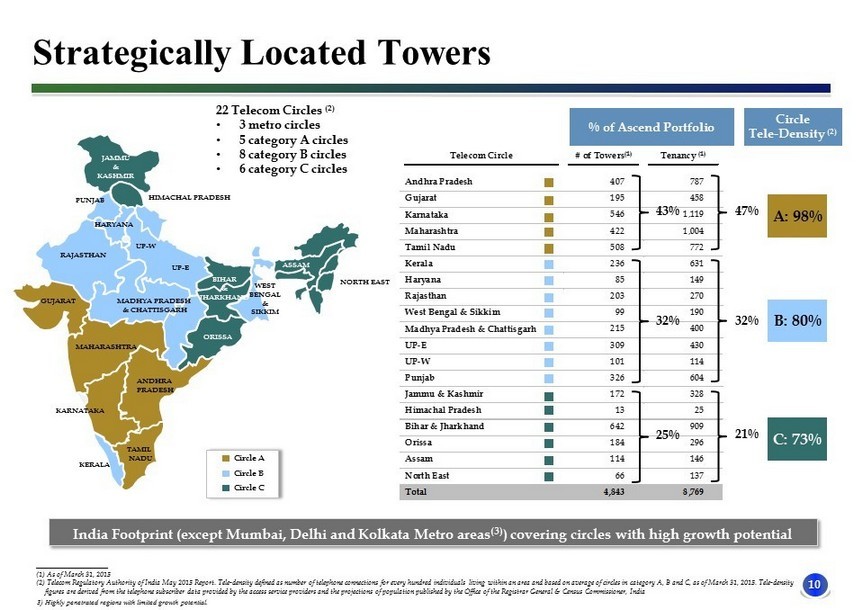
10 India Footprint (except Mumbai, Delhi and Kolkata Metro areas (3) ) covering circles with high growth potential ____________________ (1) As of March 31, 2015 (2) Telecom Regulatory Authority of India May 2015 Report. Tele - density defined as number of telephone connections for every hun dred individuals living within an area and based on average of circles in category A, B and C, as of March 31, 2015. Tele - density figures are derived from the telephone subscriber data provided by the access service providers and the projections of popula tio n published by the Office of the Registrar General & Census Commissioner, India WEST BENGAL & SIKKIM ORISSA ASSAM NORTH EAST BIHAR & JHARKHAND UP - E UP - W JAMMU & KASHMIR HIMACHAL PRADESH PUNJAB HARYANA RAJASTHAN GUJARAT MADHYA PRADESH & CHATTISGARH MAHARASHTRA KERALA KARNATAKA TAMIL NADU ANDHRA PRADESH Telecom Circle # of Towers (1) Tenancy (1) Andhra Pradesh 407 787 Gujarat 195 458 Karnataka 546 1,119 Maharashtra 422 1,004 Tamil Nadu 508 772 Kerala 236 631 Haryana 85 149 Rajasthan 203 270 West Bengal & Sikkim 99 190 Madhya Pradesh & Chattisgarh 215 400 UP-E 309 430 UP-W 101 114 Punjab 326 604 Jammu & Kashmir 172 328 Himachal Pradesh 13 25 Bihar & Jharkhand 642 909 Orissa 184 296 Assam 114 146 North East 66 137 Total 4,843 8,769 Circle A Circle B Circle C Circle Tele - Density (2) 32% 25% Strategically Located Towers 43% A: 98% B: 80% C: 73% 32% 21% 47% % of Ascend Portfolio 22 Telecom Circles (2) • 3 metro circles • 5 category A circles • 8 category B circles • 6 category C circles 3) Highly penetrated regions with limited growth potential.
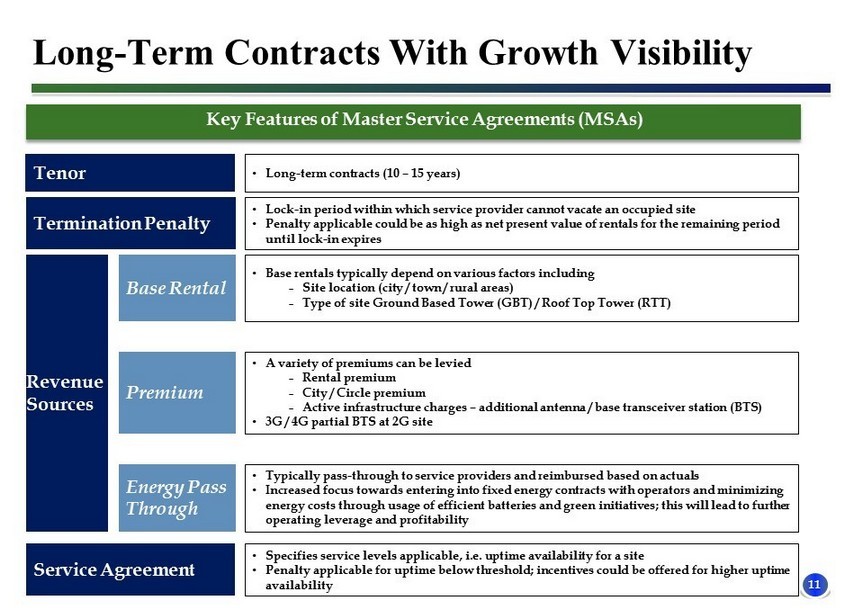
11 3 Long - Term Contracts With Growth Visibility x Key Features of Master Service Agreements (MSAs) Tenor Termination Penalty Revenue Sources Base Rental Premium Energy Pass Through Service Agreement • Long - term contracts (10 – 15 years) • Lock - in period within which service provider cannot vacate an occupied site • Penalty applicable could be as high as net present value of rentals for the remaining period until lock - in expires • Base rentals typically depend on various factors including ˗ Site location (city / town / rural areas) ˗ Type of site Ground Based Tower (GBT) / Roof Top Tower (RTT) • A variety of premiums can be levied ˗ Rental premium ˗ City / Circle premium ˗ Active infrastructure charges – additional antenna / base transceiver station (BTS) • 3G / 4G partial BTS at 2G site • Typically pass - through to service providers and reimbursed based on actuals • Increased focus towards entering into fixed energy contracts with operators and minimizing energy costs through usage of efficient batteries and green initiatives; this will lead to further operating leverage and profitability • Specifies service levels applicable, i.e. uptime availability for a site • Penalty applicable for uptime below threshold; incentives could be offered for higher uptime availability
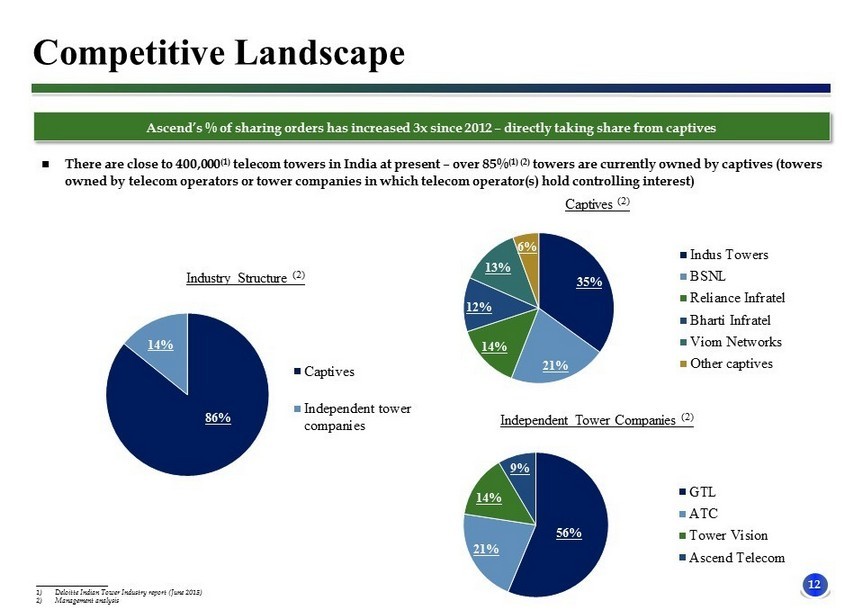
12 86% 14% Industry Structure (2) Captives Independent tower companies Competitive Landscape There are close to 400,000 (1) telecom towers in India at present – over 85% (1) (2) towers are currently owned by captives (towers owned by telecom operators or tower companies in which telecom operator(s) hold controlling interest) ____________________ 1) Deloitte Indian Tower Industry report (June 2015) 2) Management analysis Ascend’s % of sharing orders has increased 3x since 2012 – directly taking share from captives 56% 21% 14% 9% Independent Tower Companies (2) GTL ATC Tower Vision Ascend Telecom 35% 21% 14% 12% 13% 6% Captives (2) Indus Towers BSNL Reliance Infratel Bharti Infratel Viom Networks Other captives
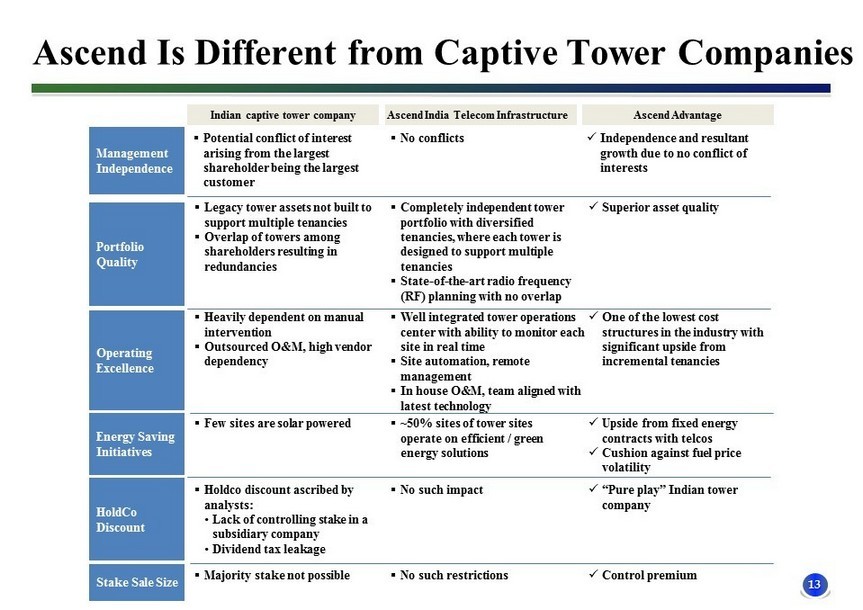
13 Ascend Is Different from Captive Tower Companies Management Independence Portfolio Quality Operating Excellence Energy Saving Initiatives Indian captive tower company Ascend India Telecom Infrastructure Ascend Advantage ▪ Potential conflict of interest arising from the largest shareholder being the largest customer ▪ No conflicts x Independence and resultant growth due to no conflict of interests ▪ Legacy tower assets not built to support multiple tenancies ▪ Overlap of towers among shareholders resulting in redundancies ▪ Completely independent tower portfolio with diversified tenancies, where each tower is designed to support multiple tenancies ▪ State - of - the - art radio frequency (RF) planning with no overlap x Superior asset quality ▪ Heavily dependent on manual intervention ▪ Outsourced O&M, high vendor dependency x One of the lowest cost structures in the industry with significant upside from incremental tenancies ▪ Well integrated tower operations center with ability to monitor each site in real time ▪ Site automation, remote management ▪ In house O&M, team aligned with latest technology ▪ Few sites are solar powered ▪ ~50% sites of tower sites operate on efficient / green energy solutions x Upside from fixed energy contracts with telcos x Cushion against fuel price volatility HoldCo Discount Stake Sale Size ▪ Holdco discount ascribed by analysts: • Lack of controlling stake in a subsidiary company • Dividend tax leakage x “Pure play” Indian tower company ▪ No such impact ▪ Majority stake not possible ▪ No such restrictions x Control premium
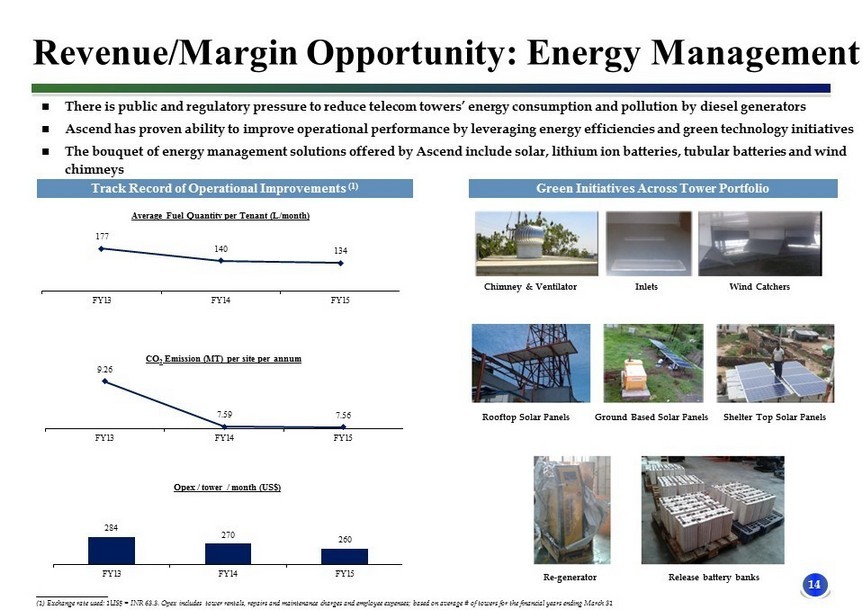
14 Average Fuel Quantity per Tenant (L/month) CO 2 Emission (MT) per site per annum Opex / tower / month (US$) Rooftop Solar Panels Ground Based Solar Panels Shelter Top Solar Panels Chimney & Ventilator Inlets Wind Catchers Re - generator Release battery banks Revenue/Margin Opportunity: Energy Management There is public and regulatory pressure to reduce telecom towers’ energy consumption and pollution by diesel generators Ascend has proven ability to improve operational performance by leveraging energy efficiencies and green technology initiativ es The bouquet of energy management solutions offered by Ascend include solar, lithium ion batteries, tubular batteries and wind chimneys Green Initiatives Across Tower Portfolio Track Record of Operational Improvements (1) ____________________ (1) Exchange rate used: 1US$ = INR 63.3. Opex includes tower rentals, repairs and maintenance charges and employee expenses; based on average # of towers for the financial y ears ending March 31
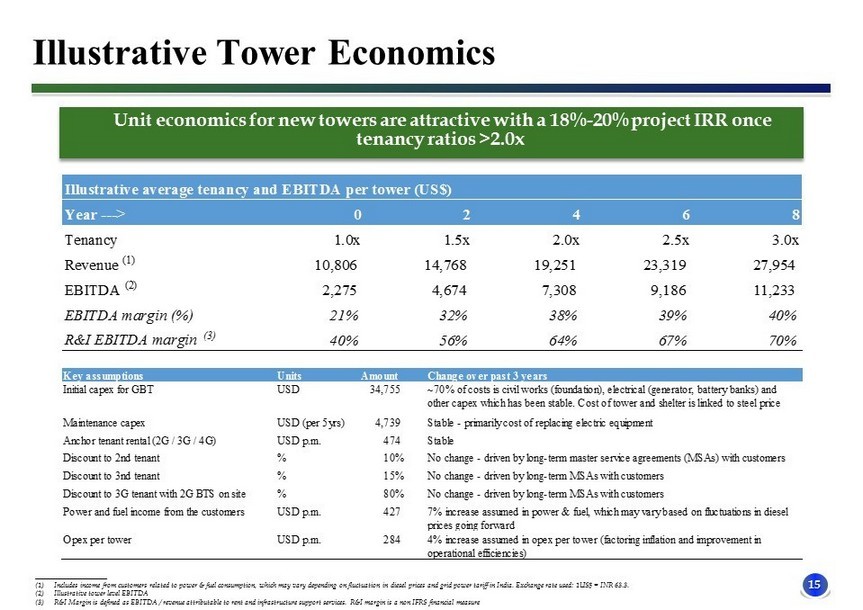
15 x Unit economics for new towers are attractive with a 18% - 20% project IRR once tenancy ratios >2.0x Illustrative Tower Economics ____________________ (1) Includes income from customers related to power & fuel consumption, which may vary depending on fluctuation in diesel prices and grid power tariff in India. Exchange rate used: 1US$ = INR 63.3. (2) Illustrative tower level EBITDA (3) R&I Margin is defined as EBITDA / revenue attributable to rent and infrastructure support services. R&I margin is a non IFRS fin ancial measure Key assumptions Units Amount Change over past 3 years Initial capex for GBT USD 34,755 ~70% of costs is civil works (foundation), electrical (generator, battery banks) and other capex which has been stable. Cost of tower and shelter is linked to steel price Maintenance capex USD (per 5yrs) 4,739 Stable - primarily cost of replacing electric equipment Anchor tenant rental (2G / 3G / 4G) USD p.m. 474 Stable Discount to 2nd tenant % 10% No change - driven by long-term master service agreements (MSAs) with customers Discount to 3nd tenant % 15% No change - driven by long-term MSAs with customers Discount to 3G tenant with 2G BTS on site % 80% No change - driven by long-term MSAs with customers Power and fuel income from the customers USD p.m. 427 7% increase assumed in power & fuel, which may vary based on fluctuations in diesel prices going forward Opex per tower USD p.m. 284 4% increase assumed in opex per tower (factoring inflation and improvement in operational efficiencies) Illustrative average tenancy and EBITDA per tower (US$) Year ---> 0 2 4 6 8 Tenancy 1.0x 1.5x 2.0x 2.5x 3.0x Revenue (1) 10,806 14,768 19,251 23,319 27,954 EBITDA (2) 2,275 4,674 7,308 9,186 11,233 EBITDA margin (%) 21% 32% 38% 39% 40% R&I EBITDA margin (3) 40% 56% 64% 67% 70%
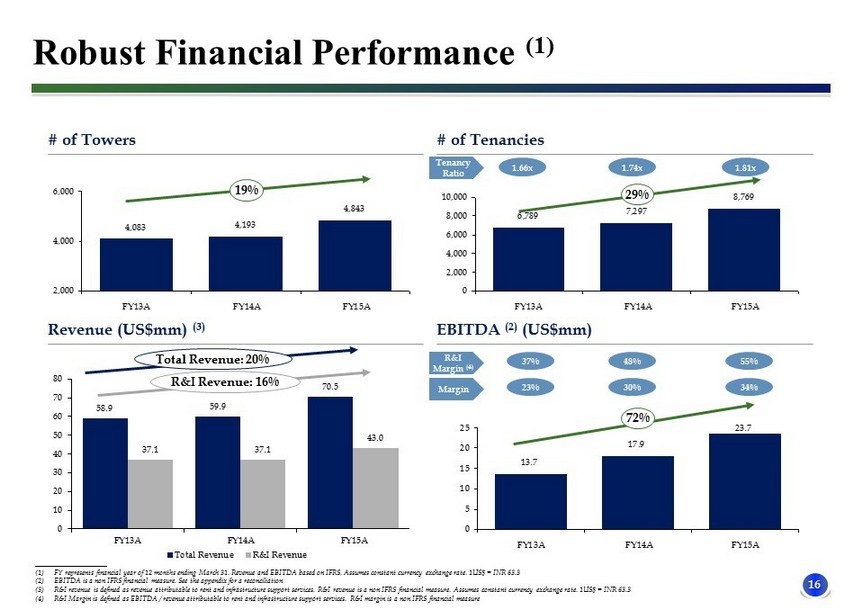
16 ____________________ (1) FY represents financial year of 12 months ending March 31. Revenue and EBITDA based on IFRS. Assumes constant currency exchan ge rate. 1US$ = INR 63.3 (2) EBITDA is a non IFRS financial measure. See the appendix for a reconciliation (3) R&I revenue is defined as revenue attributable to rent and infrastructure support services. R&I revenue is a non IFRS financi al measure. Assumes constant currency exchange rate. 1US$ = INR 63.3 (4) R&I Margin is defined as EBITDA / revenue attributable to rent and infrastructure support services. R&I margin is a non IFRS fin ancial measure # of Tenancies 4,083 4,193 4,843 2,000 4,000 6,000 FY13A FY14A FY15A # of Towers 6,789 7,297 8,769 0 2,000 4,000 6,000 8,000 10,000 FY13A FY14A FY15A EBITDA (2) (US$mm) Revenue (US$mm) (3) 1.66x 1.81x Tenancy Ratio 13.7 17.9 23.7 0 5 10 15 20 25 FY13A FY14A FY15A 23% 34% Margin 19% 29% Total Revenue: 20% 72% 1.74x 30% Robust Financial Performance (1) 37% 55% R&I Margin (4) 48% R&I Revenue: 16%
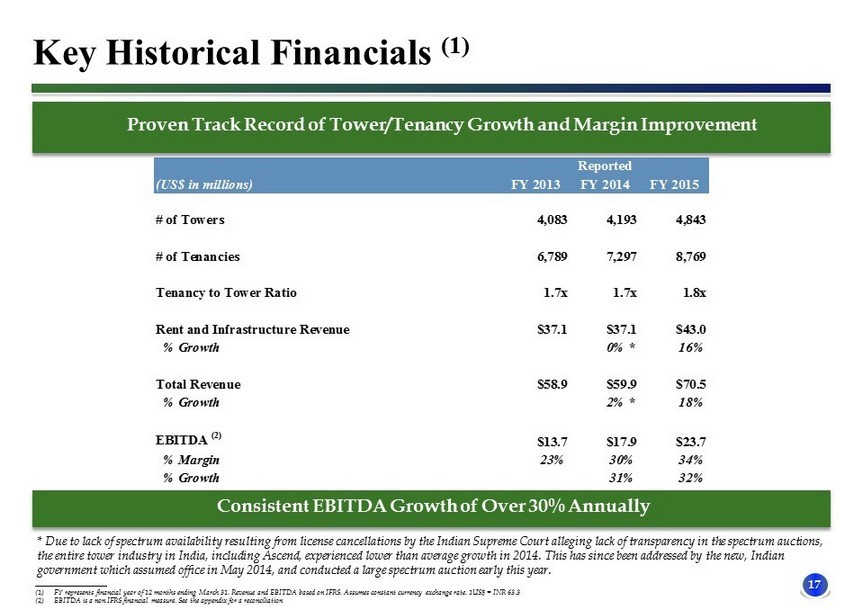
17 Reported (US$ in millions) FY 2013 FY 2014 FY 2015 # of Towers 4,083 4,193 4,843 # of Tenancies 6,789 7,297 8,769 Tenancy to Tower Ratio 1.7x 1.7x 1.8x Rent and Infrastructure Revenue $37.1 $37.1 $43.0 % Growth 0% * 16% Total Revenue $58.9 $59.9 $70.5 % Growth 2% * 18% EBITDA (2) $13.7 $17.9 $23.7 % Margin 23% 30% 34% % Growth 31% 32% 3 Key Historical Financials (1) ____________________ (1) FY represents financial year of 12 months ending March 31. Revenue and EBITDA based on IFRS. Assumes constant currency exchan ge rate. 1US$ = INR 63.3 (2) EBITDA is a non IFRS financial measure. See the appendix for a reconciliation x Proven Track Record of Tower/Tenancy Growth and Margin Improvement Consistent EBITDA Growth of Over 30% Annually * Due to lack of spectrum availability resulting from license cancellations by the Indian Supreme Court alleging lack of tran spa rency in the spectrum auctions, the entire tower industry in India, including Ascend, experienced lower than average growth in 2014. This has since been addr ess ed by the new, Indian government which assumed office in May 2014, and conducted a large spectrum auction early this year.
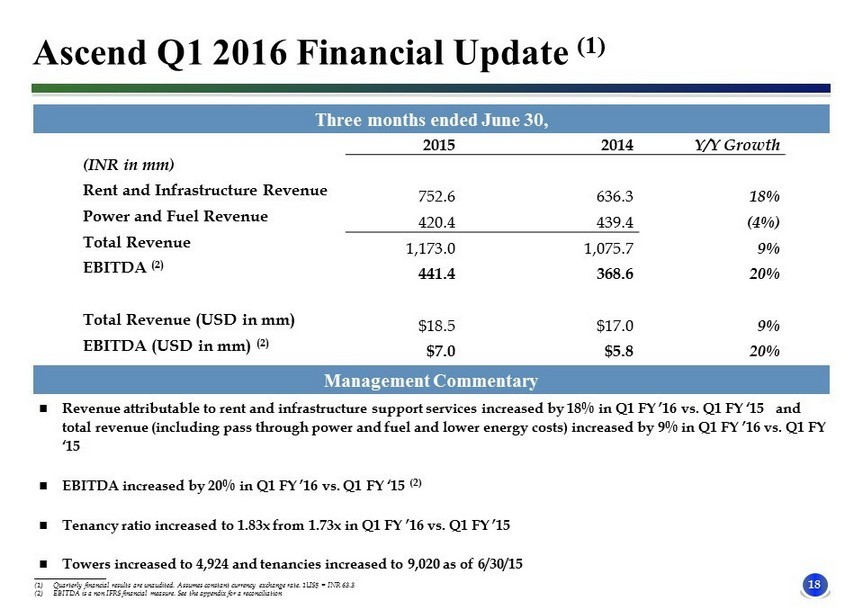
18 2015 2014 Y/Y Growth (INR in mm) Rent and Infrastructure Revenue 752.6 636.3 18% Power and Fuel Revenue 420.4 439.4 (4%) Total Revenue 1,173.0 1,075.7 9% EBITDA (2) 441.4 368.6 20% Total Revenue (USD in mm) $18.5 $17.0 9% EBITDA (USD in mm) (2) $7.0 $5.8 20% Ascend Q1 2016 Financial Update (1) Three months ended June 30, Revenue attributable to rent and infrastructure support services increased by 18% in Q1 FY ’16 vs. Q1 FY ‘15 and total revenue (including pass through power and fuel and lower energy costs) increased by 9% in Q1 FY ’16 vs. Q1 FY ‘15 EBITDA increased by 20% in Q1 FY ’16 vs. Q1 FY ‘15 (2) Tenancy ratio increased to 1.83x from 1.73x in Q1 FY ’16 vs. Q1 FY ’15 Towers increased to 4,924 and tenancies increased to 9,020 as of 6/30/15 ____________________ (1) Quarterly financial results are unaudited. Assumes constant currency exchange rate. 1US$ = INR 63.3 (2) EBITDA is a non IFRS financial measure. See the appendix for a reconciliation Management Commentary
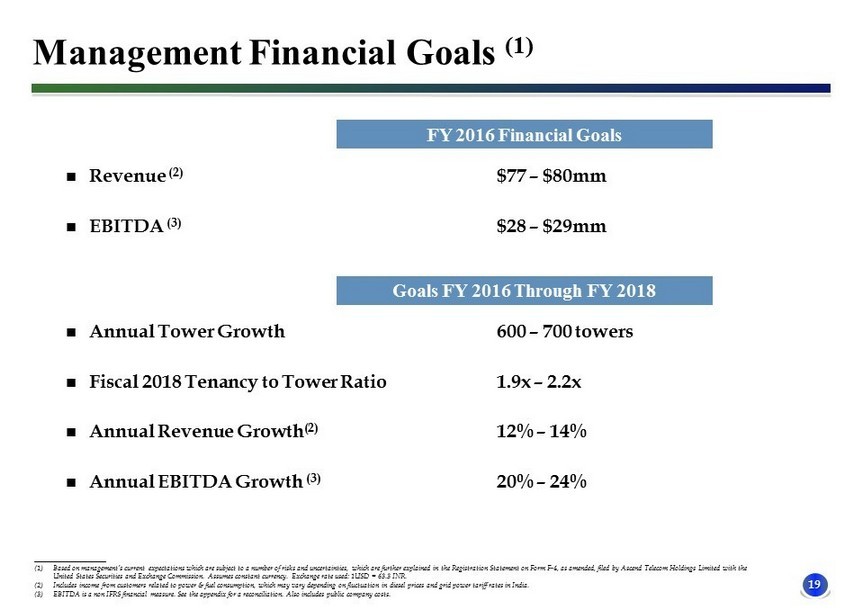
19 Management Financial Goals (1) Revenue (2) EBITDA (3) FY 2016 Financial Goals $77 – $80mm $28 – $29mm Annual Tower Growth Fiscal 2018 Tenancy to Tower Ratio Annual Revenue Growth (2) Annual EBITDA Growth (3) Goals FY 2016 Through FY 2018 600 – 700 towers 1.9x – 2.2x 12% – 14% 20% – 24% ____________________ (1) Based on management’s current expectations which are subject to a number of risks and uncertainties, which are further explai ned in the Registration Statement on Form F - 4, as amended, filed by Ascend Telecom Holdings Limited with the United States Securities and Exchange Commission. Assumes constant currency. Exchange rate used: 1USD = 63.3 INR. (2) Includes income from customers related to power & fuel consumption, which may vary depending on fluctuation in diesel prices and grid power tariff rates in India. (3) EBITDA is a non IFRS financial measure. See the appendix for a reconciliation. Also includes public company costs.
Transaction Overview
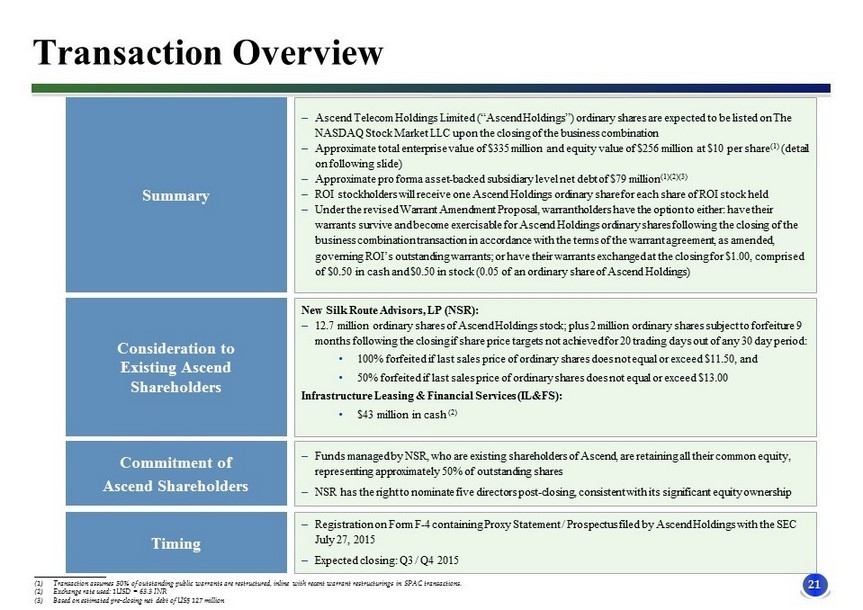
21 3 Transaction Overview Summary – Ascend Telecom Holdings Limited (“Ascend Holdings”) ordinary shares are expected to be listed on The NASDAQ Stock Market LLC upon the closing of the business combination – Approximate total enterprise value of $335 million and equity value of $256 million at $10 per share (1) (detail on following slide) – Approximate pro forma asset - backed subsidiary level net debt of $79 million (1)(2)(3) – ROI stockholders will receive one Ascend Holdings ordinary share for each share of ROI stock held – Under the revised Warrant Amendment Proposal, warrantholders have the option to either: have their warrants survive and become exercisable for Ascend Holdings ordinary shares following the closing of the business combination transaction in accordance with the terms of the warrant agreement, as amended, governing ROI’s outstanding warrants; or have their warrants exchanged at the closing for $1.00, comprised of $0.50 in cash and $0.50 in stock (0.05 of an ordinary share of Ascend Holdings) New Silk Route Advisors, LP (NSR): – 12.7 million ordinary shares of Ascend Holdings stock; plus 2 million ordinary shares subject to forfeiture 9 months following the closing if share price targets not achieved for 20 trading days out of any 30 day period: • 100% forfeited if last sales price of ordinary shares does not equal or exceed $11.50, and • 50% forfeited if last sales price of ordinary shares does not equal or exceed $13.00 Infrastructure Leasing & Financial Services (IL&FS): • $43 million in cash (2) – Funds managed by NSR, who are existing shareholders of Ascend, are retaining all their common equity, representing approximately 50% of outstanding shares – NSR has the right to nominate five directors post - closing, consistent with its significant equity ownership – Registration on Form F - 4 containing Proxy Statement / Prospectus filed by Ascend Holdings with the SEC July 27, 2015 – Expected closing: Q3 / Q4 2015 Consideration to Existing Ascend Shareholders Commitment of Ascend Shareholders Timing ____________________ (1) Transaction assumes 50% of outstanding public warrants are restructured, inline with recent warrant restructurings in SPAC tr ans actions. (2) Exchange rate used: 1USD = 63.3 INR (3) Based on estimated pre - closing net debt of US$ 127 million
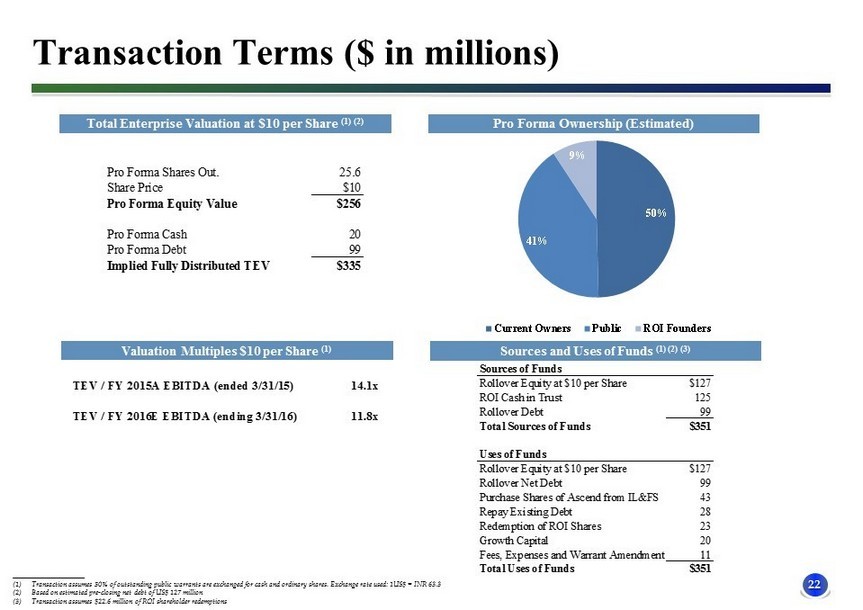
22 Transaction Terms ($ in millions) Total Enterprise Valuation at $10 per Share (1) (2) Pro Forma Ownership (Estimated) Valuation Multiples $10 per Share (1) Sources and Uses of Funds (1) (2) (3) ____________________ (1) Transaction assumes 50% of outstanding public warrants are exchanged for cash and ordinary shares. Exchange rate used: 1US$ = IN R 63.3 (2) Based on estimated pre - closing net debt of US$ 127 million (3) Transaction assumes $22.6 million of ROI shareholder redemptions TEV / FY 2015A EBITDA (ended 3/31/15) 14.1x TEV / FY 2016E EBITDA (ending 3/31/16) 11.8x 50% 41% 9% Current Owners Public ROI Founders Sources of Funds Rollover Equity at $10 per Share $127 ROI Cash in Trust 125 Rollover Debt 99 Total Sources of Funds $351 Uses of Funds Rollover Equity at $10 per Share $127 Rollover Net Debt 99 Purchase Shares of Ascend from IL&FS 43 Repay Existing Debt 28 Redemption of ROI Shares 23 Growth Capital 20 Fees, Expenses and Warrant Amendment 11 Total Uses of Funds $351 Pro Forma Shares Out. 25.6 Share Price $10 Pro Forma Equity Value $256 Pro Forma Cash 20 Pro Forma Debt 99 Implied Fully Distributed TEV $335
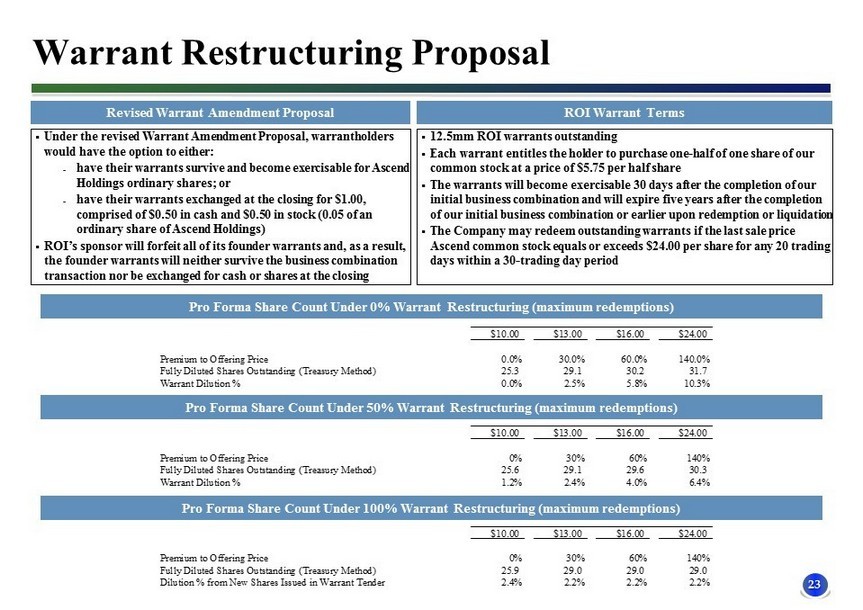
23 Warrant Restructuring Proposal Pro Forma Share Count Under 100% Warrant Restructuring (maximum redemptions) ▪ Under the revised Warrant Amendment Proposal, warrantholders would have the option to either: ˗ have their warrants survive and become exercisable for Ascend Holdings ordinary shares; or ˗ have their warrants exchanged at the closing for $1.00, comprised of $0.50 in cash and $0.50 in stock (0.05 of an ordinary share of Ascend Holdings) ▪ ROI’s sponsor will forfeit all of its founder warrants and, as a result, the founder warrants will neither survive the business combination transaction nor be exchanged for cash or shares at the closing ROI Warrant Terms Revised Warrant Amendment Proposal Pro Forma Share Count Under 50% Warrant Restructuring (maximum redemptions) Pro Forma Share Count Under 0% Warrant Restructuring (maximum redemptions) ▪ 12.5mm ROI warrants outstanding ▪ Each warrant entitles the holder to purchase one - half of one share of our common stock at a price of $5.75 per half share ▪ The warrants will become exercisable 30 days after the completion of our initial business combination and will expire five years after the completion of our initial business combination or earlier upon redemption or liquidation ▪ The Company may redeem outstanding warrants if the last sale price Ascend common stock equals or exceeds $24.00 per share for any 20 trading days within a 30 - trading day period $10.00 $13.00 $16.00 $24.00 Premium to Offering Price 0.0% 30.0% 60.0% 140.0% Fully Diluted Shares Outstanding (Treasury Method) 25.3 29.1 30.2 31.7 Warrant Dilution % 0.0% 2.5% 5.8% 10.3% $10.00 $13.00 $16.00 $24.00 Premium to Offering Price 0% 30% 60% 140% Fully Diluted Shares Outstanding (Treasury Method) 25.9 29.0 29.0 29.0 Dilution % from New Shares Issued in Warrant Tender 2.4% 2.2% 2.2% 2.2% $10.00 $13.00 $16.00 $24.00 Premium to Offering Price 0% 30% 60% 140% Fully Diluted Shares Outstanding (Treasury Method) 25.6 29.1 29.6 30.3 Warrant Dilution % 1.2% 2.4% 4.0% 6.4%
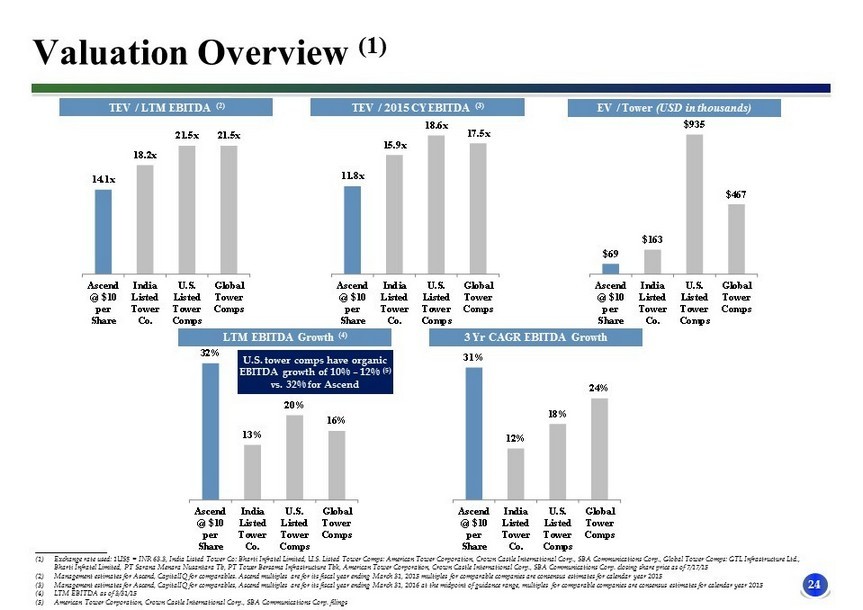
24 32% 13% 20% 16% Ascend @ $10 per Share India Listed Tower Co. U.S. Listed Tower Comps Global Tower Comps Valuation Overview (1) LTM EBITDA Growth (4) 3 Yr CAGR EBITDA Growth TEV / LTM EBITDA (2) TEV / 2015 CY EBITDA (3) EV / Tower (USD in thousands) ____________________ (1) Exchange rate used: 1US$ = INR 63.3, India Listed Tower Co: Bharti Infratel Limited, U.S. Listed Tower Comps: American Tower Corporation, Crown Castle International Corp., SBA Communications Corp., Glo ba l Tower Comps: GTL Infrastructure Ltd., Bharti Infratel Limited, PT Sarana Menara Nusantara Tb, PT Tower Bersama Infrastructure Tbk , American Tower Corporation, Crown Castle International Corp., SBA Communications Corp. closing share price as of 7/17/15 (2) Management estimates for Ascend, CapitalIQ for comparables . Ascend multiples are for its fiscal year ending March 31, 2015 multiples for comparable companies are consensus estimates f or calendar year 2015 (3) Management estimates for Ascend, CapitalIQ for comparables , Ascend multiples are for its fiscal year ending March 31, 2016 at the midpoint of guidance range, multiples for comparable com panies are consensus estimates for calendar year 2015 (4) LTM EBITDA as of 3/31/15 (5) American Tower Corporation, Crown Castle International Corp., SBA Communications Corp. filings U.S. tower comps have organic EBITDA growth of 10% – 12% (5) vs. 32% for Ascend 14.1x 18.2x 21.5x 21.5x Ascend @ $10 per Share India Listed Tower Co. U.S. Listed Tower Comps Global Tower Comps 11.8x 15.9x 18.6x 17.5x Ascend @ $10 per Share India Listed Tower Co. U.S. Listed Tower Comps Global Tower Comps $69 $163 $935 $467 Ascend @ $10 per Share India Listed Tower Co. U.S. Listed Tower Comps Global Tower Comps 31% 12% 18% 24% Ascend @ $10 per Share India Listed Tower Co. U.S. Listed Tower Comps Global Tower Comps

Appendix
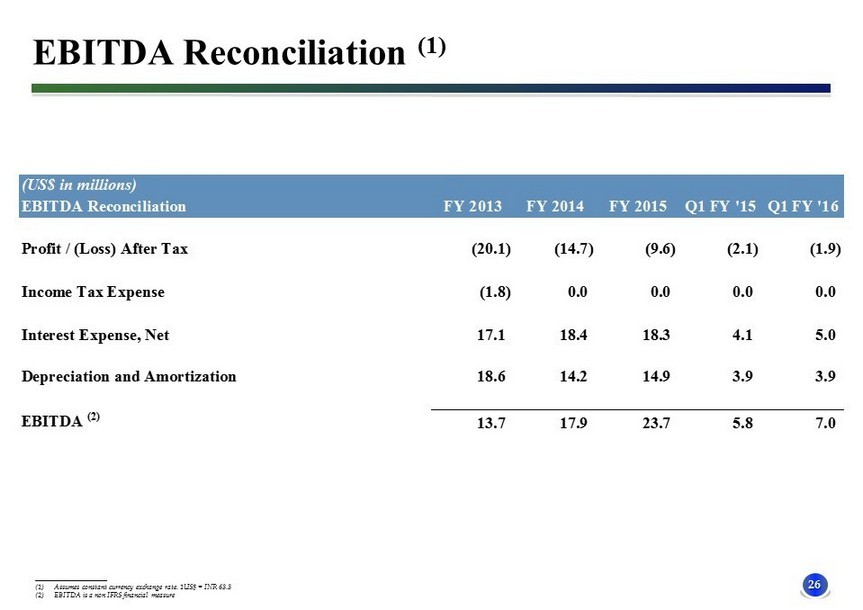
26 EBITDA Reconciliation (1) ____________________ (1) Assumes constant currency exchange rate. 1US$ = INR 63.3 (2) EBITDA is a non IFRS financial measure (US$ in millions) EBITDA Reconciliation FY 2013 FY 2014 FY 2015 Q1 FY '15 Q1 FY '16 Profit / (Loss) After Tax (20.1) (14.7) (9.6) (2.1) (1.9) Income Tax Expense (1.8) 0.0 0.0 0.0 0.0 Interest Expense, Net 17.1 18.4 18.3 4.1 5.0 Depreciation and Amortization 18.6 14.2 14.9 3.9 3.9 EBITDA (2) 13.7 17.9 23.7 5.8 7.0
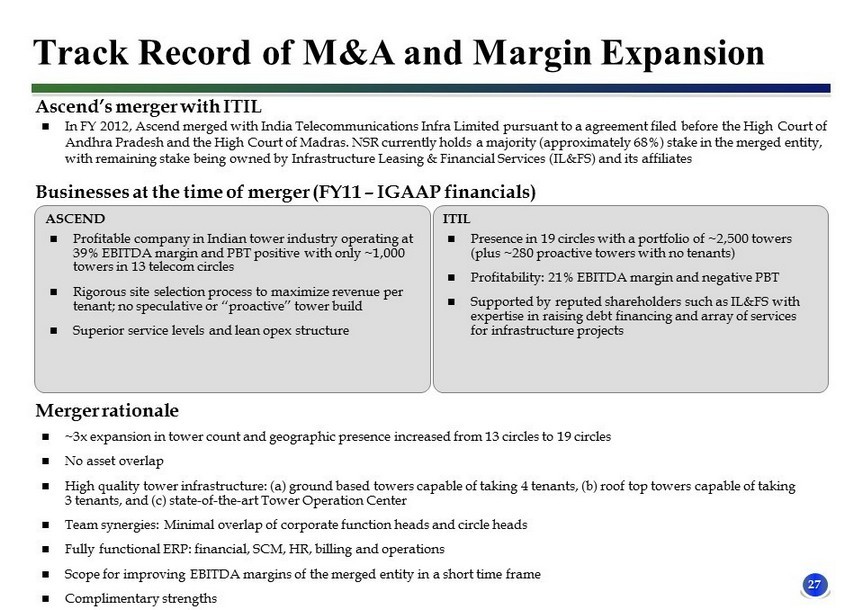
27 Track Record of M&A and Margin Expansion Ascend’s merger with ITIL ASCEND Profitable company in Indian tower industry operating at 39% EBITDA margin and PBT positive with only ~1,000 towers in 13 telecom circles Rigorous site selection process to maximize revenue per tenant; no speculative or “proactive” tower build Superior service levels and lean opex structure In FY 2012, Ascend merged with India Telecommunications Infra Limited pursuant to a agreement filed before the High Court of Andhra Pradesh and the High Court of Madras. NSR currently holds a majority (approximately 68%) stake in the merged entity, with remaining stake being owned by Infrastructure Leasing & Financial Services (IL&FS) and its affiliates Businesses at the time of merger (FY11 – IGAAP financials) ITIL Presence in 19 circles with a portfolio of ~2,500 towers (plus ~280 proactive towers with no tenants) Profitability: 21% EBITDA margin and negative PBT Supported by reputed shareholders such as IL&FS with expertise in raising debt financing and array of services for infrastructure projects Merger rationale ~3x expansion in tower count and geographic presence increased from 13 circles to 19 circles No asset overlap High quality tower infrastructure: (a) ground based towers capable of taking 4 tenants, (b) roof top towers capable of taking 3 tenants, and (c) state - of - the - art Tower Operation Center Team synergies: Minimal overlap of corporate function heads and circle heads Fully functional ERP: financial, SCM, HR, billing and operations Scope for improving EBITDA margins of the merged entity in a short time frame Complimentary strengths
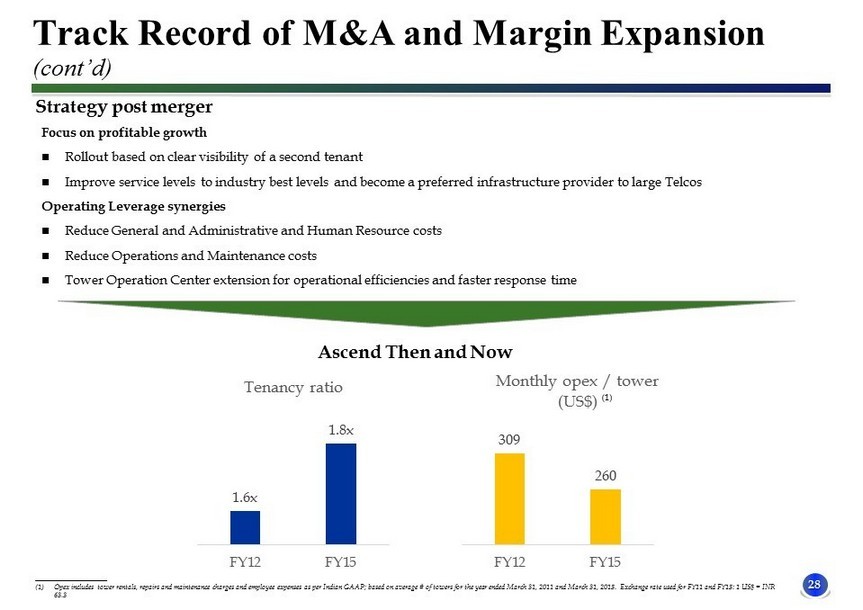
28 Strategy post merger Focus on profitable growth Rollout based on clear visibility of a second tenant Improve service levels to industry best levels and become a preferred infrastructure provider to large Telcos Operating Leverage synergies Reduce General and Administrative and Human Resource costs Reduce Operations and Maintenance costs Tower Operation Center extension for operational efficiencies and faster response time Ascend Then and Now Track Record of M&A and Margin Expansion (cont’d) (1) ____________________ (1) Opex includes tower rentals, repairs and maintenance charges and employee expenses as per Indian GAAP; based on average # of tow ers for the year ended March 31, 2011 and March 31, 2015. Exchange rate used for FY11 and FY15: 1 US$ = INR 63.3
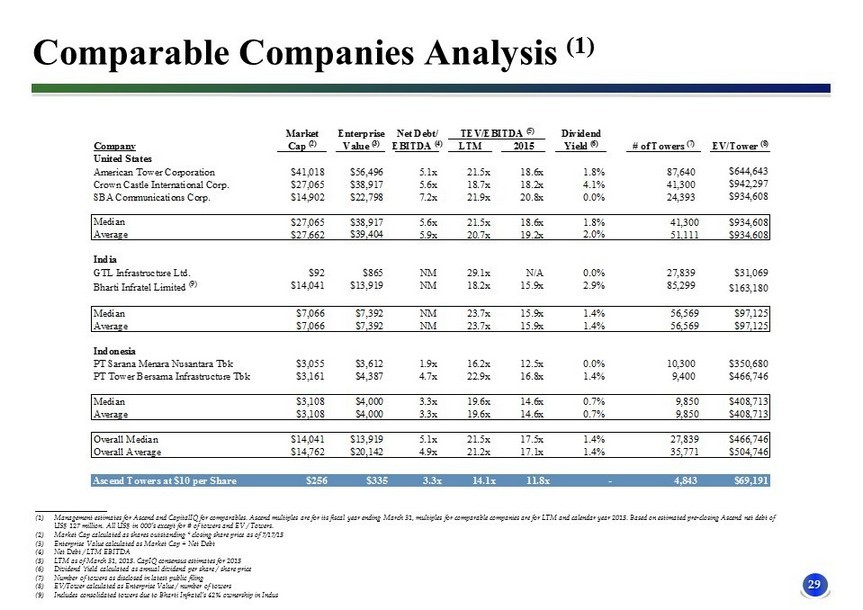
29 Comparable Companies Analysis (1) ____________________ (1) Management estimates for Ascend and CapitalIQ for comparables. Ascend multiples are for its fiscal year ending March 31, multiples for comparable companies are for LTM and c alendar year 2015. Based on estimated pre - closing Ascend net debt of US$ 127 million. All US$ in 000’s except for # of towers and EV / Towers. (2) Market Cap calculated as shares outstanding * closing share price as of 7/17/15 (3) Enterprise Value calculated as Market Cap + Net Debt (4) Net Debt / LTM EBITDA (5) LTM as of March 31, 2015. CapIQ consensus estimates for 2015 (6) Dividend Yield calculated as annual dividend per share / share price (7) Number of towers as disclosed in latest public filing (8) EV/Tower calculated as Enterprise Value / number of towers (9) Includes consolidated towers due to Bharti Infratel’s 42% ownership in Indus Market Enterprise Net Debt/ TEV/EBITDA (5) Dividend Company Cap (2) Value (3) EBITDA (4) LTM 2015 Yield (6) # of Towers (7) EV/Tower (8) United States American Tower Corporation $41,018 $56,496 5.1x 21.5x 18.6x 1.8% 87,640 $644,643 Crown Castle International Corp. $27,065 $38,917 5.6x 18.7x 18.2x 4.1% 41,300 $942,297 SBA Communications Corp. $14,902 $22,798 7.2x 21.9x 20.8x 0.0% 24,393 $934,608 Median $27,065 $38,917 5.6x 21.5x 18.6x 1.8% 41,300 $934,608 Average $27,662 $39,404 5.9x 20.7x 19.2x 2.0% 51,111 $934,608 India GTL Infrastructure Ltd. $92 $865 NM 29.1x N/A 0.0% 27,839 $31,069 Bharti Infratel Limited (9) $14,041 $13,919 NM 18.2x 15.9x 2.9% 85,299 $163,180 Median $7,066 $7,392 NM 23.7x 15.9x 1.4% 56,569 $97,125 Average $7,066 $7,392 NM 23.7x 15.9x 1.4% 56,569 $97,125 Indonesia PT Sarana Menara Nusantara Tbk $3,055 $3,612 1.9x 16.2x 12.5x 0.0% 10,300 $350,680 PT Tower Bersama Infrastructure Tbk $3,161 $4,387 4.7x 22.9x 16.8x 1.4% 9,400 $466,746 Median $3,108 $4,000 3.3x 19.6x 14.6x 0.7% 9,850 $408,713 Average $3,108 $4,000 3.3x 19.6x 14.6x 0.7% 9,850 $408,713 Overall Median $14,041 $13,919 5.1x 21.5x 17.5x 1.4% 27,839 $466,746 Overall Average $14,762 $20,142 4.9x 21.2x 17.1x 1.4% 35,771 $504,746 Ascend Towers at $10 per Share $253 $335 3.5x 14.1x 11.8x - 4,843 $69,191 Ascend Towers at $10 per Share $256 $335 3.3x 14.1x 11.8x - 4,843 $69,191