Attached files
| file | filename |
|---|---|
| 8-K - 8-K - BANK OF THE JAMES FINANCIAL GROUP INC | d29116d8k.htm |
| EX-99.2 - EX-99.2 - BANK OF THE JAMES FINANCIAL GROUP INC | d29116dex992.htm |
 Raymond
James U.S. Bank Conference September 2015
NASDAQ: BOTJ Exhibit 99.1 |
 2 FORWARD LOOKING STATEMENTS This presentation contains statements that constitute "forward-looking statements" within the
meaning of the Private Securities Litigation Reform Act of 1995. The words
"believe," "estimate," "expect,"
"intend," "anticipate," "plan" and similar expressions and variations thereof identify certain of such forward-looking statements which speak only as of the dates on which they were made.
Bank of the James Financial Group (the "Company") undertakes no obligation to
publicly update or revise any forward-looking statements, whether as
a result of new information, future events, or otherwise. You are
cautioned that any such forward-looking statements are not guarantees of future performance and involve risks and uncertainties, and that actual results may differ materially from
those indicated in the forward-looking statements as a result of various factors.
Such factors include, but are not limited to competition, general
economic conditions, potential changes in interest rates, and changes in
the value of real estate securing loans made by Bank of the James (the "Bank"), a subsidiary of Bank of the James Financial Group, Inc. Additional information concerning factors that
could cause actual results to materially differ from those in the forward-looking
statements is contained in the Company's filings with the Securities and
Exchange Commission and previously filed by the Bank (as predecessor of
the Company) with the Federal Reserve Board. |
 3 • Listed on NASDAQ: BOTJ • Market Capitalization: ~ $37 million • LTM EPS – 6/30/2015 - $1.10 • Key Balance Sheet Metrics at 6/30/2015: – Assets - $493 million – Loans - $417 million – Deposits - $445 million – Equity - $35.8 million OUR COMPANY • Formed in 1999 by a group of experienced bankers, former bankers, and community leaders to fill a void for a locally focused institution left by the acquisition by large banks • Bank of the James is a commercial banking franchise headquartered in Central Virginia; a region also referred to as “Region 2000” • Operate twelve banking centers and two mortgage offices in the Charlottesville, Harrisonburg, Lynchburg and Roanoke MSAs Strong Virginia Franchise Bank of the James’ mission is to be the pre-eminent financial institution in our markets
through superior customer service.
Key Details |
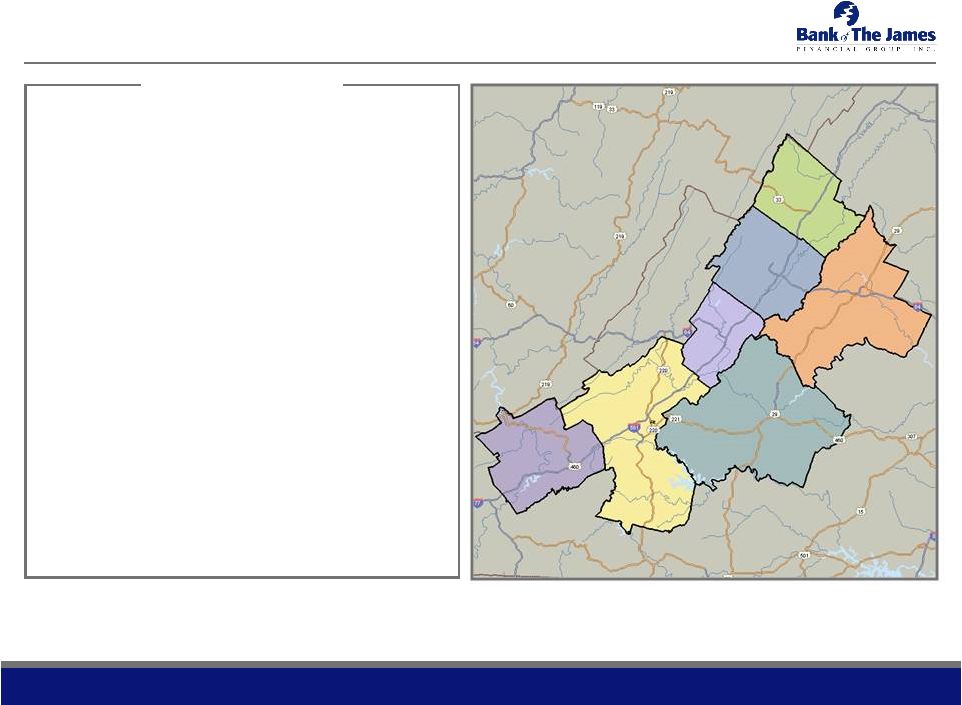
  4 OUR MARKETS Highlights • Headquartered in Lynchburg, VA – Locally know as Region 2000 – Affluent market with significant employers • Recently Expanded into Charlottesville, Harrisonburg and Roanoke – Combined market area has a population of almost 1 million residents • Market area boasts a stable economic environment • Major industries include: – Higher Education: (UVA, JMU, Liberty U., etc.) – Healthcare: Centra Health System – Power Generation: AREVA, Babcock & Wilcox – Financial Services: Genworth Financial • Lower cost of living, natural beauty, and high quality of life attracts retirees Source: SNL Financial LC; Bank of the James Management; Region 2000 Partnership: Amherst,
Appomattox, Bedford, and Campbell counties
Banking Offices (12) Pending Banking Office (1) Mortgage Only Offices (2) Roanoke Lynchburg Charlottesville Amherst Altavista Bedford Waynesboro Staunton Harrisonburg Region 2000 Five-Year Five-Year Projected Projected 2015 Median HH Metropolitan 2015 Population Median HH Income Statistical Area Population Growth Income Growth Lynchburg, VA 259,041 3.4% 47,189 $ 6.1% Charlottesville, VA 228,355 4.7% 64,284 $ 11.9% Roanoke, VA 313,826 2.8% 50,829 $ 8.2% Harrisonburg, VA 131,486 5.1% 47,600 $ 6.9% Total / Wtd. Avg. 932,708 3.7% 52,657 $ 8.6% |
 5 EXPERIENCED, YOUNG TEAM (1 of 2) Executive Headshot Previous Experience Age Years in Banking Years with BOTJ Robert Chapman President & CEO • Co-founder, Bank of the James (1999) • Current director • CEO, Bank of the James (2004) • First Lieutenant, US Army • Virginia Military Institute (1984) • Stonier Graduate School of Banking (2002) 52 31 16 Todd Scruggs CFO • Co-founder, Bank of the James (1999) • Current director • CFO, Bank of the James (16 years) • Former FINRA licensed Rep., Crestar (1998) • UVA McIntire School of Commerce (1990) • USC Grad. School of Bank Inv. Mng. (2006) 47 16+ 16 Michael Syrek Chief Lending Officer • Controller/CFO in various industries • Experience in mergers and acquisitions • SunTrust Commercial Team Leader • Lynchburg President, SunTrust Bank • James Madison University (1994) • Chief Lending Officer, Bank of the James 43 12 3 Harry Umberger Chief Credit Officer • Manager, Sovran Bank (1990) • Hamden-Sydney College (1988) • VBA School of Bank Management • Chief Credit Officer, Bank of the James (2004) 49 15 14 |
 6 Executive Headshot Previous Experience Age Years in Banking Years with BOTJ Angelia Johnson EVP & Retail Branch Administrator • Manager, Wachovia Bank (1995-2000) • MBA, Averett University • Stonier Graduate School of Banking (2013) • Retail Division Leader, Bank of the James (7 years) 52 9+ 9 Brandon Farmer Chief Operations Officer • EVP and Senior Operations Officer (7 years) • Intern, Bank of the James in Organization (1998) • Virginia Polytechnic and State University (2000) • Stonier Graduate School of Banking (2010) 36 16 16 Brian E. Cash President, Bank of the James Mortgage • Mortgage Consumer Loan Officer, Bank of the James (2004) • Lynchburg College (2002) • Stonier Graduate School of Banking (2014) • President, Bank of the James Mortgage Division (2006) 35 11 11 EXPERIENCED, YOUNG TEAM (2 of 2)
|
 7 TRACK RECORD OF CREATING SHAREHOLDER VALUE Recent Stock Price Performance Recent Stock Price Returns Source: SNL Financial LC; Market data as of August 28, 2015 YTD Returns One Year Returns Three Year Returns 0 5,000 10,000 15,000 20,000 25,000 30,000 35,000 40,000 45,000 $4.00 $5.00 $6.00 $7.00 $8.00 $9.00 $10.00 $11.00 $12.00 $13.00 $14.00 Aug-12 Dec-12 Apr-13 Aug-13 Dec-13 Apr-14 Aug-14 Dec-14 Apr-15 Volume BOTJ Price 6.01% 2.91% -3.37% BOTJ Return NASDAQ Bank S&P 500 Return 23.8% 7.6% -0.4% BOTJ Return NASDAQ Bank S&P 500 Return 107.1% 49.0% 41.1% BOTJ Return NASDAQ Bank Return S&P 500 Return |
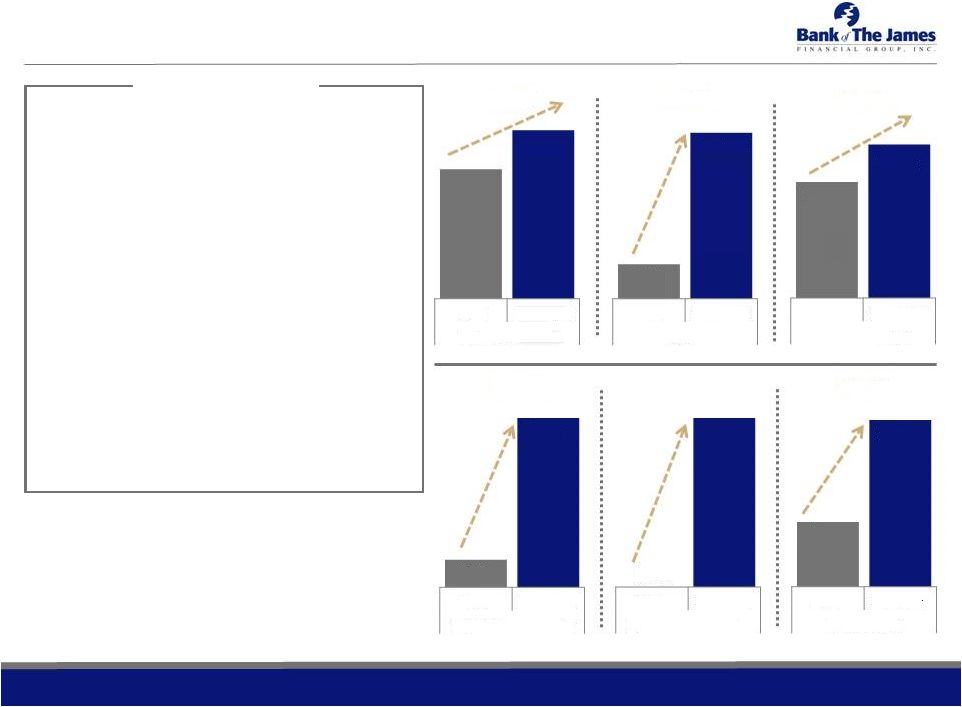 8 DRIVING SHAREHOLDER VALUE WITH STRONG RESULTS $427M $493M $319M 2.25% 10.81% $4.40 $11.36 $10.62 $0.18 $1.10 $0.00 $0.26 Note: ROAE data as of June 30, 2015 LTM 30.1% 380.3% 158.2% 32.4% 511.1% Profitable Growth • Strong loan growth has helped drive the increase in the Company’s return on equity – Loan growth has come from Lynchburg as well as recent expansion into Charlottesville and Harrisonburg • The Company’s focus on improving fundamental performance has driven increased shareholder value • The Company is focused on continuing to enhance shareholder value with the following goals: – Growing loans by high single digit to low double- digit rates through prudent lending – Targeting a double-digit ROAE – Focus on double digit EPS growth 2011 6/30/2015 Total Net Loans $415M 2011 6/30/2015 ROAE 2011 6/30/2015 TBV Per Share 2011 6/30/2015 Earnings Per Share 2011 6/30/2015 Dividends Per Share 2011 6/30/2015 Share Price $8.02 |
 9 OPPORTUNITY FOR CONTINUED STRONG ORGANIC GROWTH Highlights • As the impact of the financial crisis waned in late 2011, the Company began to refocus on growth – Hired Mike Syrek as CLO – Developed expertise and platform to bank more sophisticated C&I relationships – Hired additional talented bankers in Lynchburg – Made key hires to expand into Charlottesville and Harrisonburg • The Company has positioned itself as the bank of choice – Opportunity to hire the best banking talent in the region – Customer service and reputation accelerate business development • Recent market disruption from recent mergers and branch sales further increases the ability to capitalize on talent and clients dislocated by this process • The Company’s market area provides an opportunity for significant continued organic growth • While bigger banks have historically dominated these markets, they are focused elsewhere • Significant opportunity to grow deposit market share – meaningful opportunity remains in Lynchburg Source: SNL Financial LC Note: Includes banks operating in Lynchburg, Charlottesville, Roanoke, and Harrisonburg Metropolitan Statistical Areas (MSAs); deposit
market share data as of June 30, 2014 Current Market Area
Rank Company Branches Deposits ($000s) Market Share (%) 1 Wells Fargo & Co. 41 4,057,881 22.84 2 BB&T Corp. 58 2,824,362 15.90 3 SunTrust Banks Inc. 38 2,554,070 14.38 4 Carter Bank & Trust 30 1,137,837 6.41 5 Union Bankshares Corp. 30 1,102,669 6.21 6 Bank of America Corp. 15 1,055,585 5.94 7 BNC Bancorp 8 708,282 3.99 8 First Citizens BancShares Inc. 17 450,961 2.54 9 Bank of the James Financial Group Inc. 10 402,765 2.27 10 Virginia National Bankshares Corp. 4 392,071 2.21 11 F & M Bank Corp. 6 378,121 2.13 12 Pinnacle Bankshares Corp. 9 320,444 1.80 13 United Bankshares Inc. 10 300,012 1.69 14 HomeTrust Bancshares Inc. 5 282,977 1.59 15 HomeTown Bankshares Corp. 4 280,863 1.58 16 American National Bankshares Inc. 8 215,216 1.21 17 Bank of Botetourt 7 211,288 1.19 18 Bank of Fincastle 8 183,937 1.04 19 Farmers Bank of Appomattox 4 161,708 0.91 20 Select Bank Financial Corp. 2 112,395 0.63 21 Southern National Bancorp of Virginia Inc. 1 92,496 0.52 22 First National Corp. 2 75,272 0.42 23 First Bancorp Inc. 3 67,454 0.38 24 Cardinal Bankshares Corp. 2 65,542 0.37 25 Summit Financial Group Inc. 2 52,628 0.30 26 Farmers & Merchants Bank of Craig County 1 45,621 0.26 27 Old Dominion National Bank 2 45,379 0.26 28 Blue Ridge Bankshares Inc. 2 44,378 0.25 29 Capital One Financial Corp. 1 35,799 0.20 30 BCC Bankshares Inc. 1 28,772 0.16 31 Allegheny Bancshares Inc. 1 28,631 0.16 32 Pioneer Bankshares Inc. 4 20,498 0.12 33 Fidelity BancShares (N.C.) Inc. 1 10,323 0.06 34 Woodforest Financial Group Inc. 9 9,110 0.05 35 First Bancorp 1 6,029 0.03 36 Virginia Bank Bankshares Inc. 1 3,256 0.02 Total 348 17,764,632 100 |
 10 ATTRACTIVE POTENTIAL FOR STRATEGIC GROWTH Highlights • There are 20 banks under $750MM in assets operating in our target market area • Many of these companies are struggling to adjust to the new business and regulatory environment for community banks • Many management teams are older and looking for an opportunity to retire • There are also several similarly sized companies that would benefit from an immediate increase in economies of scale • We are open to merger opportunities and will evaluate them based on shareholder focused metrics • We believe that our company is an attractive merger partner for the following reasons – Track record of strong fundamental performance – Focus on shareholder value – Reputation and capabilities – Experienced and energetic management team Source: SNL Financial LC; Microsoft Mappoint Note: Map includes Lynchburg, Charlottesville, Roanoke, Staunton, Harrisonburg, and Blacksburg, Virginia Metropolitan Statistical Areas
(MSAs) and Rockbridge County, VA Roanoke
Lynchburg Charlottesville Staunton Harrisonburg Rockbridge County Blacksburg |
 11 STRONG BALANCE SHEET GROWTH Total Assets CAGR 4.38% Total Deposits CAGR 4.83% Total Gross Loans CAGR 9.58% Recent Balance Sheet Performance $433 $433 $426 $441 $428 $431 $435 $435 $443 $447 $452 $461 $488 $493 $319 $326 $329 $326 $332 $338 $336 $347 $356 $367 $380 $400 $410 $420 $387 $385 $384 $399 $385 $389 $393 $387 $398 $400 $399 $399 $439 $445 $300 $320 $340 $360 $380 $400 $420 $440 $460 $480 $500 Q1 Q2 Q3 Q4 Q1 Q2 Q3 Q4 Q1 Q2 Q3 Q4 Q1 Q2 2012 2013 2014 2015 Total Assets ($M) Total Gross Loans ($M) Total Deposits ($000) |
 12 ATTRACTIVE BALANCE SHEET MIX (1) For average balances during the quarter ended June 30, 2015
Current Loan Portfolio Current Deposit Portfolio • Bank of the James has a conservative loan book and is focused on profitable loan growth with manageable risk • The Company has focused its recent efforts at expanding its C&I loan book • The Company’s recent expansion into other markets will increase the geographic diversity in the Company’s portfolio • Bank of the James has produced substantial loan growth in recent years • Bank of the James has an attractive and stable core deposit base and intends to focus on a strong core deposit mix even with significant organic growth • Over 65% of the Bank’s deposits are non- time deposits • The Company does not rely on wholesale deposits for funding purposes • The Bank’s cost of funds was 0.51% for the last twelve months ended June 30, 2015 Dollars in thousands Type Balance % Commercial 68,427 $ 16% Total CRE 215,755 52% Consumer 78,675 19% Residential 54,154 13% Total 417,011 $ 100% Reported Weighted Avg. Yield (1) 4.62% Commercial $68,427 16% NOW, MM, Savings $220,092 49% Time $141,466 32% Residential 54,154 13% Noninterest Demand $83,828 19% NOW, MM, Savings 220,092 49% Time 141,466 32% Dollars in thousands Type Balance % Noninterest Demand 83,828 $ 19% NOW, MM, Savings 220,092 49% Time 141,466 32% Total 445,386 $ 100% Reported Weighted Avg. Cost (1) 0.58% |
 ASSET
QUALITY Strong Loan Quality
Low Nonperforming Assets
1.88% 1.75% 1.73% 1.70% 1.69% 1.62% 1.48% 1.50% 1.48% 1.42% 1.29% 1.20% 1.16% 1.10% 0.44% 0.92% 0.74% 0.82% 0.20% 0.22% 0.59% 0.06% -0.02% 0.09% 0.32% 0.09% 0.14% 0.21% Q1 Q2 Q3 Q4 Q1 Q2 Q3 Q4 Q1 Q2 Q3 Q4 Q1 Q2 2012 2013 2014 2015 LLR / Loans (%) Annualized Net Chargeoffs / Avg Loans (%) 3.08% 2.18% 1.89% 1.92% 1.95% 1.59% 1.32% 1.04% 1.13% 1.00% 0.98% 0.97% 0.86% 0.81% Q1 Q2 Q3 Q4 Q1 Q2 Q3 Q4 Q1 Q2 Q3 Q4 Q1 Q2 2012 2013 2014 2015 NPAs / Assets (%) 13 |
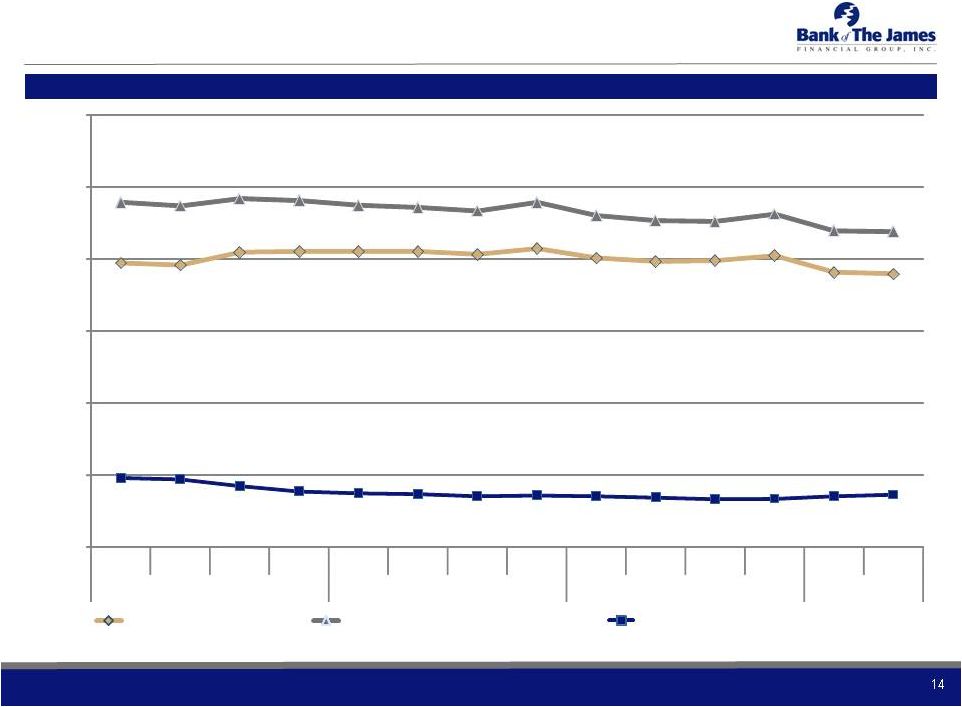 14 STRONG, STABLE NET INTEREST MARGIN Recent Net Interest Margin Performance 3.94% 3.91% 4.09% 4.10% 4.10% 4.10% 4.06% 4.14% 4.01% 3.96% 3.97% 4.04% 3.81% 3.79% 4.78% 4.73% 4.83% 4.80% 4.74% 4.71% 4.66% 4.78% 4.60% 4.53% 4.52% 4.62% 4.39% 4.38% 0.96% 0.94% 0.85% 0.78% 0.75% 0.74% 0.71% 0.72% 0.71% 0.69% 0.67% 0.67% 0.71% 0.73% 0.00% 1.00% 2.00% 3.00% 4.00% 5.00% 6.00% Q1 Q2 Q3 Q4 Q1 Q2 Q3 Q4 Q1 Q2 Q3 Q4 Q1 Q2 2012 2013 2014 2015 Net Interest Margin (%) Yield: Interest Earning Assets (%) Cost of Interest-bearing Liab (%) |
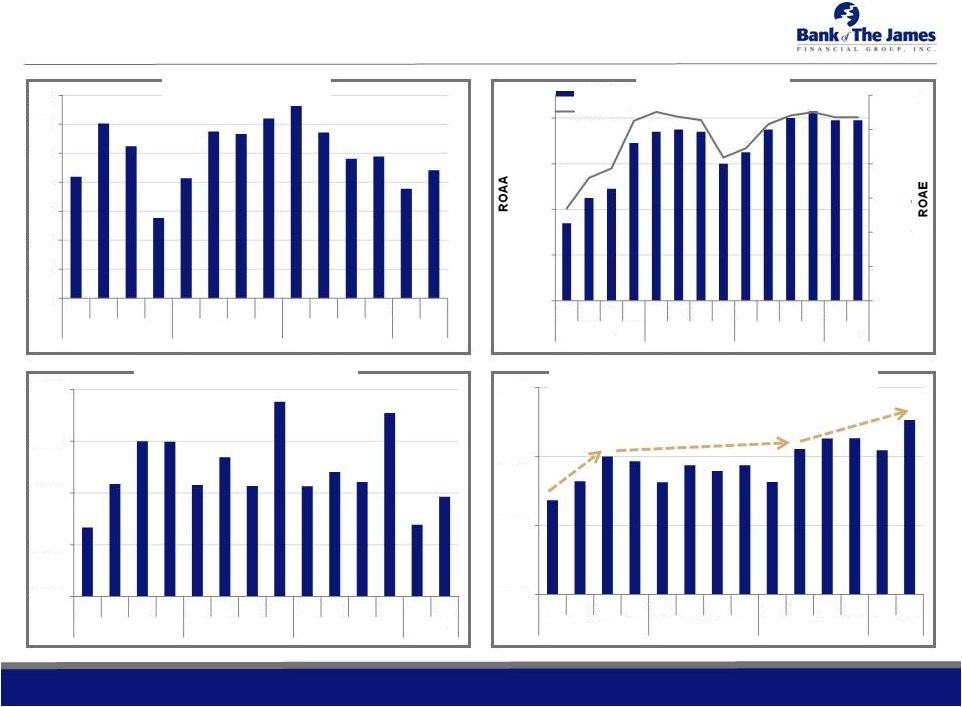 15 STRONG EARNINGS GROWTH Efficiency Ratio Noninterest Expense / AA Noninterest Income / Average Assets ROAA and ROAE 64% 66% 68% 70% 72% 74% 76% 78% Q1 Q2 Q3 Q4 Q1 Q2 Q3 Q4 Q1 Q2 Q3 Q4 Q1 Q2 2012 2013 2014 2015 0.00% 2.00% 4.00% 6.00% 8.00% 10.00% 12.00% 0.00% 0.20% 0.40% 0.60% 0.80% Q1 Q2 Q3 Q4 Q1 Q2 Q3 Q4 Q1 Q2 Q3 Q4 Q1 Q2 2012 2013 2014 2015 ROAA (%) ROAE (%) 0.25% 0.50% 0.75% 1.00% Q1 Q2 Q3 Q4 Q1 Q2 Q3 Q4 Q1 Q2 Q3 Q4 Q1 Q2 2012 2013 2014 2015 2.75% 3.00% 3.25% 3.50% 3.75% Q1 Q2 Q3 Q4 Q1 Q2 Q3 Q4 Q1 Q2 Q3 Q4 Q1 Q2 2012 2013 2014 2015 15 |
 16 HISTORICAL FINANCIALS Dollars in thousands, except per share data For the Period Ended December 31, June 30, 2010 2011 2012 2013 2014 2015 Balance Sheet Highlights Total Assets 418,928 $ 427,436 $ 441,381 $ 434,511 $ 460,865 $ 492,836 $ Total Net Loans 320,715 319,188 320,826 341,915 395,603 415,397 Total Equity 25,495 26,805 29,613 29,772 34,776 35,806 Tangible Common Equity / Tangible Assets 6.1% 6.3% 6.7% 6.9% 7.5% 7.3% Summary Income Statement Net Interest Income (non-FTE) 15,201 $ 15,327 $ 15,737 $ 15,989 $ 16,404 $ 8,520 $
Provision for Loan & Lease Losses
2,783 4,807 2,289 540 55 157 Non-Interest Income 3,518 3,680 3,618 3,478 3,587 2,025 Non-Interest Expense 13,502 13,693 14,391 14,825 15,235 7,615 Earnings Before Income Taxes 2,434 507 2,675 4,102 4,701 2,773 Income Taxes 614 (93) 543 1,042 1,288 889 Net Income 1,820 $
600 $
2,132 $
3,060 $
3,413 $
1,884 $
Operating Performance Highlights
ROAA 0.44% 0.14% 0.50% 0.71% 0.76% 0.79% ROAE 7.3% 2.3% 7.8% 10.1% 10.3% 10.7% Net Interest Margin 3.94% 3.89% 4.03% 4.08% 3.97% 3.80% Efficiency Ratio 72% 72% 72% 75% 76% 72% Asset Quality NPAs / Assets 4.01% 3.37% 2.05% 1.17% 1.05% 0.98% NPAs (Excl. Restructured Lns.) / Assets 2.82% 3.19% 1.92% 1.04% 0.97% 0.81% Reserves / Loans 1.68% 1.73% 1.70% 1.49% 1.20% 1.09% NCOs / Avg. Loans 0.49% 1.44% 0.73% 0.27% 0.12% 0.18% Per Share Information Common Shares Outstanding (Actual) 3,323,743 3,342,418 3,352,725 3,364,874 3,371,616 3,371,616 Tangible Book Value Per Share $7.67 $8.02 $8.83 $8.85 $10.31 $10.62 Diluted Earnings Per Share $0.55 $0.18 $0.64 $0.91 $1.01 $0.56 Common Dividends Declared Per Share $0.00 $0.00 $0.00 $0.00 $0.15 $0.16 |
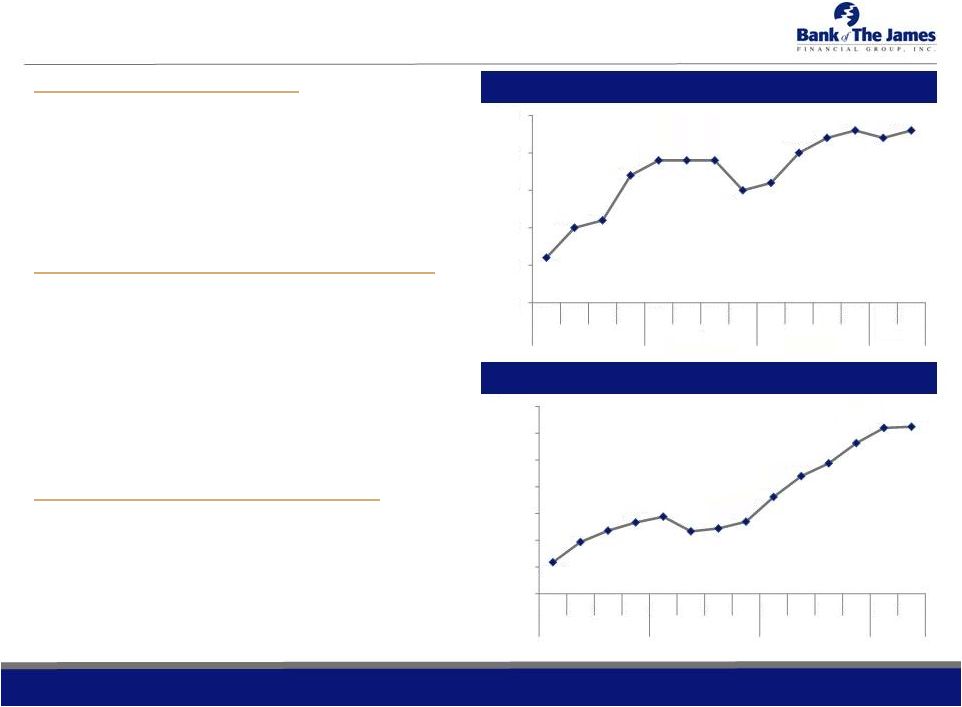 17 INVESTMENT CONSIDERATIONS Attractive Market Opportunity • Affluent market area with steady growth opportunities • Recent expansion into attractive Charlottesville and Harrisonburg MSAs • Big banks have lost focus on these markets • Opportunity to attract dislocated customers and bankers Track Record of Strong, Disciplined Growth • Experienced management team • Strong, but prudent loan growth from 2012 to present • Robust margin and low cost of funds • Attractive funding mix • Healthy revenue stream with growing net interest income and diversification with growing noninterest income • Strong profitability Focus on Creating Shareholder Value • Track record of creating shareholder value as illustrated by growth in tangible book value per share, earnings per share, dividends, and stock price • Focus on achieving double-digit loan growth, EPS growth, and ROAE going forward $0.11 $0.15 $0.16 $0.22 $0.24 $0.24 $0.24 $0.20 $0.21 $0.25 $0.27 $0.28 $0.27 $0.28 $0.05 $0.10 $0.15 $0.20 $0.25 $0.30 Q1 Q2 Q3 Q4 Q1 Q2 Q3 Q4 Q1 Q2 Q3 Q4 Q1 Q2 2012 2013 2014 2015 Strong Earnings Per Share Growth Strong TBV Per Share Growth $8.09 $8.47 $8.68 $8.83 $8.94 $8.67 $8.72 $8.85 $9.31 $9.70 $9.94 $10.31 $10.60 $10.62 $7.50 $8.00 $8.50 $9.00 $9.50 $10.00 $10.50 $11.00 Q1 Q2 Q3 Q4 Q1 Q2 Q3 Q4 Q1 Q2 Q3 Q4 Q1 Q2 2012 2013 2014 2015 |
 Raymond
James U.S. Bank Conference September 2015
NASDAQ: BOTJ |