Attached files
| file | filename |
|---|---|
| 8-K - FORM 8-K - HYSTER-YALE MATERIALS HANDLING, INC. | d49448d8k.htm |
 Investor
Presentation September
2, 2015 Exhibit 99 |
 Safe
Harbor Statement The following information includes forward-looking
statements within the meaning of Section 27A of the Securities Act of 1933, as amended, and Section 21E of the Securities Exchange Act of 1934, as amended. Any and all statements regarding the Company’s expected future financial position, results of operations, cash flows, business strategy, budgets, projected costs, capital expenditures, products, competitive positions, growth opportunities,
plans, goals and objectives of management for future operations, as well
as statements that include words such as “anticipate,” “if,” “believe,” “plan,” “estimate,” “expect,” “intend,” “may,” “could,” “should,” “will,” and other similar expressions
are forward-looking statements. Such forward-looking statements are
inherently uncertain, and readers must recognize that actual results may differ
materially from the expectations of the Company’s management. The
Company does not undertake a duty to update such forward-looking statements. Among
the factors that could cause plans, actions and results to differ
materially from current expectations include, without limitation, reduction in demand for lift trucks and related aftermarket parts and service on a global basis, the ability of dealers, suppliers and end-users to obtain financing at reasonable rates, or at all, as a result of current economic
and market conditions, the political and economic uncertainties in
Eastern Europe and Brazil, customer acceptance of pricing, delays in delivery or increases in costs, including transportation costs, of raw materials or sourced products and labor or changes in or unavailability of quality suppliers, exchange
rate fluctuations, changes in non-U.S. import tariffs and monetary
policies and other changes in the regulatory climate in the non-U.S. countries in which the Company operates and/or sells products, delays in manufacturing and delivery schedules, bankruptcy of or loss of major dealers, retail customers
or suppliers,
customer acceptance of, changes in the costs of, or delays in the development of new products, introduction of new products by, or more favorable product pricing offered by, competitors, product liability or other litigation, warranty claims or returns of products, the
effectiveness of the cost reduction
programs implemented globally, including the successful implementation of procurement and sourcing initiatives, changes mandated by federal, state and other regulation, including health, safety or environmental legislation, the successful commercialization of Nuvera Fuel Cells'
technology, the introduction
of a more accepted product to the market by a competitor, making the Nuvera technology less marketable and other risks identified in the Company’s Annual Report on Form 10-K, the Company’s Quarterly Reports on Form 10-Q and other filings with the Securities and
Exchange Commission. Many of these factors are outside of the
Company’s control. 2 |
 Our Core
Business is Materials Handling 3 |
 Hyster-Yale Snapshot
Hyster-Yale Materials Handling, Inc. (NYSE:HY)
Leading global designer, manufacturer and
marketer of lift trucks and provider of aftermarket
parts and support Headquartered in Cleveland, Ohio Separate lift truck and fuel cell power solutions segments Over 5,500 employees globally LTM 6/30/15 Revenue – $2.7 billion LTM 6/30/15 Net income - $91.4 million LTM 6/30/15 EBITDA (1) – $150.0 million 6/30/15 Net cash – $45.4 million LTM 6/30/15 ROTCE (1) of 23.4% (Net cash basis) _____________________ (1) EBITDA and ROTCE are non-GAAP measures and should not be considered in isolation or as a substitute for GAAP measures.
For discussion of non-GAAP items and the related
reconciliations to GAAP measures, see information in the Appendix starting on page 29. 4 |
 Europe 33% China 24% Americas 25% Japan 8% Asia-Pacific 7% Middle East & Africa 4% Industry Overview 951 872 547 794 975 944 1,010 1,088 1,108 0 300 600 900 1,200 2007 2008 2009 2010 2011 2012 2013 2014 LTM Q2 15 (units in thousands) Global Lift Truck Industry Size _____________________ Trend line represents 4.5% CAGR from 2006-2008 Average Industry Size. Source: WITS. Represents order intake.
Global Lift Truck Industry Breakdown (Units)
_____________________
Source: WITS. LTM 6/30/15 Orders Reports.
Long-term CAGR (2004 –
2014) = 4.5% Global Lift Truck Industry
Size _____________________
Source: WITS. LTM 6/30/15 and LTM 6/30/14 order
intake. Change over Prior Year
Total Americas Brazil EMEA JAPIC +5% +12% -25% +7% +1% 5 • Expect long-term growth similar to GDP levels in developed markets and, despite current volatility, emerging markets will drive global expansion • Strong demand for warehouse and distribution industry applications in North America and Western Europe • Increasing focus on electric truck technology development • Importance of total lifecycle cost of ownership Key Themes |
 Lift Truck Industry – Unit Distribution by Class Total Industry = 1,108k Units Market Size - Units Market Size - $ 6 _____________________ Source: Internal Company estimates Estimated Industry Revenue Mix _____________________ Source: WITS. LTM 6/30/15 Orders Reports. ICE = Internal Combustion Engine Class 1 Electric 17% Class 2 Electric 10% Class 3 Electric 31% Class 4 ICE 3% Class 5 ICE 39% Class 1 Electric 18% Class 2 Electric 11% Class 3 Electric 8% Class 4 ICE 5% Class 5 ICE 58% |
 Hyster-Yale’s Economic Engine
7 Hyster-Yale’s economic engine is driven by increasing unit volume as our “hedgehog” approach gets
embedded in all our activities and our flywheels increase momentum…
Geographic
and Product
Balance
Worldwide Distribution
Strength to Drive
Market Share
Parts and Service
Volume Large Lift Truck Population in Service Volume Economies of Scale A large lift truck population base drives parts and service volume resulting in enhanced profitability for dealers and
Hyster-Yale Design
Component Commonality Supply Chain Manufacturing Quality Marketing Parts Infrastructure Capital Requirements |
 Over the
next three years…. A period of
share growth Get to 115,000 Lift trucks irrespective of industry size Use of cash to support technology accelerators Fuel Cells Automation Telemetry Use of cash to support strategic alliances 8 |
 7% Operating Profit at the mid-point of the next cycle Operating Profit at the peak of this cycle 7% With adequate volume growth we can meet our public operating profit commitments 9 Lift Truck Business |
 $30
million fixed cost absorption by moving from
current capacity utilization to full
utilization of our manufacturing capacity
$35-$40 million by meeting target economics in standard margin net of increased SG&A spread over more units 25,000 units of additional volume $65-$70 million of operating profit 10 Lift Truck Business |
 Lift
Truck Business Operating Profit Trends and % of Sales $57.3
$111.7 $134.3 $133.3 (2) $131.9 $151.0 (1) $25 $50 $75 $100 $125 $150 2007 2012 2013 2014 LTM Q2 2015 Prior Cycle Market Peak Mid-Cycle Market _____________________ (1) Lift Truck Segment Operating Profit, as reported (2) Adjusted Lift Truck Segment Operating Profit, which excludes a $17.7 million pre-tax gain on the sale of the Brazil land and
facility, is a non-GAAP measure and should not be considered in isolation or as a substitute for the GAAP measure. Management believes that this measure assists the investor in understanding the results of operations. For discussion
of non-GAAP items and the related reconciliations to GAAP measures, see information in the Appendix starting on page 29. 11 7% TARGET 2.1% 4.5% 4.8% 5.0% 5.5% ($ in millions) 2.1% Gap Closure 4.9% |
 Lift
Truck Business Target Economics Goal and Gap to Target 7% Goal
Achieve minimum operating profit margin of 7% at the peak of the current market cycle and 7% at mid-cycle of the next market cycle Target Economics gap closure can be achieved by… Increased margin on ICE trucks Segmentation Low Cost of Ownership Unit volume Stronger Industry + Share Growth = Volume Leverage LTM 6/30/15 Gap to Target Economics Actual Lift Truck Operating Profit Margin 4.9% Margin Variances (0.1%) Unit margin 0.6% Parts/other (0.7%) Volume Variances 2.2% Manufacturing variances/other 1.3% Operating Expenses 0.9% Lift Truck Operating Profit % Gap 2.1% 12 |
 Leverage
Gained from Moving Volume to Full Manufacturing Capacity 48%
31% 33% 25% 24% 24% 0% 20% 40% 60% 80% 100% 2010 2011 2012 2013 2014 LTM Q2 15 2017-2018 Unused Capacity Unit Volume Objective of minimum 25,000 unit volume increase from 2014 levels Approximately $125m manufacturing fixed cost $500m additional revenue $65m-$70m incremental operating profit Ability to produce 115,000 units annually At capacity: Approximately $30m additional fixed cost absorption Operating costs aligned with targets at increased sales volumes 13 |
 Over the
Remainder of this Market Cycle, Target Volumes Driven by… Share growth
of approx. 1.3% pts > 8 Strategic initiatives
> Share growth is expected to be
approximately 80% of volume
increase required 100 200 300 400 500 2009 2010 2011 2012 2013 2014 2015* EMEA Industry Actual Prior Peak 50 100 150 200 250 300 2009 2010 2011 2012 2013 2014 2015* Americas Industry Actual Prior Peak Growth of 15-20% by 2018-2019** Growth of 0-5% by 2016-2017** 150 250 350 450 2009 2010 2011 2012 2013 2014 2015* Asia Industry Actual Prior Peak Growth of 5-10% by 2017-2018** * Growth is from 2013 levels. 14 *First 6 months of 2015 Annualized **Growth is from 2014 levels |
 Our Core
Strategies 15 |
 Core
Strategic Initiatives Basic Business Areas
Our strategies are designed to drive increased share,
which in turn increases the lift truck population, which
drives parts and service volumes.
Geographic
and Product
Balance
Worldwide
Distribution
Strength to Drive
Market Share
Parts and Service
Volume Large Lift Truck Population in Service Volume Economies of Scale Design Component Commonality Supply Chain Manufacturing Quality Marketing Parts Infrastructure Capital Requirements Improve Warehouse Position Enhance Independent Distribution Succeed in Asia Enhance Big Truck Market Position Strengthen the Sales and Marketing Organization Low Cost of Ownership Understand Customer Needs Core strategic initiatives were designed to drive the economic engine by increasing share…
16 Commercialize Nuvera’s Technology |
 Core
Strategic Initiatives Update 17
Strategic Objective Implementation Highlights • Provide the right product and solution to meet the specific needs of different customers across multiple industries • Increasing penetration of the Metals and Paper segments • Gained conquest business at two large trucking accounts • Introduced efficient battery extraction solutions for electric truck applications Initiative Understand Customer Needs Strategic Objective Implementation Highlights • Deliver lowest cost of ownership for all of our customers based on their specific application Initiative Low Cost of Ownership • Increasing penetration of factory- fitted telematics • Introduced new fleet management system to manage costs more effectively • Launched fuel efficient engines with longer service intervals |
 Core
Strategic Initiatives Update 18
Strategic Objective Implementation Highlights • Develop the strongest independent, exclusive dealer network Initiative Enhance Independent Distribution Strategic Objective Implementation Highlights • Strengthen penetration of the growing warehouse segment Initiative Improve Warehouse Position • Announced a major restructuring of network in North America that included a competitive conversion • Growth of our dual brand coverage in North America • 6 new dealers appointed in EMEA since the beginning of 2015 • Resources: Adding industry-focused
direct salespeople and solutions and
application center expertise
• Capability: New products, enhanced selling tools and trained dealers • Rollout: Portfolio of initiatives, targeted accounts, large wins, leverage global knowledge |
 Core
Strategic Initiatives Update 19
Strategic Objective Implementation Highlights Initiative Succeed in Asia Strategic Objective Implementation Highlights Initiative Enhance Big Truck Market Position • 4 new dealers appointed in 2015 • Direct sales support on large accounts is resulting in sales to conquest accounts • Additional Big Truck sales by leveraging global metals industry expertise • Launched additional UTILEV products • Large accounts identified, assigned and actively being pursued/increased direct sales support • Conquest accounts won • Enhanced dealer support capability • Expand market penetration throughout Asia • Increase leading market position in Big Trucks / Become vendor of choice in Big Truck segment |
 Core
Strategic Initiatives Update 20
Strategic Objective Implementation Highlights Initiative Strengthen Sales and Marketing Organization Strategic Objective Implementation Highlights Initiative Commercialize Nuvera’s Fuel Cell Technology • Recruited experienced individuals with deep knowledge of the lift truck business • Added expertise in dealer management, account identification and coverage, financial merchandising and solutions development • Expanded investment in National Account sales and support - Winning conquest accounts • Increased global collaboration to maximize efficiencies and effectiveness • PowerEdge ® product development • Identifying launch customers • PowerTap ® appliance deployments • Leveraging HY’s global purchasing power • Dealer training • Strengthen and align sales and marketing organization in all geographic regions • Commercialize Nuvera’s technology through introduction of new fuel cell and improved hydrogen generation products and enhance our lift truck business value proposition |
 Positive
Environment to Gain Share and Margin Performance Over Next Three Years
21 • Product gaps filled to position Hyster-Yale in most application segments and
improve margins • Second-tier competitors in the ICE segment more vulnerable due to their weak economies of scale position • Key warehouse segment competitors are regional • Key Big Truck segment competitors are niche Over the longer-term, as core strategic initiatives are executed and mature, share gains are expected to occur
|
 Early
Stage Mid Stage
Achieved Breakthrough Understand Customer Needs Low Cost of Ownership Enhance Independent Distribution Improve Warehouse Position Succeed in Asia Enhance Big Truck Market Position Strengthen Sales and Marketing Organization Commercialize Nuvera’s Fuel Cell Technology Our core strategic initiative flywheels are in various stages of momentum. Share gain
is expected to take place as they gain
momentum… Core Strategic Initiatives – Stages of Momentum 22 |
 2015
Second Quarter Highlights •
Lift truck segment revenue decline driven by significant
unfavorable currency partially offset by higher unit and parts
volumes Excluding prior year gain on sale, increase in lift truck operating results from: + Favorable material costs, higher unit volumes and parts sales, higher-margin product mix - Higher employee-related costs, increased bad debt expense and Brazil move expenses. Currency effect on operating profit netted to $0.6m unfavorable • Nuvera spend was on target with original guidance given 2015 Second Quarter Highlights Outlook 2015 Second Quarter LTM 6/30/15 Consolidated Revenue $658.7 100.0% $2,687.5 100.0% Lift Truck Operating Profit 33.2 5.0% 131.9 4.9% Nuvera Operating Loss (5.9) (0.9)% (14.1) (0.5)% Consolidated Operating Profit 27.3 4.1% 117.8 4.4% Consolidated Net Income 22.7 3.4% 91.4 3.4% EBITDA $36.0 5.5% $150.0 5.6% ($ in millions) 23 • Global lift truck markets expected to decline in H2 2015, with demand levels mixed by region Anticipated unit shipment and parts sales increases offset by higher expected employee-related and operating costs resulting in comparable lift truck operating profit for H2 2015 compared with same prior year period, with a weaker Q3 offset by increases in Q4 H2 2015 lift truck net income expected to decline on comparable operating profit due to higher income taxes • Nuvera net loss expected to be $7.5 million - $8.5 million in H2 2015 |
 Substantial Cash Being Returned to Stockholders
Stockholder Returns Quarterly dividend established in November 2012 $50 million stock repurchase program announced in December 2012 – Completed in 2014 2013 2014 2015 (YTD) Annual Dividends (1) $16.7m $1.00/share $17.8m $1.10/share $9.2m $1.14/share 2012 to 2014 Share Buyback $49.8m 694,653 shares (2) (1) Dollars represent total dividends paid during calendar year, while dividend per share represents the annualized dividend rate after each May increase in 2014 and 2015 (2) Class A common stock 24 |
 HY
Expects Continued Strong Cash Generation Investments in core business to
support strategic initiatives to accelerate growth or
enhance margins Investments in core business to support strategic initiatives to accelerate growth or enhance margins As appropriate, return capital to stockholders through dividends and periodically through share repurchases As appropriate, return capital to stockholders through dividends and periodically through share repurchases Look for opportunities to enhance skills and capabilities and provide sound financial returns - acquisitions of technologies that will accelerate the business or acquisitions of other forklift-related businesses Look for opportunities to enhance skills and capabilities and provide sound financial returns - acquisitions of technologies that will accelerate the business or acquisitions of other forklift-related businesses Make investments in the growth of independent and exclusive distribution network Make investments in the growth of independent and exclusive distribution network 25 Potential Uses of Cash… |
 26 Unlocking Value By Business Lift Truck Business Lift Truck Business Fuel Cell Business Fuel Cell Business Board Oversight as Separate Businesses Incentives Tied to Individual Businesses Strong Operating Cash Generation Strong Operating Cash Generation Market Leading Products and Position Market Leading Products and Position Mature Cyclical Industry Mature Cyclical Industry Value using Traditional Valuation Model of EBITDA Multiple on a Net Debt Basis Value using Traditional Valuation Model of EBITDA Multiple on a Net Debt Basis Developing / Technology Industry Developing / Technology Industry Distinct Technology / Patents in Fuel Cell and Hydrogen Generation Distinct Technology / Patents in Fuel Cell and Hydrogen Generation Operating Cash Invested in New Product Commercialization / Ramp Up Operating Cash Invested in New Product Commercialization / Ramp Up Value as Venture Business with Developed Technology Value as Venture Business with Developed Technology |
 Rationale
for Investing in Hyster-Yale •
Leading position in growing industry benefiting from globalization and long-term
worldwide economic recovery and development
• Premier brands, comprehensive global product line and exclusive, global independent distribution
network • Strong economic engine driven by volume economies of scale • Focused strategic initiatives to gain market share and enhance margins over next three years
• Strong balance sheet, financial flexibility and attractive returns on capital employed
• High potential for partnership and consolidation opportunities • Focused investment in capital goods sector with growth opportunity: – In developed countries from exposure to goods movement, distribution and warehousing
– In developing countries (Brazil, Eastern Europe, India and Asia) from exposure to industrialization
• Enhanced business value from Nuvera’s future revenue streams and ROI 27 |
 Appendix 28 |
 Non-GAAP Disclosure
29 Adjusted Lift Truck Business Operating Profit, EBITDA and return on total capital employed are not measurements under U.S. GAAP, should not be considered in isolation or as a substitute for GAAP measures, and are not necessarily comparable with similarly titled measures of other companies. Hyster-Yale defines each as the following: Adjusted Lift Truck Business Operating Profit is defined as Lift Truck Operating Profit, as reported, adjusted for the pre-tax effect of the $17.7 million gain on sale from the Brazil land and facility; EBITDA is defined as income before income taxes and noncontrolling interest income (loss) plus net interest expense and depreciation and amortization expense; Return on total capital employed (“ROTCE”) is defined as net income before interest expense, after tax, divided by average capital employed. Average capital employed is defined as average stockholders’ equity plus average debt less average cash. For reconciliations from GAAP measurements to non-GAAP measurements, see the following pages. |
 Non-GAAP Reconciliation
Year Ended December 31 Qtr. Trailing 12 Months 2010 2011 2012 2013 2014 6/30/15 6/30/15 Reconciliation of EBITDA Net income attributable to stockholders $32.4 $82.6 $98.0 $110.0 $109.8 $22.7 $91.4 Noncontrolling interest income (loss) (0.1) – 0.1 0.2 0.4 0.1 0.5 Income taxes provision 1.8 18.9 7.0 17.2 39.9 4.6 25.0 Interest expense 16.6 15.8 12.4 9.0 3.9 1.3 4.5 Interest income (2.3) (1.8) (1.5) (1.8) (1.1) (0.3) (1.1) Depreciation and amortization expense 33.9 31.3 28.0 30.2 29.7 7.6 29.7 EBITDA $82.3 $146.8 $144.0 $164.8 $182.6 $36.0 $150.0 ($ in millions) 30 _____________________ Note: EBITDA in this investor presentation is provided solely as a supplemental disclosure with respect to operating results.EBITDA
does not represent net income, as defined by U.S. GAAP and should not be considered as a substitute for net income or net loss, or as an indicator of operating performance. The Company defines EBITDA as income before income taxes and noncontrolling interest income (loss) plus net interest expense and depreciation and amortization expense. EBITDA is not a measurement under U.S. GAAP and is not necessarily comparable with similarly titled measures of other companies. |
 Non-GAAP Reconciliation (continued)
($ in millions) Reconciliation of Return on Total Capital Employed (ROTCE) 6/30/15 LTM LTM Average Stockholders' Equity (6/30/15, 3/31/15, 12/31/14, 9/30/14 and 6/30/14)
$459.9
LTM Average Debt (6/30/15, 3/31/15, 12/31/14, 9/30/14 and
6/30/14) 40.1
LTM Average Cash (6/30/15, 3/31/15, 12/31/14, 9/30/14 and
6/30/14) (99.7)
LTM average capital employed
$400.3
LTM Net income $91.4 Plus: LTM Interest expense, net 3.4 Less: Income taxes on interest expense, net at 38% (1.3) Actual return on capital employed = actual net income before interest expense, net, after tax
$93.5 Actual return on capital employed percentage 23.4% _____________________ Note: Return on capital employed is provided solely as a supplemental disclosure with respect to income generation because
management believes it provides useful information with respect to earnings in a form that is comparable to the Company’s cost of capital employed, which includes both equity and debt securities, net of cash. 31 |
 Cash
Flow before Financing Calculation ($ in
millions) Year Ended December 31
Trailing 12
Months
2010 2011 2012 2013 2014 6/30/15 Reconciliation of Cash Flow before Financing Net cash provided by operations $47.5 $54.6 $128.7 $152.9 $100.0 $110.8 Net cash used for investing activities (8.5) (15.9) (19.5) (26.1) (44.4) (44.7) Cash Flow before Financing $39.0 $38.7 $109.2 $126.8 $55.6 $66.1 32 |
 Supplemental Information |
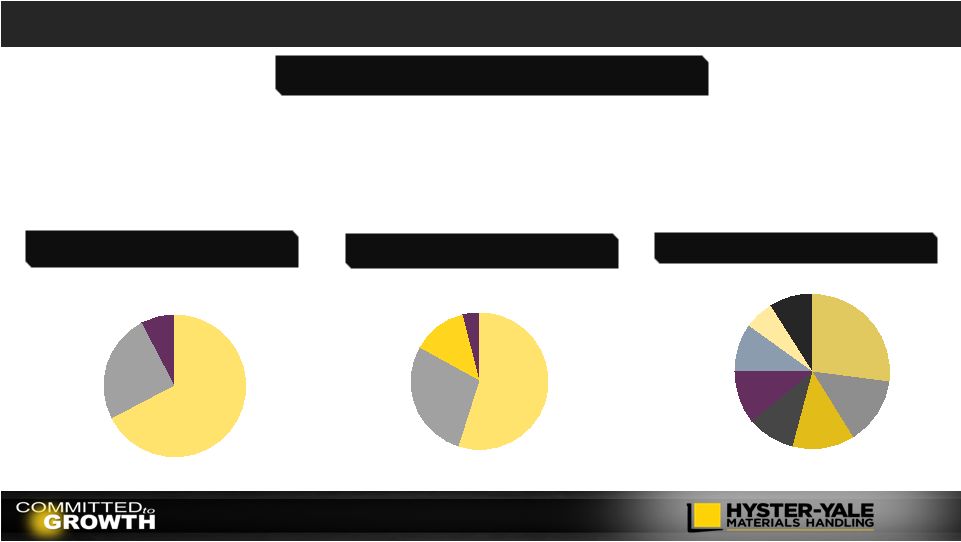 Manufacturing 27% Wholesale Distribution 14% Food & Beverage 13% Rental 10% Home Centers/ Retail 11% Freight & Logistics 10% Paper 6% Other 9% Overview and Sources of Revenue 2014 Worldwide Sales by Product 2014 Sales by Geography Americas 67% Europe, Africa & Middle East 25% Asia-Pacific 8% Internal Combustion Engine Units (2) 55% Electric Units 28% Parts 13% Other 4% 2014 Retail Shipments by End Market (1) _____________________ (1) Represents Hyster-Yale North American unit shipments by industry. (2) Includes Big Truck sales that represent 11.3% of total sales. 34 • Leading global lift truck manufacturer in terms of units sold – #3 globally in 2014 – Large installed base that drives parts sales – Over 825,000 units worldwide – Sales of 87,600 units in 2014 – Sales of >4,500 units at SN JV in Japan & Asia in 2014 Key Highlights • Diverse customer and application base • Global independent dealer network • Comprehensive, updated global product line • Globally integrated operations with economies of scale • Experienced management team |
 Hyster-Yale Global Footprint
35 |
 Hyster-Yale Is a True Full Line Supplier
Electric Counterbalanced Rider Trucks Electric Narrow Aisle Trucks Electric Hand Trucks Internal Combustion Engine (cushion tire) Internal Combustion Engine (pneumatic tire) Electric CB 3 wheel Electric 4 wheel Electric Pallet Trucks Stackers Very Narrow Aisle Trucks Order Pickers Reach Trucks Internal Combustion Engine ICE CB Laden Container Handlers Big Trucks Empty Container Handlers Reach Stackers CLASS 1 CLASS 2 CLASS 3 CLASS 4 CLASS 5 Warehouse Equipment 36 1.0T to 5.5T 1.5T to 6.0T 1.5T to 8.0T 1.0T to 7.0T 1.0T to 52.0T Forklifts |
 Our
Long-Term Philosophy Long-term
growth Long-term shareholders Shareholder protection Senior management incentivized as long-term shareholders Increase shareholder value Return on Capital Employed and Market Share Increase focus 37 |
 The
History of Hyster-Yale and its brands Hyster founded in Portland,
Oregon as the Willamette Ersted Company 1929
1944 Company name officially changed to Hyster Company 1875 Yale Lock Mfg. broadens its scope into materials handling 1963 Yale forklift truck business merges with Eaton Mfg. Industrial Truck Division 1971 Yale forges a partnership with Sumitomo Ltd 1989 1989 Hyster and Yale merge to form NACCO Materials Handling Group (NMHG) 38 2012 2012 1985 Yale acquired by NACCO Industries 1989 Hyster acquired by NACCO Industries Hyster-Yale formed as independent public company following spin-off by NACCO
2011 2011 NMHG introduces the UTILEV lift truck for the utility segment of the market 2014 2014 NMHG, HY’s operating company, acquires Nuvera to enter the fast-growing hydrogen fuel
cell market |
 The
Transition 39
Maturity of key programs designed to put
us in the position of having the right
products at the right cost and right
quality Commitment to the marketing and support programs which can enable a period of share gain Hyster-Yale spin-off
from NACCO Industries
Three years ago the company reached a key transition point |
 Our
Business Has Been Transformed Comprehensive, updated product
line Average product age since last
upgrade – less than 4 years Designed to meet customer needs and provide low overall cost of ownership Multiple power solutions to meet performance, cost, and environmental needs Product Range Product Range Manufacturing Manufacturing Globally integrated, lean operations with economies of scale Assembled in market of sale Continuous efficiency improvements DFT implementation globally 40 |
 Our
Business Has Been Transformed Centralized supply chain
management Highly flexible low cost supply chain 30%+ low cost country sourcing Concentrated supplier base Intense focus on supplier quality Supply Chain Supply Chain Aftermarket Aftermarket Quality Quality Customer driven programs North America’s warranty rates reduced significantly over the last five years Model Year upgrades High first time fill % Comprehensive all makes parts program Strong Fleet management program Telematics solutions across product line 41 |
 Mission
Statement Redefined Be a leading globally integrated designer,
manufacturer and marketer of a complete range of high quality,
application-tailored lift trucks, offering the lowest cost of
ownership, outstanding parts and service support and
the best overall value.
Our transition had its roots in our initiation of the
Good to Great strategic thinking
process in 2010 which began with a redefinition of our mission statement
42 |
 The Basic
Philosophies That Guide Our Actions Global supplier of lift
trucks and related services Understand and address the needs of customers Brands focused on unique segments of the market Market share growth Market through exclusive, independent, certified distribution Sell direct to large customers Capture full aftermarket potential Customer Customer Internal Internal Distribution Distribution Full line product supplier to meet the needs of major customer segments Modular/scalable components to create the right product at right cost Supply chain organization to deliver high quality / low cost components Assemble in market of sale to meet customer needs quickly Product quality to deliver the best uptime in the industry An environment that motivates and retains high quality employees 43 |
  Key
Relationships…Our Customers The Customer
Direct to customer sales to
major accounts Account Identification Teams Solutions Groups Special Application teams Global Account teams Investment in global CRM system Understanding Customer Needs Blue Chip Customer Base 44 |
 Key
Relationships…Our Dealers The Dealer
Independent Exclusive Entrepreneurial Committed partner Dual-line or single Over 1,000 global dealer locations Enhancing performance Dealer Excellence programs Dealer incentives Term-based contracts Strengthening the distribution footprint Sales and Service territories (SSTs) Competitor conversions In-territory acquisitions More than 2,000 application
consultants
Over 11,000
service technicians Strong Independent Distribution 45 |
 46 Key Relationships…Our Financing Partners |
 Core
Strategic Initiatives 47
Strategic Objective Key Elements • Provide the right product and solution to meet the specific needs of different customers across multiple industries • Segmentation of products and industries • Development of Utility, Standard and Premium products • Range of options to match needs of different industries • Targeted sales and marketing effort Initiative Understand Customer Needs Strategic Objective Key Elements • Deliver lowest cost of ownership for all of our customers based on their specific application • Understand major cost drivers: • Direct (truck price, fuel, service, operator, uptime) • Indirect (safety, litigation, pollution) • Implement right solutions for lower costs Initiative Low Cost of Ownership Outcome: Win in Targeted Major Accounts and Applications Outcome: Competitive Advantage across Product Segments |
 Core
Strategic Initiatives 48
Strategic Objective Key Elements Initiative Strategic Objective Key Elements Initiative Outcome: Best Distribution Channels in the Industry Outcome: Be a Top Tier Global Competitor in Warehouse • Develop the strongest independent, exclusive dealer network Enhance Independent Distribution • Develop all dealers • Appoint / convert successful dealers • Expand number of dual line dealers • Enhance dealer value proposition • Combine dealer entrepreneurship with OEM support • Strengthen penetration of the growing warehouse segment Improve Warehouse Position • Enhance product ranges • Develop stronger direct sales capabilities • Develop dealer resources and specialization • Enhance marketing services and support |
 Core
Strategic Initiatives 49
Strategic Objective Key Elements Initiative Strategic Objective Key Elements Initiative Outcome: Increase Share and Strengthen Distribution at Accelerated Pace Outcome: Grow leading market position in Big Trucks Succeed in Asia Enhance Big Truck Market Position • Expand market penetration throughout Asia • Increase leading market position in Big Trucks / Become vendor of choice in Big Truck segment • Organic growth through development of dealer network and direct selling capabilities • Development of long term strategic partnerships • Development of right products • Development of support
infrastructure • New products • Business unit concept in each region • Global team coordination • Focus on industry and solutions • Success with large port operators • Comprehensive Tier 4 offering |
 Core
Strategic Initiatives 50
Strategic Objective Key Elements Initiative Strategic Objective Key Elements Initiative Outcome: Gain momentum leading to higher unit volumes and enhanced market share Strengthen Sales and Marketing Organization Commercialize Nuvera’s Fuel Cell Technology • Strengthen and align sales and marketing organization in all geographic regions • Greater accountability for results through smaller sales management areas • Leaders provided with new tools and enhanced reporting capabilities • Solutions Groups to develop product specific expertise for customer clusters • Major focus on account identification and coverage • Implementing new sales approach with appropriate tools to enhance solutions selling skills • Acquired in December 2014 • Strong patent portfolio • Enables active participation in the growing hydrogen and fuel cell market • Integration of Nuvera’s technology into Hyster-Yale’s lift truck product range • Supports other key strategic initiatives Outcome: Successfully create an integrated fuel cell power solution option for customers
• Commercialize Nuvera’s technology through introduction of new fuel cell and improved hydrogen generation products and enhance our lift truck business value proposition |
 Early
Stage Mid Stage
Achieved Breakthrough Product Improvement Supply Chain Manufacturing Quality Pricing Dealer Structure and Excellence Area Sales Management Account Identification and Coverage Solutions Groups Aftermarket Fleet We believe momentum is gaining in all key areas of the business… Key Business Areas – Stages of Momentum 51 |
 Our
Competitive Advantages 52
• Able to meet customers needs globally • Global economies of scale • New investment in alternative energy solutions • Young/ fresh product line • Source of aftermarket profitability • Barrier to entry Global Full Product Line Field Population Dealer Relationships • Independent distribution model • Exclusive distribution • Combine OEM excellence with entrepreneurial distribution focused on customer • Long relationships • Able to meet most needs • National Account programs Customer Relationships • High performance metrics • Large fleet program Aftermarket Support Employee Relationships • Engaged workforce • Experienced leadership • Equal treatment • High return for our stockholders • Low capital employed structure • Partnership relationships to limit capital needs Focus on Return on Capital |
 Why Nuvera? Nuvera’s Products – The Total Power Solution ™ NMHG + Nuvera: One stop for your hydrogen and fuel cell needs… GENERATION DELIVERY ELECTRIC POWER INDUSTRIAL MOBILITY 53 |
 Complementary Strengths
Driven by Needs of Customers Focus on being a “Good Partner” Robust Product Designs Warehouse Equipment Low Cost of Ownership Supply Chain Management Understand Lift Truck Requirements Product Commercialization Distribution Channels Technology Innovation Patent Portfolio Hydrogen Value Chain Total Power Solution™ 54 |
 Nuvera
Technology Patents across hydrogen value chain
Fuel cell stack a strong fit for industrial mobility
• Metallic cell structure for robustness • Open flow field for high power density Steam methane reformation based hydrogen generation • On-site appliance • Efficient and durable solution Future Electro chemical compressor using fuel cell concepts 55 |
 Nuvera Orion ® Technology Gen1 Battery Box Replacement Gen2 Integrated Fuel Cell Hybrid Truck 56 |
 Fuel Cell
System vs. Batteries 57
Productivity Increase Time saved refueling and changing batteries Constant Power Power throughout shift and improved truck electronic life Environmentally Clean Minimal carbon footprint and zero indoor emissions Economics Significant ROI* Floor space Utilization Recapture battery storage and charging floor space * Depending on application |
   Capturing
More Lifecycle Value Truck
NMHG/HY Maint NMHG/Dealer Energy Utility Company Fuel (PowerTap) Energy Utility Company Nuvera/Dealer PowerEdge Nuvera Maint NMHG/Dealer Truck NMHG/HY Lead Acid Battery* PowerEdge ® Solution* *Representative Total Cost of Operation based on NREL 2013 report Batteries & Charger Battery Supplier 58 Eligible for 30% US Tax Credit (1) _____________________ (1) Currently set to expire on 1/1/17 |
 Near-Term Fuel Cell Opportunity
Market Market Customer Targets Existing Fuel Cell Users Nuvera/ NMHG Customers High productivity applications Share Growth Target Warehouse customers Low cost of ownership North America Market 135k units in 2014 750-1,000k unit Population Battery replacement for Class 1, 2, and 3 electric trucks Economics Economics HY Revenue HY Revenue Fuel Cell Similar acquisition costs Lower total cost of ownership Incremental revenue with H2 fuel Batteries $18-20k lifetime spend $12k for 3 batteries $6-8k for 1 charger Battery Vendor 59 Conventional Battery $ $ Incremental Truck Sales Fuel cell alternatives $ $ |
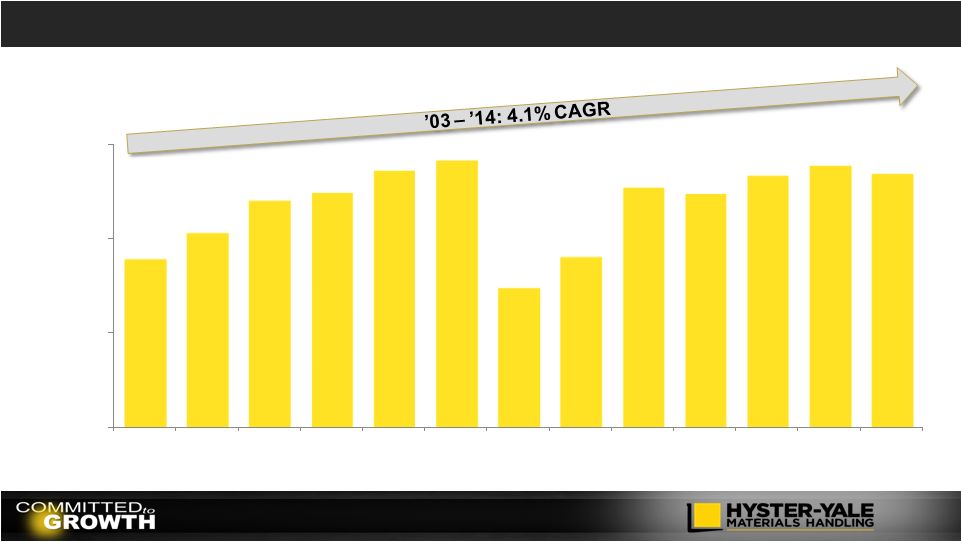 Historical Revenue $1,780 $2,057 $2,400 $2,489 $2,720 $2,824 $1,475 $1,802 $2,541 $2,469 $2,666 $2,767 $2,688 $0 $1,000 $2,000 $3,000 2003 2004 2005 2006 2007 2008 2009 2010 2011 2012 2013 2014 2015 LTM (1) _____________________ (1) As of June 30, 2015. ($ in millions) 60 |
 Key
Operating Expense Investments Strategic Programs for the Forklift
Truck Business
Strategic Programs for the Forklift
Truck Business Nuvera Key Development Investments Nuvera Key Development Investments Strategic Programs Understand the Needs of the Customer Low Cost of Ownership Crack the Code in Warehouse Leader in Independent Distribution Succeed in Asia Big Truck Sales Organization Enhancement Nuvera Fuel Cells PowerEdge ® Battery box fuel cell replacements powered by Orion ®1 Fuel Cells Orion ®2 New fuel cell stack for inclusion in new fuel cell dedicated lift truck line PowerTap ® On-demand hydrogen generation and fuel capability 61 |