Attached files
| file | filename |
|---|---|
| 8-K - FORM 8-K - Commercial Vehicle Group, Inc. | d89034d8k.htm |
 Investor Presentation September 2015 Richard Lavin President and CEO Ulf Lindqwister Chief Administrative Officer Tim Trenary Chief Financial Officer Joseph Saoud President – Global Construction & Agriculture Patrick Miller President – Global Truck & Bus Exhibit 99.1 |
 Forward
Looking Statement This
presentation contains forward-looking statements that are subject to risks and uncertainties. These statements often include words such as "believe," "expect," "anticipate," "intend," "plan," "estimate," or similar expressions. In particular, this press release may contain forward-looking statements about Company expectations for future periods with respect to its plans to improve financial results and enhance the Company, the future of the Company’s end markets, Class 8 North America build rates, performance of the global construction equipment business, expected cost savings, enhanced shareholder value and other economic benefits of the consulting services, the Company’s initiatives to address customer needs, organic growth, the Company’s economic growth plans to focus on certain segments and markets and the Company’s financial position or other financial information. These statements are based on certain assumptions that the Company has made in light of its experience in the industry as well as its perspective on historical trends, current conditions, expected future developments and other factors it believes are appropriate under the circumstances. Actual results may differ materially from the anticipated results because of certain risks and uncertainties, including but not limited to: (i) general economic or business conditions affecting the markets in which the Company serves; (ii) the Company's ability to develop or successfully introduce new products; (iii) risks associated with conducting business in foreign countries and currencies; (iv) increased competition in the medium and heavy-duty truck, construction, aftermarket, military, bus, agriculture and other markets; (v) the Company’s failure to complete or successfully integrate strategic acquisitions; (vi) the impact of changes in governmental regulations on the Company's customers or on its business; (vii) the loss of business from a major customer or the discontinuation of particular commercial vehicle platforms; (viii) the Company’s ability to obtain future financing due to changes in the lending markets or its financial position; (ix) the Company’s ability to comply with the financial covenants in its revolving credit facility; (x) the Company’s ability to realize the benefits of its cost reduction and strategic initiatives; (xi) a material weakness in our internal control over financial reporting which could, if not remediated, result in material misstatements in our financial statements; (xii) volatility and cyclicality in the commercial vehicle market adversely affecting us; and (xiii) various other risks as outlined under the heading "Risk Factors" in the Company's Annual Report on Form 10-K for fiscal year ending December 31, 2014. There can be no assurance that statements made in this presentation relating to future events will be achieved. The Company undertakes no obligation to update or revise forward-looking statements to reflect changed assumptions, the occurrence of unanticipated events or changes to future operating results over time. All subsequent written and oral forward-looking statements attributable to the Company or persons acting on behalf of the Company are expressly qualified in their entirety by such cautionary statements. pg | 1 |
 Overview • Our Company & Growth Strategy • End Markets • Product Development • Financial Update • Capital Expenditures • Capital Structure pg | 2 |
 pg |
3 Global Footprint |
 Products pg | 4 |
 2014
Sales Product
End Market Customer Region CVG at a Glance pg | 5 |
 CVG
2020 1
2014 to 2020 2 EBITDA, as may be adjusted from time-to-time for special items (such as asset impairments, restructuring, etc.)
pg | 6 Drive Profitable Organic Growth • We will invest in products and capabilities that will strengthen our right-to-win with our core products in our end markets • We intend to achieve sales and earnings targets commensurate with companies delivering top quartile total shareholder returns • We will consider opportunistic acquisitions that complement our product portfolio and enhance serving our end markets & customers |
 Prioritize Opportunities & Focus on Core Products Core and Complementary Products REGIONS END MARKETS CORE PRODUCTS COMPLEMENTARY PRODUCTS NA Seats Trim Wire Harnesses Mirrors Office Seats Structures Wipers Truck X X Construction X X X Agriculture X X X Bus X X Aftermarket X X EMEA Truck X Construction X X Agriculture X X Bus X Aftermarket X APAC Truck X X Construction X X Agriculture X X Bus X X Aftermarket X pg | 7 |
 CVG has about 5% of the addressable market – significant opportunity to drive profitable organic growth across our end
markets
Source: Company data, LMC + Millmark research reports 1 Available market = Universe of applications / platforms available for product portfolio
2 Addressable market = Subset of available market for which products are currently available or product plans are in place
3 Does not include approximately $131M in sales of complementary products Market Share pg | 8 • Available Market 1 | $27B • Addressable Market 2 | $13B |
 End
Markets •
Truck production in North America is strong
– Heavy-duty truck production may moderate in 2016 (ACT forecasting 306 thousand units), at a level well in excess of replacement level – Medium-duty truck production may be up somewhat in 2016 • Truck production in EMEA and APAC does not, at the moment, have a meaningful influence on our sales – we are in the early stages of developing our presence • Bus market in North America is up about 5 percent this year, and Indian bus market is up about 15% (government and education sector orders) Global Truck & Bus pg | 9 |
 End
Markets •
Commodity prices are adversely affecting mining and
farm incomes – Global demand for construction and agriculture equipment has declined in 2015 • Chinese construction equipment down about 40 percent year over year • The good news: Construction and agriculture is a $12 billion market for us – a big opportunity Global Construction & Agriculture pg | 10 |
 India
Modular Driver Seats •
Developed a modular driver seat for applications on truck, bus, and off-road
vehicles •
Locally sourced, common core architecture modified to specific needs; meets global
standards
• Entry level to premium level applications • Awarded business in construction and industrial applications • Truck application is in validation testing with multiple interested OEMs Off-road applications On-highway applications Expanding the Addressable Market pg | 11 |
 Expanding
the Addressable Market Light Construction & Agriculture Available
Markets Sentinel Seat
Traditional Suspension Seats –
Low Coverage Currently in market Sentinel Seat Tier 1 | 2 Available since 2013 & 2014 Sentinel Seat Tier 3 | 4 Prototypes available Late 2015 Commercialization in 2016 pg | 12 |
 Dry
Urethane •
Automated system using dry substrates improves
labor, material usage, floor-space and cycle time
• Higher quality and consistency; better acoustics and light weight • Emulates world class auto systems but customized for Heavy-Duty Truck • Proprietary process technology and material • Leading market share in headliner for North America truck; more growth in process • Next generation headliners won with this new process • In production with current products New Product Development pg | 13 |
 FINANCIAL UPDATE pg | 14 XXXXXXXXXXXX XXX |
 pg |
15 Financial Results
Sales and Adjusted Operating Income Margin See appendix for reconciliation of GAAP to non-GAAP financial measures – Adjusted Operating Income reconciliation |
 Segments 1 Mature, well performing North American business Developing global presence Established leadership, customer relationships and business processes Profitable Profitable wire harness business Developing seats business Leverage GTB capabilities and know-how Seats cost structure not yet scaled New leadership – Joseph Saoud $12 billion opportunity (Dollars in millions) Global Truck & Bus Global Construction & Agriculture Sales $ 149.3 $ 70.7 Gross Profit Margin 15.3 % 10.7 % SGA $ 7.5 $ 4.7 Adjusted OIM 10.4 % 4.0 % 1 For the quarter ended June 30, 2015 pg | 16 See appendix for reconciliation of GAAP to non-GAAP financial measures –
Segment Adjusted Operating Income reconciliation |
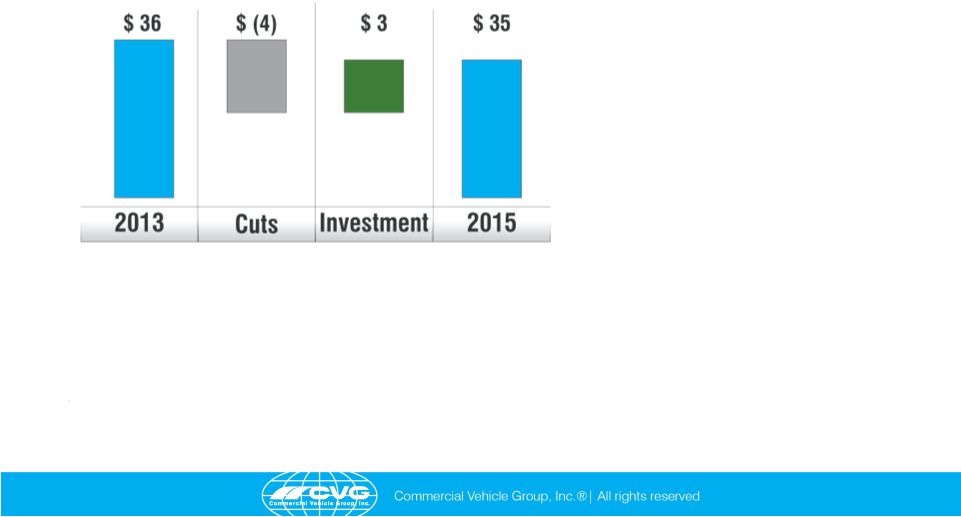 Selling,
General and Administrative Spend 1
Investment • Product Line Managers • Go to market capabilities • Global engineering • Centrally led procurement and logistics • Operational Excellence 1 For the six months ended June 30, 2015; 2013 adjusted for $2.5 million leadership change costs
Certain SG&A spend cut in favor of more value accretive
spend pg | 17 |
 Operational Excellence • Jack Feng, PhD in Industrial and Management Engineering, leads our Operational Excellence Program • Deployments to date (4 Master Black Belts / Lean 6 Sigma Deployment Managers): – Facilities representing about 40% of our annual sales – 16 Lean 6 Sigma Black Belts & 12 Green Belts • Deployments by the end of 2016: – Facilities representing about 70% of our annual sales – 30 Lean 6 Sigma Black Belts & 54 Green Belts Institutionalize lean manufacturing pg | 18 |
 Capital
Expenditures 1
1 2015 forecast of $19 - $22 million Capital investment consistent with our strategy Growth Cost Reductions Infrastructure Other Global Truck & Bus Global Construction & Agriculture Product Development & Information Technology pg | 19 |
 See appendix for reconciliation of GAAP to non-GAAP financial measures – EBITDA reconciliation Capital Structure Senior Secured Notes Principal Balance $250 Interest 7.875% Due April 2019 April 2015 Redemption 104% April 2016 Redemption 102% April 2017 Redemption 100% Agency Ratings/Outlook Moody’s B2 / Stable S&P B / Stable Asset Based Credit Facility Commitment $40 Availability $37 Letters of Credit $3 Accordion Option $35 pg | 20 LTM (Millions) 2013 2014 Q2 2015 Debt 250 $ 250 $ 250 $ Cash 73 70 89 Net Debt 177 $ 180 $ 161 $ EBITDA 27 $ 52 $ 60 $ Leverage: Debt/EBITDA 9.3 X 4.8 X 4.2 X Net Debt/EBITDA 6.6 X 3.5 X 2.7 X Liquidity: Cash 89 $ ABL 40 $ Less: LOC (3) $ Total 126 $ |
 Appendix pg | 21 XXXXXXXXXX XXXXXX |
 Reconciliation of GAAP To Non-GAAP Financial
Measures Adjusted Operating Income Reconciliation pg | 22 TOT_CVG_LOB Q1 Q2 Q3 Q4 Q1 Q2 Q3 Q4 Q1 Q2 (Dollars in millions) Sales 177.8 198.9 187.9 183.0 198.1 216.0 213.8 211.9 220.3 217.6 Cost of Sales 159.7 176.0 169.8 162.3 173.8 187.8 185.4 185.1 191.2 188.1 Gross Profit 18.1 22.9 18.1 20.7 24.3 28.2 28.4 26.8 29.1 29.5 SGA 18.0 20.4 21.1 12.3 18.5 18.8 18.3 16.9 17.6 17.6 Amortization 0.4 0.4 0.4 0.4 0.4 0.4 0.4 0.4 0.3 0.3 Operating Income (0.3) 2.1 (3.4) 8.0 5.4 9.0 9.7 9.5 11.2 11.6 OIM (0.2)% 1.1% (1.8)% 4.4% 2.8% 4.2% 4.5% 4.5% 5.1% 5.3% 2013 Special Items Reduction in Force 1.8 Third-Party Consulting 2.8 Asset Impairment 2.7 CEO Change 2.5 2014 Special Items Plant Closures 0.5 0.1 0.2 0.5 Loss on Sale of Building 0.8 2015 Special Items Plant Closures 0.7 0.5 Adjusted Operating Income (0.3) 4.6 3.9 8.0 6.7 9.1 9.9 10.0 11.9 12.1 Adjusted OIM (0.2)% 2.3% 2.1% 4.4% 3.4% 4.2% 4.6% 4.7% 5.4% 5.6% 2013 2014 2015 |
 EBITDA
Reconciliation Reconciliation of GAAP To Non-GAAP Financial
Measures 2013 2014 LTM (Dollars in millions) Q2 2015 Operating Income 6.4 33.7 42.0 Depreciation 19.0 16.7 16.7 Amortization 1.6 1.5 1.4 EBITDA 27.0 51.9 60.1 pg | 23 |
 Reconciliation of GAAP To Non-GAAP Financial
Measures Segment Adjusted Operating Income Reconciliation pg | 24 For the three months ended June 30, 2015 (Dollars in millions) Global Truck Global Construction & Bus & Agriculture Operating Income 15.1 2.8 Q2 2015 Special Items Plant Closures 0.5 - Adjusted Operating Income 15.6 2.8 Adjusted Operating Income Margin 10.4% 4.0% |