Attached files
| file | filename |
|---|---|
| 8-K - 8-K - SANFILIPPO JOHN B & SON INC | d18690d8k.htm |
 INVESTOR PRESENTATION
August 27, 2015
NASDAQ: JBSS Exhibit 99.1 Exhibit 99.1 |
 Forward-Looking Statements
Some of the statements in this presentation constitute
“forward-looking statements” about John B.
Sanfilippo & Son, Inc. Such statements include, in particular, statements about our plans, strategies, business prospects, changes and trends in our business and the markets in
which we operate. In some cases, you can identify forward-looking
statements by the use of words such as “may,”
“will,” “could,” “would,” “should,” “expect,” “plan,” “anticipate,” “intend,” “believe,” “estimate,” “forecast,” “predict,” “propose,” “potential” or
“continue” or the negative of those terms or other
comparable terminology. These statements represent our present
expectations or beliefs concerning future events and are not guarantees. Such statements speak only as of the date they are made, and we do not undertake any obligation
to update any forward-looking statement.
We caution that forward-looking statements are qualified by important
factors, risks and uncertainties that could cause actual results
to differ materially from those in the forward- looking
statements. Our periodic reports filed with the Securities and Exchange Commission, including our Forms 10-K and 10-Q and any amendments thereto, describe some of these
factors, risks and uncertainties.
2 |
 3 To be the global leader of quality driven, innovative nut solutions that enhance the customer and consumer experience and achieve consistent, profitable growth for our stockholders. We will accomplish this through our commitment to a dynamic infrastructure that maximizes the potential of our brands, people and processes. Integrity People Investment Customer Driven Quality Innovation Execution Continuous Improvement Safety Resource Conservation Our Corporate Mission and Core Values Mission Core Values |
 We
Are a Leader In The Nut Industry Net sales of $887m in Fiscal
2015 Stock Symbol: JBSS (Nasdaq)
One of the largest nut processors in the world
State-of-the-art shelling and processing facilities
Procurement expertise with buyers averaging over 20+
years experience
Product, packaging and branding innovation
Quality-driven manufacturing process
4 |
 OVH Positioning
What Makes Us Different?
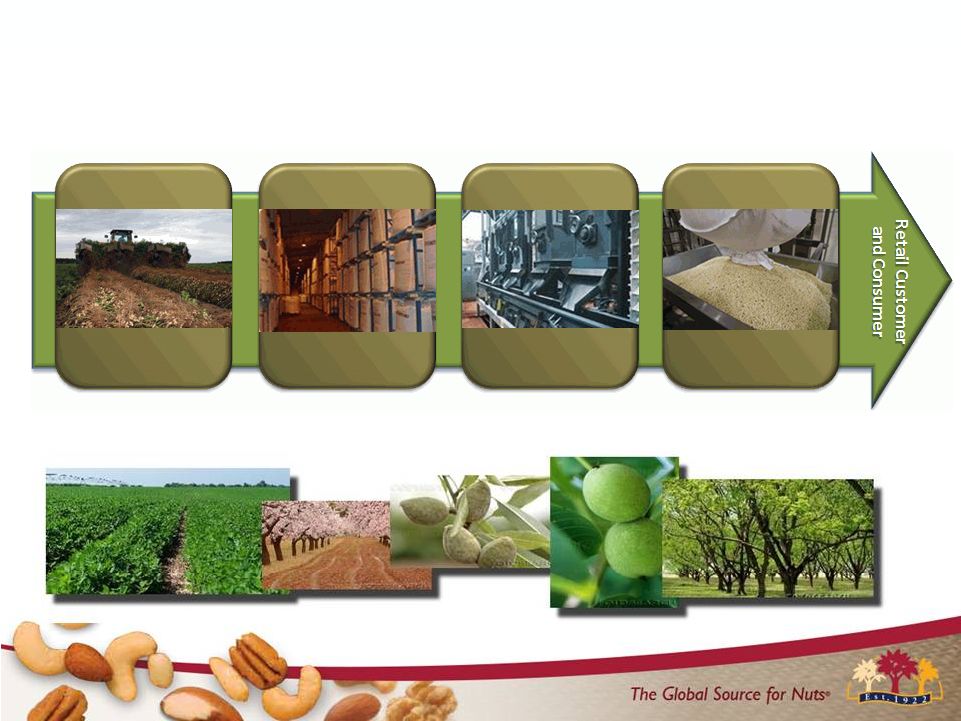
Closest to The Source
Integrated Nut Processor –
From Source to Customer
5 Direct Sourcing Enhances stability and quality of supply Shelling Reduces costs for basic processing Cold Storage Prolongs freshness and shelf life Processing Meets a wide array of customer demands |
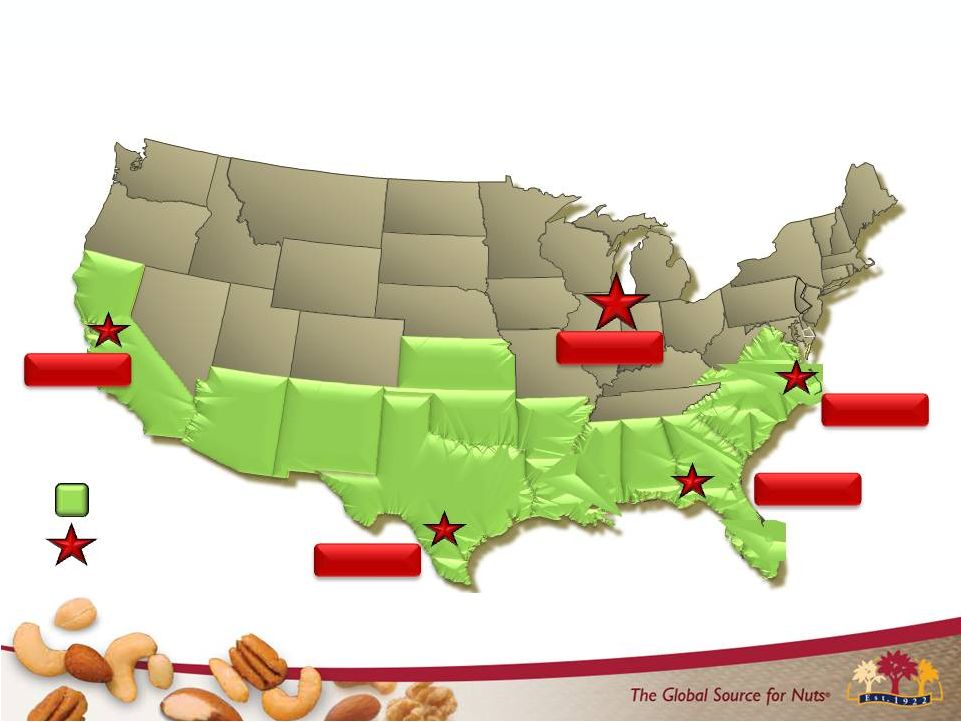 Our Facilities Are Strategically Located
Walnuts Pecans Peanuts Pecans Pecans Pecans Pecans Peanuts Pecans Peanuts Pecans Peanuts Pecans Peanuts Peanuts Pecans Peanuts Pecans Peanuts Pecans Peanuts Pecans U.S. Nut Growing Areas JBSS Facility Gustine, CA Selma, TX Elgin, IL Bainbridge, GA Garysburg, NC 6 Pecans |
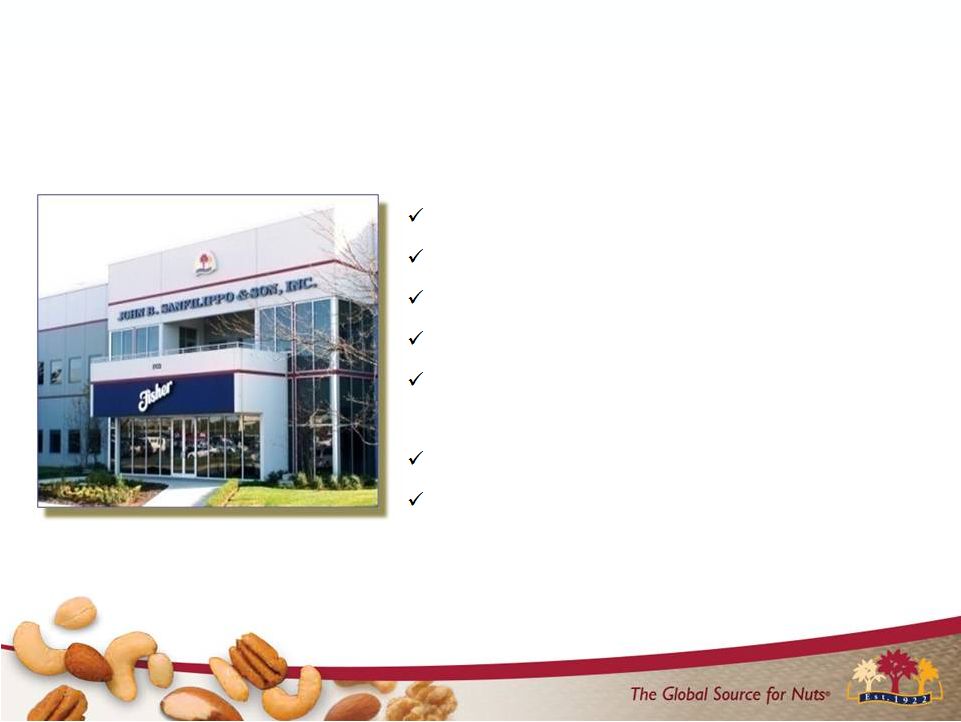
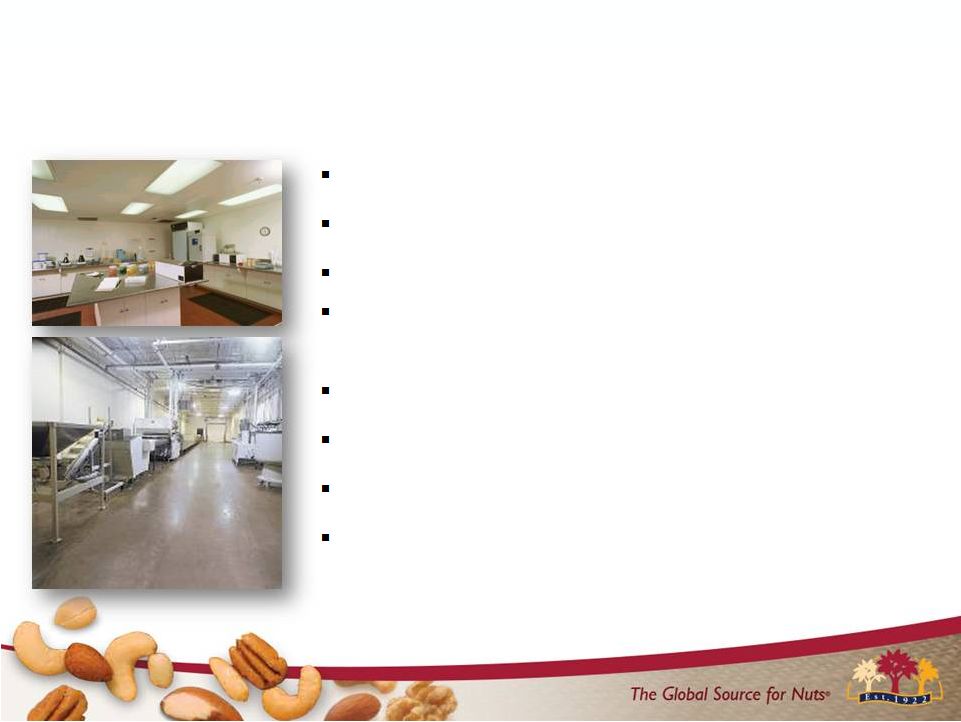
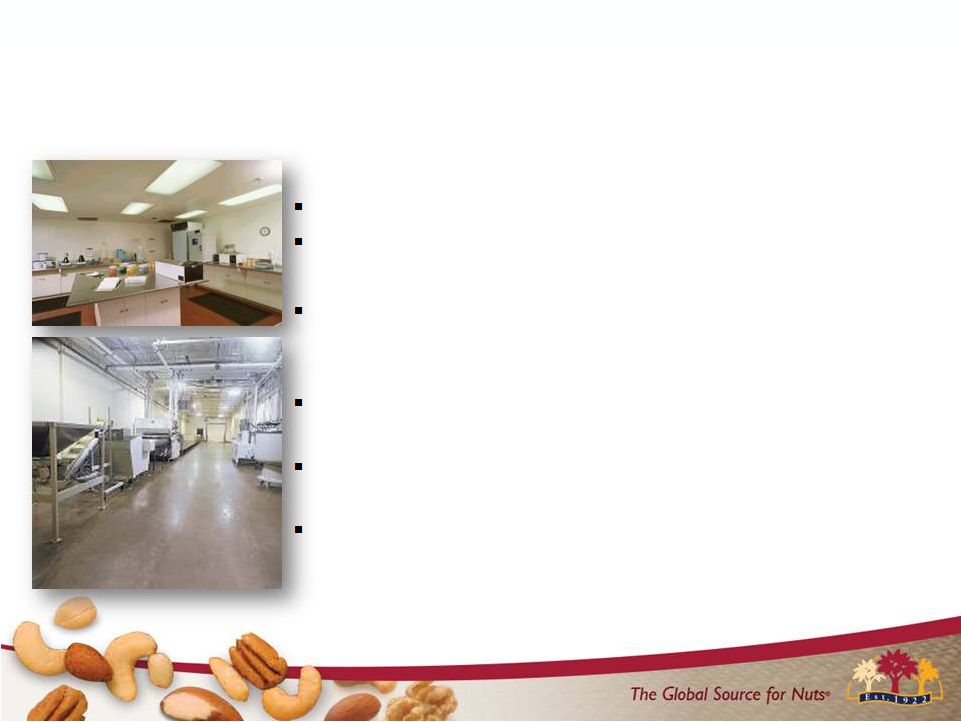
 World Class Facility in Elgin, IL
1 Million Square Feet Comprehensive Allergen Prevention Programs Robust Quality Systems Organic Certification 7 |
 Gustine, CA 131 Employees Garysburg, NC 47 Employees Bainbridge, GA 129 Employees Selma, TX 173 Employees Elgin, IL 951 Employees 8 Our People - Our Commitment - Our Passion |
 HACCP Programs
SQF Level 2 Certified
High ratings from third party audits
Allergen Cross-Contamination Prevention Programs
validated with ELISA testing
Integrated Pest Management Programs
Equipment Sanitation Programs Validated with ATP Testing
Environmental Monitoring Programs –
Zone method Key Quality Performance Indicators (KPI’s) Food Safety and Quality 9 |
 Computerized Data System (Infinity)
Comprehensive Recall Program Tested Twice/Annually
through Mock Recall exercises
Employee Training Programs utilizing Alchemy interactive
courseware GMPs, Allergens, HACCP, Food Defense, and
prerequisite programs
Continuous Review of Operational Methods, Personnel
Practices and Adequacy of the Food Safety Program
Five S Program Implementation - Productivity, Quality and Safety Improvements Food Defense Program 10 Food Safety and Quality |
 We Are Experts In Every Nut Type
% of total FY 15 net sales
* other consists of trail and snack mixes which include nut
products 11
Full assortment of nut types
Full variety of value-added products
Wide variety of dried fruit and
other snack products
Customized, unique product formulas
Fiscal Year 2015
23.4% 12.7% 12.0% 13.7% 11.0% 22.0% 5.2% ALMOND PECAN SNACK AND TRAIL MIXES PEANUT WALNUT CASHEW &MIXED NUT ALL OTHER |
 SALES CHANNEL UPDATES
Export Commercial Ingredients Contract Manufacturing Consumer 12 |
 Multiple Distribution Channels
13 * Approximately 32% of the Consumer channel sales were Fisher brand sales
$887 mil Net Sales in Fiscal 2015
Net Sales by Channel
Consumer $529m Com. Ingred. $207m Contract Mfg. $115m Export $ 36m TTL JBSS $887m Consumer * - 60% Commercial Ingredient - 23% Contract Mfg. - 13% Export - 4% |
 Consumer Channel
$529 mil Net Sales in Fiscal 2015
+16.7%* * Net sales growth versus FY 2014 14 |
 Commercial Ingredients Channel
$207 mil Net Sales in Fiscal 2015
+7.3%* * Net sales growth versus FY 2014 15 |
 Export Channel $36 mil Net Sales in Fiscal 2015 +6.0%* * Net sales growth versus FY 2014 16 |
 Contract Manufacturing Channel
$115 mil Net Sales in Fiscal 2015
17 +17.0%* * Net sales growth versus FY 2014 |
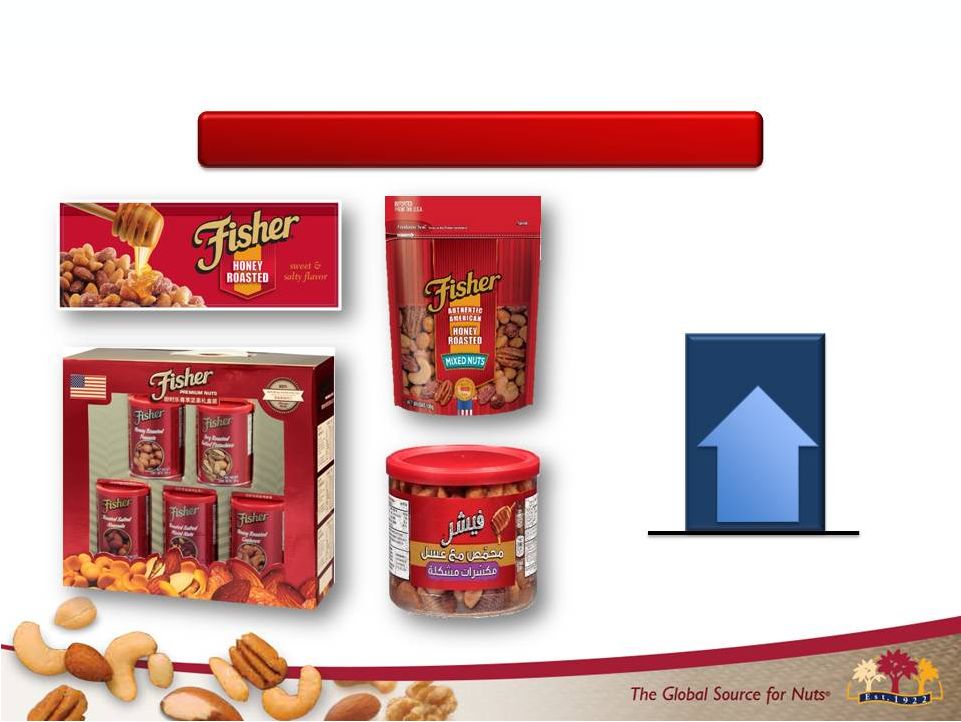
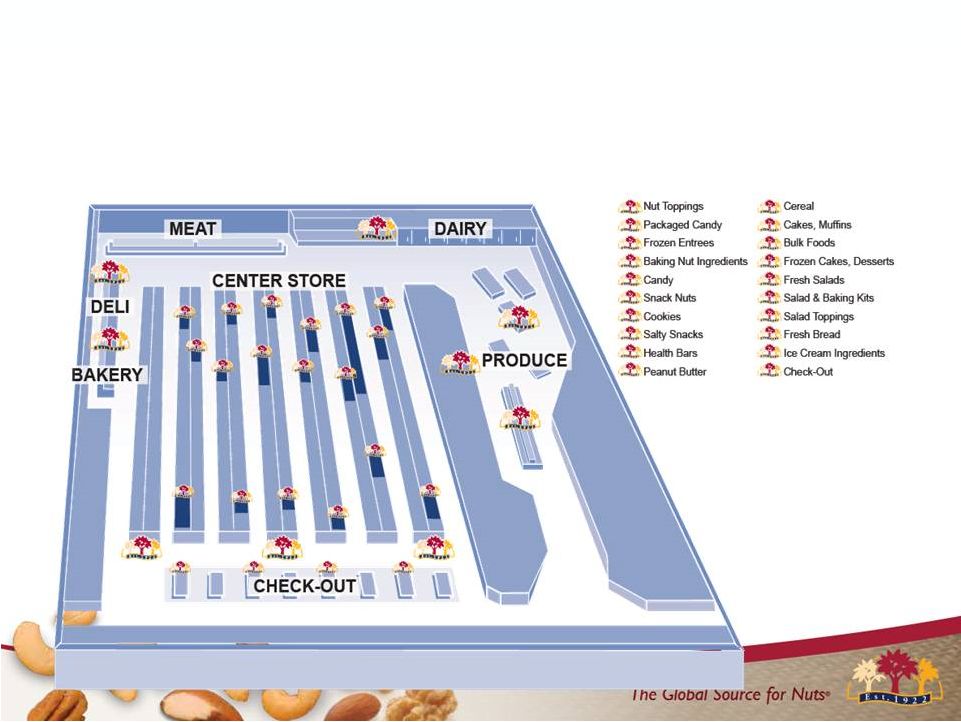 We Reach Consumers…
20+ Points of Distribution In-Store
18 |
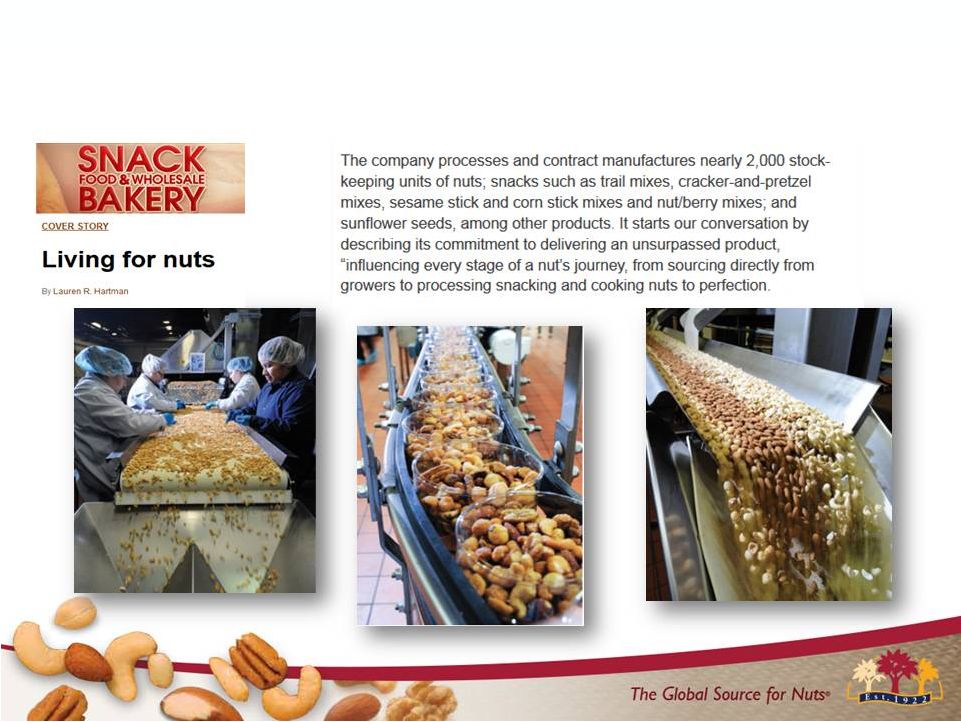 John B. Sanfilippo & Son, Inc.: Transformed
Consumer Products Company …
Reproduced with permission of Snack Food & Wholesale Bakery
magazine 19 |
 FY 2015 FINANCIAL MILESTONES |
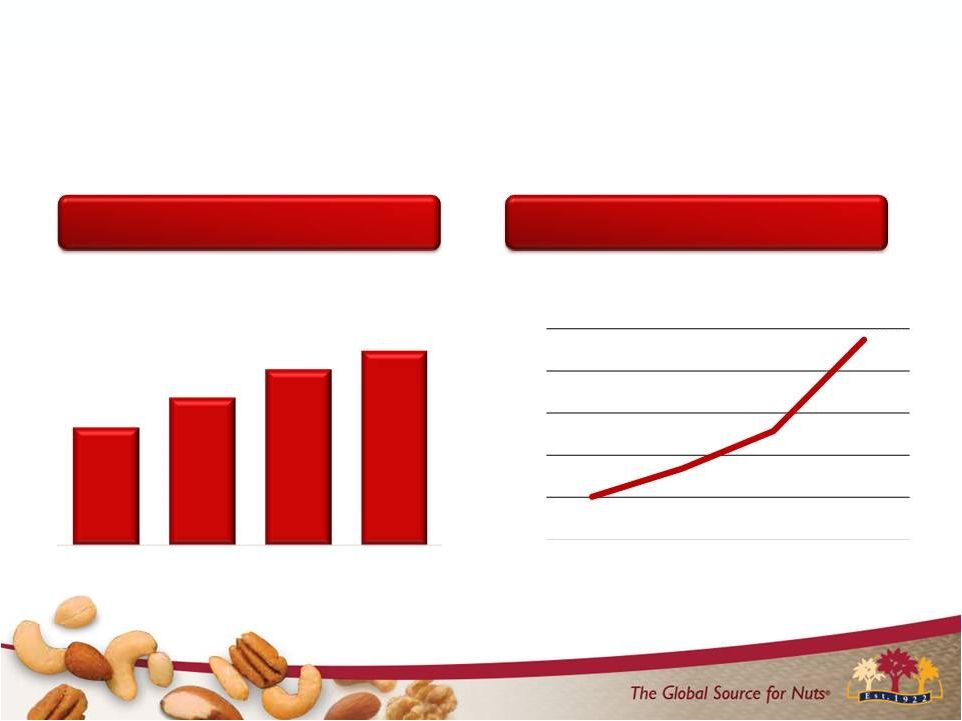 Time to Celebrate Success Results
Over The Past Four Years
Diluted EPS +11% over FY 14 …
Record $2.61 Net Sales +14% over FY 14 ... Record $887.2 mil 21 887,245 650,000 700,000 750,000 800,000 850,000 900,000 FY 12 FY 13 FY 14 FY 15 Net Sales FY 12 - FY 15 1.58 1.98 2.36 2.61 FY 12 FY 13 FY 14 FY 15 EPS FY 12 - FY 15 |
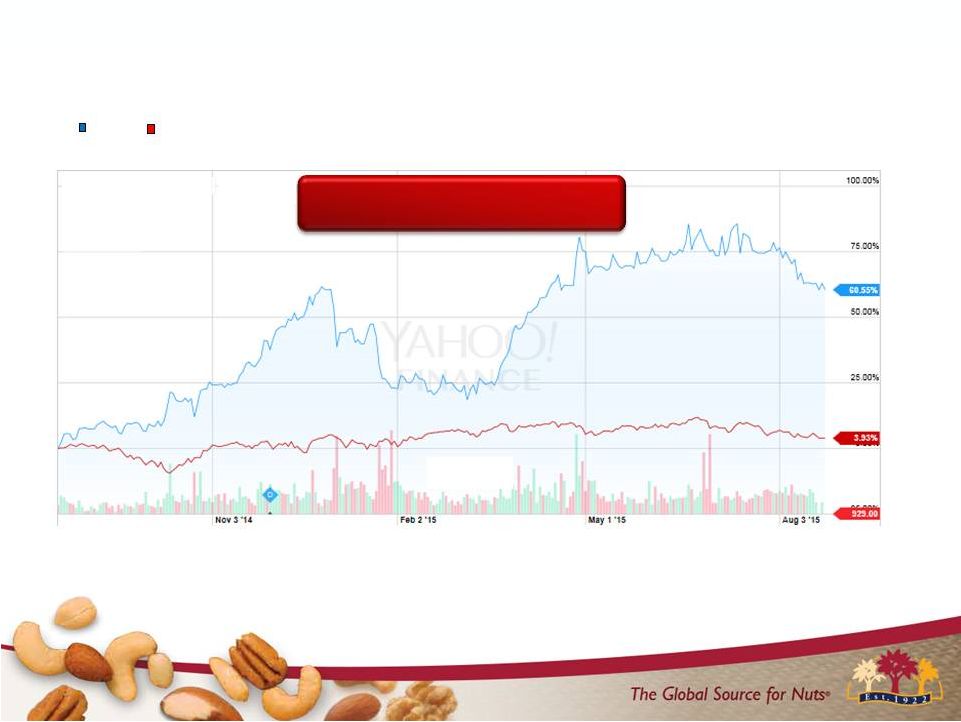 Russell 2000 JBSS 22 Creating Shareholder Value Stock Price $28.43 8/19/2014 Stock Price $48.30 8/19/2015 Outperformed the Russell 2000 Index by over 5,600 BPS’ |
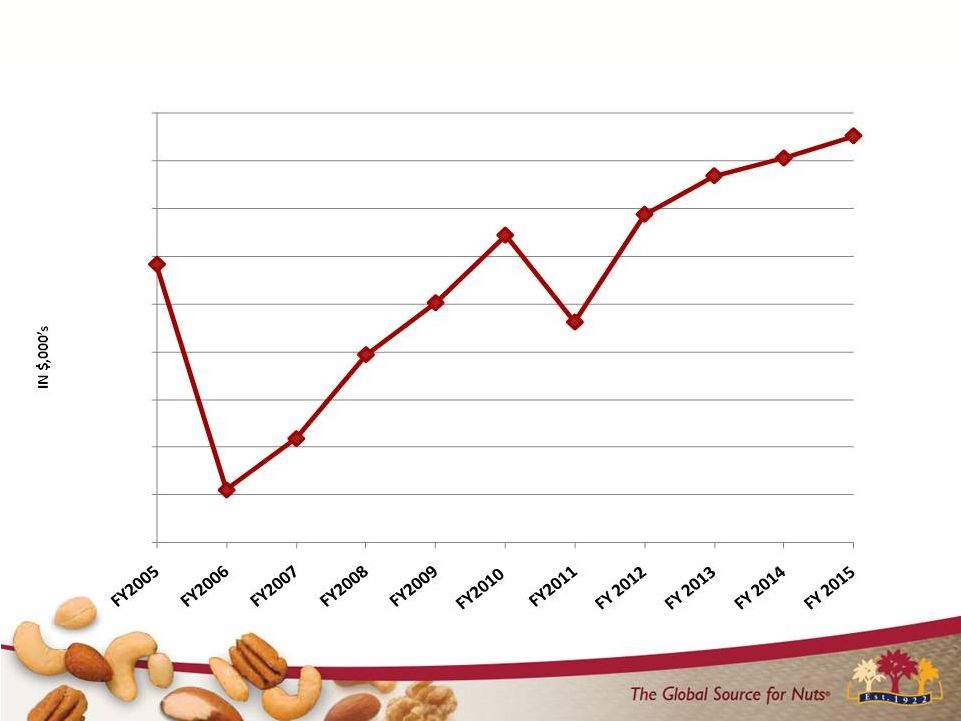
 23 JBSS Stockholders Equity FY 1991-2015 $0 $25 $50 $75 $100 $125 $150 $175 $200 $225 $250 $275 |
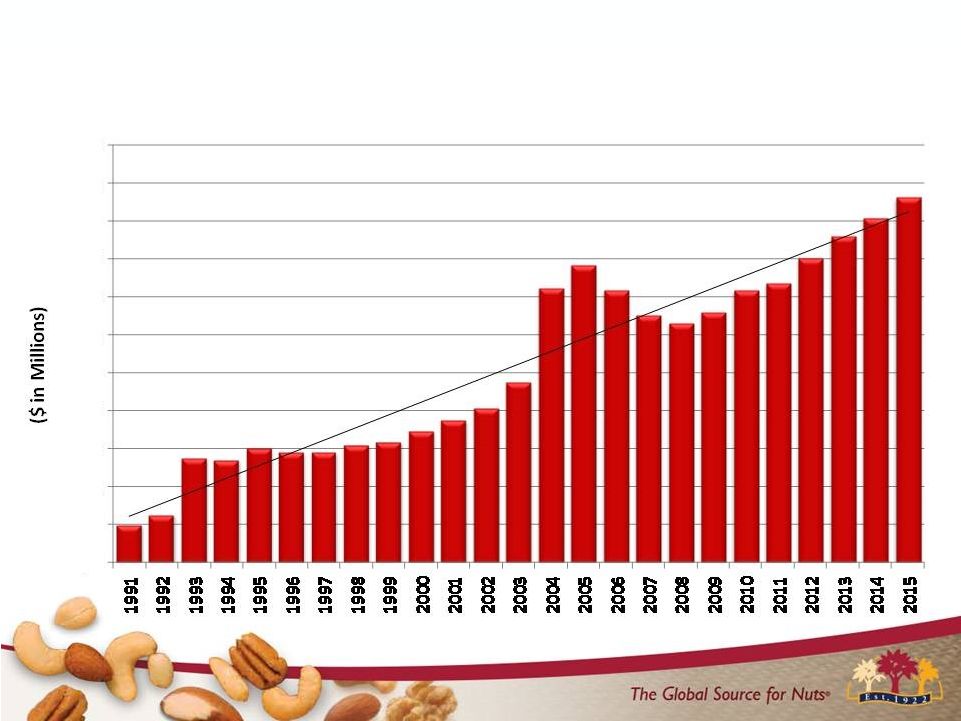
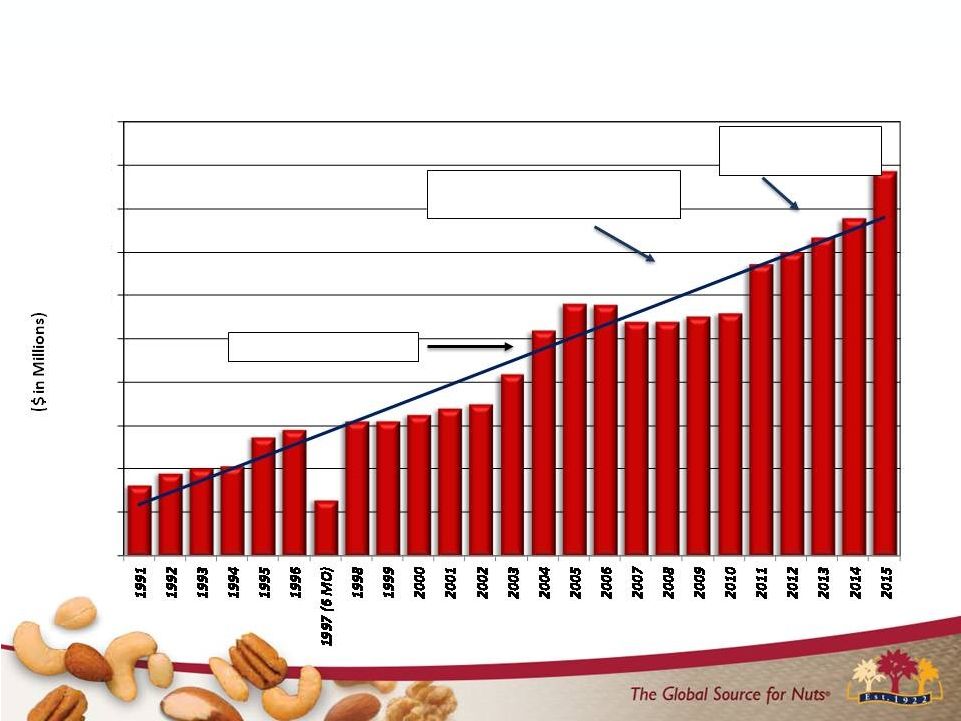 Low
Carb Diet Run Up SKU Rat., De-emphasized
Industrial Sales, Lower Prices
Increased Lb. Volume and Prices 24 JBSS Net Sales FY 1991-2015 $0 $100 $200 $300 $400 $500 $600 $700 $800 $900 $1,000 |
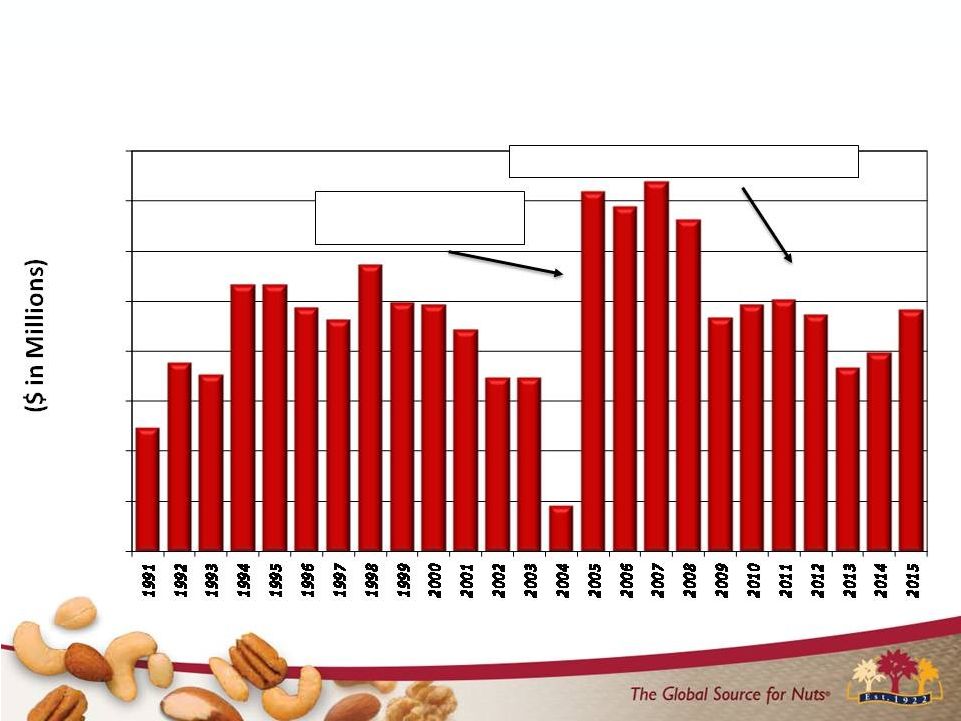 Facility consolidation
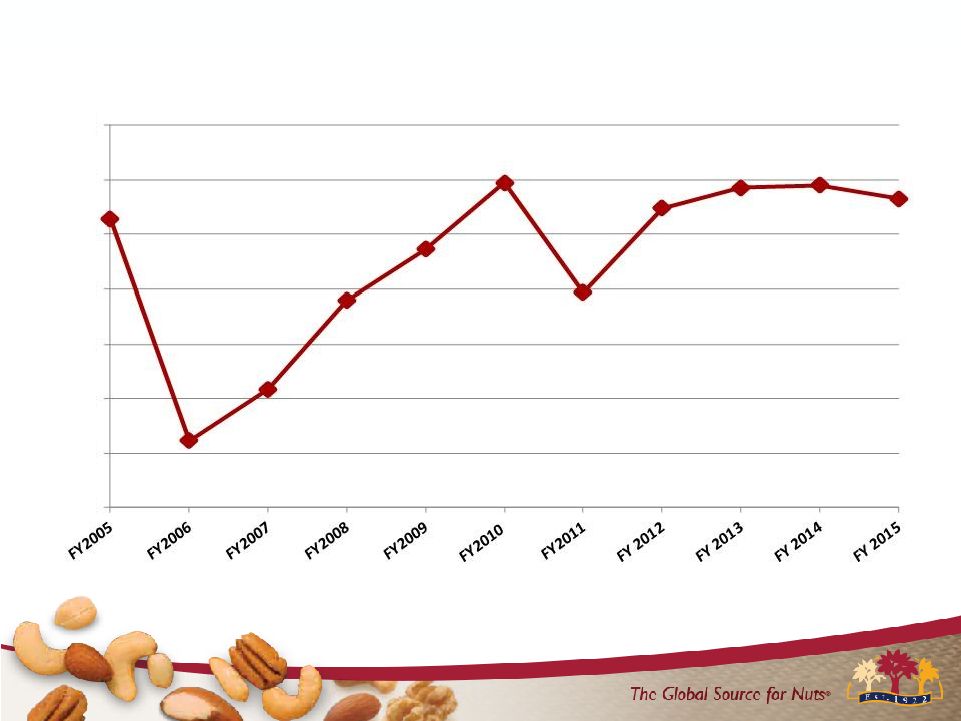
project 25 JBSS TTL Outstanding Debt FY 1991-2015 Improved Operating Performance $0 $20 $40 $60 $80 $100 $120 $140 $160 |
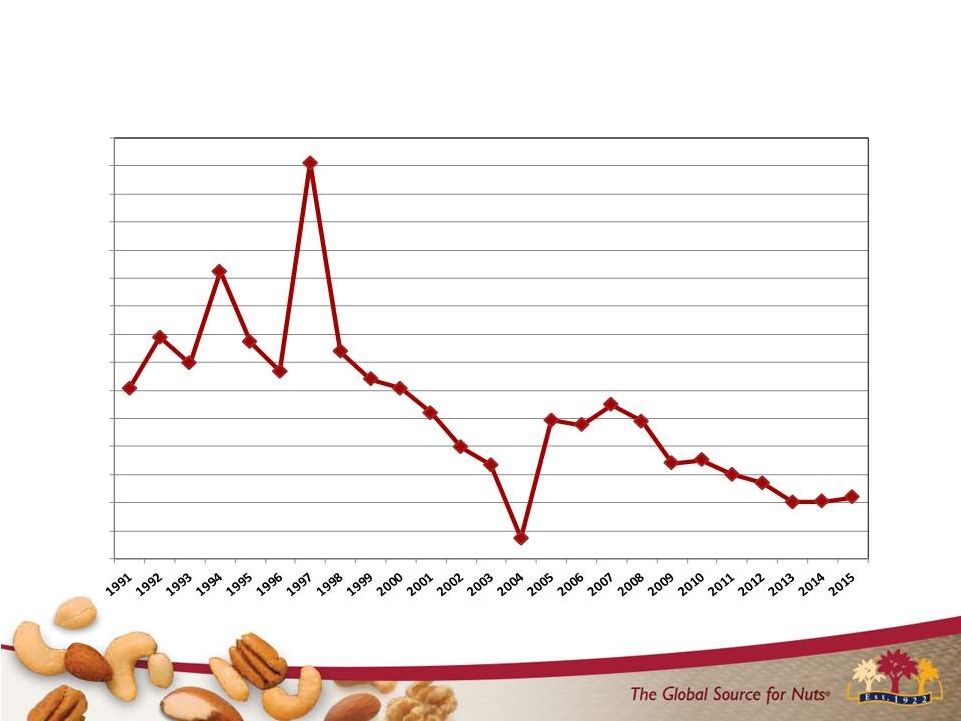 Note: FY 1997 reflects stub year
26 JBSS TTL Outstanding Debt as % of Net Sales 0.0% 5.0% 10.0% 15.0% 20.0% 25.0% 30.0% 35.0% 40.0% 45.0% 50.0% 55.0% 60.0% 65.0% 70.0% 75.0% |
 EBITDA consists of earnings before interest, taxes, depreciation, amortization and noncontrolling interest. EBITDA is not a measurement of financial performance under accounting principles generally accepted in the United States of America ("GAAP"), and does not represent cash flow from operations. EBITDA is presented solely as a supplemental disclosure because management believes that it is important in evaluating JBSS's financial performance and market valuation. In conformity with Regulation G, a reconciliation of EBITDA to the most directly comparable financial measures calculated and presented in accordance with GAAP is presented in the following slide. EBITDA 27 |
 Reconciliation of Net Income (Loss) to EBITDA
(In $ $000's)
FY 2005 FY 2006 FY 2007 FY 2008 FY 2009 FY 2010 FY 2011 FY 2012 FY 2013 FY 2014 FY 2015 NET INCOME (LOSS) 14,499 (16,721) (13,577) (5,957) 6,917 14,425 2,835 17,122 21,760 26,287 29,305 INTEREST EXPENSE 3,998 6,516 9,347 10,502 7,646 5,653 6,444 5,364 4,754 4,354 3,966 INCOME TAX (BENEFIT) EXPENSE 9,269 (8,689) (7,520) (897) (259) 8,447 (49) 9,099 13,536 13,545 15,559 DEPRECIATION & AMORTIZATION 10,501 10,000 13,584 15,742 15,922 15,825 16,968 17,117 16,717 16,278 16,284 EBITDA 38,267 (8,894) 1,834 19,390 30,226 44,350 26,198 48,702 56,767 60,464 65,114 NET SALES 581,729 579,564 540,858 541,771 553,846 561,633 674,212 700,575 734,334 778,622 887,245 EBITDA MARGIN (% OF NET SALES) 6.6% -1.5% 0.3% 3.6% 5.5% 7.9% 3.9% 7.0% 7.7% 7.8% 7.3% POUNDS SOLD 278,741 248,137 246,142 221,958 217,465 224,302 232,746 212,553 221,762 240,417 253,514 EBITDA PER POUND SOLD 0.14 (0.04) 0.01 0.09 0.14 0.20 0.11 0.23 0.26 0.25 0.26 28 |
 EBITDA* 29 -$20,000 -$10,000 $0 $10,000 $20,000 $30,000 $40,000 $50,000 $60,000 $70,000 * EBITDA is a non-GAAP measure. See slide entitled “Reconciliation of Net (Loss) Income to EBITDA” for
reconciliation to GAAP measure |
 EBITDA* Margin (% of Net Sales)
-4.0% -2.0% 0.0% 2.0% 4.0% 6.0% 8.0% 10.0% * EBITDA is a non-GAAP measure. See slide entitled “Reconciliation of Net (Loss) Income to EBITDA” for reconciliation
to GAAP measure 30 |
 Source: Spot market prices from survey of JBSS vendors and
brokers 31
PEANUT AND TREE NUT SPOT MARKET PRICES VS. JBSS ROLLING 4 QTR. GROSS MARGIN % |
 NUT CATEGORY TRENDS |
 Retail Prices Over the Last 6 Years
33 +29% $4.53 $5.84 FY 2010 FY 2015 Price Per Pound Source: IRI: Total Nut Category – Multi Outlet Geography
|
 Retail Prices Up Across All Nut Types over
the Last 6 Years
Source: IRI: Total Nut Category –
Multi Outlet Geography –
Year Ending 6/28/15
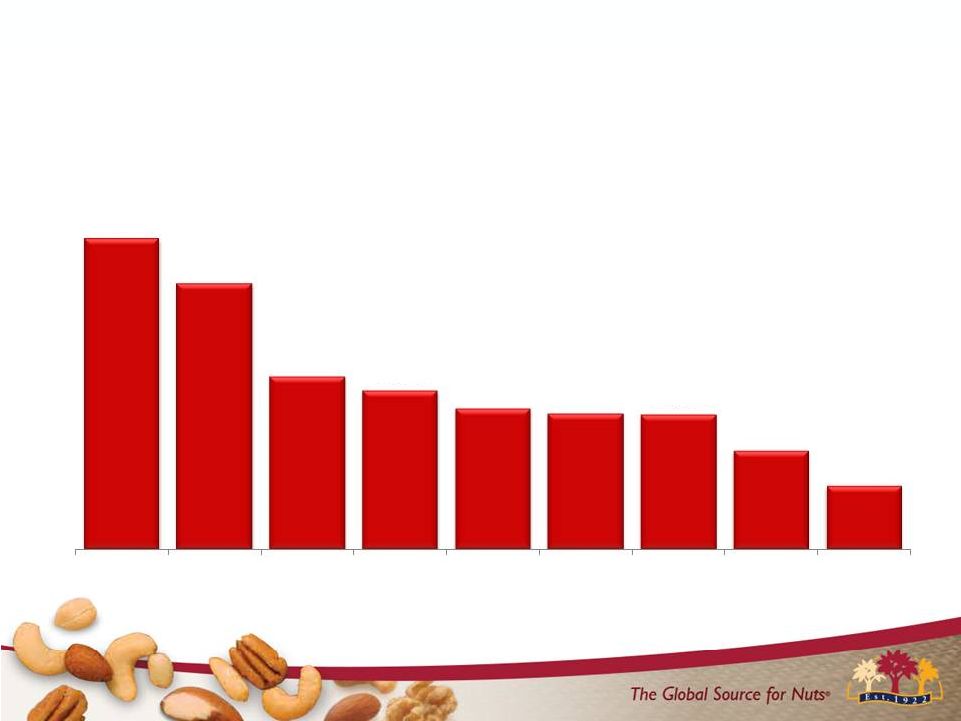
34 70.1% 60.0% 38.9% 35.8% 31.7% 30.4% 30.3% 22.2% 14.1% PISTACHIO WALNUT MACADAMIA NUT MIXED NUT CASHEW ALMOND PECAN PINE NUT PEANUT % Increase in Price Per LB Over the Past 6 Years |
 Strong Nut Category Growth 35 959 974 961 971 1,003 1,043 FY 2010 FY 2011 FY 2012 FY 2013 FY 2014 FY 2015 Category LB Sales (M) 4,350 4,578 5,105 5,457 5,704 6,096 FY 2010 FY 2011 FY 2012 FY 2013 FY 2014 FY 2015 Category $ Sales (M) Source: IRI: Total Nut Category – Multi Outlet Geography – Year Ending 6/28/15 |
 CORPORATE STRATEGIES |
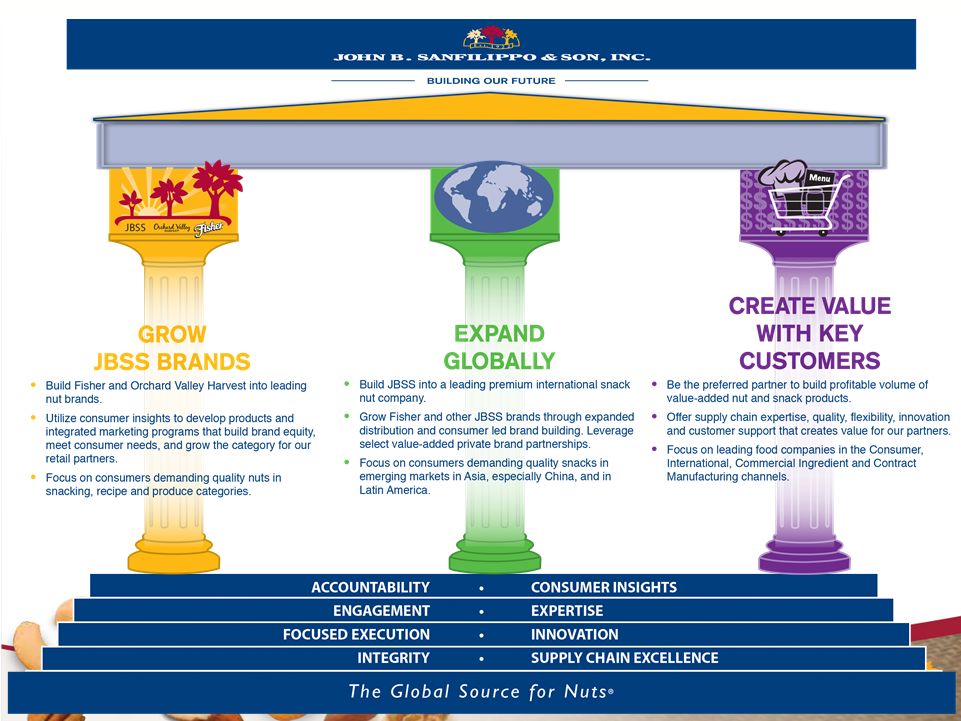 37 |
 Fisher recipe nuts market share growth,
now the #1 brand nationally (4 wks. ending
8/9/15). Fisher snack nuts market share growth in
high franchise Midwest.
Orchard Valley Harvest expanded
distribution and increased velocity
resulting in double-digit revenue growth
over FY14. FY 2015 Accomplishments 38 |
 Launched Fisher Flagship Store on Tmall
(China); Developed a Fisher stand-up bag product line for China. 39 FY 2015 Accomplishments |
 Leveraged our innovation capabilities to
launch 15 new items for our key contract
manufacturing customers.
Optimized Food Service and Industrial
Ingredient customer and product portfolios.
Expanded Fisher brand awareness in the
Commercial Ingredients Channel.
40 FY 2015 Accomplishments |
 FY 2015 SALES AND
MARKETING UPDATE |
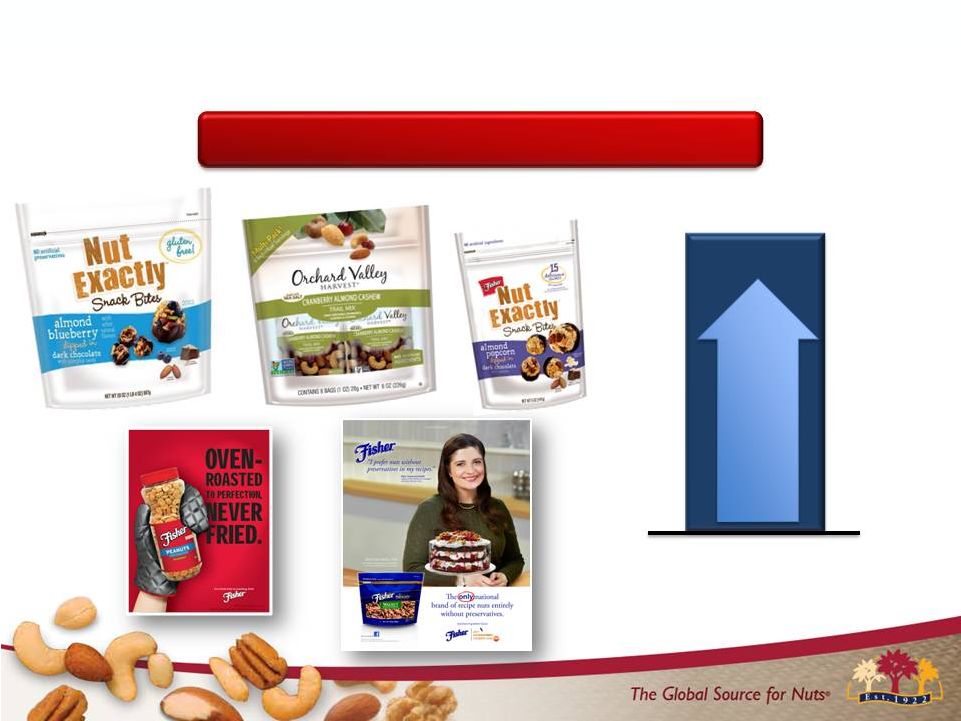
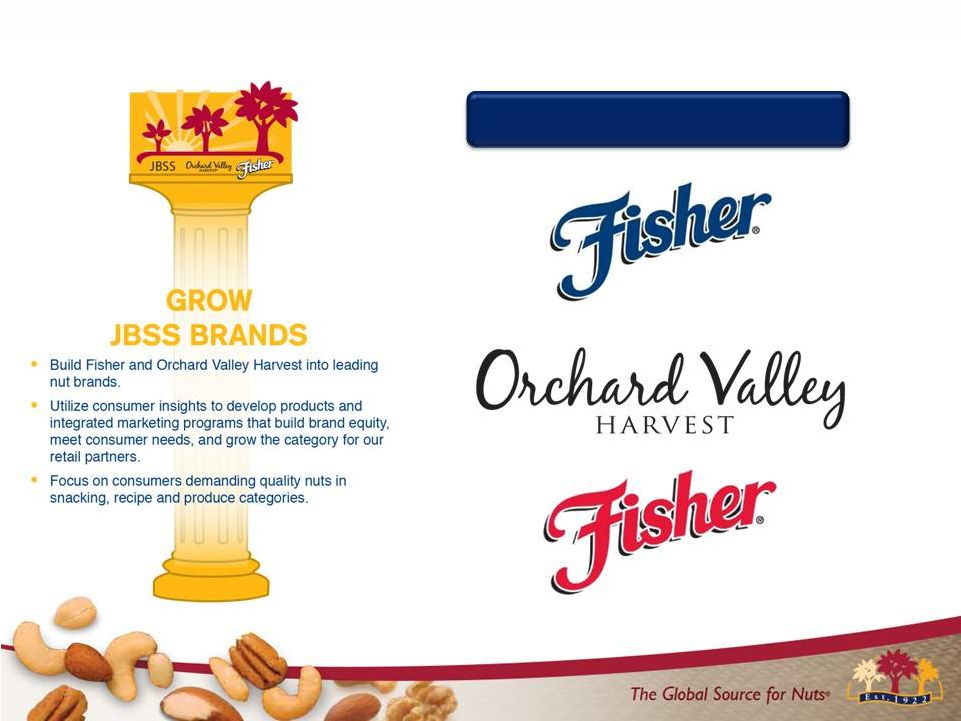 Recipe
Nuts Snack Nuts
Grow Brands 42 |
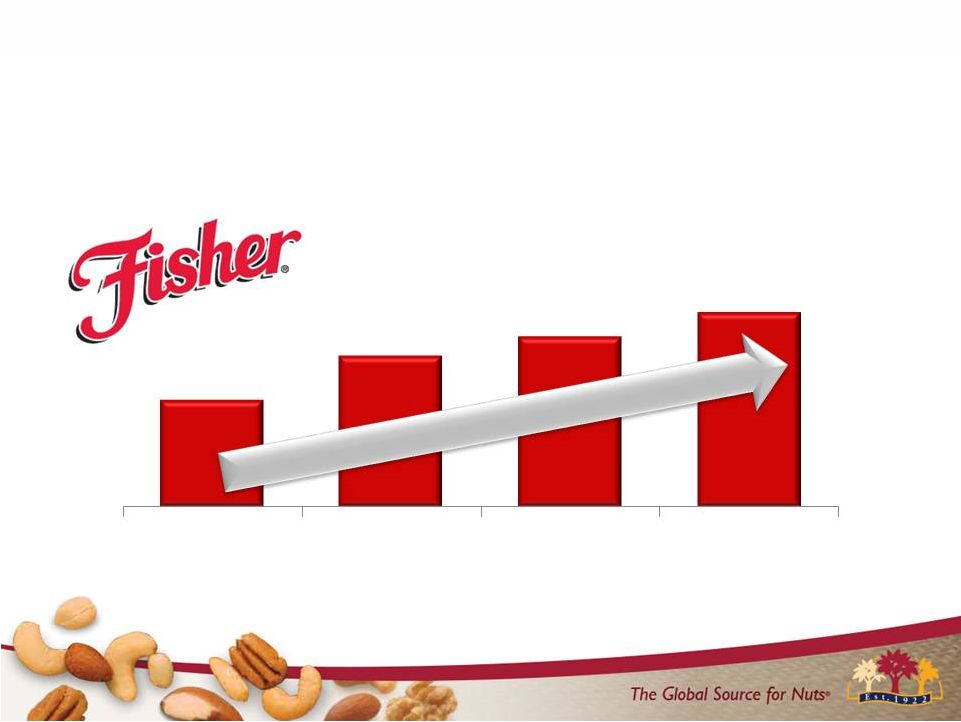
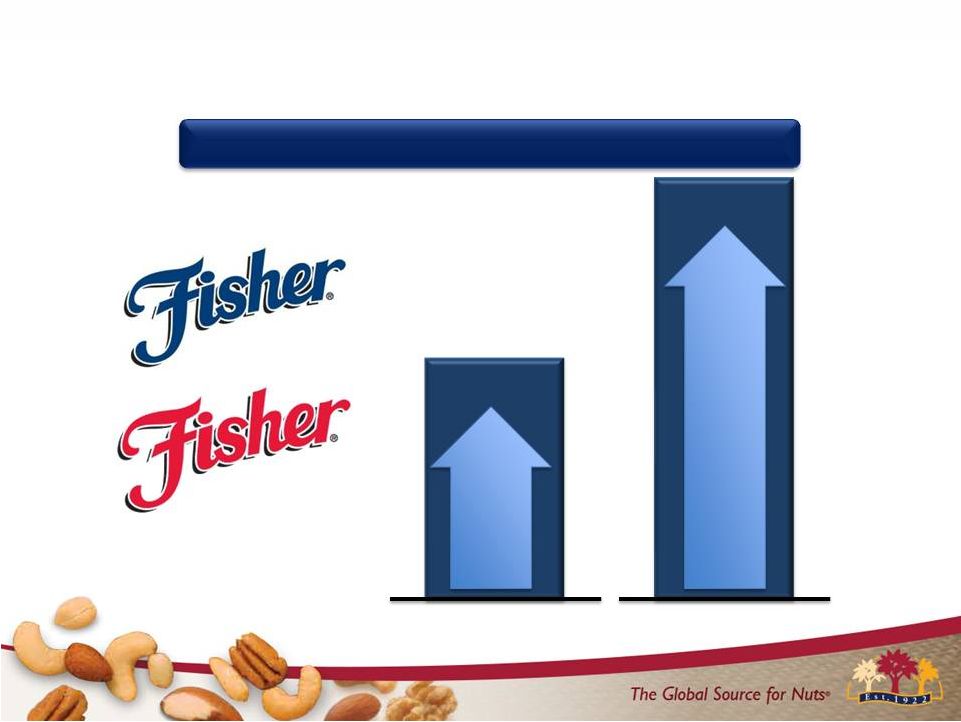 Fisher Snack & Recipe are Growing
Total Fisher Brand Growth FY15 vs. FY14
+8.0% +14.0% Recipe Nuts Snack Nuts LB SALES DOLLAR SALES 43 |
 Fisher Brand has Grown Dollar Share over
the last 3 Years
2.5 2.9 3.1 3.4 FY 2012 FY 2013 FY 2014 FY 2015 Fisher Brand Dollar Share Source: IRI: Total Nut Category – Multi Outlet Geography – Year Ending 6/28/15 44 |
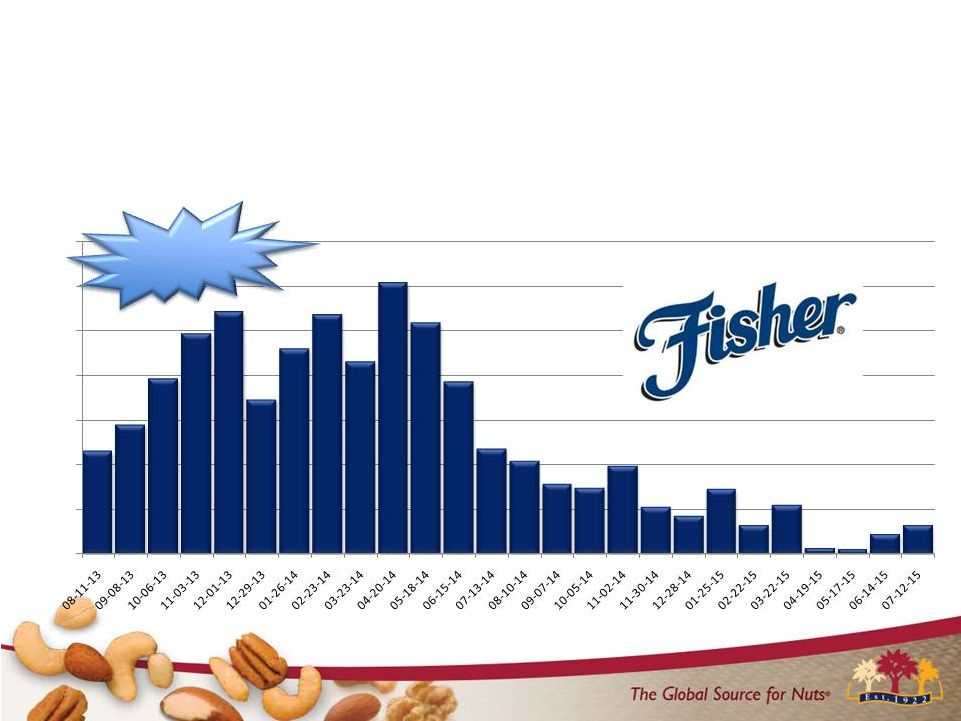 Strong and Sustained Growth on
Fisher Recipe Nuts
Recipe Nuts 44 Consecutive Quad wks of growth 0.0% 5.0% 10.0% 15.0% 20.0% 25.0% 30.0% 35.0% Fisher LB % Change vs. Last Year Source: IRI: Total Nut Category – Multi Outlet Geography – Quad Week Data Ending 7/12/15
45 |
 Differentiating Versus Competition with
“No Preservatives” Message
46 |
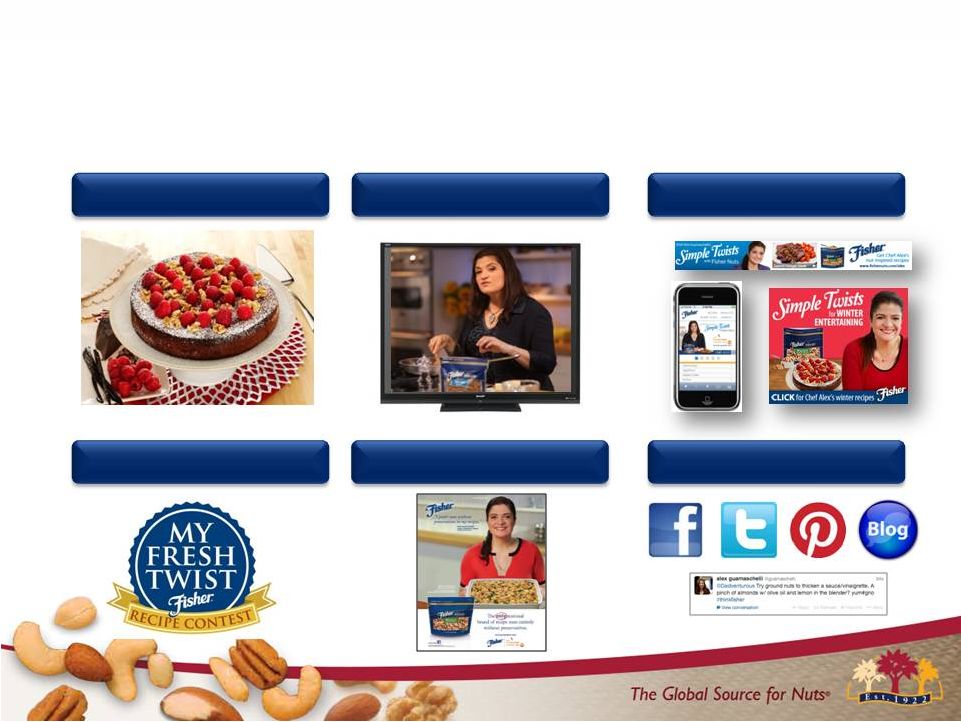 Recipes Food Network Vignettes Digital and Mobile Recipe Contest Food Network Magazine Social Media and PR Building Fisher Brand Equity with Food Network Sponsorship 47 |
 Expanding Social Media Presence with
“Fisher Fresh Thinkers”
48 |
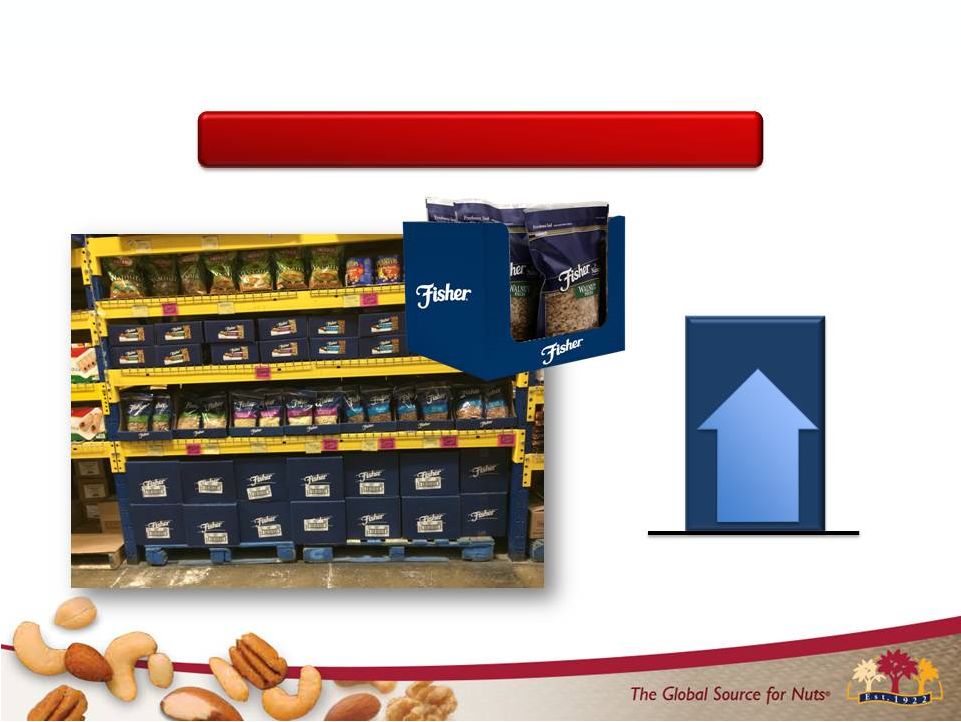
 Winning the year is about
Pounds-on-the-floor
Recipe Nuts Source: IRI: Ttl Recipe Nut Category – Multi Outlet Geography –Year Ending 6/28/15 *Note: ACV refers to “All Commodity Volume” as measured by IRI 49 27 37 41 41 FY 2012 FY 2013 FY 2014 FY 2015 Fisher % ACV Any Display |
 We Are Growing our Pound Share in High
Franchise Markets
Snack Nuts Source: IRI: Ttl Snack Nut Category – Fisher High Franchise Geography –Years Ending 6/28/15
2.2 3.1 3.5 4.0 FY 2012 FY 2013 FY 2014 FY 2015 Fisher Snack Nuts Pound Share (High Franchise Markets) 50 |
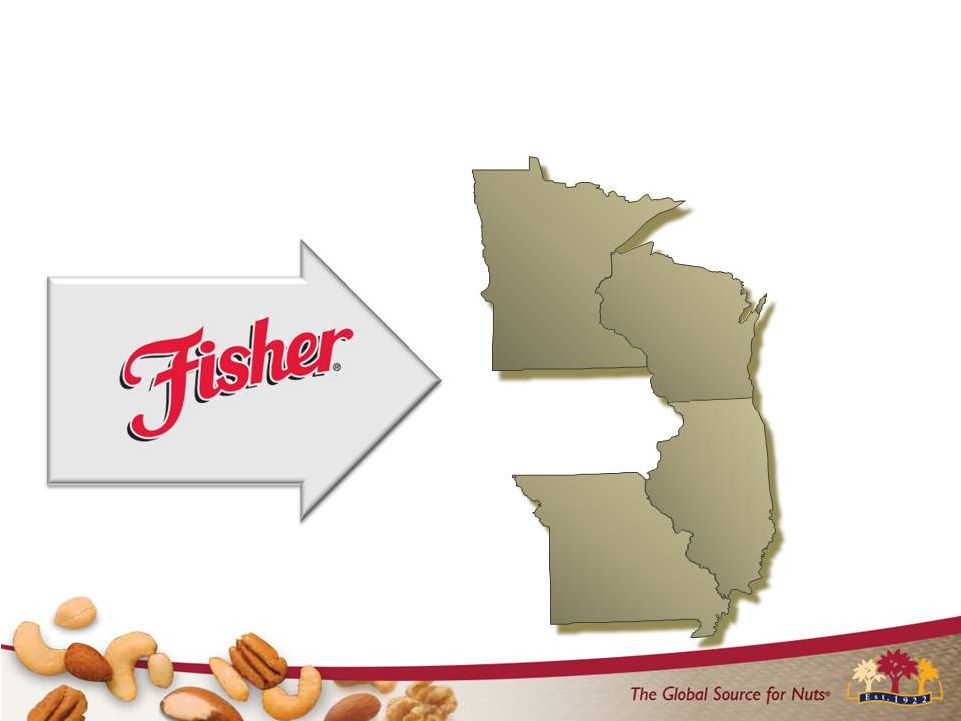 Our Fisher Snack Nut Strategy Focuses on
Midwest High Franchise Markets
51 Snack Nuts |
 Source: Blue Chip Worldwide SPARQ concept research, December
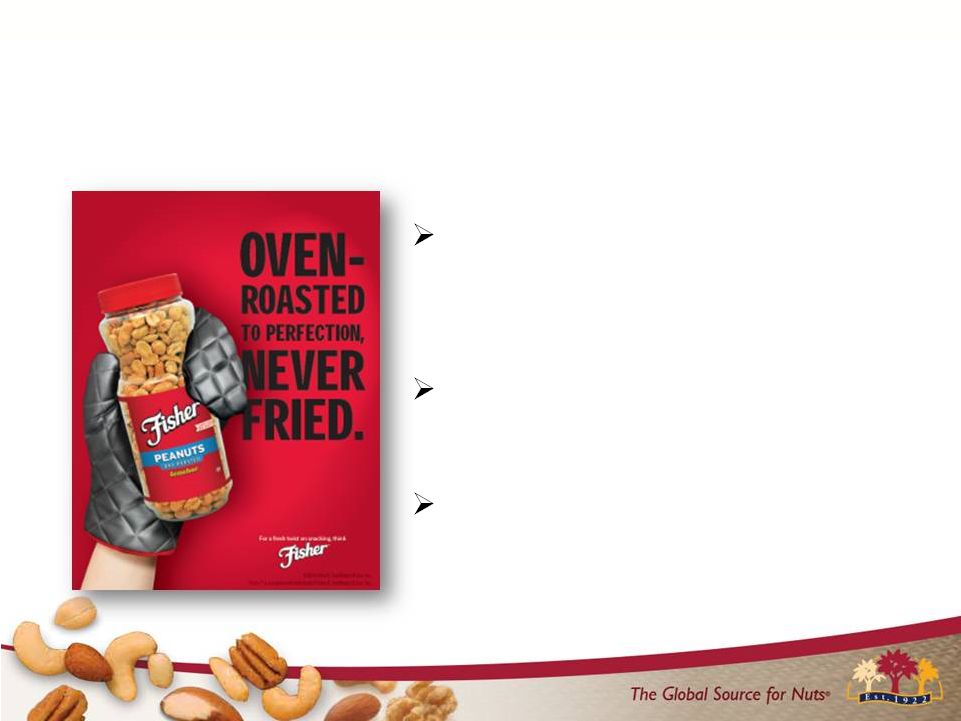
2013 Driving Results on our Core
Dry Roast Peanut Business
“Oven Roasted, Never Fried”
communication drives purchase
interest Elevates taste and healthy snack perceptions Supported through FSIs, In-Store and via Digital Channels 52 |
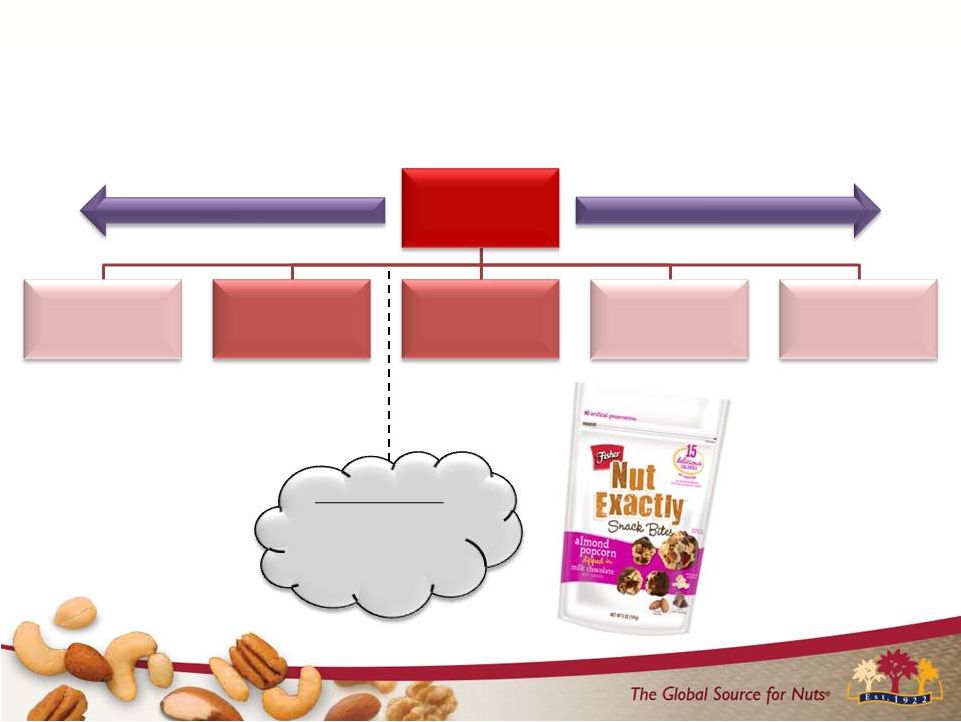 Brand Positioning on Nut Exactly is Creating
A Strong Consumer Following
Snacking Yogurt/Veggies Popcorn Nuts Chips Candy Bars New Segment: Lighter than nuts, more substantial than popcorn Indulgent Healthier 53 |
 Coupon incentive vehicle
Marketing Support is Designed to Build
Consumer Awareness and Drive Trial
PR Media Outreach Facebook Twitter Consumer receives sample via mail 54 |
 Retailers Like our New Snacking Concept Too
55 |
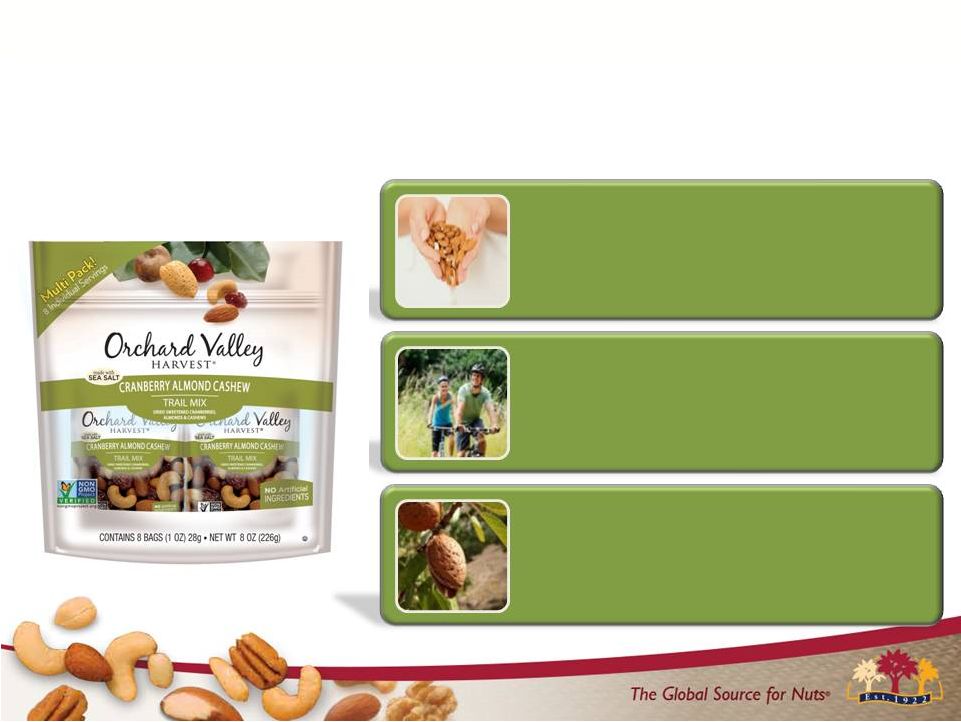 56 Our Orchard Valley Harvest Brand is On-Trend with Today’s Consumer Pure & Simple Goodness Supports a healthy lifestyle Close to the earth |
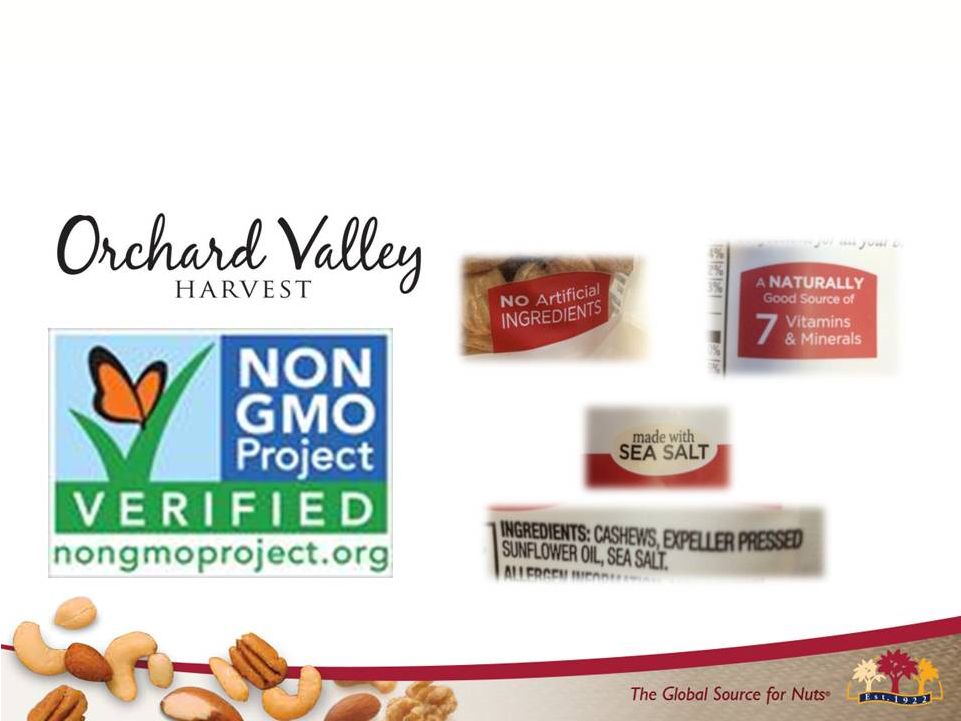 The Brand Consumers Trust for Pure &
Simple Goodness
57 |
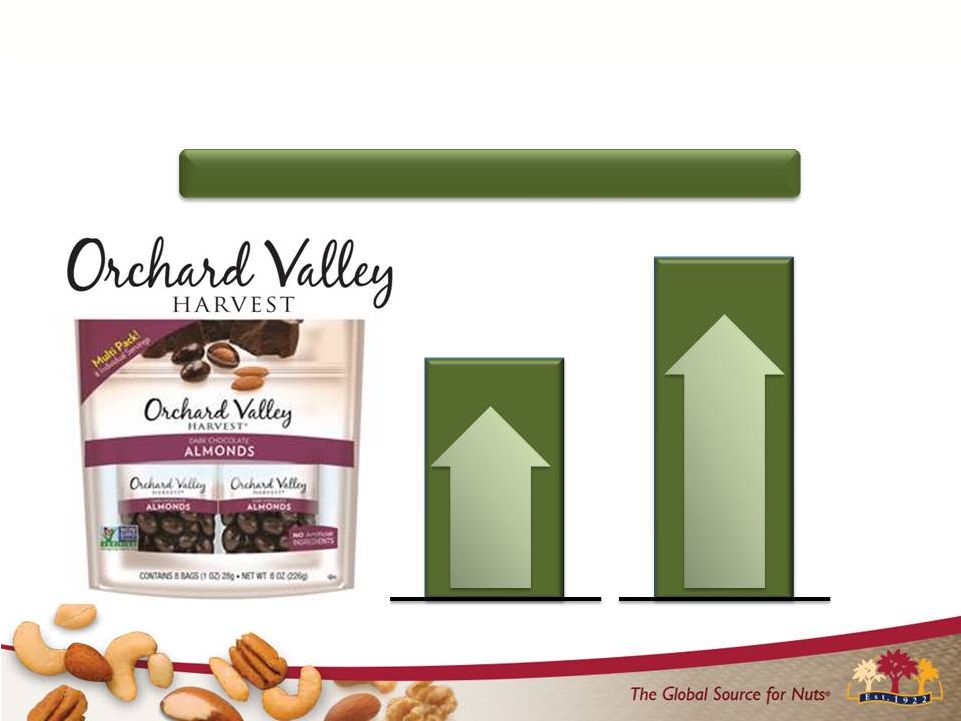 OVH is Catching on With Consumers
Orchard Valley Harvest Growth FY15 vs. FY14
+33% +48% LB SALES DOLLAR SALES 58 |
 Source: The Hartman Group : Eating Occasions, Compass 2012
The Hartman Group: Reimagining Health and
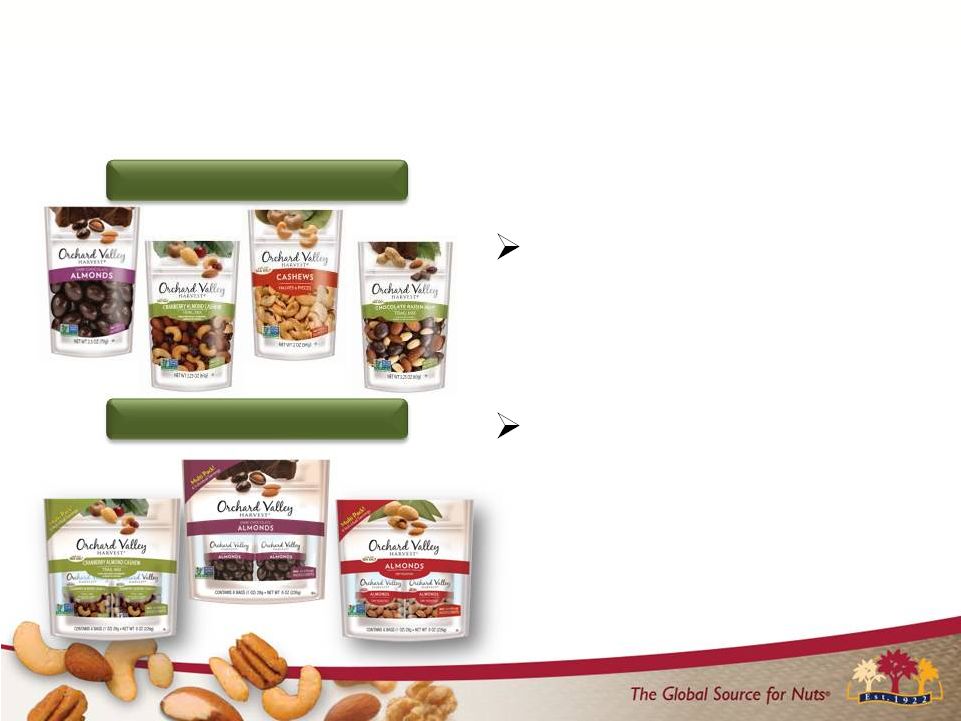
Wellness, 2013 Snacking accounts for
over 53% of all eating
occasions in the U.S.
38% of consumers snack
several times per day.
Grab ‘n Go Mini’s
Multi-Packs 59 We’re Tapping into Consumers’ Need For on-the-go Goodness |
 Bloggers Ibotta Website PR In-Store Merchandising New Packaging 60 Impactful Marketing Support |
 *Note: % ACV refers to % “All Commodity Volume” as measured by
IRI 61
And, We’re Gaining Retailer Support
12.7 13.6 18.6 32.3 FY2012 FY2013 FY2014 FY 2105 Orchard Valley Harvest % ACV Distribution* OVH % ACV Source: IRI: Ttl Produce Nut Category – Total US Food Geography–Year Ending 6/28/15 |
 THANK YOU |