Attached files
UNITED STATES
SECURITIES AND EXCHANGE COMMISSION
Washington, D.C. 20549
FORM 10-K
(Mark one)
x | ANNUAL REPORT PURSUANT TO SECTION 13 OR 15(d) OF THE SECURITIES AND EXCHANGE ACT OF 1934 |
For fiscal year ended May 31, 2015
OR
¨ | TRANSITION REPORT PURSUANT TO SECTION 13 OR 15(d) OF THE SECURITIES EXCHANGE ACT OF 1934 |
For the transition period from to
Commission File Number 1-36506
PERFORMANCE SPORTS GROUP LTD.
(Exact name of registrant as specified in its charter)
British Columbia, Canada | Not applicable. | |
(State or Other Jurisdiction of Incorporation or Organization) | (IRS Employer Identification No.) | |
100 Domain Drive Exeter, New Hampshire | 03883 | |
(Address of Principal Executive Offices) | (Zip Code) | |
Registrant’s Telephone Number, Including Area Code: (603) 610-5802
Securities registered pursuant to Section 12(b) of the Act:
Title of Each Class | Name of Each Exchange on which Registered | |||||
Common Shares, no par value | New York Stock Exchange | |||||
Securities registered pursuant to Section 12(g) of the Act: None
Indicate by check mark if the registrant is a well-known seasoned issuer, as defined in Rule 405 of the Securities Act. Yes þ No¨
Indicate by check mark if the registrant is not required to file reports pursuant to Section 13 or Section 15(d) of the Exchange Act. Yes ¨ No þ
Indicate by check mark whether the registrant (1) has filed all reports required to be filed by Section 13 or 15(d) of the Securities Exchange Act of 1934 during the preceding 12 months (or for such shorter period that the registrant was required to file such reports), and (2) has been subject to such filing requirements for the past 90 days. Yes þ No ¨
Indicate by check mark whether the registrant has submitted electronically and posted on its corporate Web site, if any, every Interactive Data File required to be submitted and posted pursuant to Rule 405 of Regulation S-T during the preceding 12 months (or for such shorter period that the registrant was required to submit and post such files). Yes þ No ¨
Indicate by check mark if disclosure of delinquent filers pursuant to Item 405 of Regulation S-K is not contained herein, and will not be contained, to the best of registrant’s knowledge, in definitive proxy or information statements incorporated by reference in Part III of this Form 10-K or any amendment to this Form 10-K. ¨
Indicate by check mark whether the registrant is a large accelerated filer, an accelerated filer, a non-accelerated filer, or a smaller reporting company. See the definitions of “large accelerated filer,” “accelerated filer” and “smaller reporting company” in Rule 12b-2 of the Exchange Act.
Large accelerated filer o | Accelerated filer o | Non-accelerated filer þ | Smaller reporting company o | ||||
Indicate by check mark whether the registrant is a shell company (as defined in Rule 12b-2 of the Exchange Act). Yes ¨ No þ
As of November 28, 2014, the last business day of the registrant's most recently completed second fiscal quarter, the aggregate market value of the voting stock held by non-affiliates of the registrant was $764.8 million, based on the closing sales price per share as reported by the New York Stock Exchange on such date.
As of the close of business on August 25, 2015, there were 45,552,180 shares of the registrant's Common Stock outstanding.
DOCUMENTS INCORPORATED BY REFERENCE
Portions of the definitive proxy statement relating to registrant’s 2015 annual and special meeting of shareholders (the “Proxy Statement”) are incorporated by reference in Part III hereof.
TABLE OF CONTENTS
Page | |||
PART I. | |||
Item 1. | Business | ||
Item 1A. | Risk Factors | ||
Item IB. | Unresolved Staff Comments | ||
Item 2. | Properties | ||
Item 3. | Legal Proceedings | ||
Item 4 | Mine Safety Disclosures | ||
PART II. | |||
Item 5. | Market for Registrant's Common Equity, Related Stockholder Matters and Issuer Purchase of Equity Securities | ||
Item 6. | Selected Financial Data | ||
Item 7. | Management's Discussion and Analysis of Financial Condition and Results of Operations | ||
Item 7A. | Quantitative and Qualitative Disclosures About Market Risk | ||
Item 8. | Financial Statements and Supplementary Data | ||
Item 9. | Changes in and Disagreements With Accountants on Accounting and Financial Disclosure | ||
Item 9A. | Controls and Procedures | ||
Item 9B. | Other Information | ||
PART III. | |||
Item 10. | Directors, Executive Officers and Corporate Governance | ||
Item 11. | Executive Compensation | ||
Item 12. | Security Ownership of Certain Beneficial Owners and Management and Related Stockholder Matters | ||
Item 13. | Certain Relationships and Related Transactions, and Director Independence | ||
Item 14. | Principal Accounting Fees and Services | ||
PART IV. | |||
Item 15. | Exhibits and Financial Statement Schedules | ||
SIGNATURES | |||
EXHIBIT INDEX | |||
3
NOTE REGARDING FORWARD-LOOKING STATEMENTS
Certain statements in this annual report on Form 10-K about our current and future plans, expectations and intentions, results, levels of activity, performance, goals or achievements or any other future events or developments constitute “forward-looking statements” under the Private Securities Litigation Reform Act of 1995 and within the meaning of applicable Canadian securities laws (collectively, “forward-looking statements”). Such statements often include words such as “may,” “will,” “would,” “should,” “could,” “expects,” “plans,” “intends,” “trends,” “indicates,” “anticipates,” “believes,” “estimates,” “predicts,” “likely,” or “potential” or the negative or other variations of these words or other comparable words or phrases.
Discussions containing forward-looking statements may be found, among other places, under “General Development of the Business,” “Industry Overview,” “Business of the Company,” “Risk Factors,” and “Management’s Discussion and Analysis of Financial Condition and Results of Operations.” Forward-looking statements are based on estimates and assumptions made by us in light of our experience and perception of historical trends, current conditions and expected future developments, as well as other factors that we believe are appropriate and reasonable under the circumstances, but there can be no assurance that such estimates and assumptions will prove to be correct. Certain assumptions with respect to the determination of acquisition accounting, valuation of derivatives, share-based payments, claim liabilities, employee future benefits, income taxes, the impairment of assets, and goodwill and intangibles are material factors made in preparing forward-looking information and management’s expectations.
Many factors could cause our actual results, level of activity, performance or achievements or future events or developments to differ materially from those expressed or implied by the forward-looking statements, including, without limitation, the following factors, which are discussed in greater detail in the “Risk Factors” section of this annual report on Form 10-K: inability to maintain and enhance brands, inability to introduce new and innovative products, intense competition in the sporting equipment and apparel industries, inability to own, enforce, defend and protect intellectual property rights worldwide, costs associated with potential lawsuits to enforce, defend or protect intellectual property rights, inability to protect our known brands and rights to use such brands, infringement of intellectual property rights of others, inability to translate booking orders into realized sales, including risks associated with changes in the mix or timing of orders placed by customers, seasonal fluctuations in our operating results and the trading price of our Common Shares, decrease in popularity of ice hockey, baseball and softball, roller hockey or lacrosse, reduced popularity of the National Hockey League, Major League Baseball or other professional or amateur leagues in sports in which our products are used, adverse publicity of athletes who use our products or the sports in which our products are used, inability to ensure third-party suppliers will meet quality and regulatory standards, reliance on third-party suppliers and manufacturers, disruption of distribution systems, loss of significant customers or suppliers, loss of key customers’ business due to customer consolidation, change in the sales mix towards larger customers, cost of raw materials, shipping costs and other cost pressures, risks associated with doing business abroad, inability to expand into international market segments, inability to accurately forecast demand for products, inventory shrinkage, excess inventory due to inaccurate demand forecasts, product liability, warranty and recall claims, inability to successfully design products that satisfy testing protocols and standards established by testing and athletic governing bodies, inability to successfully open and operate Own The Moment Hockey Experience retail stores, inability to successfully implement our strategic initiatives on anticipated timelines, including our profitability improvement initiative, risks associated with our third-party suppliers and manufacturers failing to manufacture products that comply with all applicable laws and regulations, inability to source merchandise profitably in the event new trade restrictions are imposed or existing trade restrictions become more burdensome, departure of senior executives or other key personnel with specialized market knowledge and technical skills, litigation, including certain class action lawsuits, employment or union-related disputes, disruption of information technology systems, including damages from computer viruses, unauthorized access, cyberattack and other security vulnerabilities, potential environmental liabilities, restrictive covenants in our credit facilities, increasing levels of indebtedness, inability to generate sufficient cash to fund operations or service the Company’s indebtedness failure to make, integrate, and maintain new acquisitions, inability to realize growth opportunities or cost synergies that are anticipated to result from new acquisitions such as Easton Baseball/Softball, undisclosed liabilities acquired pursuant to recent acquisitions, volatility in the market price for Common Shares, possibility that we will need additional capital in the future, incurrence of additional expenses as a result of the loss of our foreign private issuer status, assertion that the acquisition of the Bauer Hockey Business at the time of the Canadian IPO was an inversion transaction, our current intention not to pay cash dividends, dependence on the performance of subsidiaries given the our status as a holding company, potential inability of investors to enforce judgments against the Company and its directors, fluctuations in the value of certain foreign currencies, including the Canadian dollar, in relation to the U.S. dollar, and other world currencies, general adverse economic and market conditions, changes government regulations, including tax laws and unanticipated tax liabilities and natural disasters and geo-political events. These factors are not intended to represent a complete list of the factors that could affect us; however, these factors should be considered carefully.
The purpose of the forward-looking statements in this annual report on Form 10-K is to provide the reader with a description of management’s expectations regarding the Company’s financial performance and may not be appropriate for other purposes. Accordingly, readers should not place undue reliance on forward-looking statements made herein. Unless otherwise stated, the
4
forward-looking statements contained in this annual report on Form10-K are made as of the date of this annual report on 10-K, and we have no intention and undertake no obligation to update or revise any forward-looking statements, whether as a result of new information, future events or otherwise, except as required by law. The forward-looking statements contained in this annual report on Form 10-K are expressly qualified by this cautionary statement.
5
Part I
Unless otherwise noted or the context requires otherwise, “Performance Sports Group,” “PSG,” the “Company,” “we,” “us” and “our” refer to Performance Sports Group Ltd. and its direct and indirect subsidiary entities and predecessors. The Company’s fiscal year ends May 31st. Any reference to a fiscal year is to May 31 of the year then ended. All references to “$”, “US$”, “dollars” or “U.S. dollars” are to United States dollars and references to “Cdn$” and “Canadian dollars” are to Canadian dollars. Amounts are stated in U.S. dollars unless otherwise indicated.
Item 1. | BUSINESS |
Our Company
CORPORATE STRUCTURE
Incorporation and Office
The Company was incorporated under the British Columbia Business Corporations Act (“BCBCA”) on December 2, 2010, and its corporate name was changed shortly thereafter to Bauer Performance Sports Ltd. On June 17, 2014, the Company changed its corporate name from Bauer Performance Sports Ltd. to Performance Sports Group Ltd. The renaming of the Company was undertaken to better reflect the growth of the Company in connection with its strategic acquisitions and potential expansion into new high performance sports.
The Company’s registered office is located at 666 Burrard Street, Suite 1700, Vancouver, British Columbia, V6C 2X8. The Company’s headquarters and executive offices are currently located at 100 Domain Drive, Exeter, New Hampshire 03833, United States.
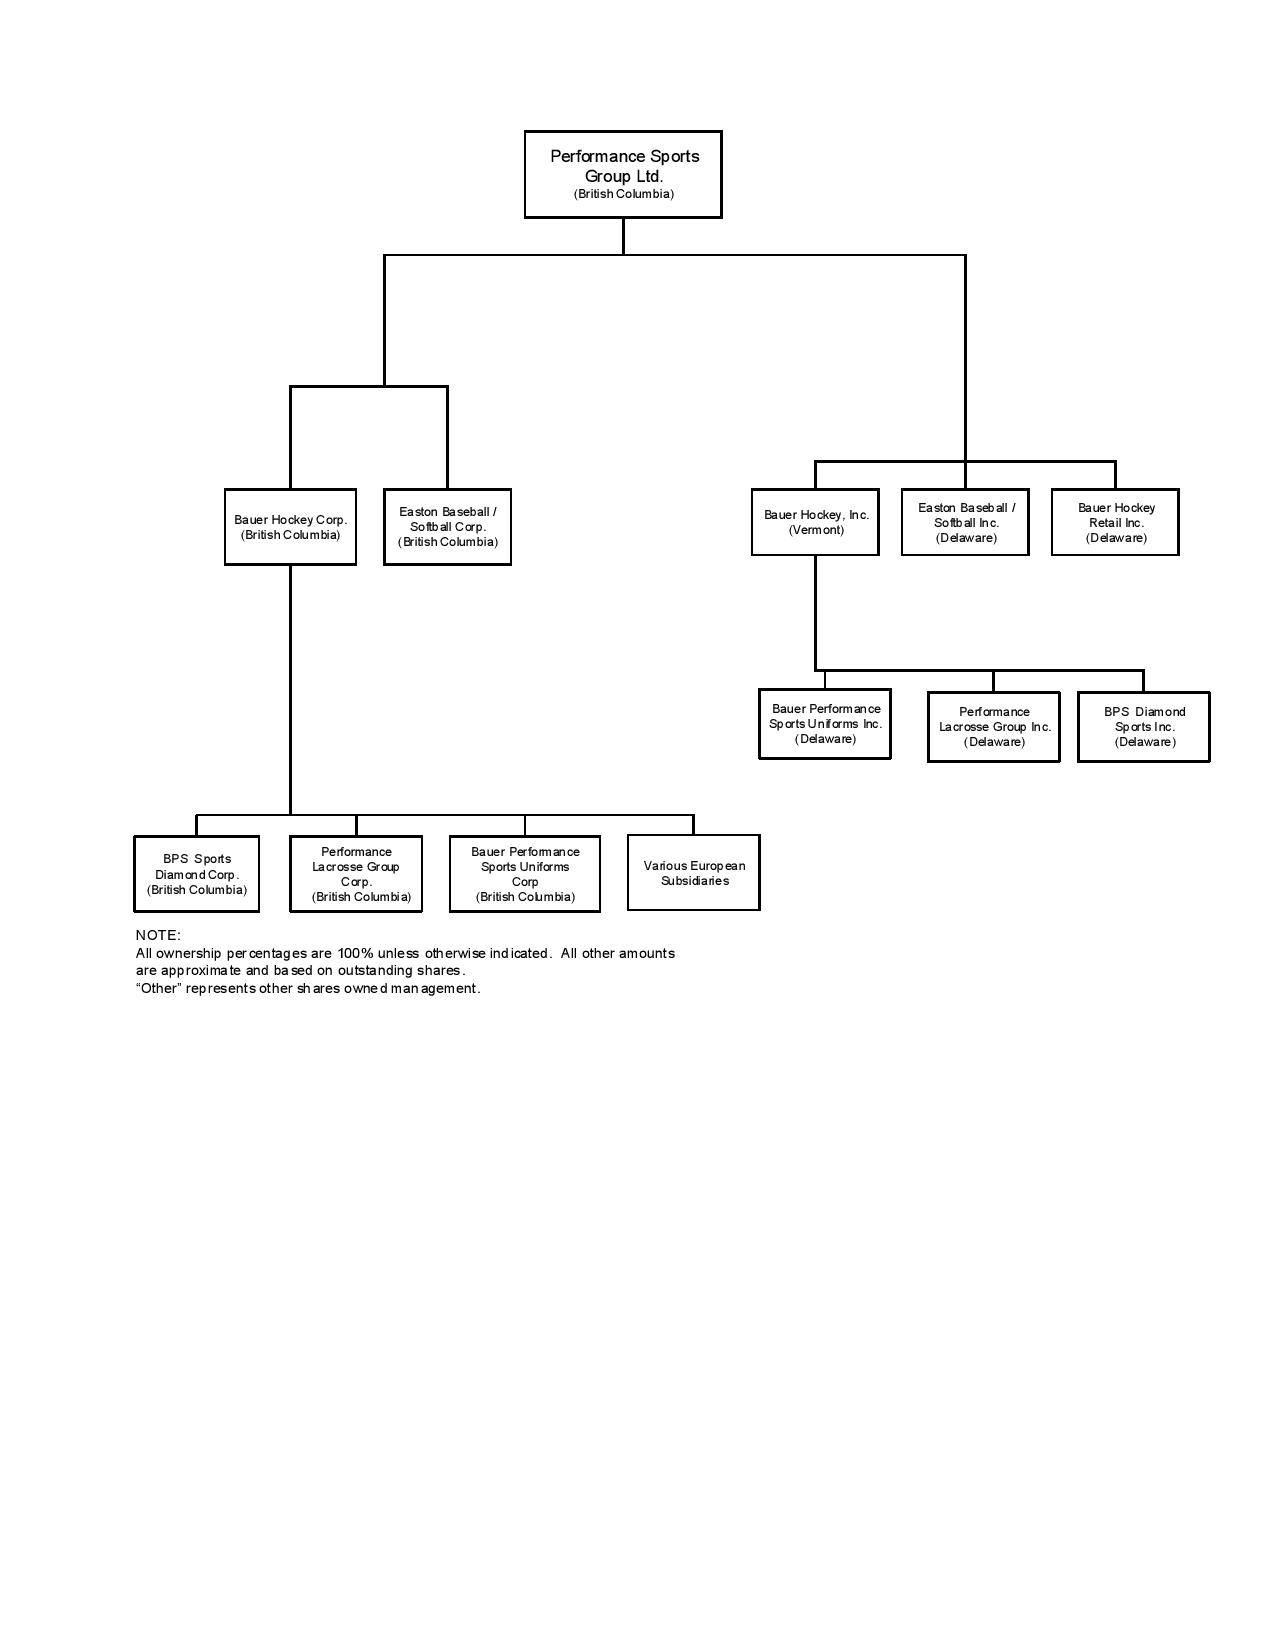
Intercorporate Relationships
The organization chart below describes the intercorporate relationships of our Company and our wholly owned material operating and certain other subsidiaries, together with the jurisdiction of incorporation or constitution of each such subsidiary.
6
7
GENERAL DEVELOPMENT OF THE BUSINESS
History
Headquartered in Exeter, New Hampshire, we are a leading designer, developer and manufacturer of high performance sports equipment and related apparel. Our mission is to elevate performance and protection for athletes at all levels through a combination of athlete insights and superior innovation.
As part of our growth strategy, we have acquired, integrated and significantly accelerated the growth of seven businesses since 2008, completing our most recent acquisition, Easton Baseball/Softball (as defined below), in April 2014. Highlights of our strategic acquisitions since 2012 are described below.
The Easton Baseball/Softball Acquisition
On April 15, 2014, we completed the acquisition of the Easton baseball and softball business and the assets formerly used in Easton-Bell Sports, Inc.’s lacrosse business (“Easton Baseball/Softball”) from Easton-Bell Sports, Inc., now named BRG Sports, Inc. (“BRG Sports”), for $330 million in cash, plus a net working capital adjustment of $21.7 million (the “Easton Baseball/Softball Acquisition”).
EASTON is one of the world’s leading and most iconic diamond sports (baseball and softball) brands with authentic brand equity accumulated over 40 years of designing and manufacturing high performance diamond sports products. Building upon its heritage in bats, EASTON has developed into one of the strongest and most innovative brands in baseball and softball, and holds the No. 1 position in diamond sports in North America with an approximate 27% market share and strong positions in multiple product categories. Easton Baseball/Softball has gained market share through innovative and higher-priced new product lines, an effective go-to-market strategy and significant brand investment.
We acquired Easton Baseball/Softball as part of an ongoing strategy to utilize our proven acquisition platform to expand our business into complementary categories and sports. The acquisition has greatly enhanced our brand portfolio, offers us another significant lever for growth, has added valuable intellectual property (including 130 patents and patents pending) and provides a significant counter-seasonal business to our existing revenue stream and working capital needs. Additionally, our R&D-focused platform allows for cross-pollination of technologies between EASTON and COMBAT, as well as our other sports, and provides the necessary infrastructure to grow the EASTON brand.
The acquisition has provided numerous financial benefits including being accretive to Adjusted EPS within the first year of ownership and generating significant cash flow to support our growth. The spring/summer season of baseball and softball is highly complementary to the fall/winter season of hockey, and our quarterly sources of revenue and profitability are more balanced throughout the year as a result. The more evenly distributed seasonality of the combined business provides more consistent working capital levels and allows us to improve our efficiency in our manufacturing, distribution and other efforts.
As a result of the Easton Baseball/Softball Acquisition, we acquired the EASTON and MAKO brands and trademarks and entered into an intellectual property agreement to license back the use of these trademarks to BRG Sports (and their permitted successors and assigns) for use in their hockey and cycling businesses on an exclusive, perpetual, royalty-free basis. Since our acquisition of Easton Baseball/Softball, BRG Sports sold the Easton Hockey business to private investment firm Chartwell Investments and its cycling business to Chris Tutton, the owner of Race Face Performance Products Inc.
The Company initially financed the Easton Baseball/Softball Acquisition, as well as refinanced certain existing indebtedness, with a $200 million secured asset-based revolving credit facility (the “ABL Facility”) and a $450 million secured term loan credit facility (the “New Term Loan Facility” and, together with the “New ABL Facility”, collectively, the “Credit Facilities”). On June 25, 2014, the Company completed an underwritten initial public offering on the New York Stock Exchange (“NYSE”) and a new issue of common shares of the Company (“Common Shares”) in Canada for net proceeds of approximately $119.5 million (the “U.S. IPO”), including the exercise in full of the over-allotment option. The Company used the net proceeds of the U.S. IPO to reduce leverage and repay approximately $119.5 million of the Company’s New Term Loan Facility.
The Combat Acquisition
On May 6, 2013, we completed the acquisition of substantially all of the assets of Combat Sports (“Combat Sports” and, such acquisition, the “Combat Acquisition”) for an aggregate purchase price of approximately Cdn$4 million in cash. The acquisition of Combat Sports was funded from cash on hand.
8
From 1998 through its acquisition by the Company, Combat Sports had been supplying composite and hybrid composite products for both its own COMBAT brand as well as for high-end brand name companies in the baseball and softball bat, hockey stick and lacrosse shaft markets. Since the acquisition, Combat Sports has focused solely upon the baseball and softball bat market, as well as related apparel. The business has developed a reputation for its premier and innovative composite technology, with the latest composite advancements in performance and durability serving players from the grassroots level to the elite professional levels. Combat Sports and several of its key employees have a long history of expertise in composite materials, including developing innovative products for NASA, the U.S. military and several leading manufacturers. By continuing to focus resources in the areas of Combat Sports’ success - baseball, softball and advanced composite technologies - we expect to further strengthen the COMBAT brand and grow our overall portfolio of high-performing products.
The Inaria Acquisition
On October 16, 2012, we completed the acquisition of Inaria International Inc. (“Inaria” and, such acquisition, the “Inaria Acquisition”). The Company entered into a purchase agreement with Inaria and its shareholders, pursuant to which we purchased substantially all of the assets of Inaria for an aggregate purchase price of approximately Cdn$7 million in cash. The Company used its former credit facility to fund the Inaria Acquisition.
Inaria, a Toronto-based company named after the Italian soccer phrase “in the area”, was founded in 1999 and began its business with a focus on soccer uniforms and products. INARIA has since become a growing brand in the team sports and active wear industry, providing a full-line of team apparel products, including pro-style jerseys, practice jerseys, socks, warm-up suits and training apparel for both youth sports programs and the most elite-level teams.
The company’s expertise in developing quality products with competitive pricing and rapid turnaround time quickly propelled INARIA into ice hockey and other sports. The Inaria Acquisition strengthened our position in team apparel, establishing Performance Sports Group as a reliable and competitive supplier in this growing segment of the market.
The Cascade Acquisition
On June 29, 2012, we completed the acquisition of Cascade Helmets Holdings, Inc. (“Cascade” and, such acquisition, the “Cascade Acquisition”). The Company entered into a purchase agreement with Cascade and its shareholders, pursuant to which we purchased all of the outstanding shares of Cascade for an aggregate purchase price of $64 million in cash subject to adjustment.
In order to fund the Cascade Acquisition, the Company (i) completed a public offering of 3,691,500 Common Shares at a price of Cdn$7.80 per share, including the exercise in full of the over-allotment option, for gross proceeds of approximately Cdn$28.7 million; (ii) completed a concurrent private placement of the equivalent of 642,000 Common Shares at the same price as those sold under the public offering, for gross and net proceeds of approximately Cdn$5.0 million; and (iii) entered into amendments to its former credit facilities.
The Cascade Acquisition significantly expanded our presence in the growing lacrosse market, through the addition of an industry-leading brand whose helmet and headgear products have been complementary to our existing offering of lacrosse equipment products under the MAVERIK brand.
INDUSTRY OVERVIEW
Sporting Goods Industries
We design, develop, manufacture and sell performance sports equipment and related apparel for ice hockey and roller hockey, baseball and softball, lacrosse and soccer.
We operate in the global sporting goods industry with a primary focus on North America and Europe. We believe this global industry is growing, including in the United States where, from 2009 to 2014, manufacturers’ wholesale sales of sporting goods increased from $48.3 billion in 2009 to $56.9 billion in 2014, representing a compound annual growth rate of 2.8%.
A Large and Growing Addressable Market
Within the sporting goods industry, we currently target an approximately $3.3 billion directly addressable market with attractive growth rates across multiple team sports, consisting of approximately $2 billion in equipment wholesale sales and approximately $1.2 billion in apparel wholesale sales. The growing size of team sports and the improving U.S. macroeconomic
9
outlook serve as a strong tailwind for our growth. The anticipated annual percentage growth in each of our sports categories is as follows:
Sport/Category | Anticipated Annual Percentage Growth of Industry | |
Hockey equipment (Global) | Low-Single-Digit to Mid-Single Digit | |
Hockey apparel (Global) | Mid-Single-Digit to High-Single-Digit | |
Baseball/Softball equipment (Global) | Low-Single-Digit | |
Baseball/Softball apparel (Global) | Low-Single-Digit | |
Lacrosse equipment (U.S., Canada) | Mid-Single-Digit to High-Single-Digit | |
Lacrosse apparel (U.S., Canada) | Mid-Single-Digit to High-Single-Digit | |
Soccer team apparel (U.S., Canada) | Low-Single-Digit to Mid-Single Digit | |
Source: Management estimates.
Our addressable market features attractive category fundamentals, including frequent replacement cycles and innovation-driven rising average selling prices.
Ice Hockey
Ice Hockey Participation Rates and Demographics
Ice hockey is a team sport played in over 80 countries by more than an estimated six million people. While ice hockey is played around the world, the largest and most significant markets for ice hockey are Canada, the United States and a number of European countries, including the Nordic countries (principally, Sweden and Finland), Central European countries (principally, the Czech Republic, Germany, Switzerland, Austria and Slovakia) and Eastern European countries (principally, Russia).
According to the International Ice Hockey Federation’s ("IIHF") 2014 survey of players, there are approximately 1.8 million registered players in the world, up from 1.6 million registered players in 2013, an increase of 12.5%. According to the IIHF, in the past five years, registered players have grown 20%, from 1.5 million players in 2010 to 1.8 million in 2014. In addition to registered players, management estimates another 4 million unregistered players globally, creating a total of approximately 6 million hockey players.
There are 533,172 registered players in the United States, according to USA Hockey’s 2014-15 Season Report, up from 519,417 in 2014, a 2.6% increase. In the past five years, registered players in the U.S. have increased 6.5% (500,579 in 2011 to 533,172 in 2015).
In Canada, there were 634,892 registered players in 2014, according to Hockey Canada’s 2014 Annual Report, representing a 1.6% increase from 625,152 players in 2013. In the past five years, registered players in Canada have increased 10.0% (577,077 in 2010 to 634,892 in 2014).
According to IIHF membership data, 63% of hockey players globally are under the age of 20. Due to this younger demographic, there is a need to purchase new equipment more frequently as these young participants grow.
Ice Hockey Equipment and Related Apparel Industry
Management estimates that the global ice hockey wholesale equipment market is approximately $670 million and the global ice hockey apparel market (including licensed apparel) is approximately $390 million.
The global ice hockey equipment and related apparel industry has significant barriers to entry and is stable in certain regions and growing in others, such as the United States and Eastern Europe. Russia had experienced significant growth prior to calendar 2015 but has entered a period of instability due to macroeconomic conditions in the region. Ice hockey equipment and related apparel sales are driven primarily by global ice hockey participation rates (registered and unregistered). Other drivers of equipment sales include demand creation efforts, the introduction of innovative products, a shorter product replacement cycle,
10
general macroeconomic conditions and the level of consumer discretionary spending. Skates and sticks are the largest contributors to equipment sales, accounting for an estimated 60% of industry sales in calendar 2014, according to management estimates.
Management estimates that 90% of the ice hockey equipment market is attributable to three major competitors: Bauer Hockey, Reebok International Ltd. (“Reebok”), a subsidiary of adidas AG, which owns both the REEBOK and CCM brands, and Easton Hockey (which is owned by private investment firm Chartwell Investments and utilizes the EASTON brand under a trademark license from the Company), each of whom offers consumers a full range of products (skates, sticks and full protective equipment). The remaining equipment market is highly fragmented among many smaller equipment manufacturers that offer specific products, catering to niche segments within the broader market.
The following table shows our estimated ranking of the three major competitors referenced above, in total and by major product category:
Company | Total Market | Skates | Sticks | Helmets | Protective | Goalie | ||||||
BAUER | #1 | #1 | #1 | #1 | #1 | #2 | ||||||
REEBOK/CCM | #2 | #2 | #2 | #2 | #2 | #1 | ||||||
EASTON | #3 | #3 | #3 | #3 | #3 | n/a | ||||||
Licensed apparel is included in the ice hockey-related apparel market and represents approximately one-third of the market. The related apparel market is more fragmented than the equipment market and includes a variety of larger and smaller participants. We expect consolidation in this market to occur in the coming years, in a manner similar to what has occurred in the ice hockey equipment industry.
Roller Hockey
Roller Hockey Participation Rates and Demographics
Roller hockey is a team sport played principally in the United States, particularly in warmer regions such as California. According to a 2015 Sports and Fitness Industry Association (“SFIA”) report, total U.S. participation in roller hockey was approximately 1.8 million in 2014, up 33.3% over 1.3 million players in 2013. In the past five years, roller hockey has grown 26.3%, from 1.4 million participants in 2010 to 1.8 million in 2014.
Roller Hockey Equipment and Related Apparel Industry
The roller hockey equipment and related apparel industry shares similar characteristics to the ice hockey equipment and related apparel industry given the similarity of the sports. Management estimates that the wholesale roller hockey equipment market generated approximately $20 million in sales in calendar 2014. Through our Company’s MISSION and BAUER brands, we hold the No. 1 and No. 2 market share positions in the roller hockey equipment market, respectively, and have a substantial lead over our primary competitors, including Reebok, Tour and a few competitors in niche categories, such as wheels and accessories.
Street Hockey
Street Hockey Participation Rates and Demographics
Street hockey is a team sport played throughout the world, primarily in the largest ice hockey markets. According to management estimates and industry sources, there are approximately 93,000 registered players in Canada, approximately 48,000 registered players in the United States, and approximately 50,000 registered players in the rest of the world. Youth players represent approximately 50% of the registered participants. Management believes that registered participation represents only a small portion of the overall consumer base for street hockey products and that unregistered participants far exceed registered participants in number.
Street Hockey Equipment Industry
The street hockey equipment industry shares similar characteristics to the ice hockey equipment and related apparel industry given the similarity of the sports. Management estimates that the wholesale street hockey equipment market generated
11
approximately $25 million in sales in calendar 2014. The Company entered the street hockey market with a full line of street hockey equipment and accessories in April 2015 under the BAUER brand.
Baseball and Softball
Baseball and Softball Participation Rates and Demographics
Baseball and softball are team sports played principally in the United States, Japan, certain other Asian countries (such as South Korea), and Latin America. Global baseball/softball participation is estimated to be approximately 65 million, according to the World Baseball Softball Confederation. Baseball remains one of the most popular team sports by participation in the United States, second only to basketball, according to SFIA.
According to SFIA, total baseball and softball (fast pitch and slow pitch) participation in the U.S was 22.7 million in 2014, equal to the overall participation rate in 2013. In the past five years, overall participation in baseball and softball has decreased by a total of 9.9%, from 25.2 million participants in 2010 to 22.7 million in 2014.
While participation for baseball and softball in the United States has remained flat or decreased, the market continues to grow as innovation, particularly in bats, has driven rising prices.
Baseball and Softball Equipment and Related Apparel Industry
Management estimates that, in calendar 2014, the global baseball and softball wholesale equipment market was approximately $1.2 billion, while the global baseball and softball wholesale apparel market (excluding footwear) was estimated to be approximately $560 million. North America provides the largest portion of the global wholesale market, with an estimated $700 million equipment market and a $430 million apparel market (not including footwear).
With approximately 65 million participants globally, we believe the enthusiast base in these sports will experience continued growth, driven by the increasing popularity of travel ball, club baseball and softball, and more frequent play.
The baseball and softball equipment market is fragmented and is currently led by five major brands: our EASTON brand, MIZUNO, Jarden-owned RAWLINGS, and Amer Sports-owned WILSON and LOUISVILLE SLUGGER. Similar to Easton Baseball/Softball, our major competitors offer a full line of baseball and softball products and varying degrees of related apparel. In total, we compete with over a dozen brands in the baseball and softball equipment market, including, in addition to those above, Amer Sports-owned DEMARINI, MARUCCI, Jarden-owned MIKEN and WORTH, NOKONA, ZETT and SSK. In addition, NIKE and UNDER ARMOUR also are competitive brands in specific categories such as batting gloves.
The following table shows our estimated ranking in North America of the five major brands referenced above, in total and by major product category:
Company | Total Market | Bats | Batting Helmets | Catcher Protective | Equipment Bags | Batting Gloves | Apparel w/o Uniform | Accessories | Ball Gloves | |||||||||
EASTON | #1 | #1 | #1 | #2 | #1 | #3 | #4 | #3 | #6 | |||||||||
WILSON/ DEMARINI | #2 | #2 | n/a | #6 | #5 | n/a | #7 | n/a | #2 | |||||||||
RAWLINGS/ WORTH | #3 | #3 | #2 | #3 | #6 | #6 | #2 | #5 | #1 | |||||||||
MIZUNO | #4 | n/a | #4 | #4 | n/a | #5 | #5 | n/a | #3 | |||||||||
LOUISVILLE SLUGGER | #5 | #4 | n/a | n/a | #4 | n/a | n/a | n/a | #4 | |||||||||
Lacrosse
Lacrosse Participation Rates and Demographics
Lacrosse is a team sport played principally in the United States and Canada. Management estimates that the total global participation is approximately 900,000. According to U.S. Lacrosse, there were 772,772 registered players in the United States in
12
2014, up 3.5% from 2013 (746,859). In the past five years, registered players in the U.S. grew 23.7%, from 624,593 players in 2010 to 772,772 in 2014. In Canada, we estimate that there are approximately 100,000 participants.
The drivers of this growth included: (i) the establishment and popularity of the National Lacrosse League and Major League Lacrosse, (ii) the rapid expansion of high school and youth programs, (iii) emerging growth outside of key lacrosse markets in the Mid-Atlantic and Northeastern United States, (iv) enhanced funding and popularity of the National Collegiate Athletic Association (the “NCAA”) lacrosse programs, and (v) increased visibility of the sport in media and advertising.
Approximately 93% of lacrosse participants in the United States are under the age of 20, with 55% of participants in the youth (15 and under) category and 38% of participants in the high school category. Similar to ice hockey, the high representation of youth in the sport provides the industry with a more frequent product replacement cycle, as these young players outgrow their equipment.
Lacrosse Equipment and Related Apparel Industry
Management estimates that, in calendar 2014, the global lacrosse equipment market was approximately $120 million, with the United States accounting for approximately $110 million while the Canadian market was estimated to be approximately $10 million in size. Management estimates that the wholesale market for lacrosse apparel (including team) is approximately $40 million in size.
Management estimates that the lacrosse market will continue to grow in the range of mid-single digits to high-single digits for the next several years. The lacrosse equipment market is made up of four primary equipment categories: sticks (shafts and heads), gloves, helmets and protective equipment. Sticks currently make up the largest segment of the lacrosse equipment market, representing approximately 35% of calendar 2014 industry-wide United States sales. Helmets currently make up approximately 20% of calendar 2014 industry-wide United States sales.
The North American lacrosse equipment and related apparel market is a high growth, emerging sports equipment market underpinned by strong growth in participation rates. The lacrosse equipment market is currently led by six major brands: New Balance-owned WARRIOR and BRINE, our MAVERIK and CASCADE brands, STX, and Jarden-owned DEBEER (women’s only). The Company’s three major competitors all offer full lines of lacrosse equipment products, while Cascade’s product offering is primarily focused on helmets.
The following table shows our estimated ranking in North America of our four major competitor brands, in total sales:
WARRIOR / | MAVERIK / | STX | DEBEER LACROSSE | ||||
BRINE | CASCADE | ||||||
Market Position | #1 | #2 | #3 | #4 | |||
Team Apparel Industry
Team apparel and uniforms make up a large and growing market characterized by high fragmentation and competition, which provides significant competitive advantages to companies that can offer a one-stop shopping experience for high-quality products and a unified look (equipment and apparel) under authentic brands.
Management estimates that the overall non-footwear apparel market (including team, performance and lifestyle) in the sports markets we address is approximately $1.2 billion in size (Hockey - $390 million, Baseball/Softball - $560 million, Lacrosse - $40 million, Soccer - $300 million (team uniforms in Canada and the United States)).
BUSINESS OF THE COMPANY
Our Company
Headquartered in Exeter, New Hampshire, we are a leading designer, developer and manufacturer of high performance sports equipment and related apparel. Our mission is to elevate performance and protection for athletes at all levels through a combination of athlete insights and superior innovation. Our model is simple. We combine authentic brands and sport-specific employee expertise with our platform strengths, particularly our high performing R&D and game changing product creation processes, to annually grow our overall revenue, market share and profitability. On a constant currency basis, we strive to grow our revenues each year faster than the total market for each of our sports and to grow our profitability faster than revenues, both
13
as measured excluding the year-over-year impact of foreign exchange.
Our products are marketed under the BAUER (ice and roller hockey), MISSION (roller hockey), MAVERIK (lacrosse), CASCADE (lacrosse), INARIA (soccer apparel), EASTON (baseball and softball) and COMBAT (baseball and softball) brand names and are sold by sales representatives and independent distributors throughout the world. Our brands have a rich history of innovation, authenticity and market leadership, with the BAUER and EASTON brands dating back to 1927 and 1922, respectively.
In recent years, we have experienced strong revenue and profit growth through innovation, product development, marketing and acquisitions that have driven market share gains in all of our sports. Our scale, strong distribution and manufacturing relationships, disciplined cost management and sourcing strategies have enabled us to maintain consistent and attractive Adjusted EBITDA margins and to compete successfully. Our annual revenues have grown from $219.5 million in Fiscal 2008 to $654.7 million in Fiscal 2015, representing a compound annual growth rate of 16.9%; Adjusted EBITDA has grown from $22.9 million in Fiscal 2008 to $98.3 million in Fiscal 2015, representing a compound annual growth rate of 23.1%; and Adjusted EPS has grown from $0.15 in Fiscal 2010 to $1.02 in Fiscal 2015, representing a compound annual growth rate of 45.5% (we did not report Adjusted EPS prior to Fiscal 2010). Our Adjusted EBITDA, together with our relatively low level of capital expenditures and certain tax attributes, allow us to generate predictable and significant cash flows to invest in R&D, pursue acquisitions and other growth initiatives, and reduce our indebtedness.
As part of our growth strategy, we have acquired, integrated and significantly accelerated the growth of seven businesses since 2008, completing our most recent acquisition, Easton Baseball/Softball, in April 2014.
Our Core Businesses
We have the most recognized and strongest brands in ice hockey, roller hockey, baseball and softball, and hold top market share positions in these sports, with an expanding presence in the fast-growing lacrosse market. Our mission is to elevate player performance and protection at all levels through a combination of athlete insights and superior innovation.
Hockey and Related Apparel
We offer a complete line of head-to-toe performance-driven equipment under the BAUER and MISSION brands for players in every major ice and roller hockey market in the world. Our equipment offerings include skates, sticks, protective equipment, helmets and goalie equipment for ice hockey, roller hockey and street hockey.
We drive market share growth by introducing new products with performance improvements each year in most of our equipment categories, alternating three sub-brands of products for ice hockey, the VAPOR, SUPREME and NEXUS lines. Through this strategy, we have grown sales by creating excitement and dialogue at the retail level with retailers and consumers and maintaining a significant advantage over competitors who introduce new products less frequently.
In addition to equipment, we offer a full assortment of hockey apparel, including team apparel and uniforms, performance apparel and lifestyle apparel. While the hockey apparel industry is highly fragmented with several niche brands, our ability to offer a reliable and competitive apparel experience combined with access to our leading equipment creates a unique opportunity for team business.
BAUER holds the No. 1 market share position in ice hockey equipment with approximately 56% overall market share. MISSION and BAUER combined have the No. 1 market share position in roller hockey equipment at approximately 70%.
Baseball/Softball and Related Apparel
With the EASTON and COMBAT brands, we offer a broad line of baseball and softball equipment for all ages and levels of play. Our equipment and accessories (bats, gloves, protective equipment and apparel) for athletes and enthusiasts serve the professional, inter-scholastic, and recreational levels of the diamond sports market across a variety of price points.
EASTON is one of the world’s leading and most iconic diamond sports brands with authentic brand equity accumulated over 40 years of designing and manufacturing high performance diamond sports products. Building upon its heritage in bats, EASTON has developed into one of the strongest and most innovative brands in baseball and softball, and holds the No. 1 position in diamond sports in North America, with an approximately 27% market share and strong positions in multiple product categories.
As we have done with prior acquisitions, we have utilized our platform to accelerate Easton Baseball/Softball’s growth and look to increase market share in every category of baseball and softball equipment both domestically and internationally, and
14
to expand EASTON’s presence in apparel.
COMBAT’s proprietary bat manufacturing process has created a unique bat technology that has a loyal following. COMBAT’s patented technology, combined with its unique connection to the sport and its emphasis on grassroots marketing has elevated the COMBAT brand at all levels.
Both EASTON and COMBAT offer a wide variety of baseball/softball specific apparel and we expect to expand both brands’ apparel offering to include uniforms.
Lacrosse and Related Apparel
With our MAVERIK and CASCADE brands, we offer a comprehensive line of lacrosse equipment for all skill levels and hold approximately a 28% market share.
Through the MAVERIK brand, we offer a full line of gloves, heads, shafts and protective equipment, as well as a women’s specific line of product, for players of all ages. MAVERIK, founded in 2005 and acquired by the Company in 2010, continues to expand its brand presence, with five MAVERIK teams participating in the 16-team 2015 NCAA Division I tournament, including No. 1 overall seed Notre Dame.
CASCADE has been a pioneer in head protection since 1986 and is the No. 1 brand in lacrosse head protection with 90% market share. Since 1995, 16 NCAA champions have worn CASCADE helmets. CASCADE provides a wide variety of helmets for all ages, as well as several options for eye protection for the female player. In addition, CASCADE offers a 48-hour turnaround time for customer helmets.
In addition to equipment, CASCADE and MAVERIK design and manufacture accessories and related apparel, including performance apparel and lifestyle apparel.
Soccer Apparel
INARIA designs and manufactures a full-line of soccer apparel, including pro-style jerseys, practice jerseys, socks, warm-up suits and training apparel. The company offers full finishing, embellishment and unique customization services at its Canadian headquarters.
INARIA has recently elevated its brand at the youth, college and professional soccer levels through a variety of sponsorships and partnerships. INARIA is a sponsor of Schwan’s USA Cup, one of the world’s largest youth soccer tournaments, and recently signed professional team Minnesota United FC as the team’s official uniform provider. In addition, INARIA has also signed several NCAA Division I programs, including Cornell University and Colgate University.
Our Core Strengths
We believe the following strengths are integral to enhancing our leadership position and market share in all product categories in all our sports:
Strong and Authentic Brands in Attractive Markets
We have the No. 1 brands in the ice hockey, roller hockey and North American diamond sports (baseball and softball) equipment industries through the BAUER, MISSION and EASTON brands, respectively. BAUER is the most recognized and strongest brand in ice hockey with an estimated 56% overall worldwide market share. MISSION and BAUER combined are the leading brands in roller hockey with an estimated 70% market share. EASTON is one of the most iconic diamond sports brand with the No. 1 market share in North America, estimated at 27%. Easton Baseball/Softball has an opportunity to meaningfully increase its market share by growing its core bats category and expanding its position in several other large and profitable diamond sports categories where it is underpenetrated today. In the lacrosse category, our MAVERIK and CASCADE brands combined have an estimated 28% market share, with our CASCADE brand continuing to be the leading helmet provider with an estimated 90% market share. Through continued rapid growth of our CASCADE and MAVERIK brands, we aim to become the market leader in the lacrosse market by 2016. Our market leadership within each sport extends across multiple product categories through a full product suite that addresses our consumers’ needs for high performance equipment and apparel for players of all ages.
We believe the strong brand recognition and consumer loyalty for our brands is the result of regularly bringing to market innovative, top quality equipment with superior performance, our “true to the game” authenticity, and consistent and effective
15
brand communication. Our brand recognition in every sport creates significant barriers to entry in our markets, as many consumers believe that brands with heritage and authenticity will provide the best products to improve their game. This belief is reinforced by the numerous professional and elite-level athletes who utilize our products and who thereby create a halo effect that influences our broader group of consumers. These elite athletes include the 75% of National Hockey League (“NHL”) players who wore BAUER skates last season, 40 of the last 48 NCAA Division I lacrosse national championship finalist teams who wore CASCADE helmets, and 17 EASTON teams competing in the 2015 College World Series.
Our brands and their broad product offerings address an attractive, highly popular team sports market that is estimated at approximately $3.3 billion. Despite modest participation growth in these sports, these markets exhibit strong dollar value growth due to positive underlying fundamentals. There are attractive purchasing patterns in the markets we service. A short replacement cycle is driven by our core youth consumers regularly outgrowing their equipment and parents wanting to provide their children with the highest performing products. Additionally, we deliver products to market using short innovation-led product cycles that ensure a relentless flow of the latest technologies are available for consumers. Consistent innovation that improves the quality and performance of our products also allows us to raise average selling prices, further underpinning growth in the size of our markets.
Integrated Performance Sports Platform
We have achieved our leadership position and growth by leveraging our world-class performance sports products platform. Customer-facing, consumer-facing and product development functions are managed individually by sport and by category within each sport. Back-end functions and certain R&D activities are shared across sports to drive operational synergies and efficiency. This integrated platform is supported by authentic brands, deep consumer insights, significant R&D investments, and strong intellectual property. We originally developed this organizational structure to promote and support the rapid growth of our ice hockey equipment business but have also used it to successfully integrate and significantly grow the new performance equipment and apparel categories and sports markets we have entered through our recent acquisitions.
Each of our businesses maintains dedicated management, sales, marketing, product development and R&D teams, while leveraging highly scalable and shared resources such as sourcing & manufacturing, distribution & logistics, advanced R&D, information technology, human resources, finance and legal. These distinct units within each business often collaborate with their counterparts across the Company. This approach ensures we benefit from our scale and capitalize on opportunities to apply key advances across our platform without compromising the functions that support our strong consumer connections, “true to the game” authenticity, high performance products and well-established retailer relationships.
Our category management structure allows us to drive growth opportunities in every sport by deploying a multi-disciplinary approach to product development. We have a strong product development process that allows us to share best practices and innovation across the Company. These resources are both scalable and shareable across sports and categories. We believe this collaborative approach to product development yields superior results and products.
Industry-Leading R&D and Innovation
We believe our development capabilities and intellectual property portfolio provide us with a strategic competitive advantage by allowing us to create advanced products, drive new purchases and create barriers to entry. Our intellectual property portfolio includes 638 patents (including design patents and patents pending).
Our mission is to elevate player performance and protection at all levels by combining athlete insights with superior innovation. To achieve this we have consistently invested in R&D, spending on average, from Fiscal 2009 to Fiscal 2015, approximately 4.0% of our annual revenues on R&D ($24.2 million in Fiscal 2015, $18.5 million in Fiscal 2014 and $16.1 million in Fiscal 2013). Few of our competitors can match this level of investment due to their lack of scale or their concentration on a single sport. We employ a passionate and committed team of more than 75 designers, developers, engineers and technicians, who work closely with our scientific and research partners, including McGill University, the University of Pittsburgh Medical Center, the Composites Innovation Center and the University of Bath. This team has a world-class reputation and leads the sporting goods industry by continuously bringing to market innovative, often revolutionary, top-quality equipment with superior performance that is trusted by players of all skill levels.
We have a disciplined, rolling, multi-year product development program through which we bring hundreds of new products to market across all of our sports in an organized and efficient manner every year. We introduce new products on a regular basis, with the timing of new product launches typically driven by one- to five-year product life cycles, depending on the sport and the product category.
16
Diversified and Balanced Business Model
We have built a balanced business model that provides a consistent flow of revenue across several product categories, sports seasons, and geographies. Hockey represents approximately 60% of our sales, with baseball and softball accounting for approximately 30% of sales and other sports contributing the remainder. Within each sport, we maintain a broad product offering across all major equipment categories, with an increasing team and related-apparel offering.
As illustrated below, the majority of sales for the spring/summer season of baseball and softball are shipped December through March, a perfect complement to ice hockey, where the majority of sales are shipped May through October. We believe this diversified model generates more consistent cash flow to allow us to invest in other growth opportunities and/or pay down our debt more evenly each year. The complementary seasonality of ice hockey and diamond sports offers us incremental benefits in physical distribution, raw material purchasing and internal manufacturing, and allows for the most efficient utilization of our third-party manufacturing partners’ annual production capacity.
Fiscal 2015 Revenue by Quarter
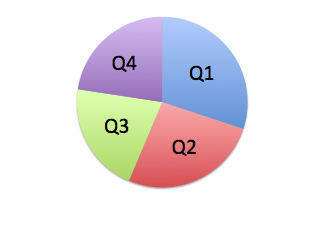
Source: Management estimates.
The Company has a global sales and distribution network in over 60 countries to service a broad and diverse customer base. We sell to more than 5,000 retailers in Canada, the United States, Scandinavia and Finland, and more than 60 distributors in other international markets. The majority of our sales are to independent or specialty retailers, such as Pure Hockey, Monkey Sports, Pro Hockey Life, Total Hockey, and Lacrosse Unlimited. As a result we have relatively low customer concentration, as evidenced by the fact that our largest customer, Canadian Tire Corporation, Limited, represents only approximately 10% of the Company’s sales. The specialty channel offers us numerous attractive qualities, including higher margins, a focus on higher performance products, superior levels of customer service that drive customer engagement with our brand, a more diversified customer base and higher barriers to entry for new brands due to the fragmented nature of the channel and the associated investment to properly service it.
Our sales are diversified geographically, with increased geographic sales concentration in the United States as a result of our acquisition of Easton Baseball/Softball. In Fiscal 2015, approximately 42% of our total sales were in the United States, approximately 33% were in Canada, and approximately 25% were in the rest of the world.
Proven Acquisition Platform
We have a proven capability to identify, acquire, integrate and rapidly grow complementary businesses. We believe that our integrated performance sports platform and scale enable us to materially enhance the synergy potential and success of an acquisition by leveraging our industry-leading R&D expertise, customer relationships, marketing resources and low-cost manufacturing.
Since September 2008, as part of our growth strategy, we have acquired, integrated and significantly accelerated the growth of seven businesses, completing our latest Easton Baseball/Softball in April 2014. Building upon our base with Bauer Hockey, we acquired Mission-ITECH Hockey Inc. (“MISSION”) in September 2008, the leader in roller hockey and at the time the fourth largest ice hockey company; entered the performance apparel market through the acquisition of certain intellectual property assets from Jock Plus Hockey Inc. in November 2009; secured a lacrosse platform brand with our acquisition of Maverik Lacrosse LLC (“Maverik” and, such acquisition the “Maverik Acquisition”) in June 2010; complemented Maverik with the
17
acquisition of Cascade, the industry-leader in lacrosse helmets, in June 2012; acquired Inaria in October 2012 to provide the capability to support all of our existing sports with team and performance apparel and enter the youth soccer apparel market; entered the diamond sports market through the acquisition of specialty bat manufacturer Combat Sports in May 2013; and gained the market-leading position in the North American baseball and softball market through the Easton Baseball/Softball Acquisition in April 2014.
As we expand our performance sports platform, we remain focused on valuation, maintaining prudent debt levels and acquiring only those brands and businesses that allow us to drive significant organic revenue, market share and earnings growth. We also maintain the discipline to forgo other acquisition opportunities that do not meet our criteria.
Seasoned Management Team
We are led by an experienced and committed management team with a successful track record of developing and marketing innovative products, integrating strategic acquisitions, and implementing successful growth strategies that continually outperform the respective market in which we compete. Under their leadership, we have expanded our market share in hockey, sourced and integrated seven acquisitions since September 2008, and dramatically increased sales and earnings.
Led by Kevin Davis, Chief Executive Officer (“CEO”), who has been with the Company for more than 13 years and Amir Rosenthal, President, PSG Brands, and Chief Financial Officer (“CFO”) who has been with the Company for more than seven years, the senior management team has an average of more than 20 years’ experience in the sporting goods and consumer product industries, including with Nike, Procter & Gamble, Newell Rubbermaid, Unilever, Cleveland Golf and the Boston Bruins. On a company-wide basis, our dedicated and passionate employees have been with the Company for an average of more than eight years, which we believe represents a strong commitment to the Company and an enthusiasm for our sports categories.
Growth Strategies
Significantly Grow Market Share in Baseball and Softball
The Easton Baseball/Softball business provides us with significant opportunities to build on the brand’s strong foundation to further drive revenue growth opportunities in the United States and internationally. We believe EASTON’s brand equity well positions us to expand in other diamond sports equipment categories that have historically been less of a focus for the business, such as ball gloves, accessories, batting gloves and apparel. We expect to increase Easton Baseball/Softball’s market share in diamond sports equipment by accelerating investment in product development, instilling category management resources and enhancing already strong connections with consumers. We also believe we can leverage our team apparel capabilities to add uniforms to Easton Baseball/Softball’s apparel business, further increasing its revenue growth potential. Another area of revenue growth opportunity is the expansion of EASTON’s presence internationally, particularly in Japan, the second largest baseball market globally.
We also intend to use the COMBAT brand, its dedicated and passionate team and its intellectual property assets to grow our diamond sports business. We believe COMBAT will continue its rapid growth in bats through an expansion of marketing and grass roots initiatives and by leveraging our unique and proprietary technologies. COMBAT has significant experience embodied in trade secrets and know how related to prototyping and manufacturing advanced composite sporting goods and other products using proprietary software, formulations, seamless construction and precision molding processes. This knowledge enables advanced composite products to be manufactured with greater quality and efficiency, and provides a significant competitive advantage over existing and potential competitors.
Continue to Grow in Hockey
BAUER is the most recognized brand in ice hockey equipment and has been synonymous with the sport itself for more than 85 years. We believe that this strong brand recognition is the result of consistent brand communication, our “true to the game” authenticity, and regularly delivering to market innovative top-quality equipment with superior performance. We have the leading market share in the overall ice hockey equipment market, with an estimated 56% market share in Fiscal 2015.
As the result of our continued focus on category management, product development and consistent innovation, we have increased our ice hockey market share substantially from approximately 35% in 2007 and hold the No. 1 market share position in each of our ice and roller hockey equipment categories, with the exception of goalie equipment for which we now hold the No. 2 market share position. For Fiscal 2015, we estimate that we had more than a 70% market share in ice hockey skates, 65% in helmets and protective, 45% in sticks and 35% in goalie.
18
While we are already the leading player in ice hockey, we believe there is still a substantial opportunity to increase our market share. We intend to expand our market share in all categories, and are particularly focused on categories where we have a leading but less than 65% market share, such as sticks, the largest ice hockey product category. Historically, we have driven market share growth by introducing new products with performance improvements each year, and we intend to continue leveraging our world-class R&D and product development platform to develop high performance and innovative products that advance player performance and protection and distinguish us from our competitors.
In addition, we are utilizing Bauer Hockey’s unique position in the market to develop partnerships and initiatives to drive hockey participation growth across the world. In October 2012, Bauer Hockey, in partnership with the Canadian Hockey Association (“Hockey Canada”), launched “Grow the Game”, a multi-faceted global initiative to add one million new players globally to the game of hockey by 2022 (double the recent industry growth rate) and increase player safety. The first round of pilot programs for the “First Shift” program launched in Canada in 2014 and included innovations such as reducing the length of seasons, parent outreach and education, and cost reduction initiatives. In the past year, we have expanded the program across Canada and are working with USA Hockey, Inc. (“USA Hockey”) to launch a similar program in the United States. Based on our success in hockey, we see an additional opportunity to launch similar initiatives in other sports.
Bauer Hockey also opened its first ever Own The Moment Hockey Experience in the Boston suburb of Burlington, Massachusetts and plans to open a total of 8-10 retail stores in key North American hockey markets, including Bloomington, Minnesota in the Fall of calendar year 2015. A transformative and historic initiative for Bauer Hockey, these premium retail experiences are expected to elevate the BAUER brand, deliver an unmatched consumer educational experience and serve as the ultimate BAUER brand and product showcase.
Built to inform and inspire hockey players, each Own The Moment Hockey Experience will have expertly trained associates to guide each consumer through a “fit, learn and experience” process. The process includes understanding the player’s needs, a customized fit based on the athlete’s style of play and the opportunity to try-before-you-buy on an indoor ice rink that will be housed inside the Own The Moment Hockey Experience. The in-store fitting protocol and experience will be personalized for the entire hockey community, including players of all ages and abilities. Every Own The Moment Hockey Experience will have dedicated areas for each product category as well as specific areas to easily educate new-to-hockey families and welcome them to the sport.
Equipped with advanced fitting protocols and unique in-store educational tools, the Company plans to continually test various retail strategies and share the findings with its authorized retail partners throughout the world to improve the consumer experience at every retail destination and further elevate the BAUER brand. In addition to sharing overall strategies, each Own The Moment Hockey Experience will serve as a training site for local retailer staff to learn the latest information about BAUER equipment.
The Company expects its retail operations to grow its overall business and be profitable in the next 12 to 16 months.
Grow Apparel Across All Sports
Our ice hockey, roller hockey, lacrosse and diamond sports authentic brands and product offerings provide us with an opportunity to develop and sell a comprehensive line of related apparel and accessories, including team performance and lifestyle apparel. Drawing on our experience in ice hockey, where we have successfully grown our apparel revenues at a 33% compound annual growth rate from Fiscal 2009 to Fiscal 2015, we believe we can also grow our share in each of these apparel categories in other sports.
We deliver convenience and consistent branding to a traditionally fragmented team apparel market, thus helping our retail partners to provide a fully customized service to their customers. We are expanding our team apparel offering across our high performance sports platform, including building on our iconic EASTON and cutting-edge MAVERIK brands in the diamond sports and lacrosse apparel markets, respectively, while focusing the INARIA brand on the soccer apparel market. The expansion of our team apparel capabilities in hockey under the BAUER brand has provided another lever of growth to our hockey business by combining team apparel offerings with customized equipment such as helmets and pants.
In addition to team apparel, we believe there is a significant opportunity to leverage our strong brand names to increase our presence and product offering in performance and lifestyle apparel. We have made significant R&D investments in apparel as well as in our equipment categories. Recent examples of products developed from these efforts include our training and base layer products for hockey utilizing the 37.5™ moisture management system and our new line of protective hockey apparel utilizing Poron®XRD™, a proprietary foam exclusively available to us for use in hockey and lacrosse. Our performance apparel business has seen the benefit of this investment and grown at a 51% compound annual growth rate from Fiscal 2009 to Fiscal 2015.
19
Continue Our Rapid Growth in Lacrosse
Through our CASCADE and MAVERIK brands, we estimate our lacrosse market share to be 28%, including a 90% market share in helmets. We believe our intellectual property assets, authentic lacrosse brand names, and strong R&D and product development platform position us well to achieve overall market leadership by 2016.
We intend to continue to focus and drive growth amongst core youth (15 and under) and high school markets, which represent 38% and 55% of lacrosse participants in the United States, respectively. Similar to ice hockey and baseball, the high representation of youth in the sport provides the industry with a more frequent product replacement cycle as players grow out of their equipment.
With our CASCADE brand, we are the leading manufacturer and distributor of men’s and youth lacrosse helmets in North America. CASCADE has been able to develop its leading market position, long-term relationships with retailers and strong industry-wide brand recognition due to an efficient manufacturing process and supply chain that allows it to manufacture and ship customized products within 48 hours of order. Cascade has been the helmet sponsor of Major League Lacrosse since 1999, with 85% of the league wearing CASCADE helmets. In addition, 40 of the last 48 NCAA Division I lacrosse national championship finalist teams have exclusively worn CASCADE helmets. We are the exclusive helmet provider for approximately 72% of all NCAA Division I collegiate lacrosse teams, and 48 of the top 50 high school teams in the United States.
Our lacrosse business operates a 72,000 square-foot manufacturing facility in Liverpool, New York with multiple production lines, as well as operations in New York City and Exeter, New Hampshire. As most of our lacrosse business’ component suppliers and vendors have facilities located within 300 miles of the Liverpool facility, we are able to manufacture and ship individualized products within a 48-hour turnaround time from order confirmation. We intend to maintain our factory custom competitive advantage while ensuring our lacrosse business continues to provide its specialty dealers and retailers with strong customer service and product customization capabilities, which are particularly important for the many school and travel lacrosse teams that customize the color schemes of their helmets as part of the team uniforms. These unique attributes have enabled our lacrosse business to develop long-term relationships with its retailers while also building strong industry-wide brand recognition. We manufacture and deliver all of our lacrosse helmet products to retailers and other distributors through our facility in Liverpool, New York and our other lacrosse equipment products through our third-party facility in Aurora, Illinois.
Beyond increasing market share in our current men’s lacrosse categories, we see substantial opportunity to expand our presence in women’s lacrosse and in lacrosse team apparel by leveraging the combined product innovation and research capabilities of the Company. We are well positioned to deliver advancements in women’s head protection as a result of CASCADE’s leadership position in helmets and recently launched MAVERIK branded lacrosse uniforms through a targeted strategy incorporating our team apparel capabilities and Cascade’s strong customization-based customer relationships.
Continue to Pursue Strategic Acquisitions
We have repeatedly used our world-class performance sports product platform to grow our business into new performance equipment and apparel categories and sports markets. Our successful acquisition and integration of seven businesses since 2008 has demonstrated our ability to identify targets and integrate acquired businesses. We are continuing to explore a number of potential near-term opportunities to complement our organic growth. When evaluating potential targets, we look for the ability to leverage our world-class performance sports platform, existing or potential market leaders, authentic brand equity and heritage and sports that demand high quality, innovative performance products. We are disciplined in our approach and have foregone many acquisition opportunities that did not satisfy our criteria.
Operating Segments
The Company has four operating segments: (i) Hockey, (ii) Baseball/Softball, (iii) Lacrosse and (iv) Soccer. Hockey and Baseball/Softball are reportable operating segments, and the remaining operating segments do not meet the criteria for a reportable segment and are included in Other Sports. The Hockey segment includes the BAUER and MISSION brands. The Baseball/Softball segment includes the EASTON and COMBAT brands. Other Sports includes the Lacrosse and Soccer operating segments, which includes the MAVERIK, CASCADE, and INARIA brands.
For operating segments data and geographic segments data, see “Segment Results” and refer to Note 17 of the Notes to Consolidated Financial Statements.
20
Customers
Our customer base spans over 5,000 retailers in Canada, the United States, the Nordic countries and more than 60 distributors. We sell our products through diverse channels of distribution including: (i) specialty retailers that cater to sports enthusiasts who typically seek premium products at the highest performance levels, (ii) national and regional full-line sporting goods retailers and distributors (“big box”), (iii) institutional buyers such as educational institutions and athletic leagues, and (iv) mass retailers that offer a focused selection of products at entry-level and mid-level price points.
In Fiscal 2015, approximately 58% of our total sales were in the United States, approximately 24% were in Canada, and approximately 18% were in the rest of the world. By channel, 27% of our sales were to big box accounts and 73% was to sport-specific specialty accounts (including larger, multi-door accounts).
Our ten largest customers together accounted for approximately 37% of the Company’s sales in Fiscal 2015, with our top customer, Canadian Tire Corporation, Limited, accounting for approximately 10% of our sales.
Bauer Hockey sells directly to our customers in Canada, the United States, and the Nordic countries. In Fiscal 2015, approximately 83% of our ice hockey equipment sales were to these markets. By channel, 18% of Bauer Hockey sales were to large big box accounts and 82% were to hockey specialty accounts (including larger, multi-door accounts). In these jurisdictions, our customers are typically independently-owned specialty hockey retail stores and large sporting goods retailers. Bauer Hockey sells through distributors outside North America and the Nordic countries. In Fiscal 2015, approximately 17% of our ice hockey equipment sales were to distributors representing over 1,000 retail outlets globally, providing us access to the world’s largest hockey markets outside North America and the Nordic countries. We believe that larger, more established equipment manufacturers like Bauer Hockey are able to more effectively serve the spectrum of retail channels globally, through established relationships and developed distribution capabilities.
Our lacrosse business exclusively sells its products through dealers and retailers, with minimal direct sales to end-consumers. In Fiscal 2015, approximately 89% of our lacrosse revenues were generated from lacrosse specialty and independent dealers, who then sell through to individuals, teams and institutions. The remaining 11% of our lacrosse revenues were from big box retailers and sporting goods retail chains, primarily on an exclusive basis. Through our grassroots and product-focused marketing approach, we have developed a diverse lacrosse customer base, with no customer representing more than 16% of total Fiscal 2015 sales.
COMBAT’s sales and distribution network focuses primarily on North America. COMBAT’s customers are made up of online stores, big box retailers, sporting goods chains and baseball specialty dealers. By channel, 3% of COMBAT sales were to big box and sporting goods chains and 97% were to baseball specialty accounts (including larger, multi-door accounts). COMBAT’s revenues are also generated via direct sales to end-consumers through team buy-in programs. COMBAT’s products are geared towards the high-end baseball and softball market which is currently served by the various retailers described above. This range allows for a wide variety of customers.
Easton Baseball/Softball’s sales and distribution network focuses primarily on North America. Easton Baseball/Softball’s customers are made up of online stores, big box retailers, sporting goods chains and baseball specialty dealers. By channel, 51% of Easton Baseball/Softball sales were to big box and sporting goods chains and 49% were to baseball specialty accounts (including larger, multi-door accounts). Easton Baseball/Softball’s products are geared towards the high-end baseball and softball market which is currently served by the various retailers described above. This range allows for a wide variety of customers.
Inaria predominantly sells its products directly to teams and associations. In Fiscal 2015, approximately 66% of revenues were generated in Canada. The primary soccer product being sold is a “player kit” that includes a jersey, shorts and matching socks for each member of the team or association. Each player kit is sized and personalized with team identifiers and numbering. Revenue is also generated from supplemental products such as off-field apparel, balls, bags and coaching accessories.
Research and Development
We have a disciplined, rolling, multi-year product development program through which we bring hundreds of new products to market annually across all of our sports. To support the successful execution of our new product launches, we (i) fully integrate our manufacturing partners into our R&D program, (ii) incorporate advanced materials into our product design to create lighter, more durable products, (iii) maintain a strong focus and discipline on cost management, and (iv) heavily test prototypes throughout the development phase, including utilization lab tests and on-ice/on-field trials by elite and high level players. We believe that this collaborative process yields superior equipment and performance apparel.
21
Our brands were founded on and exemplify the principles of performance, innovation and quality. We constantly strive to improve product performance and reduce costs through the use of biomechanical research, high performance materials, efficient manufacturing processes and valuable consumer insights. We believe that the application of next generation manufacturing technology solidifies our position as the industry leader in ice, roller hockey and baseball/softball equipment and will continue to drive the MAVERIK and CASCADE brands in lacrosse. We have been combining relevant technologies, where applicable, across all of our sports to strengthen our equipment offerings.
We work closely with athletes at all levels to provide insights that help us develop new equipment, including some of the world’s top professionals. In hockey, we have exclusive partnerships with NHL athletes such as Patrick Kane, Alexander Ovechkin, Steven Stamkos and Henrik Lundqvist who wear BAUER equipment exclusively and offer their insight and guidance to our industry-leading R&D team as we develop the most advanced hockey equipment in the industry. We believe that this collaborative process yields superior ice and roller hockey equipment and that partnering with elite athletes in our lacrosse, baseball and softball businesses will yield similar benefits.
Global Manufacturing, Sourcing and Distribution
Sourcing and Manufacturing
We have an established and comprehensive manufacturing platform with our key suppliers, primarily with facilities in Canada, China, Thailand and Vietnam, where most of our hockey equipment and related apparel is produced exclusively for us at what we believe to be low costs. During Fiscal 2015, greater than 90% of our manufactured products were sourced from international suppliers. We have excellent long-term relationships with our manufacturing partners and vendors, whom we fully integrate into our R&D and product development programs.
Bauer Hockey manufactures the majority of its hockey equipment with an exclusive vendor base. Over 90% of our overseas production is located in China, Thailand and Vietnam. Our remaining hockey products are manufactured either at non-exclusive facilities or at our in-house manufacturing facility in Blainville, Québec, the location of our new world-class research design and development center. Quality control for our products manufactured in Asia is managed from Blainville, Québec and our office in Taichung, Taiwan, where we have a dedicated staff responsible for liaising with internal resources located at our many partner locations.
Our suppliers and manufacturers are contractually bound by strict security and privacy provisions to ensure the protection of our proprietary trade secrets. We have agreements with our manufacturing partners that renew automatically every two years, and many of our manufacturing relationships vary from 10 years to more than 30 years. In the event that there are performance issues with our manufacturers, we retain the right to terminate any of our agreements with no more than 30 days’ notice. In our core product categories, we dual-source many products to mitigate the risk of supply disruptions. In addition, we employ strategies with our vendors to reduce the variability of material price increases over certain time periods.
We believe that we have one of the lowest manufacturing costs amongst our equipment competitors based on our manufacturing scale and infrastructure, coupled with our distribution network and R&D processes. We strive to obtain the lowest costs for materials and manufacturing of our products, including a focused initiative on lean manufacturing. In doing so, we seek alternative sources of supply and manufacturing capacity in existing and new markets.
We operate a 72,000 square foot manufacturing facility in Liverpool, New York, with multiple production lines for lacrosse and ice hockey helmets. For MAVERIK branded lacrosse products, we source primarily from suppliers in China, Vietnam, and Taiwan. For uniforms, we source raw materials and work-in-process primarily from suppliers in Asia and finish production at a facility in Toronto, Ontario. Our Combat Sports business manufactures its finished goods at its Ottawa, Ontario manufacturing facility as well as in China.
Easton Baseball/Softball manufactures 100% of its composite bats with an exclusive vendor located in China. Its remaining baseball and softball products are manufactured in non-exclusive facilities that are located throughout Asia, China, Thailand, Indonesia and Vietnam. A very small percentage of Easton Baseball/Softball products are sourced through vendors based in the United States. A majority of our EASTON branded wood bats are manufactured in our Van Nuys, California facility.
In October 2014 the Company announced a five-year plan to improve pre-tax profitability by $30 million (excluding certain non-recurring costs or one-time costs that may be required to implement some of these initiatives). The initiative is focused on efficiency, product cost reductions and inventory quality improvements. The Company expects to increase service levels throughout the supply chain and improve the overall distribution footprint. The cost reductions are expected to begin in Fiscal 2016, with the majority of the benefit to be experienced in the latter stages of the five-year plan.
22
Distribution
Our ice and roller hockey products are sold in over 60 countries through a distribution network of more than 2,400 retailers and distributors worldwide. We distribute our hockey products to retailers and other distributors through our facility in Mississauga, Ontario, as well as through third-party logistics providers in Aurora, Illinois, Romeoville, Illinois, Salt Lake City, Utah and Boras, Sweden. Our lacrosse products are sold in 10 different countries through a distribution network of more than 600 retailers and distributors worldwide. INARIA branded soccer products are sold directly to teams, clubs and associations across North America. All products are embellished and shipped from our 40,000 square feet facility located in Toronto, Ontario. Easton Baseball/Softball and Combat Sports’ products are sold through a distribution network of more than 1,700 retailers and distributors in North America and Europe. With the Easton Baseball/Softball Acquisition, we added a Salt Lake City, Utah distribution facility and a third-party logistics provider in Memphis, Tennessee. In addition to Baseball/Softball, the Salt Lake City facility also serves as a distribution facility for select hockey products.
Environment
We are not aware of any material environmental problems with respect to any of our operations or facilities. Existing applicable environmental laws and requirements have not had any adverse financial or operational effects on our capital expenditures, earnings or competitive position and we do not anticipate that continuing compliance with such laws and requirements will have a material adverse effect upon our expenditures, earnings or competitive position in future years.
Intellectual Property
We have an extensive portfolio of intellectual property which creates a strategic competitive advantage and can be applied to new performance equipment sports categories. Our portfolio includes 638 patents (including design patents and patents pending). We protect our technologies, products and brands under the patent, copyright and trademark laws of those countries in which we do business. We aggressively defend any infringements of our patents to the fullest extent possible.
In addition, we own a significant number of trademarks including BAUER, SUPREME, NEXUS, MISSION, MAVERIK, CASCADE, INARIA, COMBAT, EASTON and MAKO. Other significant trademarks include COOPER, ITECH, JOCK PLUS and TUUK, as well as LANGE, MICRON, DAOUST, MEGA, LASER, and FLAK.
At the time of the sale of the Bauer Hockey Business by NIKE, Inc., including its affiliates (“Nike”), where “Bauer Hockey Business” means the business consisting of, among other things, the design development, manufacturing and marketing of performance sports products of ice hockey and roller hockey, as at the time of the sale of such business by Nike, Nike granted to us an exclusive, worldwide, royalty-free, perpetual limited license to use the VAPOR brand in connection with the manufacture and sale of certain products, subject to the terms and conditions set out in the trademark license agreement, dated April 16, 2008 (the “Vapor License Agreement”). Pursuant to a co-existence agreement, Nike assigned to us its ownership of the SUPREME brand with respect to hockey and skating equipment and related apparel.
Information Technology
We use our information systems to manage our customer orders, deliveries and manufacturing processes. We primarily operate a global SAP infrastructure. We have a North American integrated business-to-business system for our sales representatives and retailers, BauerBiz, which facilitates approximately 80% of our hockey-related orders. Along with other business systems, these tools provide business process support and intelligence across our entire integrated business process, from concept to consumer. In order to protect our ability to conduct business, several risk mitigation techniques are used across our hardware and network equipment, and telecommunications. In addition, despite the Company’s implementation of security measures, its systems, are vulnerable to damages from computer viruses, unauthorized access, cyberattack and other similar disruptions. In the event we experience significant disruptions with our information technology system, we may not be able to fix our systems in an efficient and timely manner. These risks are greater with increased information transmission over the Internet and the increasing level of sophistication posed by cyber criminals. See “Risk Factors-If we experience significant disruptions in our information technology systems, our business and financial results may be adversely affected.”
Employees and Culture
We have an innovative and energetic culture. Our entire Performance Sports Group team is passionate about our brands, our businesses, ice and roller hockey, lacrosse, baseball and softball, soccer and sports in general. Most of our employees are involved in hockey, lacrosse, or baseball and softball outside of work in one manner or another. Our employees’ commitment and dedication to our company is supported by their significant length of service. Our employees have been with the Company an
23
average of approximately eight years.
As of May 31, 2015, the Company had 872 employees globally. By function, these employees are in Customer Service (72), Distribution (142), Factory (149), Foreign Sourcing (14), Product/R&D (162), Sales (78), Marketing (58), and Administrative (197). By location, these employees are in Canada (370), U.S. (445), Taiwan (19), Sweden (24), Germany (8), and Finland (6). By line of business, these employees are in hockey and shared services (473), baseball and softball (263), lacrosse (73), and apparel (53).
No employees in the United States are represented by any labour union or covered by a collective bargaining agreement. In Canada, certain of our employees are represented by unions. In Mississauga, Ontario, approximately 54 of our employees belong to the Glass, Molders, Pottery, Plastics and Allied Workers International Union and are subject to a three-year collective bargaining agreement expiring on July 6, 2017. In Blainville, Québec, 34 of our full-time employees are members of the United Steelworkers Union of America and are subject to a five-year collective bargaining agreement expiring on November 30, 2017. We have not experienced any labour-related work stoppages and we believe that our relationship with our employees is good.
Seasonality
Our business demonstrates substantial seasonality, although this seasonality has been reduced as a result of the Easton Baseball/Softball Acquisition. The spring/summer season of baseball and softball is highly complementary to the fall/winter season of hockey, and our quarterly sources of revenue and profitability are more balanced throughout the year as a result. The more evenly distributed seasonality of the combined business provides more consistent working capital levels and allows us to improve our efficiency in our manufacturing, distribution and other efforts.
Generally, our highest sales volumes for hockey occur during the first quarter of our fiscal year. Our next highest sales volumes for hockey occur during the second quarter of our fiscal year. Our lowest sales volumes for hockey occur during the third quarter of our fiscal year. In ice hockey, we have three sub-brands of products - VAPOR, SUPREME and NEXUS. In certain fiscal years, we have launched new products under more than one sub-brand. The launch timing of our products may change in future periods.
In lacrosse, our highest sales volumes for MAVERIK and CASCADE products occur in the second and third fiscal quarters.
In baseball/softball, our highest sales volumes for EASTON and COMBAT products occur in the third and fourth fiscal quarters.
The shipment of INARIA soccer products occurs substantially in the first and fourth fiscal quarters. We expect our team apparel revenues, including uniforms for ice hockey, roller hockey, lacrosse and other team sports, to align with the underlying sports’ selling seasons as we expand our team apparel offering. In addition, these custom team orders are typically fulfilled within a 30 to 60 day turnaround time, so the visibility to customer orders in advance is limited.
The following table reflects the seasonality of net revenues for each of the quarters in the three most recent fiscal years:
Percent of Fiscal Net Revenues | ||||||||
Three-Month Period Ended | Three-Month Period Ended | Three-Month Period Ended | Three-Month Period Ended | |||||
Fiscal Year | August 31 | November 30 | February 28 | May 31 | ||||
2015 (1) | 30.1% | 26.3% | 21.0% | 22.6% | ||||
2014 | 34.5% | 26.2% | 13.9% | 25.4% | ||||
2013 | 37.1% | 27.4% | 13.8% | 21.7% | ||||
(1) Revenue seasonality more balanced as a result of the Easton baseball/softball acquisition.
See “Risk Factors-Our business is affected by seasonality, which could result in fluctuations in our operating results and the trading price of the Common Shares.”
24
Item 1A. | RISK FACTORS |
You should carefully consider the risks described below, which are qualified in their entirety by reference to, and must be read in conjunction with, the detailed information appearing elsewhere in this annual report on Form 10-K and all other information contained in this annual report on Form 10-K. The risks and uncertainties described below are those we currently believe to be material, but they are not the only ones we face. If any of the following risks, or any other risks and uncertainties that we have not yet identified or that we currently consider not to be material, actually occur or become material risks, our business and financial condition could be materially and adversely affected.
Risks Related to Our Business
Our business depends on strong brands, and if we are not able to maintain and enhance our brands we may be unable to sell our products, which would harm our business and cause the results of our operations to suffer.
We believe that the brand image we have developed has significantly contributed to the success of our business. We also believe that maintaining and enhancing the BAUER, VAPOR, SUPREME, NEXUS, MISSION, MAVERIK, CASCADE, INARIA, COMBAT, EASTON and MAKO brands is critical to maintaining and expanding our customer base. Maintaining and enhancing our brands may require us to make substantial investments in areas such as R&D, marketing and employee training, and these investments may not be successful. A primary component of our strategy involves expanding into other geographic markets, particularly within Russia and other Eastern European countries (for ice hockey), in Japan and other non-North American countries (for baseball and softball) and in Canada (for lacrosse). As we expand into new geographic markets, consumers in these markets may not accept our brand image and may not be willing to pay a premium to purchase our sporting equipment as compared to the locally established branded equipment. We anticipate that as our business expands into new markets, maintaining and enhancing our brands may become increasingly difficult and expensive. If we are unable to maintain or enhance the image of our brands, it could adversely affect our business and financial condition.
Sales of our products may be adversely affected if we cannot effectively introduce new and innovative products that meet our quality standards.
Although design, safety and performance of our products is a key factor for consumer acceptance of our products, technical innovation and quality control in the design and manufacture of sporting equipment and related apparel is also essential to the commercial success of our products. R&D plays a key role in technical innovation. We include specialists in the fields of biomechanics, engineering, industrial design and related fields, as well as research committees and advisory boards made up of athletes, coaches, trainers, equipment managers and other experts to develop and test cutting-edge performance products. While we strive to produce quality products that enhance athletic safety and performance and maximize comfort, if we fail to introduce high quality technical innovation in our products the consumer demand for our products could decline.
The sporting equipment and related apparel industry is subject to constantly and rapidly changing consumer demands based, in part, on performance benefits. Our continued success depends, in part, on our ability to anticipate, gauge and respond to these changing consumer preferences in a timely manner while preserving the authenticity and quality of our brands. We believe the historical success of our business has been attributable, in part, to the introduction of products that represent an improvement in performance over products then available in the market. Our future success and growth will depend, in part, upon our continued ability to develop and introduce innovative products. Successful product design, however, can be displaced by other product designs introduced by competitors which shift market preferences in their favor. If we do not introduce successful new products or our competitors introduce products that are superior to ours, our customers may purchase more products from our competitors, which would result in a decrease in our revenues and an increase in our inventory levels, either of which could adversely affect our business and financial condition.
Our success is also dependent on our ability to prevent competitors from copying our innovative products and on the laws and law enforcement practices in respect of intellectual property in the countries in which we manufacture and sell our products. We may not be able to obtain intellectual property protection for an innovative product and, even if we do, we cannot assure that we would be successful in challenging a competitor’s attempt to copy that product. Conversely, our competitors may obtain intellectual property protection for superior products that would preclude us from offering the same or similar features on our products. If a competitor’s proprietary product feature were to become the industry standard, our customers may purchase more products from our competitors, which would result in a decrease in our revenues and an increase in our inventory levels, either of which could adversely affect our business and financial condition.
If we experience problems with the quality of our products, we may incur substantial expense to remedy the problems
25
and our reputation and brands may be harmed, which could adversely affect our business and financial condition. See also “Risk Factors - We are subject to product liability, warranty and recall claims, and our insurance coverage may not cover such claims.”
Our financial results will be affected by market conditions in the sporting equipment and related apparel industry, which is highly competitive and has certain segments with low barriers to entry.
The sporting equipment industry is highly competitive. Competitive factors that affect our market position include the style, quality, technical and safety aspects and pricing of our products and the strength and authenticity of our brands. While our brand recognition creates significant barriers to entry in most of our markets, there are minimal barriers to entry into certain segments of the sporting equipment industry and related apparel industry. For example, there are low barriers to entry in the related apparel market, including certain performance, team and lifestyle segments. The general availability of offshore manufacturing capacity allows for rapid expansion by competitors and new entrants. Our competitors may overproduce or face financial or liquidity difficulties which may lead them to release their products at lower prices into the market or offer discounts to clear their inventory, resulting in decreased demand for our products. We face competition from well-known sporting goods companies, such as adidas AG-owned Reebok, which has strong brand recognition inside and outside of hockey (and which also owns both the REEBOK and CCM brands) and Easton Hockey (which utilizes the EASTON brand under a trademark license from us). In baseball and softball, we compete with a number of international peers such as Jarden-owned RAWLINGS, Amer Sports-owned WILSON and LOUISVILLE SLUGGER and Mizuno Corp.-owned MIZUNO. In lacrosse, our principal competitors include New Balance-owned WARRIOR and BRINE, and privately-held STX, each of which has significant market share (other than in the helmet category), as well as Jarden-owned DEBEER in women’s lacrosse. We also compete with smaller companies who specialize in marketing to our core customers. Our inability to effectively compete in the sporting equipment and related apparel market could adversely affect our business and financial condition.
One of our growth strategies is to operate in the highly competitive apparel market and the brand recognition, size and resources of some of our competitors may allow them to compete more effectively than we can, resulting in us failing to execute on such growth strategy, a loss of our market share and a decrease in our net revenue and profitability.
The market for athletic apparel is highly competitive and there are low barriers to entry in certain segments of the apparel market, including performance, team and lifestyle segments. Competition may result in pricing pressures, reduced profit margins or lost market share or a failure to grow our market share, any of which could adversely affect our business and financial condition. We compete directly against wholesalers and direct retailers of athletic apparel, including large, diversified apparel companies with substantial market share and established companies expanding their production and marketing of athletic apparel. We also face competition from wholesalers and direct retailers of traditional commodity athletic apparel, such as cotton T-shirts and sweatshirts. Many of our competitors in this segment are large apparel and sporting goods companies with strong worldwide brand recognition, such as Nike, Under Armour, Inc. and adidas AG, which includes the ADIDAS and REEBOK brands. Due to the fragmented nature of the industry, we also compete with other apparel sellers, including those specializing in hockey, baseball and softball, and lacrosse related apparel. Many of our competitors have significant competitive advantages, including longer operating histories, larger and broader customer bases, more established relationships with a broader set of suppliers, greater brand recognition and greater financial, R&D, store development, marketing, distribution and other resources than we do. In addition, much of our athletic apparel is sold at a price premium to our competitors.
Our competitors may be able to create and maintain brand awareness and market share in apparel more quickly and effectively than we can by using traditional forms of advertising or otherwise. Our competitors may also be able to increase sales in their new and existing markets faster than we do by emphasizing different distribution channels than we do, such as catalog sales or an extensive franchise network and team dealer network, as opposed to distribution through retail stores or wholesale, and many of our competitors have substantial resources to devote toward increasing sales in such ways. If we are unable to grow our apparel business, it could adversely affect our business and financial condition.
Our success is dependent on our ability to protect our valuable intellectual property rights worldwide and, if we are unable to acquire, enforce, defend and protect our intellectual property rights, our competitive position may be harmed.
We rely on a combination of patent, trademark, industrial design and trade secret laws in our core geographic markets and other jurisdictions, to protect the innovations, brands and proprietary trade secrets and know how related to certain aspects of our business. We seek to protect our confidential proprietary information, in part, by entering into confidentiality and invention assignment agreements with our employees, consultants, contractors, suppliers, and collaborators. While these agreements are designed to protect our proprietary information, we cannot be certain that such agreements have been entered into with all relevant parties, and we cannot be certain that our trade secrets and other confidential proprietary information will not be disclosed or that competitors will not otherwise gain access to our trade secrets or independently develop substantially equivalent information and techniques. For example, any of these parties may breach the agreements and disclose our proprietary information, including our
26
trade secrets, or any third party may independently develop similar trade secrets and know how, and we may not be able to obtain adequate remedies for such breaches or independent developments. We also seek to preserve the integrity and confidentiality of our confidential proprietary information by maintaining physical security of our premises and physical and electronic security of our information technology systems, but it is possible that these security measures could be breached.
We cannot assure that our actions taken to establish and protect our technology and brands will be adequate to prevent others from seeking to block sales of our products or to obtain monetary damages, based on alleged violation of their patents, trademarks or other proprietary rights. In addition, our competitors have obtained and may continue to obtain patents on certain features of their products, which may prevent us from offering such features on our products, may subject us to patent litigation, and in turn, could result in a competitive disadvantage to us. Moreover, third parties may independently develop technology or other intellectual property that is comparable with or similar to our own, and we may not be able to prevent their use of it. We cannot assure that any third-party intellectual property, including patents and trademarks, for which we have obtained licenses are adequately protected to prevent imitation by others. If those third-party owners fail to obtain or maintain adequate intellectual property protection or prevent substantial unauthorized use of the licensed intellectual property, we risk the loss of our rights under the third-party intellectual property and competitive advantages we have developed based on those rights.
While we have selectively pursued patent and trademark protection in our core geographic markets, in some countries we have not perfected important patent and trademark rights. Further, the laws of some foreign countries do not protect proprietary rights to the same extent or in the same manner as the laws of Canada or the United States. As a result, we may encounter significant problems in protecting, enforcing and defending our intellectual property outside of Canada and the United States. If we are unable to prevent material disclosure of the proprietary and confidential know how and trade secrets related to our technologies to third parties, we will not be able to establish or maintain a competitive advantage in our market, which could adversely affect our business and financial condition.
We may be involved in lawsuits to protect, defend or enforce our intellectual property rights, which could be expensive, time consuming and unsuccessful.
Our success depends in part on our ability to protect our trademarks, patents and trade secrets or know how from unauthorized use by others. To counter infringement or unauthorized use, we may be required to file infringement or misappropriation claims, which can be expensive and time-consuming. Any claims that we assert against perceived infringers could also provoke these parties to assert counterclaims against us alleging that we infringe or misappropriate their intellectual property rights. In addition, in an infringement proceeding, a court may decide that a patent or trademark of ours is invalid or is unenforceable, in whole or part, or may refuse to stop the other party in such infringement proceeding from using the technology or mark at issue on the grounds that our patents do not cover the technology in question or misuse our trade secrets or know how. An adverse result in any litigation or defense proceedings, including proceedings at the patent and trademark offices, could put one or more of our patents or trademarks at risk of being invalidated, held unenforceable or interpreted narrowly, and could put any of our patent or trademark applications at risk of not being issued as a registered patent or trademark. We cannot be sure that our patents, trademarks and trade secrets, including our contractual restrictions, will be adequate to prevent imitation of our products and technology by others. We may be unable to prevent third parties from using our intellectual property rights without our authorization, particularly in countries where we have not registered such rights, where the laws or law enforcement practices do not protect our intellectual property rights as fully as in Canada or the United States, or where intellectual property protection is otherwise limited or unavailable. In some foreign countries, where intellectual property laws or law enforcement practices do not protect our intellectual property rights as fully as in Canada and the United States, third-party manufacturers may be able to manufacture and sell imitation products and diminish the value of our brands as well as infringe our trademark rights. Furthermore, because of the substantial amount of discovery required in connection with intellectual property litigation, there is a risk that some of our confidential proprietary information could be compromised by disclosure during this type of litigation. In addition, there could be public announcements of the results of hearings, motions or other interim proceedings or developments. If securities analysts or investors perceive these results to be negative, it could have a substantial adverse effect on the price of the Common Shares. If we fail to obtain enforceable patent, trademark and trade secret protection, maintain our existing patent, trademark rights and trade secret protection, or prevent substantial unauthorized use of our trade secrets or know how and brands, we risk the loss of our intellectual property rights and competitive advantages we have developed, causing us to lose revenues and have an adverse effect on our business and financial condition. Accordingly, we devote substantial resources to the establishment and protection of our trademarks, patents, industrial designs and trade secrets or know how, and we continuously evaluate the registration of additional trademarks, industrial designs and patents, as appropriate. We cannot guarantee that any of our pending applications will be approved by the applicable governmental authorities. Moreover, even if the applications will be registered during the registration process, third parties may seek to oppose or otherwise challenge these applications or registrations.
27
Our success relies on our ability to protect our known brands and our rights to the use of such brands. Any difficulties in maintaining these brands may result in damage to our business and financial condition.
Our best known brands include BAUER, VAPOR, SUPREME, NEXUS, MISSION, MAVERIK, CASCADE, INARIA, COMBAT, EASTON and MAKO. We believe that these trademarked and licensed brands, as applicable, are core assets of our business and are of great value to us. If we lose any rights necessary for the use of a product name, our efforts spent building that brand will be lost and we will have to build another brand for that product, which we may not be able to do.
VAPOR, one of our key hockey brands, is not owned by us and VAPOR and SUPREME are subject to use by third parties on products outside of hockey and skating. Our rights to the VAPOR brand are licensed from Nike, and Nike continues to own the mark and the goodwill associated therewith. We are required to comply with certain conditions regarding our use of the VAPOR mark, and are not permitted to use it on apparel or equipment primarily manufactured for participants in athletic activities other than hockey or skating. If we materially breach certain provisions of the Vapor License Agreement and do not or are unable to remedy such breach following notice by Nike, the Vapor License Agreement could be terminated, which would have an adverse effect on our business and financial condition. Nike has rights to use the VAPOR mark and the SUPREME mark on equipment and apparel outside of the hockey and skating markets. If Nike’s or its licensees’ use of the VAPOR or SUPREME marks is associated with negative publicity, it may have an adverse effect on our business and financial condition.
While we retain ownership of the EASTON and MAKO marks, in connection with the Easton Baseball/Softball Acquisition, we granted to BRG Sports and its successors and assigns a license to use these brands to identify and market their hockey and cycling products. Under the terms of this license agreement, BRG Sports must ensure that all products, packing and advertising materials are of the same quality attained by BRG Sports in its 2013-2014 hockey and cycling product lines and marketed and distributed through channels that are consistent with maintaining this quality standard. Further, as a result of the Easton Baseball/Softball Acquisition, we assumed a license granted by Easton-Bell Sports, Inc. to a company owned by one of its founding members, to use the EASTON trademark in connection with the manufacture and sale of archery bows and accessories. As we do not control either of the above licensees or their successors, we can make no assurances as to how they will conduct business under the EASTON and MAKO brand names. If the conduct or product of a licensee were to create negative publicity for the EASTON or MAKO brands, it may have an adverse effect on our business and financial condition.
Our products may infringe the intellectual property rights of others, which may cause us to incur unexpected costs or prevent us from selling our products.
From time to time, third parties have challenged our patents, trademark rights and branding practices, or asserted intellectual property rights that relate to our products and product features. We may be required to defend such claims in the future, which, whether or not meritorious, could result in substantial costs and diversion of resources and could have an adverse effect on our business and financial condition or competitive position. If we are found to infringe a third party’s intellectual property rights, we could be forced, including by court order, to cease developing, manufacturing or commercializing the infringing product. Alternatively, we may be required to obtain a license from such third party in order to use the infringing technology and continue developing, manufacturing or marketing the infringing product. However, we may not be able to obtain any required license on commercially reasonable terms or at all. Even if we were able to obtain a license, it could be non-exclusive, thereby giving our competitors access to the same technologies licensed to us. We may also need to redesign or rename some of our products to avoid future infringement liability. In addition, we could be found liable for monetary damages, including treble damages and attorneys’ fees if we are found to have willfully infringed a patent. A finding of infringement could prevent us from commercializing our products or force us to cease some of our business operations, which could materially harm our business. We may also elect to enter into license agreements in order to settle patent infringement claims or to resolve disputes prior to litigation, and any such license agreements may require us to pay royalties and other fees that could be significant. Claims that we have misappropriated the confidential information or trade secrets of third parties could have a similar negative impact on our business. Moreover, our involvement in litigation against third parties based on infringement of our intellectual property rights presents some risk that our intellectual property rights could be challenged and invalidated. See also “- We may be involved in lawsuits to protect or enforce our intellectual property rights, which could be expensive, time consuming and unsuccessful”. Any of the foregoing could cause us to incur significant costs and prevent us from manufacturing or selling certain of our products, which could adversely affect our business and financial condition.
We may not be successful in designing and manufacturing products that satisfy the testing protocols and standards established by testing and athletic governing bodies or independent third-party testing methods, which could adversely affect our business and financial conditions.
Our success depends on, among other things, the value and reputation of our brands. Negative publicity regarding any of our brands or products, could adversely affect our reputation and sales. Our products are designed to satisfy the standards
28
established by a number of regulatory and testing bodies, including the Canadian Standards Association (the “CSA”), the Hockey Equipment Certification Council, and National Operating Committee on Standards for Athletic Equipment (“NOCSAE”), as well as by athletic organizations and governing bodies, including the NHL, MLB, NCAA, Little League Baseball and USA Baseball. For certain products, we rely on our in-house testing equipment to ensure that such products comply with these standards. In addition, conferences within these athletic organizations have their own standards that can be stricter than the standards promulgated by the organizations themselves. Furthermore, independent research organizations may evaluate the safety and performance of our products under their own testing protocols and publicize these evaluations.
There can be no assurance that our products will continue to satisfy, and future products will satisfy, the standards established by testing and athletic governing bodies, that our in-house testing equipment will produce the same results as the equipment used by the applicable testing bodies, athletic organizations and governing bodies or that existing standards or testing protocols will not be interpreted and altered in ways or at times that adversely affect our brands and the sales of our products. Any failure to comply with applicable standards or resolve identified issues with applicable governing bodies and any negative publicity that results from third-party evaluation of our products could have an adverse effect on our business and financial condition. Our products also expose us to warranty claims and product liability claims, class action lawsuits and regulatory investigations, in the event that products designed, manufactured or sold by us actually or allegedly fail to perform as expected, or the use of those products results, or is alleged to result, in personal injury, death or property damage.
Sales of our baseball and softball products will be adversely affected if we cannot satisfy the standards established by athletic organizations and governing bodies. These standards can be changed on short notice and in ways that are disruptive to manufacturers such as us. USA Baseball announced a new bat standard for all youth baseball (which covers players 14 years old and under) that will take effect January 1, 2018. All youth baseball play governed by USA Baseball (with the exception of USSSA Baseball), must use bats compliant with USA Baseball’s youth standard.
In the past, in response to injuries or death caused by balls hit off non-wood bats, industry governing bodies such as Little League Baseball and several state legislatures and other local governing bodies introduced bills to ban non-wood bats in youth sports. For example, in March 2007, the New York City Council passed a law banning non-wood bats in high school games. A successful bill in a state legislature or other local governing bodies or a change in NCAA regulations to restrict or ban the use of non-wood bats could adversely affect our business and financial condition. In the past, the NCAA has also considered restricting the use of non-wood bats and passed regulations limiting batted ball speed. In August 2009, the NCAA placed a moratorium on the use of composite bats in NCAA competition. The NCAA’s concern about composite bats is that they are susceptible to performance improvement above standards set by the NCAA, either through normal use or alterations to the bats made illegally by players. Subsequently, the NCAA has decided that composite bats will be allowed to be used provided that they pass the revised performance standards limiting batted ball speed. If the NCAA, Little League Baseball, USA Baseball or other governing bodies were to prohibit composite bats, or if we were not able to adapt our products to the standards the NCAA may develop, it could have a negative impact on our operating results.
Some of our lacrosse products are made to meet requirements of governing bodies and athletic organizations such as the NCAA, National Federation of State High School Associations (“NFHS”) and U.S. Lacrosse. Specifically, lacrosse helmets, facemasks and lacrosse balls must meet the NOCSAE standard. Lacrosse goggles are made to meet an American Society for Testing and Materials standard for lacrosse eyewear. These requirements and standards may change on short notice and any failure to comply with applicable requirements or standards could have an adverse effect on our business and financial condition. For example, in November 2014, NOCSAE questioned the manner of the Company’s testing and the adequacy of certain of its quality assurance/quality control procedures which NOCSAE asserted were required to support manufacturer certification to the helmet standard. In connection with this inquiry, NOCSAE decertified the CASCADE R model helmet on November 20, 2014, although this model helmet had received passing test results at two of the three independent laboratories approved by NOCSAE for helmet testing and certification. In addition to public announcement of the decertification of the R model helmet, NOCSAE notified the various sports governing bodies which require that lacrosse helmets used in league play under their jurisdiction be certified to NOCSAE standards.
In order to satisfactorily resolve the decertification issue, the Company and NOCSAE reached agreement on a modification to existing R model helmets that met NOCSAE requirements for recertification of the subject helmets. NOCSAE and the Company announced this resolution on December 12, 2014. We immediately implemented the modification program with an extensive outreach, including direct contact to consumers. After completion of certification testing and passing a third-party quality audit at our Liverpool , New York manufacturing facility, NOCSAE on December 24, 2014 approved our shipments of both retrofitted R helmets and newly manufactured R helmets.The estimated number of retrofitted R helmets to date is approximately 80,000, but the Company estimates that approximately 92,000 R helmets will be retrofitted pursuant to the modification program.
Academic institutions or other independent research organizations may evaluate the safety and performance of our
29
products under their own testing protocols and publicize these evaluations. For example, in March 2015, Virginia Tech University unveiled its STAR Rating System for hockey helmets, which assigned all commercially available hockey helmets with a star ranking based upon the results of its own testing protocol which purportedly measures a helmet’s capacity to reduce concussion risk. Each helmet was given a rating between one and five stars or not recommended (below one star). The initial study examined 32 helmets with one helmet receiving a three-star rating, six helmets receiving two-star ratings, 16 helmets receiving one-star rating and nine being not recommended. Bauer Hockey had two two-star-rated helmets, five one-star-rated helmets, and three helmets not recommended. Mission Hockey had two helmets rated one-star. The methodology and findings of Virginia Tech’s STAR Rating System have been questioned by hockey equipment manufacturers and independent experts.
We may not be successful in converting booking orders into realized sales.
Our revenues are generated from (i) booking orders, which are typically received several months in advance of the actual delivery date or range of delivery dates, (ii) repeat orders, which are for at-once delivery, and (iii) other orders. Booking orders include firm orders for which we are given specific delivery dates and planning orders for which we are given a range of delivery dates. Planning orders represent a small, but growing part of our total booking orders. In recent years, the conversion rate of planning orders, or the percentage of planning orders which are ultimately shipped, is not materially different than the conversion rate of firm orders. There can be no assurances that this trend will continue for upcoming seasons.
The seasonality of our business and the manner in which we solicit orders could create quarterly variations in the percentage of our revenues that are comprised of booking orders. Although our booking orders give us some visibility into our future financial performance, there may not be a direct relationship between our booking orders and our future financial performance given several factors, among which are: (i) the timing of order placement compared to historical patterns, (ii) our ability to service demand for our product, (iii) the willingness of our customers to commit to purchasing our product, and (iv) the actual sell-through of our products at retail driving changes in repeat orders. As a result, there can be no assurances that our booking orders will translate into realized sales. Failure to convert booking orders into realized sales could adversely affect our business and financial condition.
Our business is affected by seasonality, which could result in fluctuations in our operating results and the trading price of the Common Shares.
We experience material fluctuations in aggregate sales volume during the year. Historically, revenues in the first fiscal quarter have exceeded those in the second and fourth fiscal quarters and revenues in the third fiscal quarter are lower than the other quarters. While the Easton Baseball/Softball Acquisition has reduced our seasonality, the mix of product sales may nevertheless vary considerably from time to time as a result of changes in seasonal and geographic demand for particular types of equipment and related apparel. In addition, our customers may cancel orders, change delivery schedules or change the mix of products ordered with minimal notice. We may also make strategic decisions to deliver and invoice product at certain dates in order to lower costs or improve supply chain efficiencies. As a result, we may not be able to accurately predict our quarterly sales. Accordingly, our results of operations are likely to fluctuate significantly from period to period. This seasonality, along with other factors that are beyond our control, including general economic conditions, changes in consumer preferences, weather conditions, availability of import quotas, and currency exchange rate fluctuations, could adversely affect our business and financial condition. Our operating margins are also sensitive to a number of factors, including those that are beyond our control, as well as shifts in product sales mix, geographic sales trends, and currency exchange rate fluctuations, all of which we expect to continue. Results of operations in any period should not be considered indicative of the results to be expected for any future period.
Our success depends in large part on the continued popularity of ice hockey, baseball and softball, roller hockey, and lacrosse as recreational sports and the popularity of the NHL, Major League Baseball (“MLB”), MLL, NCAA and Little League Baseball and other high-performance leagues for sports in which our products are used.
The demand for our ice hockey equipment and related apparel is directly related to the popularity of the sport of ice hockey, the number of professional and amateur ice hockey participants, and the amount of ice hockey being played by these participants. If ice hockey participation decreases, sales of our ice hockey equipment and related apparel could be adversely affected. The popularity of the NHL, as well as other professional ice hockey leagues in North America, Europe and the rest of the world, also affect the sales of our ice hockey equipment and related apparel. Our brands receive significant “on-ice” exposure as a result of our endorsements with, or purchases by, NHL players and other professional athletes. We depend on this “on-ice” exposure of our brands to increase brand recognition and reinforce the quality and high performance of our products. The Company maintains an important and valuable relationship with the NHL, the world’s premier professional hockey league, and any work stoppages or significant reduction in television coverage of NHL games or any other significant decreases in either attendance at NHL games or viewership of NHL games will reduce the visibility of our brands and could adversely affect our sales of hockey equipment and related apparel. The NHL entered into a lockout during a portion of the 2012-2013 NHL regular season, and during that time the Company was unable to sell BAUER products to NHL teams or continue our NHL-related marketing efforts, reducing
30
the visibility of BAUER products. There was a resolution to the NHL lockout on January 12, 2013, but we cannot assure you there will not be another lockout or long term decrease in the popularity of the NHL or other professional hockey leagues or in the “on-ice” exposure of BAUER products, which may adversely affect player participation rates and our sales of ice hockey equipment and related apparel.
Likewise, our sales of baseball and softball, roller hockey and lacrosse equipment and related apparel depend on the popularity of these sports, professional and amateur participation, and brand exposure from league play which if negatively impacted could adversely affect our business and financial condition. If MLB, the NCAA or Little League Baseball were to experience a significant reduction in television coverage or any other significant decreases in either attendance at games or viewership (including, in the case of MLB, as a result of work stoppages), the visibility of our brands would decrease, which could adversely affect the sales of our baseball/softball and lacrosse equipment.
We can provide no assurance that we will be able to maintain our existing endorsements with professional athletes or relationships with these leagues in the future or that we will be able to attract new leagues or athletes to endorse our products. Larger companies with greater access to capital for athlete or league sponsorship may in the future increase the cost of sponsorship to levels we may choose not to match. If this were to occur, our athlete or league sponsors may terminate their relationships with us and endorse the products of our competitors and we may be unable to obtain endorsements from other comparable sponsors.
The value of our brands and sales of our products could be diminished if we, the athletes who use our products or the sports in which our products are used, are associated with negative publicity.
We sponsor a variety of athletes and feature those athletes in our advertising and marketing materials, and many athletes and teams use our products, including in connection with teams or leagues for which we are an official supplier. Actions taken by athletes, teams or leagues associated with our products that harm the reputations of those athletes, teams or leagues could also harm our brand image and result in a material decrease in our revenues, net income, and cash flows which could have an adverse effect on our financial condition and liquidity. We may also select athletes who are unable to perform at expected levels or who are not sufficiently marketable, which could also have an adverse effect on our business. If we are unable in the future to secure prominent athletes and arrange athlete endorsements of our products on terms we deem to be reasonable, we may be required to modify our marketing platform and to rely more heavily on other forms of marketing and promotion, which may not prove to be as effective or may result in additional costs. Also, union strikes or lockouts affecting professional play could negatively impact the popularity of the sport, which could have an adverse effect on our revenues from products used in that sport. Furthermore, negative publicity resulting from severe injuries or death occurring in the sports in which our products are used could negatively affect our reputation and result in restrictions, recalls or bans on the use of our products, whether or not such injuries or deaths are related to our products, and if the popularity of ice hockey, baseball and softball, or lacrosse (or other sports for which we design, manufacture and sell equipment and related apparel) among players and fans were to decrease due to these risks or the associated negative publicity, sales of our products could decrease and it could have an adverse impact on our revenues, profitability and operating results. We could become exposed to additional claims and litigation relating to the use of our products and our reputation may be adversely affected by such claims, whether or not successful or meritorious, including potential negative publicity about our products, which could adversely impact our business and financial condition.
Many of our products or components of our products are provided by a limited number of third-party suppliers and manufacturers and, because we have limited control over these parties, we may not be able to obtain quality products on a timely basis or in sufficient quantities.
We rely on a limited number of suppliers and manufacturers for many of our products and for many of the components in our products. During Fiscal 2015, approximately 95% of our manufactured products were sourced from international suppliers. In addition, a substantial portion of our products are manufactured by third-party manufacturers. During Fiscal 2015, the Company's four largest suppliers of inventory produced approximately 62% of our total inventory purchases.
If we experience significantly increased demand, or if, for any reason, we need to replace an existing manufacturer or supplier, there can be no assurance that additional supplies of raw materials or additional manufacturing capacity will be available when required on terms that are acceptable to us, or at all, or that any new supplier or manufacturer would allocate sufficient capacity to us in order to meet our requirements. In addition, should we decide to transition existing manufacturing between third-party manufacturers, the risk of such a problem could increase. For example, prior to our acquisition of Easton Baseball/Softball, the business experienced quality issues when the manufacturing of composite baseball and softball bats was outsourced, which led to an increase in returns of defective bats in 2008. The issue was successfully addressed by working with the supplier in Asia to improve process controls to allow for the identification and resolution of quality issues prior to products being sold into the marketplace. Even if we are able to expand existing or find new manufacturing sources, we may encounter delays in production and added costs as a result of the time it takes to train our suppliers and manufacturers in our methods, products and quality control
31
standards. Any material delays, interruption or increased costs in the supply of raw materials or manufacture of our products could have an adverse effect on our ability to meet customer demand for our products and result in lower revenues and net income both in the short and long term.
We have occasionally received, and may in the future receive, shipments of products that fail to conform to our quality control standards. In that event, unless we are able to obtain replacement products in a timely manner, we risk the loss of revenues resulting from the inability to sell those products and could incur related increased administrative and shipping costs, and there also could be a negative impact to our brands which could adversely impact our business and financial condition.
Problems with our distribution system could harm our ability to meet customer expectations, manage inventory, complete sales, and achieve objectives for operating efficiencies.
We rely on our distribution facility in Mississauga, Ontario, and on third-party logistics providers in Boras, Sweden, Romeoville, Illinois and Aurora, Illinois for substantially all of our hockey product distribution. We broadened our arrangement with the Romeoville, Illinois and the Aurora, Illinois third-party vendor to encompass the distribution of all U.S. ice hockey equipment, and may further broaden our arrangements with both third-party vendors for additional products, but there can be no assurance that we will be able to enter into an agreement with these third parties on acceptable terms. We rely on our facilities in Salt Lake City, Utah and a third-party logistics provider in Memphis, Tennessee for substantially all of our baseball and softball product distribution. We rely on our facility in Liverpool, New York for substantially all of our lacrosse helmet product distribution and we also distribute certain hockey helmets from this facility. Our distribution network includes computer processes and software that may be subject to a number of risks related to security or computer viruses, the proper operation of software and hardware, electronic or power interruptions or other system failures. We maintain business interruption insurance, but it may not adequately protect us from the adverse effects that could result from significant disruptions to our distribution system, such as the long-term loss of customers or an erosion of our brand image. Our distribution facilities include computer controlled and automated equipment, which means their operations are complicated and may be subject to a number of risks related to security or computer viruses, the proper operation of software and hardware, electronic or power interruptions or other system failures. In addition, because substantially all of our products are distributed from a few locations, our operations could also be interrupted by labour difficulties, or by floods, fires or other natural disasters near our distribution centers. In addition, our distribution capacity is dependent on the timely performance of services by third parties, including the shipping of our products to and from the Aurora, Illinois, Romeoville, Illinois, Boras, Sweden, Memphis, Tennessee, Salt Lake City, Utah, Mississauga, Ontario and Liverpool, New York distribution facilities. If we encounter problems with our distribution system, our ability to meet customer expectations, manage inventory, complete sales and achieve objectives for operating efficiencies could be harmed, which could adversely affect our business and financial condition.
The loss of one or more key customers could result in a material loss of revenues.
Our customers do not have any contractual obligations to purchase our products on a multi-season or multi-year basis. Our ten largest customers together accounted for approximately 37% of the Company’s sales in Fiscal 2015, with our top customer, Canadian Tire Corporation, Limited, accounting for approximately 10% of our sales. We face the risk that one or more of our key customers may not increase their business with us as much as we expect, may suffer from an economic downturn, may significantly decrease their business with us, may negotiate lower prices or may terminate their relationship with us altogether. The failure to increase our sales to these customers would have a negative impact on our growth prospects and any decrease or loss of these key customers’ business or lower gross margins as a result of negotiated lower prices could adversely affect our business and financial condition. In addition, our customers in the retail industry continue to experience consolidation and some may face financial difficulties from time to time. A large portion of our sales are to specialty and “big box” sporting goods retailers, certain of whom are not strongly capitalized. Adverse conditions in the sporting goods retail industry can adversely impact the ability of retailers to purchase our products, or could lead retailers to request credit terms that would adversely affect our cash flow and involve significant risks of non-payment. As a result, we may experience a loss of customers or the un-collectability of accounts receivable in excess of amounts against which we have reserved, which could adversely affect our business and financial condition.
The cost of raw materials could affect our operating results.
The materials used by us, our suppliers and our manufacturers involve raw materials, including carbon-fiber, aluminum, steel, resin and other petroleum-based products. Significant price fluctuations or shortages in petroleum or other raw materials, including the costs to transport such materials or finished products, the uncertainty of Asian currencies’ fluctuations against the U.S. dollar, increases in labour rates, and/or the introduction of new and expensive raw materials, could have an adverse effect on our cost of goods sold, results of operations and financial condition.
We are subject to numerous risks associated with doing business abroad, any one of which, if realized, could adversely affect
32
our business or financial condition.
Our business is subject to the risks generally associated with doing business abroad. We cannot predict the effect of various factors in the countries in which we sell our products or where our suppliers are located, including, among others: (i) economic trends in international markets; (ii) legal and regulatory changes and the burdens and costs of our compliance with a variety of laws, including trade restrictions and tariffs; (iii) difficulties in obtaining, enforcing, defending and protecting intellectual property rights; (iv) increases in transportation costs or delays; (v) work stoppages and labour strikes; (vi) increase and volatility in labour input costs; (vii) fluctuations in exchange rates; (viii) political unrest, terrorism and economic instability; and (ix) limitations on repatriation of earnings. If any of these or other factors were to render the conduct of our business in a particular country undesirable or impractical, our business and financial condition could be adversely affected. Should our current third-party manufacturers become incapable of meeting our manufacturing or supply requirements in a timely manner or cease doing business with us for any reason, our business and financial condition could be adversely affected.
A significant amount of our finished goods are purchased from international third-party suppliers, the majority of which are located in mainland China and Thailand. Most of what we purchase in Asia is finished goods rather than raw materials. We may increase our international sourcing in the future.
Any violation of our policies or any applicable laws and regulations by our suppliers, manufacturers or licensees could interrupt or otherwise disrupt our sourcing, adversely affect our reputation or damage our brand image. While we do not control these suppliers, manufacturers or licensees or their labour practices, negative publicity regarding the production methods of any of our suppliers, manufacturers or licensees could adversely affect our reputation and sales and force us to locate alternative suppliers, manufacturing sources or licensees, which could adversely affect our business and financial condition.
Another significant risk resulting from our international operations is compliance with the U.S. Foreign Corrupt Practices Act (“FCPA”), Canadian Corruption of Foreign Public Officials Act (“CFPOA”), and other anti-bribery laws applicable to our operations. In many foreign countries, particularly in those with developing economies, it may be a local custom that businesses operating in such countries engage in business practices that are prohibited by the FCPA, the CFPOA or other U.S., Canadian and foreign laws and regulations applicable to us. Although we have adopted policies designed to ensure compliance with the FCPA, the CFPOA and similar laws, there can be no assurance that all of our employees, agents and other channel partners, as well as those companies to which we outsource certain of our business operations, will not take actions in violation of our policies. Any such violation could have an adverse effect on our business and financial condition.
We may not be successful in our efforts to expand into international market segments.
We intend to expand into additional international markets, particularly Russia and other Eastern European countries (for ice hockey), Japan and other non-North American countries (for baseball and softball), and in Canada (for lacrosse), in order to grow our business. These expansion plans will require significant management attention and resources and may be unsuccessful. We have limited experience adapting our products to conform to local cultures, standards and policies, particularly in non-Western markets. In addition, to achieve satisfactory performance for consumers in international locations, it may be necessary to locate physical facilities, such as regional offices, in the foreign market. We may not be successful in expanding into any additional international markets or in generating revenues from foreign operations.
In addition to risks described elsewhere in this annual report on Form 10-K, our international sales and operations are subject to a number of risks, including:
• | economic and political conditions, including inflation, fluctuation in interest rates and currency exchange rates; |
• | government regulation and restrictive governmental actions (such as trade protection measures, including export duties and quotas and custom duties and tariffs), nationalization, measures protecting cultural industries, expropriation and restrictions on foreign ownership and/or corruption or criminal activity; |
• | restrictions on sales or distribution of certain products and uncertainty regarding enforcement and protection of intellectual property rights; |
• | business licensing or certification requirements; |
• | lower levels of consumer spending and fewer opportunities for growth compared to our existing markets; and |
• | geopolitical events, including unstable governments and legal systems, war, civil unrest, and terrorism. |
33
Adverse developments in any of these areas could adversely affect our business and financial condition.
Our results of operations may suffer if we are not able to accurately forecast demand for our products.
To reduce purchasing costs and ensure supply, we place orders with our suppliers in advance of the time period we expect to deliver our products. However, a large portion of our products are sold into consumer markets that are difficult to accurately forecast. If we fail to accurately forecast demand for our products, we may experience excess inventory levels or inventory shortages. Factors that could affect our ability to accurately forecast demand for our products include, among others:
• | changes in consumer demand for our products or the products of our competitors; |
• | new product introductions by our competitors; |
• | failure to accurately forecast consumer acceptance of our products; |
• | inability to realize revenues from booking orders; |
• | work stoppages or negative publicity associated with leagues or athletes we endorse; |
• | unanticipated changes in general market conditions or other factors, which may result in cancellations of advance orders or a reduction or increase in the rate of reorders placed by retailers; |
• | weakening of economic conditions or consumer confidence in future economic conditions, which could reduce demand for discretionary items, such as our products; |
• | terrorism or acts of war, or the threat thereof, which could adversely affect consumer confidence and spending or interrupt production and distribution of products and raw materials; |
• | abnormal weather pattern or extreme weather conditions including hurricanes, floods, etc., which may disrupt economic activity; and |
• | general economic conditions. |
Inventory levels in excess of consumer demand may result in inventory write-downs and the sale of excess inventory at discounted prices, which could significantly harm our operating results and impair the value of our brands. Inventory shortages may result in unfulfilled orders, negatively impact customer relationships, diminish brand loyalty and result in lost revenues, any of which could adversely affect our business and financial condition.
We are subject to product liability, warranty and recall claims, and our insurance coverage may not cover such claims.
Our products expose us to warranty claims and product liability claims in the event that products manufactured, sold or designed by us actually or allegedly fail to perform as expected, or the use of those products results, or is alleged to result, in personal injury, death or property damage. Further, we or one or more of our suppliers might not adhere to product safety requirements or quality control standards, and products may be shipped to retail partners before the issue is identified. In the event this occurs, we may have to recall our products to address performance, compliance, or other safety related issues. The financial costs we may incur in connection with these recalls typically would include the cost of the product being replaced or repaired and associated labour and administrative costs and, if applicable, governmental fines and/or penalties.
For example, in 2010, Bauer Hockey conducted a voluntary recall of approximately 130,000 youth hockey sticks in North America after we found that the paint on these sticks contained lead in excess of the regulatory limits established in Canada and the United States for children’s products. The manufacturer of these sticks assumed full responsibility for the costs incurred by us in connection with this recall, but there can be no assurance that the costs of any future recalls will not be borne, at least in part, by us. In 2012, the lacrosse division of Easton-Bell Sports, Inc. conducted a recall of the Easton “Raptor” lacrosse helmet. The chin bar on the subject helmet was determined to be susceptible to breakage, in which event the wearer would be exposed to a jaw or facial injury. The recall involved approximately 12,000 helmets, was initiated voluntarily, and was performed in conjunction with staff from the Consumer Product Safety Commission (“CPSC”). In March 2015, Bauer Hockey, in cooperation with the CPSC and Health Canada, voluntarily recalled approximately 2,500 goalie mask cages and replacement wires, after determining that the wires on the mask may break, creating a potential risk of facial injury.
34
Product recalls can harm our reputation and cause us to lose customers, particularly if those recalls cause consumers to question the safety or reliability of our products. Substantial costs incurred or lost sales caused by future product recalls could adversely affect our business and financial condition. Conversely, not issuing a recall or not issuing a recall on a timely basis can harm our reputation and cause us to lose customers for the same reasons as expressed above. Product recalls, withdrawals, repairs or replacements may also increase the amount of competition that we face.
We vigorously defend or attempt to settle all product liability cases brought against us. However, there is no assurance that we can successfully defend or settle all such cases. We believe that we are not currently subject to any material product liability claims not covered by insurance, although the ultimate outcome of these and future claims cannot presently be determined. Because product liability claims are part of the ordinary course of our business, we maintain product liability insurance which we currently believe is adequate. Our insurance policies provide coverage against claims resulting from alleged injuries arising from our products sustained during the respective policy periods, subject to policy terms and conditions. The primary portion of our product liability coverage is written under a policy expiring on June 1, 2016 with a primary limit of $5 million, and with a self-insured retention of $50,000 for all products, including helmets and soft goods. We have first umbrella coverage with a limit of $10 million above the primary layer and a second umbrella layer with a limit of $10 million, for a total of $20 million. The umbrella coverages expire on June 1, 2016. We also have first excess liability coverage, expiring on June 1, 2016, with a limit of $25 million above the umbrella layers, and a second excess layer with an additional limit of $25 million, also expiring on June 1, 2016, providing a total of $75 million of liability insurance. Management believes the insurance will be renewed on substantially similar terms upon its expiry but there can be no assurance that this coverage will be renewed or otherwise remain available in the future, that our insurers will be financially viable when payment of a claim is required, that the cost of such insurance will not increase, or that this insurance will ultimately prove to be adequate under our various policies. Furthermore, future rate increases might make insurance uneconomical for us to maintain. These potential insurance problems or any adverse outcome in any liability suit could create increased expenses which could harm our business. We are unable to predict the nature of product liability claims that may be made against us in the future with respect to injuries, diseases or other illnesses resulting from the use of our products or the materials incorporated in our products.
With regard to warranty claims, our actual product warranty obligations could materially differ from historical rates which would oblige us to revise our estimated warranty liability accordingly. Also, certain products sold by us, such as composite ice hockey sticks and aluminum and composite baseball bats, have a higher warranty expense than other products. Adverse determinations of material product liability and warranty claims made against us could have an adverse effect on our business and financial condition (including gross profit) and could harm the reputation of our brands.
We may not be able to successfully open and operate Own The Moment Hockey Experience retail stores, which could adversely affect our business and financial condition.
Our ability to successfully open and operate Own The Moment Hockey Experience retail stores as and when contemplated depends on many factors, including, among others, our ability to identify and secure suitable locations; negotiate acceptable lease terms; hire, train and retain store personnel with the appropriate expertise; immerse new store personnel into our corporate culture; stock sufficient inventory levels; and successfully integrate new stores into our existing company operations and information technology systems.
Our Own The Moment Hockey Experience retail stores will also generally be subject to the risks associated with operating in a retail environment, including, among others, the following: risks associated with leasing real estate as our Own The Moment Hockey Experience locations are, and will be, leased; changing customer demographics, which may result in the planned locations of our Own The Moment Hockey Experiences becoming less attractive; social or economic conditions where our Own The Moment Hockey Experience retail stores are expected to be located could decline in the future, thus resulting in potentially reduced sales at those locations; intense competition in the retail hockey equipment industry with the industry being fragmented with respect to product level and brand selection, price points, physical store formats, customer experience and service and location being the principal competitive factors; changing customer demands, shopping patterns or preferences with customers having a number of shopping alternatives, including e-commerce shopping alternatives; potential breaches of customer, employee or company data, which could attract a substantial amount of media attention, damage our customer relationships and reputation and result in lost sales, potential fines or lawsuits; and extreme or unseasonable weather conditions in the areas in which our Own The Moment Hockey Experience retail stores are expected to be located.
Furthermore, failure to design, integrate and/or execute our plans for our Own The Moment Hockey Experience retail stores may result in, among other things, incremental financial expenditures, loss of capital investment, divergence of management time and resources, potential disruption or impact on our relationship with existing retail partners and negative customer experiences and related impressions with our brand.
35
Our strategic initiatives are subject to numerous assumptions and factors, many of which are outside our control, and there are no assurances that such initiatives will be realized or on the anticipated timeline.
In order to operate our business, achieve our goals and remain competitive, the Company continuously seeks to identify and devise, invest in, implement and pursue strategic, business, technological and other important initiatives. These initiatives, including activities relating to their development and implementation, may be adversely impacted by a wide range of factors, many of which are beyond the Company’s control. Such factors include those relating to foreign exchange rates, labour issues or wage increases, liquidity, competition, cost of raw materials and commodities, unanticipated expenses, economic conditions (including inflationary risk), the performance of third parties (including suppliers), the implementation and integration of such initiatives into the Company’s other activities and processes as well as the adoption and acceptance of these initiatives by the Company’s customers, suppliers, employees and personnel.
In October 2014, the Company launched a profitability improvement initiative aimed at securing increased efficiency, product cost reductions, inventory quality improvements and improvements in the overall effectiveness of the Company’s supply chain, with the goal of realizing approximately $30 million of increased pre-tax profitability within five years (excluding certain non-recurring costs or one-time costs that may be required to implement some of these initiatives). Despite the Company’s plans and objectives, the Company may not be able to successfully achieve its target goal within the five year time period or fully realize the underlying objectives of its profitability improvement initiative, including those which seek to decrease costs, improve service levels throughout the Company’s supply chain or promote efficiencies.
The Company launched a cash flow improvement initiative that is targeting an improvement in net cash flow from working capital of $30 million in Fiscal 2016. Despite the Company’s plans and objectives, the Company may not be able to successfully achieve its target goal within Fiscal 2016 or fully realize the underlying objectives of its cash flow improvement initiative.
The Company’s profitability improvement initiative and cash flow improvement initiative are based on certain market conditions and other reasonable assumptions, estimates, analyses, beliefs and opinions of management, including, but not limited to certain macro-economic factors, such as currency rates, as well as labour, raw material and other input costs, which management believes to be relevant as of the date hereof, but are subject to inherent risks and uncertainties, which give rise to the possibility that the Company’s assumptions, estimates, analyses, beliefs and opinions may not be correct and that the Company’s expectations, goals and initiatives will not be achieved.
A delay or failure to sufficiently and successfully identify and devise, invest in or implement any of the Company’s strategic initiatives, including the profitability improvement initiative, could adversely affect the Company’s ability to operate its business, achieve its goals and remain competitive and could adversely affect our business and financial condition.
There can be no assurance that our third-party suppliers and manufacturers will continue to manufacture products that comply with all applicable laws and regulations.
The labeling, distribution, importation and sale of our products are subject to extensive regulation by various federal agencies, including the Competition Bureau (Industry Canada) in Canada, and the Federal Trade Commission, the CPSC, and state attorneys general in the United States, as well as by various other federal, state, provincial, local and international regulatory authorities in the countries in which our products are manufactured, distributed or sold. If we fail to comply with applicable regulations, we could become subject to significant penalties or claims, which could harm our results of operations or our ability to conduct our business. In addition, the adoption of new regulations or changes in the interpretation of existing regulations may result in significant compliance costs or discontinuation of product sales and may impair the marketing of our products, which could adversely affect our business and financial condition.
Our ability to source our merchandise profitably or at all could be affected if new trade restrictions are imposed or existing trade restrictions become more burdensome.
The United States and the countries in which our products are produced or sold internationally have imposed and may impose additional quotas, duties, tariffs, or other restrictions or regulations, or may adversely adjust prevailing quota, duty or tariff levels. For example, under the provisions of the World Trade Organization (“WTO”), Agreement on Textiles and Clothing, effective as of January 1, 2005, the United States and other WTO member countries eliminated quotas on textiles and apparel-related products from WTO member countries. In 2005, China’s exports into the United States surged as a result of the eliminated quotas. In response to the perceived disruption of the market, the United States imposed new quotas, which remained in place through the end of 2008, on certain categories of natural-fiber products that we import from China. These quotas were lifted on January 1, 2009. Countries impose, modify and remove tariffs and other trade restrictions in response to a diverse array of factors, including
36
global and national economic and political conditions, which make it impossible for us to predict future developments regarding tariffs and other trade restrictions. For example, although Canada cut its tariffs on hockey equipment in 2013, it is impossible for us to predict whether they will return in the future. Trade restrictions, including tariffs, quotas, embargoes, safeguards and customs restrictions, could increase the cost or reduce the supply of products available to us or may require us to modify our supply chain organization or other current business practices, any of which could adversely affect our business and financial condition.
If we lose the services of our CEO or other members of our team who possess specialized market knowledge and technical skills, it could reduce our ability to compete, to manage our operations effectively, or to develop new products and services.
Many of our team members have extensive experience in our industry and with our business, products, and customers. Since we are managed by a small group of senior executive officers, the loss of the technical knowledge, management expertise and knowledge of our operations of one or more members of our team, including Kevin Davis, our CEO, or Amir Rosenthal, our President, PSG Brands, and CFO, could result in a diversion of management resources, as the remaining members of management would need to cover the duties of any senior executive who leaves us and would need to spend time usually reserved for managing our business to search for, hire and train new members of management. The loss of some or all of our team could negatively affect our ability to develop and pursue our business strategy, and/or our ability to integrate recent acquisitions, which could adversely affect our business and financial condition. In addition, the market for key personnel in the industry in which we compete is highly competitive, and we may not be able to attract and retain key personnel with the skills and expertise necessary to manage our business. We do not maintain “key executive” life insurance.
Litigation may adversely affect our business and financial results.
Our business is subject to the risk of litigation by employees, customers, consumers, suppliers, competitors, shareholders, government agencies, or others through private actions, class actions, administrative proceedings, regulatory actions or other litigation. For example, on June 5, 2014, the Company received notice from the Canadian Competition Bureau that it had commenced an inquiry relating to certain representations allegedly made by Bauer Hockey Corp. in relation to the RE-AKT hockey helmet. The Company reached a settlement with the Canadian Competition Bureau in respect of its inquiry in November 2014. There can be no assurance that the Company will not be the subject of further regulatory inquiries in the future. The outcome of litigation, particularly class action lawsuits, regulatory actions and intellectual property claims, is difficult to assess or quantify. Plaintiffs in these types of lawsuits may seek recovery of very large or indeterminate amounts, and the magnitude of the potential loss relating to these lawsuits may remain unknown for substantial periods of time. In addition, certain of these proceedings, if decided adversely to us or settled by us, may result in liability material to our financial statements as a whole or may negatively affect our operating results if changes to our business operations are required. The cost to defend future litigation may be significant. There also may be adverse publicity associated with litigation that could negatively affect customer perception of our business or our products, regardless of whether the allegations are valid or whether we are ultimately found liable. As a result, litigation may adversely affect our business and financial condition.
We may be subject to certain class action lawsuits, which could result in negative publicity and, if decided against us, could require us to pay substantial judgments, settlements or other penalties.
In addition to being subject to litigation in the ordinary course of business, in the future, we may be subject to certain class action lawsuits. We expect that this type of litigation may be time consuming, expensive and distracting from the conduct of our daily business. It is possible that we will be required to pay substantial judgments, settlements or other penalties and incur expenses that could have an adverse effect on our operating results, liquidity or financial position. Expenses incurred in connection with these lawsuits, which include substantial fees of lawyers and other professional advisors and our obligations to indemnify officers and directors who may be parties to such actions, could adversely affect our operating results, liquidity or financial position. We do not know if any of this type of litigation and resulting expenses will be covered by insurance. In addition, these lawsuits may cause our insurance premiums to increase in future periods. For example, certain sports equipment manufacturers are currently subject to ongoing class action lawsuits. The Company and Cascade are defending two putative class action lawsuits (one filed in Pennsylvania and the other filed in Connecticut) on behalf of purchasers of the CASCADE R helmet model, in each case with allegations and claims arising in connection with NOCSAE’s decertification of the helmet in November 2014. There can be no assurance that the Company will be able to prevail in, or achieve a favorable settlement of, this litigation or any other class action lawsuits that may arise in the future. There also may be adverse publicity associated with class action lawsuits that could negatively affect customer perception of the sports in which our products are used or of our business, regardless of whether the allegations are valid or whether we are ultimately found liable.
Employment-related matters, such as unionization, may affect our profitability or reputation.
As of May 31, 2015, 88 of our 872 employees were unionized. Although we have good labour relations with these
37
unionized employees, we have little control over union activities and could face difficulties in the future. Our collective bargaining agreement with a union in Mississauga, Ontario, covering 54 employees, expires on July 6, 2017. Our collective bargaining agreement with a union at our R&D and manufacturing facility in Blainville, Québec, covering 32 employees, expires on November 30, 2017. Labour organizing activities could result in additional employees becoming unionized. We can provide no assurance that we will be able to negotiate new collective bargaining agreements on similar or more favorable terms or that we will not experience work stoppages or other labour problems in the future at our unionized and non-union facilities. We could experience a disruption of our operations or higher ongoing labour costs, which could adversely affect our business and financial condition.
In addition, labour disputes at our suppliers or manufacturers create significant risks for our business, particularly if these disputes result in work slowdowns, lockouts, strikes or other disruptions during our peak importing or manufacturing seasons, and could have an adverse effect on our business, potentially resulting in canceled orders by customers, unanticipated inventory accumulation or shortages, and reduced revenues and net income.
Further, any negative publicity associated with actions by any of our employees, whether during the course of employment or otherwise, could negatively affect our reputation, which could adversely affect our business and financial condition.
If we experience significant disruptions in our information technology systems, our business and financial results may be adversely affected.
We depend on our information technology systems for the efficient functioning of our business, including accounting, data storage, customer order processing, retail, marketing, social media, internal/external communication, purchasing and inventory management. Our software solutions are intended to enable management to better and more efficiently conduct our operations and gather, analyze, and assess information across all business segments and geographic locations. However, difficulties with the hardware and software platform could disrupt our operations, including our ability to timely ship and track product orders, project inventory requirements, manage our supply chain, and otherwise adequately service our customers, which would have an adverse effect on our business and financial condition. In addition, despite the Company’s implementation of security measures, its systems, are vulnerable to damages from computer viruses, unauthorized access, cyberattack and other similar disruptions. In the event we experience significant disruptions with our information technology system, we may not be able to fix our systems in an efficient and timely manner. These risks are greater with increased information transmission over the Internet and the increasing level of sophistication posed by cyber criminals. If a person penetrates the Company’s network security or otherwise misappropriates sensitive data, the Company could be subject to liability, there could be a loss of confidence in the Company’s ability to serve its clients or the Company’s business could be interrupted, and any of these developments could have a material adverse effect on the Company’s business, results of operations and financial condition. Costs associated with potential interruptions to our information systems could be significant.
In addition, as these threats continue to evolve, we may be required to invest significant additional resources to modify and enhance our information security and controls or to investigate and remediate any security vulnerabilities. Although none of the threats that have been encountered to date have substantially impacted our business, the impact of a significant event could have a material adverse effect on the Company’s business and financial condition.
We may be subject to potential environmental liability.
We are subject to many federal, state, provincial, and local requirements relating to the protection of the environment, and we have made and will continue to make expenditures to comply with such requirements. Past and present manufacturing operations subject us to environmental laws and regulations that regulate the use, handling and contracting for disposal or recycling of hazardous or toxic substances, the discharge of pollutants into the air and the discharge of wastewaters. If environmental laws and regulations become more stringent, our capital expenditures and costs for environmental compliance could increase. Under applicable environmental laws we may also be liable for the remediation of contaminated properties, including properties currently or previously owned, operated or acquired by us and properties where wastes generated by our operations were disposed. Such liability can be imposed regardless of whether we were responsible for creating the contamination. However, due to the possibility of unanticipated factual or regulatory developments, the amount and timing of future environmental expenditures could vary substantially from those currently anticipated and could have an adverse effect on our business and financial condition.
The ability to operate our business will be limited by restrictive covenants contained in the Credit Facilities.
The Credit Facilities contain restrictive financial and other covenants which affect and, in some cases, significantly limit or prohibit, among other things, the manner in which we may structure or operate our business, including by reducing our liquidity, limiting our ability to incur indebtedness, create liens, sell assets, pay dividends, make capital expenditures, be subject to a change
38
of control, and engage in acquisitions, mergers or restructurings. Future financings and other major agreements may also be subject to similar covenants which limit our operating and financial flexibility, which could have an adverse effect on our business and financial condition.
Our failure to comply with our contractual obligations (including restrictive, financial and other covenants) or to pay our indebtedness and fixed costs could result in a variety of material adverse consequences, including the acceleration of our indebtedness and the exercise of remedies by our creditors, and such defaults could trigger additional defaults under other indebtedness or agreements. In such a situation, it is unlikely that we would be able to repay the accelerated indebtedness or fulfill our obligations under certain contracts, or otherwise cover our fixed costs. Also, the lenders could foreclose upon all or substantially all of our assets which secure our obligations.
We have a substantial amount of indebtedness which may adversely affect our cash flow and our ability to operate our business.
As a result of the Easton Baseball/Softball Acquisition, we have a significant amount of debt which could adversely affect our ability to raise additional capital to fund our operations, limit our ability to react to changes in the economy or our industry, and prevent us from meeting our debt obligations.
In order to finance the Easton Baseball/Softball Acquisition and refinance our former credit facilities, we incurred $44.4 million of revolving debt under the New ABL Facility and $450.0 million of term debt under the New Term Loan Facility due in 2021. The term debt was reduced by approximately $119.5 million after applying the net proceeds of the U.S. IPO. The amount of debt under our Credit Facilities also includes $16.8 million of financing costs which we are amortizing over the life of the Credit Facilities and finance lease obligations of $0.3 million. Our degree of leverage could have important consequences, including the following:
• | a substantial portion of our cash flows from operations will be dedicated to the payment of principal and interest on our indebtedness and other financial obligations and will not be available for other purposes, including funding our operations, growth strategies and capital expenditures for projects such as a new warehouse or distribution center, new R&D facility, and future business opportunities; |
• | the debt service requirements of our other indebtedness and lease expense could make it more difficult for us to make payments on our debt; |
• | our ability to obtain additional financing for future acquisitions, working capital and general corporate or other purposes may be limited; |
• | certain of our borrowings under the Credit Facilities are at variable rates of interest, exposing us to the risk of increased interest rates; |
• | our debt level may limit our flexibility in planning for, or reacting to, changes in our business and in our industry in general, placing us at a competitive disadvantage compared to our competitors that have less debt; |
• | our leverage may make us vulnerable to a downturn in general economic conditions and adverse industry conditions; and |
• | changes in interest rates could materially and adversely affect our cash flows and results from operations. Our financing includes long-term debt under the New Term Loan Facility and revolving debt under the New ABL Facility that bears interest based on floating market rates. Changes in these rates result in fluctuation in the required cash flow to service this debt and could adversely affect our business and financial condition. |
Despite our substantial indebtedness level, we will still be able to incur significant additional amounts of debt, which could further exacerbate the risks associated with our substantial indebtedness.
We may be able to incur substantial additional indebtedness in the future. Although the Credit Facilities contain restrictions on the incurrence of additional indebtedness, such restrictions are subject to a number of qualifications and exceptions, and under certain circumstances, incurrence of indebtedness in accordance with such restrictions could be substantial. Under the Credit Facilities and our current debt instruments we have the flexibility to incur indebtedness in the future. If our current debt levels are increased, the related risks that we now face could intensify.
39
Our business could suffer if we are unsuccessful in making, integrating, and maintaining acquisitions and investments.
One of our growth strategies is to continue to pursue strategic acquisitions of new or complementary businesses, products or technologies. There can be no assurance that we would be able to expand our efforts and operations in a cost-effective, accretive or timely manner or that any such efforts would increase overall market acceptance. Further, given our current level of market share in the hockey and baseball/softball equipment segments, respectively, any acquisitions or investments may be subject to regulatory approval, and there can be no assurance that such approval would be received, whether in a timely manner or at all.
Furthermore, any new businesses or products acquired by us that were not favorably received by consumers could damage our reputation or our existing brands. The lack of market acceptance of such businesses or products or our inability to generate satisfactory revenues from such businesses or products to offset their cost could have an adverse effect on our business and financial condition.
We have recently acquired and invested in a number of companies and we may acquire or invest in or enter into joint ventures with additional companies. These transactions create risks such as:
• | disruption of our ongoing business, including loss of management focus on existing businesses; |
• | problems retaining key personnel; |
• | additional operating losses and expenses of the businesses we acquired or in which we invested; |
• | the potential impairment of tangible assets, intangible assets and goodwill acquired in the acquisitions; |
• | the potential impairment of customer and other relationships of a company we acquired or in which we invested or our own customers as a result of any integration of operations; |
• | the difficulty of incorporating acquired businesses and unanticipated expenses related to such integration; |
• | the difficulty of integrating a new company’s accounting, financial reporting, management, information, human resource and other administrative systems to permit effective management, and the lack of control if such integration is delayed or not implemented; |
• | the difficulty of implementing at a company we acquire the controls, procedures and policies appropriate for a public company; |
• | potential environmental liabilities; |
• | potential unknown liabilities associated with a company we acquire or in which we invest; and |
• | for foreign transactions, additional risks related to the integration of operations across different cultures and languages, and the economic, political, and regulatory risks associated with specific countries. |
While we believe that the operations of the Company and our recently acquired companies can be successfully integrated, there can be no assurance that this will be the case. We could face impediments in our ability to implement our integration strategy. In addition, there can be no assurance that unforeseen costs and expenses or other factors will not offset, in whole or in part, the expected benefits of our integration and operating plans. Further, the integration may require substantial attention from, and place substantial demands upon, our senior management, as well as requiring the cooperation of our employees and those employees of the acquired businesses. Moreover, there can be no assurance that our customers and suppliers will look upon the acquisitions favorably. Failure to successfully integrate the operations of the Company and any of the acquired businesses could adversely affect our business and financial condition.
As a result of future acquisitions or mergers, we might need to issue additional equity securities, spend our cash, or incur additional debt, contingent liabilities, or amortization expenses related to intangible assets, any of which could reduce our profitability and harm our business. In addition, valuations supporting our acquisitions and strategic investments could change rapidly given the current global economic climate and the inherent uncertainty involved in such matters. We could determine that such valuations have experienced impairments or other-than-temporary declines in fair value which could adversely impact our business and financial condition.
40
Acquisitions and investment also increase the complexity of our business and places significant strain on our management, personnel, operations, supply chain, financial resources, and internal financial control and reporting functions. We may not be able to manage growth effectively, which could damage our reputation, limit our growth and adversely affect our business and financial condition.
The successful integration and management of integrating the businesses involves numerous risks that could adversely affect our growth and profitability, including: (i) the risk that management may not be able to successfully manage the acquired business’ operations and the integration may place significant demands on management, diverting their attention from existing operations; (ii) the risk that our operational, financial and management systems may be incompatible with or inadequate to effectively integrate and manage acquired systems; (iii) the risk that an acquisition may require substantial financial resources that could otherwise be used in the development of other aspects of our business; and (iv) the risk that customers and suppliers may not be retained following an acquisition, which could be significant to our operations. The successful integration of Easton Baseball/Softball is also subject to the risk that personnel from Easton Baseball/Softball and our existing business may not be able to work together successfully, which could affect the operations of the combined business. There can be no assurance that we will be successful in integrating an acquired business’ operations or that the expected benefits will be realized. There is a risk that some or all of the expected benefits of any acquisition will fail to materialize or may not occur within the time periods anticipated.
We continue to evaluate our estimates of cost synergies to be realized from our acquisitions and refine them. Actual cost synergies, the expenses required to realize the cost synergies and the sources of the cost synergies could differ materially from our internal estimates, and we cannot assure you that we will achieve the full amount of such cost synergies on the schedule anticipated or at all or that these cost synergy programs will not have other adverse effects on our business. In light of these significant uncertainties, you should not place undue reliance on our estimated cost synergies.
We may not realize the growth opportunities that are anticipated from the Easton Baseball/Softball Acquisition.
The benefits we expect to achieve as a result of the Easton Baseball/Softball Acquisition will depend, in part, on our ability to realize anticipated growth opportunities. Our success in realizing these growth opportunities, and the timing of this realization, depends on the successful integration of Easton Baseball/Softball operations with our business and operations. Even if we are able to integrate these businesses and operations successfully, this integration may not result in the realization of the full benefits of the growth opportunities we currently expect within the anticipated time frame or at all. While we anticipate that certain expenses will be incurred, such expenses are difficult to estimate accurately and may exceed current estimates. Accordingly, the benefits from the Easton Baseball/Softball Acquisition may be offset by unexpected costs incurred or delays in integrating the companies, which could cause our profit assumptions to be inaccurate.
There may be undisclosed liabilities related to the acquired businesses.
Although we have conducted what we believe to be a prudent and thorough level of investigation in connection with each of our recent acquisitions, an unavoidable level of risk remains regarding any undisclosed or unknown liabilities of the acquired businesses. Following each of the acquisitions, we may discover that we have acquired substantial undisclosed liabilities. In addition, we may be unable to retain the acquired businesses’ customers or employees or third parties may attempt to infringe the acquired businesses’ intellectual property or claim that the acquired businesses’ products infringe such third party’s intellectual property. Only certain of these events may entitle us to claim indemnification from the seller of the acquired business under the relevant purchase agreement. In addition, even if indemnification is available it may not offset such liabilities. The existence of undisclosed liabilities, our inability to retain customers or employees, our inability to enforce, protect and defend intellectual property, including proprietary trade secrets and know how, or defend claims for infringement or misappropriation of trade secrets or know how, or the inability to claim indemnification all or in part from each of the sellers of the acquired businesses could adversely affect our business and financial condition.
The market price for the Common Shares may be volatile and subject to wide fluctuations.
The market price for the Common Shares may be volatile and subject to fluctuation in response to numerous factors, many of which are beyond the Company’s control, including the following:
• | actual or anticipated fluctuations in the Company’s quarterly results of operations; |
• | changes in estimates of our future results of operations by us or securities research analysts; |
• | changes in the economic performance or market valuations of other companies that investors deem comparable to the Company; |
41
• | addition or departure of the Company’s executive officers and other key personnel; |
• | release or other transfer restrictions on outstanding Common Shares; |
• | sales or perceived sales of additional Common Shares; |
• | significant acquisitions or business combinations, strategic partnerships, joint ventures or capital commitments by or involving the Company or its competitors; and |
• | news reports relating to trends, concerns or competitive developments, regulatory changes and other related issues in the Company’s industry or target markets. |
Financial markets continue to experience significant price and volume fluctuations that have particularly affected the market prices of equity securities of companies and that have, in many cases, been unrelated to the operating performance, underlying asset values or prospects of such companies. Accordingly, the market price of the Common Shares may decline even if the Company’s operating results, underlying asset values or prospects have not changed. Additionally, these factors, as well as other related factors, may cause decreases in asset values that are deemed to be other than temporary, which may result in impairment losses. As well, certain institutional investors may base their investment decisions on consideration of the Company’s environmental, governance, diversity and social practices and performance against such institutions’ respective investment guidelines and criteria, and failure to meet such criteria may result in limited or no investment in the Common Shares by those institutions, which could adversely affect the trading price of the Common Shares. There can be no assurance that continuing fluctuations in price and volume will not occur. If such increased levels of volatility and market turmoil continue, the Company’s business and financial condition could be adversely impacted and the trading price of the Common Shares may be adversely affected.
The Common Shares are listed on the NYSE and the Toronto Stock Exchange (“TSX”). Volatility in the market prices of the Common Shares may increase as a result of the Common Shares being listed on both the NYSE and the TSX because trading is split between the two markets, resulting in less liquidity on both exchanges. In addition, different liquidity levels, volume of trading, currencies and market conditions on the two exchanges may result in different prevailing trading prices.
Securities class action litigation often has been brought against companies following periods of volatility in the market price of their securities. We may in the future be the target of similar litigation. Securities litigation could result in substantial costs and damages and divert management’s attention and resources, which could adversely affect our business. Any adverse determination in litigation against us could also subject us to significant liabilities.
We may require additional capital in the future and we cannot give any assurance that such capital will be available at all or available on terms acceptable to us and, if it is available, additional capital raised by us may dilute holders of the Company’s Common Shares.
We may need to raise additional funds through public or private debt or equity financings in order to:
• | fund ongoing operations; |
• | take advantage of opportunities, including more rapid expansion of our business or the acquisition of complementary products, technologies or businesses; |
• | develop new products; or |
• | respond to competitive pressures. |
Any additional capital raised through the sale of equity will dilute the percentage ownership of holders of the Company’s Common Shares. Capital raised through debt financing would require us to make periodic interest payments and may impose restrictive covenants on the conduct of our business. Furthermore, additional financings may not be available on terms favorable to us, or at all. Our failure to obtain additional funding could prevent us from making expenditures that may be required to grow our business or maintain our operations.
42
As a result of the loss of our foreign private issuer status, we are now required to comply with the Exchange Act’s domestic reporting regime, which may cause us to incur additional legal, accounting and other expenses.
As of November 28, 2014, we determined that we no longer qualify as a “foreign private issuer” as such term is defined in Rule 405 under the Securities Act, which means that we are required to comply with all of the periodic disclosure and current reporting requirements of the Exchange Act applicable to U.S. domestic issuers, such as Forms 10-K, 10-Q and 8-K, rather than the forms we have filed with the SEC in the past as a foreign private issuer, such as Forms 40-F and 6-K. We are accordingly required to prepare our financial statements filed with the SEC in accordance with generally accepted accounting principles in the United States (“U.S. GAAP”) (and must recast prior financial statements and selected financial data from the International Financial Reporting Standards (“IFRS”) into U.S. GAAP for all periods required to be presented in the financial statements). As of June 1, 2015, we have also been required to comply with the provisions of U.S. securities laws applicable to U.S. domestic issuers including, without limitation, the U.S. proxy rules, Regulation FD and the Section 16 beneficial ownership reporting and short swing profit rules. We have modified certain of our policies to comply with good governance practices associated with U.S. domestic issuers. In addition, we have lost our ability to rely upon exemptions from certain corporate governance requirements on the NYSE that are available to foreign private issuers.
As a result of such compliance with these additional securities laws, including the transition from IFRS to U.S. GAAP, as well as NYSE rules applicable to U.S. domestic issuers, the regulatory and compliance costs to us under U.S. securities laws may be significantly higher than the cost we would incur as a foreign private issuer and, therefore, we expect that the loss of foreign private issuer status will increase our legal and financial compliance costs and make some activities highly time-consuming and costly and that the costs associated with compliance will increase further once we are no longer an emerging growth company.
The IRS may assert that a certain acquisition is an inversion transaction.
In certain circumstances, a U.S. corporation that is acquired by a non-U.S. corporation may be required to recognize certain taxable income, or the new foreign parent corporation may be treated as a U.S. corporation for U.S. federal income tax purposes (“inversion transactions”). If the Company were treated as a U.S. corporation for U.S. federal income tax purposes, the Company and its shareholders (“Shareholders”) that are not U.S. holders could be subject to adverse tax consequences. The Company believes, based on the facts and circumstances of the acquisition of the Bauer Hockey Business at the time of the Company’s initial public offering of Common Shares on the TSX completed on March 10, 2011 (the “Canadian IPO”) and the Company’s operations that such acquisition was not an inversion transaction, but there can be no assurance that the Internal Revenue Service (the “IRS”) will not challenge this conclusion.
We do not currently intend to pay dividends on our Common Shares.
We currently intend to retain future earnings, if any, for future operation, expansion and debt repayment. Any decision to declare and pay dividends on our Common Shares in the future will be made at the discretion of the board of directors of the Company (the “Board of Directors”) and will depend on, among other things, our financial results, cash requirements, contractual restrictions and other factors that our Board of Directors may deem relevant. In addition, our ability to pay dividends may be limited by covenants of any existing and future outstanding indebtedness we incur, including the Credit Facilities. As a result, Shareholders may not receive any return on an investment in the Common Shares in the foreseeable future unless their Common Shares are sold for a price greater than that which was paid for it. See “Dividends”.
We are a holding company.
We are a holding company and a substantial portion of our assets are the capital stock of our subsidiaries. As a result, investors in the Company are subject to the risks attributable to our subsidiaries. As a holding company, we conduct substantially all of our business through our subsidiaries, which generate substantially all of our revenues. Consequently, the Company’s cash flows and ability to complete current or desirable future corporate initiatives are dependent on the earnings of its subsidiaries and the distribution of those earnings to the Company. The ability of these entities to pay dividends and other distributions will depend on their operating results and will be subject to applicable laws and regulations which require that solvency and capital standards be maintained by such companies and contractual restrictions contained in the instruments governing their debt. In the event of a bankruptcy, liquidation or reorganization of any of our subsidiaries, holders of indebtedness and trade creditors will generally be entitled to payment of their claims from the assets of those subsidiaries before any assets are made available for distribution to the Company. The Common Shares are effectively junior to indebtedness and other liabilities (including trade payables) of our subsidiaries.
43
An investor may be unable to bring actions or enforce judgments against us and certain of our directors.
The Company is incorporated under the laws of the Province of British Columbia. Some of our directors reside principally outside of the United States and a portion of our assets and a substantial portion of the assets of these persons are located outside the United States. Consequently, it may not be possible for an investor to effect service of process within the United States on us or those persons. Furthermore, it may not be possible for an investor to enforce judgments obtained in United States courts based upon the civil liability provisions of United States federal securities laws or other laws of the United States against us or those persons.
Risks Related to Macroeconomic Environment
Fluctuations in the value of the Canadian dollar and the U.S. dollar in relation to each other and other world currencies may impact our operating and financial results and may affect the comparability of our results between financial periods.
We are exposed to market risks attributable to fluctuations in foreign currency exchange rates, primarily changes in the value of the U.S. dollar versus other currencies such as the Canadian dollar, the euro and the Swedish krona. Exchange rate fluctuations could have an adverse effect on our results of operations. We conduct business in many geographic markets. For example, most of our supply purchases are in U.S. dollars, and historically approximately one-third of our revenues have been in Canadian dollars, and approximately 3% and 2% of our revenues have been in Swedish krona and euro, respectively. Therefore, a fluctuation in the exchange rate of the U.S. dollar versus other currencies such as the Canadian dollar, the euro and the Swedish krona, could materially affect our gross profit margins and operating results. We have entered into various arrangements to mitigate our foreign currency risk, but there can be no assurances that such arrangements will prove to be favorable to the Company.
Our consolidated financial statements are presented in accordance with U.S. GAAP, and we report, and will continue to report, our results in U.S. dollars. Some of our operations are conducted by subsidiaries in Canada or other countries outside of the United States. The results of operations and the financial position of these subsidiaries are reported in the relevant foreign currencies and then translated into U.S. dollars. Any change in the value of the Canadian dollar or of the currencies in the other markets in which we operate against the U.S. dollar during a given financial reporting period would result in a foreign currency loss or gain on the translation of U.S. dollar denominated revenues and costs. The exchange rates between many of the currencies in the other markets in which we operate against the U.S. dollar have fluctuated significantly in recent years and may fluctuate significantly in the future. Consequently, our reported earnings could fluctuate materially as a result of foreign exchange translation gains or losses and may not be comparable from period to period.
In addition, the value of a U.S. Shareholder’s investment in us will fluctuate as the U.S. dollar rises and falls against the Canadian dollar. Also, if we pay dividends in the future, we may pay those dividends in Canadian dollars. In that case, and if the U.S. dollar rises in value relative to the Canadian dollar, the U.S. dollar value of the dividend payments received by U.S. Shareholders would be less than they would have been if exchange rates were stable.
The Company employs a hedging strategy that can include foreign currency forwards, interest rate contracts, and foreign exchange swaps as economic hedges. Currency hedging entails a risk of illiquidity and the risk of using hedges could result in losses greater than if the hedging had not been used. Hedging arrangements may have the effect of limiting or reducing the total returns to the Company if purchases at hedged rates result in lower margins than otherwise earned if purchases had been made at spot rates. In addition, the costs associated with a hedging program may outweigh the benefits of the arrangements in such circumstances.
An economic downturn or economic uncertainty in our key markets may adversely affect consumer discretionary spending and reduce sales of our products.
We sell recreational, non-essential products. The success of our business depends to a significant extent upon discretionary consumer spending. Factors affecting the level of consumer spending for such discretionary items include general economic conditions affecting disposable consumer income, particularly those in North America, and other factors such as consumer confidence in future economic conditions, fears of recession, the availability of consumer credit, levels of unemployment, tax rates and the cost of consumer credit. As global economic conditions continue to be volatile or economic uncertainty remains, trends in consumer discretionary spending also remain unpredictable and subject to reductions due to credit constraints and uncertainties about the future. The current volatility in the United States economy in particular has resulted in an overall slowing in growth in the retail sector because of decreased consumer spending, which may remain depressed for the foreseeable future. These unfavorable economic conditions may lead consumers to delay or reduce purchases of discretionary items including our sporting equipment and related apparel. Consumer demand for our products may not reach our sales targets, or may decline, when there is an economic downturn or economic uncertainty in our key markets, particularly in North America. Our sensitivity to
44
economic cycles and any related fluctuation in consumer demand could adversely affect our business and financial condition. Anticipating and forecasting such changes in discretionary consumer spending is difficult and cannot be done with certainty. We use internal forecasts to plan and make important decisions relating to our business, however these forecasts may prove to be incorrect and this can lead to negative economic consequences for the business.
Changes in tax laws and unanticipated tax liabilities could adversely affect our effective income tax rate and profitability.
We are subject to income taxes in Canada, the United States, and numerous foreign jurisdictions. Our effective income tax rate in the future could be adversely affected by a number of factors, including changes in the mix of earnings in countries with differing statutory tax rates, changes in the valuation of deferred tax assets and liabilities, changes in tax laws, and the outcome of income tax audits in various jurisdictions around the world. We regularly assess all of these matters to determine the adequacy of our tax provision, which is subject to discretion. If our assessments are incorrect, it could have an adverse effect on our business and financial condition.
Changes in import/export tariff rates on our products may have an impact on our profitability. For example, on March 21, 2013, the Canadian government announced that it would reduce import tariffs on certain hockey equipment effective as of April 1, 2013 (“Canadian Tariff Reduction”). Prior to April 1, 2013, the Company’s tariffs on hockey equipment imported into Canada were up to 18.0% and were included in the Company’s cost of goods sold. Retroactive to April 1, 2013, Bauer Hockey reduced wholesale prices to its Canadian retail partners to reflect the lower duties on certain categories of hockey equipment. The reduced wholesale prices on affected products had a limited impact on future profitability, as the reduction in the costs of goods sold was passed on to retailers. We also reduced wholesale prices on products affected by the Canadian Tariff Reduction that were imported prior to April 1, 2013. The total amount of import tariffs paid on products imported prior to April 1, 2013 was $1.6 million, of which $1.1 million was recognized in the twelve months ended May 31, 2014. Although the Company was able to minimize the impact of the reduction of certain import tariffs on certain hockey equipment, any future change in tariffs could have an adverse effect on our business and financial condition.
Natural disasters, unusual weather, pandemic outbreaks, boycotts and geo-political events or acts of terrorism could adversely affect our operations and financial results.
The occurrence of one or more natural disasters, such as hurricanes, floods and earthquakes, unusually adverse weather, pandemic outbreaks, boycotts and geo-political events, such as civil unrest in countries in which our suppliers are located and acts of terrorism, or similar disruptions could adversely affect our operations and financial results. These events could result in physical damage to one or more of our properties, increases in fuel or other energy prices, the temporary or permanent closure of one or more of our warehouses or distribution centers, the temporary lack of an adequate workforce in a market, the temporary or long-term disruption in the supply of products from some local and overseas suppliers, the temporary disruption in the transport of goods from overseas, delay in the delivery of goods to our warehouses and distribution centers, and disruption to our information systems. These factors could otherwise disrupt our operations and could have an adverse effect on our business and financial condition.
Item 1B. | UNRESOLVED STAFF COMMENTS |
Not applicable.
45
Item 2. | PROPERTIES |
Facilities
Our sales and distribution offices are located worldwide, as shown in the table below as of May 31, 2015:
Location | Type | Facility Size (Approx. Sq. Ft.) | Leased/Owned | Expiration | ||||
Exeter, New Hampshire | Global Headquarters | 55,000 | Leased | April 30, 2023 | ||||
Blainville, Quebec | Hockey and Lacrosse - R&D and manufacturing | 98,000 | Leased | February 28, 2030 | ||||
Mississauga, Ontario | Hockey - Sales, marketing and distribution | 145,000 | Leased | September 30, 2016 | ||||
Vantaa, Finland | Hockey - Sales | 4,600 | Leased | May 31, 2016 | ||||
Gothenburg, Sweden | Hockey - Sales, administration and marketing | 8,700 | Leased | September 30, 2019 | ||||
Rosenheim, Germany | Hockey - Sales and marketing | 3,800 | Leased | May 31, 2018 | ||||
Taichung, Taiwan | Asia sourcing | 10,000 | Leased | May 15, 2017 | ||||
Irvine, California | Roller hockey - Sales and marketing | 3,900 | Leased | December 31, 2015 | ||||
New York, New York | Lacrosse - Sales and marketing | 6,000 | Leased | March 31, 2016 | ||||
Liverpool, New York | Lacrosse and hockey - All functions | 72,000 | Leased | May 31, 2016 | ||||
Toronto, Ontario | Apparel - All functions | 40,000 | Leased | January 6, 2017 | ||||
Kent, Washington | Baseball/Softball - Sales, marketing, distribution and administration | 13,600 | Leased | December 31, 2015 | ||||
Ottawa, Ontario | Baseball/Softball - All functions | 18,000 | Leased | January 31, 2019 | ||||
Salt Lake City, Utah | Baseball/Softball and Hockey - Distribution | 140,000 | Leased | November 30, 2017 | ||||
Van Nuys, California | Baseball/Softball - All functions | 54,000 | Leased | January 31, 2016 | ||||
Bentonville, Arkansas | Baseball/Softball - Showroom | 820 | Leased | April 14, 2017 | ||||
Burlington, Massachusetts | Hockey Retail Store | 25,000 | Leased | July 31, 2025 | ||||
Bloomington, Minnesota | Hockey Retail Store | 33,000 | Leased | January 31, 2024 | ||||
Item 3. | LEGAL PROCEEDINGS |
We are from time to time involved in legal proceedings and regulatory actions of a nature considered to be in the ordinary course of business. See “Item 1A-Risk Factors - Litigation may adversely affect our business and financial results.”
We believe that none of the legal proceedings or regulatory actions in which we are currently involved, or have been involved since the beginning of the most recently completed fiscal year, individually or in the aggregate, are material to, or exceed in value 10% of the current assets of, the Company.
Item 4. | MINE SAFETY DISCLOSURES |
None.
46
PART II
Item 5. | Market for Registrant's Common Equity, Related Stockholder Matters and Issuer Purchases of Equity Securities |
Market Information
Our Common Shares trade on the NYSE and on the TSX under the symbol PSG. The table below sets forth the high and low closing sale prices of the Common Shares on each of the NYSE and the TSX for the periods indicated.
NYSE | TSX (Cdn$) | ||||||||||||||
High | Low | High | Low | ||||||||||||
Fiscal Year Ending May 31, 2015 | |||||||||||||||
Fourth quarter | $ | 21.65 | $ | 18.41 | $ | 25.91 | $ | 23.32 | |||||||
Third quarter | 19.96 | 17.49 | 24.35 | 20.20 | |||||||||||
Second quarter | 17.97 | 15.96 | 20.93 | 17.91 | |||||||||||
First quarter | 17.33 | 14.21 | 18.90 | 15.49 | |||||||||||
Fiscal Year Ending May 31, 2014 | |||||||||||||||
Fourth quarter | N/A | N/A | $ | 15.45 | $ | 13.93 | |||||||||
Third quarter | N/A | N/A | 14.71 | 12.90 | |||||||||||
Second quarter | N/A | N/A | 13.81 | 11.77 | |||||||||||
First quarter | N/A | N/A | 12.75 | 10.90 | |||||||||||
Holders
As of August 25, 2015, the approximate number of holders of record of our Common Shares was 22.
Dividends
The Company has never declared or paid any cash dividends on either its Common Shares or its proportionate voting shares (the “Proportionate Voting Shares”). The Company currently intends to use its earnings to finance the expansion of its business and to reduce indebtedness. Any future determination to pay dividends on Common Shares will be at the discretion of the Board of Directors and will depend on, among other things, the Company’s results of operations, current and anticipated cash requirements and surplus, financial condition, contractual restrictions and financing agreement covenants, solvency tests imposed by corporate law and other factors that the Board of Directors may deem relevant. As of August 25, 2015, there were no Proportionate Voting Shares outstanding.
47
Performance Graph
The following graph compares the total cumulative return of a Cdn$100 investment in the Common Shares made on March 10, 2011, being the date on which the Common Shares started trading on the TSX, with the cumulative return on the Standard & Poor’s Ratings Services (“S&P”)/TSX Composite Index and the Russell 2000 Index for the same period. The graph plots the respective values on the last trading day of fiscal years 2011 through 2015. The stock performance shown on the performance graph below is not necessarily indicative of future performance.
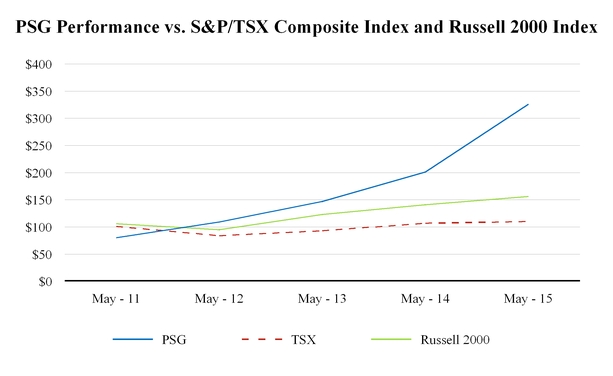
The Company completed its Canadian IPO in March 2011 and as such, there is limited history of its Common Shares trading on the TSX and it may not be possible to draw conclusions from short-term trends. Since the Canadian IPO, the overall compensation to the Company’s executive officers has increased modestly, and the Company’s operating performance has steadily improved based on the following performance metrics: market share in ice hockey equipment (56% in 2015 vs. 49% in 2011), Company-wide net revenues (20.9% compound annual growth rate from Fiscal 2011 to Fiscal 2015) and Adjusted EPS (16.7% compound annual growth from Fiscal 2011 to Fiscal 2015). As discussed in “Non-GAAP Financial Measures,” the Company uses Adjusted EPS, an objective performance metric, to determine annual cash bonuses payable to its executive officers for Company performance. The Company believes that year-over-year growth in Adjusted EPS will lead to long-term shareholder value. The Company does not compensate its executive officers based on its share price, which may fluctuate for factors outside the control of the Company, including macro-economic environmental risks.
Use of Proceeds from Registered Securities
The U.S. IPO was effected under a registration statement on F-10 (File No. 333-196614), which became effective upon filing with the SEC on June 19, 2014. In connection with the U.S. IPO, we registered and sold 8,161,291 Common Shares at a price per share to the public of $15.50 for an aggregate offering price of $126.5 million, including the exercise in full of the over-allotment option. Morgan Stanley, BofA Merrill Lynch and RBC Capital Markets acted as joint book-running managers for a syndicate of underwriters in connection with the U.S. IPO. The U.S. IPO closed on June 25, 2014, and we used the net proceeds of the U.S. IPO to reduce leverage and repay approximately $119.5 million of the Company’s New Term Loan Facility, which was used to finance part of the purchase price in the Easton Baseball/Softball Acquisition.
Unregistered Sales of Equity Securities
The Company did not sell any unregistered securities during Fiscal 2015.
48
Issuer Purchases of Equity Securities
The Company has not purchased any of its Common Shares during Fiscal 2015, nor has it made any plans or established any additional programs to purchase any of its Common Shares during the same period.
Item 6. | Selected Financial Data |
The selected consolidated financial information set out below for the twelve months ended May 31, 2015, May 31, 2014 and May 31, 2013 has been derived from our audited annual consolidated financial statements and related notes included elsewhere in this annual report on Form 10-K. Unless otherwise specified, the Company’s financial information outlined herein includes Easton Baseball/Softball’s operating results from April 15, 2014.
The selected historical consolidated financial data below should be read in conjunction with “Item 7-Management’s Discussion and Analysis of Financial Condition and Results of Operations” and our audited annual consolidated financial statements and the related notes included elsewhere in this annual report on Form 10-K. Historical results presented herein may not be indicative of future results.
Twelve Months Ended | ||||||||||||
(millions of U.S. dollars, except for percentages and per share amounts) | May 31, 2015 | May 31, 2014 | May 31, 2013 | |||||||||
Consolidated statements of income data: | ||||||||||||
Revenues | $ | 654.7 | $ | 446.2 | $ | 399.6 | ||||||
Adjusted Gross Profit(1) | $ | 229.4 | $ | 164.7 | $ | 153.0 | ||||||
Adjusted Gross Profit % (1) | 35.0 | % | 36.9 | % | 38.3 | % | ||||||
Adjusted EBITDA (1) | $ | 98.3 | $ | 68.9 | $ | 62.8 | ||||||
Net income | $ | 3.3 | $ | 20.0 | $ | 25.2 | ||||||
Basic earnings per share | $ | 0.07 | $ | 0.56 | $ | 0.74 | ||||||
Diluted earnings per share | $ | 0.07 | $ | 0.53 | $ | 0.69 | ||||||
Adjusted Net Income (1) | $ | 47.5 | $ | 37.3 | $ | 35.8 | ||||||
Adjusted EPS (1) | $ | 1.02 | $ | 1.00 | $ | 0.98 | ||||||
As of | ||||||||||||
May 31, 2015 | May 31, 2014 | May 31, 2013 | ||||||||||
Consolidated balance sheet data: | ||||||||||||
Working Capital | $ | 332.4 | $ | 324.8 | $ | 200.9 | ||||||
Average Working Capital as a % of revenue | 52.6% | 53.6% | 49.6% | |||||||||
Total assets | $ | 844.9 | $ | 828.6 | $ | 419.2 | ||||||
Total long-term liabilities | $ | 354.8 | $ | 454.4 | $ | 185.0 | ||||||
Leverage Ratio | 4.29 | 4.78 | 2.70 | |||||||||
(1) | Represents a non-GAAP measure. For the relevant definitions and reconciliations to reported results, see “Non-GAAP Financial Measures" in Item 7. |
49
Item 7. | Management's Discussion and Analysis of Financial Condition and Results of Operations |
This discussion summarizes our consolidated operating results, financial condition and liquidity during each of the years in the three-year period ended May 31, 2015. Our fiscal year ends May 31st. Any reference to a fiscal year is to May 31 of the year then ended. The following Management’s Discussion and Analysis of our Financial Condition and Results of Operations should be read in conjunction with the consolidated financial statements and notes thereto included as part of this annual report on Form 10-K.
This discussion contains forward-looking statements that are based upon current expectations and are subject to risks, uncertainties and assumptions that could cause our results to differ materially from expectations. Factors that might cause such differences include, but are not limited to, those described under “Item 1A-Risk Factors,” “Note Regarding Forward-Looking Statements” and elsewhere in this annual report on Form 10-K.
Executive Overview
Performance Sports Group Ltd. is a leading developer and manufacturer of ice hockey, roller hockey, lacrosse, baseball and softball sports equipment, as well as related apparel and soccer apparel. The Company is the global leader in hockey with the strongest and most recognized brand, and it holds the No. 1 North American position in baseball and softball. Its products are marketed under the BAUER, MISSION, MAVERIK, CASCADE, INARIA, COMBAT and EASTON brand names and are distributed by sales representatives and independent distributors throughout the world. In addition, the Company distributes its hockey products through its Burlington, Massachusetts Own The Moment Hockey Experience retail store. The Company is focused on building its leadership position by growing market share in all product categories and pursuing strategic acquisitions.
Our mission is to elevate player performance and protection through athlete insight and superior innovation. Financially, our objectives are to grow our revenues each year faster than the total market for each of our sports and grow our profitability faster than revenues in constant currency. We have a diversified and balanced business model and are focused on growth through the following opportunities:
• | Significantly grow market share in Baseball/Softball - as we did with Hockey, we look to expand our market share in Baseball/Softball by investing in product development, developing a disciplined category management process and connecting with our core consumers. |
• | Continue to grow in Hockey - although we hold the No.1 market share position, we look to continue to expand market share in every category, with a particular focus on sticks, the largest dollar category in the industry. |
• | Grow apparel across all sports - the apparel market is highly fragmented and we look to grow apparel across all of our sports by leveraging the strength of our brands as well as continued R&D investments in apparel. |
• | Continue rapid growth in Lacrosse - Lacrosse continues to be one of the fastest growing sports in the United States and we look to grow market share, targeting market leadership by 2016. We focus our efforts on the fast-growing youth and high school markets, including the women’s game. |
• | Continue to pursue strategic acquisitions - we are an acquirer of choice and our global operating platform is applicable for many sports. We have established an effective internal process for identifying, acquiring and integrating target companies. |
Highlights of Fiscal 2015
• | A 51% increase in revenues on a constant currency basis, generating $675.2 million million in revenue in Fiscal 2015, compared to $446.2 million in Fiscal 2014; |
• | Currency neutral Adjusted Net Income increased by 64.6%, to $61.4 million or $1.32 per diluted share, compared to $37.3 million, or $1.00 per diluted share in Fiscal 2014; |
50
• | We continued to outpace the growth of the markets in which we participate by growing market share and profitability and we continue to leverage our performance sports platform, which is improving efficiency and driving constant currency profit growth that exceeds revenue growth; |
• | We announced a supply chain initiative that we expect to improve pre-tax profitability of $30 million by Fiscal 2020; |
• | We announced a cash flow improvement initiative that is targeting an improvement in net cash flow from working capital of $30 million in Fiscal 2016; |
• | Our leading hockey market share strengthened, growing from 54% to 56%; |
• | On a constant currency basis, our total apparel sales grew approximately 36% for the year, driven by a 50% growth in team uniforms and a 50% growth in performance apparel; |
• | Easton Baseball/Softball continued its dominant share at the NCAA level as 17 EASTON teams competed in the NCAA College World Series; |
• | Maverik continued to gain momentum, signing High Point University and Penn State as college partners. Maverik sales also increased by approximately 28% for the year; and |
• | In January 2015, we announced our plans to open 8-10 Bauer Hockey Own The Moment Hockey Experience retail stores. The first location opened in Burlington, Massachusetts on August 15, 2015. |
Factors Affecting our Performance
Seasonality
Our business demonstrates substantial seasonality, although this seasonality has been reduced as a result of the Easton Baseball/Softball Acquisition. The spring/summer season of baseball and softball is highly complementary to the fall/winter season of hockey, and our quarterly sources of revenue and profitability are more balanced throughout the year as a result. The more evenly distributed seasonality of the combined business provides more consistent working capital levels and allows us to improve our efficiency in our manufacturing, distribution and other efforts.
Generally, our highest sales volumes for hockey occur during the first quarter of our fiscal year. Our next highest sales volumes for hockey occur during the second quarter of our fiscal year. Our lowest sales volumes for hockey occur during the third quarter of our fiscal year. In ice hockey, we have three sub-brands of products - VAPOR, SUPREME and NEXUS. In certain fiscal years, we launch new products under more than one sub-brand. The launch timing of our products may change in future periods.
In lacrosse, our highest sales volumes for MAVERIK and CASCADE products occur in the second and third fiscal quarters.
In baseball/softball, our highest sales volumes for EASTON and COMBAT products occur in the third and fourth fiscal quarters. The seasonality of our baseball/softball businesses will substantially reduce the seasonality of our overall business.
The shipment of INARIA soccer products occurs substantially in the first and fourth fiscal quarters. We expect our team apparel revenues, including uniforms for ice hockey, roller hockey, lacrosse and other team sports, to align with the underlying sports' selling seasons as we expand our team apparel offering.
Revenues
We generate revenues from the sale of performance sports equipment and related apparel and accessories. We offer various cooperative marketing incentive programs to assist our sales channels with the marketing and selling of our products. These costs are recorded as a reduction of revenues. Each sport within PSG manages its own commercial organization and go-to-market strategy.
The current sales channels for our sports include (i) retailers in North America and the Nordic countries, and (ii) distributors throughout the rest of the world (principally, Western Europe, Eastern Europe, and Russia). Based on the regional mix, our revenues are generated in multiple currencies. For revenues, we are exposed to foreign currency exchange rate fluctuations of the U.S. dollar against the Canadian dollar, the euro, the Swedish krona, Norwegian krona and Danish krona.
51
The following table highlights revenues for the periods indicated:
Twelve Months Ended | |||||||||||
Period Over Period Growth Rate(1) | |||||||||||
(millions of U.S. dollars, except for percentages) | May 31, 2015 | May 31, 2014 | |||||||||
Revenues: | |||||||||||
Canada | $ | 157.0 | $ | 145.3 | 8.1 | % | |||||
United States | 383.3 | 191.0 | 100.7 | % | |||||||
Rest of world | 114.4 | 109.9 | 4.1 | % | |||||||
Total Revenues | $ | 654.7 | $ | 446.2 | 46.7 | % | |||||
(1) | Twelve-month period ended May 31, 2015 vs. the twelve-month period ended May 31, 2014. |
For further detail on our geographic segments data, please refer to Note 17 of the Notes to Consolidated Financial Statements.
Cost of Goods Sold
Our cost of goods sold is comprised primarily of (i) the cost of finished goods, materials and components purchased from our suppliers, manufacturing labour and overhead costs in our manufacturing facilities, (ii) supply chain-related costs, such as freight, duties, warehousing and other distribution costs, (iii) warranty costs and (iv) inventory provisions and write-offs. Our warranty costs result from a general warranty policy providing coverage against manufacturing defects. Warranties range from 30 days to one year from the date sold to the consumer, depending on the type of product. Our warranty costs are primarily driven by sales of composite ice hockey sticks and baseball bats. Amortization associated with certain acquired intangible assets, such as purchased technology and customer relationships, is also included in cost of goods sold. We also include charges to cost of goods sold resulting from the fair market value adjustment to inventory associated with certain acquired inventories.
PSG’s cost of goods sold are exposed to transactional foreign currency risk in the following ways:
• | PSG’s entities purchase finished goods inventory directly from third party factories in U.S. dollars. These purchases generate a foreign currency exposure for those PSG entities with a functional currency other than the U.S. dollar, primarily PSG’s Hockey business outside of the U.S. which has a functional currency of primarily Canadian dollars, Swedish krona and euro. As a result, a stronger U.S. dollar increases the inventory cost incurred by PSG whereas a weaker U.S. dollar decreases its cost. The Company uses foreign currency forward contracts to hedge a portion of our exposure to fluctuations in the value of the U.S. dollar against the Canadian dollar. The resulting realized gain/loss on derivatives is an economic offset to the cost of goods sold. |
• | We source the majority of our products from suppliers in China and Thailand and agree to buy such products in U.S. dollars. We enter into supplier agreements ranging from six to twelve months with respect to the U.S. dollar cost of our Asian-sourced finished goods. In these agreements, we adjust for changes in the relevant foreign exchange rates in which the factory labor, materials and overhead are denominated. As a result, our cost of goods sold is impacted by the fluctuations of the Chinese renminbi, Thai baht and certain other Asian currencies against the U.S. dollar. Therefore, a strengthening U.S. dollar relative to these Asian currencies decreases PSG’s U.S. dollar sourced product cost, whereas a weakening U.S. dollar increases our sourced product cost. We do not currently hedge our exposure to fluctuations in the value of these factory input cost currencies. |
Selling, General and Administrative Expenses
Our SG&A expenses consist primarily of costs relating to our sales and marketing activities, including salaries, commissions and related personnel costs, customer order management and support activities, advertising, trade shows, and other promotional activities. Our marketing expenses include promotional costs for launching new products, advertising, and athlete endorsement costs. Our administrative expenses consist of costs relating to information systems, legal and finance functions, professional fees, insurance, and other corporate expenses. We also include share-based payment expense, costs related to share offerings, and acquisition costs, including rebranding and integration costs, in SG&A expenses. We expect our SG&A expenses
52
to increase as we make investments in the Easton business, launch our Bauer Hockey retail business, and continue to invest in certain PSG platform functions.
Research and Development Expenses
R&D expenses consist primarily of salaries and related consulting expenses for technical personnel, contracts with leading research facilities, as well as materials and consumables used in product development. To date, no development costs have been capitalized. We incur most of our R&D expenses in Canada and are eligible to receive Scientific Research and Experimental Development investment tax credits for certain eligible expenditures which are recorded as a reduction to income tax expense. We currently expect our R&D expenses to grow as a result of investments in our Easton business, and as we focus on enhancing and expanding our product lines.
Interest Expense
Interest expense is derived from the financing activities of the Company and consists of interest expense on our term loan and revolving loan, and the amortization of deferred financing fees. As of May 31, 2015, the Credit Facilities consist of a $450 million New Term Loan, denominated in U.S. dollars of which $330.5 million was drawn, and a $200 million New ABL Facility, denominated in both Canadian dollars and U.S. dollars of which $92.9 million was drawn, the availability of which is subject to meeting certain borrowing base requirements. Please see “Indebtedness” for a more detailed discussion of the Credit Facilities.
Impact of Foreign Exchange and Hedging Practices
As a global company with significant operations outside the United States, in the normal course of business we are exposed to risk arising from the changes in currency exchange rates. Our primary foreign currency exposures arise from the recording of transactions denominated in non-functional currencies and the translation of foreign currency denominated results of operations, financial position, and cash flows into U.S. dollars.
Our foreign exchange risk management efforts are intended to lessen both the negative and positive effects of currency fluctuations on our consolidated results of operations, financial position, and cash flows. We manage global foreign exchange risk centrally on a portfolio basis to address those risks that are material to PSG. We manage these exposures primarily through the use of foreign exchange forward contracts, which are recorded on the consolidated statements of financial position at fair value (see Note 18 - Derivatives and Risk Management and Note 19 - Fair Value Measures in the accompanying Notes to Consolidated Financial Statements). Our hedging practices are designed to provide stability around the receipt of cash, and at least partially offset the impact of exchange rate changes on the underlying exposures being hedged. Where exposures are hedged, our program has the effect of reducing volatility in our financial results and at least delaying the impact of exchange rate movements on our consolidated financial statements when a currency’s direction is sustained over a longer period; the length of delay is dependent upon hedge horizons. We do not hold or issue derivative instruments for trading or speculative purposes.
The Company primarily uses foreign currency forward contracts to hedge the effect of changes in currency exchange rates on its product costs (see the "Cost of Goods Sold” section above). The resulting realized gain/loss on derivatives is an economic offset to the cost of goods sold that are recorded in the Company’s Gross Profit. The Company has not elected hedge accounting; therefore, the changes in the fair value of these derivatives are recognized as unrealized gains and losses through profit or loss each reporting period. In Fiscal 2015 and Fiscal 2014, the Company settled Canadian dollar forward contracts for $102.0 million and $129.5 million U.S. dollars, respectively, at a weighted average exchange rate of 1.05 and 1.00, respectively. As of May 31, 2015, the amount of Canadian dollar forward contracts outstanding is $78.0 million U.S. dollars at a weighted average exchange rate of 1.24.
The Company’s reporting currency is the U.S. dollar. Many of our foreign subsidiaries operate in functional currencies other than the U.S. dollar, the most significant of which are in Canadian Dollars, Swedish krona, and euro. Fluctuations in currency exchange rates create volatility in our reported results as we are required to translate the balance sheets, operational results, and cash flows of these subsidiaries into U.S. dollars for consolidated reporting. Balances on the statements of financial position are converted at the month-end foreign exchange rates or at historical exchange rates, and all profit and loss transactions are recognized at monthly average rates. In the translation of our Consolidated Statements of Income, a weaker U.S. dollar in relation to the Canadian Dollar, Swedish krona, and euro benefits our consolidated revenues and earnings, whereas a stronger U.S. dollar reduces our consolidated revenues and earnings. Adjustments resulting from translating foreign functional currency balance sheets into U.S. dollars are included in the foreign currency translation adjustment, a component of accumulated other comprehensive income (loss) in equity. Re-measurement gains and losses generated by the effect of foreign exchange on recorded assets and liabilities denominated in a currency different from the functional currency of the applicable entity are recorded in Foreign Exchange Gain/
53
Loss in the period in which they occur. The Company does not currently hedge these translation or re-measurement exposures.
In this annual report on Form 10-K, we provide the impact of foreign exchange on our various financial measures. These amounts reflect the impact of translating the current period results at the monthly foreign exchange rates of the prior year period, the effect of changes in the value of the Canadian dollar against the U.S. dollar on our cost of goods purchased for sale outside of the United States including the related realized gains/losses on derivatives described above, and the realized gains/losses generated from revaluing non-functional currency assets and liabilities. The reported foreign exchange impact does not include the impact of fluctuations in Asian currencies against the U.S. dollar and their related effect on our Asian-sourced finished goods. See the "Cost of Goods Sold” section above for a more detailed description of these foreign exchange impacts.
The following table summarizes the change in the reported U.S. dollars versus constant currency U.S. dollars for the twelve-month period ended May 31, 2015:
Twelve Months Ended | ||||||||||||||
May 31, 2015 | ||||||||||||||
(millions of U.S. dollars, except for per share amounts) | Reported | Constant Currency (2) | Impact of Foreign Exchange | % Change | ||||||||||
Revenues | $ | 654.7 | $ | 675.2 | $ | (20.5 | ) | (3.0 | )% | |||||
Gross Profit | $ | 206.4 | $ | 228.6 | $ | (22.2 | ) | (9.7 | )% | |||||
Selling, general & administrative | $ | 140.0 | $ | 143.4 | $ | (3.4 | ) | (2.4 | )% | |||||
Research & development | $ | 24.8 | $ | 25.6 | $ | (0.8 | ) | (3.1 | )% | |||||
Adjusted Gross Profit (1) | $ | 229.4 | $ | 251.8 | $ | (22.4 | ) | (8.9 | )% | |||||
Adjusted EBITDA (1) | $ | 98.3 | $ | 116.4 | $ | (18.1 | ) | (15.5 | )% | |||||
Adjusted Net Income (1) | $ | 47.5 | $ | 61.4 | $ | (13.9 | ) | (22.6 | )% | |||||
Adjusted EPS (1) | $ | 1.02 | $ | 1.32 | $ | (0.3 | ) | (22.7 | )% | |||||
(1) | Represents a non-GAAP measure. For the relevant definitions and reconciliations to reported results, see “Non-GAAP Financial Measures.” |
(2) | Represents a non-GAAP measure. For the relevant definition, see "Non-GAAP Financial Measures". See "Impact of Foreign Exchange and Hedging Practices" in this Item 7 for a summary of the change in the reported U.S. dollars versus constant currency U.S. dollars for the twelve-month period ended May 31, 2015. |
The following table summarizes the average of the monthly exchange rates used to translate profit or loss transactions for the periods indicated, as reported by the Wall Street Journal:
Twelve Months Ended | |||||||||
May 31, 2015 | May 31, 2014 | % Change | |||||||
CAD / USD | 1.147 | 1.059 | (8.3 | )% | |||||
EUR / USD | 0.806 | 0.743 | (8.5 | )% | |||||
SEK / USD | 7.465 | 6.521 | (14.5 | )% | |||||
Income Taxes
The Company is subject to cash taxes in the United States, Canada and Europe for federal, state, and provincial income taxes, as applicable. The Company utilizes its tax loss carry forwards, tax credits and other tax assets, as available, to offset its taxable income.
54
Results of Operations
The following table summarizes our results of operations for the twelve months ended May 31, 2015, May 31, 2014 and May 31, 2013 and has been derived from our audited annual consolidated financial statements and related notes.
(millions of U.S. dollars, except for percentages and per share amounts) | Twelve Months Ended | ||||||||||
May 31, 2015 | May 31, 2014 | May 31, 2013 | |||||||||
Revenues | $ | 654.7 | $ | 446.2 | $ | 399.6 | |||||
Cost of goods sold | 448.3 | 291.8 | 252.4 | ||||||||
Gross profit | $ | 206.4 | $ | 154.4 | $ | 147.2 | |||||
Operating expenses: | |||||||||||
Selling, general & administrative | 140.0 | 104.6 | 90.5 | ||||||||
Research & development | 24.8 | 19.8 | 16.8 | ||||||||
Operating income (loss) | $ | 41.6 | $ | 30.0 | $ | 39.9 | |||||
Interest expense, net | 19.8 | 9.7 | 8.7 | ||||||||
Derivative and foreign exchange (gain) loss | 14.9 | (6.3 | ) | (1.4 | ) | ||||||
Gain on bargain purchase | — | — | (1.2 | ) | |||||||
Other expense (income) | 0.2 | $ | 0.3 | — | |||||||
Income tax expense (benefit) | 3.4 | 6.3 | 8.6 | ||||||||
Net income (loss) | $ | 3.3 | $ | 20.0 | $ | 25.2 | |||||
Basic earnings (loss) per share | $ | 0.07 | $ | 0.56 | $ | 0.74 | |||||
Diluted earnings (loss) per share | $ | 0.07 | $ | 0.53 | $ | 0.69 | |||||
Adjusted Gross Profit (1) | $ | 229.4 | $ | 164.7 | $ | 153.0 | |||||
Adjusted EBITDA (1) | $ | 98.3 | $ | 68.9 | $ | 62.8 | |||||
Adjusted Net Income (Loss) (1) | $ | 47.5 | $ | 37.3 | $ | 35.8 | |||||
Adjusted EPS (1) | $ | 1.02 | $ | 1.00 | $ | 0.98 | |||||
As a percentage of revenues: | |||||||||||
Gross profit | 31.5 | % | 34.6 | % | 36.8 | % | |||||
Selling, general & administrative | 21.4 | % | 23.4 | % | 22.6 | % | |||||
Research & development | 3.8 | % | 4.4 | % | 4.2 | % | |||||
Adjusted Gross Profit (1) | 35.0 | % | 36.9 | % | 38.3 | % | |||||
Adjusted EBITDA (1) | 15.0 | % | 15.4 | % | 15.7 | % | |||||
(1) Represents a non-GAAP measure. For the relevant definitions and reconciliations to reported results, see “Non-GAAP Financial Measures.”
Comparison of Fiscal 2015 with Fiscal 2014
Revenues
Currency neutral revenues in the twelve-month period ended May 31, 2015 increased by $229.0 million, or 51.3%, to $675.2 million due to the addition of $175.8 million of Easton Baseball/Softball revenues, 13.3% growth in hockey revenues driven by growth in key hockey categories, and 6.1% growth in Lacrosse. Excluding the impact of the Easton Baseball/Softball Acquisition, currency neutral revenues increased by 11.9%. Currency neutral revenues in North America grew by 64.2% and increased by 12.1% in the rest of the world.
Including the impact of foreign exchange, revenues increased by $208.5 million, or 46.7% to $654.7 million. Overall revenues in North America grew by 60.8%, primarily as a result of the Easton Baseball/Softball Acquisition, and increased by 4.0% in the rest of the world. The translation impact of foreign exchange in the twelve-month period ended May 31, 2015 decreased our reported revenues by $20.5 million compared to the prior year.
For further detail on our revenues, please refer to the “Segment Results” section.
55
Cost of goods sold
Cost of goods sold in the twelve-month period ended May 31, 2015 increased by $156.5 million, or 53.6%, to $448.3 million driven by the increase in cost of goods sold as a result of higher revenues, higher purchase accounting related amortization and non-cash charges to cost of goods sold resulting from the fair value adjustment of inventories related to the Easton Baseball/Softball Acquisition and costs related to the lacrosse helmet decertification. The impact of foreign exchange for the twelve-month period ended May 31, 2015 increased our reported cost of goods sold expenses by $1.8 million compared to prior year.
Gross Profit
Currency neutral gross profit in the twelve-month period ended May 31, 2015 increased by $74.3 million, or 48.1%, to $228.6 million driven by higher revenues, partially offset by higher purchase accounting related amortization and non-cash charges to cost of goods sold resulting from the fair value adjustment of inventories related to the Easton Baseball/Softball Acquisition and costs related to the lacrosse helmet decertification. As a percentage of revenues, currency neutral gross profit decreased to 33.9% for the twelve-month period ended May 31, 2015 from 34.6% in the twelve-month period ended May 31, 2014.
Including the impact of foreign exchange, gross profit in the twelve-month period ended May 31, 2015 increased by $52.1 million, or 33.7%, to $206.4 million driven by the factors mentioned above, partially offset by an unfavorable impact from foreign exchange. As a percentage of revenues, gross profit decreased to 31.5% for the twelve-month period ended May 31, 2015 from 34.6% in the twelve-month period ended May 31, 2014 driven by the unfavorable impact from foreign exchange partially offset by the addition of Easton Baseball/Softball (including the aforementioned purchase accounting related amortization and non-cash charges to cost of goods sold resulting from the fair value adjustment of inventories). The impact of foreign exchange in the twelve-month period ended May 31, 2015 decreased gross profit by $22.2 million compared to the prior year. See “Factors Affecting our Performance - Cost of Goods Sold” and “Liquidity and Capital Resources” for more detail on our product costs.
Adjusted Gross Profit
Currency neutral Adjusted Gross Profit (removing purchase accounting related amortization, non-cash charges to cost of goods sold resulting from the fair value adjustment of inventories related to the Easton Baseball/Softball Acquisition and costs related to the lacrosse helmet decertification) in the twelve-month period ended May 31, 2015 increased by $87.1 million, or 52.9%, to $251.8 million. Currency neutral Adjusted Gross Profit as a percentage of revenues increased to 37.3% for the twelve-month period ended May 31, 2015 from 36.9% for the twelve-month period ended May 31, 2014 driven by the addition of Easton Baseball/Softball, which has significantly higher adjusted gross margins than the Company’s prior year levels. Including the impact of foreign exchange, Adjusted Gross Profit in the twelve-month period ended May 31, 2015 increased by $64.7 million, or 39.3%, to $229.4 million. Adjusted Gross Profit as a percentage of revenues decreased to 35.0% for the twelve-month period ended May 31, 2015 from 36.9% for the twelve-month period ended May 31, 2014 driven by an unfavorable impact from foreign exchange, partially offset by the addition of Easton Baseball/Softball. Please see the Adjusted Gross Profit table for the reconciliation of gross profit to Adjusted Gross Profit in the “Non-GAAP Financial Measures” section.
Selling, General and Administrative Expenses
SG&A expenses in the twelve-month period ended May 31, 2015 increased by $35.4 million, or 33.9%, to $140.0 million, due to the addition of Easton Baseball/Softball, the impact of the gain from the BRG Sports intellectual property litigation settlement in the fourth quarter of Fiscal 2014, higher share-based payment expense and costs related to the lacrosse helmet decertification. Excluding the impact of acquisition-related costs, costs related to share offerings, share-based payment expense, and costs related to the lacrosse helmet decertification, our SG&A expenses increased by $33.0 million, or 37.5%, to $121.2 million driven by the addition of Easton Baseball/Softball SG&A, and the impact of the gain from the BRG Sports intellectual property litigation settlement in the fourth quarter of Fiscal 2014.
As a percentage of revenues, our SG&A expenses (including acquisition-related charges, costs related to share offerings, share-based payment expense, and costs related to the lacrosse helmet decertification) decreased to 21.4% for the twelve-month period ended May 31, 2015 from 23.4% of revenues for the twelve-month period ended May 31, 2014. Excluding acquisition-related charges, costs related to share offerings, share-based payment expense, and costs related to the lacrosse helmet decertification, SG&A expenses as a percentage of revenue decreased to 18.5% for the twelve-month period ended May 31, 2015 from 19.8% of revenues for the twelve-month period ended May 31, 2014. The translation impact of foreign exchange for the twelve-month period ended May 31, 2015 decreased our reported SG&A expenses by $3.4 million compared to prior year.
56
Research and Development Expenses
R&D expenses in the twelve-month period ended May 31, 2015 increased by $5.0 million, or 25.5%, to $24.8 million due to the addition of Easton Baseball/Softball and our continued focus on product development efforts. As a percentage of revenues, our R&D expenses decreased to 3.8% for the twelve-month period ended May 31, 2015 from 4.4% for the twelve-month period ended May 31, 2014, driven by the addition of Easton Baseball/Softball, which historically has spent less on R&D expenses as a percentage of sales than the Company’s prior year levels. The translation impact of foreign exchange for the twelve-month period ended May 31, 2015 decreased our reported R&D expenses by $0.8 million compared to prior year.
Adjusted EBITDA
Currency neutral Adjusted EBITDA in the twelve-month period ended May 31, 2015 increased by $47.5 million, or 69.0%, to $116.4 million from $68.9 million due to a $35.2 million increase in Baseball/Softball Segment EBITDA resulting from the addition of Easton Baseball/Softball and a $17.9 million currency neutral increase in Hockey Segment EBITDA, partially offset by an increase in unallocated PSG corporate expenses resulting from the gain from the BRG Sports intellectual property litigation settlement in the fourth quarter of Fiscal 2014. As a percentage of revenues, currency neutral Adjusted EBITDA increased to 17.2% for the twelve-month period ended May 31, 2015 from 15.4% for the twelve-month period ended May 31, 2014, driven primarily by the addition of Easton Baseball/Softball. Including the impact of foreign exchange, Adjusted EBITDA in the twelve-month period ended May 31, 2015 increased by $29.4 million, or 42.7%, to $98.3 million from $68.9 million due, driven by the above factors and an unfavorable impact from foreign exchange of $18.1 million. As a percentage of revenues, Adjusted EBITDA decreased to 15.0% for the twelve-month period ended May 31, 2015 from 15.4% for the twelve-month period ended May 31, 2014, driven by the addition of Easton Baseball/Softball, offset by the unfavorable impact from foreign exchange. Please see the Adjusted EBITDA table for the reconciliation of net income to Adjusted EBITDA in the “Non-GAAP Financial Measures” section.
Interest Expense, net
Interest expense in the twelve-month period ended May 31, 2015 increased by $10.1 million, or over 100%, to $19.8 million from $9.7 million driven by the new debt issued to fund the Easton Baseball/Softball Acquisition.
Derivative and Foreign Exchange Gains/Losses
Realized gain on derivatives increased $0.8 million, or 13.0% , to a gain of $6.9 million from a gain of $6.1 million, driven by the continued devaluation of the Canadian dollar relative to the hedge rates in effect on the Company’s forward contracts.
Unrealized loss on derivatives increased $0.2 million, or 9.4%, to a loss of $2.2 million from a loss of $2.0 million. The Company has not elected hedge accounting and therefore the changes in the fair value of derivative contracts are recognized through profit or loss each reporting period.
Foreign exchange (gain) loss decreased $24.4 million, to a loss of $19.6 million from a gain of $4.8 million. The foreign exchange gain/loss represents the realized and unrealized gains/losses generated from revaluing non-functional currency assets and liabilities to their respective functional currency. The realized foreign exchange gain increased $0.4 million to a gain of $1.7 million, from a gain of $1.3 million.
Income Taxes
Income tax expense for the twelve-month period ended May 31, 2015 decreased by $2.9 million to $3.4 million from $6.3 million in the twelve-month period ended May 31, 2014. The Company’s effective tax rate was 50.6%, compared to 23.9% for the same period in the prior year. The increase in the effective tax rate was due to a relatively low amount of income before income tax and the non-recognition of tax benefits from unrealized losses on capital items in the current year period, partially offset by the tax benefits derived from the financing of the Easton Baseball/Softball Acquisition.
Net Income
Net income in the twelve-month period ended May 31, 2015 decreased by $16.7 million, or 83.6%, to $3.3 million from net income of $20.0 million in the twelve-month period ended May 31, 2014 driven by the operating results described above in the Adjusted EBITDA section, which were more than offset by the unfavorable change in the unrealized foreign exchange (gains) and losses, higher purchase accounting related amortization and non-cash charges to cost of goods sold resulting from the fair value adjustment of inventories related to the Easton Baseball/Softball Acquisition, higher interest expense, higher share-based payment expense, and costs related to the lacrosse helmet decertification. The impact of foreign exchange for the twelve-month
57
period ended May 31, 2015 decreased our net income by $13.8 million compared to the prior year.
Adjusted Net Income
Currency neutral Adjusted Net Income in the twelve-month period ended May 31, 2015, increased by $24.1 million, or 64.6%, to $61.4 million from $37.3 million in the twelve-month period ended May 31, 2014 driven by the operating results reflected in the Adjusted EBITDA section which were partially offset by higher interest expense resulting from the Easton Baseball/Softball Acquisition, higher taxes, and an unfavorable impact from realized foreign exchange (gains) and losses. Including the impact from foreign exchange, Adjusted Net Income in the twelve-month period ended May 31, 2015, increased by $10.2 million, or 27.3%, to $47.5 million from $37.3 million in the twelve-month period ended May 31, 2014 driven by the factors described above and an unfavorable impact from foreign exchange of $13.9 million. Adjusted Net Income/Loss removes unrealized foreign exchange gains/losses, acquisition-related charges, share-based payment expense, and other one-time or non-cash expenses. Please see the Adjusted Net Income/Loss table in the “Non-GAAP Financial Measures” section for the reconciliation of net income (loss) to Adjusted Net Income/Loss and Adjusted EPS.
Comparison of Fiscal 2014 with Fiscal 2013
Revenues
Revenues in the twelve-month period ended May 31, 2014 increased by $46.6 million, or 11.7%, to $446.2 million due to strong growth in apparel, the addition of Easton Baseball/Softball and Combat Sports revenues, and continued growth in lacrosse and hockey, which grew 19.0% and 4.1%, respectively. Apparel revenues grew by 42.0% driven by the addition of hockey, lacrosse and soccer uniforms, 30.1% growth in off-ice team apparel, 27.0% growth in our base layer performance apparel, and 34.2% growth in lifestyle apparel.
Excluding the impact of foreign exchange, revenues increased 13.7%, and excluding the impact of foreign exchange, the impact of lower wholesale prices as a result of the Canadian Tariff Reduction, and the impact of the Easton Baseball/Softball, Inaria, Cascade, and Combat Sports acquisitions, revenues increased 6.5%. Overall revenues in North America grew by 13.8% and increased by 5.6% in the rest of the world. The translation impact of foreign exchange in the twelve-month period ended May 31, 2014 decreased our reported revenues by $8.3 million compared to the prior year.
For further detail on our revenues, please refer to the “Segment Results” section.
Cost of goods sold
Cost of goods sold in the twelve-month period ended May 31, 2014 increased by $39.4 million, or 15.6%, to $291.8 million, driven by the increase in cost of goods sold as a result of higher revenues, higher purchase accounting related amortization and non-cash charges to cost of goods sold resulting from the fair value adjustment of inventories related to the Easton Baseball/Softball Acquisition, and higher initial costs to support the growth in the uniforms business. The impact of foreign exchange for the twelve-month period ended May 31, 2014 did not have a significant impact on our reported cost of goods sold expenses as compared to the prior year.
Gross Profit
Gross profit in the twelve-month period ended May 31, 2014 increased by $7.2 million, or 4.9%, to $154.4 million. Gross profit was favorably impacted by higher revenues, partially offset by higher purchase accounting related amortization and charges to cost of goods sold resulting from the fair value adjustment of inventories related to the Easton Baseball/Softball Acquisition and the cost of duty paid on products imported prior to the Canadian Tariff Reduction.
As a percentage of revenues, gross profit decreased to 34.6% for the twelve-month period ended May 31, 2014 from 36.8% in the twelve-month period ended May 31, 2013 driven by the above items, an unfavorable impact from foreign exchange, and higher initial costs to support the growth in the uniforms business. The translation impact of foreign exchange in the twelve-month period ended May 31, 2014 decreased gross profit by $3.9 million compared to the prior year. See “Factors Affecting our Performance - Cost of Goods Sold” and “Liquidity and Capital Resources” for more detail on our product costs.
Adjusted Gross Profit
Adjusted Gross Profit in the twelve-month period ended May 31, 2014 increased by $11.7 million, or 7.6%, to $164.7 million. Adjusted Gross Profit as a percentage of revenues decreased to 36.9% for the twelve-month period ended May 31, 2014
58
from 38.3% for the twelve-month period ended May 31, 2013 driven by the unfavorable impact from foreign exchange and higher initial costs to support the growth in the uniforms business described above, which more than offset higher margins on ice hockey equipment. Please see the Adjusted Gross Profit table for the reconciliation of gross profit to Adjusted Gross Profit in the “Non-GAAP Financial Measures” section.
Selling, General and Administrative Expenses
SG&A expenses in the twelve-month period ended May 31, 2014 increased by $14.1 million, or 15.6%, to $104.6 million, due to higher acquisition related-costs, the addition of Easton Baseball/Softball and Combat Sports, an additional four and a half months of Inaria expenses in Fiscal 2014, higher share-based payment expense, partially offset by the $6.0 million gain from the Easton litigation settlement. Excluding the impact of acquisition-related charges (which do not include the Easton litigation settlement), costs related to share offerings, and share-based payment expense, SG&A expenses increased by $8.4 million, or 10.6%, to $88.2 million driven by the SG&A expenses from the acquisitions noted above, additional hires to support the growth of the business, higher selling expenses to support the higher revenues, higher endorsement expense in Fiscal 2014 as compared to Fiscal 2013 during which the NHL Lockout occurred, and higher legal expenses to support intellectual property litigation related matters, offset by the $6.0 million gain from the Easton litigation settlement.
As a percentage of revenues, our SG&A (including acquisition-related charges, costs related to share offerings, and share-based payment expense) increased to 23.4% for the twelve-month period ended May 31, 2014 from 22.6% of revenues for the twelve-month period ended May 31, 2013. Excluding the impact of acquisition-related charges (which do not include the Easton litigation settlement), costs related to share offerings, share-based payment expense, and the Easton litigation settlement, SG&A expenses as a percentage of revenues decreased slightly to 19.8% for the twelve-month period ended May 31, 2014 from 20.0% of revenues for the twelve-month period May 31, 2013. The translation impact of foreign exchange for the twelve-month period ended May 31, 2014 decreased our reported SG&A expenses by $1.4 million compared to prior year.
Research and Development Expenses
R&D expenses in the twelve-month period ended May 31, 2014 increased by $3.0 million, or 17.6%, to $19.8 million, due to our continued focus on product development efforts and the addition of Easton Baseball/Softball and Combat Sports. As a percentage of revenues, our R&D expenses increased to 4.4% for the twelve-month period ended May 31, 2014 from 4.2% of revenues for the twelve-month period ended May 31, 2013. The translation impact of foreign exchange for the twelve-month period ended May 31, 2014 decreased our reported R&D expenses by $0.5 million compared to prior year.
Adjusted EBITDA
Adjusted EBITDA in the twelve-month period ended May 31, 2014 increased $6.1 million, or 9.7%, to $68.9 million from $62.8 million for the twelve-month period ended May 31, 2013 due to higher Adjusted Gross Profit, a favorable change in realized gain on derivatives, which are included in finance income, and the impact of the Easton litigation settlement, partially offset by higher R&D and SG&A spending and the unfavorable impact of foreign exchange. As a percentage of revenues, Adjusted EBITDA decreased slightly to 15.4% for the twelve-month period ended May 31, 2014 from 15.7% for the twelve-month period ended May 31, 2013. The translation impact of foreign exchange for the twelve-month period ended May 31, 2014 decreased Adjusted EBITDA by $3.0 million compared to prior year. Please see the Adjusted EBITDA table for the reconciliation of net income to Adjusted EBITDA in the “Non-GAAP Financial Measures” section.
Derivative and Foreign Exchange Gains/Losses
Realized gain on derivatives increased $5.8 million, or greater than 100.0%, to a gain of $6.1 million from a gain of $0.3 million driven by the devaluation of the Canadian dollar relative to the hedge rates in effect on the Company’s forward contracts.
Unrealized gain/loss on derivatives decreased $2.9 million to a loss of $2.0 million from a gain of $0.9 million. The Company has not elected hedge accounting and therefore the changes in the fair value of derivative contracts are recognized through profit or loss each reporting period.
Foreign exchange (gain) loss increased $4.3 million, to a gain of $4.8 million from a gain of $0.5 million. The foreign exchange (gain) loss represents the realized and unrealized (gain) loss generated from revaluing non-functional currency assets and liabilities to their respective functional currency. The realized foreign exchange gain increased $0.9 million, to a gain of $1.3 million from a gain of $0.4 million.
59
Income Taxes
Income tax expense for the twelve-month period ended May 31, 2014 decreased by $2.4 million from $8.6 million to $6.3 million. The Company’s effective tax rate was 23.9%, compared to 25.5% for the same period in the prior year. The decrease in the annual effective tax rate was primarily due to a larger proportion of pre-tax income earned in lower-tax jurisdictions than in the prior year, partially offset by benefits recorded in the prior year related to specific income tax matters that did not occur in the year ended May 31, 2014.
Net Income
Net income in the twelve-month period ended May 31, 2014 decreased by $5.2 million, or 20.8%, to $20.0 million from net income of $25.2 million in the twelve-month period ended May 31, 2013 as the growth in Adjusted EBITDA and lower tax rate described above, were more than offset by higher acquisition-related charges, higher share-based payment expense, an unfavorable change in the unrealized (gain) loss on derivatives, the loss on extinguishment of debt, and higher interest expense. The translation impact of foreign exchange for the twelve-month period ended May 31, 2014 decreased the Company's net income by $2.0 million compared to prior year.
Adjusted Net Income
Adjusted Net Income in the twelve-month period ended May 31, 2014 increased by $1.5 million, or 4.1%, to $37.3 million from $35.8 million in the twelve-month period ended May 31, 2013 driven by the operating results reflected in the Adjusted EBITDA section which was partially offset by higher interest expense and a higher tax rate as a result of favorable prior period tax items recorded in the twelve months ended May 31, 2013. Adjusted Net Income/Loss removes unrealized foreign exchange (gain) loss, acquisition-related charges, share-based payment expense, costs related to share offerings, and other one-time or non-cash expenses. Please see the Adjusted Net Income/Loss table in the “Non-GAAP Financial Measures” section for the reconciliation of net income to Adjusted Net Income/Loss and Adjusted EPS.
Segment Results
The Company has two reportable operating segments: (i) Hockey and (ii) Baseball/Softball. The remaining operating segments do not meet the criteria for a reportable segment and are included in Other Sports. The Hockey segment includes the BAUER and MISSION brands. The Baseball/Softball segment includes the EASTON and COMBAT brands. Other Sports includes the Lacrosse and Soccer operating segments, which includes the MAVERIK, CASCADE, and INARIA brands. The Hockey segment sales channels include: (i) direct sales to retailers in North America and the Nordic countries, (ii) distributors throughout the rest of the world (principally, Western Europe, Eastern Europe, and Russia), and (iii) direct sales to teams. The Baseball/Softball segment sales channels primarily consist of retailers and distributors in North America. The Other Sports segment sales channels primarily include retailers and distributors in North America and direct sales to teams and sports associations.
These operating segments were determined based on the management structure established in the fourth quarter of Fiscal 2014 and the financial information, among other factors, reviewed by the Chief Operating Decision Maker (“CODM”) to assess segment performance. The decisions concerning assessing the performance of segments and allocation of resources to the segments are based on segments’ revenues and segment EBITDA.
60
Segmented operating results and other financial information for the twelve-month periods ended May 31, 2015, May 31, 2014 and May 31, 2013 is presented in the following table:
(millions of U.S. dollars, except for percentages) | Twelve Months Ended | % Change | % Change (Constant $) | % Change | % Change (Constant $) | |||||||||||||||
May 31, 2015 | May 31, 2014 | May 31, 2013 | ||||||||||||||||||
(1) | (2) | (3) | (4) | |||||||||||||||||
Revenues: | ||||||||||||||||||||
Hockey | $ | 418.4 | $ | 386.2 | $ | 370.9 | 8.3% | 13.3% | 4.1% | 6.2% | ||||||||||
Baseball/Softball | 199.3 | 24.5 | 0.1 | > 100.0% | > 100.0% | > 100.0% | > 100.0% | |||||||||||||
Other Sports | 36.9 | 35.5 | 28.6 | 4.1% | 5.5% | 24.1% | 25.3% | |||||||||||||
Total Revenues | $ | 654.7 | $ | 446.2 | $ | 399.6 | 46.7% | 51.3% | 11.7% | 13.7% | ||||||||||
Segment EBITDA (5)(6) | ||||||||||||||||||||
Hockey | $ | 66.6 | $ | 67.2 | 66.1 | (1.0)% | 26.6% | 1.7% | 4.0% | |||||||||||
Baseball/Softball | 35.9 | 0.5 | (0.6 | ) | > 100.0% | > 100.0% | > 100.0% | > 100.0% | ||||||||||||
Other Sports | 3.5 | 3.4 | 2.5 | 1.2% | (0.6)% | 37.7% | 38.9% | |||||||||||||
Total Segment EBITDA (5) (6) | $ | 106.0 | $ | 71.1 | $ | 68.0 | 48.8% | 74.5% | 4.6% | 7.0% | ||||||||||
(1) | Twelve-month period ended May 31, 2015 vs. the twelve-month period ended May 31, 2014. |
(2) | Represents the change in the constant currency U.S. dollars for the twelve-month period ended May 31, 2015 vs. the reported twelve-month period ended May 31, 2014. Results have been restated using actual exchange rates in use during the comparative period to enhance the visibility of the underlying business trends by excluding the impact of foreign currency exchange fluctuations. |
(3) | Twelve-month period ended May 31, 2014 vs. the twelve-month period ended May 31, 2013. |
(4) | Represents the change in the constant currency U.S. dollars for the twelve-month period ended May 31, 2014 vs. the reported twelve-month period ended May 31, 2013. Results have been restated using actual exchange rates in use during the comparative period to enhance the visibility of the underlying business trends by excluding the impact of foreign currency exchange fluctuations. |
(5) | Represents a non-GAAP financial measure.For the relevant definitions and reconciliations to reported results, see “Non-GAAP Financial Measures". |
(6) | Certain PSG functional platform costs are directly allocated to each operating segment based on usage or other relevant operational metrics. PSG’s functional platform costs consist of expenses incurred by centrally managed functions, including global information systems, finance and legal, distribution and logistics, sourcing and manufacturing, and other miscellaneous costs. |
Fiscal 2015 compared to Fiscal 2014
Hockey
Currency neutral Hockey revenues increased by $51.4 million, or 13.3% driven by 18.6% growth in helmets resulting from the launch of the RE-AKT 100 helmet and continued growth in the retail team business, 15.6% growth in composite sticks due to the strong demand for the new SUPREME and VAPOR family of sticks, 10.1% growth in protective equipment, and 7.4% growth in skates due to a two family launch of NEXUS and VAPOR products compared to the one family SUPREME launch in Fiscal 2014 as well as strong sales for the VAPOR 1X skate. Hockey apparel revenues grew by 36.4% driven by strong growth in all apparel categories which includes performance apparel, uniforms, off-ice team apparel, lifestyle apparel and bags. Including the impact of foreign exchange, reported Fiscal 2015 Hockey revenues increased by $32.2 million, or 8.3%, driven by growth in all hockey equipment categories and strong growth in apparel, partially offset by an unfavorable impact from foreign exchange.
Currency neutral Hockey segment EBITDA increased by $17.9 million, or 26.6% driven by the higher revenues described above, higher gross margins and lower R&D and SG&A spending as a percent of sales. Hockey gross margins improved as a result of higher margins on hockey uniforms driven by the higher initial costs to support uniforms growth in Fiscal 2014, which more than offset the impact of growth in sticks and apparel which carry slightly lower gross margins than other ice hockey equipment categories. Including the impact of foreign exchange, reported Fiscal 2015 Hockey segment EBITDA decreased by $0.6 million, or 1.0%, to $66.6 million driven by the significant impact of foreign exchange, which more than offset the impacts described above.
Baseball/Softball
Baseball/Softball revenue in Fiscal 2015 increased by $174.9 million, or greater than 100%, to $199.3 million due to the addition of Easton Baseball/Softball.
61
Baseball/Softball segment EBITDA in Fiscal 2015 increased by $35.4 million, or greater than 100%, to $35.9 million due to the addition of Easton Baseball/Softball.
Other Sports
Revenues in our Other Sports segment in Fiscal 2015 increased by $1.5 million, or 4.1%, to $36.9 million due to 6.0% growth in lacrosse sales driven by 28.0% growth in MAVERIK lacrosse equipment and the addition of team uniforms, partially offset by a 3.9% decline in lacrosse helmet sales as a result of the NOCSAE decertification in November 2014. Growth in MAVERIK lacrosse equipment was led by strong demand for the new line of heads and shafts, as well as strong growth in the new line of protective equipment and team gloves.
Other Sports segment EBITDA in Fiscal 2015 increased by $0.1 million, or 1.2%, driven by the impact of higher revenues, which was largely offset by lower gross margins in our lacrosse business as a result of the decline in helmet sales, and higher sales and marketing expenses in our soccer segment.
Fiscal 2014 compared to Fiscal 2013
Hockey
Hockey revenues were $386.2 million in Fiscal 2014, compared to $370.9 million in Fiscal 2013, an increase of $15.3 million or 4.1%. The increase in Hockey revenues was driven by 4.1% growth in ice hockey equipment and 40.3% growth in hockey apparel, partially offset by unfavorable impacts from foreign exchange and the impact of lower wholesale prices as a result of the Canadian Tariff Reduction. Ice hockey equipment revenue growth was driven by 4.2% growth in sticks, 4.4% growth in protective equipment, 3.7% growth in skates, and 19.5% growth in accessories due to strong demand for the TUUK LIGHTSPEED EDGE holder and replacement steel blades. Hockey apparel growth was driven by the addition of team uniforms, 30.1% growth in off-ice team apparel, 27.0% growth in our base layer performance apparel, and 34.0% growth in lifestyle apparel. Excluding the impact of foreign exchange and the impact of lower wholesale prices as a result of the Canadian Tariff Reduction, Hockey revenues increased by 6.9%.
Hockey segment EBITDA in Fiscal 2014 increased by $1.1 million, or 1.7%, driven by higher gross margins in ice hockey equipment, partially offset by the impact of foreign exchange and higher initial costs to support the growth in the uniforms business. Excluding the impact of foreign exchange, Hockey segment EBITDA increased by $2.7 million, or 4.0%.
Baseball/Softball
Baseball/Softball revenue was $24.5 million in Fiscal 2014, compared to $0.1 million in Fiscal 2013, an increase of $24.4 million or greater than 100%. The increase in Baseball/Softball revenue resulted from the Easton Baseball/Softball Acquisition in April 2014 and the Combat Acquisition in May 2013.
Baseball/Softball segment EBITDA in Fiscal 2014 increased by $1.1 million, from a loss of $0.6 million to income of $0.5 million due to the addition of Easton Baseball/Softball. The increase in Baseball/Softball segment EBITDA resulted from the Easton Baseball/Softball Acquisition in April 2014, and the Combat Acquisition in May 2013.
Other Sports
Other Sports revenues were $35.5 million in Fiscal 2014, compared to $28.6 million in Fiscal 2013, an increase of $6.9 million or 24.1%. The increase in Other Sports revenues was driven by 19.0% growth in Lacrosse as a result of strong demand for the new CASCADE “R” helmet, the new line of Maverik products, including the launch of a women’s product line, and twelve months of Cascade sales in Fiscal 2014 as compared to eleven months in Fiscal 2013. Additionally, Other Sports revenue growth benefited from a full year of Inaria soccer uniform sales compared to four and a half months in Fiscal 2013.
Other Sports segment EBITDA in Fiscal 2014 increased by $0.9 million, or 37.7%, driven by the revenue growth in Lacrosse and improvement in Soccer segment EBITDA resulting from the impact of a full year of Inaria soccer uniform sales and the integration of Inaria into the PSG platform.
For operating segments data and geographic segments data, please refer to Note 17 of the Notes to Consolidated Financial Statements.
62
Non-GAAP Financial Measures
This annual report on Form 10-K makes reference to certain non-GAAP measures. These non-GAAP measures are not recognized measures under U.S. GAAP and do not have a standardized meaning prescribed by U.S. GAAP. When used, these measures are defined in such terms as to allow the reconciliation to the closest U.S. GAAP measure. These measures are therefore unlikely to be comparable to similar measures presented by other companies. Rather, these measures are provided as additional information to complement those U.S. GAAP measures by providing further understanding of the Company’s results of operations from management’s perspective. Accordingly, they should not be considered in isolation nor as a substitute for analyses of the Company’s financial information reported under U.S. GAAP. We use non-GAAP measures, such as Adjusted Net Income/Loss, Adjusted EPS, Adjusted EBITDA and Adjusted Gross Profit, to provide investors with a supplemental measure of our operating performance and thus highlight trends in our core business that may not otherwise be apparent when relying solely on U.S. GAAP financial measures. We also believe that securities analysts, investors and other interested parties frequently use non-GAAP measures in the evaluation of issuers. We also use non-GAAP measures in order to facilitate operating performance comparisons from period to period, prepare annual operating budgets, and to assess our ability to meet our future debt service, capital expenditure, and working capital requirements.
Constant Currency
The Company also presents certain information related to our current period results of operations in this Item 7 through "constant currency", which is a non-GAAP financial measure and should be viewed as a supplement to our results of operations and presentation of reportable segments under U.S. GAAP. These amounts reflect the impact of translating the current period results at the monthly foreign exchange rates of the prior year period, the effect of changes in the value of the Canadian dollar against the U.S. dollar on our cost of goods purchased for sale outside of the United States including the related realized gains/losses on derivatives described above, and the realized gains/losses generated from revaluing non-functional currency assets and liabilities. The reported foreign exchange impact does not include the impact of fluctuations in Asian currencies against the U.S. dollar and their related effect on our Asian-sourced finished goods. Constant currency is used to enhance the visibility of the underlying business trends excluding the impact of foreign currency exchange rate fluctuations. We also use the terms "currency neutral" or "excluding the impact of foreign currency" to describe the constant currency impact. See "Factors Affecting Our Performance - Impact of Foreign Exchange and Hedging Practices" and "Results of Operations - Segment Results".
The definition and reconciliation of Adjusted Gross Profit, Adjusted EBITDA, Adjusted Net Income/Loss, and Adjusted EPS used and presented by the Company to the most directly comparable U.S. GAAP measures follows below.
Adjusted Gross Profit
Adjusted Gross Profit is defined as gross profit plus the following expenses which are part of cost of goods sold: (i) amortization and depreciation of intangible assets, (ii) charges to cost of goods sold resulting from fair market value adjustments to inventory as a result of business acquisitions, (iii) reserves established to dispose of obsolete inventory acquired from acquisitions, and (iv) other one-time or non-cash items. We use Adjusted Gross Profit as a key performance measure to assess our core gross profit and as a supplemental measure to evaluate the overall operating performance of our cost of goods sold.
The table below provides the reconciliation of gross profit to Adjusted Gross Profit:
Twelve Months Ended May 31, | ||||||||||||
(millions of U.S. dollars) | 2015 | 2014 | 2013 | |||||||||
Gross profit | $ | 206.4 | $ | 154.3 | $ | 147.2 | ||||||
Amortization & depreciation of intangible assets (1) | 13.6 | 4.8 | 3.6 | |||||||||
Inventory step-up/step-down & reserves (2) | 7.0 | 4.6 | 1.7 | |||||||||
Other (3) | 2.4 | 1.0 | 0.5 | |||||||||
Adjusted Gross Profit | $ | 229.4 | $ | 164.7 | $ | 153.0 | ||||||
63
(1) | Upon completion of the purchase of the Bauer business from Nike in 2008, the Maverik Acquisition in 2010, the Cascade Acquisition in June 2012, the Inaria Acquisition in October 2012, the Combat Acquisition in May 2013, and the Easton Baseball/Softball Acquisition in April 2014, the Company capitalized acquired intangible assets at fair market value. These intangible assets, in addition to other intangible assets subsequently acquired, are amortized over their useful life and we recognize the amortization as a non-cash cost of goods sold. |
(2) | Upon completion of the Inaria, Combat Sports and Easton Baseball/Softball acquisitions, the Company adjusted Inaria’s, Combat Sports’ and Easton Baseball/Softball’s inventories to fair market value. Included in the twelve-month periods ended May 31, 2015, May 31, 2014 and May 31, 2013 are charges to cost of goods sold resulting from the fair market value adjustment to inventory. This line also includes costs associated with the integration of the Inaria Acquisition in the twelve-month period ended May 31, 2014. |
(3) | Other represents the impact of costs related to the lacrosse helmet decertification for the twelve-month period ended May 31, 2015. Other represents the impact of the Canadian Tariff Reduction for the twelve-month periods ended May 31, 2014 and May 31, 2013. |
See “Factors Affecting our Performance - Impact of Foreign Exchange and Hedging Practices” for Adjusted Gross Profit in constant currency.
Adjusted EBITDA
Adjusted EBITDA is defined as net income adjusted for income tax expense, depreciation and amortization, losses related to amendments to the credit facilities, gain or loss on disposal of fixed assets, net interest expense, deferred financing fees, unrealized gains/losses on derivative instruments, and realized and unrealized gains/losses related to foreign exchange revaluation, and before restructuring and other one-time or non-cash charges associated with acquisitions, other one time or non-cash items, costs related to share offerings, as well as share-based payment expenses. We use Adjusted EBITDA as the key metric in assessing our business performance when we compare results to budgets, forecasts and prior years. Management believes Adjusted EBITDA is an important measure of operating performance and cash flow, and provides useful information to investors because it highlights trends in the business that may not otherwise be apparent when relying solely on U.S. GAAP measures, and eliminates items that have less bearing on operating performance and cash flow. It is an alternative to measure business performance to net income and operating income, and management believes Adjusted EBITDA is a better measure of cash flow generation than, for example, cash flow from operations, particularly because it removes cash flow fluctuations caused by extraordinary changes in working capital. Adjusted EBITDA is used by management in the assessment of business performance and used by our Board of Directors as well as our lenders in assessing management's performance. It is also the key metric in determining payments under incentive compensation plans.
The table below provides the reconciliation of net income (loss) to Adjusted EBITDA:
Twelve Months Ended May 31, | ||||||||||||
(millions of U.S. dollars) | 2015 | 2014 | 2013 | |||||||||
Net income (loss) | $ | 3.3 | $ | 20.0 | $ | 25.2 | ||||||
Income tax expense (benefit) | 3.4 | 6.3 | 8.6 | |||||||||
Depreciation & amortization | 21.3 | 11.1 | 8.3 | |||||||||
Loss on extinguishment of debt | — | 2.6 | 0.3 | |||||||||
Gain on bargain purchase | — | — | (1.2 | ) | ||||||||
Loss on disposal of fixed assets | — | 0.2 | — | |||||||||
Interest expense, net | 17.3 | 8.1 | 7.3 | |||||||||
Deferred financing fees | 2.5 | 1.6 | 1.5 | |||||||||
Unrealized (gain)/loss on derivative instruments, net (1) | 2.2 | 2.0 | (0.9 | ) | ||||||||
Foreign exchange (gain)/loss (1) | 19.6 | (4.8 | ) | (0.5 | ) | |||||||
EBITDA | $ | 69.6 | $ | 47.1 | $ | 48.6 | ||||||
Acquisition Related Charges: | ||||||||||||
Inventory step-up/step-down & reserves (2) | 7.0 | 4.6 | 1.7 | |||||||||
Rebranding/integration costs (3) | 8.7 | 3.7 | 3.2 | |||||||||
Acquisition costs (4) | 2.3 | 7.3 | 2.6 | |||||||||
Subtotal | $ | 18.0 | $ | 15.6 | $ | 7.5 | ||||||
Costs related to share offerings (5) | 0.1 | 0.5 | 0.8 | |||||||||
Share-based payment expense | 7.1 | 4.7 | 4.2 | |||||||||
Other(6) | 3.5 | 1.0 | 1.7 | |||||||||
Adjusted EBITDA | $ | 98.3 | $ | 68.9 | $ | 62.8 | ||||||
64
(1) | The unrealized gain/loss on derivatives is the change in fair market value of the foreign currency forward contracts and interest rate contracts. The Company has not elected hedge accounting and therefore the changes in the fair value of these derivatives are recognized through profit or loss each reporting period. The foreign exchange gain/loss is the realized and unrealized gains and losses generated by the effect of foreign exchange on recorded assets and liabilities denominated in a currency different from the functional currency of the applicable entity are recorded in foreign exchange (gain) loss, as applicable, in the period in which they occur. |
(2) | Upon completion of the Inaria, Combat Sports and Easton Baseball/Softball acquisitions, the Company adjusted Inaria’s, Combat Sports’ and Easton Baseball/Softball’s inventories to fair market value. Included in the twelve-month periods ended May 31, 2015, May 31, 2014 and May 31, 2013 are charges to cost of goods sold resulting from the fair market value adjustment to inventory. This line also includes costs associated with the integration of the Inaria Acquisition in the twelve-month period ended May 31, 2014. |
(3) | The rebranding/integration costs for the twelve-month period ended May 31, 2015 are associated with the integration of the Inaria, Combat Sports and Easton Baseball/Softball acquisitions. The rebranding/integration costs for the twelve-month period ended May 31, 2014 are associated with the integration of the Cascade, Inaria, Combat Sports and Easton Baseball/Softball acquisitions. The rebranding/integration costs for the twelve-month period ended May 31, 2013 are associated with the integration of the Cascade, Inaria and Combat Sports acquisitions. |
(4) | Acquisition-related transaction costs include legal, audit, and other consulting costs. The twelve-month period ended May 31, 2015 include costs related to the Easton Baseball/Softball Acquisition and costs related to reviewing corporate opportunities. The twelve-month period ended May 31, 2014 include costs related to the Combat Acquisition, the Easton Baseball/Softball Acquisition. Acquisition-related transaction costs in the twelve-month period ended May 31, 2013 include costs related to the Cascade, Inaria and Combat Sports acquisitions. All periods presented include costs related to reviewing corporate opportunities. |
(5) | The costs related to share offerings in the twelve-month periods ended May 31, 2015 and 2014 include legal, audit, and other consulting costs incurred as part of the U.S. IPO. The costs related to share offerings in the twelve-month period ended May 31, 2013 include legal, audit, and other consulting costs incurred as part of secondary offerings of Common Shares completed by funds managed by Kohlberg Management VI, LLC on October 17, 2012, February 6, 2013 and November 1, 2013. |
(6) | Other represents the impact of costs related to the lacrosse helmet decertification for the twelve-month period ended May 31, 2015. Other for the twelve-month period ended May 31, 2014 represents the impact of the Canadian Tariff Reduction. For the twelve-month period ended May 31, 2013, other represents the impact of the Canadian Tariff Reduction and $1.2 million for termination benefits. |
See “Factors Affecting our Performance - Impact of Foreign Exchange and Hedging Practices” for Adjusted EBITDA in constant currency.
Adjusted Net Income/Loss and Adjusted EPS
Adjusted Net Income/Loss is defined as net income adjusted for all unrealized gains/losses related to derivative instruments and unrealized gains/losses related to foreign exchange revaluation, non-cash or incremental charges associated with acquisitions, amortization of acquisition-related intangible assets for acquisitions since the Canadian IPO in March 2011, costs related to share offerings, share-based payment expense and other non-cash or one-time items. Adjusted EPS is defined as Adjusted Net Income/Loss divided by the weighted average diluted shares outstanding. We use Adjusted Net Income/Loss and Adjusted EPS as key metrics for assessing our operational business performance and to assist with the planning and forecasting for the future operating results of the underlying business of the Company. We believe Adjusted Net Income/Loss and Adjusted EPS are useful information to investors because they highlight trends in the business that may not otherwise be apparent when relying solely on U.S. GAAP measures.
The table below provides the reconciliation of net income (loss) to Adjusted Net Income/Loss and to Adjusted EPS:
Twelve Months Ended May 31, | ||||||||||||
(millions of U.S. dollars, except share and per share amounts) | 2015 | 2014 | 2013 | |||||||||
Net income (loss) | $ | 3.3 | $ | 20.0 | $ | 25.2 | ||||||
Foreign exchange loss / (gain) (1) | 20.4 | (1.5 | ) | (1.1 | ) | |||||||
Costs related to share offerings (2) | 0.1 | 0.5 | 0.8 | |||||||||
Acquisition-related charges (3) | 30.5 | 19.2 | 9.5 | |||||||||
Share-based payment expense | 7.1 | 4.7 | 4.2 | |||||||||
Other (4) | 3.5 | 3.9 | 0.8 | |||||||||
Tax impact on above items | (17.4 | ) | (9.5 | ) | (3.6 | ) | ||||||
Adjusted Net Income (Loss) | $ | 47.5 | $ | 37.3 | $ | 35.8 | ||||||
Average diluted shares outstanding | 46,354,657 | 37,475,278 | 36,428,019 | |||||||||
Adjusted EPS | $ | 1.02 | $ | 1.00 | $ | 0.98 | ||||||
(1) | The foreign exchange loss / gain represents the unrealized gain/loss on derivatives and the unrealized portion of the foreign exchange gain/loss from the Adjusted EBITDA table. The unrealized portion of the foreign exchange gain/loss in the twelve-month periods ended May 31, 2015, May 31, 2014 and May 31, 2013 was a loss of $18.2 million, a gain of $3.5 million and a gain of $0.2 million, respectively. |
65
(2) | The costs related to share offerings in the twelve-month periods ended May 31, 2015 and May 31, 2014 include legal, audit, and other consulting costs incurred as part of the U.S. IPO. The costs related to share offerings in the twelve-month period ended May 31, 2013 include legal, audit, and other consulting costs incurred as part of secondary offerings of Common Shares completed by funds managed by Kohlberg Management VI, LLC on October 17, 2012, February 6, 2013 and November 1, 2013. |
(3) | Acquisition-related charges include rebranding/integration costs, and legal, audit, and other consulting costs associated with acquisition transactions. The twelve-month period ended May 31, 2015 include costs related to the Easton Baseball/Softball Acquisition. The twelve-month period ended May 31, 2014 include costs related to the Combat Acquisition, the Easton Baseball/Softball Acquisition. Acquisition-related transaction costs in the twelve-month period ended May 31, 2013 include costs related to the Cascade, Inaria and Combat Sports acquisitions. All periods presented include costs related to reviewing corporate opportunities. The charges also include amortization of intangible assets in the twelve-month periods ended May 31, 2015, May 31, 2014 and May 31, 2013 of $12.5 million, $3.6 million, and $2.0 million, respectively. Also included are charges to cost of goods sold resulting from the fair market value adjustment to inventory in the twelve-month periods ended May 31, 2015, May 31, 2014 and May 31, 2013 of $7.0 million, $4.6 million, and $1.7 million, respectively. This line also includes costs associated with the integration of the Inaria Acquisition in the twelve-month period ended May 31, 2014. |
(4) | Other represents the impact of costs related to the lacrosse helmet decertification in the twelve-month period ended May 31, 2015. For the twelve-month period ended May 31, 2014, other items represent the impact of the Canadian Tariff Reduction, the write-off of deferred financing fees recorded as a result of the replacement of the existing credit facilities with the New Term Loan Facility and the New ABL Facility and loss on disposal of fixed assets. Other items for the twelve-month period ended May 31, 2013 include the $1.2 million gain on bargain purchase related to the Combat Acquisition, $1.2 million for termination benefits and $0.5 million related to the Canadian Tariff Reduction. Also included in the twelve months ended May 31, 2013 is the write-off of $0.3 million of deferred financing fees as a result of amending the Credit Facility. |
See “Factors Affecting our Performance - Impact of Foreign Exchange and Hedging Practices” for Adjusted Net Income (Loss) and Adjusted EPS in constant currency.
Liquidity and Capital Resources
Cash Flows
The primary sources of the Company’s cash are net cash flows from operating activities and funds available under its New ABL Facility (defined herein). We believe that ongoing operations and associated cash flows, in addition to our cash resources and New ABL Facility, provide sufficient liquidity to support our business operations for at least the next 12 months. Furthermore, as of May 31, 2015, the Company held cash and cash equivalents of $2.9 million, our working capital was $332.4 million, and we had availability of $105.7 million under the New ABL Facility, which provides further flexibility to meet any unanticipated cash requirements due to changes in working capital commitments or liquidity risks associated with financial instruments. Such changes may arise from, among other things, the seasonality of our business (see “Factors Affecting our Performance - Seasonality” and “Liquidity and Capital Resources”), the failure of one or more customers to pay their obligations (see the “Quantitative and Qualitative Disclosures About Market Risk-Credit Risk” section) or from losses incurred on derivative instruments, such as foreign currency forwards and interest rate contracts (see “Factors Affecting our Performance - Interest Expense”).
The following table summarizes our net cash flows provided by and used in operating, investing and financing activities:
Twelve Months Ended | ||||||||
(millions of U.S. dollars) | May 31, 2015 | May 31, 2014 | ||||||
Net cash flows from (used in) operating activities | $ | 11.6 | $ | 9.9 | ||||
Net cash flows from (used in) investing activities | (16.8 | ) | (358.4 | ) | ||||
Net cash flows from (used in) financing activities | 1.8 | 351.3 | ||||||
Effect of exchange rate changes on cash | (0.6 | ) | (0.5 | ) | ||||
(Decrease) / increase in cash | (4.0 | ) | 2.4 | |||||
Beginning cash | 6.9 | 4.5 | ||||||
Ending cash | $ | 2.9 | $ | 6.9 | ||||
Net Cash From (Used In) Operating Activities
Our largest source of operating cash flows is cash collections from the sale of inventory. Our primary cash outflows from operating activities are inventory purchases, personnel-related expenses, occupancy costs, payment of interest and payment of taxes. Net cash from operating activities for the twelve-month period ended May 31, 2015 was $11.6 million, an increase of $1.7 million, compared to net cash from operating activities of $9.9 million for the twelve-month period ended May 31, 2014, primarily driven by the following:
• | $22.3 million lower use of cash from accounts receivable, due to an increase in payments received for receivables; |
• | $5.9 lower use of cash from accrued liabilities related to the timing of settlement for the liabilities; partially |
66
offset by
• | $11.9 million lower source of cash from inventory, due to increasing inventory needs required to support future revenue growth; |
• | $4.9 million lower source of cash from accounts payable related to the timing of payments for inventory purchases; and |
• | $8.3 million higher use of cash as a result of lower cash earnings. |
Net Cash From (Used In) Investing Activities
Our cash outflows from investing activities are primarily for acquisitions and the purchase of property, plant and equipment and intangible assets. Net cash used in investing activities for the twelve-month period ended May 31, 2015 was $16.8 million, an increase of $341.6 million, compared to net cash used of $358.4 million for the twelve-month period ended May 31, 2014, primarily due to the following:
• | $353.1 million lower cash outflow due to the Easton Baseball/Softball Acquisition in the twelve-month period ended May 31, 2014; offset by |
• | $11.5 million of higher cash outflow related to the purchase of property, plant and equipment and intangible assets. |
Net Cash From (Used In) Financing Activities
Our cash flows from financing activities consist primarily of proceeds from and repayment of debt, proceeds from the issuance of Common Shares and share issuances under stock option plans. Net cash from financing activities for the twelve-month period ended May 31, 2015 was $1.8 million, a decrease of $349.5 million, compared to net cash from financing activities of $351.3 million for the twelve-month period ended May 31, 2014, primarily due to the following:
• | $116.8 million of net cash inflow related to the net proceeds of the U.S. IPO; partially offset by |
• | $433.2 million lower net cash inflow related to the financing of the Easton Baseball/Softball Acquisition with a combination of an asset-backed revolving credit facility and senior secured loans in the twelve months ended May 31, 2014; |
• | $13.0 million increase in net cash outflow related to repayment of debt; and |
• | $17.4 million decrease in net cash inflow related to the net movement in revolving debt. |
Indebtedness
Credit Facilities
Concurrently with the closing of the Easton Baseball/Softball Acquisition, the Company entered into the New Term Loan Facility (as defined herein) and the Company and certain of its subsidiaries entered into the New ABL Facility (as defined herein). The New Term Loan Facility and the New ABL Facility (referred to herein together as the “Credit Facilities”) replaced the Company's existing credit facilities.
As of May 31, 2015, $330.5 million was drawn under the New Term Loan Facility and $92.9 million was drawn under the New ABL Facility. Following completion of the U.S. IPO on June 25, 2014, the Company used the net proceeds of the U.S. IPO and repaid approximately $119.5 million under the New Term Loan Facility. The repayment was first applied against the outstanding amortization payments and as such no further amortization payments are due for the life of the facility.
New Term Loan Facility
Concurrently with the closing of the Easton Baseball/Softball Acquisition, the Company entered into an amortizing term credit facility in the principal amount of $450 million U.S. dollars by and among the Company, as borrower, Bank of America, N.A., as administrative agent and collateral agent, Bank of America, N.A., J.P. Morgan Securities LLC, RBC Capital Markets and
67
Morgan Stanley Senior Funding, Inc., as joint lead arrangers, Bank of America, N.A., J.P. Morgan Securities LLC, and RBC Capital Markets, as bookrunners, JP Morgan Chase Bank, N.A. and RBC Capital Markets, as syndication agents, and the lenders party thereto from time to time (the “New Term Loan Facility”). The New Term Loan Facility matures on April 15, 2021. The New Term Loan Facility contains representations and warranties, affirmative and negative covenants and events of default customary for credit facilities of this nature.
The New Term Loan Facility may be prepaid at any time in whole or in part without premium or penalty, upon written notice, at the option of the Company, other than reimbursement of the New Term Loan Facility lenders for any funding losses and redeployment costs (but not loss of margin) resulting from prepayments of LIBOR advances in certain circumstances. Any amounts prepaid under the New Term Loan Facility may not be reborrowed. In certain circumstances, the Company is permitted to add one or more incremental term loan facilities under the New Term Loan Facility. As well, in certain circumstances and from time to time, the Company is permitted to refinance loans or incremental term loans under the New Term Loan Facility, in whole or in part.
Interest Rates
The interest rates per annum applicable to the New Term Loan Facility equal the sum of (a) the applicable margin percentage (as described below), plus, at the Company's option, (b) either LIBOR, subject to a 1% floor or the U.S. base rate (each as determined in accordance with the terms of the New Term Loan Facility). The applicable margin is 3.50% per annum in the case of LIBOR advances and 2.50% per annum in the case of U.S. base rate advances. The Company's $119.5 million repayment from the net proceeds of the U.S. IPO activated the Leverage Step-Down Trigger (as defined in the New Term Loan Facility). Effective July 1, 2014, the applicable margin is 3.00% per annum in the case of LIBOR advances and 2.00% per annum in the case of U.S. base rate advances for so long as the Consolidated Total Net Leverage Ratio (as defined in the New Term Loan Facility) remains less than 4.25:1.00. If the Consolidated Total Net Leverage Ratio (as defined in the New Term Loan Facility) is greater than or equal to 4.25:1.00, the applicable margin is 3.50% per annum in the case of LIBOR advances and 2.50% per annum in the case of U.S. base rate advances.
Guarantees and Security
The obligations of the Company under the New Term Loan Facility are guaranteed by certain subsidiaries of the Company, including each of the existing and future direct and indirect wholly-owned material Canadian and U.S. subsidiaries of the Company (collectively, the “Term Loan Guarantors”). The New Term Loan Facility is secured by a perfected first priority security interest (subject to permitted liens and certain exceptions) in: (a) all present and future shares of capital stock of each present and future subsidiary of the Company (subject to certain exceptions); (b) all present and future debt owed to the Company or any Term Loan Guarantor; and (c) all present and future property and assets, real and personal (other than assets constituting ABL Priority Collateral (as defined herein)) of the Company and each Term Loan Guarantor; and (d) all proceeds and products of the property and assets described above (collectively, the “Term Priority Collateral”). The New Term Loan Facility is further secured by a perfected second priority security interest in the ABL Priority Collateral (as defined herein), subject to permitted liens and certain exceptions.
New ABL Facility
Concurrently with the closing of the Easton Baseball/Softball Acquisition, the Company and certain of its subsidiaries entered into a revolving, non-amortizing asset-based credit facility in an amount equal to the lesser of $200 million U.S. dollars (or the Canadian dollar equivalent thereof) and the Borrowing Base (as defined herein) by and among Bauer Hockey Corp. and its Canadian subsidiaries from time to time party thereto, as Canadian borrowers (collectively, the “Canadian ABL Borrowers”), Bauer Hockey, Inc. and its U.S. subsidiaries from time to time party thereto, as U.S. borrowers (collectively, the “U.S. ABL Borrowers” and, collectively with the Canadian ABL Borrowers, the “ABL Borrowers”), the Company as parent, Bank of America, N.A., as administrative agent and collateral agent, JP Morgan Chase Bank, N.A. and an affiliate of RBC Dominion Securities Inc., as syndication agents, Bank of America, N.A., J.P. Morgan Securities LLC, RBC Capital Markets and Morgan Stanley Senior Funding, Inc., as joint lead arrangers, Bank of America, N.A., J.P. Morgan Securities LLC, and RBC Capital Markets, as bookrunners, and the various lenders party thereto (the “New ABL Facility”). The ABL Borrowers are permitted under the New ABL Facility to solicit the lenders to provide additional revolving loan commitments in an aggregate amount not to exceed $75 million U.S. dollars (or the Canadian dollar equivalent thereof). The New ABL Facility matures on April 15, 2019 and may be drawn in U.S. dollars by the U.S. ABL Borrowers and either U.S. dollars or Canadian dollars by the Canadian ABL Borrowers, as LIBOR loans, CDOR loans, U.S. base rate loans, Canadian prime rate loans, as applicable, or letters of credit or swingline loans (with a sublimit of up to $25 million U.S. dollars available for letters of credit and up to $20 million U.S. dollars for swingline loans (or, in each case, the Canadian dollar equivalent thereof)), each as determined in accordance with the terms of the New ABL Facility. The New ABL Facility contains representations and warranties, affirmative and negative covenants, and events of default customary for credit facilities of this nature.
68
Under the New ABL Facility, the ABL Borrowers were permitted to draw up to $25 million U.S. dollars (or the Canadian dollar equivalent thereof) to partially finance the Easton Baseball/Softball Acquisition and drew approximately $22 million in connection therewith. The ABL Borrowers are permitted to use the undrawn amount under the New ABL Facility from time to time for ordinary course working capital and for general corporate purposes. Voluntary reductions of the unutilized portion of the New ABL Facility commitments and voluntary prepayments under the New ABL Facility are permitted at any time, without premium or penalty, subject to reimbursement of the Lenders’ redeployment costs in the case of prepayments of LIBOR advances in certain circumstances. Voluntary prepayments under the New ABL Facility may be reborrowed.
Borrowing Base
The borrowing base (the “Borrowing Base”) under the New ABL Facility for the interim period up until the 90th day following April 15, 2014 (subject to extension at the discretion of the Agent) is deemed to be the greater of $100 million or as calculated by adding the net book value of (a) Accounts of Bauer Hockey Corp. and Bauer Hockey, Inc. (collectively, the “Borrowers”), multiplied by the advance rate of 50%, plus (b) the net book value of Inventory of the Borrowers located in the United States or Canada multiplied by the advance rate of 45%. The Borrowing Base for the interim period up until the 90th day following April 15, 2014 was extended to September 15, 2014.
After the interim period the Borrowing Base equals the sum of the Canadian Borrowing Base (as defined herein) and the U.S. Borrowing Base (as defined herein).
The “Canadian Borrowing Base” means, subject to customary reserves and eligibility criteria, the sum of: (a) 85% of the Canadian ABL Borrowers’ eligible accounts receivable; plus (b) the lesser of 70% of the cost (valued on a first in, first out basis) of the Canadian ABL Borrowers' eligible inventory, or 85% of the appraised net orderly liquidation value of the Canadian ABL Borrowers’ eligible inventory.
The “U.S. Borrowing Base” means, subject to customary reserves and eligibility criteria, the sum of: (a) 85% of the U.S. ABL Borrowers’ eligible accounts receivable; plus (b) the lesser of 70% of the cost (valued on a first in, first out basis) of the U.S. ABL Borrowers’ eligible inventory, or 85% of the appraised net orderly liquidation value of the U.S. ABL Borrowers' eligible inventory.
Interest Rates and Fees
At the option of the ABL Borrowers, until August 31, 2014, the interest rates under the New ABL Facility were (i) LIBOR or CDOR, as applicable, plus 1.75% per annum or (ii) the U.S. base rate or Canadian prime rate, as applicable, plus 0.75% per annum. Following August 31, 2014, interest rate margins under the New ABL Facility are determined with reference to the following grid, based on the average availability, as a percentage of the aggregate commitments, during the immediately preceding quarter:
Average Availability (% of Line Cap) | Interest Rate Margin for LIBOR/CDOR Rate Loans | Interest Rate Margin for U.S. Base Rate/Canadian Prime Rate Loans | ||
Equal to or greater than 66% | 1.50% | 0.50% | ||
Less than 66% but equal to or greater than 33% | 1.75% | 0.75% | ||
Less than 33% | 2.00% | 1.00% | ||
The ABL Borrowers may elect interest periods of one, two, three or six months (or 12 months if agreed to by all the Lenders) for LIBOR or CDOR loans.
A per annum fee equal to the interest rate margin for LIBOR or CDOR loans under the New ABL Facility will accrue on the average daily amount of the aggregate undrawn amount of outstanding letters of credit, payable in arrears on the first day of each quarter. In addition, the ABL Borrowers shall pay (a) a fronting fee equal to 0.125% on the average daily amount of the aggregate undrawn amount of outstanding letters of credit, and (b) customary issuance and administration fees.
The ABL Borrowers initially paid a commitment fee of 0.50% per annum on the average daily unused portion of the New ABL Facility. From and after August 31, 2014, the commitment fee is determined by reference to the following grid based on the average utilization of the commitments under the New ABL Facility during the immediately preceding fiscal quarter:
69
Average Usage (% of commitments) | Commitment Fee % | ||
Less than 50% | 0.375 | % | |
Equal to or greater than 50% | 0.25 | % | |
The interest rate on the Credit Facilities for the twelve-month period ended May 31, 2015 ranged from 1.9% to 4.5%. As of May 31, 2015, there are five letters of credit totaling $1.4 million outstanding under the New ABL Facility.
Guarantees and Security
The obligations of the ABL Borrowers under the New ABL Facility are guaranteed by the Company and certain subsidiaries of the Company, including each of the existing and future direct and indirect wholly owned material Canadian and U.S. subsidiaries of the Company (collectively, the “ABL Guarantors”).
The New ABL Facility is secured by a perfected first priority security interest (subject to permitted liens and certain exceptions) in (a) all present and future accounts receivable (except to the extent constituting proceeds of equipment, real property or intellectual property and intercompany loans); (b) all present and future inventory; (c) all present and future instruments, chattel paper and other contracts, in each case, evidencing, or substituted for, any accounts receivable referred to in clause (a) above; (d) all present and future guarantees, letters of credit, security and other credit enhancements in each case for the accounts receivable; (e) all present and future documents of title for any inventory referred to in clause (b) above; (f) all present and future commercial tort claims and general intangibles in each case to the extent relating to any of the accounts receivable referred to in clause (a) above or inventory referred to in clause (b) above, but excluding intercompany debt and capital stock; (g) all present and future bank accounts, securities accounts (including all cash and other funds on deposit therein, except to the extent constituting identifiable proceeds of the Fixed Asset Priority Collateral (as defined therein) or any such account which holds solely such identifiable proceeds of the Fixed Asset Priority Collateral) or investment property and any capital stock; (h) all present and future tax refunds; (i) all present and future supporting obligations, documents and books and records relating to any of the foregoing; and (j) all substitutions, replacements, accessions, products or proceeds (including, without limitation, insurance proceeds) of any of the foregoing (collectively, the “ABL Priority Collateral”). The New ABL Facility is further secured by a perfected second priority security interest in the Term Priority Collateral (subject to permitted liens and certain exceptions).
Leverage Ratio
The former credit facilities and the current Credit Facilities define Leverage Ratio as Net Indebtedness divided by EBITDA. Net Indebtedness includes such items as the Company’s term loan, capital lease obligations, subordinated indebtedness, and average revolving loans for the last 12 months as of the reporting date, less the average amount of cash for the last 12 months as of the reporting date. EBITDA is defined in both the former credit facilities and Credit Facilities. The following table depicts the Company’s Leverage Ratio:
As of | As of | As of | As of | As of | |||||
May 31, | February 28, | November 30, | August 31, | May 31, | |||||
2015 (1) | 2015 | 2015 | 2015 | 2014 | |||||
Leverage Ratio | 4.29 | 3.87 | 3.62 | 3.61 | 4.78 | ||||
(1) Excluding the impact of foreign exchange on the Company's Fiscal 2015 EBITDA, the Leverage Ratio was 3.62.
70
Off-Balance Sheet Arrangements
We enter into agreements with our manufacturing partners on tooling requirements for our manufactured products. These agreements form an important part of the Company’s supply chain strategy and cash flow management. The following table summarizes our vendor tooling commitments as of May 31, 2015 and Fiscal 2015:
(millions of U.S. dollars) | ||||||||||||||||||||
Vendor | Tooling acquisition value | Cost paid | Owed amounts as of May 31, 2015 | Open purchase orders amortization value | Outstanding liability Fiscal 2015 | |||||||||||||||
Supplier A | $ | 6.9 | $ | 5.1 | $ | 1.8 | $ | 0.2 | $ | 1.6 | ||||||||||
Supplier B | 6.3 | 5.1 | 1.2 | 0.3 | 0.9 | |||||||||||||||
Supplier C | 1.3 | 0.5 | 0.8 | 0.1 | 0.7 | |||||||||||||||
Supplier D | 0.6 | 0.6 | — | — | — | |||||||||||||||
Supplier E | 0.6 | 0.3 | 0.3 | 0.1 | 0.2 | |||||||||||||||
Supplier F | 0.3 | 0.2 | 0.1 | — | — | |||||||||||||||
Supplier G | 0.1 | 0.1 | — | — | — | |||||||||||||||
Supplier H | 0.1 | 0.1 | — | — | — | |||||||||||||||
Total | $ | 16.2 | $ | 12.0 | $ | 4.2 | $ | 0.7 | $ | 3.5 | ||||||||||
Capital Expenditures
In the twelve-month period ended May 31, 2015 and the twelve-month period ended May 31, 2014, we incurred capital expenditures of $17.6 million and $6.0 million, respectively. As a percentage of revenues, our capital expenditures for the twelve months ended May 31, 2015 were 2.7% of revenues, compared to 1.4% of revenues for the twelve months ended May 31, 2014. The capital investments were incurred for information systems to assist in streamlining our growing organization, leasehold improvements related to the Blainville, Quebec research, design and development facility, investments related to the Own The Moment Hockey Experience retail stores, tooling, R&D and investments in retail marketing assets. The year-over-year increase is driven by higher investments in information systems, leasehold improvements related to the Blainville, Quebec research, design and development facility investments related to the Own The Moment Hockey Experience retail stores and the addition of Easton Baseball/Softball, as compared to the prior year. Our ordinary course of operations requires minimal capital expenditures for equipment, given that we manufacture most of our products through our manufacturing partners. Going forward, to support our growth and key business initiatives, we currently anticipate moderately higher levels of capital expenditures and investment.
71
Contractual Obligations
The following table summarizes our contractual obligations as of May 31, 2015 and the effect such obligations are expected to have on our liquidity and cash flows in future periods:
Payments due by period | ||||||||||||||||||||
(millions of U.S. dollars) | Total | Less Than 1 Year | 1 - 3 Years | 3 - 5 Years | More Than 5 Years | |||||||||||||||
Operating lease obligations (1) | $ | 14.8 | $ | 5.4 | $ | 3.9 | $ | 1.7 | $ | 3.8 | ||||||||||
Financing and capital lease obligations (1) | 21.3 | 1.6 | 3.4 | 3.4 | 12.9 | |||||||||||||||
Endorsement contracts (2) | 14.8 | 7.2 | 5.6 | 1.1 | 0.9 | |||||||||||||||
Long-term borrowings: (3) | ||||||||||||||||||||
Revolving loan | 92.9 | 92.9 | — | — | — | |||||||||||||||
Term loan due 2021 | 330.5 | — | — | — | 330.5 | |||||||||||||||
Interest payment obligations | 78.7 | 13.4 | 26.8 | 26.8 | 11.7 | |||||||||||||||
Inventory purchases (4) | 89.5 | 89.5 | — | — | — | |||||||||||||||
Non-inventory purchases (5) | 11.1 | 5.6 | 1.8 | 2.6 | 1.1 | |||||||||||||||
Total | $ | 653.6 | $ | 215.6 | $ | 41.5 | $ | 35.6 | $ | 360.9 | ||||||||||
(1) | Future operating lease obligations are not recognized in our consolidated balance sheets. The operating lease obligations for buildings and equipment expire at various dates through the fiscal year ended May 31, 2026. The financing and capital lease obligations for buildings expire at various dates through the fiscal year ended May 31, 2030. Certain of the operating and capital leases contain renewal clauses for the extension of the lease for one or more renewal periods. |
(2) | The amounts listed for endorsement contracts represent approximate amounts of base compensation and minimum guaranteed royalty fees the Company is obligated to pay athletes, sports teams, and other endorsers of the Company's products. Actual payments under some contracts may be higher than the amounts listed as these contracts provide for bonuses to be paid to the endorsers based upon certain achievements and/or royalties on product sales in future periods. Actual payments under some contracts may also be lower as these contracts include provisions for reduced payments if certain performance criteria are not met. In addition to the cash payments, the Company is obligated to furnish the endorsers with products for their use. It is not possible to determine how much the Company will spend on this product on an annual basis as the contracts do not stipulate a specific amount of cash to be spent on the product. The amount of product provided to the endorsers will depend on many factors including general playing conditions, the number of sporting events in which they participate, and the Company's decisions regarding product and marketing initiatives. In addition, the costs to design, develop, source, and purchase the products furnished to the endorsers are incurred over a period of time and are not necessarily tracked separately from similar costs incurred for products sold to customers. |
(3) | The revolving loan and the term loan due 2021 amounts represent principal payments on outstanding debt. The interest payment obligations represent interest payments on the term loan due 2021. Estimates of interest payments are based on outstanding principal amounts, currently effective interest rates as of May 31, 2015, and the term of the debt obligation. The interest payment obligations exclude expected interest payments on our revolving loan, which can fluctuate based on the amount of outstanding borrowings in any given period. For more information, please refer to the “Indebtedness” section and the notes to the audited annual consolidated financial statements for the fiscal year ended May 31, 2015. |
(4) | Inventory purchase obligations include various commitments in the ordinary course of business that would include the purchase of goods that are not recognized in our consolidated balance sheets. |
(5) | Non-inventory purchase obligations include other binding commitments for the expenditure of funds that are not recognized in our consolidated balance sheets, including (i) amounts related to contracts not involving the purchase of inventories, such as the non-cancelable portion of service or maintenance agreements for management information systems, and (ii) capital expenditures for approved projects. |
Contingencies
In connection with the purchase of the certain assets from Nike on April 16, 2008 (the “Business Purchase”), a subsidiary of Kohlberg Sports Group Inc., a Cayman Island corporation (“KSGI”), agreed to pay additional consideration to Nike in future periods based upon the attainment of a qualifying exit event. As of May 31, 2015, the maximum potential future consideration pursuant to such arrangements, to be resolved on or before the eighth anniversary of April 16, 2008, is $10.0 million. As a condition to the acquisition in connection with the U.S. IPO, the former securityholders of KSGI who sold KSGI and its subsidiaries to the Company on March 10, 2011 pursuant to the acquisition agreement dated March 3, 2011 (the “Existing Holders”) entered into a reimbursement agreement with the Company pursuant to which each such Existing Holder agreed to reimburse the Company, on a pro rata basis, in the event that the Company or any of its subsidiaries are obligated to make such a payment to Nike.
The Company previously entered into employment agreements with the former owners of Inaria in connection with the closing of the Inaria Acquisition. Included in the employment agreements are yearly performance bonuses payable in the event Inaria achieves gross profit targets in the period one to four years following the closing. These amounts will be accrued over the required service period. As of May 31, 2015, the potential undiscounted amount of the future payments that the Company could be required to make is between $0 and $0.9 million Canadian dollars.
72
In addition to the matters above, during the ordinary course of its business, the Company is involved in various legal proceedings involving contractual and employment relationships, product liability claims, trademark rights and a variety of other matters. The Company does not believe there are any pending legal proceedings that will have a material adverse impact on the Company’s financial position or results of operations.
Critical Accounting Policies and Estimates
The preparation of the financial statements in conformity with U.S. GAAP requires management to make judgments, estimates, and assumptions that affect the application of accounting policies and the reported amount of assets, liabilities, income, and expenses. The judgments and estimates are reviewed on an ongoing basis and estimates are revised and updated accordingly. Actual results may differ from these estimates. Significant areas requiring the use of judgment in application of accounting policies, assumptions, and estimates include fair value determination of assets and liabilities in connection with business combinations, fair valuation of financial instruments, impairment of non-financial assets, valuation allowances for receivables and inventory, amortization periods, provisions, employee benefits, share-based payment transactions, and income taxes. We believe our critical accounting estimates are those related to acquisitions, valuation of derivatives, share-based payments, warranties, retirement benefit obligations, depreciation and amortization, income taxes, and impairment of non-financial assets. We consider these accounting estimates critical because they are both important to the portrayal of our financial condition and operating results, and they require us to make judgments and estimates about inherently uncertain matters.
Acquisition Accounting
Part of our growth strategy has included the acquisition by us of numerous businesses. The purchase price of each acquisition has been determined after due diligence of the target business, market research, strategic planning and the forecasting of expected future results and synergies. Estimated future results and expected synergies are subject to revisions as we integrate each acquisition and attempt to leverage resources.
The fair value of assets acquired and liabilities assumed in a business combination is estimated based on information available at the date of the acquisition. The estimate of fair value of the acquired intangible assets (including goodwill), property, plant and equipment, and other assets, and the liabilities assumed at the date of acquisition, as well as the useful lives of the acquired intangible assets and property, plant and equipment is based on assumptions. The measurement is largely based on projected cash flows, discount rates and market conditions at the date of acquisition. We use a variety of information sources to determine the fair value of acquired assets and liabilities and we generally use third party appraisers to assist us in the determination of the fair value and useful lives of identifiable intangible assets. We estimate the fair values of the assets acquired in each acquisition as of the date of acquisition and these estimates are subject to adjustment based on the final assessments of the fair value of acquired intangible assets (including goodwill), property, plant and equipment, and other assets, and the liabilities assumed. We complete these assessments within one year of the date of acquisition.
Our estimates of fair value are based upon assumptions believed to be reasonable at that time but which are inherently uncertain and unpredictable. Assumptions may be incomplete or inaccurate, and unanticipated events and circumstances may occur, which may affect the accuracy of such assumptions.
Valuation of Derivatives
In the valuation of the Company’s outstanding derivatives, foreign currency forward contracts, the fair value is based on current foreign exchange rates at each reporting date. Since the Company recognizes the fair value of these financial instruments on the consolidated statements of financial position and records changes in fair value in the current period earnings, these estimates will have a direct impact on the Company’s net income or loss for the period.
Share-Based Payments
Share-based compensation expense is measured at the grant date based on the fair value of the award and is recognized as expense over the applicable vesting period of the stock award (generally four years) using an accelerated method. Determining the fair value of share-based compensation awards at grant date requires significant judgment and estimates regarding valuation variables such as volatility, expected forfeiture rates and the expected term of the awards. Expected volatility is estimated based on the historic average share price volatility of the Company’s peers based on the recent period commensurate with the estimated expected term of the stock options. When estimating pre-vesting forfeitures, we consider voluntary termination behavior. We reflect the impact of forfeitures for stock options based on historical experience. The Company uses the “simplified method” to estimate the expected life of options for employee awards that qualify as “plain-vanilla” options as it lacks sufficient company-specific historical information as it relates to the exercise of options. The “simplified method” calculates the expected life of a
73
stock option equal to the time from grant to the midpoint between the vesting date and contractual term, taking into account all vesting tranches. The calculation of the grant date fair value requires the input of highly subjective assumptions and changes in subjective input assumptions can materially affect the fair value estimate.
Warranties
Estimated future warranty costs are accrued and charged to cost of goods sold in the period in which revenues are recognized from the sale of goods. When we evaluate our reserve for warranty costs, we consider our product warranty policies, historical claim rates, product category and mix, current warranty claim trends, and the historical cost to replace or repair its products under warranty. If we determine that a smaller or larger reserve is appropriate, we will record a credit or a charge to cost of goods sold in the period in which we make such a determination. The recognized amount of future warranty costs is based on management’s best information and judgment.
Retirement Benefit Obligations
Accounting for the costs of the defined benefit obligations is based on actuarial valuations. The present value of the defined benefit obligation recognized in the consolidated statements of financial position and the net financing charge recognized in the consolidated statements of comprehensive income is dependent on current market interest rates of high quality, fixed rate debt securities. Other key assumptions within this calculation are based on market conditions or estimates of future events, including mortality rates. Since the determination of the costs and obligations associated with future employee benefits requires the use of various assumptions, there is measurement uncertainty inherent in the actuarial valuation process.
Income Taxes
The measurement of income tax expense and deferred income tax assets and liabilities requires management to make judgments in the interpretation and application of the relevant tax laws. In evaluating our ability to recover our deferred income tax assets, we consider all available positive and negative evidence, including current and proposed tax legislation, current and projected future taxable income, future reversals of existing taxable temporary differences and tax-planning strategies. We record a valuation allowance against deferred tax assets for which we are unable to conclude that recoverability is more likely than not. Given the judgments and estimates required and the sensitivity of the results to the significant assumptions used, we believe the accounting estimates used in relation to the recognition of deferred income tax assets are subject to measurement uncertainty and are susceptible to a material change if the underlying assumptions change.
We are subject to income taxes in the United States, Canada and various foreign and state jurisdictions. Our policy is to recognize interest expense and penalties related to income tax matters as a selling, general and administrative expense. As of May 31, 2015, we do not have any significant accruals for interest related to unrecognized tax benefits or tax penalties. Our intercompany transfer pricing policies are currently subject to audits by various foreign tax jurisdictions. Although we believe that our intercompany transfer pricing policies and tax positions are reasonable, the final outcomes of tax audits or potential tax disputes may be materially different from that which is reflected in our income tax provisions and accruals. The actual amount of income taxes only becomes final upon filing and acceptance of the tax return by the relevant authorities, which occurs subsequent to the issuance of the financial statements.
Impairment of Non-Financial Assets
We perform annual impairment tests on goodwill and intangible assets with indefinite lives in the fourth quarter of each fiscal year, or when events occur or circumstances change that would, more likely than not, reduce the fair value of a reporting unit or an intangible asset with an indefinite life below its carrying value. Goodwill is tested annually on March 1. Indefinite lived intangible assets are tested annually on May 31. Events or changes in circumstances that may trigger interim impairment reviews include significant changes in business climate, operating results, planned investments in the reporting unit, planned divestitures, or an expectation that the carrying amount may not be recoverable, among other factors. We may first assess qualitative factors to determine whether it is more likely than not that the fair value of a reporting unit is less than its carrying amount. If, after assessing the totality of events and circumstances, we determine that it is more likely than not that the fair value of the reporting unit is greater than its carrying amount, the two-step impairment test is unnecessary. The two-step impairment test requires us to estimate the fair value of our reporting units. If the carrying value of a reporting unit exceeds its fair value, the goodwill of that reporting unit is potentially impaired and we proceed to step two of the impairment analysis. In step two of the analysis, we measure and record an impairment loss equal to the excess of the carrying value of the reporting unit's goodwill over its implied fair value, if any.
74
Management exercises judgment in assessing whether there are indications that goodwill or intangible assets may be impaired. In determining the recoverable amount of assets, in the absence of quoted market prices, impairment tests are based on estimates of discounted cash flow projections and other relevant assumptions. The assumptions used in the estimated discounted cash flow projections involve estimates and assumptions regarding discount rates and long-term terminal growth rates. Differences in estimates could affect whether goodwill or intangible assets are in fact impaired and the dollar amount of that impairment.
Indefinite-lived intangible assets primarily consist of acquired trade names and trademarks. We may first perform a qualitative assessment to determine whether it is more likely than not that an indefinite-lived intangible asset is impaired. If, after assessing the totality of events and circumstances, we determine that it is more likely than not that the indefinite-lived intangible asset is not impaired, no quantitative fair value measurement is necessary. If a quantitative fair value measurement calculation is required for these intangible assets, we utilize the relief-from-royalty method. This method assumes that trade names and trademarks have value to the extent that their owner is relieved of the obligation to pay royalties for the benefits received from them. This method requires us to estimate the future revenue for the related brands, the appropriate royalty rate, and the weighted average cost of capital.
It is possible that the Company’s conclusions regarding impairment or recoverability of goodwill or intangible assets in any reporting unit could change in future periods. There can be no assurance that the estimates and assumptions used in our goodwill and intangible asset impairment testing performed as of the beginning of the fourth quarter of Fiscal 2015 will prove to be accurate predictions of the future, if, for example, (i) the businesses do not perform as projected, (ii) overall economic conditions in Fiscal 2016 or future years vary from current assumptions (including changes in discount rates), (iii) business conditions or strategies for a specific reporting unit change from current assumptions, including loss of major customers, (iv) investors require higher rates of return on equity investments in the marketplace or (v) enterprise values of comparable publicly traded companies, or actual sales transactions of comparable companies, were to decline, resulting in lower multiples of revenues and EBITDA. A future impairment charge for goodwill or intangible assets could have a material effect on the Company’s consolidated financial position and results of operations.
New Accounting Pronouncements
See Item 8 of Part II, “Financial Statements and Supplementary Data - Note 2 - Significant Accounting Policies - Recent Accounting Pronouncements”.
Item 7A. | QUANITATIVE AND QUALITATIVE DISCLOSURES ABOUT MARKET RISK |
Market risk represents the risk of loss that may impact our financial position due to adverse changes in financial market prices and rates. Our market risk exposure is primarily a result of fluctuations in foreign currency exchange rates and interest rates. We do not hold or issue financial instruments for trading purposes.
Foreign Currency Risk
The Company is a global enterprise subject to the risk of foreign currency fluctuations. We are exposed to foreign exchange rate risk driven by the fluctuations against the U.S. dollar of the currencies in which we collect our revenues: the Canadian dollar, euro, Swedish krona, Norwegian krona, and Danish krona. Our exposure also relates to debt held in Canadian dollars and purchases of goods and services in foreign currencies. While we purchase a majority of our products in U.S. dollars, we are exposed to cost variability due to fluctuations against the U.S. dollar of certain foreign currencies, primarily: the Canadian dollar, Chinese renminbi, Taiwanese new dollar and Thai baht. Approximately 41% of the Company’s revenues in Fiscal 2015 were generated in international markets. Most of our foreign businesses operate in functional currencies other than the U.S. dollar. In periods where the U.S. dollar strengthens relative to the Canadian dollar, euro or other foreign currencies where the Company has operations, there is a negative impact on the Company’s operating results upon translation of those foreign operating results into the U.S. dollar. The Company currently does not hedge the translation of foreign currency operating results into the U.S. dollar; however, management does hedge foreign currency transactions as discussed later in this section.
The reported values of assets and liabilities in these foreign businesses are subject to fluctuations in foreign currency exchange rates. For net advances to and investments in the Company’s foreign businesses that are considered to be long-term, the impact of changes in foreign currency exchange rates on those long-term advances are deferred as a component of accumulated other comprehensive income (loss) in shareholders’ equity. The U.S. dollar value of net investments in foreign subsidiaries fluctuates with changes in the underlying functional currencies. The Company does not hedge this balance sheet translation exposure and currently does not intend to do so.
75
We currently generate a portion of our revenue and incur a portion of our expenses in Canada, Sweden and Finland. The reporting currency for our consolidated financial statements is the U.S. dollar. The strengthening of the U.S. dollar against the Canadian dollar, Swedish krona, and euro during Fiscal 2015 has resulted in:
• | A reduction in our revenue upon translation of the sales made by our Canadian, Swedish and Finnish operations into U.S. dollars for the purposes of consolidation; |
• | A reduction in our R&D and selling, general and administrative expenses, as well as certain Canadian dollar denominated cost of goods sold incurred by our Canadian, Swedish and Finnish operations into U.S. dollars for the purposes of consolidation; and |
• | An increase in our cost of goods sold for sourced products purchased in U.S. dollars. |
The Company monitors net foreign currency market exposures and enters into derivative foreign currency contracts to hedge the effects of exchange rate fluctuations for a significant portion of forecasted foreign currency cash flows or specific foreign currency transactions (relating to cross-border inventory purchases). Currently, the Company uses only forward exchange contracts. This use of financial instruments allows management to reduce the overall exposure to risks from exchange rate fluctuations on the Company’s cash flows and earnings, since gains and losses on these contracts will offset losses and gains on the transactions being hedged. The Company has not elected hedge accounting and therefore the changes in the fair value of these derivatives are recognized through profit or loss each reporting period. In subsequent periods, the income statement impact of the mark-to-market adjustment is effectively offset when the inventory being hedged is sold. While these effects occur every reporting period, they are of much greater magnitude when there are sudden and significant changes in currency exchange rates during a short period of time.
For derivative foreign currency contracts outstanding at the end of Fiscal 2015, if there were a hypothetical change in foreign currency exchange rates of 10% compared with rates at the end of Fiscal 2015, it would result in a change in fair value of those contracts of approximately $7.6 million. However, any change in the fair value of the hedging contracts would be offset by a change in the fair value of the underlying hedged exposure impacted by the currency rate changes.
Commodity Price Risk
We are subject to market risk from fluctuating market prices of certain purchased commodities and raw materials including steel, aluminum, petroleum-based resins, and diesel fuel. In addition, we are a purchaser of components and parts containing various commodities, including steel, aluminum, rubber and others, which are integrated into the Company’s end products. While such materials are typically available from numerous suppliers, commodity raw materials are subject to price fluctuations. We generally buy these commodities and components based upon market prices that are established with the vendor as part of the purchase process. The Company does not currently enter into futures contracts or otherwise hedge its exposure to commodity price risk. In the event of significant commodity cost increases, we may not be able to adjust our selling prices sufficiently to mitigate the impact on our margins. Based on our current outlook for commodity prices, the total impact of commodities is expected to have a positive impact on our gross margins for Fiscal 2016 when compared to Fiscal 2015.
Interest Rate Risk
Interest rate risk is the risk that the value of a financial instrument will be affected by changes in market interest rates. Our financing includes long-term debt and a New ABL Facility that bears interest based on floating market rates. Changes in these rates result in fluctuations in the required cash flow to service this debt. We have entered into an interest rate cap on a portion of our term debt to mitigate our interest rate risk. Based on the average amount of variable rate borrowings during Fiscal 2015, the effect on reported interest expense of a hypothetical 1.0% change in interest rates is approximately $1.4 million (assumes LIBOR on the New Term Loan Facility is below the 1% floor).
Credit Risk
Credit risk is when the counterparty to a financial instrument or a customer fails to meet its contractual obligations, resulting in a financial loss to the Company. The counterparties to all derivative transactions are major financial institutions with investment grade credit ratings. However, this does not eliminate the Company’s exposure to credit risk with these institutions. This credit risk is generally limited to the unrealized gains in such contracts should any of these counterparties fail to perform as contracted. To manage this risk, the Company has established strict counterparty credit guidelines that are continually monitored and reported to senior management according to specified guidelines.
76
We sell to a diverse customer base over a global geographic area. We evaluate collectability of specific customers’ receivables based on a variety of factors including currency risk, geopolitical risk, payment history, customer stability, and other economic factors. Collectability of receivables is reviewed on an ongoing basis by management and the allowance for doubtful accounts is adjusted as required. Account balances are charged against the allowance for doubtful accounts when we determine that it is probable that the receivable will not be recovered. We believe that the geographic diversity of the customer base, combined with our established credit approval practices and ongoing monitoring of customer balances, mitigates the counterparty risk.
Liquidity Risk
Liquidity risk is the risk that we will not be able to meet our financial obligations as they become due. We continually monitor our actual and projected cash flows. We believe our cash flows generated from operations combined with our New ABL Facility provide sufficient funding to meet our obligations. See “Liquidity and Capital Resources” for more information.
77
Item 8. | Financial Statements and Supplementary Data |
PERFORMANCE SPORTS GROUP LTD.
Index to Consolidated Financial Statements
Report of Independent Registered Public Accounting Firm | |
Consolidated Balance Sheets | |
Consolidated Statements of Income | |
Consolidated Statements of Comprehensive Income (Loss) | |
Consolidated Statements of Cash Flows | |
Consolidated Statements of Stockholders' Equity | |
Notes to the Consolidated Financial Statements | |
78
Report of Independent Registered Public Accounting Firm
The Board of Directors and Stockholders
Performance Sports Group Ltd.:
We have audited the accompanying consolidated balance sheets of Performance Sports Group Ltd. and subsidiaries as of May 31, 2015 and 2014, and the related consolidated statements of income, comprehensive income (loss), cash flows and stockholders’ equity for each of the years in the three‑year period ended May 31, 2015. These consolidated financial statements are the responsibility of the Company’s management. Our responsibility is to express an opinion on these consolidated financial statements based on our audits.
We conducted our audits in accordance with the standards of the Public Company Accounting Oversight Board (United States). Those standards require that we plan and perform the audit to obtain reasonable assurance about whether the financial statements are free of material misstatement. An audit includes examining, on a test basis, evidence supporting the amounts and disclosures in the financial statements. An audit also includes assessing the accounting principles used and significant estimates made by management, as well as evaluating the overall financial statement presentation. We believe that our audits provide a reasonable basis for our opinion.
In our opinion, the consolidated financial statements referred to above present fairly, in all material respects, the financial position of Performance Sports Group Ltd. and subsidiaries as of May 31, 2015 and 2014, and the results of its operations and its cash flows for each of the years in the three‑year period ended May 31, 2015, in conformity with U.S. generally accepted accounting principles.
/s/ KPMG LLP
August 26, 2015
Boston, Massachusetts
79
PERFORMANCE SPORTS GROUP LTD.
CONSOLIDATED BALANCE SHEETS
(In thousands, except share data)
May 31, | May 31, | ||||||
2015 | 2014 | ||||||
ASSETS | |||||||
Cash | $ | 2,932 | $ | 6,871 | |||
Trade and other receivables, net of allowance for doubtful accounts of $2,038 in 2015 and $1,500 in 2014 | 199,375 | 207,584 | |||||
Inventories, net | 174,546 | 159,292 | |||||
Income taxes receivable | 7,393 | 5,580 | |||||
Deferred income taxes | 15,465 | 9,968 | |||||
Prepaid expenses and other current assets | 4,985 | 9,255 | |||||
Total current assets | 404,696 | 398,550 | |||||
Property, plant and equipment, net | 47,051 | 25,322 | |||||
Goodwill | 102,755 | 102,842 | |||||
Intangible assets, net | 276,754 | 296,138 | |||||
Deferred income taxes | 8,150 | 5,322 | |||||
Other non-current assets | 5,511 | 475 | |||||
TOTAL ASSETS | $ | 844,917 | $ | 828,649 | |||
LIABILITIES AND STOCKHOLDERS' EQUITY | |||||||
Short-term debt | $ | 90,550 | $ | 91,435 | |||
Accounts payable | 41,518 | 42,117 | |||||
Accrued liabilities | 45,507 | 44,908 | |||||
Income taxes payable | 249 | 3,298 | |||||
Current portion of retirement benefit obligations | 320 | 358 | |||||
Current portion of financing and capital lease obligations | 179 | 218 | |||||
Total current liabilities | 178,323 | 182,334 | |||||
Long-term debt | 320,271 | 431,399 | |||||
Retirement benefit obligation | 5,057 | 5,506 | |||||
Financing and capital lease obligations | 14,406 | 3,695 | |||||
Deferred income taxes | 14,741 | 12,983 | |||||
Other non-current liabilities | 358 | 798 | |||||
TOTAL LIABILITIES | 533,156 | 636,715 | |||||
Commitments and Contingencies (Note 12) | |||||||
STOCKHOLDERS' EQUITY | |||||||
Common stock, no par value; unlimited shares authorized; 45,552,180, and 35,770,160 shares issued and outstanding at May 31, 2015 and 2014, respectively | 273,332 | 146,799 | |||||
Additional paid-in capital | 5,385 | 7,094 | |||||
Retained earnings | 56,022 | 52,740 | |||||
Accumulated other comprehensive loss | (22,978 | ) | (14,699 | ) | |||
TOTAL STOCKHOLDERS' EQUITY | 311,761 | 191,934 | |||||
TOTAL LIABILITIES & STOCKHOLDERS' EQUITY | $ | 844,917 | $ | 828,649 | |||
See accompanying notes to consolidated financial statements.
80
PERFORMANCE SPORTS GROUP LTD.
CONSOLIDATED STATEMENTS OF INCOME
(In thousands, except share and per share data)
Year ended May 31, | |||||||||||
2015 | 2014 | 2013 | |||||||||
Revenues | $ | 654,691 | $ | 446,179 | $ | 399,593 | |||||
Cost of goods sold | 448,304 | 291,843 | 252,419 | ||||||||
Gross profit | 206,387 | 154,336 | 147,174 | ||||||||
Selling, general and administrative expenses | 140,004 | 104,563 | 90,491 | ||||||||
Research and development expenses | 24,800 | 19,762 | 16,810 | ||||||||
Operating income | 41,583 | 30,011 | 39,873 | ||||||||
Interest expense, net | 19,838 | 9,689 | 8,695 | ||||||||
Realized gain on derivatives | (6,858 | ) | (6,069 | ) | (300 | ) | |||||
Unrealized (gain) loss on derivatives | 2,213 | 2,023 | (942 | ) | |||||||
Loss on extinguishment of debt | — | 2,589 | 320 | ||||||||
Foreign exchange (gain) loss | 19,580 | (4,829 | ) | (542 | ) | ||||||
Gain on bargain purchase | — | — | (1,190 | ) | |||||||
Other expenses (income) | 158 | 340 | (33 | ) | |||||||
Income before income taxes | 6,652 | 26,268 | 33,865 | ||||||||
Income tax expense | 3,370 | 6,281 | 8,641 | ||||||||
Net income | $ | 3,282 | $ | 19,987 | $ | 25,224 | |||||
Earnings per share: | |||||||||||
Basic | $ | 0.07 | $ | 0.56 | $ | 0.74 | |||||
Diluted | $ | 0.07 | $ | 0.53 | $ | 0.69 | |||||
Weighted-average shares outstanding: | |||||||||||
Basic | 44,028,076 | 35,476,607 | 34,107,334 | ||||||||
Diluted | 46,354,657 | 37,475,278 | 36,428,019 | ||||||||
See accompanying notes to consolidated financial statements.
81
PERFORMANCE SPORTS GROUP LTD.
CONSOLIDATED STATEMENTS OF COMPREHENSIVE INCOME (LOSS)
(In thousands)
Year ended May 31, | |||||||||||
2015 | 2014 | 2013 | |||||||||
Net income | $ | 3,282 | $ | 19,987 | $ | 25,224 | |||||
Other comprehensive loss: | |||||||||||
Foreign currency translation adjustments | (8,191 | ) | (6,993 | ) | (130 | ) | |||||
Defined benefit pension plans, net of tax: | |||||||||||
Actuarial losses, net of tax benefits of $65 in 2015, $100 in 2014 and $59 in 2013 | (108 | ) | (220 | ) | (217 | ) | |||||
Reclassification adjustments included in net income, net of tax expense of $9 in 2015, $5 in 2014 and $3 in 2013 | 20 | 10 | 6 | ||||||||
Other comprehensive loss | (8,279 | ) | (7,203 | ) | (341 | ) | |||||
Comprehensive income (loss) | $ | (4,997 | ) | $ | 12,784 | $ | 24,883 | ||||
See accompanying notes to consolidated financial statements.
82
PERFORMANCE SPORTS GROUP LTD.
CONSOLIDATED STATEMENTS OF CASH FLOWS
(In thousands)
Year ended May 31, | |||||||||||
2015 | 2014 | 2013 | |||||||||
OPERATING ACTIVITIES | |||||||||||
Net income | $ | 3,282 | $ | 19,987 | $ | 25,224 | |||||
Adjustments to reconcile net income to net cash provided by operating activities: | |||||||||||
Share-based payment expense | 6,110 | 4,625 | 4,152 | ||||||||
Depreciation and amortization | 23,773 | 12,647 | 9,743 | ||||||||
Unrealized (gain) loss from derivatives | 2,379 | 2,189 | (767 | ) | |||||||
Deferred income taxes | (4,260 | ) | (2,709 | ) | 4,098 | ||||||
Bad debt expense | 1,442 | 1,470 | 117 | ||||||||
Loss on extinguishment of debt | — | 2,620 | 315 | ||||||||
Gain on bargain purchase | — | — | (1,190 | ) | |||||||
Loss on disposal of assets | 39 | 200 | 45 | ||||||||
Changes in operating assets and liabilities excluding the effect of acquisitions: | |||||||||||
Trade and other receivables | (3,248 | ) | (25,514 | ) | (3,319 | ) | |||||
Inventories | (25,232 | ) | (13,371 | ) | (17,674 | ) | |||||
Prepaid expenses and other assets | (7,219 | ) | (5,739 | ) | 1,159 | ||||||
Trade and other payables | 2,220 | 7,126 | (2,423 | ) | |||||||
Accrued and other liabilities | 12,327 | 6,416 | (2,437 | ) | |||||||
Net cash provided by operating activities | 11,613 | 9,947 | 17,043 | ||||||||
INVESTING ACTIVITIES | |||||||||||
Acquisition of businesses, net of cash acquired | 732 | (352,389 | ) | (74,008 | ) | ||||||
Purchase of property, plant and equipment and intangible assets | (17,563 | ) | (6,032 | ) | (7,377 | ) | |||||
Net cash used in investing activities | (16,831 | ) | (358,421 | ) | (81,385 | ) | |||||
FINANCING ACTIVITIES | |||||||||||
Proceeds from debt | — | 450,000 | 30,000 | ||||||||
Repayment of debt | (119,626 | ) | (106,641 | ) | (9,569 | ) | |||||
Net movement in revolving debt | 4,922 | 22,335 | 14,595 | ||||||||
Debt issuance costs | — | (16,803 | ) | (1,265 | ) | ||||||
Payments on financing obligations | (130 | ) | (544 | ) | (533 | ) | |||||
Proceeds from issuance of common shares | 126,500 | — | 32,902 | ||||||||
Common share issuance costs | (9,739 | ) | — | (2,098 | ) | ||||||
Proceeds from stock options exercises | 1,431 | 2,101 | — | ||||||||
Excess tax benefits from share-based compensation | 6,815 | 2,116 | 400 | ||||||||
Payment of taxes upon net stock option exercise | (8,394 | ) | (1,293 | ) | (694 | ) | |||||
Net cash provided by financing activities | 1,779 | 351,271 | 63,738 | ||||||||
Effect of exchange rate changes on cash | (500 | ) | (393 | ) | (76 | ) | |||||
Net increase (decrease) in cash | (3,939 | ) | 2,404 | (680 | ) | ||||||
Cash at beginning of period | 6,871 | 4,467 | 5,147 | ||||||||
Cash at end of period | $ | 2,932 | $ | 6,871 | $ | 4,467 | |||||
Supplemental disclosure of cash flow information: | |||||||||||
Cash paid during year for: | |||||||||||
Interest | $ | 16,850 | $ | 8,120 | $ | 6,911 | |||||
Income taxes | 10,449 | 6,335 | 2,649 | ||||||||
Non-cash investing and financing activities | |||||||||||
Capitalization of costs related to financing lease obligation | 10,543 | — | — | ||||||||
See accompanying notes to consolidated financial statements.
83
PERFORMANCE SPORTS GROUP LTD.
CONSOLIDATED STATEMENTS OF STOCKHOLDERS' EQUITY
(In thousands, except share data)
Common Stock | ||||||||||||||||||||||
Shares Outstanding | Amount | Additional Paid-in Capital | Retained Earnings | Accumulated Other Comprehensive Loss | Total | |||||||||||||||||
Balance as of June 1, 2012 | 30,082,925 | $ | 107,859 | $ | 1,562 | $ | 7,529 | $ | (7,155 | ) | $ | 109,795 | ||||||||||
Net income | — | — | — | 25,224 | — | 25,224 | ||||||||||||||||
Other comprehensive income (loss): | ||||||||||||||||||||||
Pension actuarial losses, net | — | — | — | — | (211 | ) | (211 | ) | ||||||||||||||
Cumulative translation adjustment | — | — | — | — | (130 | ) | (130 | ) | ||||||||||||||
Issuance of common shares | 4,333,500 | 32,902 | — | — | — | 32,902 | ||||||||||||||||
Common share issuance costs | — | (2,098 | ) | — | — | — | (2,098 | ) | ||||||||||||||
Share-based payment expense | — | — | 3,732 | — | — | 3,732 | ||||||||||||||||
Exercise of stock options | 171,292 | 637 | (1,331 | ) | — | — | (694 | ) | ||||||||||||||
Recognition of taxes on items recorded to equity | 2,924 | 400 | — | — | 3,324 | |||||||||||||||||
Balance as of May 31, 2013 | 34,587,717 | 142,224 | 4,363 | 32,753 | (7,496 | ) | 171,844 | |||||||||||||||
Net income | — | — | — | 19,987 | — | 19,987 | ||||||||||||||||
Other comprehensive income (loss): | ||||||||||||||||||||||
Pension actuarial losses, net | — | — | — | — | (210 | ) | (210 | ) | ||||||||||||||
Cumulative translation adjustment | — | — | — | — | (6,993 | ) | (6,993 | ) | ||||||||||||||
Share-based payment expense | — | — | 4,406 | — | — | 4,406 | ||||||||||||||||
Exercise of stock options | 1,182,443 | 4,573 | (3,765 | ) | — | — | 808 | |||||||||||||||
Recognition of taxes on items recorded to equity | — | 2 | 2,090 | — | — | 2,092 | ||||||||||||||||
Balance as of May 31, 2014 | 35,770,160 | 146,799 | 7,094 | 52,740 | (14,699 | ) | 191,934 | |||||||||||||||
Net income | — | — | — | 3,282 | — | 3,282 | ||||||||||||||||
Other comprehensive income (loss): | ||||||||||||||||||||||
Pension actuarial losses, net | — | — | — | — | (88 | ) | (88 | ) | ||||||||||||||
Cumulative translation adjustment | — | — | — | — | (8,191 | ) | (8,191 | ) | ||||||||||||||
Issuance of common shares | 8,161,291 | 126,500 | — | — | — | 126,500 | ||||||||||||||||
Common share issuance costs | — | (9,739 | ) | — | — | — | (9,739 | ) | ||||||||||||||
Share-based payment expense | — | — | 5,998 | — | — | 5,998 | ||||||||||||||||
Exercise of stock options | 1,620,729 | 7,204 | (14,169 | ) | — | — | (6,965 | ) | ||||||||||||||
Recognition of taxes on items recorded to equity | — | 2,568 | 6,462 | — | — | 9,030 | ||||||||||||||||
Balance as of May 31, 2015 | 45,552,180 | $ | 273,332 | $ | 5,385 | $ | 56,022 | $ | (22,978 | ) | $ | 311,761 | ||||||||||
See accompanying notes to consolidated financial statements.
84
PERFORMANCE SPORTS GROUP LTD.
NOTES TO CONSOLIDATED FINANCIAL STATEMENTS
Years ended May 31, 2015, 2014 and 2013
(In thousands, except share and per share data)
1. BASIS OF PRESENTATION AND ORGANIZATION
Nature of the business:
Performance Sports Group Ltd. and its subsidiaries (‘‘PSG’’ or the ‘‘Company’’) is a public company incorporated pursuant to the laws of the Province of British Columbia. The Company is listed on the New York Stock Exchange (NYSE: PSG) and the Toronto Stock Exchange (TSX: PSG).
The Company is engaged in the design, manufacture and distribution of performance sports equipment for ice hockey, roller hockey, baseball and softball, lacrosse, as well as related apparel and accessories, including soccer apparel. The ice hockey products include skates, helmets, protective gear, sticks, team apparel and accessories. The roller hockey products include skates, helmets, protective gear, sticks and accessories. The baseball and softball products include bats, gloves, helmets, protective gear, apparel and accessories. The lacrosse products include sticks (shafts and heads), helmets, protective gear and apparel. The Company distributes its products primarily in the United States, Canada and Europe to specialty retail stores, sporting goods and national retail chains as well as directly to sports teams.
Basis of presentation:
The accompanying consolidated financial statements include the accounts of the Company and its wholly owned subsidiaries, which have been prepared in conformity with accounting principles generally accepted in the United States of America (“U.S. GAAP”). All intercompany transactions and balances have been eliminated in consolidation.
In prior years, the Company had prepared its financial statements under International Financial Reporting Standards (“IFRS”), as issued by the International Accounting Standards Board, for reporting as required by securities regulators in Canada, as well as in the United States under the status of a foreign private issuer as defined by the U.S. Securities and Exchange Commission (the “SEC”). During the year ended May 31, 2015, the Company determined that it no longer qualified as a foreign private issuer under the SEC rules. As a result, beginning with the Company’s annual report on Form 10-K as of and for the year ended May 31, 2015, the Company is required to report with the SEC on domestic forms and comply with domestic public company rules in the United States. The Company is permitted in Canada, in accordance with securities regulators, to prepare its consolidated financial statements in accordance with U.S. GAAP. The transition to U.S. GAAP was made retrospectively for all periods presented.
2. SIGNIFICANT ACCOUNTING POLICIES
Use of estimates:
The preparation of the consolidated financial statements in conformity with U.S. GAAP requires management to make estimates and assumptions that affect the application of accounting policies and the reported amount of assets and liabilities at the date of the consolidated financial statements, and the reported amounts of revenue and expenses during the reporting periods. Significant estimates and assumptions reflected in these consolidated financial statements include, but are not limited to, fair value determination of assets and liabilities in connection with business combinations, fair valuation of financial instruments, impairment of non-financial assets, valuation allowances for receivables and inventory, amortization periods, accruals, employee benefits, share-based payment transactions, and income taxes. Estimates are periodically reviewed in light of changes in circumstances, facts and experience. Actual results could differ from the Company’s estimates.
Trade and other receivables, net:
Trade accounts receivable are recorded at net realizable value. This value includes appropriate allowances for estimated uncollectible accounts to reflect any loss anticipated on the trade accounts receivable balances and charged to the allowance for doubtful accounts. The Company assesses collectability of receivables on an ongoing basis to determine any adjustments to the allowance for doubtful accounts. The allowance is determined based on review of specific customer accounts where collection is doubtful, as well as assessment of the collectability of total receivables considering the aging of balances, historical collection experience, customer disputes, historical and anticipated trends and economic conditions. Receivables are written off against the allowance when it is probable the amounts will not be recovered.
85
Trade and other receivables, net on the consolidated balance sheet represents amounts due from customers less the allowance for doubtful accounts as well as allowances for discounts and returns.
The Company recognizes long-term receivables related to debt investments within other non-current assets on its consolidated balance sheets. Interest earned on the loan receivable is recognized within interest income in the consolidated statements of income.
Inventories, net:
Inventories are measured at the lower of cost or market. Cost is determined by the first-in, first-out method and includes all costs incurred in bringing each product to its present location and condition. Market value is based on estimated selling price in the ordinary course of business less any further costs expected to be incurred to completion and disposal. The estimated allowance for obsolete or unmarketable inventory is based upon current inventory levels, sales trends and historical experience as well as management’s understanding of market conditions and forecasts of future product demand, all of which are subject to change.
Inventory, net is made up of the following balances:
May 31, 2015 | May 31, 2014 | ||||||
Raw Materials | $ | 6,062 | $ | 4,545 | |||
Work-in-process | 443 | 222 | |||||
Finished goods | 172,798 | 158,322 | |||||
Inventories, gross | 179,303 | 163,089 | |||||
Less: allowance for obsolete inventory | (4,757 | ) | (3,797 | ) | |||
Total inventories, net | $ | 174,546 | $ | 159,292 | |||
Property, plant, and equipment:
Property, plant and equipment are recorded at cost, less accumulated depreciation and amortization. Such cost includes costs directly attributable to making the asset capable of operating as intended. Subsequent costs are included in the asset’s carrying amount or recognized as a separate component as appropriate, only when it is probable that the future economic benefits associated with the item will flow to the Company and its cost can be reliably measured. The carrying amount of any replaced asset is derecognized. All repairs and maintenance costs are charged to profit or loss in the period in which they are incurred. Depreciation is provided on all property, plant and equipment. The Company periodically reviews assets’ estimated useful lives based upon actual experience and expected future utilization, and any change in estimated useful life is treated as a change in accounting estimate and recognized prospectively.
Depreciation expense is recognized in earnings on a straight-line basis over the estimated useful life of the related asset. The estimated useful lives are as follows:
Buildings | 30 years |
Machinery and equipment | 2-8 years |
Computer software and equipment | 3-10 years |
Furniture and fixtures | 2-8 years |
Leasehold improvements | Shorter of lease term or remaining life of the assets |
Assets under capital lease | Shorter of lease term or remaining life of the assets |
The Company assesses potential impairments of its long-lived assets, including definite-lived intangible assets whenever events or changes in circumstances indicate that the asset’s carrying value may not be recoverable. An impairment charge would be recognized when the carrying amount of a long-lived asset or asset group is not recoverable and exceeds its fair value. The carrying amount of a long-lived asset or asset group is not recoverable if it exceeds the sum of the undiscounted cash flows expected to result from the use and eventual disposition of the asset or asset group. If the carrying amount is not recoverable, an impairment charge would be recognized when the carrying amount of the long-lived asset or asset group exceeds its fair value, as based on its discounted cash flows.
Any gain or loss arising on the disposal or retirement of an item of property, plant and equipment is determined as the difference between the sales proceeds and the carrying value of the asset and is recognized in selling, general and administrative expenses.
86
Intangible assets and goodwill:
Goodwill and indefinite lived intangible assets are not amortized and are required to be tested for impairment at least annually or more frequently when events or changes in circumstances indicate that the carrying amount of the assets may be impaired. A significant amount of judgment is involved in determining if an indicator of impairment has occurred. Such indicators may include deterioration in general economic conditions, adverse changes in the markets in which an entity operates, increases in input costs that have negative effects on earnings and cash flows, or a trend of negative or declining cash flows over multiple periods, among others. The fair value that could be realized in an actual transaction may differ from that used to evaluate the impairment of goodwill and other intangible assets.
Goodwill is tested annually on March 1. The Company may first assess qualitative factors before utilizing a quantitative assessment to determine whether a goodwill impairment exists. Under the goodwill two-step quantitative impairment test, the evaluation of impairment involves comparing the current fair value of each reporting unit to its carrying value, including goodwill. The first step of the test compares the carrying value of a reporting unit, including goodwill, with its fair value. We estimate the fair value using level 3 inputs as defined by the fair value hierarchy. Refer to Note 2 for the definition of the levels in the fair value hierarchy. The inputs used to calculate the fair value include a number of subjective factors, such as estimates of future cash flows, estimates of our future cost structure, discount rates for our estimated cash flows, required level of working capital, assumed terminal value, and time horizon of cash flow forecasts. If the carrying value of a reporting unit exceeds its fair value, we complete the second step of the test to determine the amount of goodwill impairment loss, if any, to be recognized. In the second step, we estimate an implied fair value of the reporting unit’s goodwill by allocating the fair value of the reporting unit to all of the assets and liabilities other than goodwill (including any unrecognized intangible assets). The impairment loss is equal to the excess of the carrying value of the goodwill over the implied fair value of that goodwill.
Indefinite lived intangible assets are tested annually on May 31. The Company may first assess qualitative factors before performing a quantitative impairment test for its intangible assets. The estimates of fair value are determined using a relief-from-royalty method.
Intangible assets with definite lives are amortized over their estimated useful lives and tested for impairment whenever events or changes in circumstances indicate the carrying amount of the asset may be impaired. Intangible assets with definite lives are evaluated for impairment using a process similar to that used in evaluating elements of property, plant and equipment. If impaired, the asset is written down to its fair value.
The Company did not record any impairment charges in the years ending May 31, 2015, 2014 or 2103, respectively.
A summary of the policies applied to the Company’s intangible assets are:
Useful Life | Weighted-average amortization period | Method of amortization | |||
Trade names and trademarks | Indefinite | ||||
Purchased technology | Finite | 9 years | Straight-line | ||
Customer relationships | Finite | 18 years | Cash flow | ||
Leases | Finite | 6 years | Straight-line | ||
Non-compete agreements | Finite | 3 years | Straight-line | ||
Segment reporting:
The Company’s operating segments are organized on the basis of the management structure established to assess segment performance. The Hockey segment includes the Bauer and Mission brands; the Baseball/Softball segment includes the Easton and Combat brands; and Other Sports includes the Lacrosse and Soccer operating segments, which includes the Maverik and Cascade brands for Lacrosse and the Inaria brand for Soccer.
Income taxes:
The Company accounts for income taxes under the asset and liability method, whereby deferred tax assets and liabilities are recognized for the expected future tax consequences attributable to differences between the financial statement carrying amounts of existing assets and liabilities and their respective tax bases. Deferred taxes are measured using enacted tax rates expected to
87
apply to taxable income in years in which the differences are expected to reverse. The effect of a change in tax rates on deferred tax assets and liabilities is recognized in income in the period that includes the enactment date.
A valuation allowance is provided against deferred tax assets if, based on the weight of available evidence, it is more likely than not that some portion or all of the deferred tax assets will not be realized.
The Company uses a two-step process for the measurement of uncertain tax positions that have been taken or are expected to be taken in a tax return. The first step is a determination of whether it is more likely than not that the tax position will be sustained on the basis of the technical merits of the position. The second step determines the measurement of the tax position based on the probability of it being sustained in the event of a tax examination. The Company records potential interest and penalties on uncertain tax positions as a component of income tax expense.
Fair value measurements:
Certain assets and liabilities are carried at fair value under U.S. GAAP. Fair value is defined as the exchange price that would be received for an asset or paid to transfer a liability (an exit price) in the principal or most advantageous market for the asset or liability in an orderly transaction between market participants on the measurement date. Valuation techniques used to measure fair value must maximize the use of observable inputs and minimize the use of unobservable inputs. Financial assets and liabilities carried at fair value are to be classified and disclosed in one of the following three levels of the fair value hierarchy, of which the first two are considered observable and the last is considered unobservable:
• | Level 1 - Quoted prices in active market for identical assets or liabilities |
• | Level 2 - Observable inputs (other than Level 1 quoted market prices) such as quoted prices in active market for similar assets or liabilities, quoted prices in markets that are not active for identical or similar assets or liabilities, or other inputs that are observable or can be corroborated by observable market data. |
• | Level 3 - Unobservable inputs that are supported by little or no market activity and that are significant to determining the fair value of the assets or liabilities, including pricing models, discounted cash flow methodologies and similar techniques. |
The Company’s foreign currency forward contracts and variable cash bonuses (see Note 18) are carried at fair value determined according to the fair value hierarchy described above. The carrying amounts shown for the Company’s cash, trade and other receivables and trade and other payables approximate fair value because of the short term maturity of those instruments. The carrying amount of the loan receivable approximates fair value due to the recent nature of this transaction. The fair value of the Company’s long-term debt (see Note 8) bearing interest at variable rates is considered to approximate the carrying amount. The finance lease obligations are recorded at carrying value, which approximates fair value.
Derivatives:
In the normal course of business, the Company’s consolidated balance sheets and consolidated statements of income are impacted by currency rate movements in foreign currency denominated assets, liabilities and cash flows as the Company purchases and sells goods in local currencies, except for the purchases of finished goods inventory, which are predominantly in U.S. dollars. The Company is also impacted by interest rate movements on its variable interest rate debt. The Company has established policies and business practices that are intended to mitigate a portion of the effect of these exposures. The Company uses derivative financial instruments, specifically foreign currency forward contracts and interest rate contracts to manage exposures. Currently, all of the Company’s derivative financial instruments are not designated as derivatives that qualify for hedge accounting, and are accordingly recorded at fair value in the consolidated balance sheets with changes in fair value included in unrealized (gain) loss on derivatives. Derivative instruments are included in current assets, non-current assets, current liabilities and non-current liabilities depending on their term to maturity. The Company does not enter into derivative financial instruments for speculative or trading purposes.
Foreign currency translation:
The results and financial position of all of the Company’s foreign operations are translated into the Company’s reporting currency, the U.S. dollar. The assets and liabilities of foreign operations are translated into U.S. dollars at exchange rates in effect at each accounting period end date. The income and expense items of foreign operations are translated to U.S. dollars at average exchange rates during the period. Gains or losses arising from translation of the financial statements of these foreign operations are recorded in foreign currency translation adjustments, a component of other comprehensive income (loss) in the consolidated statements of stockholders' equity.
88
Transaction gains and losses generated by the effect of foreign exchange on recorded assets and liabilities denominated in a currency different from the functional currency of the applicable entity are recorded in foreign exchange (gain) loss in the consolidated statements of income in the period in which they occur.
Revenue recognition:
Sales are recognized, in general, as products are shipped to customers, net of an allowance for sales returns and sales programs in accordance with Accounting Standards Codification (“ASC”) Topic 605, Revenue Recognition. In certain cases, the Company recognizes sales when products are received by customers, depending on the country of sale and the agreement with the customer. Amounts billed to customers for shipping and handling costs are included in revenues and costs incurred related to shipping and handling are included in cost of goods sold. The criteria for recognition of revenue are met when persuasive evidence that an arrangement exists and both title and risk of loss have passed to the customer, the price is fixed or determinable and collectability is reasonably assured. Sales returns are estimated based upon historical returns, current economic trends, changes in customer demands and sell-through of products. The Company also records estimated reductions to revenue for sales programs such as incentive offerings, including special pricing agreements, promotions, advertising allowances and other volume-based incentives. Sales program accruals are estimated based on agreements with applicable customers, historical experience with the customers and/or product, historical sales returns, and other relevant factors.
Share-based compensation:
The Company maintains share-based compensation plans providing executives, board members, certain other employees and consultants with stock options. The options vest in tranches over a vesting period of up to 6 years and expire after 10 years.
The Company uses the Black-Scholes option-pricing model to estimate the fair market value of all share-based compensation awards, excluding awards which may be partially settled in cash (see Note 18) and deferred share units (see Note 14), which requires various assumptions, including volatility and expected option life. The Company uses the “simplified method” to estimate the expected life of options for employee awards that qualify as “plain-vanilla” options as it lacks sufficient company-specific historical information as it relates to the exercise of options. The “simplified method” calculates the expected life of a stock option equal to the time from grant to the midpoint between the vesting date and contractual term, taking into account all vesting tranches. For all options granted to nonemployees, the estimated expected term is equal to the contractual life of the option, which is 10 years. The risk free interest rate is based on the yield for the U.S. Treasury bill or Canada Benchmark Bond Yield rates, as applicable, with a maturity equal to the expected life of the stock option. Expected volatility is estimated based on the historic average share price volatility of the Company’s peers.
The fair value of each tranche of the options granted to senior management, board members, and certain other employees is determined separately at the date granted using the Black-Scholes option pricing model. The grant date fair value, net of expected forfeitures, is expensed over the vesting period of each tranche, using an accelerated method. Expected forfeitures are estimated based on the Company's historic average.
For stock options granted to nonemployees, compensation expense is recognized over the period during which services are rendered by such nonemployee consultants until completed. At the end of each financial reporting period prior to completion of service, the fair value of these awards is remeasured using the then-current fair value of the Company’s common stock and updated assumption inputs in the Black-Scholes option pricing model. The Company issues new shares of its common stock upon exercise of its stock options.
Share-based payments expense is classified as selling, general and administrative expense in the consolidated statements of income with a corresponding increase in equity.
Advertising costs:
Advertising costs are expensed as incurred and are included as a component of selling, general and administrative expenses.
A significant amount of the Company’s promotional expenses results from payments under endorsement contracts. Accounting for endorsement payments is based upon specific contract provisions. Generally, endorsement payments are expensed on a straight-line basis over the term of the contract after giving recognition to periodic performance compliance provisions of the contracts. Prepayments made under contracts are included in prepaid expenses and other assets.
Through cooperative advertising programs, the Company reimburses its retail customers for certain costs of advertising the Company’s products. The Company records these costs as a reduction of revenues at the point in time when it is obligated to its
89
customers for the costs, which is when the related revenues are recognized. This obligation may arise prior to the related advertisement being run.
For the years ended May 31, 2015, 2014 and 2013, advertising costs, expensed by the Company in selling, general and administrative expenses, were $30,484, $22,936 and $19,570, respectively.
Research and development:
Research and development costs are charged to operations as incurred.
Earnings per share:
Basic earnings per common share are calculated by dividing net income by the weighted average number of common shares outstanding during the period. Diluted earnings per common share are calculated by adjusting the weighted average outstanding shares, assuming conversion of all potentially dilutive stock options.
Warranty Policy:
The Company has a warranty policy for its products ranging from 30 days to one year. The Company’s policy is to accrue the estimated cost of satisfying future warranty claims at the time the sale is recorded. In estimating its future warranty obligations, the Company considers various relevant factors, including the Company’s stated warranty policies and practices, the historical frequency of claims, and the cost to replace or repair its products under warranty. Warranty expense is classified as a cost of goods sold in the consolidated statements of income.
The following table provides a reconciliation of the activity related to the Company's reserve for warranty expense:
Year Ended May 31, | |||||||||||
2015 | 2014 | 2013 | |||||||||
Beginning balance | $ | 4,907 | $ | 1,789 | $ | 1,501 | |||||
Accrual | 8,072 | 6,705 | 4,769 | ||||||||
Acquired warranty obligations | — | 2,514 | 382 | ||||||||
Claims paid/costs incurred | (8,498 | ) | (6,040 | ) | (4,945 | ) | |||||
Other | (130 | ) | (61 | ) | 82 | ||||||
Ending balance | $ | 4,351 | $ | 4,907 | $ | 1,789 | |||||
Recent Accounting Pronouncements:
During fiscal year 2015, the Company transitioned its accounting from IFRS to U.S. GAAP. The transition was made retrospectively for all periods presented. The transition to U.S. GAAP included the adoption of any relevant accounting pronouncements effective for fiscal years ended prior to May 31, 2015.
In January 2015, the FASB issued ASU No. 2015-01, Income Statement-Extraordinary and Unusual Items (Subtopic 225-20): Simplifying Income Statement Presentation by Eliminating the Concept of Extraordinary Items. This ASU eliminates the concept of extraordinary items in Accounting Standards Codification Subtopic 225-20, Income Statement-Extraordinary and Unusual Items. The standard eliminates and no longer requires that an entity recognize an unusual and infrequent event separately in the income statement as an extraordinary item, net of tax. This ASU is effective for fiscal years beginning after December 15, 2015, and for interim periods within those fiscal years. The Company has adopted this standard in the fourth quarter ending May 31, 2015. The adoption of this standard had no impact on the consolidated statements of income.
In April 2015, the FASB issued ASU 2015-03, Interest - Imputation of Interest - Simplifying the Presentation of Debt Issuance Costs, which, when effective, will require that debt issuance costs related to a recognized debt liability be presented in the balance sheet as a direct deduction from the carrying amount of that debt liability, consistent with debt discounts. The recognition and measurement guidance for debt issuance costs are not affected by the amendments in this update. The guidance is effective for annual periods beginning after December 15, 2015 and interim periods within that year. An entity should apply the new guidance on a retrospective basis, wherein the balance sheet or each individual period presented should be adjusted to reflect the period-
90
specific effects of applying the new guidance. Early adoption is permitted. The Company has adopted this standard in the fourth quarter ending May 31, 2015 and applied it retrospectively for all periods presented.
In May 2014, the Financial Accounting Standards Board ("FASB") issued Accounting Standards Update ("ASU") No. 2014-09, Revenue from Contracts with Customers: Topic 606. This ASU outlines a single comprehensive model for entities to use in accounting for revenue arising from contracts with customers and supersedes most current revenue recognition guidance. This accounting standard is effective for annual reporting periods beginning after December 15, 2017, including interim reporting periods within that reporting period. Early adoption is not permitted. The Company is currently evaluating the impact this accounting standard will have on the Company's consolidated financial statements.
In June 2014, the FASB issued ASU No. 2014-12, Accounting for Share-Based Payments When the Terms of an Award Provide That a Performance Target Could Be Achieved after the Requisite Service Period. ASU 2014-12 requires that a performance target that affects vesting, and that could be achieved after the requisite service period, be treated as a performance condition. As such, the performance target should not be reflected in estimating the grant date fair value of the award. This update further clarifies that compensation cost should be recognized in the period in which it becomes probable that the performance target will be achieved and should represent the compensation cost attributable to the period(s) for which the requisite service has already been rendered. The amendments in this ASU are effective for annual periods and interim periods within those annual periods beginning after December 15, 2015. The Company does not expect this update to have a material effect on its consolidated financial statements as the terms of outstanding share-based payments do not include awards related to performance targets. However, the Company will continue to evaluate this accounting standard for future issuances of share-based payments.
In August 2014, the FASB issued ASU No. 2014-15, Presentation of Financial Statements-Going Concern. The new guidance addresses management’s responsibility to evaluate whether there is substantial doubt about an entity’s ability to continue as a going concern and to provide related footnote disclosures. Management’s evaluation should be based on relevant conditions and events that are known and reasonably knowable at the date that the consolidated financial statements are issued. The standard will be effective for the first interim period within annual reporting periods ending after December 15, 2016. Early adoption is permitted. The Company is evaluating the effect that this guidance will have on its consolidated financial statements.
The Company has reviewed all other recently issued accounting standards in order to determine their effects, if any, on the consolidated financial statements. Based on that review, the Company believes that none of these standards will have a significant effect on current or future earnings or results of operations.
3. BUSINESS ACQUISITIONS
Easton Baseball/Softball
On April 15, 2014, the Company acquired substantially all of the assets and assumed certain liabilities formerly used in Easton-Bell Sports, Inc.'s baseball, softball and lacrosse businesses ("Easton Baseball/Softball") from Easton-Bell Sports, Inc. (now named BRG Sports, Inc. ("BRG Sports")). The acquisition allowed the Company to expand its presence in the baseball and softball market as Easton is North America's leading diamond sports brand.
Upon closing of the acquisition, the Company also owned the Easton brand. In connection with the acquisition, the Company granted a license to BRG Sports to permit BRG Sports and its assigns to use the Easton name in their hockey and cycling businesses only. The Company and BRG Sports also settled certain intellectual property litigation matters related to patents held by the Company concurrently with the closing of the acquisition. The Company received $6,000 from BRG Sports which was recognized as an offset to selling, general and administrative expenses during the year ended May 31, 2014.
The purchase price paid by the Company at closing was $330,000 in cash, plus a working capital adjustment of $21,657. The Company financed the acquisition, and refinanced certain existing indebtedness, with a combination of a $200,000 asset-based revolving loan and a $450,000 term loan. Refer to Note 8 - Debt for details on the Company's outstanding debt.
The Company has completed its valuation of assets acquired and liabilities assumed. The allocation of the purchase price to the individual assets acquired and liabilities assumed under the purchase method of accounting resulted in $55,301 of goodwill of which the entire amount is expected to be deductible for tax purposes. The goodwill associated with the transaction was due to management’s conclusion that the acquisition coincided with the Company’s strategy of expanding its baseball and softball product offerings to drive revenue growth and expected synergies from combining operations.
91
The following table presents the final allocation of purchase price related to the business as of the date of the acquisition:
Net assets acquired: | |||
Trade receivables | $ | 72,119 | |
Inventories | 39,473 | ||
Property, plant and equipment | 3,904 | ||
Intangible assets | 205,550 | ||
Other assets | 786 | ||
Total Assets acquired | 321,832 | ||
Current liabilities | (25,476 | ) | |
Total liabilities assumed | (25,476 | ) | |
Net assets acquired | $ | 296,356 | |
Consideration paid to seller | $ | 351,657 | |
Goodwill | $ | 55,301 | |
The estimated fair values and useful lives of intangible assets acquired as of the acquisition date were as follows:
Amount | Weighted-Average Remaining Useful Life | ||||
Trade names and trademarks | $ | 134,300 | Indefinite | ||
Customer relationships | 61,450 | 20 | |||
Purchased technology | 9,800 | 6 | |||
Total intangible assets acquired | $ | 205,550 | |||
The trade names and trademarks and purchased technology were valued using the relief-from-royalty method. The relief-from royalty method recognizes that the current value of an asset may be premised upon the expected receipt of future economic benefit in the use of the acquired technology. These benefits are generally considered to be higher income resulting from the avoidance of a loss in revenue that would likely occur without the specific technology.
Customer relationships were valued using the excess earnings method. The excess earnings method recognizes that the current value of an asset may be premised upon the present value of the earnings it generates, net of a reasonable return on other assets also contributing to that stream of earnings.
As a result of the acquisition, the Company stepped-up the acquired inventory to fair market value. The amount of the step-up was $10,055. Of this amount, $7,234 and $2,857 was charged to costs of goods sold for the years ended May 31, 2015 and 2014, respectively.
The Company incurred acquisition-related costs in the years ended May 31, 2015 and 2014 of $282 and $4,331, respectively, relating to external legal fees, consulting fees and due diligence costs. The costs are included in selling, general and administrative expenses.
The amounts of Easton Baseball/Softball's revenue and net loss included in the Company’s consolidated statements of income for the year ended May 31, 2014 was $13,955 and $2,979, respectively.
At May 31, 2014, trade and other receivables, net includes a receivable from BRG Sports in the amount of $33,009 which consists of cash receipts from customers paid to BRG Sports that was owed to the Company. The Company received $33,009 by July 2014.
92
Pro forma information (Unaudited)
The following unaudited pro forma financial information presents the consolidated results of operations if the Easton Baseball/Softball acquisition had occurred on June 1, 2012:
Year ended May 31, | |||||||
2014 | 2013 | ||||||
Revenues | $ | 602,228 | $ | 562,388 | |||
Net income | 35,251 | 33,926 | |||||
Earnings per share: | |||||||
Basic | $ | 0.99 | $ | 0.99 | |||
Diluted | $ | 0.94 | $ | 0.93 | |||
In determining these amounts, management has assumed the fair value adjustments which arose on the date of acquisition would have been the same if the acquisitions had occurred on June 1, 2012. In addition, the intellectual property litigation would have settled on June 1, 2012. This pro forma information is not necessarily indicative of the results of operations that actually would have been achieved had the acquisitions been consummated at that time, nor is it intended to be a projection of future results. The pro forma results also do not include, among other items, the effects of the anticipated synergies from combining the two companies or differences in the combined Company's operating structure.
On May 3, 2013, the Company acquired substantially all of the assets and assumed certain liabilities of Combat Sports (“Combat”), a manufacturer and distributor of composite baseball and softball bats, hockey sticks and lacrosse shafts. The acquisition provided the Company with intellectual property that strengthened its research and development portfolio and expanded the Company’s product offering into baseball and softball. The purchase price paid by the Company at closing was $3,342 in cash, net of $630 collected on trade receivables. The acquisition was funded through cash on hand. The allocation of the purchase price to the individual assets acquired and liabilities assumed under the purchase method of accounting resulted in a gain on bargain purchase as a result of the excess of the estimated fair value of the assets and liabilities acquired over the purchase price. The gain on bargain purchase of $1,190 was due to the fact that Combat was in bankruptcy and was being sold through a bidding process. The Company acquired substantially all the assets and assumed liabilities of Combat out of bankruptcy. Due to the bankruptcy it is impractical to provide pro forma financial information for the impact on revenue and consolidated net income as the information cannot be reasonably determined.
On October 16, 2012, the Company acquired substantially all of the assets of Inaria International (“Inaria”), a manufacturer and distributor of team sports and active apparel. The acquisition provided the Company with full team apparel capabilities, including the design, development and manufacturing of uniforms for soccer, ice hockey, roller hockey, lacrosse, baseball, soccer and other team sports. The purchase price paid by the Company at closing was $7,145 in cash. The acquisition was funded by additional borrowings on the revolving credit line.
On June 29, 2012, the Company purchased all of the issued and outstanding shares of the capital stock of Cascade Helmets Holdings, Inc. (“Cascade”), primarily a manufacturer and distributor of lacrosse equipment and a growing hockey helmet business. The acquisition allowed the Company to expand its presence in the growing lacrosse market, whose helmet and headgear products were complementary to the Company’s existing offering of lacrosse equipment products under the Maverik brand. In addition, the Company leveraged Cascade’s patented head-protection technologies in both lacrosse and hockey. The total consideration paid to the seller at closing was $68,131 in cash, or $64,788 net of cash acquired of $3,343. The acquisition was funded by a public offering of 3,691,500 common shares at a price of $7.80 Canadian dollars per share for aggregate proceeds, net of underwriting fees of $1,401 ($1,440 Canadian dollars), of $26,613 ($27,354 Canadian dollars) and the issuance of 642,000 common shares resulting in proceeds of $4,888 ($5,008 Canadian dollars). The acquisition was also funded by a $30,000 senior secured term facility maturing on March 16, 2016 and the balance through additional borrowings on the revolving loan.
If the Inaria and Cascade acquisitions had occurred on June 1, 2012, consolidated revenue would have been approximately $405,005 and consolidated net income would have been approximately $24,829 for the year ended May 31, 2013. In determining these amounts, management has assumed the fair value adjustments which arose on the date of acquisition would have been the same if the acquisitions had occurred on June 1, 2012. This pro forma information is not necessarily indicative of the results of operations that actually would have been achieved had the acquisitions been consummated at that time, nor is it intended to be a projection of future results.
93
4. CONCENTRATIONS
Revenues & Trade Receivables
The Company had one customer that accounted for approximately 12% of trade and other receivables, net at May 31, 2015 and 2014.
The Company had one customer that accounted for approximately 10%, 14% and 11% of revenues for the years ended May 31, 2015, 2014 and 2013, respectively.
Country and supplier concentrations
The Company’s products are generally produced by contract manufacturers located outside the United States, principally in Asia. The Company's four largest suppliers of inventory accounted for approximately 62% of total inventory purchases for the year ended May 31, 2015. The Company's three largest suppliers of inventory accounted for approximately 61% of total inventory purchases for the year ended May 31, 2014. These companies, however, have multiple factory locations, many of which are in different countries, thus reducing the risk that unfavorable conditions at a single factory or location will have a material adverse effect on the Company.
5. PROPERTY, PLANT, AND EQUIPMENT, NET
Property, plant, and equipment, net consisted of the following:
May 31, 2015 | May 31, 2014 | ||||||
Buildings | $ | 14,737 | $ | 7,553 | |||
Machinery and equipment | 10,946 | 9,691 | |||||
Computer software and equipment | 25,681 | 16,452 | |||||
Furniture and fixtures | 5,605 | 5,483 | |||||
Leasehold improvements | 3,874 | 3,801 | |||||
Construction in progress | 5,545 | 600 | |||||
66,388 | 43,580 | ||||||
Less: accumulated depreciation | (19,337 | ) | (18,258 | ) | |||
Total property, plant and equipment, net | $ | 47,051 | $ | 25,322 | |||
The Company has contractual commitments at May 31, 2015 to purchase property, plant and equipment for $4,051.
6. OTHER NON-CURRENT ASSETS
In August 2014, the Company entered into a loan agreement with KNIC Properties L.P. (“KNIC”) lending KNIC $4,000 as a commercial loan, bearing interest at 12% per annum. The loan receivable matures on August 1, 2020, at which time all outstanding principal and accrued interest is due and payable in full.
As of May 31, 2015, the Company accrued approximately $400 as interest income. The loan is accounted for at cost plus accrued interest and is evaluated periodically for impairment. As of May 31, 2015, no reserve for uncollectibility was established.
94
7. INTANGIBLE ASSETS, NET AND GOODWILL
Intangible assets
Intangible assets, net consisted of the following:
May 31, 2015 | May 31, 2014 | ||||||||||||||||||||||
Gross Amount | Accumulated Amortization | Carrying Value | Gross Amount | Accumulated Amortization | Carrying Value | ||||||||||||||||||
Trade names and trademarks | $ | 199,481 | $ | — | $ | 199,481 | $ | 204,910 | $ | — | $ | 204,910 | |||||||||||
Purchased technology | 21,413 | (7,135 | ) | 14,278 | 22,356 | (4,822 | ) | 17,534 | |||||||||||||||
Customer relationships | 86,513 | (23,518 | ) | 62,995 | 88,566 | (15,008 | ) | 73,558 | |||||||||||||||
Non-compete agreements | — | — | — | 1,045 | (922 | ) | 123 | ||||||||||||||||
Leases | — | — | — | 434 | (421 | ) | 13 | ||||||||||||||||
Total | $ | 307,407 | $ | (30,653 | ) | $ | 276,754 | $ | 317,311 | $ | (21,173 | ) | $ | 296,138 | |||||||||
Amortization expense for the years ended May 31, 2015, 2014, and 2013 was $13,301, $5,201 and $3,966, respectively. Amortization expense related to intangible assets held by the Company as of May 31, 2015 for each of the next five fiscal years and beyond is expected to be incurred as follows:
2016 | $ | 11,929 | |
2017 | 10,716 | ||
2018 | 9,661 | ||
2019 | 8,477 | ||
2020 | 7,493 | ||
2021 and thereafter | 28,997 | ||
Expected amortization expense of intangible assets | $ | 77,273 | |
Goodwill
Goodwill consisted of the following:
Hockey | Baseball/Softball | Other Sports | PSG | Total | |||||||||||||||
Balance as of May 31, 2013 | $ | — | $ | — | $ | — | $ | 47,394 | $ | 47,394 | |||||||||
Acquisition of businesses | — | 55,301 | — | — | 55,301 | ||||||||||||||
Allocation of goodwill | 43,840 | — | 3,625 | (47,465 | ) | — | |||||||||||||
Exchange differences | — | 73 | 3 | 71 | 147 | ||||||||||||||
Balance as of May 31, 2014 | $ | 43,840 | $ | 55,374 | $ | 3,628 | $ | — | $ | 102,842 | |||||||||
Following the acquisition of Easton Baseball/Softball in the fourth quarter of the year ended May 31, 2014, the Company updated their reportable segments, as described in Note 17. In conjunction with this change, the Company allocated goodwill to its identified reporting units on a relative fair value basis. Fair value of reporting units is determined using a combination of two valuation methods: a market approach and an income approach. Each method is generally given equal weight in determining the fair value assigned to each reporting unit.
Hockey | Baseball/Softball | Other Sports | Total | ||||||||||||
Balance as of May 31, 2014 | $ | 43,840 | $ | 55,374 | $ | 3,628 | $ | 102,842 | |||||||
Acquisition of businesses | — | — | — | — | |||||||||||
Exchange differences | — | — | (87 | ) | (87 | ) | |||||||||
Balance as of May 31, 2015 | $ | 43,840 | $ | 55,374 | $ | 3,541 | $ | 102,755 | |||||||
95
During the years ended May 31, 2015, 2014 and 2013, the Company determined that its goodwill and intangible assets were not impaired.
8. DEBT
The debt outstanding is comprised of:
May 31, 2015 | May 31, 2014 | ||||||
Asset-based revolving loan | $ | 92,878 | $ | 89,544 | |||
Term loan due 2021 | 330,457 | 450,000 | |||||
Financing costs | (12,514 | ) | (16,710 | ) | |||
Total debt | $ | 410,821 | $ | 522,834 | |||
Current | $ | 90,550 | $ | 91,435 | |||
Non-current | 320,271 | 431,399 | |||||
Total debt | $ | 410,821 | $ | 522,834 | |||
New Credit Facility
On April 15, 2014, the Company, concurrently with the Easton Baseball/Softball acquisition, entered into the New Term Loan Facility (as defined herein) and the Company and certain of its subsidiaries entered into the New ABL Facility (as defined herein) with Bank of America, B.A. The New Term Loan Facility and the New ABL Facility (referred to herein together as the “Credit Facilities”) replaced the Company’s existing credit facilities. The Credit Facilities are comprised of a (i) $450,000 term loan facility (the ‘‘New Term Loan Facility’’) and a (ii) $200,000 asset-based revolving loan (the ‘‘New ABL Facility’’). The Company refinanced its former credit facilities, financed the cash purchase price of the Easton Baseball/Softball acquisition and paid fees and expenses incurred in connection with the transaction with the use of cash on hand and an aggregate amount of $475,000 drawn from the Credit Facilities. In connection with the Credit Facilities, the Company incurred and capitalized $16,803 in fees in the year ended May 31, 2014.
The New Term Loan Facility of $450,000 matures on April 15, 2021 and is subject to quarterly amortization of principal equal to 0.25% of the original aggregate principal amount of the New Term Loan Facility drawn, with the balance of the New Term Loan Facility payable on maturity. The interest rates per annum applicable to the New Term Loan equal an applicable margin percentage, plus, at the Company’s option, (i) the U.S. base rate or (ii) LIBOR (subject to a 1% floor). The applicable margin is 2.50% per annum in the case of U.S. base rate advances and 3.50% per annum in the case of LIBOR advances, subject to adjustment upon the occurrence of the Leverage Step-Down Trigger (as defined in the New Term Loan Facility) for so long as the Consolidated Total Net Leverage Ratio (as defined in the New Term Loan Facility) remains less than 4.25:1.00.
On June 25, 2014, the Company completed its underwritten public offering in the United States and Canada (the "Offering") of 8,161,291 common shares at a price to the public of $15.50 U.S. dollars per share, for total gross proceeds of approximately $126,500, including the exercise in full of the over-allotment option. Refer to Note 13 - Stockholders' Equity. The Company used the net proceeds of the Offering to repay $119,500 of the New Term Loan Facility. The repayment was first applied against the outstanding amortization payments and as such no further amortization payments are due during the life of the facility. The repayment also reduced the applicable margin by 0.50% per annum which is a component of the interest rate on the New Term Loan Facility.
The New ABL Facility of $200,000 matures on April 15, 2019 and is equal to the lesser of $200,000 (or Canadian dollar equivalent) and the borrowing base. The borrowing base is based on the Company’s accounts receivable and inventory balances. The New ABL Facility includes a $25,000 letter of credit facility and a $20,000 swing loan facility. The amounts outstanding under the New Term Loan Facility and the New ABL Facility are secured by certain assets, including the Company’s trade and other receivables and inventory, with priority given first to the New ABL Facility. At the option of the Company, until August 31, 2014, the interest rates under the New ABL Facility were (i) LIBOR or CDOR, as applicable, plus 1.75% per annum or (ii) the U.S. base rate or Canadian prime rate, as applicable, plus 0.75% per annum. Following August 31, 2014, interest rate margins under the New ABL Facility are determined with reference to the following grid, based on the average availability, as a percentage of the aggregate commitments during the immediately preceding quarter:
96
Average Availability (% of Line Cap)(1) | Interest Rate Margin for LIBOR/CDOR Rate Loans | Interest Rate Margin for U.S. Base Rate/Canadian Prime Rate Loans | ||||
Equal to or greater than 66% | 1.50 | % | 0.50 | % | ||
Less than 66% but equal to or greater than 33% | 1.75 | % | 0.75 | % | ||
Less than 33% | 2.00 | % | 1.00 | % | ||
(1) The term “% of Line Cap” represents the Company’s percentage of aggregate commitments
At May 31, 2015 there are five letters of credit in the amount of $1,403 outstanding under the New ABL Facility. The maximum amount of additional indebtedness (as defined by the New ABL Facility) that could have been outstanding on May 31, 2015, after outstanding borrowings and letters of credit was approximately $106,000.
Former Credit Facility
On June 29, 2012, the Company amended the previous credit facility (the ‘‘Amended Credit Facility’’) to increase its borrowing
capacity. The Company maintained the Amended Credit Facility up to April 15, 2014. The total loss on extinguishment of debt for the year ended May 31, 2014 was $2,589. The Amended Credit Facility was comprised of a (i) $130,000 term loan facility, denominated in both Canadian dollars and U.S. dollars and (ii) $145,000 revolving loan, denominated in both Canadian dollars and U.S. dollars, the availability of which was subject to meeting certain borrowing base requirements, such as eligible accounts receivable and inventory.
The revolving loan included a $20,000 letter of credit subfacility and a $10,000 swing line loan facility. The term loan and the revolving loan were to mature on March 10, 2016. In connection with the Amended Credit Facility, the Company incurred $1,569 in fees, of which $304 was recognized in selling, general and administrative expenses in the year ended May 31, 2013 and $1,265 was capitalized.
The interest rates per annum applicable to the loans under the Amended Credit Facility equal an applicable margin percentage, plus, at the Company’s option depending on the currency of borrowing, (i) the U.S. base rate/Canadian Base rate or (ii) LIBOR/Bankers Acceptance rate. The applicable margin percentages and the unused commitment fee was subject to adjustment based upon the ratio of the total debt to Adjusted EBITDA as follows:
Total Debt to Adjusted EBITDA | Base Rate/Canadian Base Rate | LIBOR/BA Rate | Unused Commitment Fee | ||||
Equal to or greater than 3.0x | 1.25 | % | 2.50 | % | 0.50 | % | |
Equal to or greater than 2.5x but less than 3.0x | 1.00 | % | 2.25 | % | 0.45 | % | |
Equal to or greater than 2.0x but less than 2.5x | 0.75 | % | 2.00 | % | 0.40 | % | |
Less than 2.0x | 0.50 | % | 1.75 | % | 0.35 | % | |
The Amended Credit Facility included covenants that required the Company to maintain a minimum fixed charge ratio, a minimum
leverage ratio and maximum capital expenditures.
The range of interest rates on the credit facilities is as follows:
Year ended May 31, | |||
2015 | 2014 | ||
Asset-based revolving loan | 1.90% - 4.00% | 1.24% - 4.00% | |
Revolving loan | — | 2.48% - 4.25% | |
Term loan due in 2021 | 4.00% - 4.50% | 4.50% - 5.75% | |
Term loan due in 2016 | — | 2.48% - 4.25% | |
97
Maturities of debt in each of the fiscal years ending May 31 are as follows:
2016 | $ | 92,878 | |
2017 | — | ||
2018 | — | ||
2019 | — | ||
2020 | — | ||
Thereafter | 330,457 | ||
Total Debt | $ | 423,335 | |
9. ACCRUED LIABILITIES
Current accrued liabilities consisted of the following:
May 31, 2015 | May 31, 2014 | ||||||
Accrued payroll and related costs, excluding taxes | $ | 12,728 | $ | 13,820 | |||
Accrued advertising and volume rebates | 13,749 | 10,339 | |||||
Accrued legal fees | 438 | 1,319 | |||||
Accrued endorsement and royalties | 1,877 | 1,949 | |||||
Customer credit balances | 533 | 1,371 | |||||
Warranty | 4,351 | 4,907 | |||||
Other | 11,831 | 11,203 | |||||
Total accrued liabilities | $ | 45,507 | $ | 44,908 | |||
10. INCOME TAXES
The components of income before income taxes and income tax expense are summarized as follows:
Year ended May 31, | |||||||||||
Income before income taxes: | 2015 | 2014 | 2013 | ||||||||
Canada | $ | (23,269 | ) | $ | 22,456 | $ | 24,030 | ||||
U.S. | 13,594 | 1,695 | 9,181 | ||||||||
Other | 16,327 | 2,117 | 654 | ||||||||
Total income before income taxes | $ | 6,652 | $ | 26,268 | $ | 33,865 | |||||
Income tax expense: | |||||||||||
Current: | |||||||||||
Canada | $ | 721 | $ | 7,544 | $ | 1,672 | |||||
U.S. Federal | 7,144 | 3,250 | 3,245 | ||||||||
Other | 311 | 346 | 90 | ||||||||
Total current tax expense | 8,176 | 11,140 | 5,007 | ||||||||
Deferred: | |||||||||||
Canada | (2,238 | ) | (1,483 | ) | 4,125 | ||||||
U.S. Federal | (2,568 | ) | (3,376 | ) | (491 | ) | |||||
Total deferred tax expense (benefit) | (4,806 | ) | (4,859 | ) | 3,634 | ||||||
Total income tax expense | $ | 3,370 | $ | 6,281 | $ | 8,641 | |||||
98
The amount of income tax expense expected based on applying the Company's Canadian statutory income tax rate of approximately 26.6% to pretax income differs from income tax expense included in the consolidated statements of income due to the following:
Year ended May 31, | |||||||||||
2015 | 2014 | 2013 | |||||||||
Income tax at Canadian statutory rate | $ | 1,770 | $ | 6,994 | $ | 9,019 | |||||
Share-based compensation | 233 | 137 | (2 | ) | |||||||
Change in valuation allowance | 1,683 | — | (178 | ) | |||||||
Change in enacted rates | 98 | (69 | ) | 265 | |||||||
Capital (gains) losses taxed at capital rate | 1,600 | (563 | ) | — | |||||||
Notional interest | (4,290 | ) | (307 | ) | — | ||||||
Non-deductible items | 700 | 543 | 370 | ||||||||
Investment tax credits | (887 | ) | (1,326 | ) | (754 | ) | |||||
Return to provision and other prior year items | (24 | ) | 625 | (918 | ) | ||||||
Non-Canada tax rate differential | 2,272 | 199 | 1,191 | ||||||||
Other | 215 | 48 | (352 | ) | |||||||
Income tax expense | $ | 3,370 | $ | 6,281 | $ | 8,641 | |||||
The significant components of deferred tax assets and liabilities are presented below:
May 31, 2015 | May 31, 2014 | ||||||
Deferred tax assets: | |||||||
Net operating loss carryforwards | $ | 6,573 | $ | 4,915 | |||
Allowance for doubtful accounts | 3,992 | 2,024 | |||||
Net capital loss carryforwards | 1,558 | — | |||||
Transaction costs | 1,738 | 725 | |||||
Inventory | 4,405 | 2,834 | |||||
Accrued expenses | 7,809 | 5,697 | |||||
Share-based compensation and defined benefit plans | 4,441 | 3,949 | |||||
Other liabilities | 5,138 | 1,362 | |||||
Other | 172 | 184 | |||||
Gross deferred tax assets | 35,826 | 21,690 | |||||
Valuation allowance | (1,683 | ) | — | ||||
Deferred tax assets, net of valuation allowance | 34,143 | 21,690 | |||||
Deferred tax liabilities: | |||||||
Intangible assets | (16,962 | ) | (13,248 | ) | |||
Property, plant and equipment | (7,507 | ) | (3,809 | ) | |||
Unremitted earnings of certain foreign subsidiaries | (654 | ) | (750 | ) | |||
Other | (146 | ) | (1,576 | ) | |||
Deferred tax liabilities | (25,269 | ) | (19,383 | ) | |||
Net deferred tax assets | $ | 8,874 | $ | 2,307 | |||
The Company evaluates its ability to realize the tax benefits associated with deferred tax assets by analyzing both historical and projected future operating results, the reversal of existing temporary differences, taxable income in prior carry-back years and the availability of tax planning strategies. The valuation allowance of $1,683 at May 31, 2015 relates to Canadian unrealized losses on capital items which are subject to tax deduction limitations.
99
A tabular roll forward of the Company’s gross unrecognized tax benefits is presented below:
Year ended May 31, | |||||||||||
2015 | 2014 | 2013 | |||||||||
Balance at beginning of year | $ | 1,600 | $ | 1,611 | $ | 1,611 | |||||
Translation gain | (27 | ) | (11 | ) | — | ||||||
Balance at end of year | $ | 1,573 | $ | 1,600 | $ | 1,611 | |||||
Of the $1,573 of gross unrecognized tax benefits from uncertain tax positions outstanding at May 31, 2015, $183 would affect the Company’s tax rate if recognized. The Company recognizes interest and penalties related to unrecognized tax benefits as a component of selling, general and administrative expense. Accrued interest and penalties related to unrecognized tax positions as of May 31, 2015 and 2014, and recorded in each of the years ended May 31, 2015, 2014 and 2013 were not significant.
The Company conducts business globally and, as a result, its subsidiaries file income tax returns in Canada, U.S. federal and state jurisdictions and various foreign jurisdictions. In the normal course of business the Company may be subject to examination by taxing authorities throughout the world, including such major jurisdictions as Canada and the United States. The Company is currently under income tax examination in Germany for the fiscal years ended May 31, 2003 through 2011. The statute of limitations in the Company’s other tax jurisdictions remain open for various periods between 2011 and the present. However, carryforward attributes from prior years may still be adjusted upon examination by tax authorities if they are used in an open period.
At May 31, 2015 and 2014 the Company has Canadian non-capital loss carryforwards of $25,113 and $18,868, respectively, which expire at various times through 2035. At May 31, 2015, the Company has capital loss carryforwards in Canada of $1,854 for which a full valuation allowance exists. These capital losses are available indefinitely to offset taxable capital gains.
The Company has recognized a deferred income tax liability in the amount of $654 for the undistributed earnings of two of its foreign subsidiaries in the current or prior years for the earnings it expects to repatriate. We have not provided for deferred income taxes or withholding taxes on the undistributed earnings of the remaining foreign subsidiaries because such earnings are considered permanently reinvested. It is not practicable to estimate the amount of tax that may be payable upon distribution because such liability, if any, is dependent on circumstances existing if and when such remittance occurs.
11. EMPLOYEE BENEFIT PLANS
Defined benefit plans
The Company has two defined benefit pension plans. These plans are not registered, are not funded, and do not accept new participants. Additionally, current participants do not earn any additional benefits outside of those earned by eligible employees during their service period with the Company. The Canadian defined benefit pension plan was available to designated senior management and executives. The U.S. defined benefit pension plan was available to designated employees. Payouts under these plans are dependent on the Company’s ability to pay at the time the participants are entitled to receive their payments. The Company also pays all of the costs of a post-retirement life insurance plan which is available to most Canadian employees. This plan is not funded.
The following table provides the defined benefit plan liabilities:
Defined Benefit Pension Plan | Post-retirement Life Insurance Plan | Total Retirement Benefit Obligation | |||||||||||||||||||||
May 31, 2015 | May 31, 2014 | May 31, 2015 | May 31, 2014 | May 31, 2015 | May 31, 2014 | ||||||||||||||||||
Current | $ | 320 | $ | 358 | $ | — | $ | — | $ | 320 | $ | 358 | |||||||||||
Non-current | 4,473 | 4,956 | 584 | 550 | 5,057 | 5,506 | |||||||||||||||||
Total | $ | 4,793 | $ | 5,314 | $ | 584 | $ | 550 | $ | 5,377 | $ | 5,864 | |||||||||||
100
Changes in the present value of the projected defined benefit pension plan liabilities are as follows:
Year ended May 31, | |||||||||||
2015 | 2014 | 2013 | |||||||||
Beginning balance | $ | 5,314 | $ | 5,271 | $ | 5,307 | |||||
Interest cost | 225 | 212 | 236 | ||||||||
Benefits paid | (320 | ) | (358 | ) | (358 | ) | |||||
Exchange rate gain | (612 | ) | (237 | ) | (15 | ) | |||||
Actuarial losses | 186 | 426 | 101 | ||||||||
Total | $ | 4,793 | $ | 5,314 | $ | 5,271 | |||||
The components of net periodic benefit costs are as follows:
Year ended May 31, | |||||||||||
2015 | 2014 | 2013 | |||||||||
Interest cost | $ | 287 | $ | 264 | $ | 290 | |||||
Amortization of net actuarial loss | 29 | 15 | 9 | ||||||||
Net periodic benefit costs | $ | 316 | $ | 279 | $ | 299 | |||||
The Company’s accumulated benefit obligation includes amounts that are not yet reflected in net periodic benefit cost and are recognized in accumulated other comprehensive income:
Year ended May 31, | |||||||||||
2015 | 2014 | 2013 | |||||||||
Net actuarial loss | $ | 1,187 | $ | 1,144 | $ | 760 | |||||
Accumulated other comprehensive loss at year end | 1,187 | 1,144 | 760 | ||||||||
Cumulative employer contributions in excess of net periodic benefit cost | 3,606 | 4,170 | 4,511 | ||||||||
Net liability recognized in consolidated balance sheets | $ | 4,793 | $ | 5,314 | $ | 5,271 | |||||
Estimated amortization of net actuarial losses (gains) from accumulated other comprehensive income into net periodic benefit cost for the following fiscal year is $35.
The following table provides the principal actuarial assumptions used in determining the defined benefit pension obligation:
Year ended May 31, | |||||
2015 | 2014 | 2013 | |||
Canadian Plan | |||||
Discount rate | 3.60% | 4.00% | 4.10% | ||
Inflation rate | 2.00% | 2.10% | 2.10% | ||
U.S. Plan | |||||
Discount rate | 3.80% | 3.80% | 3.50% | ||
Inflation rate | N/A | N/A | N/A | ||
The discount rate was selected based on a review of current market interest rates of high quality, fixed rate debt securities adjusted to reflect the duration of expected future cash outflows for the defined pension benefit payments. The rate is determined by management with the aid of third-party actuaries. The mortality table used for the defined benefit plan obligation and benefit plan costs was UP-94 Generational.
101
The effect of a 1% change in the discount rate and inflation rate of the defined benefit pension obligation is reflected in the following table:
Discount Rate for the year ended | Inflation Rate for the year ended | ||||||||||||||
May 31, 2015 | May 31, 2015 | ||||||||||||||
1% Increase | 1% Decrease | 1% Increase | 1% Decrease | ||||||||||||
Effect on interest cost | $ | 5 | $ | (7 | ) | $ | (2 | ) | $ | 1 | |||||
Discount Rate for the year ended | Inflation Rate for the year ended | ||||||||||||||
May 31, 2015 | May 31, 2015 | ||||||||||||||
1% Increase | 1% Decrease | 1% Increase | 1% Decrease | ||||||||||||
Effect on defined benefit obligation | $ | (438 | ) | $ | 517 | $ | (34 | ) | $ | 28 | |||||
Benefits expected to be paid over the next five fiscal years are:
2016 | $ | 320 | |
2017 | 320 | ||
2018 | 320 | ||
2019 | 320 | ||
2020 | 320 | ||
Thereafter | 3,777 | ||
Total | $ | 5,377 | |
Defined contribution plans
The Company has two defined contribution pension plans: a defined contribution Registered Retirement Savings Plan (‘‘RRSP’’) which is available to most Canadian employees and a defined contribution 401(k) plan that covers all employees in the United States. The terms of the RRSP provides for annual contributions by the Company as determined by executive management. Contributions to the RRSP for the years ended May 31, 2015, 2014 and 2013 were $499, $451 and $447, respectively. The RRSP contributions are included in cost of goods sold, selling, general and administrative expenses and research and development expenses.
Employees are eligible to participate in the defined contribution 401(k) plan immediately upon hire; there is no service requirement. The 401(k) plan provides for matching contributions in an amount equal to 100% of the first 4% contributed by the employee to the plan. Matching contributions to the 401(k) plan were $872, $562 and $478 for the years ended May 31, 2015, 2014 and 2013, respectively. The 401(k) plan contributions are included in cost of goods sold, selling, general and administrative expenses and research and development expenses.
12. COMMITMENTS AND CONTINGENCIES
Leases
Operating Leases
102
The Company has entered into various long-term operating lease agreements for buildings and equipment that expire at various dates through the fiscal year ended 2030. Amounts of minimum future annual rental commitments under non-cancelable operating leases are as follows:
2016 | $ | 5,421 | |
2017 | 2,380 | ||
2018 | 1,490 | ||
2019 | 884 | ||
2020 | 754 | ||
Thereafter | 3,828 | ||
$ | 14,757 | ||
Certain of the leases contain renewal clauses for the extension of the lease for one or more renewal periods. Rent expense for the years ended May 31, 2015, 2014 and 2013 was $4,503, $2,014 and $1,504, respectively.
Financing Obligations: Build-to-suit Leases
In September 2010, the Company entered into a lease agreement as a second tenant of a property in Exeter, New Hampshire (the “Exeter property”) for a lease term of 144 months. During the Company’s assessment of the Exeter property, it was determined that the facility was not in a functional state of use. Per the terms of the lease agreement and due to the Company’s involvement in the restoration of the facility, the Company was determined to be the owner of the facility. Subsequent to the completion of the restoration of the Exeter property, the Company maintained continuing involvement in the premise and consequently did not transfer the substantial risks and rewards of ownership, and thereby failing to meet the provisions for sale-leaseback accounting. Therefore, the Company recognizes the Exeter property and related improvements as a lease financing obligation in accordance with ASC 840 Topic, "Leases" ("ASC 840").
In April 2014, the Company entered into a lease agreement for a building under construction in Blainville (Quebec), Canada (the “Blainville property”) for a lease term of 183 months. Per the terms of the lease agreement and due to the Company’s involvement during the construction of the facility, the Company was determined to be the owner of the Blainville property. Subsequent to the completion of construction of the Blainville property, the Company maintained continuing involvement in the premise and consequently did not transfer the substantial risks and rewards of ownership, and thereby failing to meet the provisions for sale-leaseback accounting. Therefore, the Company recognizes the Blainville property and related improvements as a lease financing obligation in accordance with ASC 840.
Financing and capital lease assets and obligations consisted of the following:
May 31, 2015 | May 31, 2014 | ||||||
Assets: | |||||||
Building costs | $ | 14,737 | $ | 7,553 | |||
Machinery and equipment | 337 | 390 | |||||
15,074 | 7,943 | ||||||
Less: accumulated depreciation | (901 | ) | (3,331 | ) | |||
Total | $ | 14,173 | $ | 4,612 | |||
Liabilities: | |||||||
Current | $ | 179 | $ | 218 | |||
Long-term | 14,406 | 3,695 | |||||
Total | $ | 14,585 | $ | 3,913 | |||
103
As of May 31, 2015, the future minimum lease payments due under the lease financing obligations were as follows:
2016 | $ | 1,602 | |
2017 | 1,698 | ||
2018 | 1,699 | ||
2019 | 1,699 | ||
2020 | 1,717 | ||
Thereafter | 12,893 | ||
$ | 21,308 | ||
Depreciation expense related to the properties capitalized under ASC 840 is recognized in the Company’s consolidated statements of income within costs of goods sold, selling, general and administrative expenses and research and development expenses as depreciation expense.
Commitments
Contractual Obligations:
The following represents the Company’s material contractual obligations as of May 31, 2015:
Endorsement Contracts(1) | Inventory Purchases (2) | Non-inventory Purchases (3) | |||||||||
2016 | $ | 7,241 | $ | 93,049 | $ | 5,606 | |||||
2017 | 3,727 | — | 767 | ||||||||
2018 | 1,938 | — | 1,049 | ||||||||
2019 | 743 | — | 1,232 | ||||||||
2020 | 385 | — | 1,414 | ||||||||
Thereafter | 923 | — | 1,070 | ||||||||
$ | 14,957 | $ | 93,049 | $ | 11,138 | ||||||
(1) | The amounts listed for endorsement contracts represent approximate amounts of base compensation and minimum guaranteed royalty fees the Company is obligated to pay athletes, sport teams, and other endorsers of the Company’s products. |
(2) | Inventory purchase obligations include various commitments in the ordinary course of business that would include the purchase of goods or services that are not recognized in our consolidated balance sheets. |
(3) | Non-inventory purchase obligations include various commitments in the ordinary course of business that would include the purchase of goods or services that are not recognized in our consolidated balance sheets. |
Other contractual obligations not included in the chart above, and discussed elsewhere in the notes to the consolidated financial statements, include lease obligations and scheduled principal payments on outstanding debt.
Contingencies
The Company acquired Kohlberg Sports Group Inc. (‘‘KSGI’’) on March 10, 2011. In connection with the formation of KSGI in March 2008, a subsidiary of KSGI agreed to pay additional consideration to Nike, Inc. in future periods, based upon the attainment of a qualifying exit event. At May 31, 2015, the maximum potential future consideration pursuant to such arrangements, to be resolved on or before the eighth anniversary of April 16, 2008, is $10,000. On April 16, 2008, all of the security holders of KSGI (collectively, the ‘‘Existing Holders’’) entered into a reimbursement agreement with the Company pursuant to which each such Existing Holder agreed to reimburse the Company, on a pro rata basis, in the event that the Company or any of its subsidiaries are obligated to make a payment to Nike, Inc. As of May 31, 2015, the Company determined that no such qualifying exit event has occurred. The Company will continue to assess the probability of a qualifying exit event through the eighth anniversary date.
In the ordinary course of its business, the Company is involved in various legal proceedings involving contractual and employment relationships, product liability claims, trademark rights, and a variety of other matters. The Company does not believe there are any pending legal proceedings that will have a material impact on the Company’s consolidated balance sheets or consolidated statements of income.
104
13. STOCKHOLDERS' EQUITY
As of May 31, 2015, the Company’s authorized share capital consisted of an unlimited number of Common Shares without par value.
Prior to April 8, 2015, the Company’s authorized share capital consisted of an unlimited number of Common Shares without par value and an unlimited number of Proportionate Voting Shares. Common Shares, at the option of the holder, were eligible for conversion into Proportionate Voting Shares on the basis of 1,000 common shares for one Proportionate Voting Share. Each outstanding Proportionate Voting Share, at the option of the holder, was also eligible for conversion into 1,000 Common Shares. Except in limited circumstances, no fractional equity share was permitted to be issued on any conversion of another equity share. For all matters coming before shareholders, the Common Shares carry one vote per share and the Proportionate Voting Shares carry 1,000 votes per share. The holders of common shares and proportionate voting shares are entitled to receive notice of any meeting of shareholders of the Company and to attend and vote at those meetings, except those meetings at which holders of a specific class of shares are entitled to vote separately as a class under the British Columbia Business Corporations Act.
The Company’s transfer agent and registrar, certified that, as of close of business on April 7, 2015, there were no issued and outstanding Proportionate Voting Shares. In light of this certification and in accordance with the articles of the Company (the “Articles”), the Board of Directors resolved, effective April 8, 2015, that (i) the right of holders of Common Shares to convert their shares into Proportionate Voting Shares shall be terminated and (ii) the Board of Directors shall not be entitled to issue any further Proportionate Voting Shares.
On June 25, 2014, the Company completed its underwritten public offering in the United States and Canada (the "Offering") of 8,161,291 common shares at a price to the public of $15.50 per share, for total gross proceeds of approximately $126,500, including the exercise in full of the over-allotment option. The Company used the net proceeds of the Offering to repay $119,500 of the New Term Loan Facility. The Company incurred $9,739 in common share issuance costs in the year ended May 31, 2015. These costs are recorded in common stock in the consolidated balance sheets.
14. SHARE-BASED COMPENSATION
As of May 31, 2015, the Company had stock options outstanding and exercisable under two shareholder approved plans: the “Rollover Plan” and the “2011 Plan.” Additionally, the Company has a Deferred Share Unit Plan (the “DSU Plan”) as an optional form of compensation for eligible directors.
Rollover Plan
The Rollover Plan was adopted by the Board of Directors on March 10, 2011. The terms of the Rollover Plan are substantially similar to the terms of the 2011 Plan detailed below, except that all rollover options are fully vested and no further options may be granted under the Rollover Plan. An aggregate of 5,119,815 rollover options were issued under the Rollover Plan.
Information concerning stock option activity under the Rollover Plan is summarized as follows:
Year ended May 31, | ||||||||||||||||||||
2015 | 2014 | 2013 | ||||||||||||||||||
Number of Stock Options | Weighted-Average Exercise Price (Canadian dollars) | Number of Stock Options | Weighted-Average Exercise Price (Canadian dollars) | Number of Stock Options | Weighted-Average Exercise Price (Canadian dollars) | |||||||||||||||
Outstanding, beginning of period | 3,193,677 | $ | 4.58 | 4,699,278 | $ | 4.26 | 5,015,556 | $ | 4.21 | |||||||||||
Exercised | (2,284,034 | ) | 5.01 | (1,505,601 | ) | 3.59 | (316,278 | ) | 3.49 | |||||||||||
Outstanding and exercisable, end of period | 909,643 | $ | 3.49 | 3,193,677 | $ | 4.58 | 4,699,278 | $ | 4.26 | |||||||||||
The intrinsic value of stock options exercised under the Rollover Plan in Canadian dollars during the years ended May 31, 2015, 2014 and 2013 was $37,811, $13,027 and $2,433, respectively.
105
The following table summarizes information about stock options outstanding and exercisable under the Rollover Plan as of May 31, 2015:
Options Outstanding and Exercisable | ||||||||||||
Exercise Price (Canadian dollars) | Number of Underlying Shares | Weighted Average Exercise Price per Share (Canadian dollars) | Weighted-Average Remaining Contractual Years | Total Intrinsic Value (Canadian dollars) | ||||||||
$3.49 | 909,643 | $ | 3.49 | 3.0 | $ | 19,084 | ||||||
As of May 31, 2015, there is no unrecognized cost for the Rollover Plan.
2011 Plan
The 2011 Plan was adopted by the Board of Directors on March 10, 2011. The maximum aggregate number of common shares which may be subject to options under the 2011 Plan and any other proposed or established share compensation arrangement of the Company (other than the Rollover Plan) is 12% of the Company’s common shares outstanding from time to time. On this basis, at May 31, 2015, the maximum number of common shares available for future issuance under the 2011 Plan was 1,169,541.
The Company grants options under the 2011 Plan to employees and nonemployees. Employee service-based awards have a contractual life of 10 years and typically vest over a period of 4 years from grant-date. Nonemployee service-based awards have a contractual life of 10 years and typically vest over a period of up to 6 years.
The assumptions used for options granted to acquire TSX listed common shares and the fair value at the date of grant is noted in the following table:
Year ended May 31, | |||||
2015 | 2014 | 2013 | |||
Weighted average expected term (in years) | 6.11 | 6.25 | 6.25 | ||
Weighted average expected volatility | 34.44% | 37.12% | 36.53% | ||
Weighted average risk-free interest rate | 1.54% | 1.75% | 1.44% | ||
Expected dividend yield | —% | —% | —% | ||
Weighted average fair value per option granted (Canadian dollars) | $6.58 | $5.60 | $3.81 | ||
The assumptions used for options granted to acquire NYSE listed common shares and the fair value at the date of grant is noted in the following table:
Year ended May 31, | |
2015 | |
Weighted average expected term (in years) | 6.25 |
Weighted average expected volatility | 33.24% |
Weighted average risk-free interest rate | 1.51% |
Expected dividend yield | —% |
Weighted average fair value per option granted | $6.11 |
106
Information concerning stock option activity under the 2011 Plan for options to acquire TSX listed common shares is summarized
as follows:
Year ended May 31, | ||||||||||||||||||||
2015 | 2014 | 2013 | ||||||||||||||||||
Number of Stock Options | Weighted-Average Exercise Price (Canadian dollars) | Number of Stock Options | Weighted-Average Exercise Price (Canadian dollars) | Number of Stock Options | Weighted-Average Exercise Price (Canadian dollars) | |||||||||||||||
Outstanding, beginning of period | 4,234,872 | $ | 11.37 | 3,065,997 | $ | 9.92 | 998,497 | $ | 7.36 | |||||||||||
Granted | 138,574 | 18.20 | 1,374,500 | 14.20 | 2,340,000 | 10.88 | ||||||||||||||
Exercised | (426,350 | ) | 9.80 | (141,625 | ) | 7.51 | (50,000 | ) | 7.5 | |||||||||||
Canceled | — | — | — | — | (17,000 | ) | 10.54 | |||||||||||||
Forfeited | (15,375 | ) | 11.20 | (64,000 | ) | 11.08 | (205,500 | ) | 8.89 | |||||||||||
Outstanding, end of period | 3,931,721 | $ | 11.78 | 4,234,872 | $ | 11.37 | 3,065,997 | $ | 9.92 | |||||||||||
Options vested and expected to vest, end of period | 3,896,443 | $ | 11.77 | — | $ | — | — | $ | — | |||||||||||
Options exercisable, end of period | 1,688,754 | $ | 10.48 | 1,021,250 | $ | 9.25 | 418,750 | $ | 7.43 | |||||||||||
The intrinsic value of stock options exercised under the 2011 Plan in Canadian dollars during the years ended May 31, 2015, 2014 and 2013 was $6,094, $615 and $194, respectively.
Information concerning stock option activity under the 2011 Plan for options to acquire NYSE listed common shares is summarized
as follows:
Year ended May 31, | ||||||
2015 | ||||||
Number of Stock Options | Weighted-Average Exercise Price | |||||
Outstanding, beginning of period | — | $ | — | |||
Granted | 267,000 | 18.22 | ||||
Forfeited | (2,000 | ) | 15.99 | |||
Outstanding, end of period | 265,000 | $ | 18.24 | |||
Options vested and expected to vest, end of period | 259,040 | $ | 18.25 | |||
Options exercisable, end of period | — | $ | — | |||
107
The following table summarizes information about stock options outstanding and exercisable under the 2011 Plan for stock options to acquire TSX listed common shares as of May 31, 2015:
Options Outstanding | Options Exercisable | ||||||||||||||||||||||||
Exercise Price (Canadian dollars) | Number of Underlying Shares | Weighted Average Exercise Price per Share (Canadian dollars) | Weighted-Average Remaining Contractual Years | Total Intrinsic Value (Canadian dollars) | Number of Underlying Shares | Weighted Average Exercise Price per Share (Canadian dollars) | Weighted-Average Remaining Contractual Years | Total Intrinsic Value (Canadian dollars) | |||||||||||||||||
$5.36 - $10.78 | 1,515,147 | $ | 9.10 | 6.77 | — | 945,150 | $ | 8.60 | 6.49 | — | |||||||||||||||
$10.79 - $13.56 | 1,168,000 | 11.86 | 7.82 | — | 472,875 | 11.81 | 7.77 | — | |||||||||||||||||
$13.57 - $23.05 | 1,248,574 | 14.98 | 8.82 | — | 270,729 | 14.71 | 8.78 | — | |||||||||||||||||
Total | 3,931,721 | $ | 11.78 | 7.73 | $ | 49,875 | 1,688,754 | $ | 10.48 | 7.21 | $ | 23,623 | |||||||||||||
The following table summarizes information about stock options outstanding and exercisable under the 2011 Plan for stock options to acquire NYSE listed common shares as of May 31, 2015:
Options Outstanding | Options Exercisable | |||||||||||||||||||||
Exercise Price | Number of Underlying Shares | Weighted Average Exercise Price per Share | Weighted-Average Remaining Contractual Years | Total Intrinsic Value | Number of Underlying Shares | Weighted Average Exercise Price per Share | Weighted-Average Remaining Contractual Years | Total Intrinsic Value | ||||||||||||||
$15.99 - $20.45 | 265,000 | $18.24 | 9.64 | $ | 482 | — | — | — | — | |||||||||||||
The Company recognized share-based compensation expense for the 2011 Plan as follows:
Year ended May 31, | |||||||||||
2015 | 2014 | 2013 | |||||||||
Share-based compensation for employee awards | $ | 5,273 | $ | 4,092 | $ | 3,514 | |||||
Share-based compensation for non-employee awards | 367 | 307 | 541 | ||||||||
Total share-based compensation | $ | 5,640 | $ | 4,399 | $ | 4,055 | |||||
Total related tax benefit | $ | 1,117 | $ | 932 | $ | 550 | |||||
Share-based payments expense recognized in the consolidated statements of income is included in selling, general and administrative expense, and was credited to additional paid-in capital. Estimated forfeiture rates are incorporated into the measurement of share-based payment expense. The unrecognized compensation expense associated with stock options outstanding under the 2011 Plan at May 31, 2015 was $5,164, which is expected to be recognized over a weighted average period of 2.0 years.
The weighted average exercise price of all outstanding options under the Rollover Plan and the 2011 Plan is $8.73 U.S. dollars. The weighted average remaining term of all outstanding options under the Rollover Plan and the 2011 Plan is 7.0 years.
Deferred Share Unit Plan (“DSU Plan”)
On September 18, 2012, the Board adopted a Deferred Share Unit Plan (the ‘‘Plan’’) for the directors of the Company. The purpose of the Plan is to promote a greater alignment of interests between certain eligible directors (‘‘Eligible Directors’’) and the shareholders of the Company. Under the terms of the Plan, each Eligible Director may elect to receive director fees (i.e. retainers, meeting fees) and other cash compensation payable for services as an independent contractor paid entirely in cash or up to 100% in deferred share units (‘‘DSUs’’). If the Eligible Director elects to receive any portion of the director fees and other compensation in deferred share units, the amount of the compensation is fixed at the election. The number of shares awarded to satisfy that liability is variable based on the value of the shares at the time of settlement of the liability. The DSUs are therefore classified as liability awards. If an Eligible Director ceases, for any reason except as a result of death, to be a director of the Company, DSUs
108
held by such Eligible Director may be redeemed at the election of such Eligible Director on or prior to December 15 in the first calendar year commencing after the date that the Eligible Director retires from or otherwise ceases to hold such positions. In the event of death of an Eligible Director, the Company will redeem all DSUs held by the Eligible Director within 90 days of the death.
The Company reserved 100,000 Common Shares for issuance under the Plan. Of the 100,000 DSUs authorized for issuance under the plan, 40,883 were available for issuance as of May 31, 2015. During the year ended May 31, 2015, 30,706 DSUs were issued and a total amount of $470 was credited to accrued liabilities. As of May 31, 2015, 59,117 DSUs are outstanding with related accrued liabilities amounting to $706. For the years ended May 31, 2015, 2014 and 2013, the Company recognized $470, $226 and $98 in share-based payment expense in its consolidated statements of income. Share based payment expense is included in selling, general and administrative expenses.
15. EARNINGS PER SHARE
The following is a reconciliation from basic earnings per common share to diluted earnings per common share:
Year Ended May 31, | |||||||||||
2015 | 2014 | 2013 | |||||||||
Net income | $ | 3,282 | $ | 19,987 | $ | 25,224 | |||||
Weighted average common shares outstanding, assuming conversion of proportionate voting shares - Basic | 44,028,076 | 35,476,607 | 34,107,334 | ||||||||
Assumed conversion of dilutive stock options and awards | 2,326,581 | 1,998,671 | 2,320,685 | ||||||||
Diluted weighted average common shares outstanding | 46,354,657 | 37,475,278 | 36,428,019 | ||||||||
Basic earnings per common share | $ | 0.07 | $ | 0.56 | $ | 0.74 | |||||
Diluted earnings per common share | $ | 0.07 | $ | 0.53 | $ | 0.69 | |||||
Anti-dilutive stock options and awards excluded from diluted earnings per share calculation | 32,824 | 86,105 | 745,717 | ||||||||
16. ACCUMULATED OTHER COMPREHENSIVE INCOME (LOSS)
Comprehensive income (loss) consists of net income and specified components of other comprehensive income (loss) ("OCI”). OCI consists of changes in assets and liabilities that are not included in net income under U.S. GAAP but are instead deferred and accumulated within a separate component of stockholders’ equity in the consolidated balance sheets. Comprehensive income (loss) is presented in the consolidated statements of comprehensive income (loss).
The changes in accumulated other comprehensive income (loss), net of taxes, are as follows:
Foreign currency translation | Defined benefit pension plans | Total | |||||||||
Balance as of May 31, 2013 | $ | (6,772 | ) | $ | (724 | ) | $ | (7,496 | ) | ||
Other comprehensive loss before reclassifications | (6,993 | ) | (220 | ) | (7,213 | ) | |||||
Amounts reclassified from accumulated other comprehensive loss to net income | — | 10 | 10 | ||||||||
Balance as of May 31, 2014 | (13,765 | ) | (934 | ) | (14,699 | ) | |||||
Other comprehensive loss before reclassifications | (8,191 | ) | (108 | ) | (8,299 | ) | |||||
Amounts reclassified from accumulated other comprehensive loss to net income | — | 20 | 20 | ||||||||
Balance as of May 31, 2015 | $ | (21,956 | ) | $ | (1,022 | ) | $ | (22,978 | ) | ||
17. SEGMENT INFORMATION
The Company has two reportable operating segments, Hockey and Baseball/Softball. The remaining operating segments do not meet the criteria for a reportable segment and are included in Other Sports. The Hockey segment includes the Bauer and Mission
109
brands. The Baseball/Softball segment includes the Easton and Combat brands. Other Sports includes the Lacrosse and Soccer operating segments, which includes the Maverik and Cascade brands for Lacrosse, and the Inaria brand for Soccer.
These operating segments were determined based on the management structure established, as a result of the Easton Baseball/Softball acquisition, in the fourth quarter of the year ended May 31, 2014 and the financial information, among other factors, reviewed by the Chief Operating Decision Maker ("CODM") to assess segment performance. Operating segment profit is evaluated using EBITDA adjusted for items excluded by the CODM, which is not a measure defined by U.S. GAAP, and is reviewed by the CODM. Certain PSG functional platform costs are directly allocated to each operating segment based on usage or other relevant operational metrics. PSG's functional platform costs consist of expenses incurred by centrally-managed functions, including global information systems, finance and legal, distribution and logistics, sourcing and manufacturing, and other miscellaneous costs.
PSG corporate expenses, currency related gains (losses), acquisition related expenses and other costs are not controlled by the management at each operating segment and therefore are excluded from segment EBITDA. PSG corporate expenses consist of executive compensation and administration costs, public company costs, certain tax credits and other miscellaneous costs. Currency related gains (losses) consists of foreign exchange gains (losses) and the unrealized gain (loss) on derivative instruments. The realized gain (loss) on derivative instruments is included in the Hockey operating segment because it currently relates specifically to Hockey cost of goods sold. Acquisition related expenses consist of charges to cost of goods sold resulting from the fair market value adjustment to inventory, integration costs, costs related to reviewing corporate opportunities, and transaction costs. Other costs consist of share-based payment expenses and items that the CODM excludes from segment EBITDA, for example, items that are infrequent in nature such as costs related to share offerings.
Segment revenue information is summarized as follows:
Year ended May 31, | |||||||||||
2015 | 2014 | 2013 | |||||||||
Hockey | $ | 418,397 | $ | 386,220 | $ | 370,906 | |||||
Baseball/Softball | 199,346 | 24,461 | 93 | ||||||||
Other Sports | 36,948 | 35,498 | 28,594 | ||||||||
Total revenues | $ | 654,691 | $ | 446,179 | $ | 399,593 | |||||
Segment EBITDA information is summarized as follows:
Year ended May 31, | |||||||||||
2015 | 2014 | 2013 | |||||||||
Hockey | $ | 66,588 | $ | 67,249 | $ | 66,140 | |||||
Baseball/Softball | 35,882 | 526 | (556 | ) | |||||||
Other Sports | 3,484 | 3,444 | 2,501 | ||||||||
Total segment EBITDA | $ | 105,954 | $ | 71,219 | $ | 68,085 | |||||
The reconciliation of segment EBITDA to income before income taxes is summarized as follows:
Year ended May 31, | |||||||||||
2015 | 2014 | 2013 | |||||||||
Segment EBITDA | $ | 105,954 | $ | 71,219 | $ | 68,085 | |||||
Corporate expenses | (7,640 | ) | (2,422 | ) | (5,299 | ) | |||||
Acquisition related expenses | (17,989 | ) | (15,551 | ) | (7,539 | ) | |||||
Depreciation and amortization | (21,312 | ) | (11,102 | ) | (8,359 | ) | |||||
Interest expense, net | (19,838 | ) | (9,689 | ) | (8,695 | ) | |||||
Currency related gains (losses) | (21,793 | ) | 2,806 | 1,484 | |||||||
Other(1) | (10,730 | ) | (8,993 | ) | (5,812 | ) | |||||
Income before income taxes | $ | 6,652 | $ | 26,268 | $ | 33,865 | |||||
110
(1) | Other consists of share-based payments expense, costs related to share offerings, costs related to the lacrosse helmet decertification, the impact of Canadian tariff reduction and other miscellaneous expenses. |
Segment interest expense information is summarized as follows:
Year ended May 31, | |||||||||||
2015 | 2014 | 2013 | |||||||||
Hockey | $ | 9,807 | $ | 7,483 | $ | 7,438 | |||||
Baseball/Softball | 3,859 | 787 | — | ||||||||
Other Sports | 981 | 946 | 582 | ||||||||
Unallocated interest expense | 5,191 | 473 | 675 | ||||||||
Total interest expense, net | $ | 19,838 | $ | 9,689 | $ | 8,695 | |||||
Segment depreciation and amortization expense information is summarized as follows:
Year ended May 31, | |||||||||||
2015 | 2014 | 2013 | |||||||||
Hockey | $ | 4,472 | $ | 5,120 | $ | 5,019 | |||||
Baseball/Softball | 11,973 | 1,734 | — | ||||||||
Other Sports | 4,228 | 3,849 | 2,720 | ||||||||
Corporate depreciation and amortization expense | 639 | 399 | 620 | ||||||||
Total depreciation and amortization expense | $ | 21,312 | $ | 11,102 | $ | 8,359 | |||||
Segment assets, which includes accounts receivable, inventory and property, plant and equipment, is summarized as follows:
May 31, 2015 | May 31, 2014 | ||||||
Hockey | $ | 283,897 | $ | 235,761 | |||
Baseball/Softball | 97,472 | 121,104 | |||||
Other Sports | 32,309 | 29,278 | |||||
Corporate assets | 7,294 | 6,055 | |||||
Total assets | $ | 420,972 | $ | 392,198 | |||
The Company markets its products in the United States, Canada and internationally, with its principal markets being the United States and Canada. The tables below contain information about the geographical areas in which the Company operates. In presenting information on the basis of geography, revenues are based on the geographical location of customers and non-current assets are based on the geographical location of the assets.
The following represents the Company’s revenue information based on geographical areas:
Year ended May 31, | |||||||||||
2015 | 2014 | 2013 | |||||||||
Canada | $ | 157,036 | $ | 145,274 | $ | 136,643 | |||||
United States | 383,310 | 190,956 | 158,821 | ||||||||
Rest of World | 114,345 | 109,949 | 104,129 | ||||||||
Total Revenues | $ | 654,691 | $ | 446,179 | $ | 399,593 | |||||
Non-current assets presented consists of property, plant and equipment, other non-current assets, goodwill and intangible assets:
111
May 31, 2015 | May 31, 2014 | ||||||
Canada | $ | 56,267 | $ | 52,989 | |||
United States | 375,510 | 371,195 | |||||
Rest of World | 294 | 593 | |||||
Total non-current assets | $ | 432,071 | $ | 424,777 | |||
18. DERIVATIVES & RISK MANAGEMENT
The Company is exposed to global market risks, including the effect of changes in foreign currency exchange rates, and uses derivatives to attempt to manage financial exposures that occur during the normal course of business. From time to time, the Company may elect to enter into foreign currency forward contracts to reduce the risk associated with foreign currency exchange rate fluctuations, and recognizes such instruments as economic hedges. Foreign currency exchange contracts are used only to meet the Company’s objectives of minimizing variability in the Company’s operating results arising from foreign exchange rate movements. The Company does not enter into foreign currency exchange contracts for speculative purposes. The use of derivatives exposes the Company to counterparty credit risk for nonperformance. The Company manages its exposure to counterparty credit risk by purchasing contracts with major financial institutions with investment grade credit ratings.
The Company accounts for its foreign currency forward contracts in accordance with ASC Topic 815, “Derivatives and Hedging” (“ASC 815”). ASC 815 requires the recognition of all derivatives as either assets or liabilities on the consolidated balance sheets at fair value. During the years ended May 31, 2015, 2014 and 2013, the Company did not designate any foreign currency exchange contracts as derivatives that qualify for hedge accounting under ASC 815 and therefore recognizes the changes in the fair value of these derivatives through profit or loss at each reporting period.
At May 31, 2015 and 2014, the notional amounts of the Company’s foreign currency forward contracts used to mitigate the exposures discussed above were approximately $78,000 and $52,000, respectively. The Company estimates the fair values of foreign currency forward contracts using inputs that are based on readily available market data using pricing models based on current market rates, and records all derivatives on the consolidated balance sheets at fair value with changes in fair value recorded in the consolidated statements of income. The foreign currency forward contracts are classified under Level 2 of the fair value hierarchy (see Note 19).
At May 31, 2015 and 2014, the Company recorded a liability for a variable cash settlement in connection with a stock option award. The Company recognized the issuance of the options as an equity-classified award. The amount of the variable cash settlement obligation is dependent upon the total intrinsic value of the options granted, at the fourth anniversary of the original grant date. The fair value of the cash portion of the award is determined using inputs based on readily available market data. The award is recognized on the consolidated balance sheets and changes in the fair value of the award are recognized in the consolidated statements of income.
The following table summarizes the fair value of derivative instruments by contract type as well as the location of the asset and/or liability on the consolidated balance sheets at May 31, 2015 and 2014:
Balance Sheet Location | May 31, 2015 | May 31, 2014 | |||||||
Assets: | |||||||||
Foreign currency forward contracts | Prepaid and other current assets | $ | 697 | $ | 3,193 | ||||
Foreign currency forward contracts | Other non-current assets | 54 | — | ||||||
Liabilities: | |||||||||
Foreign currency forward contracts | Accrued liabilities | 141 | — | ||||||
Variable cash settlement | Other non-current liabilities | 20 | 307 | ||||||
112
The following table summarizes the location of gains and losses on the consolidated statements of income that were recognized during the years ended May 31, 2015, 2014 and 2013, respectively, in addition to the derivative contract type:
Year Ended May 31, | ||||||||||||||
Derivatives not designated as hedging instruments | Location of (gain) loss recognized in income on derivative instruments | 2015 | 2014 | 2013 | ||||||||||
Foreign currency forward contracts | Realized gain on derivatives | $ | (6,858 | ) | $ | (6,069 | ) | $ | (300 | ) | ||||
Foreign currency forward contracts | Unrealized (gain) loss on derivatives | 2,213 | 2,023 | (942 | ) | |||||||||
Variable cash settlement | Share-based payments expense | (279 | ) | 1 | 324 | |||||||||
19. FAIR VALUE MEASURES
The following tables present information about the Company’s assets and liabilities that are measured at fair value on a recurring basis as of May 31, 2015 and 2014 and indicate the level of the fair value hierarchy utilized by the Company to determine such fair value:
Fair Value Measurements as of May 31, 2015 Using: | |||||||||||
Level 1 | Level 2 | Level 3 | |||||||||
Assets: | |||||||||||
Foreign currency forward contracts | $ | — | $ | 751 | $ | — | |||||
Liabilities: | |||||||||||
Foreign currency forward contracts | $ | — | $ | 141 | $ | — | |||||
Variable cash settlement | $ | — | $ | 20 | $ | — | |||||
Fair Value Measurements as of May 31, 2014 Using: | |||||||||||
Level 1 | Level 2 | Level 3 | |||||||||
Assets: | |||||||||||
Foreign currency forward contracts | $ | — | $ | 3,193 | $ | — | |||||
Liabilities: | |||||||||||
Variable cash settlement | $ | — | $ | 307 | $ | — | |||||
As of May 31, 2015 and 2014, the Company’s foreign currency forward contracts were measured using a generally accepted valuation technique which is the discounted value of the difference between the contract's value at maturity based on the foreign exchange rate set out in the contract and the contract's value at maturity based on the foreign exchange rate that the counterparty would use if it were to renegotiate the same contract at today's date under the same conditions. The Company’s variable cash settlement, discussed in Note 18, was valued using a Monte Carlo simulation based on the value of the Company’s underlying common share price, a Level 2 input.
20. RELATED PARTY TRANSACTIONS
The Kohlberg Funds were a related party of the Company through the second quarter of the year ended May 31, 2015. As a result of selling Common Shares of the Company through secondary offerings and in the open market, the Kohlberg Funds are no longer a related party.
The Kohlberg Funds include Kohlberg TE Investors VI, LP, Kohlberg Investors VI, LP, Kohlberg Partners VI, LP, and KOCO Investors VI, LP, each of which is managed by Kohlberg & Co L.L.C. On June 29, 2012, in conjunction with the acquisition of Cascade and related share offering, the Company issued 642,000 Common Shares as part of a concurrent private placement to the Kohlberg Funds resulting in gross and net proceeds of $4,888 ($5,008 Canadian dollars).
On September 26, 2012, the Kohlberg Funds entered into an agreement for a secondary offering, on a bought deal basis, of 3,600,000 Common Shares of the Company at an offering price of $9.90 Canadian dollars per Common Share. In addition, an over-allotment option was granted, exercisable for a period of 30 days from closing, to purchase up to an additional 540,000 Common Shares. On October 17, 2012, the Kohlberg Funds completed the sale of an aggregate of 4,140,000 Common Shares at a price of $9.90
113
Canadian dollars per Common Share, including the exercise in full of the over-allotment option. The Company did not receive any proceeds from the secondary offering. The Common Shares sold under the terms of the offering had previously been held by the Kohlberg Funds in the form of Proportionate Voting Shares which were converted to Common Shares on the basis of one Proportionate Voting Share for 1,000 Common Shares to facilitate the secondary offering. In connection with the secondary offering, the Company incurred $461 in fees in the year ended May 31, 2013, which was recognized in selling, general and administrative expenses.
On January 17, 2013, the Kohlberg Funds entered into an agreement for a secondary offering, on a bought deal basis, of 3,000,000 Common Shares of the Company at an offering price of $11.60 Canadian dollars per Common Share. In addition, an over-allotment option was granted, exercisable for a period of 30 days from closing, to purchase up to an additional 450,000 Common Shares. On February 6, 2013, the Kohlberg Funds completed the sale of an aggregate of 3,450,000 Common Shares at a price of $11.60 Canadian dollars per Common Share, including the exercise in full of the over-allotment option. The Company did not receive any proceeds from the secondary offering. The Common Shares sold under the terms of the offering had previously been held by the Kohlberg Funds in the form of Proportionate Voting Shares which were converted to Common Shares on the basis of one Proportionate Voting Share for 1,000 Common Shares to facilitate the secondary offering. In connection with the secondary offering, the Company incurred $365 in fees which was recognized in selling, general and administrative expenses in the year ended May 31, 2013.
On October 17, 2013, the Kohlberg Funds entered into an agreement for a secondary offering, on a bought deal basis, of 5,500,000 Common Shares of the Company at an offering price of $12.15 Canadian dollars per Common Share. In addition, an over-allotment option was granted, exercisable for a period of 30 days from closing, to purchase up to an additional 825,000 Common Shares. On November 1, 2013, the Kohlberg Funds completed the sale of an aggregate of 6,325,000 Common Shares at a price of $12.15 Canadian dollars per Common Share, including the exercise in full of the over-allotment option. The Company did not receive any proceeds from the secondary offering but was responsible for all distribution expenses (excluding any underwriters’ fees) pursuant to its obligations under a registration rights agreement with the Kohlberg Funds. The Common Shares sold under the terms of the offering had previously been held by the Kohlberg Funds in the form of Proportionate Voting Shares which were converted to Common Shares on the basis of one Proportionate Voting Share for 1,000 Common Shares to facilitate the secondary offering. In connection with the secondary offering, the Company incurred $524 in fees which was recognized in selling, general and administrative expenses in the year ended May 31, 2014.
21. QUARTERLY FINANCIAL DATA (UNAUDITED)
Year ended May 31, 2015 | First Quarter | Second Quarter | Third Quarter | Fourth Quarter | ||||||||||||
Revenues | $ | 197,135 | $ | 172,254 | $ | 137,746 | $ | 147,556 | ||||||||
Gross profit | 63,936 | 55,933 | 42,257 | 44,261 | ||||||||||||
Net income (loss) | 10,747 | 1,031 | (12,464 | ) | 3,968 | |||||||||||
Earnings per share - basic | $ | 0.26 | $ | 0.02 | $ | (0.28 | ) | $ | 0.09 | |||||||
Earnings per share - diluted | $ | 0.24 | $ | 0.02 | $ | (0.28 | ) | $ | 0.08 | |||||||
Year ended May 31, 2014 | First Quarter | Second Quarter | Third Quarter | Fourth Quarter | ||||||||||||
Revenues | $ | 153,986 | $ | 117,094 | $ | 62,197 | $ | 112,902 | ||||||||
Gross profit | 59,739 | 37,958 | 18,848 | 37,791 | ||||||||||||
Net income (loss) | 21,749 | 3,966 | (5,205 | ) | (523 | ) | ||||||||||
Earnings per share - basic | $ | 0.62 | $ | 0.11 | $ | (0.15 | ) | $ | (0.01 | ) | ||||||
Earnings per share - diluted | $ | 0.59 | $ | 0.11 | $ | (0.15 | ) | $ | (0.01 | ) | ||||||
Item 9. | CHANGES IN AND DISAGREEMENTS WITH ACCOUNTANTS ON ACCOUNTING AND FINANCIAL DISCLOSURE |
Not applicable.
114
Item 9A. | CONTROLS AND PROCEDURES |
In May 2013, the Committee of Sponsoring Organizations of the Treadway Commission (COSO) released COSO 2013, an update of its Internal Control - Integrated Framework (1992). The COSO 2013 Internal Control-Integrated Framework formalizes the principles embedded in the original COSO 1992, incorporates business and operating environment changes over the past two decades, and improves the original 1992 framework’s ease of use and application. We completed our transition to COSO 2013 in the fourth quarter of Fiscal 2015. The transition to COSO 2013 did not have a significant impact on our underlying compliance with the applicable provisions of the Sarbanes-Oxley Act of 2002, including internal control over financial reporting and disclosure controls and procedures.
Disclosure Controls and Procedures
Management, under the supervision of and with the participation of the Company’s CEO and CFO, our principal executive officer and principal financial officer, respectively, evaluated the effectiveness of the design and operation of our disclosure controls and procedures (as such term is defined in Rules 13a-15(e) and 15(d)-(e) under the Securities Exchange Act of 1934 (the “Exchange Act”) as of May 31, 2015. Based on the evaluation, the CEO and CFO concluded that such disclosure controls and procedures as of May 31, 2015 are effective.
Changes in Internal Control over Financial Reporting
There were no changes in the Company’s internal control over financial reporting that occurred during its last fiscal quarter that have materially affected, or are reasonably likely to materially affect, the Company’s internal control over financial reporting.
Management’s Annual Report on Internal Control over Financial Reporting
Management, under the supervision of and with the participation of the Company’s CEO and CFO, evaluated and concluded, as of May 31, 2015, that the Company’s internal controls over financial reporting (as defined in Rule 13a-15(f) and 15d-15(f) under the Exchange Act) were effective. This evaluation included review of the documentation of controls, evaluation of the design and testing the operating effectiveness of controls, and a conclusion about this evaluation. Based on their evaluation, the CEO and the CFO have concluded that, as at May 31, 2015, the Company’s internal control over financial reporting is effective in providing reasonable assurance regarding the reliability of financial reporting and the preparation of financial statements for external purposes in accordance with U.S. GAAP. Such internal control over financial reporting includes those policies and procedures that (i) pertain to the maintenance of records that in reasonable detail accurately and fairly reflect the transactions and dispositions of the assets; (ii) provide reasonable assurance (A) that transactions are recorded as necessary to permit preparation of financial statements in accordance with U.S. GAAP and that receipts and expenditures of the Company are being made only in accordance with authorizations of management and directors; and (B) regarding prevention or timely detection of unauthorized acquisition, use or disposition of our assets that could have a material effect on the financial statements.
In making this evaluation, management used the Internal Control-Integrated Framework issued by the Committee of Sponsoring Organizations of the Treadway Commission (COSO 2013 Framework). This evaluation also took into consideration the Company’s Corporate Disclosure Policy and the functioning of its Disclosure Committee.
Because we are an emerging growth company under the JOBS Act, this annual report on Form 10-K does not include an attestation report of our independent registered public accounting firm.
Item 9B. | OTHER INFORMATION |
Not applicable.
PART III
Item 10. | DIRECTORS, EXECUTIVE OFFICERS AND CORPORATE GOVERNANCE |
Information with respect to this item is included in the Company’s Proxy Statement for the 2015 annual and special meeting of shareholders under the captions “Board of Directors and Corporate Governance - Director Independence and Qualifications” and “Executive Officers” and is incorporated herein by reference.
115
Information on the beneficial ownership reporting for the Company’s directors and executive officers is included in the Company’s Proxy Statement for the 2015 annual and special meeting of shareholders under the caption “Section 16(a) Beneficial Ownership Reporting Compliance” and is incorporated herein by reference.
Information on the Company’s Audit Committee and “audit committee financial expert” is contained in the Company’s Proxy Statement for the 2015 annual and special meeting of shareholders under the caption “Board of Directors and Corporate Governance - Audit Committee” and is incorporated herein by reference.
The Board has adopted a written code of ethics entitled, “Code of Business Conduct and Ethics” (the “Code of Conduct”), that applies to all of the officers, directors, employees, consultants and contractors of the Company, including the Company’s principal executive officer, principal financial officer, principal accounting officer or controller, and persons performing similar functions. The Code of Conduct is posted on the Company’s website at www.performancesportsgroup.com. If there is an amendment to the Code of Conduct, or if a waiver of the Code of Conduct is granted to any of Company’s principal executive officer, principal financial officer, principal accounting officer or controller, the Company intends to disclose any such amendment or waiver by posting such information on the Company’s website. Unless and to the extent specifically referred to herein, the information on the Company’s website shall not be deemed to be incorporated by reference in this annual report on Form 10-K.
Item 11. | EXECUTIVE COMPENSATION |
Information with respect to this item is included in the Company’s Proxy Statement for the 2015 annual and special meeting of shareholders and is incorporated herein by reference.
Item 12. | SECURITY OWNERSHIP OF CERTAIN BENEFICIAL OWNERS AND MANAGEMENT AND RELATED SHAREHOLDER MATTERS |
Information with respect to this item is included in the Company’s Proxy Statement for the 2015 annual and special meeting of shareholders and is incorporated herein by reference.
Item 13. | CERTAIN RELATIONSHIPS AND RELATED TRANSACTIONS AND DIRECTOR INDEPENDENCE |
Information with respect to this item is included in the Company’s Proxy Statement for the 2015 annual and special meeting of shareholders and is incorporated herein by reference.
Item 14. | PRINCIPAL ACCOUNTING FEES AND SERVICES |
Information with respect to this item is included in the Company’s Proxy Statement for the 2015 annual and special meeting of shareholders and is incorporated herein by reference.
PART IV
Item 15. | EXHIBITS AND FINANCIAL STATEMENT SCHEDULES |
a. | The following documents are filed as part of this annual report on Form 10-K: |
1. | Financial Statements. The financial statements as set forth under Item 8 of this annual report on Form 10-K are incorporated herein. |
2. | Financial Statement Schedule: |
116
Schedule II - Valuation and Qualifying Accounts | |||||||||||||||||||
(In thousands) | Balance at Beginning of Period | Charged to Costs and Expenses | Deductions | Other | Balance at End of Period | ||||||||||||||
Allowance for doubtful accounts | |||||||||||||||||||
For the year ended May 31, 2013 | $ | 1,056 | $ | 143 | $ | (476 | ) | $ | 3 | $ | 726 | ||||||||
For the year ended May 31, 2014 | 726 | 947 | (164 | ) | (9 | ) | 1,500 | ||||||||||||
For the year ended May 31, 2015 | 1,500 | 1,141 | (541 | ) | (62 | ) | 2,038 | ||||||||||||
Allowance for obsolete inventory: | |||||||||||||||||||
For the year ended May 31, 2013 | $ | 1,192 | $ | 1,657 | $ | (92 | ) | $ | (3 | ) | $ | 2,754 | |||||||
For the year ended May 31, 2014 | 2,754 | 2,076 | (980 | ) | (53 | ) | 3,797 | ||||||||||||
For the year ended May 31, 2015 | 3,797 | 1,714 | (641 | ) | (113 | ) | 4,757 | ||||||||||||
3. | Exhibits: |
Exhibit Number | Description | |
3.1 | Amended and Restated Articles of Performance Sports Group Ltd. (the “Registrant”). | |
4.1 | Specimen Common Stock Certificate. | |
10.1* | Term Loan Credit Agreement, dated as of April 15, 2014, among the Registrant, as borrower, Bank of America, N.A., as administrative agent and collateral agent, Bank of America, N.A., J.P. Morgan Securities LLC, RBC Capital Markets and Morgan Stanley Senior Funding, Inc., as joint lead arrangers, Bank of America, N.A., J.P. Morgan Securities LLC, and RBC Capital Markets, as bookrunners, JP Morgan Chase Bank, N.A. and RBC Capital Markets, as syndication agents, and the lenders party thereto from time to time. | |
10.2* | ABL Credit Agreement, dated as of April 15, 2014, among Bauer Hockey Corp. and its Canadian subsidiaries from time to time party thereto, as Canadian borrowers, Bauer Hockey, Inc. and its U.S. subsidiaries from time to time party thereto, as U.S. borrowers, the Registrant as parent, Bank of America, N.A., as administrative agent and collateral agent, JP Morgan Chase Bank, N.A. and an affiliate of RBC Dominion Securities Inc., as syndication agents, Bank of America, N.A., J.P. Morgan Securities LLC, RBC Capital Markets and Morgan Stanley Senior Funding, Inc., as joint lead arrangers, Bank of America, N.A., J.P. Morgan Securities LLC, and RBC Capital Markets, as bookrunners, and the various lenders party thereto. | |
10.3 | Amendment No. 1, dated as of July 14, 2015, to ABL Credit Agreement, dated as of April 15, 2014, among Bauer Hockey Corp. and its Canadian subsidiaries from time to time party thereto, as Canadian borrowers, Bauer Hockey, Inc. and its U.S. subsidiaries from time to time party thereto, as U.S. borrowers, the Registrant as parent, Bank of America, N.A., as administrative agent and collateral agent, JP Morgan Chase Bank, N.A. and an affiliate of RBC Dominion Securities Inc., as syndication agents, Bank of America, N.A., J.P. Morgan Securities LLC, RBC Capital Markets and Morgan Stanley Senior Funding, Inc., as joint lead arrangers, Bank of America, N.A., J.P. Morgan Securities LLC, and RBC Capital Markets, as bookrunners, and the various lenders party thereto. | |
10.4 | Trademark License Agreement (VAPOR®), dated April 16, 2008, among NIKE, Inc., NIKE International Limited, and NIKE Bauer Hockey Corp. | |
10.5 | Second Amended and Restated 2011 Stock Option Plan, dated April 9, 2013, including the form of Notice of Grant attached as Schedule A thereto. Incorporated herein by reference to Exhibit 4.2 to the Registrant’s Registration Statement on Form S-8, dated August 28, 2014. | |
10.6 | Amended and Restated Directors' Deferred Share Unit Plan, dated October 14, 2014. | |
10.7 | Form of irrevocable election for participation in the Directors' Deferred Share Unit Plan. | |
10.8 | Second Amended and Restated Rollover Stock Option Plan, dated April 9, 2013, including the form of Notice of Substitution attached as Schedule A thereto. | |
10.9 | Employment Agreement between Bauer Hockey, Inc. and Angela Bass, effective as of January 9, 2012. | |
117
10.10 | Amended and Restated Employment Agreement between Bauer Hockey, Inc. and Kevin Davis, effective as of March 10, 2011. | |
10.11 | Employment Agreement between Bauer Hockey, Inc. and Paul Dachsteiner, effective as of March 9, 2011. | |
10.12 | Amended and Restated Employment Agreement between Bauer Hockey, Inc. and Paul Gibson, effective as of March 10, 2011. | |
10.13 | Employment Agreement between Easton Baseball/Softball Inc. and Todd Harman, effective as of April 6, 2015. | |
10.14 | Amended and Restated Employment Agreement between Bauer Hockey, Inc. and Troy Mohns, effective as of March 10, 2011. | |
10.15 | Amended and Restated Employment Agreement between Bauer Hockey, Inc. and Amir Rosenthal, effective as of March 10, 2011. | |
10.16 | Employment Agreement between Bauer Hockey, Inc. and Richard Wuerthele, effective as of March 1, 2014. | |
10.17 | Employment Agreement between Bauer Hockey, Inc. and Michael Wall, effective as of March 10, 2011. | |
14.1 | Code of Business Conduct and Ethics. | |
21.1 | Subsidiaries of the Registrant. | |
23.1 | Consent of KPMG LLP. | |
31.1 | Certification of Chief Executive Officer pursuant to Section 302 of the Sarbanes-Oxley Act of 2002, with respect to the Company’s Annual Report on Form 10-K for the fiscal year ended May 31, 2015. | |
31.2 | Certification of Chief Financial Officer pursuant to Section 302 of the Sarbanes-Oxley Act of 2002, with respect to the Company’s Annual Report on Form 10-K for the fiscal year ended May 31, 2015. | |
32.1 | Certification of Chief Executive Officer pursuant to Section 906 of the Sarbanes-Oxley Act of 2002, with respect to the Company’s Annual Report on Form 10-K for the fiscal year ended May 31, 2015. | |
32.2 | Certification of Chief Financial Officer pursuant to Section 906 of the Sarbanes-Oxley Act of 2002, with respect to the Company’s Annual Report on Form 10-K for the fiscal year ended May 31, 2015. | |
99.1 | Charter of the Audit Committee. | |
___________________
* Confidential treatment has been requested with respect to portions of this exhibit, and such confidential portions have been deleted and filed separately with the SEC pursuant to Rule 24b-2 of the Exchange Act.
118
SIGNATURES
Pursuant to the requirements of Section 13 or 15(d) of the Securities Exchange Act of 1934, the registrant has duly caused this report to be signed on its behalf by the undersigned, thereunto duly authorized.
PERFORMANCE SPORTS GROUP LTD. | |||
(Registrant) | |||
Dated: | August 26, 2015 | By: | /s/ Kevin Davis |
Kevin Davis | |||
Chief Executive Officer | |||
Pursuant to the requirements of the Securities Exchange Act of 1934, this report has been signed below by the following persons on behalf of the registrant and in the capacities and on the date indicated.
Dated: | August 26, 2015 | /s/ Kevin Davis | |
Kevin Davis | |||
Chief Executive Officer and Director | |||
Dated: | August 26, 2015 | /s/ Amir Rosenthal | |
Amir Rosenthal | |||
President, PSG Brands, and Chief Financial Officer | |||
Dated: | August 26, 2015 | /s/ Bernard McDonell | |
Bernard McDonell | |||
Director and Chairman | |||
Dated: | August 26, 2015 | /s/ Karyn O. Barsa | |
Karyn O. Barsa | |||
Director | |||
Dated: | August 26, 2015 | /s/ Joan Dea | |
Joan Dea | |||
Director | |||
Dated: | August 26, 2015 | /s/ C. Michael Jacobi | |
C. Michael Jacobi | |||
Director | |||
Dated: | August 26, 2015 | /s/ Paul A. Lavoie | |
Paul A. Lavoie | |||
Director | |||
Dated: | August 26, 2015 | /s/ Larry Lucchino | |
Larry Lucchino | |||
Director | |||
Dated: | August 26, 2015 | /s/ Matthew M. Mannelly | |
Matthew M. Mannelly | |||
Director | |||
Dated: | August 26, 2015 | /s/ Bob Nicholson | |
Bob Nicholson | |||
Director | |||
119
EXHIBIT INDEX
Exhibit Number | Description | |
3.1 | Amended and Restated Articles of Performance Sports Group Ltd. (the “Registrant”). | |
4.1 | Specimen Common Stock Certificate. | |
10.1* | Term Loan Credit Agreement, dated as of April 15, 2014, among the Registrant, as borrower, Bank of America, N.A., as administrative agent and collateral agent, Bank of America, N.A., J.P. Morgan Securities LLC, RBC Capital Markets and Morgan Stanley Senior Funding, Inc., as joint lead arrangers, Bank of America, N.A., J.P. Morgan Securities LLC, and RBC Capital Markets, as bookrunners, JP Morgan Chase Bank, N.A. and RBC Capital Markets, as syndication agents, and the lenders party thereto from time to time. | |
10.2* | ABL Credit Agreement, dated as of April 15, 2014, among Bauer Hockey Corp. and its Canadian subsidiaries from time to time party thereto, as Canadian borrowers, Bauer Hockey, Inc. and its U.S. subsidiaries from time to time party thereto, as U.S. borrowers, the Registrant as parent, Bank of America, N.A., as administrative agent and collateral agent, JP Morgan Chase Bank, N.A. and an affiliate of RBC Dominion Securities Inc., as syndication agents, Bank of America, N.A., J.P. Morgan Securities LLC, RBC Capital Markets and Morgan Stanley Senior Funding, Inc., as joint lead arrangers, Bank of America, N.A., J.P. Morgan Securities LLC, and RBC Capital Markets, as bookrunners, and the various lenders party thereto. | |
10.3 | Amendment No. 1, dated as of July 14, 2015, to ABL Credit Agreement, dated as of April 15, 2014, among Bauer Hockey Corp. and its Canadian subsidiaries from time to time party thereto, as Canadian borrowers, Bauer Hockey, Inc. and its U.S. subsidiaries from time to time party thereto, as U.S. borrowers, the Registrant as parent, Bank of America, N.A., as administrative agent and collateral agent, JP Morgan Chase Bank, N.A. and an affiliate of RBC Dominion Securities Inc., as syndication agents, Bank of America, N.A., J.P. Morgan Securities LLC, RBC Capital Markets and Morgan Stanley Senior Funding, Inc., as joint lead arrangers, Bank of America, N.A., J.P. Morgan Securities LLC, and RBC Capital Markets, as bookrunners, and the various lenders party thereto. | |
10.4 | Trademark License Agreement (VAPOR®), dated April 16, 2008, among NIKE, Inc., NIKE International Limited, and NIKE Bauer Hockey Corp. | |
10.5 | Second Amended and Restated 2011 Stock Option Plan, dated April 9, 2013, including the form of Notice of Grant attached as Schedule A thereto. Incorporated herein by reference to Exhibit 4.2 to the Registrant’s Registration Statement on Form S-8, dated August 28, 2014. | |
10.6 | Amended and Restated Directors' Deferred Share Unit Plan, dated October 14, 2014. | |
10.7 | Form of irrevocable election for participation in the Directors' Deferred Share Unit Plan. | |
10.8 | Second Amended and Restated Rollover Stock Option Plan, dated April 9, 2013, including the form of Notice of Substitution attached as Schedule A thereto. | |
10.9 | Employment Agreement between Bauer Hockey, Inc. and Angela Bass, effective as of January 9, 2012. | |
10.10 | Amended and Restated Employment Agreement between Bauer Hockey, Inc. and Kevin Davis, effective as of March 10, 2011. | |
10.11 | Amended and Restated Employment Agreement between Bauer Hockey, Inc. and Paul Dachsteiner, effective as of March 9, 2011. | |
10.12 | Amended and Restated Employment Agreement between Bauer Hockey, Inc. and Paul Gibson, effective as of March 10, 2011. | |
10.13 | Employment Agreement between Easton Baseball/Softball Inc. and Todd Harman, effective as of April 6, 2015. | |
10.14 | Amended and Restated Employment Agreement between Bauer Hockey, Inc. and Troy Mohns, effective as of March 10, 2011. | |
10.15 | Amended and Restated Employment Agreement between Bauer Hockey, Inc. and Amir Rosenthal, effective as of March 10, 2011. | |
10.16 | Employment Agreement between Bauer Hockey, Inc. and Richard Wuerthele, effective as of March 1, 2014. | |
10.17 | Amended and Restated Employment Agreement between Bauer Hockey, Inc. and Michael Wall, effective as of March 10, 2011. | |
14.1 | Code of Business Conduct and Ethics. | |
120
21.1 | Subsidiaries of the Registrant. | |
23.1 | Consent of KPMG LLP. | |
31.1 | Certification of Chief Executive Officer pursuant to Section 302 of the Sarbanes-Oxley Act of 2002, with respect to the Company’s Annual Report on Form 10-K for the fiscal year ended May 31, 2015. | |
31.2 | Certification of Chief Financial Officer pursuant to Section 302 of the Sarbanes-Oxley Act of 2002, with respect to the Company’s Annual Report on Form 10-K for the fiscal year ended May 31, 2015. | |
32.1 | Certification of Chief Executive Officer pursuant to Section 906 of the Sarbanes-Oxley Act of 2002, with respect to the Company’s Annual Report on Form 10-K for the fiscal year ended May 31, 2015. | |
32.2 | Certification of Chief Financial Officer pursuant to Section 906 of the Sarbanes-Oxley Act of 2002, with respect to the Company’s Annual Report on Form 10-K for the fiscal year ended May 31, 2015. | |
99.1 | Charter of the Audit Committee. | |
* Confidential treatment has been requested with respect to portions of this exhibit, and such confidential portions have been deleted and filed separately with the SEC pursuant to Rule 24b-2 of the Exchange Act.
121