Attached files
| file | filename |
|---|---|
| 8-K - 8-K - EXELON CORP | d54970d8k.htm |
Exhibit 99.1

Exelon Corporation 2014 Fact Book
Introduction 1 Exelon at a Glance Pro?le, Vision and Quick Facts 2 Company Overview 3 Service Area and Generation Fuel Mix Map of Exelon Service Area and Selected Generating Assets and 2014 Generation Fuel Mix 4 Credit and Liquidity for Exelon and Operating Companies Credit Ratings, Credit Facilities and Commercial Paper 5 Long Term Debt Outstanding as of December 31, 2014 Exelon Corporation 6 Exelon Generation 6 ComEd 7 PECO 8 BGE 9 Federal Regulation Federal Energy Regulatory Commission (FERC) 10 ComEd Electric Transmission Rate Cases, BGE Electric Transmission Rate Cases 11 State Regulation Illinois Commerce Commission (ICC), ComEd Electric Distribution Rate Cases and Average Residential Rate 12, 13 Pennsylvania Public Utility Commission (PUC), PECO Electric and Gas Rate Cases and Average Residential Rate 14 Maryland Public Service Commission (PSC), BGE Electric and Gas Distribution Rate Cases and Average Residential Rate 15, 16 Capital Structure and Capitalization Ratios for Exelon and Operating Companies 17 Reconciliation of Adjusted (non-GAAP) Operating Earnings to GAAP Consolidated Statements of Operations Exelon Corporation 18, 19 Exelon Generation 20 ComEd 21 PECO 22 BGE 23 Supply and Sales Statistics Exelon Generation 24, 25 ComEd 26 PECO 27, 28 BGE 29, 30 Exelon Generation – Generating Resources Total Owned Generating Capacity 31-34 Exelon Nuclear Fleet and Nuclear Operating Data 35, 36 Fossil Emissions and Emission Reduction Technology Summary 37-40 Total Contracted Generation Capacity 41
To the Financial Community, The Exelon Fact Book provides historical ?nancial and operating information to assist in the analysis of Exelon and its operating companies. Please refer to the SEC ?lings of Exelon and its subsidiaries, including the annual Form 10-K and quarterly Form 10-Q, for more comprehensive ?nancial statements and information. For more information about Exelon, or to send email inquiries, visit the Investor section at www.exeloncorp.com Investor Information Stock Symbol: EXC Exelon Corporation Common stock is listed on the Investor Relations New York and Chicago stock exchanges. 10 South Dearborn Street Chicago, IL 60603 Twitter 312.394.2345 @Exelon Cautionary Statements Regarding Forward-Looking Information This presentation contains certain forward-looking statements within the meaning of the Private Securities Litigation Reform Act of 1995, that are subject to risks and uncertainties. The factors that could cause actual results to differ materially from the forward-looking statements made by Exelon Corporation, Commonwealth Edison Company, PECO Energy Company, Baltimore Gas and Electric Company and Exelon Generation Company, LLC (Registrants) include those factors discussed herein, as well as the items discussed in (1) Exelon’s 2014 Annual Report on Form 10-K in (a) ITEM 1A. Risk Factors, (b) ITEM 7. Management’s Discussion and Analysis of Financial Condition and Results of Operations and (c) ITEM 8. Financial Statements and Supplementary Data: Note 22; and (2) other factors discussed in filings with the SEC by the Registrants. Readers are cautioned not to place undue reliance on these forward-looking statements, which apply only as of the date of this presentation (June 30, 2015). None of the Registrants undertakes any obligation to publicly release any revision to its forward-looking statements to re?ect events or circumstances after the date of this presentation.
Exelon at a Glance Company Pro?le Headquartered in Chicago, Exelon is the nation’s leading competitive energy provider, doing business in 48 states, the District of Columbia and Canada. The company is one of the largest competitive U.S. power generators, with more than 32,000 megawatts of owned capacity comprising one of the nation’s cleanest and lowest-cost power generation fleets. Constellation, Exelon’s competitive retail and wholesale energy business, provides energy products and services to more than 2.5 million residential, public sector and business customers, including more than two-thirds of the Fortune 100. Exelon’s utilities deliver electricity and natural gas to more than 7.8 million customers in central Maryland (BGE), northern Illinois (ComEd) and southeastern Pennsylvania (PECO). Our Mission Exelon’s mission is to be the leading diversified energy company — by providing reliable, clean, affordable and innovative energy products. Our Vision Performance that drives progress. At Exelon, we believe that reliable, clean and affordable energy is essential to a brighter, more sustainable future. That’s why we’re committed to providing innovation, best-in-class performance and thought leadership to help drive progress for our customers and the communities we serve. Our Values We are dedicated to safety. We actively pursue excellence. We innovate to better serve our customers. We act with integrity and are accountable to our communities and the environment. We succeed as an inclusive and diverse team. Quick Facts 2014 $27.4 billion in operating revenues $86.8 billion in assets 6.7 million electric distribution customers 1.2 million gas distribution customers ~29,000 employees 7,435 circuit miles of electric transmission lines ~32,000 MW U.S. generating capacity ~157 terawatt-hours of electric load served 198 billion cubic feet of natural gas utility load served $1.24 annual dividend rate per share 2
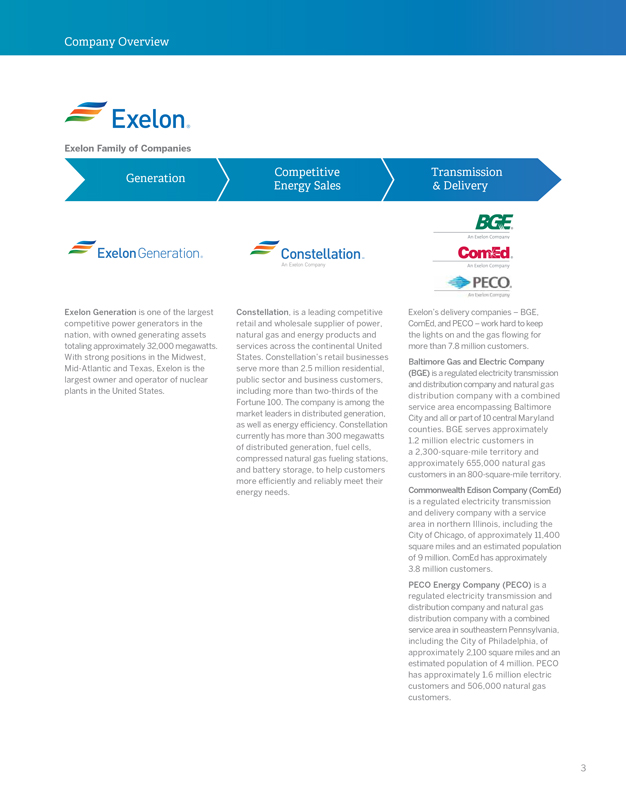
Company Overview Exelon Family of Companies Generation Competitive Transmission Energy Sales & Delivery Exelon Generation is one of the largest competitive power generators in the nation, with owned generating assets totaling approximately 32,000 megawatts. With strong positions in the Midwest, Mid-Atlantic and Texas, Exelon is the largest owner and operator of nuclear plants in the United States. Constellation, is a leading competitive retail and wholesale supplier of power, natural gas and energy products and services across the continental United States. Constellation’s retail businesses serve more than 2.5 million residential, public sector and business customers, including more than two-thirds of the Fortune 100. The company is among the market leaders in distributed generation, as well as energy efficiency. Constellation currently has more than 300 megawatts of distributed generation, fuel cells, compressed natural gas fueling stations, and battery storage, to help customers more efficiently and reliably meet their energy needs. Exelon’s delivery companies – BGE, ComEd, and PECO – work hard to keep the lights on and the gas ?owing for more than 7.8 million customers. Baltimore Gas and Electric Company (BGE) is a regulated electricity transmission and distribution company and natural gas distribution company with a combined service area encompassing Baltimore City and all or part of 10 central Maryland counties. BGE serves approximately 1.2 million electric customers in a 2,300-square-mile territory and approximately 655,000 natural gas customers in an 800-square-mile territory. Commonwealth Edison Company (ComEd) is a regulated electricity transmission and delivery company with a service area in northern Illinois, including the City of Chicago, of approximately 11,400 square miles and an estimated population of 9 million. ComEd has approximately 3.8 million customers. PECO Energy Company (PECO) is a regulated electricity transmission and distribution company and natural gas distribution company with a combined service area in southeastern Pennsylvania, including the City of Philadelphia, of approximately 2,100 square miles and an estimated population of 4 million. PECO has approximately 1.6 million electric customers and 506,000 natural gas customers. 3
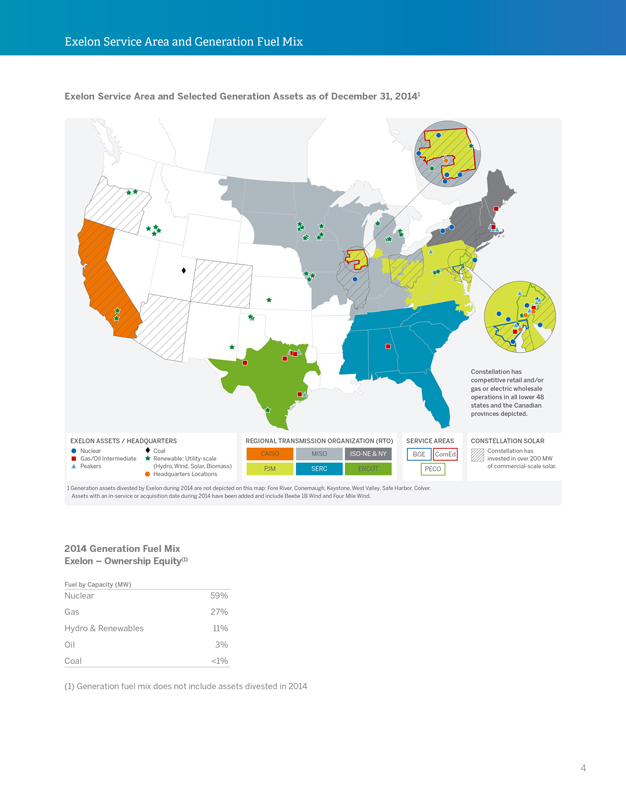
Exelon Service Area and Generation Fuel Mix Exelon Service Area and Selected Generation Assets as of December 31, 20141 EXELON ASSETS / HEADQUARTERS Nuclear Coal Gas/Oil Intermediate Renewable: Utility-scale Peakers (Hydro, Wind, Solar, Biomass) Headquarters Locations Constellation has competitive retail and/or gas or electric wholesale operations in all lower 48 states and the Canadian provinces depicted. REGIONAL TRANSMISSION ORGANIZATION (RTO) CAISO MISO ISO-NE & NY PJM SERC ERCOT SERVICE AREAS BGE ComEd PECO CONSTELLATION SOLAR Constellation has invested in over 200 MW of commercial-scale solar. 2014 Generation Fuel Mix Exelon – Ownership Equity(1) Fuel by Capacity (MW) Nuclear 59% Gas 27% Hydro & Renewables 11% Oil 3% Coal <1% (1) Generation fuel mix does not include assets divested in 2014 4
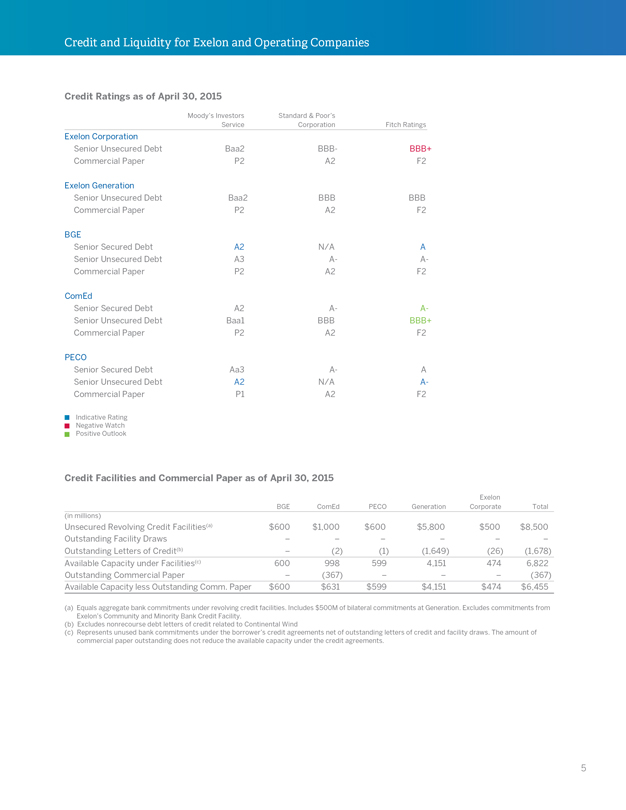
Credit and Liquidity for Exelon and Operating Companies Credit Ratings as of April 30, 2015 Moody’s Investors Standard & Poor’s Service Corporation Fitch Ratings Exelon Corporation Senior Unsecured Debt Baa2 BBB- BBB+ Commercial Paper P2 A2 F2 Exelon Generation Senior Unsecured Debt Baa2 BBB BBB Commercial Paper P2 A2 F2 BGE Senior Secured Debt A2 N/A A Senior Unsecured Debt A3 A- A- Commercial Paper P2 A2 F2 ComEd Senior Secured Debt A2 A- A- Senior Unsecured Debt Baa1 BBB BBB+ Commercial Paper P2 A2 F2 PECO Senior Secured Debt Aa3 A- A Senior Unsecured Debt A2 N/A A- Commercial Paper P1 A2 F2 Indicative Rating Negative Watch Positive Outlook Credit Facilities and Commercial Paper as of April 30, 2015 Exelon BGE ComEd PECO Generation Corporate Total (in millions) Unsecured Revolving Credit Facilities(a) $ 600 $1,000 $600 $5,800 $500 $8,500 Outstanding Facility Draws – – – – – – Outstanding Letters of Credit(b) –(2)(1)(1,649)(26)(1,678) Available Capacity under Facilities(c) 600 998 599 4,151 474 6,822 Outstanding Commercial Paper –(367) – – –(367) Available Capacity less Outstanding Comm. Paper $ 600 $631 $599 $4,151 $474 $6,455 (a) Equals aggregate bank commitments under revolving credit facilities. Includes $500M of bilateral commitments at Generation. Excludes commitments from Exelon’s Community and Minority Bank Credit Facility. (b) Excludes nonrecourse debt letters of credit related to Continental Wind (c) Represents unused bank commitments under the borrower’s credit agreements net of outstanding letters of credit and facility draws. The amount of commercial paper outstanding does not reduce the available capacity under the credit agreements. 5
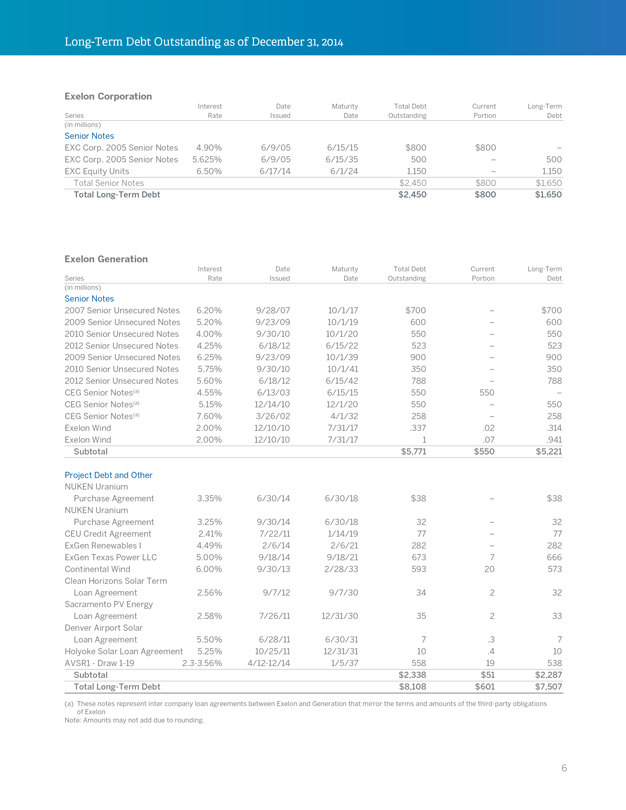
Long-Term Debt Outstanding as of December 31, 2014 Exelon Corporation Interest Date Maturity Total Debt Current Long-Term Series Rate Issued Date Outstanding Portion Debt (in millions) Senior Notes EXC Corp. 2005 Senior Notes 4.90% 6/9/05 6/15/15 $800 $800 – EXC Corp. 2005 Senior Notes 5.625% 6/9/05 6/15/35 500 – 500 EXC Equity Units 6.50% 6/17/14 6/1/24 1,150 – 1,150 Total Senior Notes $2,450 $800 $1,650 Total Long-Term Debt $2,450 $800 $1,650 Exelon Generation Interest Date Maturity Total Debt Current Long-Term Series Rate Issued Date Outstanding Portion Debt (in millions) Senior Notes 2007 Senior Unsecured Notes 6.20% 9/28/07 10/1/17 $700 – $700 2009 Senior Unsecured Notes 5.20% 9/23/09 10/1/19 600 – 600 2010 Senior Unsecured Notes 4.00% 9/30/10 10/1/20 550 – 550 2012 Senior Unsecured Notes 4.25% 6/18/12 6/15/22 523 – 523 2009 Senior Unsecured Notes 6.25% 9/23/09 10/1/39 900 – 900 2010 Senior Unsecured Notes 5.75% 9/30/10 10/1/41 350 – 350 2012 Senior Unsecured Notes 5.60% 6/18/12 6/15/42 788 – 788 CEG Senior Notes(a) 4.55% 6/13/03 6/15/15 550 550 – CEG Senior Notes(a) 5.15% 12/14/10 12/1/20 550 – 550 CEG Senior Notes(a) 7.60% 3/26/02 4/1/32 258 – 258 Exelon Wind 2.00% 12/10/10 7/31/17 .337 .02 .314 Exelon Wind 2.00% 12/10/10 7/31/17 1 .07 .941 Subtotal $5,771 $550 $5,221 Project Debt and Other NUKEN Uranium Purchase Agreement 3.35% 6/30/14 6/30/18 $38 – $38 NUKEN Uranium Purchase Agreement 3.25% 9/30/14 6/30/18 32 – 32 CEU Credit Agreement 2.41% 7/22/11 1/14/19 77 – 77 ExGen Renewables I 4.49% 2/6/14 2/6/21 282 – 282 ExGen Texas Power LLC 5.00% 9/18/14 9/18/21 673 7 666 Continental Wind 6.00% 9/30/13 2/28/33 593 20 573 Clean Horizons Solar Term Loan Agreement 2.56% 9/7/12 9/7/30 34 2 32 Sacramento PV Energy Loan Agreement 2.58% 7/26/11 12/31/30 35 2 33 Denver Airport Solar Loan Agreement 5.50% 6/28/11 6/30/31 7 .3 7 Holyoke Solar Loan Agreement 5.25% 10/25/11 12/31/31 10 .4 10 AVSR1—Draw 1-19 2.3-3.56% 4/12-12/14 1/5/37 558 19 538 Subtotal $2,338 $51 $2,287 Total Long-Term Debt $8,108 $601 $7,507 (a) These notes represent inter company loan agreements between Exelon and Generation that mirror the terms and amounts of the third-party obligations of Exelon Note: Amounts may not add due to rounding. 6
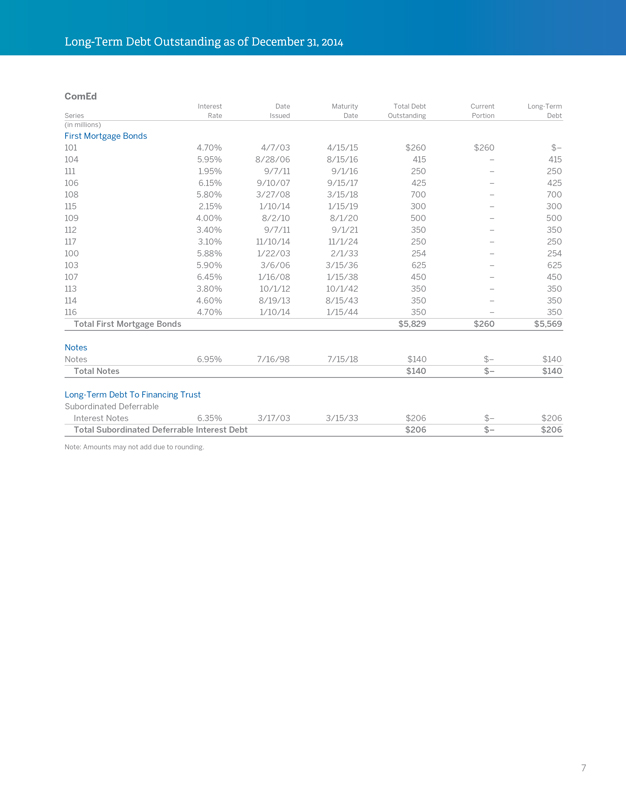
Long-Term Debt Outstanding as of December 31, 2014 ComEd Interest Date Maturity Total Debt Current Long-Term Series Rate Issued Date Outstanding Portion Debt (in millions) First Mortgage Bonds 101 4.70% 4/7/03 4/15/15 $260 $260 $– 104 5.95% 8/28/06 8/15/16 415 – 415 111 1.95% 9/7/11 9/1/16 250 – 250 106 6.15% 9/10/07 9/15/17 425 – 425 108 5.80% 3/27/08 3/15/18 700 – 700 115 2.15% 1/10/14 1/15/19 300 – 300 109 4.00% 8/2/10 8/1/20 500 – 500 112 3.40% 9/7/11 9/1/21 350 – 350 117 3.10% 11/10/14 11/1/24 250 – 250 100 5.88% 1/22/03 2/1/33 254 – 254 103 5.90% 3/6/06 3/15/36 625 – 625 107 6.45% 1/16/08 1/15/38 450 – 450 113 3.80% 10/1/12 10/1/42 350 – 350 114 4.60% 8/19/13 8/15/43 350 – 350 116 4.70% 1/10/14 1/15/44 350 – 350 Total First Mortgage Bonds $5,829 $260 $5,569 Notes Notes 6.95% 7/16/98 7/15/18 $140 $– $140 Total Notes $140 $– $140 Long-Term Debt To Financing Trust Subordinated Deferrable Interest Notes 6.35% 3/17/03 3/15/33 $206 $– $206 Total Subordinated Deferrable Interest Debt $206 $– $206 Note: Amounts may not add due to rounding. 7
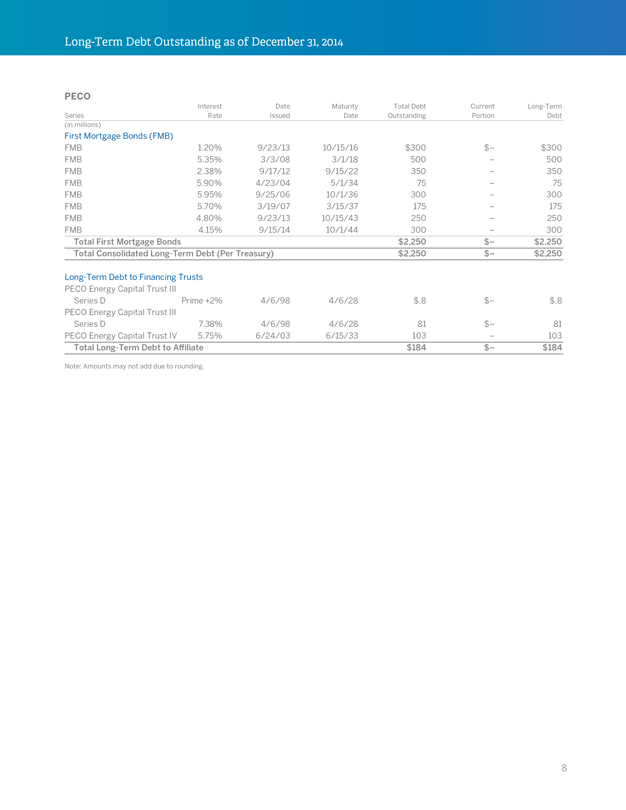
Long-Term Debt Outstanding as of December 31, 2014 PECO Interest Date Maturity Total Debt Current Long-Term Series Rate Issued Date Outstanding Portion Debt (in millions) First Mortgage Bonds (FMB) FMB 1.20% 9/23/13 10/15/16 $300 $ – $300 FMB 5.35% 3/3/08 3/1/18 500 – 500 FMB 2.38% 9/17/12 9/15/22 350 – 350 FMB 5.90% 4/23/04 5/1/34 75 – 75 FMB 5.95% 9/25/06 10/1/36 300 – 300 FMB 5.70% 3/19/07 3/15/37 175 – 175 FMB 4.80% 9/23/13 10/15/43 250 – 250 FMB 4.15% 9/15/14 10/1/44 300 – 300 Total First Mortgage Bonds $2,250 $ – $2,250 Total Consolidated Long-Term Debt (Per Treasury) $2,250 $ – $2,250 Long-Term Debt to Financing Trusts PECO Energy Capital Trust III Series D Prime +2% 4/6/98 4/6/28 $.8 $ – $.8 PECO Energy Capital Trust III Series D 7.38% 4/6/98 4/6/28 81 $ – 81 PECO Energy Capital Trust IV 5.75% 6/24/03 6/15/33 103 – 103 Total Long-Term Debt to Affiliate $184 $ – $184 Note: Amounts may not add due to rounding. 8
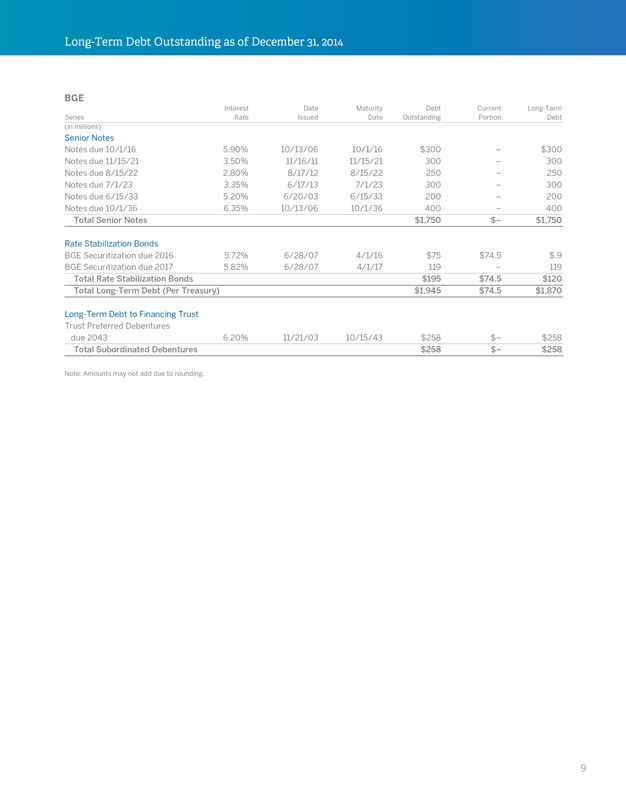
Long-Term Debt Outstanding as of December 31, 2014 BGE Interest Date Maturity Debt Current Long-Term Series Rate Issued Date Outstanding Portion Debt (in millions) Senior Notes Notes due 10/1/16 5.90% 10/13/06 10/1/16 $300 – $300 Notes due 11/15/21 3.50% 11/16/11 11/15/21 300 – 300 Notes due 8/15/22 2.80% 8/17/12 8/15/22 250 – 250 Notes due 7/1/23 3.35% 6/17/13 7/1/23 300 – 300 Notes due 6/15/33 5.20% 6/20/03 6/15/33 200 – 200 Notes due 10/1/36 6.35% 10/13/06 10/1/36 400 – 400 Total Senior Notes $1,750 $– $1,750 Rate Stabilization Bonds BGE Securitization due 2016 5.72% 6/28/07 4/1/16 $75 $74.5 $.9 BGE Securitization due 2017 5.82% 6/28/07 4/1/17 119 – 119 Total Rate Stabilization Bonds $195 $74.5 $120 Total Long-Term Debt (Per Treasury) $1,945 $74.5 $1,870 Long-Term Debt to Financing Trust Trust Preferred Debentures due 2043 6.20% 11/21/03 10/15/43 $258 $– $258 Total Subordinated Debentures $258 $– $258 Note: Amounts may not add due to rounding. 9
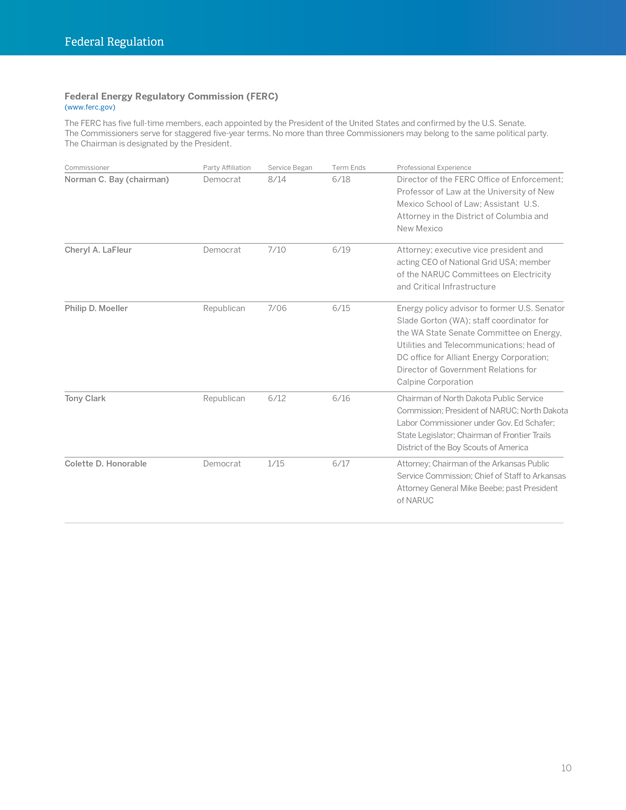
Federal Regulation Federal Energy Regulatory Commission (FERC) (www.ferc.gov) The FERC has ?ve full-time members, each appointed by the President of the United States and con?rmed by the U.S. Senate. The Commissioners serve for staggered ?ve-year terms. No more than three Commissioners may belong to the same political party. The Chairman is designated by the President. Commissioner Party Affiliation Service Began Term Ends Professional Experience Norman C. Bay (chairman) Democrat 8/14 6/18 Director of the FERC Office of Enforcement; Professor of Law at the University of New Mexico School of Law; Assistant U.S. Attorney in the District of Columbia and New Mexico Cheryl A. LaFleur Democrat 7/10 6/19 Attorney; executive vice president and acting CEO of National Grid USA; member of the NARUC Committees on Electricity and Critical Infrastructure Philip D. Moeller Republican 7/06 6/15 Energy policy advisor to former U.S. Senator Slade Gorton (WA); staff coordinator for the WA State Senate Committee on Energy, Utilities and Telecommunications; head of DC office for Alliant Energy Corporation; Director of Government Relations for Calpine Corporation Tony Clark Republican 6/12 6/16 Chairman of North Dakota Public Service Commission; President of NARUC; North Dakota Labor Commissioner under Gov. Ed Schafer; State Legislator; Chairman of Frontier Trails District of the Boy Scouts of America Colette D. Honorable Democrat 1/15 6/17 Attorney; Chairman of the Arkansas Public Service Commission; Chief of Staff to Arkansas Attorney General Mike Beebe; past President of NARUC 10
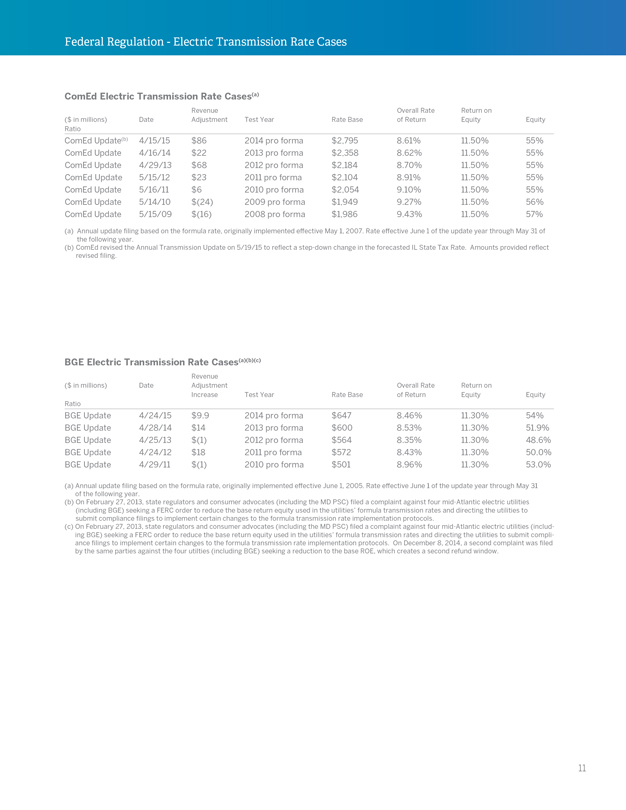
Federal Regulation—Electric Transmission Rate Cases ComEd Electric Transmission Rate Cases(a) Revenue Overall Rate Return on ($ in millions) Date Adjustment Test Year Rate Base of Return Equity Equity Ratio ComEd Update(b) 4/15/15 $86 2014 pro forma $2,795 8.61% 11.50% 55% ComEd Update 4/16/14 $22 2013 pro forma $2,358 8.62% 11.50% 55% ComEd Update 4/29/13 $68 2012 pro forma $2,184 8.70% 11.50% 55% ComEd Update 5/15/12 $23 2011 pro forma $2,104 8.91% 11.50% 55% ComEd Update 5/16/11 $6 2010 pro forma $2,054 9.10% 11.50% 55% ComEd Update 5/14/10 $(24) 2009 pro forma $1,949 9.27% 11.50% 56% ComEd Update 5/15/09 $(16) 2008 pro forma $1,986 9.43% 11.50% 57% (a) Annual update ?ling based on the formula rate, originally implemented effective May 1, 2007. Rate effective June 1 of the update year through May 31 of the following year. (b) ComEd revised the Annual Transmission Update on 5/19/15 to re?ect a step-down change in the forecasted IL State Tax Rate. Amounts provided re?ect revised ?ling. BGE Electric Transmission Rate Cases(a)(b)(c) Revenue ($ in millions) Date Adjustment Overall Rate Return on Increase Test Year Rate Base of Return Equity Equity Ratio BGE Update 4/24/15 $9.9 2014 pro forma $647 8.46% 11.30% 54% BGE Update 4/28/14 $14 2013 pro forma $600 8.53% 11.30% 51.9% BGE Update 4/25/13 $(1) 2012 pro forma $564 8.35% 11.30% 48.6% BGE Update 4/24/12 $18 2011 pro forma $572 8.43% 11.30% 50.0% BGE Update 4/29/11 $(1) 2010 pro forma $501 8.96% 11.30% 53.0% (a) Annual update ?ling based on the formula rate, originally implemented effective June 1, 2005. Rate effective June 1 of the update year through May 31 of the following year. (b) On February 27, 2013, state regulators and consumer advocates (including the MD PSC) ?led a complaint against four mid-Atlantic electric utilities (including BGE) seeking a FERC order to reduce the base return equity used in the utilities’ formula transmission rates and directing the utilities to submit compliance ?lings to implement certain changes to the formula transmission rate implementation protocols. (c) On February 27, 2013, state regulators and consumer advocates (including the MD PSC) ?led a complaint against four mid-Atlantic electric utilities (includ- ing BGE) seeking a FERC order to reduce the base return equity used in the utilities’ formula transmission rates and directing the utilities to submit compli- ance ?lings to implement certain changes to the formula transmission rate implementation protocols. On December 8, 2014, a second complaint was ?led by the same parties against the four utilties (including BGE) seeking a reduction to the base ROE, which creates a second refund window. 11
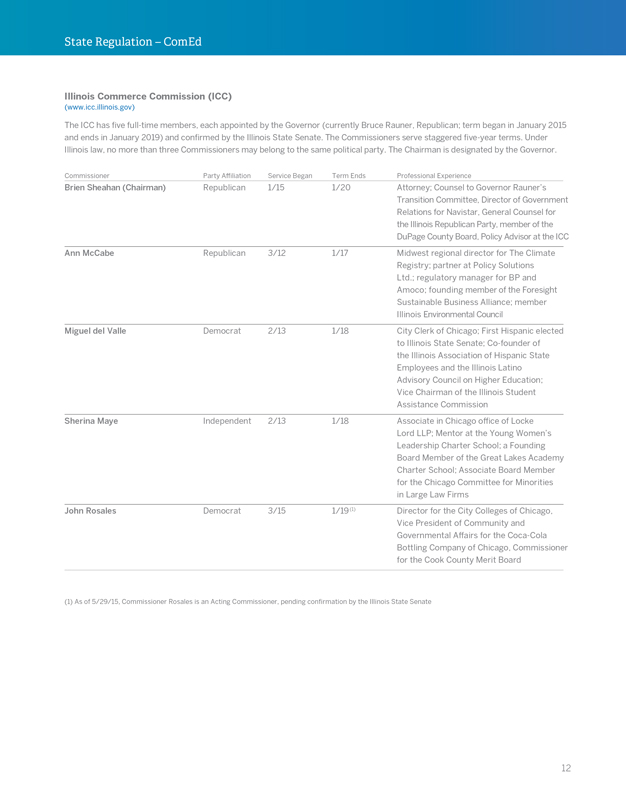
State Regulation – ComEd Illinois Commerce Commission (ICC) (www.icc.illinois.gov) The ICC has ?ve full-time members, each appointed by the Governor (currently Bruce Rauner, Republican; term began in January 2015 and ends in January 2019) and con?rmed by the Illinois State Senate. The Commissioners serve staggered ?ve-year terms. Under Illinois law, no more than three Commissioners may belong to the same political party. The Chairman is designated by the Governor. Commissioner Party Affiliation Service Began Term Ends Professional Experience Brien Sheahan (Chairman) Republican 1/15 1/20 Attorney; Counsel to Governor Rauner’s Transition Committee, Director of Government Relations for Navistar, General Counsel for the Illinois Republican Party, member of the DuPage County Board, Policy Advisor at the ICC Ann McCabe Republican 3/12 1/17 Midwest regional director for The Climate Registry; partner at Policy Solutions Ltd.; regulatory manager for BP and Amoco; founding member of the Foresight Sustainable Business Alliance; member Illinois Environmental Council Miguel del Valle Democrat 2/13 1/18 City Clerk of Chicago; First Hispanic elected to Illinois State Senate; Co-founder of the Illinois Association of Hispanic State Employees and the Illinois Latino Advisory Council on Higher Education; Vice Chairman of the Illinois Student Assistance Commission Sherina Maye Independent 2/13 1/18 Associate in Chicago office of Locke Lord LLP; Mentor at the Young Women’s Leadership Charter School; a Founding Board Member of the Great Lakes Academy Charter School; Associate Board Member for the Chicago Committee for Minorities in Large Law Firms John Rosales Democrat 3/15 1/19 (1) Director for the City Colleges of Chicago, Vice President of Community and Governmental Affairs for the Coca-Cola Bottling Company of Chicago, Commissioner for the Cook County Merit Board (1) As of 5/29/15, Commissioner Rosales is an Acting Commissioner, pending con?rmation by the Illinois State Senate 12
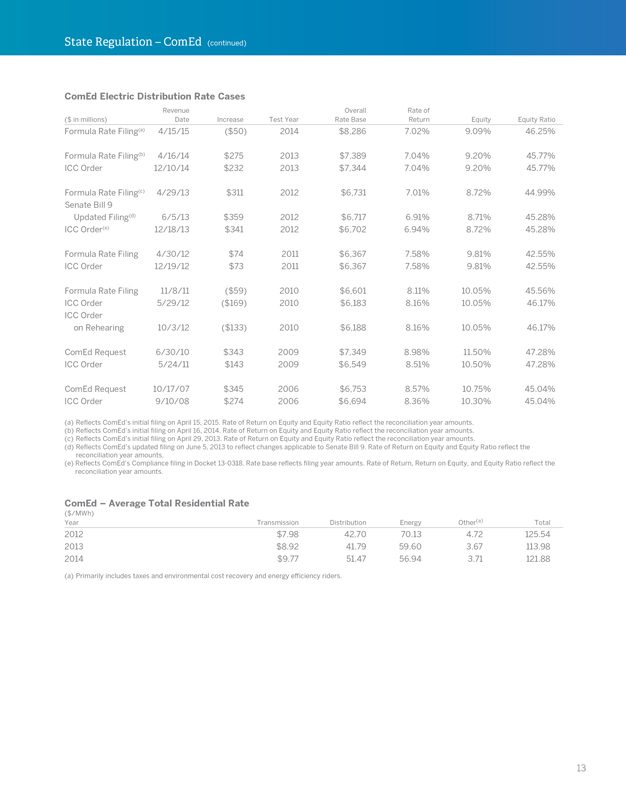
State Regulation – ComEd (continued) ComEd Electric Distribution Rate Cases Revenue Overall Rate of ($ in millions) Date Increase Test Year Rate Base Return Equity Equity Ratio Formula Rate Filing(a) 4/15/15($50) 2014 $8,286 7.02% 9.09% 46.25% Formula Rate Filing(b) 4/16/14 $275 2013 $7,389 7.04% 9.20% 45.77% ICC Order 12/10/14 $232 2013 $7,344 7.04% 9.20% 45.77% Formula Rate Filing(c) 4/29/13 $311 2012 $6,731 7.01% 8.72% 44.99% Senate Bill 9 Updated Filing(d) 6/5/13 $359 2012 $6,717 6.91% 8.71% 45.28% ICC Order(e) 12/18/13 $341 2012 $6,702 6.94% 8.72% 45.28% Formula Rate Filing 4/30/12 $74 2011 $6,367 7.58% 9.81% 42.55% ICC Order 12/19/12 $73 2011 $6,367 7.58% 9.81% 42.55% Formula Rate Filing 11/8/11($59) 2010 $6,601 8.11% 10.05% 45.56% ICC Order 5/29/12($169) 2010 $6,183 8.16% 10.05% 46.17% ICC Order on Rehearing 10/3/12($133) 2010 $6,188 8.16% 10.05% 46.17% ComEd Request 6/30/10 $343 2009 $7,349 8.98% 11.50% 47.28% ICC Order 5/24/11 $143 2009 $6,549 8.51% 10.50% 47.28% ComEd Request 10/17/07 $345 2006 $6,753 8.57% 10.75% 45.04% ICC Order 9/10/08 $274 2006 $6,694 8.36% 10.30% 45.04% (a) Reflects ComEd’s initial filing on April 15, 2015. Rate of Return on Equity and Equity Ratio reflect the reconciliation year amounts. (b) Reflects ComEd’s initial filing on April 16, 2014. Rate of Return on Equity and Equity Ratio reflect the reconciliation year amounts. (c) Reflects ComEd’s initial filing on April 29, 2013. Rate of Return on Equity and Equity Ratio reflect the reconciliation year amounts. (d) Reflects ComEd’s updated filing on June 5, 2013 to reflect changes applicable to Senate Bill 9. Rate of Return on Equity and Equity Ratio reflect the reconciliation year amounts. (e) Reflects ComEd’s Compliance filing in Docket 13-0318. Rate base reflects filing year amounts. Rate of Return, Return on Equity, and Equity Ratio reflect the reconciliation year amounts. ComEd – Average Total Residential Rate ($/MWh) Year Transmission Distribution Energy Other(a) Total 2012 $7.98 42.70 70.13 4.72 125.54 2013 $8.92 41.79 59.60 3.67 113.98 2014 $9.77 51.47 56.94 3.71 121.88 (a) Primarily includes taxes and environmental cost recovery and energy efficiency riders. 13
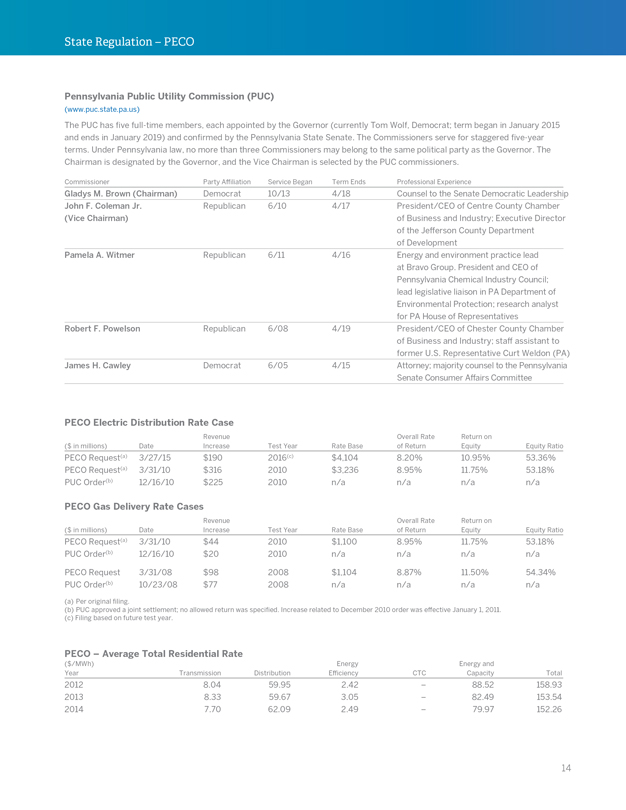
State Regulation – PECO Pennsylvania Public Utility Commission (PUC) (www.puc.state.pa.us) The PUC has ?ve full-time members, each appointed by the Governor (currently Tom Wolf, Democrat; term began in January 2015 and ends in January 2019) and con?rmed by the Pennsylvania State Senate. The Commissioners serve for staggered ?ve-year terms. Under Pennsylvania law, no more than three Commissioners may belong to the same political party as the Governor. The Chairman is designated by the Governor, and the Vice Chairman is selected by the PUC commissioners. Commissioner Party Affiliation Service Began Term Ends Professional Experience Gladys M. Brown (Chairman) Democrat 10/13 4/18 Counsel to the Senate Democratic Leadership John F. Coleman Jr. Republican 6/10 4/17 President/CEO of Centre County Chamber (Vice Chairman) of Business and Industry; Executive Director of the Jefferson County Department of Development Pamela A. Witmer Republican 6/11 4/16 Energy and environment practice lead at Bravo Group. President and CEO of Pennsylvania Chemical Industry Council; lead legislative liaison in PA Department of Environmental Protection; research analyst for PA House of Representatives Robert F. Powelson Republican 6/08 4/19 President/CEO of Chester County Chamber of Business and Industry; staff assistant to former U.S. Representative Curt Weldon (PA) James H. Cawley Democrat 6/05 4/15 Attorney; majority counsel to the Pennsylvania Senate Consumer Affairs Committee PECO Electric Distribution Rate Case Revenue Overall Rate Return on ($ in millions) Date Increase Test Year Rate Base of Return Equity Equity Ratio PECO Request(a) 3/27/15 $190 2016(c) $4,104 8.20% 10.95% 53.36% PECO Request(a) 3/31/10 $316 2010 $3,236 8.95% 11.75% 53.18% PUC Order(b) 12/16/10 $225 2010 n/a n/a n/a n/a PECO Gas Delivery Rate Cases Revenue Overall Rate Return on ($ in millions) Date Increase Test Year Rate Base of Return Equity Equity Ratio PECO Request(a) 3/31/10 $44 2010 $1,100 8.95% 11.75% 53.18% PUC Order(b) 12/16/10 $20 2010 n/a n/a n/a n/a PECO Request 3/31/08 $98 2008 $1,104 8.87% 11.50% 54.34% PUC Order(b) 10/23/08 $77 2008 n/a n/a n/a n/a (a) Per original ?ling. (b) PUC approved a joint settlement; no allowed return was speci?ed. Increase related to December 2010 order was effective January 1, 2011. (c) Filing based on future test year. PECO – Average Total Residential Rate ($ /MWh) Energy Energy and Year Transmission Distribution Efficiency CTC Capacity Total 2012 8.04 59.95 2.42 – 88.52 158.93 2013 8.33 59.67 3.05 – 82.49 153.54 2014 7.70 62.09 2.49 – 79.97 152.26 14
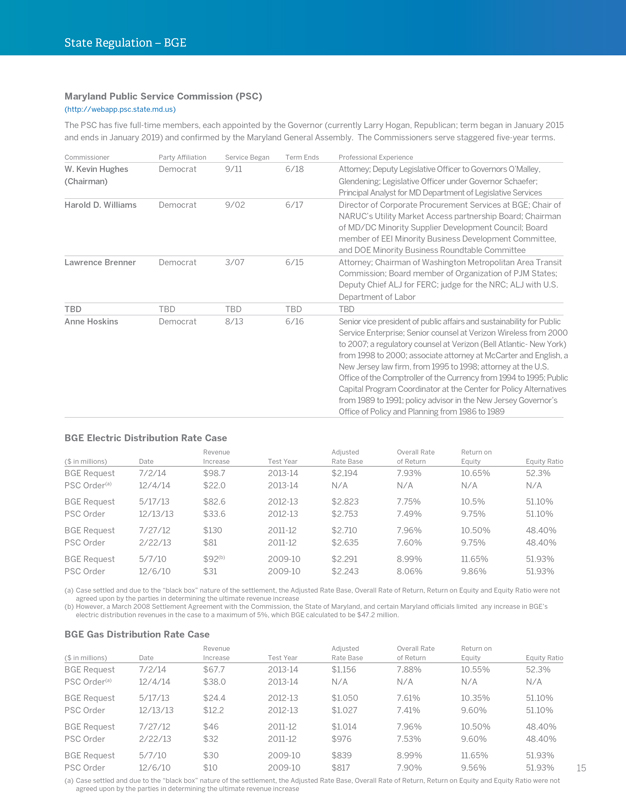
State Regulation – BGE Maryland Public Service Commission (PSC) (http://webapp.psc.state.md.us) The PSC has ?ve full-time members, each appointed by the Governor (currently Larry Hogan, Republican; term began in January 2015 and ends in January 2019) and con?rmed by the Maryland General Assembly. The Commissioners serve staggered ?ve-year terms. Commissioner Party Affiliation Service Began Term Ends Professional Experience W. Kevin Hughes Democrat 9/11 6/18 Attorney; Deputy Legislative Officer to Governors O’Malley, (Chairman) Glendening; Legislative Officer under Governor Schaefer; Principal Analyst for MD Department of Legislative Services Harold D. Williams Democrat 9/02 6/17 Director of Corporate Procurement Services at BGE; Chair of NARUC’s Utility Market Access partnership Board; Chairman of MD/DC Minority Supplier Development Council; Board member of EEI Minority Business Development Committee, and DOE Minority Business Roundtable Committee Lawrence Brenner Democrat 3/07 6/15 Attorney; Chairman of Washington Metropolitan Area Transit Commission; Board member of Organization of PJM States; Deputy Chief ALJ for FERC; judge for the NRC; ALJ with U.S. Department of Labor TBD TBD TBD TBD TBD Anne Hoskins Democrat 8/13 6/16 Senior vice president of public affairs and sustainability for Public Service Enterprise; Senior counsel at Verizon Wireless from 2000 to 2007; a regulatory counsel at Verizon (Bell Atlantic- New York) from 1998 to 2000; associate attorney at McCarter and English, a New Jersey law ?rm, from 1995 to 1998; attorney at the U.S. Office of the Comptroller of the Currency from 1994 to 1995; Public Capital Program Coordinator at the Center for Policy Alternatives from 1989 to 1991; policy advisor in the New Jersey Governor’s Office of Policy and Planning from 1986 to 1989 BGE Electric Distribution Rate Case Revenue Adjusted Overall Rate Return on ($ in millions) Date Increase Test Year Rate Base of Return Equity Equity Ratio BGE Request 7/2/14 $98.7 2013-14 $2,194 7.93% 10.65% 52.3% PSC Order(a) 12/4/14 $22.0 2013-14 N/A N/A N/A N/A BGE Request 5/17/13 $82.6 2012-13 $2.823 7.75% 10.5% 51.10% PSC Order 12/13/13 $33.6 2012-13 $2.753 7.49% 9.75% 51.10% BGE Request 7/27/12 $130 2011-12 $2.710 7.96% 10.50% 48.40% PSC Order 2/22/13 $81 2011-12 $2.635 7.60% 9.75% 48.40% BGE Request 5/7/10 $92(b) 2009-10 $2.291 8.99% 11.65% 51.93% PSC Order 12/6/10 $31 2009-10 $2.243 8.06% 9.86% 51.93% (a) Case settled and due to the “black box” nature of the settlement, the Adjusted Rate Base, Overall Rate of Return, Return on Equity and Equity Ratio were not agreed upon by the parties in determining the ultimate revenue increase (b) However, a March 2008 Settlement Agreement with the Commission, the State of Maryland, and certain Maryland officials limited any increase in BGE’s electric distribution revenues in the case to a maximum of 5%, which BGE calculated to be $47.2 million. BGE Gas Distribution Rate Case Revenue Adjusted Overall Rate Return on ($ in millions) Date Increase Test Year Rate Base of Return Equity Equity Ratio BGE Request 7/2/14 $67.7 2013-14 $1,156 7.88% 10.55% 52.3% PSC Order(a) 12/4/14 $38.0 2013-14 N/A N/A N/A N/A BGE Request 5/17/13 $24.4 2012-13 $1.050 7.61% 10.35% 51.10% PSC Order 12/13/13 $12.2 2012-13 $1.027 7.41% 9.60% 51.10% BGE Request 7/27/12 $46 2011-12 $1.014 7.96% 10.50% 48.40% PSC Order 2/22/13 $32 2011-12 $976 7.53% 9.60% 48.40% BGE Request 5/7/10 $30 2009-10 $839 8.99% 11.65% 51.93% PSC Order 12/6/10 $10 2009-10 $817 7.90% 9.56% 51.93% (a) Case settled and due to the “black box” nature of the settlement, the Adjusted Rate Base, Overall Rate of Return, Return on Equity and Equity Ratio were not agreed upon by the parties in determining the ultimate revenue increase 15
State Regulation – BGE (continued) Capital Structure and Capitalization Ratios for Exelon and Operating Companies BGE – Average Total Residential Rate ($/MWh) Year Energy Transmission Distribution Other Total 2012 85.54 7.87 33.35 4.78 131.54 2013 88.01 7.84 37.22 5.16 138.24 2014 84.33 7.48 39.41 6.62 137.84 16
Capital Structure and Capitalization Ratios for Exelon and Operating Companies Capital Structure and Capitalization Ratios for Exelon and Operating Companies (at December 31) 2014 2013 2012 Exelon (consolidated)(in millions)(in percent)(in millions)(in percent)(in millions)(in percent) Total Debt $22,272 48.0 $20,121 46.7 $19,603 47.3 Preferred Securities of Subsidiaries – – – – 87 0.2 Total Equity 24,133 52.0 22,940 53.3 21,730 52.5 Total Capitalization $46,405 $43,061 $41,420 Exelon Generation Total Debt $8,302 37.1 $7,751 37.8 $7,483 37.1 Total Equity 14,051 62.9 12,742 62.2 12,665 62.9 Total Capitalization $22,353 $20,493 $20,148 ComEd Total Debt $6,468 45.0 $6,065 44.6 $5,773 44.1 Total Equity 7,907 55.0 7,528 55.4 7,323 55.9 Total Capitalization $14,375 $13,593 $13,096 PECO Total Debt $2,430 43.8 $2,381 43.7 $2,341(a) 43.3 Preferred Securities (b) – – – – 87 1.6 Total Shareholders’ Equity 3,121 56.2 3,065 56.3 2,982 55.1 Total Capitalization $5,551 $5,446 $5,410 Transition Debt BGE Total Debt $2,320 45.7 $2,404 48.5 $2,436 50.8 Preferred Securities 190 3.8 190 3.8 190 4.0 Total Shareholders’ Equity 2,563 50.5 2,365 47.7 2,168 45.2 Total Capitalization $5,073 $4,959 $4,794 Note: Percentages may not add due to rounding. (a) Includes PECO’s accounts receivable agreement at December 31, 2012 of $210 million, which is classified as a short-term note payable. (b) On March 25, 2013, PECO Energy Company (PECO) issued a press release announcing that it had issued a notice of redemption for all of the outstanding shares of its preferred stock, effective May 1, 2013. 17
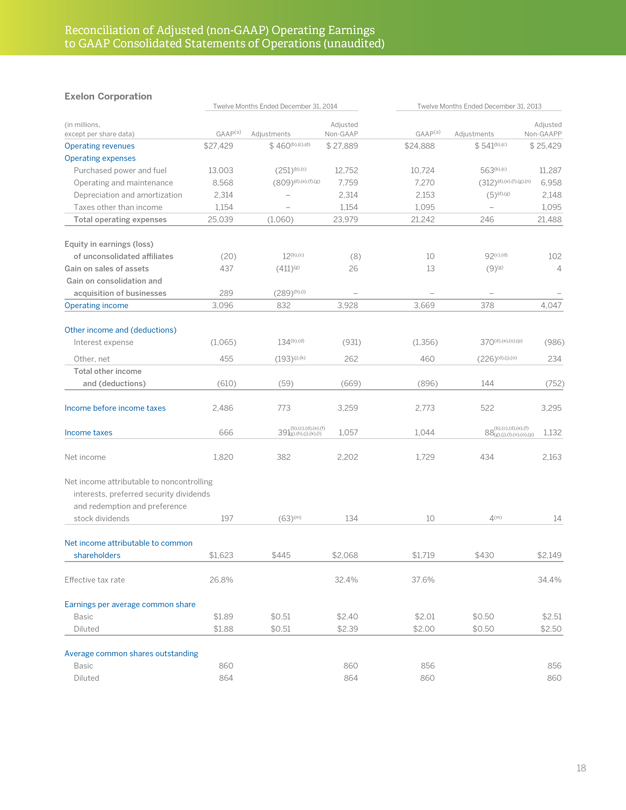
Reconciliation of Adjusted (non-GAAP) Operating Earnings to GAAP Consolidated Statements of Operations (unaudited) Exelon Corporation Twelve Months Ended December 31, 2014 Twelve Months Ended December 31, 2013 (in millions, Adjusted Adjusted except per share data) GAAP(a) Adjustments Non-GAAP GAAP(a) Adjustments Non-GAAPP Operating revenues $27,429 $ 460(b),(c),(d) $ 27,889 $24,888 $ 541(b),(c) $ 25,429 Operating expenses Purchased power and fuel 13,003(251)(b),(c) 12,752 10,724 563(b),(c) 11,287 Operating and maintenance 8,568(809)(d),(e),(f),(g) 7,759 7,270(312)(d),(e),(f),(g),(n) 6,958 Depreciation and amortization 2,314 – 2,314 2,153(5)(d),(g) 2,148 Taxes other than income 1,154 – 1,154 1,095 – 1,095 Total operating expenses 25,039(1,060) 23,979 21,242 246 21,488 Equity in earnings (loss) of unconsolidated affiliates(20) 12(b),(c)(8) 10 92(c),(d) 102 Gain on sales of assets 437(411)(g) 26 13(9)(g) 4 Gain on consolidation and acquisition of businesses 289(289)(h),(i) – – – – Operating income 3,096 832 3,928 3,669 378 4,047 Other income and (deductions) Interest expense(1,065) 134(b),(d)(931)(1,356) 370(d),(e),(o),(p)(986) Other, net 455(193)(j),(k) 262 460(226)(d),(j),(o) 234 Total other income and (deductions)(610)(59)(669)(896) 144(752) Income before income taxes 2,486 773 3,259 2,773 522 3,295 Income taxes 666 391(g),(h),(j),(k),(l) (b),(c),(d),(e),(f) 1,057 1,044 88(g),(j),(l),(n),(o),(p) (b),(c),(d),(e),(f) 1,132 Net income 1,820 382 2,202 1,729 434 2,163 Net income attributable to noncontrolling interests, preferred security dividends and redemption and preference stock dividends 197(63)(m) 134 10 4(m) 14 Net income attributable to common shareholders $1,623 $445 $2,068 $1,719 $430 $2,149 Effective tax rate 26.8% 32.4% 37.6% 34.4% Earnings per average common share Basic $1.89 $0.51 $2.40 $2.01 $0.50 $2.51 Diluted $1.88 $0.51 $2.39 $2.00 $0.50 $2.50 Average common shares outstanding Basic 860 860 856 856 Diluted 864 864 860 860 18
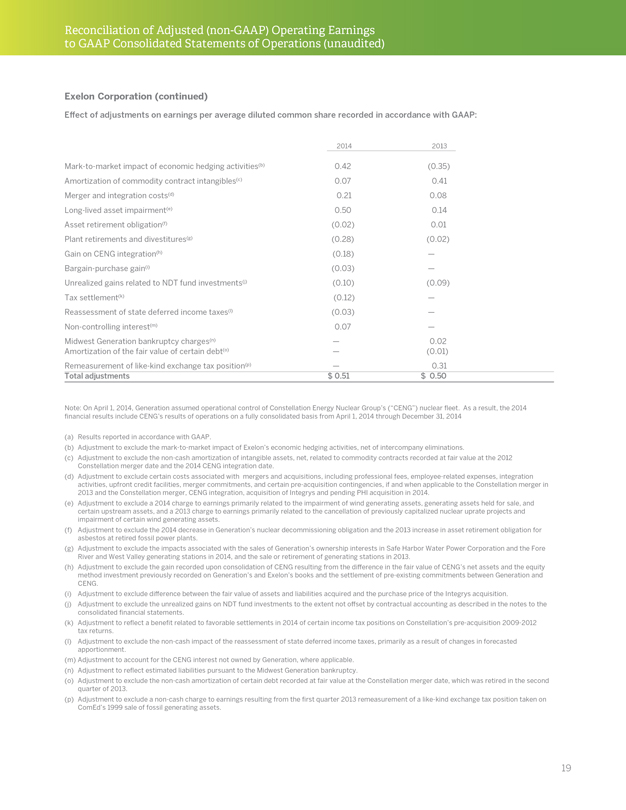
Reconciliation of Adjusted (non-GAAP) Operating Earnings to GAAP Consolidated Statements of Operations (unaudited) Exelon Corporation (continued) Effect of adjustments on earnings per average diluted common share recorded in accordance with GAAP: 2014 2013 Mark-to-market impact of economic hedging activities(b) 0.42(0.35) Amortization of commodity contract intangibles(c) 0.07 0.41 Merger and integration costs(d) 0.21 0.08 Long-lived asset impairment(e) 0.50 0.14 Asset retirement obligation(f)(0.02) 0.01 Plant retirements and divestitures(g)(0.28)(0.02) Gain on CENG integration(h)(0.18) — Bargain-purchase gain(i)(0.03) — Unrealized gains related to NDT fund investments(j)(0.10)(0.09) Tax settlement(k)(0.12) — Reassessment of state deferred income taxes(l)(0.03) — Non-controlling interest(m) 0.07 — Midwest Generation bankruptcy charges(n) — 0.02 Amortization of the fair value of certain debt(o) —(0.01) Remeasurement of like-kind exchange tax position(p) — 0.31 Total adjustments $ 0.51 $ 0.50 Note: On April 1, 2014, Generation assumed operational control of Constellation Energy Nuclear Group’s (“CENG”) nuclear fleet. As a result, the 2014 financial results include CENG’s results of operations on a fully consolidated basis from April 1, 2014 through December 31, 2014 (a) Results reported in accordance with GAAP. (b) Adjustment to exclude the mark-to-market impact of Exelon’s economic hedging activities, net of intercompany eliminations. (c) Adjustment to exclude the non-cash amortization of intangible assets, net, related to commodity contracts recorded at fair value at the 2012 Constellation merger date and the 2014 CENG integration date. (d) Adjustment to exclude certain costs associated with mergers and acquisitions, including professional fees, employee-related expenses, integration activities, upfront credit facilities, merger commitments, and certain pre-acquisition contingencies, if and when applicable to the Constellation merger in 2013 and the Constellation merger, CENG integration, acquisition of Integrys and pending PHI acquisition in 2014. (e) Adjustment to exclude a 2014 charge to earnings primarily related to the impairment of wind generating assets, generating assets held for sale, and certain upstream assets, and a 2013 charge to earnings primarily related to the cancellation of previously capitalized nuclear uprate projects and impairment of certain wind generating assets. (f) Adjustment to exclude the 2014 decrease in Generation’s nuclear decommissioning obligation and the 2013 increase in asset retirement obligation for asbestos at retired fossil power plants. (g) Adjustment to exclude the impacts associated with the sales of Generation’s ownership interests in Safe Harbor Water Power Corporation and the Fore River and West Valley generating stations in 2014, and the sale or retirement of generating stations in 2013. (h) Adjustment to exclude the gain recorded upon consolidation of CENG resulting from the difference in the fair value of CENG’s net assets and the equity method investment previously recorded on Generation’s and Exelon’s books and the settlement of pre-existing commitments between Generation and CENG. (i) Adjustment to exclude difference between the fair value of assets and liabilities acquired and the purchase price of the Integrys acquisition. (j) Adjustment to exclude the unrealized gains on NDT fund investments to the extent not offset by contractual accounting as described in the notes to the consolidated ?nancial statements. (k) Adjustment to reflect a benefit related to favorable settlements in 2014 of certain income tax positions on Constellation’s pre-acquisition 2009-2012 tax returns. (l) Adjustment to exclude the non-cash impact of the reassessment of state deferred income taxes, primarily as a result of changes in forecasted apportionment. (m) Adjustment to account for the CENG interest not owned by Generation, where applicable. (n) Adjustment to re?ect estimated liabilities pursuant to the Midwest Generation bankruptcy. (o) Adjustment to exclude the non-cash amortization of certain debt recorded at fair value at the Constellation merger date, which was retired in the second quarter of 2013. (p) Adjustment to exclude a non-cash charge to earnings resulting from the ?rst quarter 2013 remeasurement of a like-kind exchange tax position taken on ComEd’s 1999 sale of fossil generating assets. 19
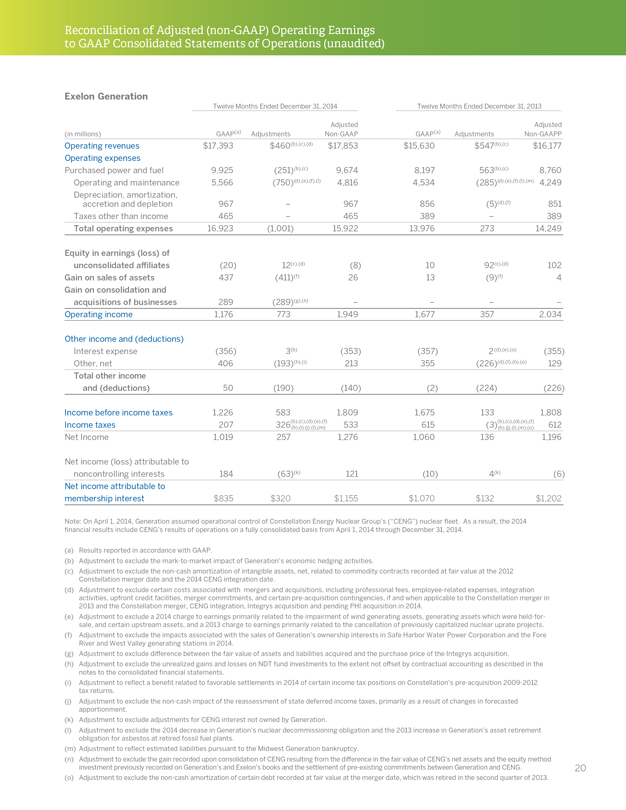
Reconciliation of Adjusted (non-GAAP) Operating Earnings to GAAP Consolidated Statements of Operations (unaudited) Exelon Generation Twelve Months Ended December 31, 2014 Twelve Months Ended December 31, 2013 Adjusted Adjusted (in millions) GAAP(a) Adjustments Non-GAAP GAAP(a) Adjustments Non-GAAPP Operating revenues $17,393 $460(b),(c),(d) $17,853 $15,630 $547(b),(c) $16,177 Operating expenses Purchased power and fuel 9,925(251)(b),(c) 9,674 8,197 563(b),(c) 8,760 Operating and maintenance 5,566(750)(d),(e),(f),(l) 4,816 4,534(285)(d),(e),(f),(l),(m) 4,249 Depreciation, amortization, accretion and depletion 967 – 967 856(5)(d),(f) 851 Taxes other than income 465 – 465 389 – 389 Total operating expenses 16,923(1,001) 15,922 13,976 273 14,249 Equity in earnings (loss) of unconsolidated affiliates(20) 12(c),(d)(8) 10 92(c),(d) 102 Gain on sales of assets 437(411)(f) 26 13(9)(f) 4 Gain on consolidation and acquisitions of businesses 289(289)(g),(n) – – – – Operating income 1,176 773 1,949 1,677 357 2,034 Other income and (deductions) Interest expense(356) 3(b)(353)(357) 2 (d),(e),(o)(355) Other, net 406(193)(h),(i) 213 355(226)(d),(f),(h),(o) 129 Total other income and (deductions) 50(190)(140)(2)(224)(226) Income before income taxes 1,226 583 1,809 1,675 133 1,808 Income taxes 207 326(b),(c),(d),(e),(f) 533 615(3)(b),(c),(d),(e),(f) 612 (h),(i),(j),(l),(m)(h),(j),(l),(m),(o) Net Income 1,019 257 1,276 1,060 136 1,196 Net income (loss) attributable to noncontrolling interests 184(63)(k) 121(10) 4(k)(6) Net income attributable to membership interest $835 $320 $1,155 $1,070 $132 $1,202 Note: On April 1, 2014, Generation assumed operational control of Constellation Energy Nuclear Group’s (“CENG”) nuclear fleet. As a result, the 2014 financial results include CENG’s results of operations on a fully consolidated basis from April 1, 2014 through December 31, 2014. (a) Results reported in accordance with GAAP. (b) Adjustment to exclude the mark-to-market impact of Generation’s economic hedging activities. (c) Adjustment to exclude the non-cash amortization of intangible assets, net, related to commodity contracts recorded at fair value at the 2012 Constellation merger date and the 2014 CENG integration date. (d) Adjustment to exclude certain costs associated with mergers and acquisitions, including professional fees, employee-related expenses, integration activities, upfront credit facilities, merger commitments, and certain pre-acquisition contingencies, if and when applicable to the Constellation merger in 2013 and the Constellation merger, CENG integration, Integrys acquisition and pending PHI acquisition in 2014. (e) Adjustment to exclude a 2014 charge to earnings primarily related to the impairment of wind generating assets, generating assets which were held-for- sale, and certain upstream assets, and a 2013 charge to earnings primarily related to the cancellation of previously capitalized nuclear uprate projects. (f) Adjustment to exclude the impacts associated with the sales of Generation’s ownership interests in Safe Harbor Water Power Corporation and the Fore River and West Valley generating stations in 2014. (g) Adjustment to exclude difference between the fair value of assets and liabilities acquired and the purchase price of the Integrys acquisition. (h) Adjustment to exclude the unrealized gains and losses on NDT fund investments to the extent not offset by contractual accounting as described in the notes to the consolidated ?nancial statements. (i) Adjustment to reflect a benefit related to favorable settlements in 2014 of certain income tax positions on Constellation’s pre-acquisition 2009-2012 tax returns. (j) Adjustment to exclude the non-cash impact of the reassessment of state deferred income taxes, primarily as a result of changes in forecasted apportionment. (k) Adjustment to exclude adjustments for CENG interest not owned by Generation. (l) Adjustment to exclude the 2014 decrease in Generation’s nuclear decommissioning obligation and the 2013 increase in Generation’s asset retirement obligation for asbestos at retired fossil fuel plants. (m) Adjustment to re?ect estimated liabilities pursuant to the Midwest Generation bankruptcy. (n) Adjustment to exclude the gain recorded upon consolidation of CENG resulting from the difference in the fair value of CENG’s net assets and the equity method investment previously recorded on Generation’s and Exelon’s books and the settlement of pre-existing commitments between Generation and CENG. (o) Adjustment to exclude the non-cash amortization of certain debt recorded at fair value at the merger date, which was retired in the second quarter of 2013. 20
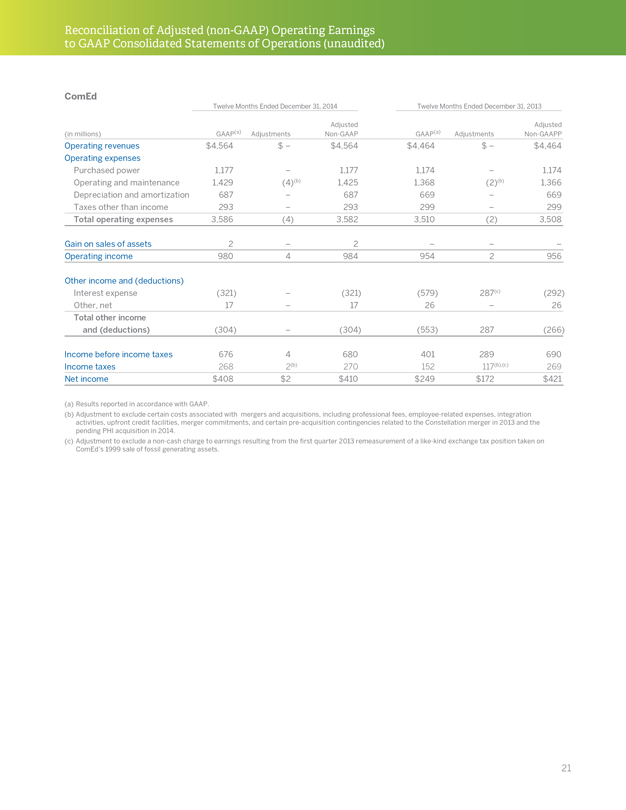
Reconciliation of Adjusted (non-GAAP) Operating Earnings to GAAP Consolidated Statements of Operations (unaudited) ComEd Twelve Months Ended December 31, 2014 Twelve Months Ended December 31, 2013 Adjusted Adjusted (in millions) GAAP(a) Adjustments Non-GAAP GAAP(a) Adjustments Non-GAAPP Operating revenues $4,564 $ – $4,564 $4,464 $ – $4,464 Operating expenses Purchased power 1,177 – 1,177 1,174 – 1,174 Operating and maintenance 1,429(4)(b) 1,425 1,368(2)(b) 1,366 Depreciation and amortization 687 – 687 669 – 669 Taxes other than income 293 – 293 299 – 299 Total operating expenses 3,586(4) 3,582 3,510(2) 3,508 Gain on sales of assets 2 – 2 – – – Operating income 980 4 984 954 2 956 Other income and (deductions) Interest expense(321) –(321)(579) 287(c)(292) Other, net 17 – 17 26 – 26 Total other income and (deductions)(304) –(304)(553) 287(266) Income before income taxes 676 4 680 401 289 690 Income taxes 268 2(b) 270 152 117(b),(c) 269 Net income $408 $2 $410 $249 $172 $421 (a) Results reported in accordance with GAAP. (b) Adjustment to exclude certain costs associated with mergers and acquisitions, including professional fees, employee-related expenses, integration activities, upfront credit facilities, merger commitments, and certain pre-acquisition contingencies related to the Constellation merger in 2013 and the pending PHI acquisition in 2014. (c) Adjustment to exclude a non-cash charge to earnings resulting from the ?rst quarter 2013 remeasurement of a like-kind exchange tax position taken on ComEd’s 1999 sale of fossil generating assets. 21
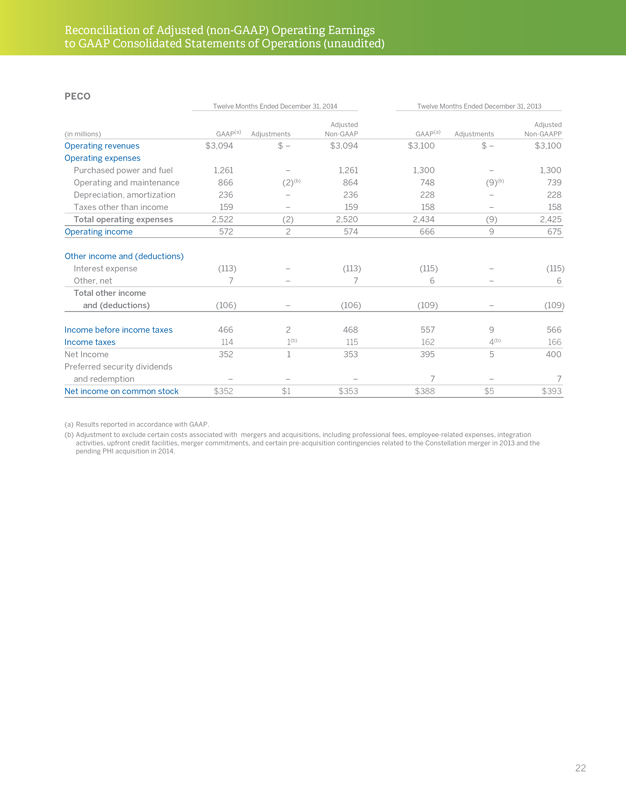
Reconciliation of Adjusted (non-GAAP) Operating Earnings to GAAP Consolidated Statements of Operations (unaudited) PECO Twelve Months Ended December 31, 2014 Twelve Months Ended December 31, 2013 Adjusted Adjusted (in millions) GAAP(a) Adjustments Non-GAAP GAAP(a) Adjustments Non-GAAPP Operating revenues $3,094 $ – $3,094 $3,100 $ – $3,100 Operating expenses Purchased power and fuel 1,261 – 1,261 1,300 – 1,300 Operating and maintenance 866(2)(b) 864 748(9)(b) 739 Depreciation, amortization 236 – 236 228 – 228 Taxes other than income 159 – 159 158 – 158 Total operating expenses 2,522(2) 2,520 2,434(9) 2,425 Operating income 572 2 574 666 9 675 Other income and (deductions) Interest expense(113) –(113)(115) –(115) Other, net 7 – 7 6 – 6 Total other income and (deductions)(106) –(106)(109) –(109) Income before income taxes 466 2 468 557 9 566 Income taxes 114 1(b) 115 162 4(b) 166 Net Income 352 1 353 395 5 400 Preferred security dividends and redemption – – – 7 – 7 Net income on common stock $352 $1 $353 $388 $5 $393 (a) Results reported in accordance with GAAP. (b) Adjustment to exclude certain costs associated with mergers and acquisitions, including professional fees, employee-related expenses, integration activities, upfront credit facilities, merger commitments, and certain pre-acquisition contingencies related to the Constellation merger in 2013 and the pending PHI acquisition in 2014. 22
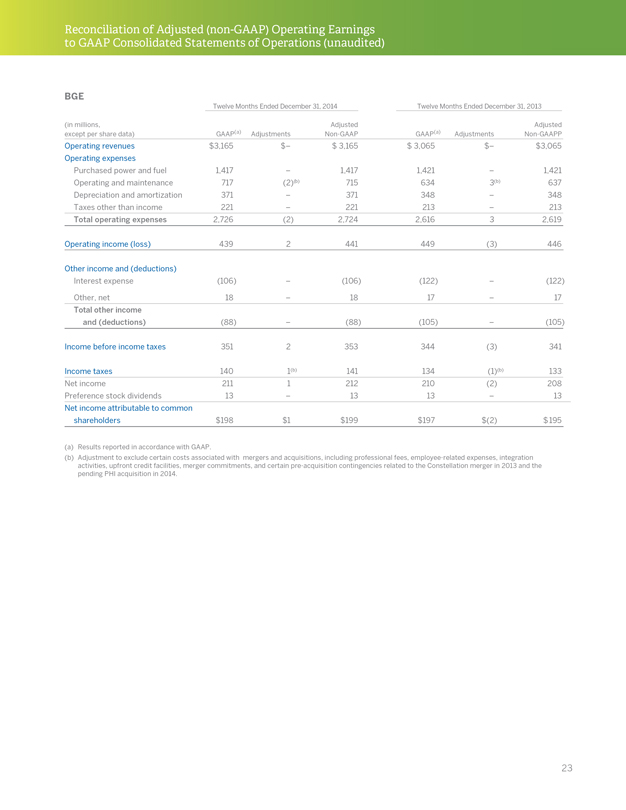
Reconciliation of Adjusted (non-GAAP) Operating Earnings to GAAP Consolidated Statements of Operations (unaudited) BGE Twelve Months Ended December 31, 2014 Twelve Months Ended December 31, 2013 (in millions, Adjusted Adjusted except per share data) GAAP(a) Adjustments Non-GAAP GAAP(a) Adjustments Non-GAAPP Operating revenues $3,165 $– $ 3,165 $ 3,065 $– $3,065 Operating expenses Purchased power and fuel 1,417 – 1,417 1,421 – 1,421 Operating and maintenance 717(2)(b) 715 634 3(b) 637 Depreciation and amortization 371 – 371 348 – 348 Taxes other than income 221 – 221 213 – 213 Total operating expenses 2,726(2) 2,724 2,616 3 2,619 Operating income (loss) 439 2 441 449(3) 446 Other income and (deductions) Interest expense(106) –(106)(122) –(122) Other, net 18 – 18 17 – 17 Total other income and (deductions)(88) –(88)(105) –(105) Income before income taxes 351 2 353 344(3) 341 Income taxes 140 1(b) 141 134(1)(b) 133 Net income 211 1 212 210(2) 208 Preference stock dividends 13 – 13 13 – 13 Net income attributable to common shareholders $198 $1 $199 $197 $(2) $ 195 (a) Results reported in accordance with GAAP. (b) Adjustment to exclude certain costs associated with mergers and acquisitions, including professional fees, employee-related expenses, integration activities, upfront credit facilities, merger commitments, and certain pre-acquisition contingencies related to the Constellation merger in 2013 and the pending PHI acquisition in 2014. 23
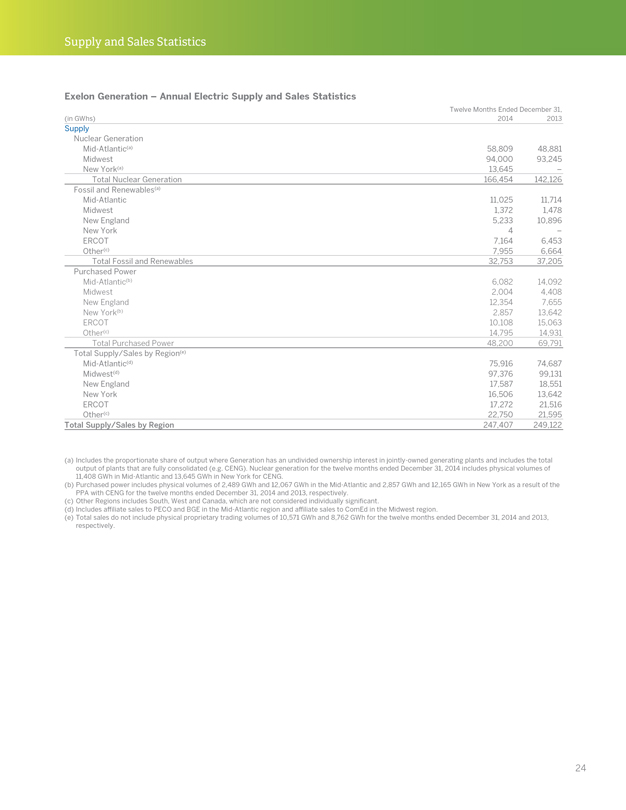
Supply and Sales Statistics Exelon Generation – Annual Electric Supply and Sales Statistics Twelve Months Ended December 31, (in GWhs) 2014 2013 Supply Nuclear Generation Mid-Atlantic(a) 58,809 48,881 Midwest 94,000 93,245 New York(a) 13,645 – Total Nuclear Generation 166,454 142,126 Fossil and Renewables(a) Mid-Atlantic 11,025 11,714 Midwest 1,372 1,478 New England 5,233 10,896 New York 4 – ERCOT 7,164 6,453 Other(c) 7,955 6,664 Total Fossil and Renewables 32,753 37,205 Purchased Power Mid-Atlantic(b) 6,082 14,092 Midwest 2,004 4,408 New England 12,354 7,655 New York(b) 2,857 13,642 ERCOT 10,108 15,063 Other(c) 14,795 14,931 Total Purchased Power 48,200 69,791 Total Supply/Sales by Region(e) Mid-Atlantic(d) 75,916 74,687 Midwest(d) 97,376 99,131 New England 17,587 18,551 New York 16,506 13,642 ERCOT 17,272 21,516 Other(c) 22,750 21,595 Total Supply/Sales by Region 247,407 249,122 (a) Includes the proportionate share of output where Generation has an undivided ownership interest in jointly-owned generating plants and includes the total output of plants that are fully consolidated (e.g. CENG). Nuclear generation for the twelve months ended December 31, 2014 includes physical volumes of 11,408 GWh in Mid-Atlantic and 13,645 GWh in New York for CENG. (b) Purchased power includes physical volumes of 2,489 GWh and 12,067 GWh in the Mid-Atlantic and 2,857 GWh and 12,165 GWh in New York as a result of the PPA with CENG for the twelve months ended December 31, 2014 and 2013, respectively. (c) Other Regions includes South, West and Canada, which are not considered individually signi?cant. (d) Includes affiliate sales to PECO and BGE in the Mid-Atlantic region and affiliate sales to ComEd in the Midwest region. (e) Total sales do not include physical proprietary trading volumes of 10,571 GWh and 8,762 GWh for the twelve months ended December 31, 2014 and 2013, respectively. 24
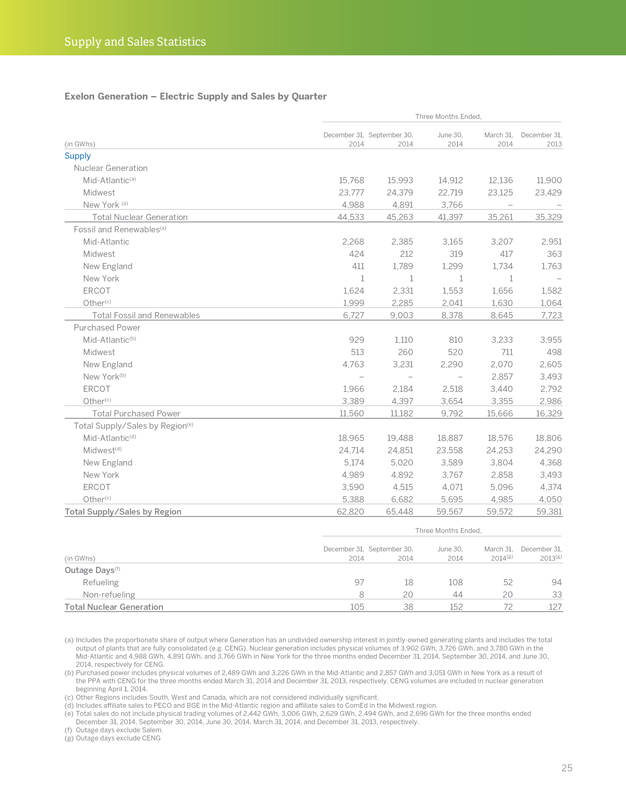
Supply and Sales Statistics Exelon Generation – Electric Supply and Sales by Quarter Three Months Ended, December 31, September 30, June 30, March 31, December 31, (in GWhs) 2014 2014 2014 2014 2013 Supply Nuclear Generation Mid-Atlantic(a) 15,768 15,993 14,912 12,136 11,900 Midwest 23,777 24,379 22,719 23,125 23,429 New York (a) 4,988 4,891 3,766 – – Total Nuclear Generation 44,533 45,263 41,397 35,261 35,329 Fossil and Renewables(a) Mid-Atlantic 2,268 2,385 3,165 3,207 2,951 Midwest 424 212 319 417 363 New England 411 1,789 1,299 1,734 1,763 New York 1 1 1 1 – ERCOT 1,624 2,331 1,553 1,656 1,582 Other(c) 1,999 2,285 2,041 1,630 1,064 Total Fossil and Renewables 6,727 9,003 8,378 8,645 7,723 Purchased Power Mid-Atlantic(b) 929 1,110 810 3,233 3,955 Midwest 513 260 520 711 498 New England 4,763 3,231 2,290 2,070 2,605 New York(b) – – – 2,857 3,493 ERCOT 1,966 2,184 2,518 3,440 2,792 Other(c) 3,389 4,397 3,654 3,355 2,986 Total Purchased Power 11,560 11,182 9,792 15,666 16,329 Total Supply/Sales by Region(e) Mid-Atlantic(d) 18,965 19,488 18,887 18,576 18,806 Midwest(d) 24,714 24,851 23,558 24,253 24,290 New England 5,174 5,020 3,589 3,804 4,368 New York 4,989 4,892 3,767 2,858 3,493 ERCOT 3,590 4,515 4,071 5,096 4,374 Other(c) 5,388 6,682 5,695 4,985 4,050 Total Supply/Sales by Region 62,820 65,448 59,567 59,572 59,381 Three Months Ended, December 31, September 30, June 30, March 31, December 31, (in GWhs) 2014 2014 2014 2014(g) 2013(g) Outage Days(f) Refueling 97 18 108 52 94 Non-refueling 8 20 44 20 33 Total Nuclear Generation 105 38 152 72 127 (a) Includes the proportionate share of output where Generation has an undivided ownership interest in jointly-owned generating plants and includes the total output of plants that are fully consolidated (e.g. CENG). Nuclear generation includes physical volumes of 3,902 GWh, 3,726 GWh, and 3,780 GWh in the Mid-Atlantic and 4,988 GWh, 4,891 GWh, and 3,766 GWh in New York for the three months ended December 31, 2014, September 30, 2014, and June 30, 2014, respectively for CENG. (b) Purchased power includes physical volumes of 2,489 GWh and 3,226 GWh in the Mid-Atlantic and 2,857 GWh and 3,051 GWh in New York as a result of the PPA with CENG for the three months ended March 31, 2014 and December 31, 2013, respectively. CENG volumes are included in nuclear generation beginning April 1, 2014. (c) Other Regions includes South, West and Canada, which are not considered individually signi?cant. (d) Includes affiliate sales to PECO and BGE in the Mid-Atlantic region and affiliate sales to ComEd in the Midwest region. (e) Total sales do not include physical trading volumes of 2,442 GWh, 3,006 GWh, 2,629 GWh, 2,494 GWh, and 2,696 GWh for the three months ended December 31, 2014, September 30, 2014, June 30, 2014, March 31, 2014, and December 31, 2013, respectively. (f) Outage days exclude Salem. (g) Outage days exclude CENG 25
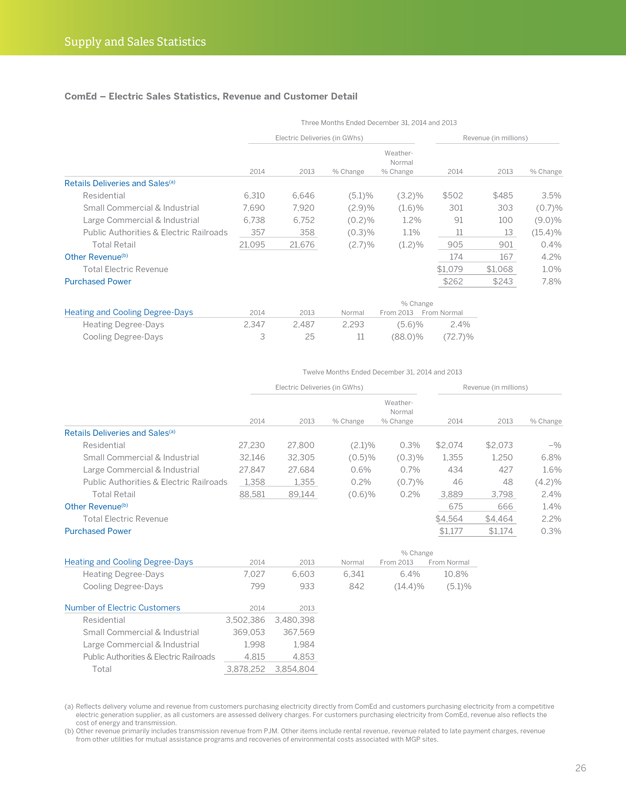
Supply and Sales Statistics ComEd – Electric Sales Statistics, Revenue and Customer Detail Three Months Ended December 31, 2014 and 2013 Electric Deliveries (in GWhs) Revenue (in millions) Weather- Normal 2014 2013% Change% Change 2014 2013% Change Retails Deliveries and Sales(a) Residential 6,310 6,646(5.1)%(3.2)% $502 $485 3.5% Small Commercial & Industrial 7,690 7,920(2.9)%(1.6)% 301 303(0.7)% Large Commercial & Industrial 6,738 6,752(0.2)% 1.2% 91 100(9.0)% Public Authorities & Electric Railroads 357 358(0.3)% 1.1% 11 13(15.4)% Total Retail 21,095 21,676(2.7)%(1.2)% 905 901 0.4% Other Revenue(b) 174 167 4.2% Total Electric Revenue $1,079 $1,068 1.0% Purchased Power $262 $243 7.8% % Change Heating and Cooling Degree-Days 2014 2013 Normal From 2013 From Normal Heating Degree-Days 2,347 2,487 2,293(5.6)% 2.4% Cooling Degree-Days 3 25 11(88.0)%(72.7)% Twelve Months Ended December 31, 2014 and 2013 Electric Deliveries (in GWhs) Revenue (in millions) Weather- Normal 2014 2013% Change% Change 2014 2013% Change Retails Deliveries and Sales(a) Residential 27,230 27,800(2.1)% 0.3% $2,074 $2,073 –% Small Commercial & Industrial 32,146 32,305(0.5)%(0.3)% 1,355 1,250 6.8% Large Commercial & Industrial 27,847 27,684 0.6% 0.7% 434 427 1.6% Public Authorities & Electric Railroads 1,358 1,355 0.2%(0.7)% 46 48(4.2)% Total Retail 88,581 89,144(0.6)% 0.2% 3,889 3,798 2.4% Other Revenue(b) 675 666 1.4% Total Electric Revenue $4,564 $4,464 2.2% Purchased Power $1,177 $1,174 0.3% % Change Heating and Cooling Degree-Days 2014 2013 Normal From 2013 From Normal Heating Degree-Days 7,027 6,603 6,341 6.4% 10.8% Cooling Degree-Days 799 933 842(14.4)%(5.1)% Number of Electric Customers 2014 2013 Residential 3,502,386 3,480,398 Small Commercial & Industrial 369,053 367,569 Large Commercial & Industrial 1,998 1,984 Public Authorities & Electric Railroads 4,815 4,853 Total 3,878,252 3,854,804 (a) Re?ects delivery volume and revenue from customers purchasing electricity directly from ComEd and customers purchasing electricity from a competitive electric generation supplier, as all customers are assessed delivery charges. For customers purchasing electricity from ComEd, revenue also re?ects the cost of energy and transmission. (b) Other revenue primarily includes transmission revenue from PJM. Other items include rental revenue, revenue related to late payment charges, revenue from other utilities for mutual assistance programs and recoveries of environmental costs associated with MGP sites. 26
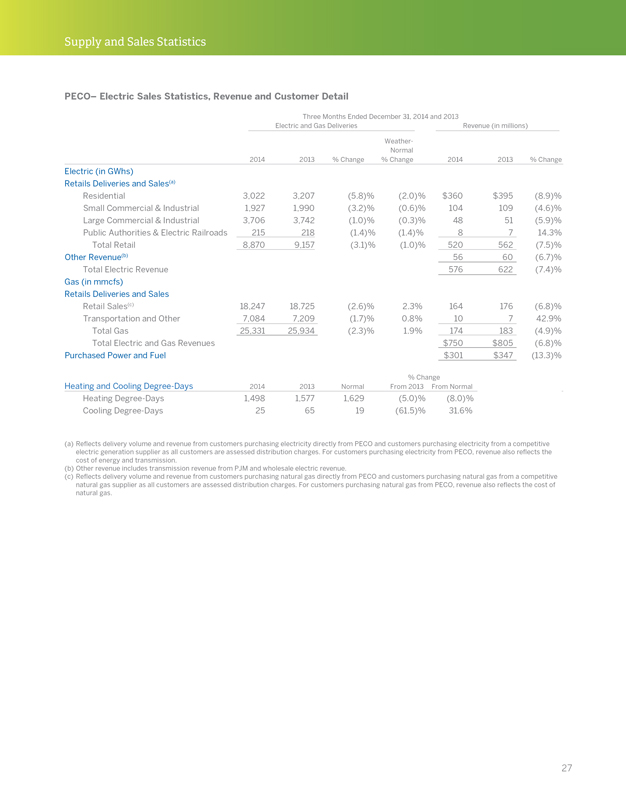
Supply and Sales Statistics PECO– Electric Sales Statistics, Revenue and Customer Detail Three Months Ended December 31, 2014 and 2013 Electric and Gas Deliveries Revenue (in millions) Weather- Normal 2014 2013% Change% Change 2014 2013% Change Electric (in GWhs) Retails Deliveries and Sales(a) Residential 3,022 3,207(5.8)%(2.0)% $360 $395(8.9)% Small Commercial & Industrial 1,927 1,990(3.2)%(0.6)% 104 109(4.6)% Large Commercial & Industrial 3,706 3,742(1.0)%(0.3)% 48 51(5.9)% Public Authorities & Electric Railroads 215 218(1.4)%(1.4)% 8 7 14.3% Total Retail 8,870 9,157(3.1)%(1.0)% 520 562(7.5)% Other Revenue(b) 56 60(6.7)% Total Electric Revenue 576 622(7.4)% Gas (in mmcfs) Retails Deliveries and Sales Retail Sales(c) 18,247 18,725(2.6)% 2.3% 164 176(6.8)% Transportation and Other 7,084 7,209(1.7)% 0.8% 10 7 42.9% Total Gas 25,331 25,934(2.3)% 1.9% 174 183(4.9)% Total Electric and Gas Revenues $750 $ 805(6.8)% Purchased Power and Fuel $301 $347(13.3)% % Change Heating and Cooling Degree-Days 2014 2013 Normal From 2013 From Normal Heating Degree-Days 1,498 1,577 1,629(5.0)%(8.0)% Cooling Degree-Days 25 65 19(61.5)% 31.6% (a) Re?ects delivery volume and revenue from customers purchasing electricity directly from PECO and customers purchasing electricity from a competitive electric generation supplier as all customers are assessed distribution charges. For customers purchasing electricity from PECO, revenue also re?ects the cost of energy and transmission. (b) Other revenue includes transmission revenue from PJM and wholesale electric revenue. (c) Re?ects delivery volume and revenue from customers purchasing natural gas directly from PECO and customers purchasing natural gas from a competitive natural gas supplier as all customers are assessed distribution charges. For customers purchasing natural gas from PECO, revenue also re?ects the cost of natural gas. 27
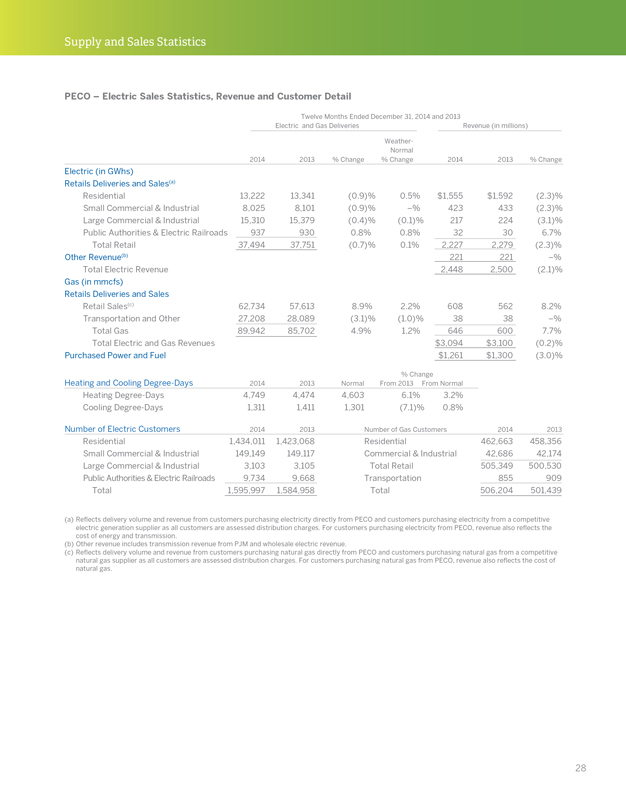
Supply and Sales Statistics PECO – Electric Sales Statistics, Revenue and Customer Detail Twelve Months Ended December 31, 2014 and 2013 Electric and Gas Deliveries Revenue (in millions) Weather- Normal 2014 2013% Change% Change 2014 2013% Change Electric (in GWhs) Retails Deliveries and Sales(a) Residential 13,222 13,341(0.9)% 0.5% $1,555 $1,592(2.3)% Small Commercial & Industrial 8,025 8,101(0.9)% –% 423 433(2.3)% Large Commercial & Industrial 15,310 15,379(0.4)%(0.1)% 217 224(3.1)% Public Authorities & Electric Railroads 937 930 0.8% 0.8% 32 30 6.7% Total Retail 37,494 37,751(0.7)% 0.1% 2,227 2,279(2.3)% Other Revenue(b) 221 221 –% Total Electric Revenue 2,448 2,500(2.1)% Gas (in mmcfs) Retails Deliveries and Sales Retail Sales(c) 62,734 57,613 8.9% 2.2% 608 562 8.2% Transportation and Other 27,208 28,089(3.1)%(1.0)% 38 38 –% Total Gas 89,942 85,702 4.9% 1.2% 646 600 7.7% Total Electric and Gas Revenues $3,094 $3,100(0.2)% Purchased Power and Fuel $1,261 $1,300(3.0)% % Change Heating and Cooling Degree-Days 2014 2013 Normal From 2013 From Normal Heating Degree-Days 4,749 4,474 4,603 6.1% 3.2% Cooling Degree-Days 1,311 1,411 1,301(7.1)% 0.8% Number of Electric Customers 2014 2013 Number of Gas Customers 2014 2013 Residential 1,434,011 1,423,068 Residential 462,663 458,356 Small Commercial & Industrial 149,149 149,117 Commercial & Industrial 42,686 42,174 Large Commercial & Industrial 3,103 3,105 Total Retail 505,349 500,530 Public Authorities & Electric Railroads 9,734 9,668 Transportation 855 909 Total 1,595,997 1,584,958 Total 506,204 501,439 (a) Re?ects delivery volume and revenue from customers purchasing electricity directly from PECO and customers purchasing electricity from a competitive electric generation supplier as all customers are assessed distribution charges. For customers purchasing electricity from PECO, revenue also re?ects the cost of energy and transmission. (b) Other revenue includes transmission revenue from PJM and wholesale electric revenue. (c) Re?ects delivery volume and revenue from customers purchasing natural gas directly from PECO and customers purchasing natural gas from a competitive natural gas supplier as all customers are assessed distribution charges. For customers purchasing natural gas from PECO, revenue also re?ects the cost of natural gas. 28
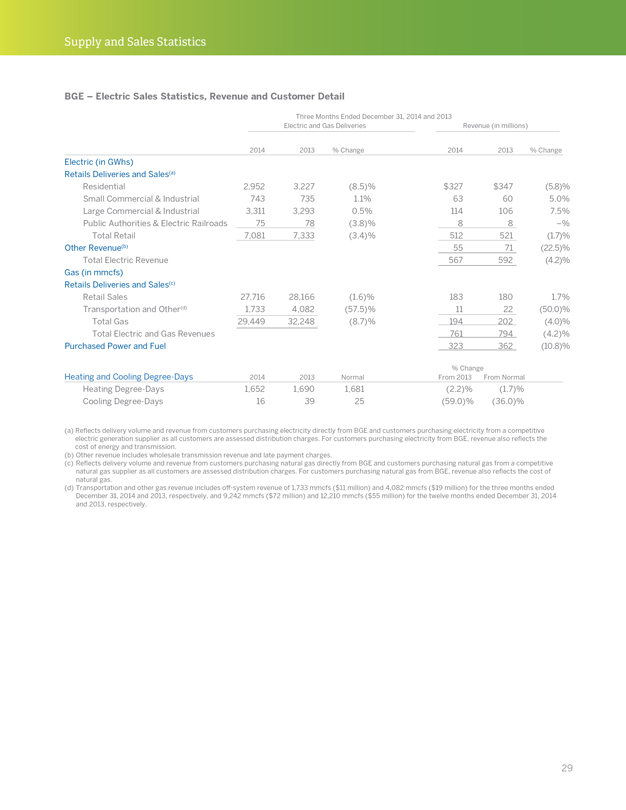
Supply and Sales Statistics BGE – Electric Sales Statistics, Revenue and Customer Detail Three Months Ended December 31, 2014 and 2013 Electric and Gas Deliveries Revenue (in millions) 2014 2013% Change 2014 2013% Change Electric (in GWhs) Retails Deliveries and Sales(a) Residential 2,952 3,227(8.5)% $327 $347(5.8)% Small Commercial & Industrial 743 735 1.1% 63 60 5.0% Large Commercial & Industrial 3,311 3,293 0.5% 114 106 7.5% Public Authorities & Electric Railroads 75 78(3.8)% 8 8 –% Total Retail 7,081 7,333(3.4)% 512 521(1.7)% Other Revenue(b) 55 71(22.5)% Total Electric Revenue 567 592(4.2)% Gas (in mmcfs) Retails Deliveries and Sales(c) Retail Sales 27,716 28,166(1.6)% 183 180 1.7% Transportation and Other(d) 1,733 4,082(57.5)% 11 22(50.0)% Total Gas 29,449 32,248(8.7)% 194 202(4.0)% Total Electric and Gas Revenues 761 794(4.2)% Purchased Power and Fuel 323 362(10.8)% % Change Heating and Cooling Degree-Days 2014 2013 Normal From 2013 From Normal Heating Degree-Days 1,652 1,690 1,681(2.2)%(1.7)% Cooling Degree-Days 16 39 25(59.0)%(36.0)% (a) Re?ects delivery volume and revenue from customers purchasing electricity directly from BGE and customers purchasing electricity from a competitive electric generation supplier as all customers are assessed distribution charges. For customers purchasing electricity from BGE, revenue also re?ects the cost of energy and transmission. (b) Other revenue includes wholesale transmission revenue and late payment charges. (c) Re?ects delivery volume and revenue from customers purchasing natural gas directly from BGE and customers purchasing natural gas from a competitive natural gas supplier as all customers are assessed distribution charges. For customers purchasing natural gas from BGE, revenue also re?ects the cost of natural gas. (d) Transportation and other gas revenue includes off-system revenue of 1,733 mmcfs ($11 million) and 4,082 mmcfs ($19 million) for the three months ended December 31, 2014 and 2013, respectively, and 9,242 mmcfs ($72 million) and 12,210 mmcfs ($55 million) for the twelve months ended December 31, 2014 and 2013, respectively. 29
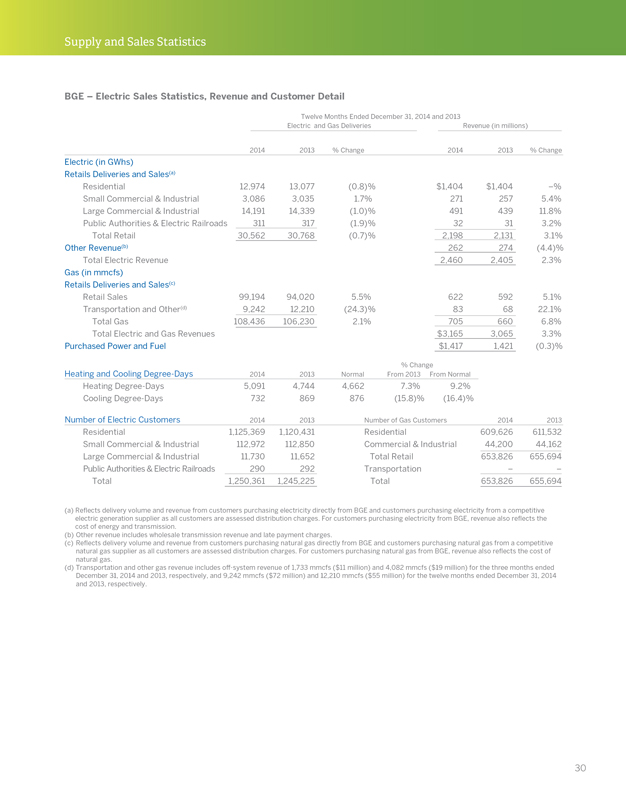
Supply and Sales Statistics BGE – Electric Sales Statistics, Revenue and Customer Detail Twelve Months Ended December 31, 2014 and 2013 Electric and Gas Deliveries Revenue (in millions) 2014 2013% Change 2014 2013% Change Electric (in GWhs) Retails Deliveries and Sales(a) Residential 12,974 13,077(0.8)% $1,404 $1,404 –% Small Commercial & Industrial 3,086 3,035 1.7% 271 257 5.4% Large Commercial & Industrial 14,191 14,339(1.0)% 491 439 11.8% Public Authorities & Electric Railroads 311 317(1.9)% 32 31 3.2% Total Retail 30,562 30,768(0.7)% 2,198 2,131 3.1% Other Revenue(b) 262 274(4.4)% Total Electric Revenue 2,460 2,405 2.3% Gas (in mmcfs) Retails Deliveries and Sales(c) Retail Sales 99,194 94,020 5.5% 622 592 5.1% Transportation and Other(d) 9,242 12,210(24.3)% 83 68 22.1% Total Gas 108,436 106,230 2.1% 705 660 6.8% Total Electric and Gas Revenues $3,165 3,065 3.3% Purchased Power and Fuel $1,417 1,421(0.3)% % Change Heating and Cooling Degree-Days 2014 2013 Normal From 2013 From Normal Heating Degree-Days 5,091 4,744 4,662 7.3% 9.2% Cooling Degree-Days 732 869 876(15.8)%(16.4)% Number of Electric Customers 2014 2013 Number of Gas Customers 2014 2013 Residential 1,125,369 1,120,431 Residential 609,626 611,532 Small Commercial & Industrial 112,972 112,850 Commercial & Industrial 44,200 44,162 Large Commercial & Industrial 11,730 11,652 Total Retail 653,826 655,694 Public Authorities & Electric Railroads 290 292 Transportation – – Total 1,250,361 1,245,225 Total 653,826 655,694 (a) Re?ects delivery volume and revenue from customers purchasing electricity directly from BGE and customers purchasing electricity from a competitive electric generation supplier as all customers are assessed distribution charges. For customers purchasing electricity from BGE, revenue also re?ects the cost of energy and transmission. (b) Other revenue includes wholesale transmission revenue and late payment charges. (c) Re?ects delivery volume and revenue from customers purchasing natural gas directly from BGE and customers purchasing natural gas from a competitive natural gas supplier as all customers are assessed distribution charges. For customers purchasing natural gas from BGE, revenue also re?ects the cost of natural gas. (d) Transportation and other gas revenue includes off-system revenue of 1,733 mmcfs ($11 million) and 4,082 mmcfs ($19 million) for the three months ended December 31, 2014 and 2013, respectively, and 9,242 mmcfs ($72 million) and 12,210 mmcfs ($55 million) for the twelve months ended December 31, 2014 and 2013, respectively. 30
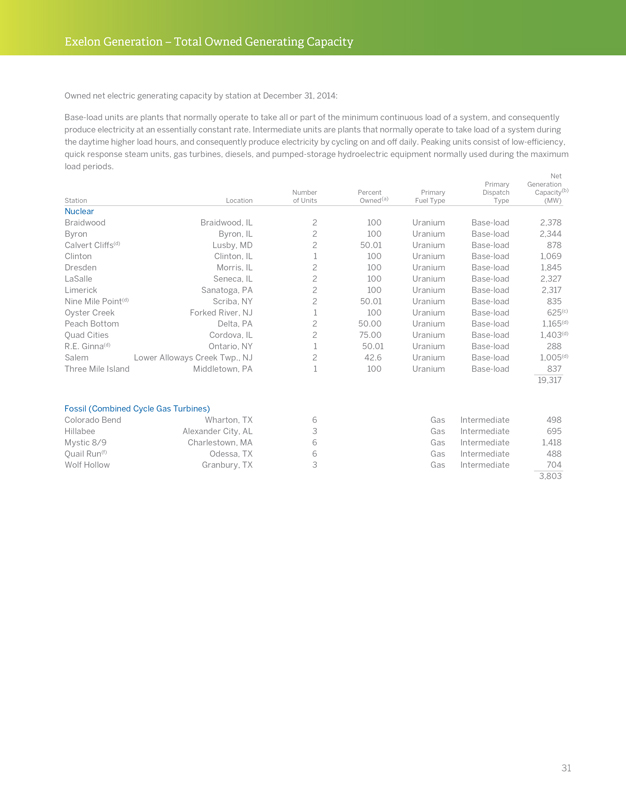
Exelon Generation – Total Owned Generating Capacity Owned net electric generating capacity by station at December 31, 2014: Base-load units are plants that normally operate to take all or part of the minimum continuous load of a system, and consequently produce electricity at an essentially constant rate. Intermediate units are plants that normally operate to take load of a system during the daytime higher load hours, and consequently produce electricity by cycling on and off daily. Peaking units consist of low-efficiency, quick response steam units, gas turbines, diesels, and pumped-storage hydroelectric equipment normally used during the maximum load periods. Net Primary Generation Number Percent Primary Dispatch Capacity(b) Station Location of Units Owned(a) Fuel Type Type(MW) Nuclear Braidwood Braidwood, IL 2 100 Uranium Base-load 2,378 Byron Byron, IL 2 100 Uranium Base-load 2,344 Calvert Cliffs(d) Lusby, MD 2 50.01 Uranium Base-load 878 Clinton Clinton, IL 1 100 Uranium Base-load 1,069 Dresden Morris, IL 2 100 Uranium Base-load 1,845 LaSalle Seneca, IL 2 100 Uranium Base-load 2,327 Limerick Sanatoga, PA 2 100 Uranium Base-load 2,317 Nine Mile Point(d) Scriba, NY 2 50.01 Uranium Base-load 835 Oyster Creek Forked River, NJ 1 100 Uranium Base-load 625(c) Peach Bottom Delta, PA 2 50.00 Uranium Base-load 1,165(d) Quad Cities Cordova, IL 2 75.00 Uranium Base-load 1,403(d) R.E. Ginna(d) Ontario, NY 1 50.01 Uranium Base-load 288 Salem Lower Alloways Creek Twp., NJ 2 42.6 Uranium Base-load 1,005(d) Three Mile Island Middletown, PA 1 100 Uranium Base-load 837 19,317 Fossil (Combined Cycle Gas Turbines) Colorado Bend Wharton, TX 6 Gas Intermediate 498 Hillabee Alexander City, AL 3 Gas Intermediate 695 Mystic 8/9 Charlestown, MA 6 Gas Intermediate 1,418 Quail Run(f) Odessa, TX 6 Gas Intermediate 488 Wolf Hollow Granbury, TX 3 Gas Intermediate 704 3,803 31
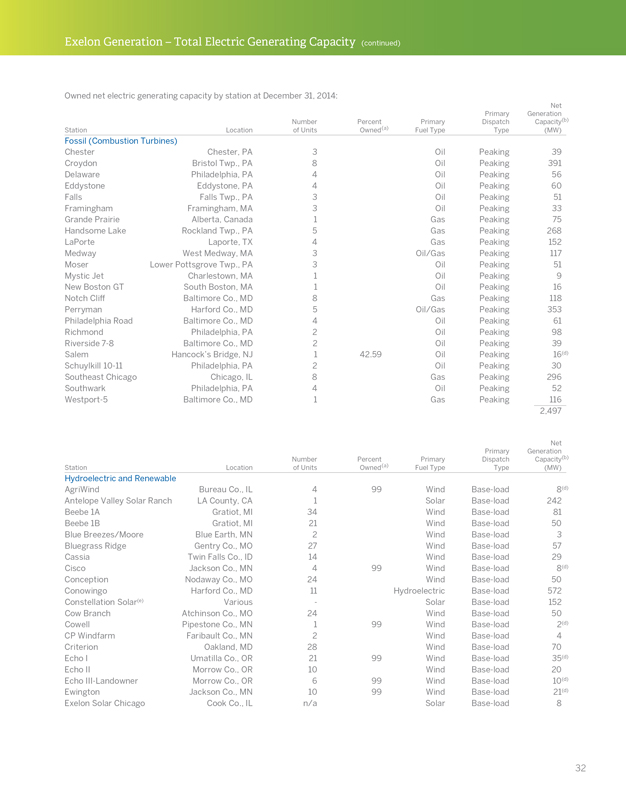
Exelon Generation – Total Electric Generating Capacity (continued) Owned net electric generating capacity by station at December 31, 2014: Net Primary Generation Number Percent Primary Dispatch Capacity(b) Station Location of Units Owned(a) Fuel Type Type(MW) Fossil (Combustion Turbines) Chester Chester, PA 3 Oil Peaking 39 Croydon Bristol Twp., PA 8 Oil Peaking 391 Delaware Philadelphia, PA 4 Oil Peaking 56 Eddystone Eddystone, PA 4 Oil Peaking 60 Falls Falls Twp., PA 3 Oil Peaking 51 Framingham Framingham, MA 3 Oil Peaking 33 Grande Prairie Alberta, Canada 1 Gas Peaking 75 Handsome Lake Rockland Twp., PA 5 Gas Peaking 268 LaPorte Laporte, TX 4 Gas Peaking 152 Medway West Medway, MA 3 Oil/Gas Peaking 117 Moser Lower Pottsgrove Twp., PA 3 Oil Peaking 51 Mystic Jet Charlestown, MA 1 Oil Peaking 9 New Boston GT South Boston, MA 1 Oil Peaking 16 Notch Cliff Baltimore Co., MD 8 Gas Peaking 118 Perryman Harford Co., MD 5 Oil/Gas Peaking 353 Philadelphia Road Baltimore Co., MD 4 Oil Peaking 61 Richmond Philadelphia, PA 2 Oil Peaking 98 Riverside 7-8 Baltimore Co., MD 2 Oil Peaking 39 Salem Hancock’s Bridge, NJ 1 42.59 Oil Peaking 16(d) Schuylkill 10-11 Philadelphia, PA 2 Oil Peaking 30 Southeast Chicago Chicago, IL 8 Gas Peaking 296 Southwark Philadelphia, PA 4 Oil Peaking 52 Westport-5 Baltimore Co., MD 1 Gas Peaking 116 2,497 Net Primary Generation Number Percent Primary Dispatch Capacity(b) Station Location of Units Owned(a) Fuel Type Type(MW) Hydroelectric and Renewable AgriWind Bureau Co., IL 4 99 Wind Base-load 8(d) Antelope Valley Solar Ranch LA County, CA 1 Solar Base-load 242 Beebe 1A Gratiot, MI 34 Wind Base-load 81 Beebe 1B Gratiot, MI 21 Wind Base-load 50 Blue Breezes/Moore Blue Earth, MN 2 Wind Base-load 3 Bluegrass Ridge Gentry Co., MO 27 Wind Base-load 57 Cassia Twin Falls Co., ID 14 Wind Base-load 29 Cisco Jackson Co., MN 4 99 Wind Base-load 8(d) Conception Nodaway Co., MO 24 Wind Base-load 50 Conowingo Harford Co., MD 11 Hydroelectric Base-load 572 Constellation Solar(e) Various—Solar Base-load 152 Cow Branch Atchinson Co., MO 24 Wind Base-load 50 Cowell Pipestone Co., MN 1 99 Wind Base-load 2(d) CP Windfarm Faribault Co., MN 2 Wind Base-load 4 Criterion Oakland, MD 28 Wind Base-load 70 Echo I Umatilla Co., OR 21 99 Wind Base-load 35(d) Echo II Morrow Co., OR 10 Wind Base-load 20 Echo III-Landowner Morrow Co., OR 6 99 Wind Base-load 10(d) Ewington Jackson Co., MN 10 99 Wind Base-load 21(d) Exelon Solar Chicago Cook Co., IL n/a Solar Base-load 8 32
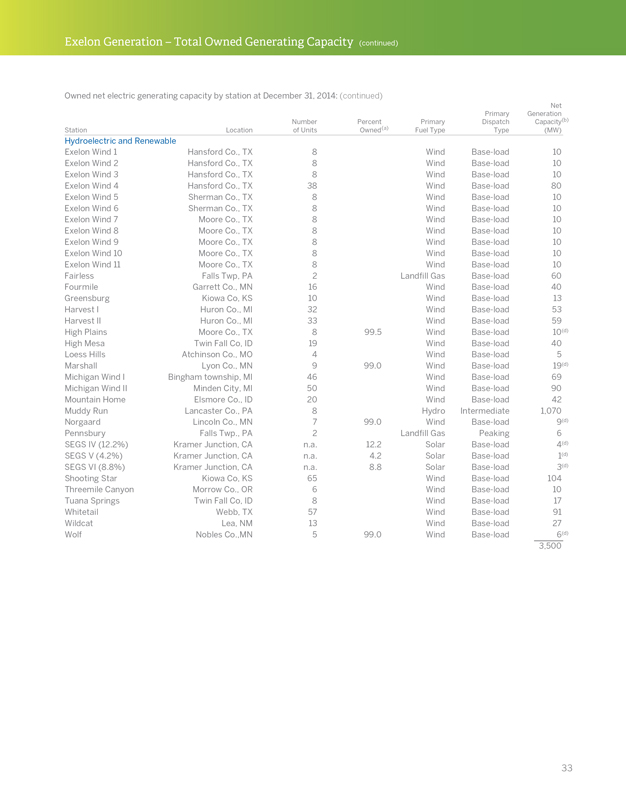
Exelon Generation – Total Owned Generating Capacity (continued) Owned net electric generating capacity by station at December 31, 2014: (continued) Net Primary Generation Number Percent Primary Dispatch Capacity(b) Station Location of Units Owned(a) Fuel Type Type(MW) Hydroelectric and Renewable Exelon Wind 1 Hansford Co., TX 8 Wind Base-load 10 Exelon Wind 2 Hansford Co., TX 8 Wind Base-load 10 Exelon Wind 3 Hansford Co., TX 8 Wind Base-load 10 Exelon Wind 4 Hansford Co., TX 38 Wind Base-load 80 Exelon Wind 5 Sherman Co., TX 8 Wind Base-load 10 Exelon Wind 6 Sherman Co., TX 8 Wind Base-load 10 Exelon Wind 7 Moore Co., TX 8 Wind Base-load 10 Exelon Wind 8 Moore Co., TX 8 Wind Base-load 10 Exelon Wind 9 Moore Co., TX 8 Wind Base-load 10 Exelon Wind 10 Moore Co., TX 8 Wind Base-load 10 Exelon Wind 11 Moore Co., TX 8 Wind Base-load 10 Fairless Falls Twp, PA 2 Land?ll Gas Base-load 60 Fourmile Garrett Co., MN 16 Wind Base-load 40 Greensburg Kiowa Co, KS 10 Wind Base-load 13 Harvest I Huron Co., MI 32 Wind Base-load 53 Harvest II Huron Co., MI 33 Wind Base-load 59 High Plains Moore Co., TX 8 99.5 Wind Base-load 10(d) High Mesa Twin Fall Co, ID 19 Wind Base-load 40 Loess Hills Atchinson Co., MO 4 Wind Base-load 5 Marshall Lyon Co., MN 9 99.0 Wind Base-load 19(d) Michigan Wind I Bingham township, MI 46 Wind Base-load 69 Michigan Wind II Minden City, MI 50 Wind Base-load 90 Mountain Home Elsmore Co., ID 20 Wind Base-load 42 Muddy Run Lancaster Co., PA 8 Hydro Intermediate 1,070 Norgaard Lincoln Co., MN 7 99.0 Wind Base-load 9(d) Pennsbury Falls Twp., PA 2 Land?ll Gas Peaking 6 SEGS IV (12.2%) Kramer Junction, CA n.a. 12.2 Solar Base-load 4(d) SEGS V (4.2%) Kramer Junction, CA n.a. 4.2 Solar Base-load 1(d) SEGS VI (8.8%) Kramer Junction, CA n.a. 8.8 Solar Base-load 3(d) Shooting Star Kiowa Co, KS 65 Wind Base-load 104 Threemile Canyon Morrow Co., OR 6 Wind Base-load 10 Tuana Springs Twin Fall Co, ID 8 Wind Base-load 17 Whitetail Webb, TX 57 Wind Base-load 91 Wildcat Lea, NM 13 Wind Base-load 27 Wolf Nobles Co.,MN 5 99.0 Wind Base-load 6(d) 3,500 33
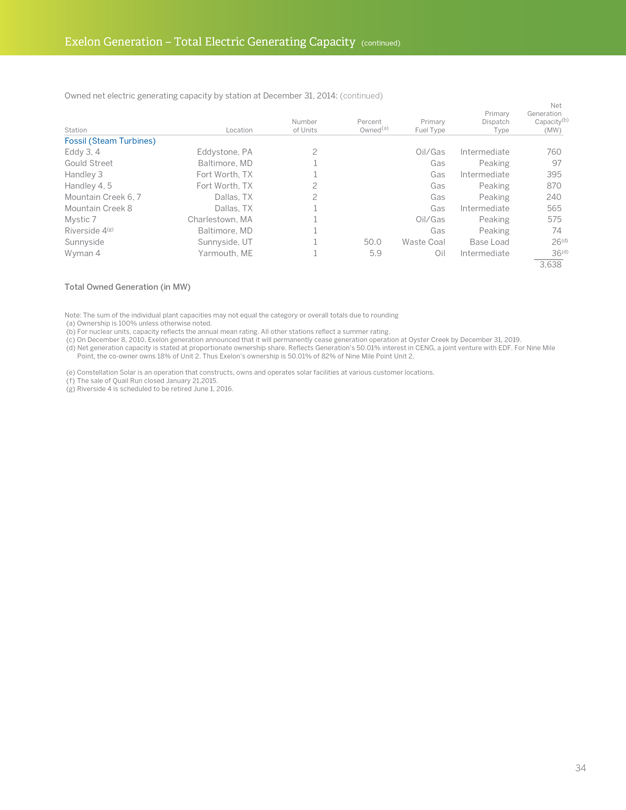
Exelon Generation – Total Electric Generating Capacity (continued) Owned net electric generating capacity by station at December 31, 2014: (continued) Net Primary Generation Number Percent Primary Dispatch Capacity(b) Station Location of Units Owned(a) Fuel Type Type(MW) Fossil (Steam Turbines) Eddy 3, 4 Eddystone, PA 2 Oil/Gas Intermediate 760 Gould Street Baltimore, MD 1 Gas Peaking 97 Handley 3 Fort Worth, TX 1 Gas Intermediate 395 Handley 4, 5 Fort Worth, TX 2 Gas Peaking 870 Mountain Creek 6, 7 Dallas, TX 2 Gas Peaking 240 Mountain Creek 8 Dallas, TX 1 Gas Intermediate 565 Mystic 7 Charlestown, MA 1 Oil/Gas Peaking 575 Riverside 4(g) Baltimore, MD 1 Gas Peaking 74 Sunnyside Sunnyside, UT 1 50.0 Waste Coal Base Load 26(d) Wyman 4 Yarmouth, ME 1 5.9 Oil Intermediate 36(d) 3,638 Total Owned Generation (in MW) Note: The sum of the individual plant capacities may not equal the category or overall totals due to rounding (a) Ownership is 100% unless otherwise noted. (b) For nuclear units, capacity re?ects the annual mean rating. All other stations re?ect a summer rating. (c) On December 8, 2010, Exelon generation announced that it will permanently cease generation operation at Oyster Creek by December 31, 2019. (d) Net generation capacity is stated at proportionate ownership share. Reflects Generation’s 50.01% interest in CENG, a joint venture with EDF. For Nine Mile Point, the co-owner owns 18% of Unit 2. Thus Exelon’s ownership is 50.01% of 82% of Nine Mile Point Unit 2. (e) Constellation Solar is an operation that constructs, owns and operates solar facilities at various customer locations. (f) The sale of Quail Run closed January 21,2015. (g) Riverside 4 is scheduled to be retired June 1, 2016. 34
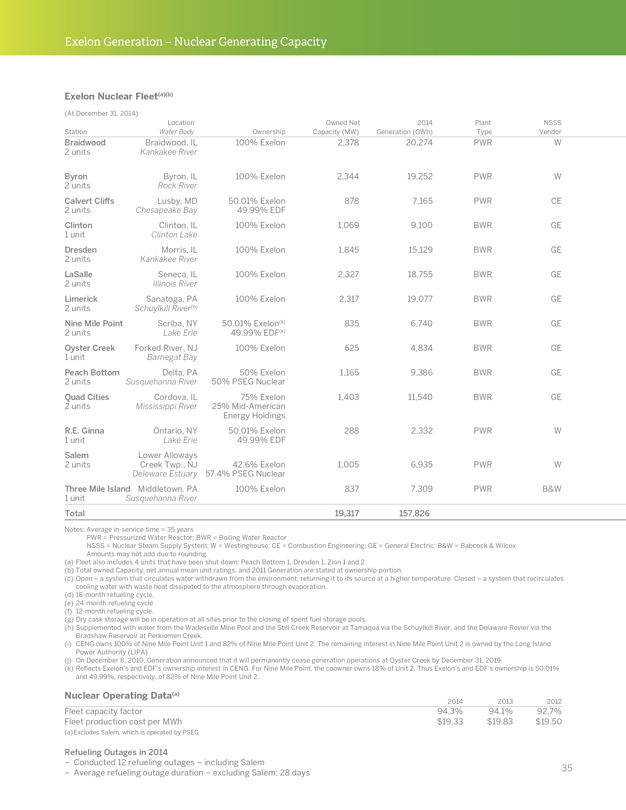
Exelon Generation – Nuclear Generating Capacity Exelon Nuclear Fleet(a)(b) (At December 31, 2014) Location Owned Net 2014 Plant NSSS Station Water Body Ownership Capacity (MW) Generation (GWh) Type Vendor Braidwood Braidwood, IL 100% Exelon 2,378 20,274 PWR W 2 units Kankakee River Byron Byron, IL 100% Exelon 2,344 19,252 PWR W 2 units Rock River Calvert Cliffs Lusby, MD 50.01% Exelon 878 7,165 PWR CE 2 units Chesapeake Bay 49.99% EDF Clinton Clinton, IL 100% Exelon 1,069 9,100 BWR GE 1 unit Clinton Lake Dresden Morris, IL 100% Exelon 1,845 15,129 BWR GE 2 units Kankakee River LaSalle Seneca, IL 100% Exelon 2,327 18,755 BWR GE 2 units Illinois River Limerick Sanatoga, PA 100% Exelon 2,317 19,077 BWR GE 2 units Schuylkill River(h) Nine Mile Point Scriba, NY 50.01% Exelon(k) 835 6,740 BWR GE 2 units Lake Erie 49.99% EDF(k) Oyster Creek Forked River, NJ 100% Exelon 625 4,834 BWR GE 1 unit Barnegat Bay Peach Bottom Delta, PA 50% Exelon 1,165 9,386 BWR GE 2 units Susquehanna River 50% PSEG Nuclear Quad Cities Cordova, IL 75% Exelon 1,403 11,540 BWR GE 2 units Mississippi River 25% Mid-American Energy Holdings R.E. Ginna Ontario, NY 50.01% Exelon 288 2,332 PWR W 1 unit Lake Erie 49.99% EDF Salem Lower Alloways 2 units Creek Twp., NJ 42.6% Exelon 1,005 6,935 PWR W Deleware Estuary 57.4% PSEG Nuclear Three Mile Island Middletown, PA 100% Exelon 837 7,309 PWR B&W 1 unit Susquehanna River Total 19,317 157,826 Notes: Average in-service time = 35 years PWR = Pressurized Water Reactor; BWR = Boiling Water Reactor NSSS = Nuclear Steam Supply System; W = Westinghouse; CE = Combustion Engineering; GE = General Electric; B&W = Babcock & Wilcox Amounts may not add due to rounding (a) Fleet also includes 4 units that have been shut down: Peach Bottom 1, Dresden 1, Zion 1 and 2 (b) Total owned Capacity, net annual mean unit ratings, and 2011 Generation are stated at ownership portion. (c) Open – a system that circulates water withdrawn from the environment, returning it to its source at a higher temperature. Closed – a system that recirculates cooling water with waste heat dissipated to the atmosphere through evaporation. (d) 18-month refueling cycle. (e) 24-month refueling cycle (f) 12-month refueling cycle. (g) Dry cask storage will be in operation at all sites prior to the closing of spent fuel storage pools. (h) Supplemented with water from the Wadesville Mine Pool and the Still Creek Reservoir at Tamaqua via the Schuylkill River, and the Delaware Revier via the Bradshaw Reservoir at Perkiomen Creek. (i) CENG owns 100% of Nine Mile Point Unit 1 and 82% of Nine Mile Point Unit 2. The remaining interest in Nine Mile Point Unit 2 is owned by the Long Island Power Authority (LIPA) (j) On December 8, 2010, Generation announced that it will permanently cease generation operations at Oyster Creek by December 31, 2019. (k) Reflects Exelon’s and EDF’s ownership interest in CENG. For Nine Mile Point, the coowner owns 18% of Unit 2. Thus Exelon’s and EDF’s ownership is 50.01% and 49.99%, respectively, of 82% of Nine Mile Point Unit 2. Nuclear Operating Data(a) 2014 2013 2012 Fleet capacity factor 94.3% 94.1% 92.7% Fleet production cost per MWh $19.33 $19.83 $19.50 (a) Excludes Salem, which is operated by PSEG. Refueling Outages in 2014 – Conducted 12 refueling outages – including Salem – Average refueling outage duration – excluding Salem: 28 days 35
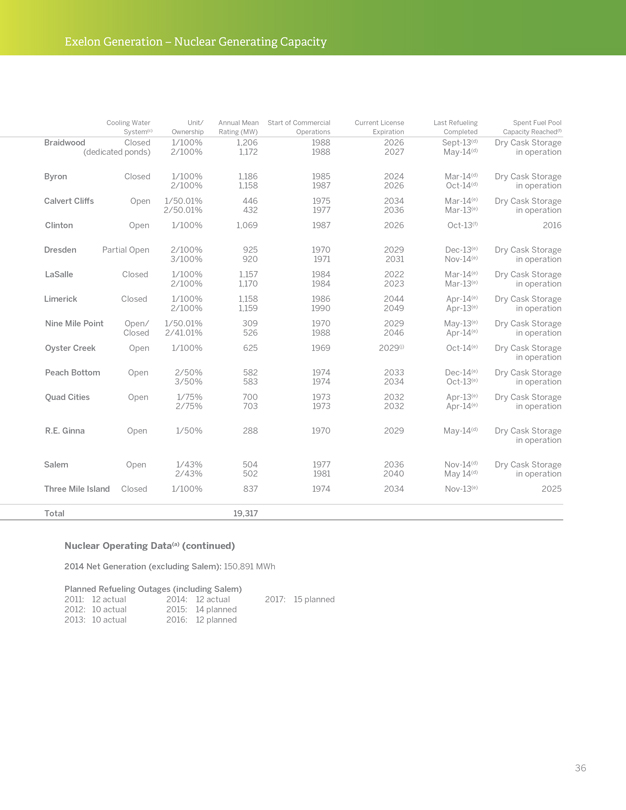
Exelon Generation – Nuclear Generating Capacity Cooling Water Unit/ Annual Mean Start of Commercial Current License Last Refueling Spent Fuel Pool System(c) Ownership Rating (MW) Operations Expiration Completed Capacity Reached(f) Braidwood Closed 1/100% 1,206 1988 2026 Sept-13(d) Dry Cask Storage (dedicated ponds) 2/100% 1,172 1988 2027 May-14(d) in operation Byron Closed 1/100% 1,186 1985 2024 Mar-14(d) Dry Cask Storage 2/100% 1,158 1987 2026 Oct-14(d) in operation Calvert Cliffs Open 1/50.01% 446 1975 2034 Mar-14(e) Dry Cask Storage 2/50.01% 432 1977 2036 Mar-13(e) in operation Clinton Open 1/100% 1,069 1987 2026 Oct-13(f) 2016 Dresden Partial Open 2/100% 925 1970 2029 Dec-13(e) Dry Cask Storage 3/100% 920 1971 2031 Nov-14(e) in operation LaSalle Closed 1/100% 1,157 1984 2022 Mar-14(e) Dry Cask Storage 2/100% 1,170 1984 2023 Mar-13(e) in operation Limerick Closed 1/100% 1,158 1986 2044 Apr-14(e) Dry Cask Storage 2/100% 1,159 1990 2049 Apr-13(e) in operation Nine Mile Point Open/ 1/50.01% 309 1970 2029 May-13(e) Dry Cask Storage Closed 2/41.01% 526 1988 2046 Apr-14(e) in operation Oyster Creek Open 1/100% 625 1969 2029(j) Oct-14(e) Dry Cask Storage in operation Peach Bottom Open 2/50% 582 1974 2033 Dec-14(e) Dry Cask Storage 3/50% 583 1974 2034 Oct-13(e) in operation Quad Cities Open 1/75% 700 1973 2032 Apr-13(e) Dry Cask Storage 2/75% 703 1973 2032 Apr-14(e) in operation R.E. Ginna Open 1/50% 288 1970 2029 May-14(d) Dry Cask Storage in operation Salem Open 1/43% 504 1977 2036 Nov-14(d) Dry Cask Storage 2/43% 502 1981 2040 May 14(d) in operation Three Mile Island Closed 1/100% 837 1974 2034 Nov-13(e) 2025 Total 19,317 Nuclear Operating Data(a) (continued) 2014 Net Generation (excluding Salem): 150,891 MWh Planned Refueling Outages (including Salem) 2011: 12 actual 2014: 12 actual 2017: 15 planned 2012: 10 actual 2015: 14 planned 2013: 10 actual 2016: 12 planned 36
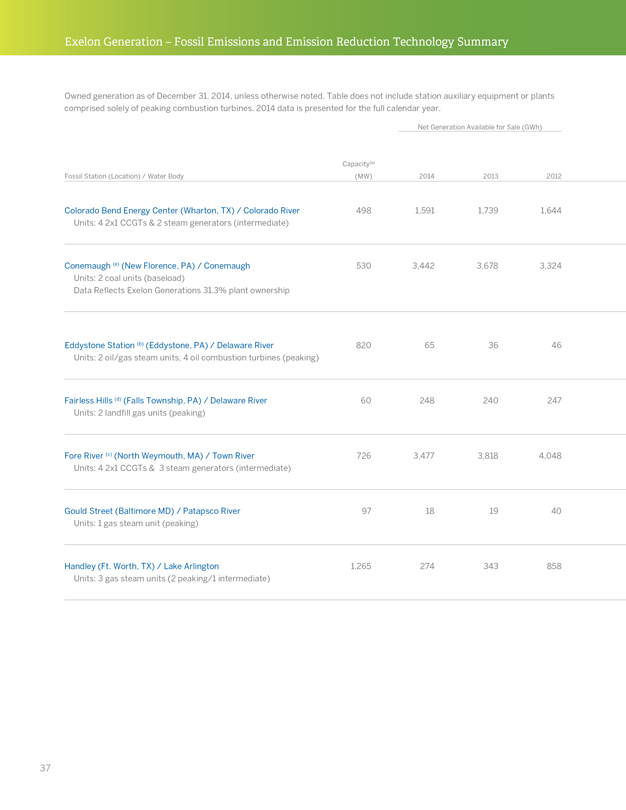
Exelon Generation – Fossil Emissions and Emission Reduction Technology Summary Owned generation as of December 31, 2014, unless otherwise noted. Table does not include station auxiliary equipment or plants comprised solely of peaking combustion turbines. 2014 data is presented for the full calendar year. Net Generation Available for Sale (GWh) Capacity(a) Fossil Station (Location) / Water Body(MW) 2014 2013 2012 Colorado Bend Energy Center (Wharton, TX) / Colorado River 498 1,591 1,739 1,644 Units: 4 2x1 CCGTs & 2 steam generators (intermediate) Conemaugh (e) (New Florence, PA) / Conemaugh 530 3,442 3,678 3,324 Units: 2 coal units (baseload) Data Reflects Exelon Generations 31.3% plant ownership Eddystone Station (b) (Eddystone, PA) / Delaware River 820 65 36 46 Units: 2 oil/gas steam units, 4 oil combustion turbines (peaking) Fairless Hills (d) (Falls Township, PA) / Delaware River 60 248 240 247 Units: 2 land?ll gas units (peaking) Fore River (c) (North Weymouth, MA) / Town River 726 3,477 3,818 4,048 Units: 4 2x1 CCGTs & 3 steam generators (intermediate) Gould Street (Baltimore MD) / Patapsco River 97 18 19 40 Units: 1 gas steam unit (peaking) Handley (Ft. Worth, TX) / Lake Arlington 1,265 274 343 858 Units: 3 gas steam units (2 peaking/1 intermediate) 37
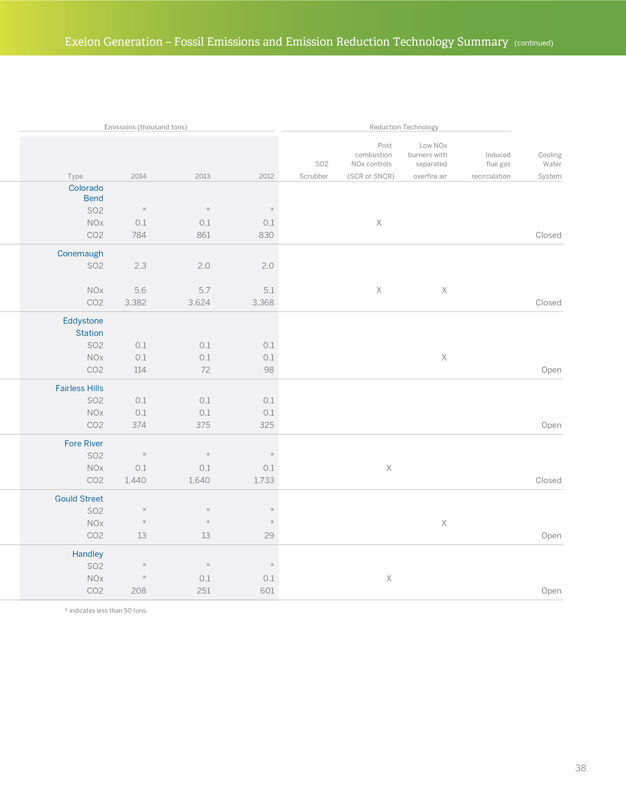
Exelon Generation – Fossil Emissions and Emission Reduction Technology Summary (continued) Emissions (thousand tons) Reduction Technology Post Low NOx combustion burners with Induced Cooling SO2 NOx controls separated due gas Water Type 2014 2013 2012 Scrubber(SCR or SNCR) over?re air recirculation System Colorado Bend SO2*** NOx 0.1 0.1 0.1 X CO2 784 861 830 Closed Conemaugh SO2 2.3 2.0 2.0 NOx 5.6 5.7 5.1 X X CO2 3,382 3,624 3,368 Closed Eddystone Station SO2 0.1 0.1 0.1 NOx 0.1 0.1 0.1 X CO2 114 72 98 Open Fairless Hills SO2 0.1 0.1 0.1 NOx 0.1 0.1 0.1 CO2 374 375 325 Open Fore River SO2*** NOx 0.1 0.1 0.1 X CO2 1,440 1,640 1,733 Closed Gould Street SO2*** NOx*** X CO2 13 13 29 Open Handley SO2*** NOx* 0.1 0.1 X CO2 208 251 601 Open * indicates less than 50 tons. 38
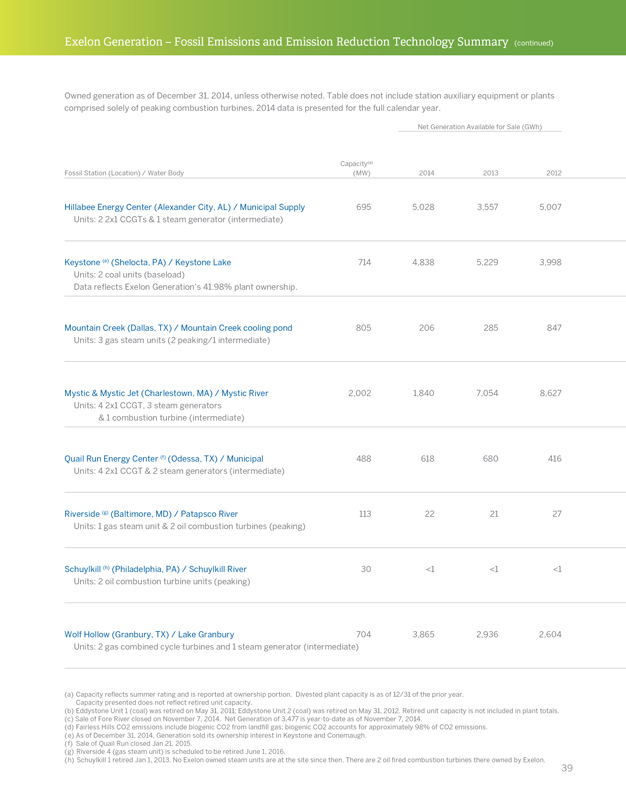
Exelon Generation – Fossil Emissions and Emission Reduction Technology Summary (continued) Owned generation as of December 31, 2014, unless otherwise noted. Table does not include station auxiliary equipment or plants comprised solely of peaking combustion turbines. 2014 data is presented for the full calendar year. Net Generation Available for Sale (GWh) Capacity(a) Fossil Station (Location) / Water Body(MW) 2014 2013 2012 Hillabee Energy Center (Alexander City, AL) / Municipal Supply 695 5,028 3,557 5,007 Units: 2 2x1 CCGTs & 1 steam generator (intermediate) Keystone (e) (Shelocta, PA) / Keystone Lake 714 4,838 5,229 3,998 Units: 2 coal units (baseload) Data reflects Exelon Generation’s 41.98% plant ownership. Mountain Creek (Dallas, TX) / Mountain Creek cooling pond 805 206 285 847 Units: 3 gas steam units (2 peaking/1 intermediate) Mystic & Mystic Jet (Charlestown, MA) / Mystic River 2,002 1,840 7,054 8,627 Units: 4 2x1 CCGT, 3 steam generators & 1 combustion turbine (intermediate) Quail Run Energy Center (f) (Odessa, TX) / Municipal 488 618 680 416 Units: 4 2x1 CCGT & 2 steam generators (intermediate) Riverside (g) (Baltimore, MD) / Patapsco River 113 22 21 27 Units: 1 gas steam unit & 2 oil combustion turbines (peaking) Schuylkill (h) (Philadelphia, PA) / Schuylkill River 30 <1 <1 <1 Units: 2 oil combustion turbine units (peaking) Wolf Hollow (Granbury, TX) / Lake Granbury 704 3,865 2,936 2,604 Units: 2 gas combined cycle turbines and 1 steam generator (intermediate) (a) Capacity re?ects summer rating and is reported at ownership portion. Divested plant capacity is as of 12/31 of the prior year. Capacity presented does not re?ect retired unit capacity. (b) Eddystone Unit 1 (coal) was retired on May 31, 2011; Eddystone Unit 2 (coal) was retired on May 31, 2012. Retired unit capacity is not included in plant totals. (c) Sale of Fore River closed on November 7, 2014. Net Generation of 3,477 is year-to-date as of November 7, 2014. (d) Fairless Hills CO2 emissions include biogenic CO2 from land?ll gas; biogenic CO2 accounts for approximately 98% of CO2 emissions. (e) As of December 31, 2014, Generation sold its ownership interest in Keystone and Conemaugh. (f) Sale of Quail Run closed Jan 21, 2015. (g) Riverside 4 (gas steam unit) is scheduled to be retired June 1, 2016. (h) Schuylkill 1 retired Jan 1, 2013. No Exelon owned steam units are at the site since then. There are 2 oil ?red combustion turbines there owned by Exelon. 39
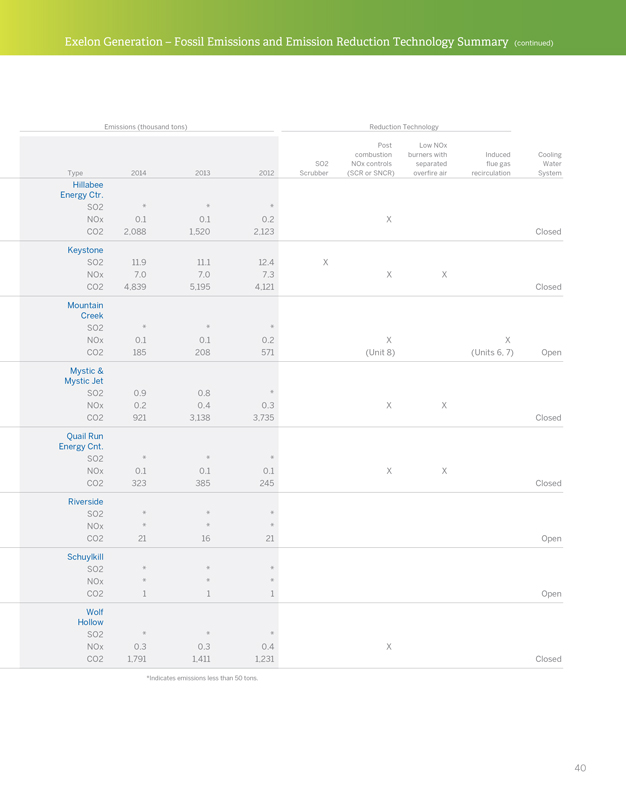
Exelon Generation – Fossil Emissions and Emission Reduction Technology Summary (continued) Emissions (thousand tons) Reduction Technology Post Low NOx combustion burners with Induced Cooling SO2 NOx controls separated ?ue gas Water Type 2014 2013 2012 Scrubber(SCR or SNCR) over?re air recirculation System Hillabee Energy Ctr. SO2*** NOx 0.1 0.1 0.2 X CO2 2,088 1,520 2,123 Closed Keystone SO2 11.9 11.1 12.4 X NOx 7.0 7.0 7.3 X X CO2 4,839 5,195 4,121 Closed Mountain Creek SO2*** NOx 0.1 0.1 0.2 X X CO2 185 208 571(Unit 8)(Units 6, 7) Open Mystic & Mystic Jet SO2 0.9 0.8* NOx 0.2 0.4 0.3 X X CO2 921 3,138 3,735 Closed Quail Run Energy Cnt. SO2*** NOx 0.1 0.1 0.1 X X CO2 323 385 245 Closed Riverside SO2*** NOx*** CO2 21 16 21 Open Schuylkill SO2*** NOx*** CO2 1 1 1 Open Wolf Hollow SO2*** NOx 0.3 0.3 0.4 X CO2 1,791 1,411 1,231 Closed *Indicates emissions less than 50 tons. 40
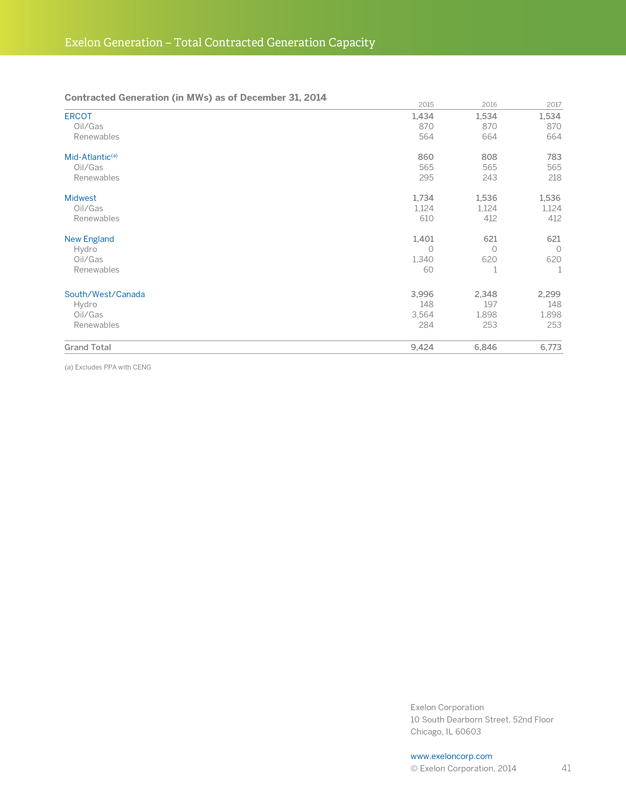
Exelon Generation – Total Contracted Generation Capacity Contracted Generation (in MWs) as of December 31, 2014 2015 2016 2017 ERCOT 1,434 1,534 1,534 Oil/Gas 870 870 870 Renewables 564 664 664 Mid-Atlantic(a) 860 808 783 Oil/Gas 565 565 565 Renewables 295 243 218 Midwest 1,734 1,536 1,536 Oil/Gas 1,124 1,124 1,124 Renewables 610 412 412 New England 1,401 621 621 Hydro 0 0 0 Oil/Gas 1,340 620 620 Renewables 60 1 1 South/West/Canada 3,996 2,348 2,299 Hydro 148 197 148 Oil/Gas 3,564 1,898 1,898 Renewables 284 253 253 Grand Total 9,424 6,846 6,773 (a) Excludes PPA with CENG Exelon Corporation 10 South Dearborn Street, 52nd Floor Chicago, IL 60603 www.exeloncorp.com © Exelon Corporation, 2014 41