Attached files
| file | filename |
|---|---|
| 8-K - 8-K - AGILYSYS INC | form8-kinvestordaypresenta.htm |

TECHNOLOGY | INNOVATION | SOLUTIONS Investor/Analyst Day August 27, 2015

TECHNOLOGY | INNOVATION | SOLUTIONS 2 Forward-looking Statements & Non-GAAP Financial Information Forward-Looking Language This presentation and all publicly available documents, including the documents incorporated herein and therein by reference, contain, and our officers and representatives may from time to time make, "forward-looking statements" within the meaning of the safe harbor provisions of the U.S. Private Securities Litigation Reform Act of 1995. Forward-looking statements can be identified by words such as: "anticipate," "intend," "plan," "goal," "seek," "believe," "project," "estimate," "expect," "strategy," "future," "likely," "may," "should," "will" and similar references to future periods, including statements and forecast data on the slides in this presentation titled “Total Addressable Market is Growing,” “Agilysys Delivers in Cruise,” “Agilysys Delivers in Cruise,” “FY16 Outlook,” and “Investment Highlights.” Forward-looking statements are not guarantees of future performance and involve risks, uncertainties and assumptions that are difficult to predict. These statements are based on management’s current expectations, intentions or beliefs and are subject to a number of factors, assumptions and uncertainties that could cause actual results to differ materially from those described in the forward-looking statements. Factors that could cause or contribute to such differences or that might otherwise impact the business include the risk factors set forth in Item 1A of the company’s Annual Report for the fiscal year ended March 31, 2015. Copies are available from the SEC or the Agilysys website. We undertake no obligation to update any such factor or to publicly announce the results of any revisions to any forward-looking statements contained herein whether as a result of new information, future events or otherwise. Use of Non-GAAP Financial Information To supplement the unaudited condensed consolidated financial statements presented in accordance with U.S. GAAP in this press release, certain non-GAAP financial measures as defined by the SEC rules are used. These non-GAAP financial measures include adjusted cash flow from operations and adjusted EBITDA. Management believes that such information can enhance investors' understanding of the company's ongoing operations. See the tables on slide 40 & 41 for reconciliations to the comparable GAAP measures.

TECHNOLOGY | INNOVATION | SOLUTIONS 3 Today’s Agenda Executive Summary Market Overview Products & Technology Financial Overview

4 Executive Summary

5 Connecting Hospitality Managers to Their Guests Guest Recognition Dining & Stay Preferences Reaching your Target Market Integrated Purchasing & Payment

TECHNOLOGY | INNOVATION | SOLUTIONS 6 Connection Value Improve recruitment Connecting purchasing & payment Targeted promotions Increase wallet share Acting persona Contextually relevant offers Strengthen guest connection Guest recognition Guest value

TECHNOLOGY | INNOVATION | SOLUTIONS 7 Transform the guest experience in the hospitality industry Build lasting connections with our team, our customers, our stakeholders and our communities Our Purpose Our Vision Vision & Purpose

TECHNOLOGY | INNOVATION | SOLUTIONS 8 Operating Plan Guidelines Strategy Objectives/Key Results: • Substantially grow market share • Increase SaaS portion of revenue • Market leading innovation • Leader in employee retention Go to Market Strategy: • Dominate gaming and food service management • Extend our leadership in the luxury resort and cruise segments. • Increase our share in the core hotel and restaurant segments • Expand our international market coverage

TECHNOLOGY | INNOVATION | SOLUTIONS 9 Investment Highlights 53% Recurring Revenue TTM* 78% Recurring Revenue Gross Margins 95%+ Renewal Rate in FY15 $14B+ Market Opportunity 10+ Year Average Customer Relationship *TTM for the twelve month period ended June 30, 2015.

10 Market Overview

TECHNOLOGY | INNOVATION | SOLUTIONS 11 Total Addressable Market is Growing $14B+ Market Opportunity $4.3B Addressed Market AGYS Product roadmap & reseller channel significantly expands total addressable market Industry growth expected at 5-7% annually (commissioned IHL and STR study)

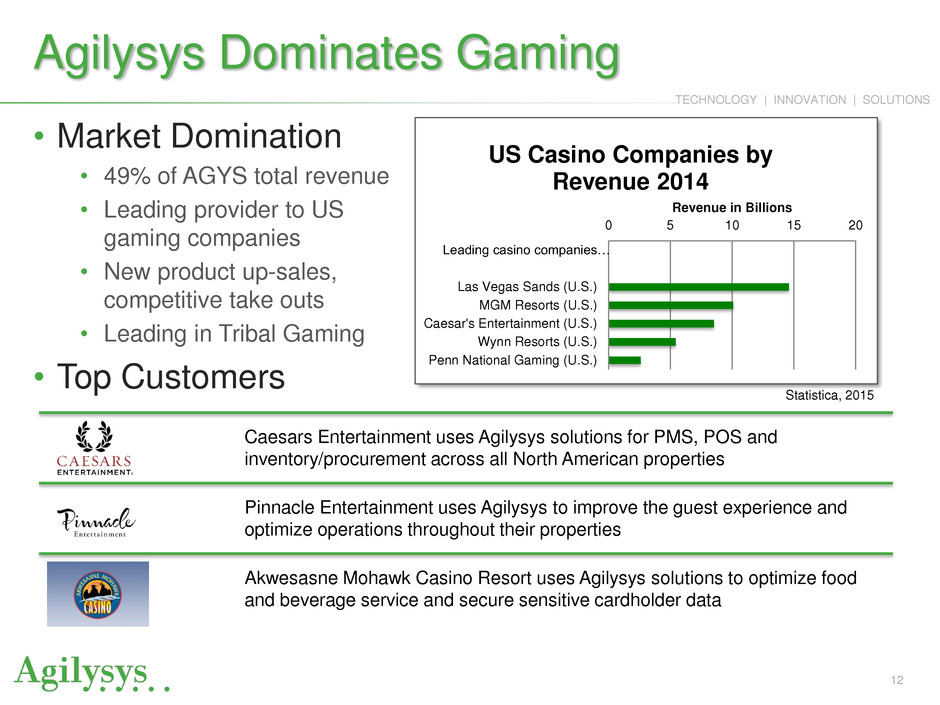
TECHNOLOGY | INNOVATION | SOLUTIONS 12 Agilysys Dominates Gaming • Market Domination • 49% of AGYS total revenue • Leading provider to US gaming companies • New product up-sales, competitive take outs • Leading in Tribal Gaming • Top Customers Caesars Entertainment uses Agilysys solutions for PMS, POS and inventory/procurement across all North American properties Pinnacle Entertainment uses Agilysys to improve the guest experience and optimize operations throughout their properties Akwesasne Mohawk Casino Resort uses Agilysys solutions to optimize food and beverage service and secure sensitive cardholder data Statistica, 2015 0 5 10 15 20 Leading casino companies… Las Vegas Sands (U.S.) MGM Resorts (U.S.) Caesar's Entertainment (U.S.) Wynn Resorts (U.S.) Penn National Gaming (U.S.) Revenue in Billions US Casino Companies by Revenue 2014

TECHNOLOGY | INNOVATION | SOLUTIONS 13 Agilysys Leads in FSM • Market Leadership • Partnered With: #1 North American Foodservice Management Company • Exceeding Targeted Growth • Top Customers Compass Group deploys Agilysys solutions throughout its base of institutional foodservice customers to lower costs and increase revenue at each site BRguest relies on Agilysys to improve guest loyalty and return visits while lowering food costs and improving their ability to manage operations Savor uses Agilysys to ensure that its foodservice customers lower food costs and improve the bottom line

TECHNOLOGY | INNOVATION | SOLUTIONS 14 Your Hotel is Ready® with Agilysys • Market Growth • Leading PMS Products: Info-Tech PMS Landscape • New SMB Solution • Winning Limited Service Chains • Top Customers Rosen Hotels depends on Agilysys to help drive revenue growth and wallet share, improve operational efficiency and increase guest loyalty Vail Resorts relies on Agilysys to meet both its PMS and POS requirements across its properties to control costs and increase guest wallet share Caribe Royale uses Agilysys to manage the guest experience from reservation to checkout, building lasting relationships Construction Pipeline by Project Stage Largest Pipeline in 7 Years Lodging Econometrics 2015

TECHNOLOGY | INNOVATION | SOLUTIONS 15 Agilysys Delivers in Cruise • Market Leadership • 2 of the Top 3 by Revenue • Top 2 in Growth Expansion • 2 Newest Ships • Top Customers RCCL deploys Agilysys solutions across its fleet of cruise ships to simplify operations, increase cruise revenue and ensure the best guest experience Norwegian relies on Agilysys’ help to serve guests quickly & efficiently whatever the onboard venue; in a restaurant, at a bar or while lounging at the pool BREA 0 1,000 2,000 3,000 4,000 5,000 6,000 Royal Caribbean Norwegian Berths North American Planned Birth Expansion 2013 - 2015

TECHNOLOGY | INNOVATION | SOLUTIONS 16 Increasing Share in Restaurants • Targeted Growth • Full Service Groups • Fast Casual • Reseller Channel for Down-Market • Top Customers Benchmarc Restaurants relies on Agilysys to maximize the security of every guest’s payment transaction 0. 50. 100. 150. 200. 250. 300. Limited service restaurants Full service restaurants Travel and leisure 2015 Forecast Sales $Billions Technomic, 2015 Uncle Julio’s Fine Mexican Food uses Agilysys to streamline operations, lower food costs and improve profit with automated inventory & procurement The Walker Inn uses Agilysys to optimize guest reservations and table management, including a complete view of guests’ past dining experiences

TECHNOLOGY | INNOVATION | SOLUTIONS 17 International Presence and Growth Despite global presence, there is still room for tremendous international growth International revenues represent approximately 5% of revenue composition, reflecting a large growth opportunity Seattle Las Vegas Santa Barbara Eden Prairie Alpharetta Singapore Hong Kong Principal Location Malaysia Country with Installation Reseller Philippines

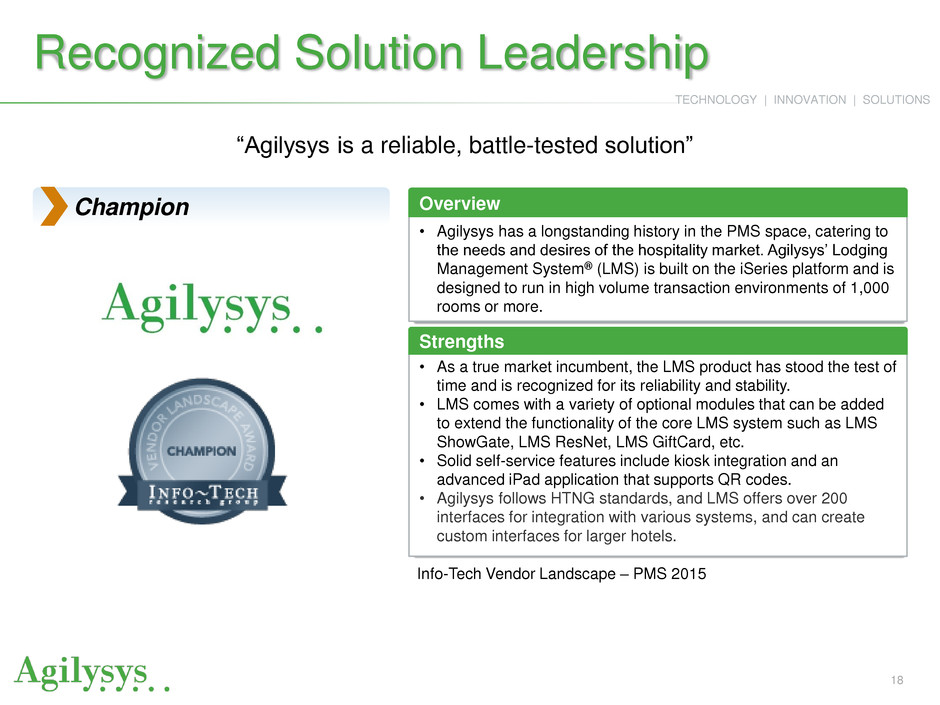
TECHNOLOGY | INNOVATION | SOLUTIONS 18 Recognized Solution Leadership • Agilysys has a longstanding history in the PMS space, catering to the needs and desires of the hospitality market. Agilysys’ Lodging Management System® (LMS) is built on the iSeries platform and is designed to run in high volume transaction environments of 1,000 rooms or more. Overview • As a true market incumbent, the LMS product has stood the test of time and is recognized for its reliability and stability. • LMS comes with a variety of optional modules that can be added to extend the functionality of the core LMS system such as LMS ShowGate, LMS ResNet, LMS GiftCard, etc. • Solid self-service features include kiosk integration and an advanced iPad application that supports QR codes. • Agilysys follows HTNG standards, and LMS offers over 200 interfaces for integration with various systems, and can create custom interfaces for larger hotels. Strengths Champion Info-Tech Vendor Landscape – PMS 2015 “Agilysys is a reliable, battle-tested solution”

TECHNOLOGY | INNOVATION | SOLUTIONS 19 Recognized Cloud Solutions • InfoGenesis® Flex • Finalist – SaaS Solutions • Innovation & efficiency in cloud-based delivery • Program theme – “Operational Excellence” “Recognizes companies, executives, and services whose innovative approaches are helping to accelerate the development and adoption of the cloud in the consumer and business markets.”

TECHNOLOGY | INNOVATION | SOLUTIONS 20 Market Dynamics • Strong market fundamentals • Product development success • Sales execution • Favorable competitive landscape

21 Products & Technology

TECHNOLOGY | INNOVATION | SOLUTIONS 22 Established In-Market Product Offerings: Interfaced, Not Common Platform Workforce Management (Staff) 2% of Revenue Property Management (Book, Arrive, Order) 27% of Revenue Point-of-Sale (Order) 56% of Revenue Inventory & Procurement (Procure) 11% of Revenue Document Management (Order, Procure) 3% of Revenue Note: Revenue contribution figures represent percentage of TTM for the twelve months ended June 30, 2015. (approx. 1% of revenues from rGuest Platform sales)

TECHNOLOGY | INNOVATION | SOLUTIONS 23 Key Differentiators The best hospitality knowledge coupled with the best technology talent Competitive Strengths Scalability Support deployments from single lane café (POS) to 8,000 room property (PMS) on a single instance Scalability Scalability High levels of customer service and satisfaction leads to industry-leading average customer life of over ten years Customer Engagement Scalability Successfully running mission critical operations for high profile accounts Stability Scalability Handle disconnected scenarios for weeks at a time Offline Capabilities Scalability Full-service product suite supports customers’ business operations Integrated Suite

TECHNOLOGY | INNOVATION | SOLUTIONS 24 rGuest ® Platform & Product Offering Overview: End-to-End Solutions Promote Staff Survey Promote Supply Seat Reserve Seat Stay Buy Stay Upsell Profile Analyze NextGen Offering Today’s Offering Guest Lifecycle Pay Suggest Order Market Discover Book / Reserve Arrive Analyze Procure Staff Experience Current offering Future offering Pay Agilysys’ Unified Platform for Delivering its Next Generation Offerings

TECHNOLOGY | INNOVATION | SOLUTIONS 25 Delivering Vision Through the rGuest ® Platform Common User Interface Shared Configuration Common Services Cloud Technology Open Architecture Rich Integrations

TECHNOLOGY | INNOVATION | SOLUTIONS 26 Product Status Insight Mobile Manager (IMM) v1.x for LMS & Visual One (POS) Initial Release: Fall 2015 (PMS) Limited Release Available

TECHNOLOGY | INNOVATION | SOLUTIONS 27 Recently Released Offerings SaaS-based Reservations & Table Management solution Leverage comprehensive guest data Drive operational efficiency PCI-validated P2PE gateway gets merchant out of PCI scope Card data protection Differentiated pricing model Single solution for AGYS and non- AGYS products Offers loyalty engine, stored value solution & mobile payments

TECHNOLOGY | INNOVATION | SOLUTIONS 28 Guest-Centric Operation • Thrill the guest • Maximize wallet share • Increase recruitment • Reduce cost rGuest® Seat: Guest Centric 2 8 PERSONALIZE SCORE IDENTIFY SATISFY UPSELL RECRUIT

TECHNOLOGY | INNOVATION | SOLUTIONS 29 Product Demo

TECHNOLOGY | INNOVATION | SOLUTIONS 30

TECHNOLOGY | INNOVATION | SOLUTIONS 31 rGuest® Buy Kiosk – Upcoming Initial Offering • Menu scheduling • Suggestive selling • Real-time menu updates • P2PE payment w/rGuest pay • USB scanner and scale support • Menu modifiers & choice groups • Image management • White label branding • Table top or free-standing kiosk hardware options LS Café Lite Menu Modifiers, Choice Groups, Kitchen IP Printing, KDS Integration Grab N Go Lite Scanner & Scale Support, Advanced Menu Buffet Lite Basic Menu, Credit Card Payments, Receipt Printing

TECHNOLOGY | INNOVATION | SOLUTIONS 32 Product Demo

33 Financial Overview

TECHNOLOGY | INNOVATION | SOLUTIONS 34 Historical Financial Results All numbers in thousands, except per share data *FY13 & FY14 results reflect the sale of RSG and UK entity **TTM for the twelve month period ended June 30, 2015 ^ Non-GAAP measure, see reconciliation on slide 40 & 41 $94,008 $101,261 $103,514 $107,259 $85,000 $90,000 $95,000 $100,000 $105,000 $110,000 FY13* FY14* FY15 TTM** Revenue $3,235 $876 $5,099 $0 $1,000 $2,000 $3,000 $4,000 $5,000 $6,000 $7,000 $8,000 FY14* FY15 TTM** Adjusted Cash from Continuing Operations^ $1,836 $6,450 $1,174 $1,866 $0 $2,000 $4,000 $6,000 $8,000 $10,000 FY13* FY14* FY15 TTM** Adjusted EBITDA^ ($6,214) ($2,895) ($11,497) ($9,452) ($15,000) ($13,000) ($11,000) ($9,000) ($7,000) ($5,000) ($3,000) ($1,000) FY13* FY14* FY15 TTM** Loss from Continuing Operations

TECHNOLOGY | INNOVATION | SOLUTIONS 35 Recurring Revenue Growth Agilysys’ pure-play software business model is driving robust recurring revenue Reported revenue growth of +2% in FY15 TTM revenue growth of 4% 54% recurring revenue in FY2015 with high retention rates More than doubled new customer acquisition for last three consecutive quarters Opportunity to sell new SaaS / PaaS products into existing customer base and into new customers and markets Revenue by Vertical (1) Restaurants, universities, stadia, and healthcare (2) TTM for the twelve month period ended June 30, 2015 52% 55% 49% 49% 24% 21% 24% 25% 14% 14% 18% 17% 10% 10% 9% 9% 0% 20% 40% 60% 80% 100% FY13 FY14 FY15 TTM Gaming Hotels, Resorts & Cruiselines Food Service Management RUSH (2) ($ in millions) $94.0 $101.3 $103.5 $107.3 Revenue by Type (2) $49.1 $53.2 $56.0 $57.1 $44.9 $48.1 $47.5 $50.2 - $20 $40 $60 $80 $100 $120 FY13 FY14 FY15 TTM Recurring Non-Recurring (1)

TECHNOLOGY | INNOVATION | SOLUTIONS 36 Strong Balance Sheet Consolidated Balance Sheet (unaudited) in thousands June 30, 2015 March 31, 2015 Cash, cash equivalents and marketable securities $66,034 $75,067 Other current assets 23,434 29,950 Long-term assets 81,172 76,508 Total assets $170,640 $181,525 Current liabilities $39,538 $50,610 Other liabilities 6,709 6,727 Total liabilities $46,247 $57,337 Shareholders’ equity 124,393 124,188 Total liabilities and shareholders’ equity $170,640 $181,525

TECHNOLOGY | INNOVATION | SOLUTIONS 37 FY16 Outlook • Revenue outlook • $106-108M compared to $103.5M in fiscal 2015 • Gross margin • Expected to be consistent with fiscal 2015 in high 50% range • Adjusted EBITDA • Incrementally higher Adjusted EBITDA compared to fiscal 2015 Adjusted EBITDA of $1.2M • Year-end cash of more than $50 million • Reflects ongoing investment in transition to a Subscription business and the rGuest® platform development

TECHNOLOGY | INNOVATION | SOLUTIONS 38 Investment Highlights Focused Business with Significant Room for Growth Over $4B in annual industry spend for current product portfolio, Gain share, expand product capabilities through focused investments and acquisitions Support growth with world-class customer service and high client engagement Growing Recurring Revenue Business Ability to leverage large installed base Growing SaaS-based product offerings Over 53% of revenue in TTM(1) revenue; 95%+ renewal rate Large Untapped International Opportunities Europe and Asia infrastructure in place Expanding reseller community International revenues currently make up approximately 5% of revenue Strong Industry Demand and Upsell Opportunities Strong long-term relationships averaging 10+ years with industry leading brands 3,100+ customers Two thirds of current customers have only one of our software titles Products that Drive Performance Customer and market driven technology delivery Guest centric business intelligence & reporting New innovation Strong Financial Model with Upside Recurring revenue growth and margin expansion Fully valued federal net operating losses of approximately $180M Balance sheet (approximately $66M in cash, no debt) to support growth (1) TTM for the twelve month period ended June 30, 2015

39 APPENDIX

TECHNOLOGY | INNOVATION | SOLUTIONS 40 Non-GAAP Reconciliation *TTM for the twelve month period ended June 30, 2015. 2013 2014 2015 TTM* Net (loss) income (1,298)$ 17,097$ (11,497)$ (9,452)$ (Loss) Income from discontinued operations, net of taxes 4,916 19,992 - - Loss from continuing operations (6,214) (2,895) (11,497) (9,452) Income tax (benefit) expense (3,118) (2,491) (1,054) (284) Loss before income taxes (9,332) (5,386) (12,551) (9,736) Depreciation of fixed assets 2,137 2,074 2,225 2,129 Amortization of intangibles 3,284 6,414 3,461 1,976 Amortization of developed technology 805 312 1,294 1,260 Interest (income) expense 253 61 (62) (57) EBITDA (b) (2,853) 3,475 (5,633) (4,428) Share-based compensation 1,638 2,119 3,140 3,179 Asset write-offs and other fair value adjustments 120 327 1,836 1,836 Restructuring, severance and other charges 1,495 1,392 1,482 1,066 Other non-operating (income) expense (228) (863) 146 158 Legal settlements 1,664 - 203 54 Adjusted EBITDA from continuing operations (a) 1,836$ 6,450$ 1,174$ 1,865$ (a) Adjusted EBITDA from continuing operations, a non-GAAP financial measure, is defined as income from continuing operations before income taxes, interest expense (net of interest income), depreciation and amortization (including amortization of developed technology), and excluding charges relating to i) legal settlements, ii) restructuring, severance, and other charges, iii) asset write-offs and other fair value adjustments, iv) share-based compensation, and v) other non-operating (income) expense (b) EBITDA is defined as net income before income taxes, interest expense, depreciation and amortization (In thousands) AGILYSYS, INC. RECONCILIATION OF ADJUSTED EBITDA TO NET (LOSS) INCOME (UNAUDITED) Fiscal year ended March 31,

TECHNOLOGY | INNOVATION | SOLUTIONS 41 Non-GAAP Reconciliation *TTM for the twelve month period ended June 30, 2015. 2014 2015 TTM* Operating activities: Net cash used in operating activities from continuing operations 1,384$ (2,186)$ 4,136$ Non-recurring cash items: Payments for restructuring, severance and other charges 1,741 1,348 893 Payments for legal settlements 110 1,714 69 Adjusted cash provided by continuing operations (a) 3,235$ 876$ 5,098$ (a) Non-GAAP financial measure AGILYSYS, INC. (In thousands) RECONCILIATION OF OPERATING CASH FLOWS FROM CONTINUING OPERATIONS (UNAUDITED) TO ADJUSTED CASH FLOWS FROM CONTINUING OPERATIONS Fiscal year ended March 31,
