Attached files
| file | filename |
|---|---|
| 8-K - 8-K - Nimble Storage Inc | d50521d8k.htm |
| EX-99.2 - EX-99.2 - Nimble Storage Inc | d50521dex992.htm |
Exhibit 99.1
Nimble Storage, Inc. Q2FY16 Shareholder Letter
Executive Summary
Major architectural shifts are continuing to disrupt the storage market resulting in significant year-over-year revenue declines for incumbent vendors in our industry. Against this backdrop, we believe that the Nimble Storage Adaptive Flash Platform offers the broadest approach to leveraging flash storage in the modern data center. There are two key principles on which our platform is founded:
| 1. | Flash will disrupt traditional storage systems. Flash delivers overwhelmingly better performance to applications. Further, our architecture is so broad and flexible that we deliver the benefits of flash to the entire spectrum of Enterprise applications at a lower total cost of ownership than competitive storage architectures. High performance applications can benefit from All-Flash latencies while mainstream applications can simultaneously realize high performance and low cost of capacity. |
| 2. | Cloud-based management will radically simplify data center operations. Unlike the traditional approach of managing storage with complex, on-premise management software, we monitor our customers’ infrastructure from the cloud, on a real-time basis. Combining cloud-based management with data analytics allows us to ensure that customer environments are operating optimally and we radically simplify day-to-day operations. |
We believe that we stand alone in our ability to address the entire market opportunity as Hybrid-Flash arrays and All-Flash arrays displace disk-only storage arrays over the next several years.
|
To address this market opportunity, our go-to-market strategy has been focused on building a large, diverse and global customer base. We are systematically expanding our customer base across the mid-sized enterprise, large enterprise and cloud service provider segments of the market. We believe that a large, highly satisfied customer base will propel our long-term growth given that data growth drives repeat deployments by our customers.
Even as we pursue our long-term goal of storage market leadership, our financial strategy has been to balance growth with profitability – investing to drive sustained high growth over many years while demonstrating improved operating leverage and increased positive cash flow on a year-over-year basis. |
Q2FY16 marked strong progress on all fronts:
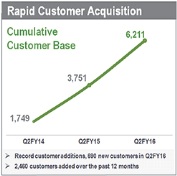
| • | Record pace of new customer acquisition with 690 new customers - our highest ever in a single quarter. Our global customer base now stands at more than 6,200 customers. |
| • | Rapid pace of growth in SmartStack converged infrastructure solutions, with a doubling of SmartStack customers on a year-over-year basis |
| • | Continued Enterprise momentum. Our penetration of Global 5000 enterprises continues to scale and we now have more than 70 customers within the Global 500. During Q2 we had a record number of deals over $100K driven by increasingly larger customer deployments. |
| • | The unmatched simplicity and quality of customer support with InfoSight drove 46% of our bookings from existing customers on a trailing 12-month basis, even as we added a record number of new customers in Q2. |
| • | Strong financial performance in Q2FY16 |
| • | Revenue of $80.1 million increased by 49% year-over-year compared to Q2FY15. Excluding fluctuations in foreign currency, revenues would be $82.8 million, representing a 54% increase year-over-year compared to Q2FY15 |
| • | Record Non-GAAP gross margin of 67.8% |
| • | Non-GAAP operating loss of $7.2 million, or negative 9% of revenue, compared to negative 20% in Q2FY15 |
| • | Non-GAAP EPS was a loss of $0.10 per share, compared to a loss of $0.15 per share in Q2FY15 |
| • | Cash flow from operations of $14.9 million in Q2FY16 compared to $2.8 million in Q2FY15, and free cash flow of $9 million in Q2FY16 compared to negative $1.3 million in Q2FY15 |
| • | During Q2, we advanced our Adaptive Flash Platform in a significant manner. We introduced enterprise-grade capabilities including Flash Service Levels, SmartSecure Encryption, VMVision, Nimble Concierge Services, Virtual Volume support and several other features. |
Adaptive Flash Platform: The broadest approach to leveraging flash in the Enterprise
The breadth of our software architecture is evident in the pace at which we have been able to deliver innovation across the Adaptive Flash Platform. Our milestone innovations over the past 18 months have spanned scale-out clustering, the ability to have variable flash to disk ratios, Fibre Channel support, high-end platforms, and triple parity RAID, among others.
Underscoring the differentiation of our Adaptive Flash Platform, the Flash Memory Summit Awards Committee named Nimble a Best of Show winner in the “Most Innovative Flash Memory Technology” category. IT Professionals also recognized Nimble as the 2015 Innovation Leader for Hybrid HDD/SSD Array in IT Brand Pulse’s most recent brand leader survey.
During Q2, we fortified our proven track record of innovation and advanced the Adaptive Flash Platform with significant new enterprise-grade capabilities as part of Nimble OS 2.3 and as part of InfoSight:
| • | Adaptive Flash Service Levels. With our most recent software release, customers can now consolidate hundreds of applications onto a single platform while delivering customized service levels. With three user-selectable modes (All-Flash, Auto-Flash and No Flash), performance-demanding applications can run in the “All-Flash” mode to ensure deterministic low latencies. “Auto-Flash” mode ensures a blend of high performance and low cost of capacity. “No Flash” mode delivers the lowest cost of capacity for capacity-intensive applications that do not require high levels of performance. |
| • | SmartSecure Encryption. Unlike competitive data-at-rest encryption offerings that require unique and expensive hardware in the form of self-encrypting drives, SmartSecure Encryption is free and uses flexible software-based encryption that can be applied on a per-volume basis to provide granular security and compliance only for the applications that require it. Further, data remains encrypted even as it is replicated to remote sites or third-party service provider sites. |
| • | VMvision. The VMVision agentless per-VM monitoring feature provides enterprise IT organizations with clear visibility into latency and performance levels across host, network and storage layers of the stack. This enables administrators to rapidly pinpoint and resolve performance issues. |
| • | Nimble Concierge Services. For large enterprises, a “Nimble Concierge Manager” serves as a single point of contact to provide technical account management and leverage actionable intelligence gained through InfoSight to deliver customized insights and guidance on optimizing the customer’s environment. |
| • | Virtual Volume support. Support for VMWare Virtual Volumes enables more granular and policy-based per-VM management across VMware environments. |
| • | Added functionality includes features such as REST APIs, deeper integration with Microsoft SCVMM for Hyper-V environments, and enhanced vCenter integration. |
We anticipate that the functionality introduced as part of Nimble OS 2.3 will further allow us to demonstrate a radically superior value proposition relative to legacy incumbent and emerging competitive offerings.
In the three quarters following the introduction of Fibre Channel support, we have had continued momentum with the addition of 110 Fibre Channel customers in Q2, 74 of which were “net new Nimble” customers. The mix between Fibre Channel and iSCSI expanded to 17% (versus 16% and 12% in the prior two quarters respectively after excluding protocol agnostic bookings). As we expected, the average deal size for Fibre Channel orders remains significantly above our overall average. As a result we have experienced a double-digit percentage increase in ASP’s for new customer orders compared to Q2FY15.
As customers seek to simplify the deployment of infrastructure, we have partnered with industry leaders to create SmartStack converged infrastructure solutions that are experiencing rapid adoption. During Q2FY16, we saw the number of SmartStack customers compared to Q2FY15 more than double, and increase more than 40% sequentially compared to Q1FY16. For example, one of the largest deals this quarter was a significant 2.5PB deployment at a major healthcare organization that selected our SmartStack solution over incumbent EMC and other leading hyper-convergence solutions.
|
| ||
| • | Systematically expanding our global presence. We now have Nimble sales teams on the ground in 20 countries. We have distribution partners that expand our reach into additional countries. Exiting Q2, we have customer deployments in more than 50 countries worldwide. International revenues represented 20% of total revenue. EMEA and APJ demonstrated strong year-over-year growth. Excluding foreign currency fluctuations, international revenue contribution would have represented 23% of total revenues representing a year-over-year growth of 133%. |
| • Land and expand model fueling repeat bookings. One of our biggest differentiators is the level of resiliency and availability our products provide, the level of visibility that we have into our customers’ environments with InfoSight, and the consequent high level of proactive support we are able to deliver. Over 90% of support cases are proactively identified by InfoSight instead of from customers calling us. We continue to experience availability well ahead of five 9s across our rapidly expanding installed base.
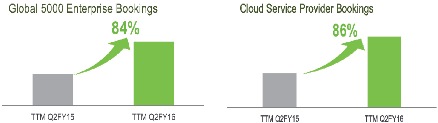
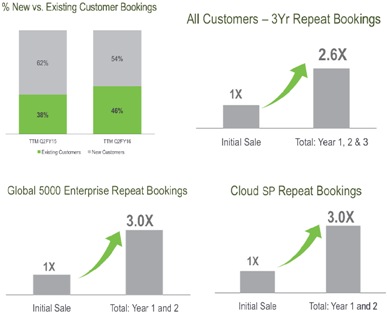
Because of these differentiators, our highly satisfied customer base on average spends 2.6X of its spend in the twelve quarters following its initial purchase. Global 5000 enterprise and Cloud Service Provider customers triple their spend in the eight quarters following their initial purchase. This pattern of repeat purchases has resulted in sales to existing customers representing more than 46% of bookings over the last 12 months, even as we have added new customers at a record pace. |
|
|
Zanox AG accelerates its mission-critical applications with the Nimble Adaptive Flash platform
Headquartered in Berlin Germany, Zanox AG is the leading performance advertising network in Europe, supporting more than 4,300 international advertisers in effectively marketing its clients’ products and services on the Internet.
Application performance is critical to their business success, and the focus of the IT team’s initial engagement with Nimble was addressing the performance requirements of their Microsoft SQL Databases. After evaluating multiple leading vendor solutions, Zanox AG selected Nimble for the following reasons:
• Faster applications. A single 3U storage system was able to handily outperform their legacy storage array with hundreds of disks for their core databases.
• Lower TCO. Zanox has realized significant cost savings, including 109,000 EUR in annual energy costs and over 60,000 EUR in annual maintenance costs
• Simplicity of cloud-managed infrastructure. With InfoSight, the IT team is now managing a dramatically simpler environment now has the ability to proactively monitor and optimize application performance.
Zanox has already expanded their initial footprint and has now deployed Nimble to optimize their Hadoop analytics environment as well.
|
Niko Group selects Nimble as a consolidation platform for SAP, Siebel and Microsoft applications
Founded in 1919, the Niko Group, headquartered in Sint-Niklaas, Belgium, is a European reference in electro-technical solutions and services. Following an evaluation of its IT infrastructure the IT department realized that their IBM storage systems were reaching the end of their support contracts and were no longer meeting the company’s performance and capacity requirements. The IT team reviewed storage offerings from HP, NetApp and Nimble and conducted proof-of-concept testing before selecting the Nimble Adaptive Flash platform for its production environment.
Within minutes of deploying the Nimble array the team was ready to start migrating production SAP, Siebel and Microsoft Exchange instances. The migration was completed in a single day in contrast to competing offerings that would have taken up to a week. The customer experienced a significant 40% reduction in full backups of their SQL environment in contrast to their legacy IBM systems. Further, the Niko Group gained the benefits of proactive support and comprehensive visibility into all system metrics via InfoSight, cloud-based management software. |
Financial Performance: Q2FY16 Financial Results
As a reminder, all results presented in this letter are on a non-GAAP basis except for revenue and the balance sheet. Non-GAAP results exclude the impact of stock-based compensation.
Q2FY16 Highlights
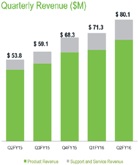
| • | Revenue of $80.1 million increased 49% from $53.8 million in Q2FY15. Excluding fluctuations in foreign currency, revenue would have been $82.8 million representing a 54% increase over Q2FY15. |
| • | Non-GAAP Gross Margin was 67.8%, an all-time high and an increase of 40 basis points vs. Q2FY15 |
| • | Non-GAAP Operating Loss improved to $7.2 million, or negative 9% of revenue, compared to $10.7 million, or negative 20% of revenue, in Q2FY15. |
| • | Adjusted EBITDA improved to negative $3.9 million, or 5% of revenue, compared to negative $8.7 million, or 16% of revenue, in Q2FY15. |
| • | Non-GAAP EPS was a loss of $0.10 per share compared to a loss of $0.15 per share in Q2FY15. |
| • | Total Cash increased by $12.1 million during Q2 to $213.6 million, with cash flow from operations generating $14.9 million or 19% of revenue. |
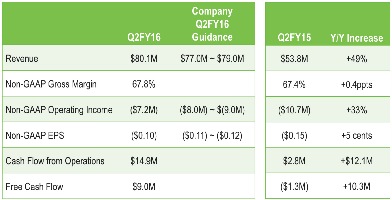
| Q2FY16 was another quarter of strong financial execution for us. We achieved revenue of $80.1 million, above our guidance of $77 million to $79 million. Q2 revenue grew 49% from prior year. Excluding foreign currency fluctuations, revenue would have been $82.8 million representing a 54% increase over Q2FY15. Our gross margin reached another record high during Q2 and remained industry leading at 67.8%. Our operating loss was $7.2 million, better than our projected operating loss of $8.0 million to $9.0 million, primarily due to higher than expected revenue and gross margin. Q2 non-GAAP EPS was a loss of $0.10 per share, better than our guidance of $0.11 to $0.12 loss per share. Our Cash balance increased by $12.1 million during Q2 with positive Cash Flow from Operations of $14.9 million and positive Free Cash Flow of $9.0 million. |
|
|
Revenue and Non-GAAP Gross Margin
Product revenue for Q2FY16 was $66.8 million, representing 83% of total revenue and an increase of 42% from Q2FY15. Support and service revenue for Q2FY16, which includes our maintenance and InfoSight service, was $13.3 million, representing 17% of total revenue and an increase of 101% from Q2FY15. Our international business contributed 20% of total revenue during Q2FY16 and grew by 99% from Q2FY15. Excluding fluctuations in foreign currency, international revenues would have been 23% of total revenue, with growth of 133% compared to Q2FY15. At the end of Q2FY16, our total deferred revenue was $97.9 million, an increase of $47.4 million or 94% from Q2FY15. Our deferred revenue consists primarily of payments received for support and service agreements, which have an average life of approximately three years. |
|
|
|
|
Gross margin was 67.8% in Q2FY16, another record high for us, and an improvement of 40 basis points compared to Q2FY15. Product gross margin in Q2FY16 was 69.3%, almost equivalent to the record high of 69.4% achieved in Q2FY15. Our industry leading product gross margin continues to reflect the efficiencies of our Adaptive Flash platform. |
|
|
|
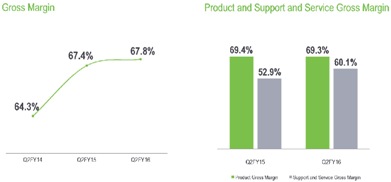
Support and service gross margin in Q2FY16 was at a record high 60.1%, up by 7.2 percentage points from 52.9% in Q2FY15. The expansion in support and service gross margin was driven by increased revenue from our larger base of customers and economies of scale from our support organization, enabled by the automation capabilities of InfoSight.
Non-GAAP Operating Expenses and Margin
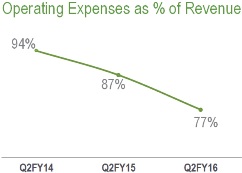
Q2FY16 total operating expenses were $61.5 million or 77% of revenue compared to Q2 last year operating expenses of $47.0 million or 87% of revenue. We ended Q2FY16 with 975 employees on board, an increase of 71 during the quarter. We saw an improvement in overall operating expense leverage by 10 percentage points which was spread across all of our functional areas.
| • Research and development (R&D) spending in Q2FY16 was $17.9 million or 22% of revenue. Leverage improved by 3.2 percentage points compared to Q2FY15 when spending was $13.7 million or 26% of total revenue. Our long-term target for R&D spending is 11% to 13% of total revenue.
• Sales and marketing (S&M) spending in Q2FY16 was $38.5 million or 48% of revenue. Leverage improved by 4 percentage points compared to Q2FY15 spending of $28.0 million or 52% of revenue. Our long-term target for S&M spending is 28% to 31% of total revenue.
• General and administrative (G&A) spending in Q2FY16 was $5.1 million or 6% of revenue. Leverage improved by 3.4 percentage points compared to Q2FY15 spending of $5.3 million or 10% of revenue. Our long-term target for G&A spending is 5% to 6% of total revenue. |
|
|
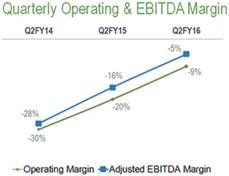
Our Q2FY16 operating loss was $7.2 million, better than our guidance for an operating loss of $8.0 million to $9.0 million, and better than our operating loss of $10.7 million in Q2FY15. Q2FY16 operating margin improved to negative 9% compared to negative 20% in Q2FY15, an improvement of 11 percentage points. Our operating margin improvement was due to mainly operating expense leverage as well as stronger gross margin compared to Q2FY15. Our Adjusted EBITDA was negative $3.9 million or negative 5% of revenue in Q2FY16 compared to negative $8.7 million or negative 16% of revenue in Q2FY15, also an 11 percentage point improvement. |
| |
|
Q2FY16 non-GAAP EPS was a loss of $0.10 per share on approximately 78.2 million weighted average basic and diluted shares outstanding compared to a loss of $0.15 per share in Q2FY15. This was better than our guidance for a loss of $0.11 to $0.12 per share. | ||
|
Balance Sheet and Cash Flow
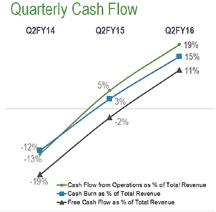
We ended Q2FY16 with cash and cash equivalents of $213.6 million, an increase of $12.1 million during the quarter. Cash Flow from Operations during Q2FY16 was $14.9 million or 19% of revenue compared to $2.8 million or 5% of revenue in Q2FY15. Free Cash Flow during Q2FY16 was $9.0 million or 11% of revenue compared to negative $1.3 million or negative 2% of revenue in Q2FY15.
In Q2FY16, we achieved a cash conversion cycle of 13 days, consistent with Q1FY16 and ahead of our target of 20 days. We ended Q2 with accounts receivables of $43.1 million, a decrease of $1.1 million from Q1FY16. Compared to Q2FY15, our accounts receivables increased by 46%, driven by our revenue growth of 49%. Days sales outstanding (DSO) were 44 days, inside of our target range of 35 to 45 days and was consistent with our Q1FY16 DSO level. We |
|
ended Q2 with inventory of $13.7 million, an increase of 48% from Q2FY15, as we increased our service and demo inventory to support our fast growing installed base of customers and prospects. Days sales in inventory (DSI) were 48 days in Q2FY16, consistent with the prior quarter. Capex spend during Q2FY16 was $5.9 million, or 7% of revenue. For FY16, we expect our total capex spend to be approximately 7% to 9% of total revenue.
Q3FY16 Financial Outlook
Our financial guidance for Q3FY16 is as follows:
| • | Total revenue of $86.0 million to $88.0 million |
| • | Non-GAAP operating loss of $5.0 million to $6.0 million |
| • | Non-GAAP net loss of $0.08 to $0.09 per share, based on weighted average basic shares outstanding of approximately 80 million |
As discussed previously, we remain on track to achieve our goal of non-GAAP operating income break-even by the end of the current fiscal year.
Our financial objectives remain (1) driving strong revenue growth and increasing our market share by growing significantly above the level of overall industry growth, (2) maintaining industry leading gross margins and (3) steadily progressing towards our long term target financial model of 16%-20% operating margin by delivering sequential improvement in operating margin every year.
We want to thank our partners and customers once again for embracing us, our investors for their confidence in us, and our employees for their dedication and flawless execution.
|
Suresh Vasudevan, CEO |
Anup Singh, CFO |


Conference Call Information:
As previously announced, Nimble Storage will host a live question & answer conference call and webcast today at 5:00 p.m. ET (2:00 p.m. PT) to discuss its financial results for the fiscal second quarter 2016. Interested parties may access the call by dialing (888) 455-2238 in the U.S. or (719) 325-2434 from international locations. In addition, a live audio webcast of the conference call will be available on the Nimble Storage Investor Relations website at http://investors.nimblestorage.com. The live webcast will be archived and available on this site for 45 days. A replay of the conference call will be available for 45 days. To access the replay, please dial 888-203-1112 and enter pass code 7056092. Callers outside the U.S. and Canada should dial 719-457-0820 and enter pass code 7056092.
Non-GAAP Financial Measures
To provide investors with additional information regarding our financial results, Nimble Storage has disclosed in this release non-GAAP financial measures that are not calculated in accordance with generally accepted accounting principles in the United States, or GAAP. The Company provides non-GAAP gross margin, non-GAAP operating margin, non-GAAP net loss, non-GAAP net loss per basic and diluted share, free cash flow and adjusted EBITDA. In computing many of these non-GAAP financial measures, the Company excludes the effects of stock-based compensation, which is a recurring expense for the Company. The Company has provided reconciliation below of non-GAAP financial measures to the most directly comparable GAAP financial measures.
The Company discloses these non-GAAP financial measures because they are key measures used by the Company’s management and board of directors to understand and evaluate operating performance and trends, to prepare and approve the annual budget and to develop short-term and long-term operational and compensation plans. In particular, the exclusion of certain expenses in calculating non-GAAP financial measures can provide a useful measure for period-to-period comparisons of the Company’s business. Accordingly, the Company believes that these non-GAAP financial measures provide useful information to investors and others in understanding and evaluating the Company’s operating results in the same manner as the Company’s management and board of directors.
Non-GAAP financial measures have limitations as analytical tools and, as such, should not be considered in isolation or as substitutes for analysis of the Company’s results as reported under GAAP. Some of these limitations are:
| • | Non-GAAP financial measures do not consider the potentially dilutive impact of equity-based compensation, which is an ongoing expense for the Company; and |
| • | Other companies, including companies in our industry, may calculate non-GAAP financial measures differently, which reduces their usefulness as comparative measures. |
Nimble Storage, Inc.
Reconciliation of GAAP to Non-GAAP Financial Measures
(In thousands, except per share amounts)
(Unaudited)
| Three Months Ended July 31, |
Six Months Ended July 31, |
|||||||||||||||
| 2015 | 2014 | 2015 | 2014 | |||||||||||||
| GAAP gross margin |
$ | 52,345 | $ | 35,245 | $ | 98,840 | $ | 65,457 | ||||||||
| Stock-based compensation |
1,964 | 967 | 3,666 | 1,591 | ||||||||||||
|
|
|
|
|
|
|
|
|
|||||||||
| Non-GAAP gross margin |
$ | 54,309 | $ | 36,212 | $ | 102,506 | $ | 67,048 | ||||||||
|
|
|
|
|
|
|
|
|
|||||||||
| GAAP operating margin |
$ | (29,503 | ) | $ | (25,912 | ) | $ | (58,421 | ) | $ | (45,556 | ) | ||||
| Stock-based compensation |
22,321 | 15,169 | 43,306 | 24,726 | ||||||||||||
|
|
|
|
|
|
|
|
|
|||||||||
| Non-GAAP operating margin |
$ | (7,182 | ) | $ | (10,743 | ) | $ | (15,115 | ) | $ | (20,830 | ) | ||||
|
|
|
|
|
|
|
|
|
|||||||||
| GAAP net loss |
$ | (30,109 | ) | $ | (26,117 | ) | $ | (59,095 | ) | $ | (45,712 | ) | ||||
| Stock-based compensation |
22,321 | 15,169 | 43,306 | 24,726 | ||||||||||||
|
|
|
|
|
|
|
|
|
|||||||||
| Non-GAAP net loss |
$ | (7,788 | ) | $ | (10,948 | ) | $ | (15,789 | ) | $ | (20,986 | ) | ||||
|
|
|
|
|
|
|
|
|
|||||||||
| Interest income, net |
(61 | ) | (22 | ) | (129 | ) | (18 | ) | ||||||||
| Provision for income taxes |
288 | 162 | 500 | 318 | ||||||||||||
| Depreciation |
3,626 | 2,070 | 6,938 | 3,828 | ||||||||||||
|
|
|
|
|
|
|
|
|
|||||||||
| Adjusted EBITDA |
$ | (3,935 | ) | $ | (8,738 | ) | $ | (8,480 | ) | $ | (16,858 | ) | ||||
|
|
|
|
|
|
|
|
|
|||||||||
| GAAP net loss per share, basic and diluted |
$ | (0.38 | ) | $ | (0.37 | ) | $ | (0.76 | ) | $ | (0.65 | ) | ||||
| Stock-based compensation |
0.29 | 0.22 | 0.56 | 0.35 | ||||||||||||
|
|
|
|
|
|
|
|
|
|||||||||
| Non-GAAP net loss per share |
$ | (0.10 | ) | $ | (0.15 | ) | $ | (0.20 | ) | $ | (0.30 | ) | ||||
|
|
|
|
|
|
|
|
|
|||||||||
| Shares used to compute GAAP net loss per share, basic and diluted |
78,228 | 71,381 | 77,381 | 70,854 | ||||||||||||
|
|
|
|
|
|
|
|
|
|||||||||
| Shares used to compute Non-GAAP net loss per share |
78,228 | 71,381 | 77,381 | 70,854 | ||||||||||||
|
|
|
|
|
|
|
|
|
|||||||||
Forward-Looking Statements
This press release contains “forward-looking” statements that are based on our management’s beliefs and assumptions and on information currently available to management. We intend for such forward-looking statements to be covered by the safe harbor provisions for forward-looking statements contained in the U.S. Private Securities Litigation Reform Act of 1995. Forward-looking statements include all statements other than statements of historical fact contained in this letter, including information concerning our future financial results, product benefits, business plans strategy and objectives, potential growth drivers and opportunities, competitive position, industry trends and environment and potential market opportunities.
Forward-looking statements are subject to known and unknown risks, uncertainties, assumptions and other factors including, but not limited to, those related to our future financial performance which is inherently uncertain, unforeseen delays in product development or introduction, uncertainty around market acceptance of our solutions, our ability to increase sales of our solutions, our ability to attract and retain customers and to selling additional solutions to our existing customers, our ability to develop new solutions and bring them to market in a timely manner, pricing pressure (as a result of competition or otherwise), introduction of new technologies and products by other companies, our ability to maintain, protect and enhance our brand and intellectual property, the effectiveness of our channel partners and sales team, our ability to recruit new or keep our existing key talent, global economic conditions and fluctuations in foreign currency rates and our ability to continue to expand our business and manage our growth. Moreover, we operate in very competitive and rapidly changing environments, and new risks may emerge from time to time. It is not possible for our management to predict all risks, nor can we assess the impact of all factors on our business or the extent to which any factor, or combination of factors, may cause actual results to differ materially from those contained in any forward-looking statements we may make. Further information on these and other factors that could affect our financial results are included in our filings with the Securities and Exchange Commission, and may cause our actual results, performance or achievements to differ materially and adversely from those anticipated or implied by our forward-looking statements.
You should not rely upon forward-looking statements as predictions of future events. Although our management believes that the expectations reflected in our forward-looking statements are reasonable, we cannot guarantee that the future results, levels of activity, performance or events and circumstances described in the forward-looking statements will be achieved or occur. Moreover, neither we, nor any other person, assume responsibility for the accuracy and completeness of the forward-looking statements. We undertake no obligation to publicly update any forward-looking statements for any reason after the date of this presentation to conform these statements to actual results or to changes in our expectations, except as required by law.
Any unreleased services, features or functions whether referenced in this document, Nimble Storage’s website or other press releases or public statements that are not currently available are subject to change at Nimble Storage’s discretion and may not be delivered as planned or at all. Customers who purchase Nimble Storage’s products and services should make their purchase decisions based upon services, features and functions that are currently available.
“Customer” or “Customers” referenced above are Nimble Storage’s end customers. It is Nimble Storage’s practice to identify an end-customer from our channel partners prior to shipment and before any support and services are provided. Products are typically shipped directly to the end-customers of our channel partners. Assuming all other revenue recognition criteria have been met, Nimble Storage generally recognizes product revenue on sales upon shipment, as title and risk of loss are transferred at that time. Nimble Storage recognizes revenue from support and service contracts over the contractual service period.
Nimble Storage, the Nimble Storage logo, CASL, InfoSight, SmartStack, and NimbleConnect are trademarks or registered trademarks of Nimble Storage. Other trade names or words used in this document are the properties of their respective owners.
Press Contact:
Kristalle Cooks
408-314-3313
kristalle@nimblestorage.com
Investor Relations Contact:
Edelita Tichepco
408-514-3379
IR@nimblestorage.com