Attached files
| file | filename |
|---|---|
| 8-K - FORM 8-K - ASB Bancorp Inc | v419001_8k.htm |

Investor Presentation August 25, 2015 NASDAQ | ASBB Exhibit 99.1

This presentation, as well as other written communications made from time to time by the Company and its subsidiaries and oral communications made from time to time by authorized officers of the Company, may contain statements relating to the future results of the Company (including certain projections and business trends) that are considered “forward - looking statements” as defined in the Private Securities Litigation Reform Act of 1995 (the PSLRA). Such forward - looking statements may be identified by the use of such words as “believe,” “expect,” “anticipate,” “should,” “targets,” “planned,” “under consideration,” “estimated,” “intend,” “potential” and similar expressions. For these statements, the Company claims the protection of the safe harbor for forward - looking statements contained in the PSLRA. The Company cautions you that a number of important factors could cause actual results to differ materially from those currently anticipated in any forward - looking statement. Such factors include, but are not limited to: prevailing economic and geopolitical conditions; changes in interest rates, loan demand, real estate values and competition; changes in accounting principles, policies, and guidelines; changes in any applicable law, rule, regulation or practice with respect to tax or legal issues; and other economic, competitive, governmental, regulatory and technological factors affecting the Company’s operations, pricing, products and services and other factors that may be described in the Company’s annual report on Form 10 - K and quarterly reports on Form 10 - Q as filed with the Securities and Exchange Commission. The forward - looking statements are made as of the date of this presentation, and, except as may be required by applicable law or regulation, the Company assumes no obligation to update the forward - looking statements or to update the reasons why actual results could differ from those projected in the forward - looking statements. NASDAQ | ASBB Forward - Looking Statements | 2

» Solid Franchise in Attractive Market Area » Significant Improvement in Key Performance Metrics » Key Performance Indicator Targets Summarize Expectation of Continued Improvement » Significant Additional Cost Reductions Planned » Implementing Long - Term Strategic Plan to Achieve Sustainable Superior Performance NASDAQ | ASBB Investment Highlights | 3

Solid Franchise in Attractive Market Area NASDAQ | ASBB | 4

» Headquartered in Asheville, North Carolina » Community bank founded in 1936 with total assets of $783 million » 13 offices in 5 Western North Carolina counties » 159 full - time equivalent employees » Converted from the mutual form of ownership on October 11, 2011 NASDAQ | ASBB ASBB Profile | 5

NASDAQ | ASBB Executive Management | 6 Role Years in Banking Suzanne DeFerie President & Chief Executive Officer 23+ Kirby Tyndall Executive Vice President & Chief Financial Officer 26+ David Kozak Executive Vice President & Chief Credit Officer 31+ Vikki Bailey Executive Vice President & Chief Retail Officer 39+ Combined Management Team Experience 119+
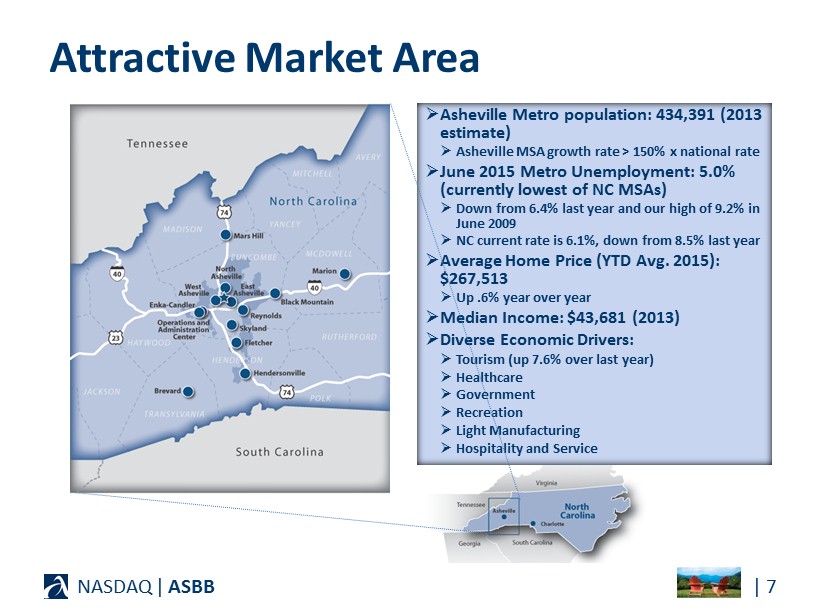
| 7 NASDAQ | ASBB Attractive Market Area » Asheville Metro population: 434,391 (2013 estimate) » Asheville MSA growth rate > 150% x national rate » June 2015 Metro Unemployment: 5.0% (currently lowest of NC MSAs) » Down from 6.4% last year and our high of 9.2% in June 2009 » NC current rate is 6.1%, down from 8.5% last year » Average Home Price (YTD Avg. 2015): $267,513 » Up .6% year over year » Median Income: $43,681 (2013) » Diverse Economic Drivers: » Tourism (up 7.6% over last year) » Healthcare » Government » Recreation » Light Manufacturing » Hospitality and Service

Asheville lagged at the onset of the recession and lagged in the recovery. Recession Years 2009 - 2012: » North Carolina recession impact was more pronounced in the mountains and coastal areas » Three bank failures in Asheville, NC during the timeframe » Bank and real estate fraud cases in the local headlines » Real estate de - valuations as high as 30 - 50% for land and commercial properties » Construction of all types was halted » Unemployment reached a high of 9.2% in Asheville MSA in 2009 » Little to no loan demand; high loan default rates » Tourism slowed NASDAQ | ASBB Local Market Economy | 8
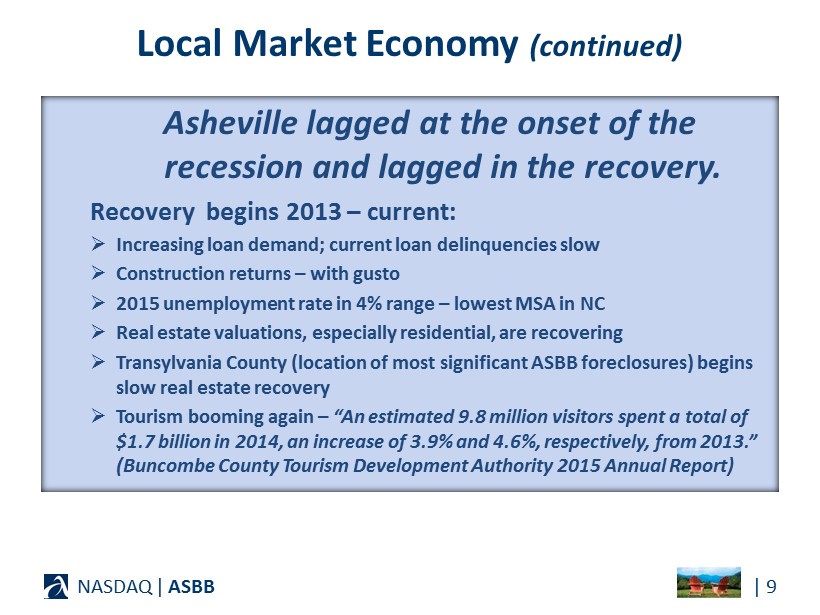
Asheville lagged at the onset of the recession and lagged in the recovery. Recovery begins 2013 – current: » Increasing loan demand; current loan delinquencies slow » Construction returns – with gusto » 2015 unemployment rate in 4% range – lowest MSA in NC » Real estate valuations, especially residential, are recovering » Transylvania County (location of most significant ASBB foreclosures) begins slow real estate recovery » Tourism booming again – “An estimated 9.8 million visitors spent a total of $1.7 billion in 2014, an increase of 3.9% and 4.6%, respectively, from 2013.” (Buncombe County Tourism Development Authority 2015 Annual Report) NASDAQ | ASBB Local Market Economy (continued) | 9

NASDAQ | ASBB Deposit Market Share – June 30, 2014 | 10 Institution # Br Deposits ($ millions) Market Share Institution # Br Deposits ($ millions) Market Share First Citizens Bank 1 22 $ 1,730 24.7% United Cmty (GA) 4 $ 135 1.9% Wells Fargo Bank (SD) 18 1,412 20.2% Capital Bank (FL) 4 126 1.8% Asheville Savings 13 596 8.5% Carolina Alliance (SC) 2 124 1.8% TD Bank (DE) 9 491 7.0% Fifth Third Bank (OH) 4 84 1.2% Bank of America 11 470 6.7% First Bank 4 82 1.2% SunTrust Bank (GA) 11 444 6.3% Bank of N Carolina 3 78 1.1% HomeTrust Bank 6 434 6.2% Black Mtn Savings 1 31 0.4% BB&T 8 380 5.4% Woodforest Natl (TX) 3 4 0.1% PNC Bank (DE) 8 198 2.8% Capital Bank (MD) 2 1 4 0.1% Macon Bank 3 183 2.6% Institutions: 19 135 $ 7,006 100.0% Markets are Buncombe, Henderson, Madison, McDowell & Transylvania Counties 1 Includes Mountain 1 st acquisition. 2 Includes Pisgah Community assumption. Source: FDIC Summary of Deposit Data

$0 $500 $1,000 $1,500 $2,000 June 30, 2013 June 30, 2014 Column1 NASDAQ | ASBB | 11 Markets are Buncombe, Henderson, Madison, McDowell & Transylvania Counties June 30 ($ millions) Deposit Market Share – 2013 vs. 2014 Source: FDIC Deposit Market Share Data

As of June 30, 2015 NASDAQ Global Market ASBB Closing price $21.66 Book value per share $21.96 Price to book value 98.6% Shares outstanding 4,378,411 shares Shares repurchased (Jan 1, 2013 ‒ Jun 30, 2015) 1,207,740 shares NASDAQ | ASBB Stock Information | 12

NASDAQ | ASBB Change in Stock Price | 13 -5.00% 0.00% 5.00% 10.00% 15.00% 20.00% 25.00% 30.00% Trailing Twelve Months ASBB (20.97%) SNL U.S. Bank $500M-$1B (8.39%) SNL U.S. Thrift $500M-$1B (18.73%) Source: SNL Financial

Significant Improvements in Key Performance Metrics NASDAQ | ASBB | 14

NASDAQ | ASBB Balance Sheet — Loans Grew | 15 $500.0 $432.9 $387.7 $449.2 $521.8 $553.0 $340 $390 $440 $490 $540 2010 2011 2012 2013 2014 Q2-2015 December 31 ($ millions) 6M +6% +16% +15% » Solid track record of loan growth

NASDAQ | ASBB Balance Sheet — Core Deposits | 16 $332.4 $349.7 $389.1 $405.7 $449.3 $473.7 $300 $325 $350 $375 $400 $425 $450 $475 2010 2011 2012 2013 2014 2015-Q2 December 31 ($ millions) » Solid track record of low cost core deposit growth to support Net Interest Margin 6M +5% +10% +4% +11% Nonint DDA 6M +17% Cml DDA 6M +15%

NASDAQ | ASBB Balance Sheet — C ommercial C ore D eposits | 17 $58.4 $71.4 $85.3 $95.2 $121.6 $140.2 $50 $75 $100 $125 $150 2010 2011 2012 2013 2014 2015-Q2 December 31 ($ millions) +15% +28% » Commercial deposits believed to be much less rate sensitive than retail deposits

NASDAQ | ASBB Balance Sheet — Improved Asset Quality | 18 $13.4 $20.6 $1.2 $1.2 $2.7 $2.9 $10.7 $8.1 $19.4 $14.2 $8.8 $9.4 3.21% 3.63% 2.74% 2.10% 1.51% 1.57% 0.25% 0.75% 1.25% 1.75% 2.25% 2.75% 3.25% 3.75% $0 $5 $10 $15 $20 $25 $30 $35 2010 2011 2012 2013 2014 Q2-2015 Nonperforming Assets, December 31 ($ millions) Foreclosed Properties Nonperforming Loans Nonperforming Assets as % of Assets (right scale) NPAs down $16.4 million from peak
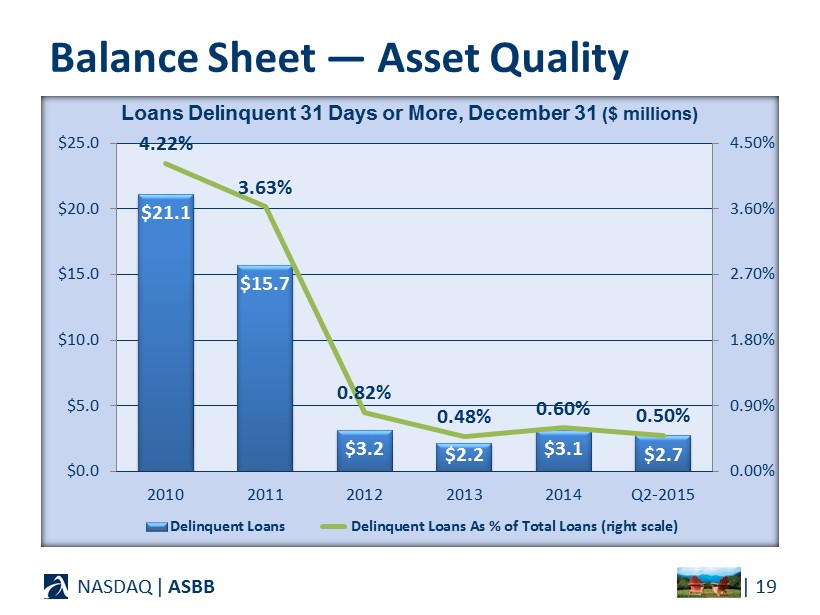
NASDAQ | ASBB Balance Sheet — Asset Quality | 19 $21.1 $15.7 $3.2 $2.2 $3.1 $2.7 4.22% 3.63% 0.82% 0.48% 0.60% 0.50% 0.00% 0.90% 1.80% 2.70% 3.60% 4.50% $0.0 $5.0 $10.0 $15.0 $20.0 $25.0 2010 2011 2012 2013 2014 Q2-2015 Delinquent Loans Delinquent Loans As % of Total Loans (right scale) Loans Delinquent 31 Days or More, December 31 ($ millions)

$0.23 $0.17 $0.31 $0.59 $0.37 $0.00 $0.10 $0.20 $0.30 $0.40 $0.50 $0.60 $0.70 2010* 2011 2012 2013 2014 2015-Q2 YTD Diluted Earnings Per Share NASDAQ | ASBB Improvement in Core Performance | 20 Earnings Per Share, Year Ended December 31 * Converted to a stock savings bank from a mutual savings bank on October 11, 2011. 6M

NASDAQ | ASBB Performance — TBVPS | 21 $20.69 $19.97 $20.06 $21.56 $21.96 $19.50 $20.00 $20.50 $21.00 $21.50 $22.00 $22.50 2010* 2011 2012 2013 2014 2015-Q2 December 31 * Converted to a stock savings bank from a mutual savings bank on October 11, 2011. » TBVPS enhanced by both earnings increases and share repurchases

$1,187 $862 $1,454 $2,489 $1,487 ($1,000) $0 $1,000 $2,000 2010* 2011 2012 2013 2014 2015-Q2 YTD NASDAQ | ASBB | 22 $(9,458) * 2010 not to scale because of large loss Net Income, Year Ended December 31 ($ thousands) Improvement in Core Performance 6M

NASDAQ | ASBB | 23 4.54% 4.00% 3.37% 3.31% 3.37% 3.46% 1.79% 1.38% 1.09% 0.75% 0.64% 0.63% 2.96% 2.80% 2.50% 2.72% 2.87% 2.99% 0.00% 0.50% 1.00% 1.50% 2.00% 2.50% 3.00% 3.50% 4.00% 4.50% 5.00% 2010 2011 2012 2013 2014 2015-Q2 YTD Earning Asset Yield Cost of Funds Net Interest Margin Earning Asset Yield, Cost of Funds and Net Interest Margin Year Ended December 31 Improvement in Core Performance
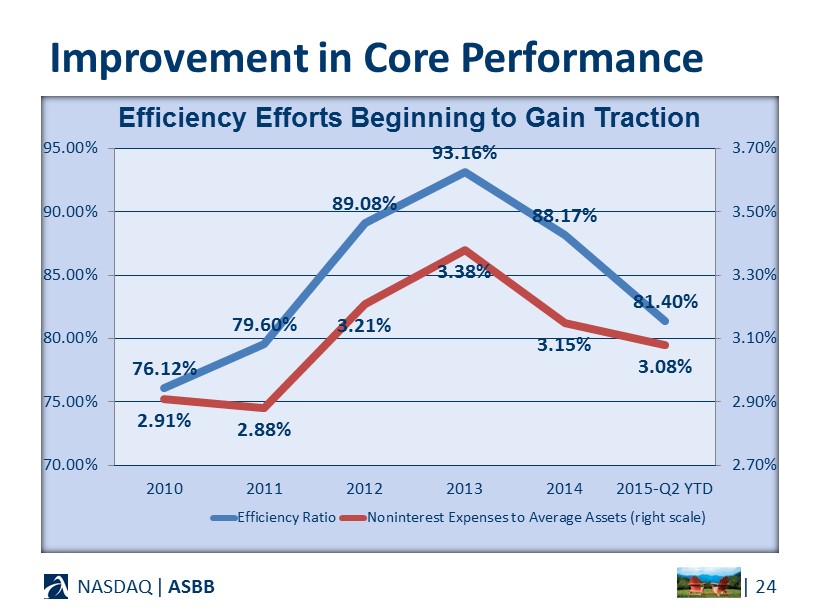
NASDAQ | ASBB | 24 76.12% 79.60% 89.08% 93.16% 88.17% 81.40% 2.91% 2.88% 3.21% 3.38% 3.15% 3.08% 2.70% 2.90% 3.10% 3.30% 3.50% 3.70% 70.00% 75.00% 80.00% 85.00% 90.00% 95.00% 2010 2011 2012 2013 2014 2015-Q2 YTD Efficiency Ratio Noninterest Expenses to Average Assets (right scale) Efficiency Efforts Beginning to Gain Traction Improvement in Core Performance

Key Performance Indicator Targets Summarize Expectation of Continued Improvement NASDAQ | ASBB | 25

NASDAQ | ASBB | 26 KPI 2013 Full - Year Actual 2014 Full - Year Actual 2015 Q2 - YTD Actual* 2015 Full - Year Target 2016 Full - Year Target 2017 Full - Year Target 2018 Full - Year Target Earnings growth 68.7% 71.2% 10.6% 40% - 50% 60% - 70% 25% - 35% 15% - 25% Return on equity 1.37% 2.51% 3.11% 3.7% - 4.2% 5.8% - 6.5% 7.2% - 8.0% 8.1% - 9.0% Return on assets 0.19% 0.33% 0.39% 0.4% - 0.5% 0.6% - 0.8% 0.8% - 1.0% 1.0% - 1.1% Efficiency 93.16% 88.17% 81.40% 72% - 82% 63% - 73% 58% - 68% 54% - 64% Net interest margin 2.72% 2.87% 2.99% 2.9% - 3.1% 3.1% - 3.3% 3.4% - 3.5% 3.5% - 3.6% Loan growth 15.9% 16.2% 17.2% 9% - 13% 8% - 12% 5% - 9% 2% - 7% Asset growth ‒ 2.2% 3.7% 3.8% 5% - 9% 4% - 8% 0% - 4% 3% - 7% Deposit growth ‒1.0% 5.3% 5.3% 6% - 10% 4% - 8% 4% - 8% 4% - 8% Core deposit** growth 4.3% 10.7% 9.6% 10% - 14% 5% - 9% 5% - 9% 5% - 9% Key Performance Indicator (KPI) Targets Targets * Growth rates Y - O - Y comparing June 30 YTD ** Core deposits are total deposits excluding time deposits Targets do not include effects of any potential acquisitions

Significant Additional Cost Reductions Planned NASDAQ | ASBB | 27

Significant Additional Cost Reductions Planned NASDAQ | ASBB | 28 ($ in thousands, except per share amounts) Impact On 2015 Full - Year Target 2016 Full - Year Target 2017 Full - Year Target 2018 Full - Year Target PLANNED (included in targets) FHLB debt interest ($40M matures 2017; $10M matures 2018) Pre - tax After - tax 1 Per share 2 $ 1,965 $ 1,232 $ 0.31 $ 1,970 $ 1,235 $ 0.30 $ 862 $ 540 $ 0.13 $ 263 $ 165 $ 0.04 UNDER CONSIDERATION (not included in targets) Pension expense (most of settlement accounting included in AOCI) Pre - tax After - tax 1 Per share 2 $ 877 $ 550 $ 0.14 $ 877 $ 550 $ 0.14 $ 877 $ 550 $ 0.14 $ 877 $ 550 $ 0.14 1 Assumes a 37.3% combined marginal Federal and state income tax rate. 2 Assumes 4 million average shares outstanding.

Implementing Long - Term Strategic Plan to Achieve Sustainable Superior Performance NASDAQ | ASBB | 29

Strategic Vision: (3 Primary Focus Areas) » Focus: Commercial and Small Business Relationships for improved NIM » Focus: Mortgage Banking for improved Fee Income and NIM » Focus: Increased Efficiencies and Productivity, including further reduction of nonperforming assets, for improved expense ratio s NASDAQ | ASBB Implementing Long - Term Strategic Plan to Achieve Sustainable, Superior Performance | 30
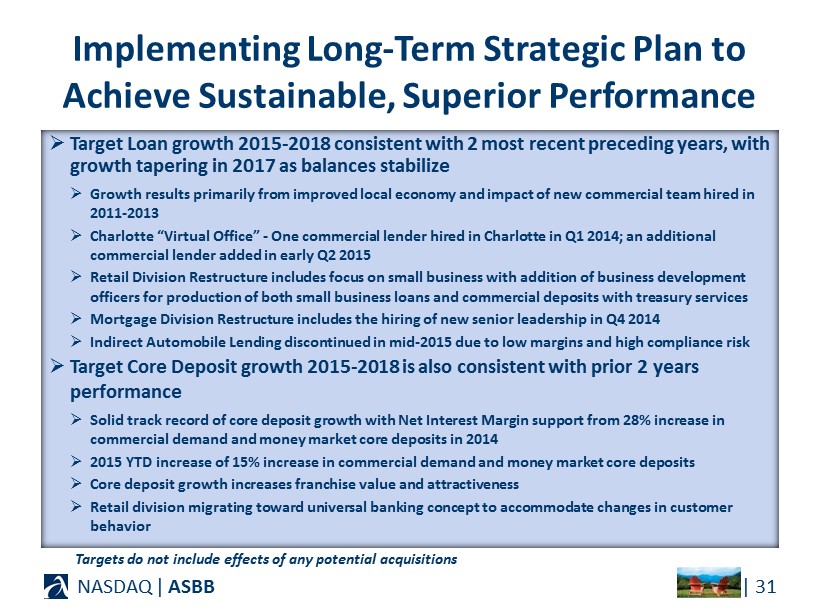
» Target Loan growth 2015 - 2018 consistent with 2 most recent preceding years, with growth tapering in 2017 as balances stabilize » Growth results primarily from improved local economy and impact of new commercial team hired in 2011 - 2013 » Charlotte “Virtual Office” - One commercial lender hired in Charlotte in Q1 2014; an additional commercial lender added in early Q2 2015 » Retail Division Restructure includes focus on small business with addition of business development officers for production of both small business loans and commercial deposits with treasury services » Mortgage Division Restructure includes the hiring of new senior leadership in Q4 2014 » Indirect Automobile Lending discontinued in mid - 2015 due to low margins and high compliance risk » Target Core Deposit growth 2015 - 2018 is also consistent with prior 2 years performance » Solid track record of core deposit growth with Net Interest Margin support from 28% increase in commercial demand and money market core deposits in 2014 » 2015 YTD increase of 15% increase in commercial demand and money market core deposits » Core deposit growth increases franchise value and attractiveness » Retail division migrating toward universal banking concept to accommodate changes in customer behavior NASDAQ | ASBB | 31 Implementing Long - Term Strategic Plan to Achieve Sustainable, Superior Performance Targets do not include effects of any potential acquisitions
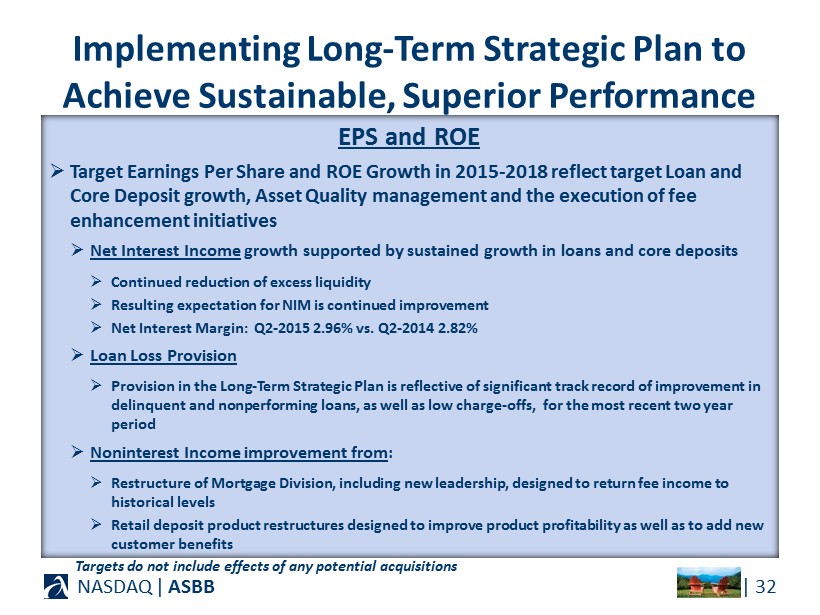
EPS and ROE » Target Earnings Per Share and ROE Growth in 2015 - 2018 reflect target Loan and Core Deposit growth, Asset Quality management and the execution of fee enhancement initiatives » Net Interest Income growth supported by sustained growth in loans and core deposits » Continued reduction of excess liquidity » Resulting expectation for NIM is continued improvement » Net Interest Margin: Q2 - 2015 2.96% vs. Q2 - 2014 2.82% » Loan Loss Provision » Provision in the Long - Term Strategic Plan is reflective of significant track record of improvement in delinquent and nonperforming loans, as well as low charge - offs, for the most recent two year period » Noninterest Income improvement from : » Restructure of Mortgage Division, including new leadership, designed to return fee income to historical levels » Retail deposit product restructures designed to improve product profitability as well as to add new customer benefits NASDAQ | ASBB | 32 Implementing Long - Term Strategic Plan to Achieve Sustainable, Superior Performance Targets do not include effects of any potential acquisitions

EPS and ROE (continued) » Earnings per Share and ROE Growth in 2015 - 2018 improved from Expense Management as well as prudent Capital Management » Noninterest Expense stabilized from: » 5% reduction in overall headcount (net of increases in new lending positions) resulting from process efficiencies and retail staff realignment » Core processing and telecom contracts renegotiated in 2014 for future cost savings » Ongoing research for full termination of Defined Benefit Pension Plan (see impact on “Cost Reductions Under Consideration” slide) » With proven track record of 22% Stock Repurchases during 2013 - 201 4 ( Q1 2015 announced new 5% repurchase ) , ASB Board will actively consider additional buybacks for prudent capital management to increase shareholder value » Track record of comparable earnings growth rate in most recent 2 years » Earnings lift from continued loan and deposit growth (see targets on “KPI Targets” slide) » Impact of buybacks NASDAQ | ASBB | 33 Implementing Long - Term Strategic Plan to Achieve Sustainable, Superior Performance Targets do not include effects of any potential acquisitions

» The ASBB board of directors is very optimistic about the long - term opportunities for Asheville Savings Bank and the results we can provide to our shareholders in the long - term. » Asheville is a community that embraces the “doing business locally” concept and an investment in ASB Bancorp fits nicely with this philosophy. » We are an almost 80 year old bank and our board of directors believes in the long - term success that ASBB can achieve as an important member of the local business community. NASDAQ | ASBB Implementing Long - Term Strategic Plan to Achieve Sustainable, Superior Performance | 34
» Solid Franchise in Attractive Market Area » Significant Improvement in Key Performance Metrics » Key Performance Indicator Targets Summarize Expectation of Continued Improvement » Significant Additional Cost Reductions Planned » Implementing Long - Term Strategic Plan to Achieve Sustainable Superior Performance NASDAQ | ASBB Investment Highlights | 35
Appendix NASDAQ | ASBB | 36

NASDAQ | ASBB Balance Sheet — Assets | 37 Cash $53.0m (7%) Securities $138.7m (18%) Loans HFS $8.2m (1%) Loans, net $553.0m (71%) Fore - closures $9.4m (1%) Other $21.0m (3%) Composition, As of June 30, 2015 ($ millions) » Loans are largest earning asset category » Represent 71% of assets » Grew 6% during 2015 YTD

NASDAQ | ASBB Balance Sheet — Loans | 38 Cml Const $27.2m (5%) Cml Mtg $212.8m (38%) Cml & Ind $17.2m (3%) Res Const $16.2m (3%) Res Mtg $173.9m (31%) Revolv Mtg $61.7m (11%) Consumer $44.5m (8%) Composition, As of June 30, 2015 ($ millions) » Commercial loans » 46% of total loans » Grew 7.7% 2015 YTD » Diversified portfolio » Mortgage loans » 45% of total loans » Most fixed rate loans sold in secondary market » Grew 3.5% 2015 YTD » Very low speculative construction loans

NASDAQ | ASBB Balance Sheet — Liabilities & Equity | 39 Core Deposits $473.7m (60%) Time Deposits $150.3m (19%) Debt $50.2m (6%) Other Liabilities $12.9m (2%) Equity $96.2m (12%) Composition, As of June 30, 2015 ($ millions) » Core deposits are largest funding category » Represent 60% of assets » Grew 5.4% 2015 YTD » Low brokered time deposits » Low debt

NASDAQ | ASBB Balance Sheet — Deposits | 40 Demand $114.0 18% NOW $150.8 24% Savings $46.4 8% Money Market $162.4 26% CDs $150.3 24% Composition, As of June 30, 2015 ($ millions) * ASBB defines core deposits as demand, savings and money market deposits and excludes all certificates of deposits — retail , jumbo and brokered. » Core deposits are largest funding category » Represent 59% of assets » 5.4% increase 2015 YTD » Low brokered time deposits Core Deposits * $473.6 76%

$7,468 $7,422 $9,456 $8,034 $6,333 $3,578 $6,670 $6,024 $6,266 $7,164 $6,122 $3,379 $0 $1,000 $2,000 $3,000 $4,000 $5,000 $6,000 $7,000 $8,000 $9,000 $10,000 2010 2011 2012 2013 2014 2015-Q2 YTD Noninterest Income Excluding Securities Gains NASDAQ | ASBB Income Statement Trends | 41 Noninterest Income, Year Ended December 31 ($ thousands) 6M

$22,096 $22,071 $25,092 $25,394 $23,548 $11,782 $20,316 $20,497 $22,062 $23,548 $23,398 $11,782 $0 $5,000 $10,000 $15,000 $20,000 $25,000 $30,000 2010 2011 2012 2013 2014 2015-Q2 YTD Noninterest Expense Excluding FHLB Prepayments & Foreclosed Property Valuation Adjustments NASDAQ | ASBB Income Statement Trends | 42 Noninterest Expenses, Year Ended December 31 ($ thousands) 6M

NASDAQ | ASBB | 43 Item 2010 2011 2012 2013 2014 2015 Q2 - YTD Noninterest income (GAAP) $ 7,468 $ 7,422 $ 9,456 $ 8,034 $ 6,333 $ 3,578 Less: Securities gains (798) (1,398) (3,190) (870) (211) (199) Noninterest income excluding securities gains (non - GAAP) $ 6,670 $ 6,024 $ 6,266 $ 7,164 $ 6,122 $ 3,379 Noninterest expense (GAAP) $ 22,096 $ 22,071 $ 25,092 $ 25,394 $ 23,548 $ 11,782 Less: FHLB prepayment penalties ‒ ‒ (1,722) ‒ ‒ ‒ Less: Foreclosed property valuation adjustments (1,780) (1,574) (1,308) (1,846) (150) ‒ Noninterest expense excluding FHLB prepayment penalties and foreclosed property valuation adjustments (non - GAAP) $ 20,316 $ 20,497 $ 22,062 $ 23,548 $ 23,398 $ 11,782 Reconciliation of Non - GAAP to GAAP Items

NASDAQ | ASBB Inquiries may be directed to : Suzanne DeFerie, President & Chief Executive Officer Kirby Tyndall, Executive Vice President & Chief Financial Officer