Attached files
| file | filename |
|---|---|
| 10-K - ANNUAL REPORT - CLOROX CO /DE/ | clorox_10k.htm |
| EX-32 - CERTIFICATION OF THE CHIEF EXECUTIVE OFFICER AND CHIEF FINANCIAL OFFICER - CLOROX CO /DE/ | exhibit32.htm |
| EX-21 - SUBSIDIARIES - CLOROX CO /DE/ | exhibit21.htm |
| EX-23 - CONSENT OF INDEPENDENT REGISTERED PUBLIC ACCOUNTING FIRM - CLOROX CO /DE/ | exhibit23.htm |
| EX-99.3 - RECONCILIATION OF ECONOMIC PROFIT - CLOROX CO /DE/ | exhibit99-3.htm |
| EX-31.1 - CERTIFICATION OF THE CHIEF EXECUTIVE OFFICER - CLOROX CO /DE/ | exhibit31-1.htm |
| EX-99.2 - VALUATION AND QUALIFYING ACCOUNTS AND RESERVES - CLOROX CO /DE/ | exhibit99-2.htm |
| EX-10.9 - FORM OF PERFORMANCE SHARE AWARD AGREEMENT - CLOROX CO /DE/ | exhibit10-9.htm |
| EX-31.2 - CERTIFICATION OF THE CHIEF FINANCIAL OFFICER - CLOROX CO /DE/ | exhibit31-2.htm |
Exhibit 99.1
MANAGEMENT’S DISCUSSION
AND ANALYSIS OF FINANCIAL CONDITION AND
RESULTS OF
OPERATIONS
The Clorox
Company
(Dollars in
millions, except per share amounts)
Management’s Discussion and Analysis of Financial Condition and Results of Operations (MD&A) is designed to provide a reader of The Clorox Company’s (the Company or Clorox) financial statements with a narrative from the perspective of management on the Company’s financial condition, results of operations, liquidity and certain other factors that may affect future results. In certain instances, parenthetical references are made to relevant sections of the Notes to Consolidated Financial Statements to direct the reader to a further detailed discussion. This section should be read in conjunction with the Consolidated Financial Statements and Supplementary Data included in this Annual Report on Form 10-K.
The following sections are included herein:
| ● |
Executive
Overview |
| ● |
Results of Operations
|
| ● |
Financial Position and
Liquidity |
| ● |
Contingencies
|
| ● |
Quantitative and
Qualitative Disclosures about Market Risk |
| ● |
Recently Issued
Accounting Pronouncements |
| ● |
Critical Accounting
Policies and Estimates |
| ● |
Summary of Non-GAAP Financial Measures |
EXECUTIVE OVERVIEW
Clorox is a leading multinational manufacturer and marketer of consumer and professional products with approximately 7,700 employees worldwide as of June 30, 2015 and fiscal year 2015 net sales of $5,655. Clorox sells its products primarily through mass retail outlets, e-commerce channels, wholesale distributors and medical supply distributors. Clorox markets some of the most trusted and recognized consumer brand names, including its namesake bleach and cleaning products, Pine-Sol® cleaners, Liquid-Plumr® clog removers, Poett® home care products, Fresh Step® cat litter, Glad® bags, wraps and containers, Kingsford® charcoal, Hidden Valley® dressings and sauces, Brita® water-filtration products and Burt’s Bees® natural personal care products. The Company also markets brands through professional services channels, including infection control products for the healthcare industry under Clorox Healthcare®, HealthLink®, Aplicare® and Dispatch® brands. The Company manufactures products in more than a dozen countries and markets them in more than 100 countries.
The Company primarily markets its leading brands in midsized categories considered to be financially attractive. Most of the Company’s products compete with other nationally advertised brands within each category and with “private label” brands.
As discussed more fully below under “Venezuela Discontinued Operations,” the Company’s Venezuela affiliate, Corporación Clorox de Venezuela S.A. (Clorox Venezuela), discontinued its operations effective September 22, 2014. The Company has reclassified the financial results of Clorox Venezuela as a discontinued operation in the consolidated financial statements for all periods presented herein.
1
The Company operates through strategic business units that are aggregated into four reportable segments: Cleaning, Household, Lifestyle and International.
| ● |
Cleaning consists of
laundry, home care and professional products marketed and sold in the
United States. Products within this segment include laundry additives,
including bleach products under the Clorox® brand and Clorox
2® stain fighter and color booster; home care products,
primarily under the Clorox®, Formula 409®,
Liquid-Plumr®, Pine-Sol®, S.O.S® and
Tilex® brands; naturally derived products under the Green
Works® brand; and professional cleaning and disinfecting
products under the Clorox®, Dispatch®,
Aplicare®, HealthLink® and Clorox
Healthcare® brands. |
| ● |
Household consists
of charcoal, cat litter and plastic bags, wraps and container products
marketed and sold in the United States. Products within this segment
include plastic bags, wraps and containers under the Glad®
brand; cat litter products under the Fresh Step®, Scoop
Away® and Ever Clean® brands; and charcoal products
under the Kingsford® and Match Light®
brands. |
| ● |
Lifestyle consists
of food products, water-filtration systems and filters and natural
personal care products marketed and sold in the United States. Products
within this segment include dressings and sauces, primarily under the
Hidden Valley®, KC Masterpiece® and Soy
Vay® brands; water-filtration systems and filters under the
Brita® brand; and natural personal care products under the
Burt’s Bees® brand. |
| ● |
International consists of products sold outside the United States. Products within this segment include laundry, home care, water-filtration, charcoal and cat litter products, dressings and sauces, plastic bags, wraps and containers and natural personal care products, primarily under the Clorox®, Glad®, PinoLuz®, Ayudin®, Limpido®, Clorinda®, Poett®, Mistolin®, Lestoil®, Bon Bril®, Brita®, Green Works®, Pine-Sol®, Agua Jane®, Chux®, Kingsford®, Fresh Step®, Scoop Away®, Ever Clean®, KC Masterpiece®, Hidden Valley® and Burt’s Bees® brands. |
Non-GAAP Financial Measures
This Executive Overview, the succeeding sections of MD&A and Exhibit 99.3 include certain financial measures that are not defined by accounting principles generally accepted in the United States of America (U.S. GAAP). These measures, which are referred to as non-GAAP measures, are listed below.
| ● |
Currency-neutral net
sales growth |
| ● |
Economic profit
(EP) |
| ● |
Free cash flow and
free cash flow as a percentage of net sales |
| ● |
Earnings from
continuing operations before interest and taxes (EBIT) margin (the ratio
of EBIT to net sales) |
| ● |
Debt to earnings from continuing operations before interest, taxes, depreciation and amortization, and noncash intangible asset impairment charges ratio (Consolidated Leverage ratio) |
For a discussion of these measures and the reasons management believes they are useful to investors, refer to “Summary of Non-GAAP Financial Measures” below. For a discussion of the Consolidated Leverage ratio, please refer to “Senior Notes and Credit Arrangements” below. This MD&A and Exhibit 99.3 include reconciliations of these non-GAAP measures to the most directly comparable financial measures calculated and presented in accordance with U.S. GAAP.
2
Fiscal Year 2015 Financial Highlights
A detailed discussion of strategic goals, key initiatives and results of operations is included below. Key fiscal year 2015 financial results are summarized as follows:
| ● |
The Company delivered
diluted net earnings per share from continuing operations in fiscal year
2015 of $4.57, an increase of approximately 4% from fiscal year 2014
diluted net earnings per share of $4.39. |
| ● |
The Company’s fiscal
year 2015 net sales increased by 3%, from $5,514 in fiscal year 2014 to
$5,655 in fiscal year 2015, reflecting the benefit of price increases and
higher volume, partially offset by unfavorable foreign currency exchange
rates. On a currency-neutral basis, net sales increased
5%. |
| ● |
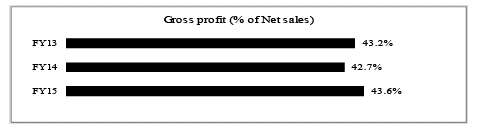
Gross margin increased
90 basis points to 43.6% in fiscal year 2015 from 42.7% in fiscal year
2014, reflecting the benefits of cost savings and price increases, partially offset by the impact of higher manufacturing and
logistics costs. |
| ● |
The Company reported
earnings from continuing operations of $606 in fiscal year 2015, compared
to $579 in fiscal year 2014. |
| ● |
EP increased to $458 in
fiscal year 2015 compared to $423 in fiscal year 2014 (refer to the
reconciliation of EP to earnings from continuing operations before income
taxes in Exhibit 99.3). |
| ● |
The Company’s net cash
flows provided by continuing operations were $858 in fiscal year 2015,
compared to $786 in fiscal year 2014. Free cash flow was $733 or 13% of
net sales in fiscal year 2015, an increase from $649 or 12% of net sales
in fiscal year 2014. |
| ● |
The Company returned $385 in cash dividends to stockholders in fiscal year 2015 compared to $368 in cash dividends in fiscal year 2014. In May 2015, the Company announced an increase of 4% in the quarterly cash dividend. In fiscal year 2015, the Company repurchased approximately 4 million shares of its common stock at a cost of approximately $434. |
Venezuela Discontinued Operations
On September 22, 2014, Clorox Venezuela announced that it was discontinuing its operations, effective immediately, and seeking to sell its assets. Since fiscal year 2012, Clorox Venezuela was required to sell more than two thirds of its products at prices frozen by the Venezuelan government. During this same period, Clorox Venezuela experienced successive years of hyperinflation resulting in significant sustained increases in its input costs, including packaging, raw materials, transportation and wages. As a result, Clorox Venezuela had been selling its products at a loss, resulting in ongoing operating losses. Clorox Venezuela repeatedly met with government authorities in an effort to help them understand the rapidly declining state of the business, including the need for immediate, significant and ongoing price increases and other critical remedial actions to address these adverse impacts. Based on the Venezuelan government’s representations, Clorox Venezuela had expected significant price increases would be forthcoming much earlier; however, the price increases subsequently approved were insufficient and would have caused Clorox Venezuela to continue operating at a significant loss into the foreseeable future. As such, Clorox Venezuela was no longer financially viable and was forced to discontinue its operations.
On September 26, 2014, the Company reported that Venezuelan Vice President Jorge Arreaza announced, with endorsement by President Nicolás Maduro, that the Venezuelan government had occupied the Santa Lucía and Guacara production facilities of Clorox Venezuela. On November 6, 2014, the Company reported that the Venezuelan government had published a resolution granting a government-sponsored Special Administrative Board full authority to restart and operate the business of Clorox Venezuela, thereby reaffirming the government's expropriation of Clorox Venezuela’s assets. Further, President Nicolás Maduro announced the government's intention to facilitate the resumed production of bleach and other cleaning products at Clorox Venezuela plants. He also announced his approval of a financial credit to invest in raw materials and production at the plants. These actions by the Venezuelan government were taken without the consent or involvement of Clorox Venezuela, its parent Clorox Spain S.L. (Clorox Spain) or any of their affiliates. Clorox Venezuela, Clorox Spain and their affiliates reserved their rights under all applicable laws and treaties.
3
Strategic Goals and Initiatives
The Clorox Company’s 2020 Strategy serves as its strategic growth plan, directing the Company to the highest value opportunities for long-term, profitable growth and strong stockholder returns.
The long-term financial goals reflected in the Company’s 2020 Strategy include annual net sales growth of 3-5%, market share growth, annual EBIT margin growth between 25-50 basis points and annual free cash flow as a percentage of net sales of about 10-12%. Clorox anticipates using free cash flow to invest in the business, maintain appropriate debt levels and return excess cash to stockholders.
In fiscal year 2016, Clorox anticipates certain continuing challenges to impact its sales and margins, including unfavorable foreign currency exchange rates, particularly in Argentina, and a continuation of slowing international economies. In addition, the Company is monitoring changes to commodities costs and managing rising logistics costs. The Company’s priority in fiscal year 2016 is to continue investing strongly in its U.S. business, particularly in its “3D” demand-creation model of Desire, Decide and Delight, including advertising and consumer promotion, as well as trade promotion in order to drive category and market share growth. The Company is also focused on product innovation that will continue to delight and deliver superior value to consumers. Importantly, the Company anticipates supporting its margins by reducing exposure to inflation in its products and operations, continuing to slow the growth of selling and administrative expenses by driving out low-value activity and rebuilding margin in its international businesses.
As the Company executes its 2020 Strategy, a particular focus on “Strategy Accelerators,” will help drive investment decisions – with the goal to deliver profitable growth:
| ● |
Accelerating portfolio momentum takes advantage of tailwinds in faster-growing categories and brands in the
portfolio by directing more demand investment to those categories and brands. |
| ● |
Accelerating 3D technology transformation addresses the shift in how today’s consumers research, shop and
buy their products. The Company is investing in digital marketing and social media and focused on driving its e-commerce business. |
| ● |
Accelerating innovation
across the Company’s demand-creation model of
Desire, Decide and Delight will continue to support category growth and market
share improvement. In particular, the Company is focused on delivering superior value to
consumers through the introduction of new products and product
improvements. |
| ● |
Accelerating the Company’s growth culture encourages Clorox employees to be even more consumer-centric and focus on driving out low-value activity and delivering growth for the Company as they conduct their day-to-day activities. |
Looking forward, the Company will continue to execute against its 2020 Strategy and seek to achieve its goals to deliver long-term profitable growth.
RESULTS OF OPERATIONS
Unless otherwise noted, management’s discussion and analysis compares results of continuing operations from fiscal year 2015 to fiscal year 2014, and fiscal year 2014 to fiscal year 2013, with percentage and basis point calculations based on rounded numbers, except as noted.
4
CONSOLIDATED RESULTS
Continuing operations

Net sales in fiscal year 2015 increased 3%. Volume increased 2%, reflecting higher product shipments in the International segment, primarily due to growth in Latin America, Canada, Europe and Asia; higher shipments of Burt’s Bees® natural personal care products, largely due to innovation in lip and face care products combined with distribution gains; higher shipments of cleaning and healthcare products in the professional products business; higher shipments of Clorox® toilet bowl cleaner due to increased merchandising activities and distribution gains; and higher shipments of Kingsford® charcoal products behind increased merchandising support to launch the start of the grilling season. Volume results also reflected lower shipments of Clorox® liquid bleach due to the February 2015 price increase, category softness and increased competition; and lower shipments of Brita® water-filtration products, primarily due to continuing category softness and increased competition. The variance between volume and net sales was primarily due to the benefit of price increases, partially offset by unfavorable foreign currency exchange rates. On a currency-neutral basis, net sales increased about 5%.
Net sales in fiscal year 2014 remained essentially flat. Volume increased 0.6%, reflecting higher shipments of cleaning and healthcare products in the professional products business; higher shipments of charcoal products, primarily behind strong merchandising activities and improved weather conditions; higher shipments of Clorox® liquid bleach, driven by product innovation; and higher shipments of Hidden Valley® dry and bottled salad dressings, primarily due to continued category growth and increased merchandising activity. These increases were partially offset by lower shipments due to heightened competitive activity in the disinfecting wipes category, including the distribution loss of Clorox® disinfecting wipes at a major club customer; and lower shipments of Glad® trash bags, primarily due to a price increase in the second half of the fiscal year. The variance between volume and net sales was primarily due to unfavorable foreign currency exchange rates, partially offset by the benefit of price increases. On a currency-neutral basis, net sales increased about 2%.
5
Gross profit increased 5% in fiscal year 2015, from $2,356 to $2,465, and gross margin, defined as gross profit as a percentage of net sales, increased 90 basis points from 42.7% to 43.6%. Gross margin expansion in fiscal year 2015 was driven by the benefits of cost savings and price increases, partially offset by the impact of higher manufacturing and logistics costs.
Gross profit decreased 1% in fiscal year 2014, from $2,391 to $2,356, and gross margin decreased 50 basis points from 43.2% to 42.7%. Gross margin decline in fiscal year 2014 was driven by higher manufacturing and logistics costs, including the impact of continued inflation in Argentina, and higher commodity costs. These factors were partially offset by the benefits of cost savings and price increases.
Expenses
| % Change | % of Net sales | |||||||||||||||||||||||
| 2015 | 2014 | 2013 | 2015 to 2014 |
2014 to 2013 |
2015 | 2014 | 2013 | |||||||||||||||||
| Selling and administrative expenses | $ | 798 | $ | 751 | $ | 793 | 6 | % | (5 | ) % | 14.1 | % | 13.6 | % | 14.3 | % | ||||||||
| Advertising costs | 523 | 503 | 498 | 4 | 1 | 9.2 | 9.1 | 9.0 | ||||||||||||||||
| Research and development costs | 136 | 125 | 130 | 9 | (4 | ) | 2.4 | 2.3 | 2.3 | |||||||||||||||
Selling and administrative expenses increased 6% in fiscal year 2015, primarily from higher performance-based incentive costs as a result of fiscal year financial performance exceeding financial targets. Expenses in the prior year reflected lower performance-based incentive costs when the Company’s results fell below financial targets. In addition, the Company continued to experience inflationary pressures in international markets. These increases were partially offset by the benefit of cost savings, one-time costs in fiscal year 2014 related to the change in information technology (IT) service providers and a one-time impact related to a change in the Company’s long-term disability plan in fiscal year 2015 to bring it more in line with the marketplace.
Selling and administrative expenses decreased 5% in fiscal year 2014, primarily driven by lower performance-based incentive costs, cost savings and a comparison to one-time costs associated with an IT systems implementation in Latin America incurred in fiscal year 2013. These decreases were partially offset by one-time costs related to the transition to new IT service providers in fiscal year 2014.
Advertising costs as a percentage of net sales increased slightly during fiscal year 2015, reflecting continued support behind the Company’s brands, including driving the trial of new products. The Company’s U.S. retail advertising spend was approximately 10% of net sales during the year.
Advertising costs as a percentage of net sales increased slightly during fiscal year 2014, reflecting an increase in spending across our U.S. retail and international markets.
6
Research and development costs increased slightly as a percentage of net sales in fiscal year 2015, driven by higher performance-based incentive costs.
Research and development costs were flat as a percentage of net sales in fiscal year 2014, and were impacted by lower performance-based incentive costs.
Interest expense, other income, net, and the effective tax rate on earnings
| 2015 | 2014 | 2013 | ||||||||||
| Interest expense | $ | 100 | $ | 103 | $ | 122 | ||||||
| Other income, net | (13 | ) | (10 | ) | (4 | ) | ||||||
| Income taxes on continuing operations | 315 | 305 | 279 | |||||||||
Interest expense decreased $3 in fiscal year 2015, primarily due to a lower weighted-average interest rate on long-term debt resulting from the issuance of senior notes in December 2014 and the maturities of senior notes in January 2015, combined with less interest expense on a lower balance of commercial paper throughout fiscal year 2015.
Interest expense decreased $19 in fiscal year 2014, primarily due to a lower weighted-average interest rate on long-term debt resulting from the issuance of senior notes in September 2012 and the maturities of senior notes in October 2012 and March 2013.
Other income, net, of $(13) in fiscal year 2015 included $(14) of income from equity investees, $(13) gain on the sale of real estate assets by a low-income housing partnership and $(4) of interest income, partially offset by $9 of foreign currency exchange losses, $8 of amortization of trademarks and other intangible assets and $3 of noncash asset impairment charges.
Other income, net, of $(10) in fiscal year 2014 included $(13) of income from equity investees, $(5) of insurance and litigation settlements and other smaller items, partially offset by $8 of amortization of trademarks and other intangible assets and $3 of noncash asset impairment charges.
7
Other income, net, of $(4) in fiscal year 2013 included $(12) of income from equity investees, $(4) from gains on fixed asset sales, net and $(4) of a gain on the sale of real estate assets by a low-income housing partnership, partially offset by $9 of amortization of trademarks and other intangible assets and $8 of foreign currency exchange losses.
The effective tax rate on earnings was 34.2%, 34.6% and 32.7% in fiscal years 2015, 2014 and 2013, respectively. The lower effective tax rate in fiscal year 2015 compared to fiscal year 2014 was primarily due to higher uncertain tax position releases, partially offset by higher tax on foreign earnings, in the current period. The higher effective tax rate in fiscal year 2014 compared to fiscal year 2013 was primarily due to favorable tax settlements in fiscal year 2013 and higher tax on foreign earnings in fiscal year 2014.
Diluted net earnings per share
| % Change | ||||||||||
| 2015 | 2014 | 2013 | 2015 to 2014 |
2014 to 2013 | ||||||
| Diluted net earnings per share from continuing operations | $ 4.57 | $ 4.39 | $ 4.31 | 4 % | 2 % | |||||
Diluted net earnings per share (EPS) from continuing operations increased $0.18 in fiscal year 2015, driven by the benefits of higher sales and gross margin expansion, partially offset by increased selling and administrative expenses, primarily from higher performance-based incentive costs as a result of fiscal year financial performance exceeding financial targets. Expenses in the prior year reflected lower performance-based incentive costs when the Company’s results fell below financial targets. Increased investments in total demand-building programs also reduced fiscal year diluted EPS.
Diluted net earnings per share from continuing operations increased $0.08 in fiscal year 2014, driven by the benefits of cost savings, price increases and lower performance-based incentive costs, reflecting significantly lower year-over-year payouts, as well as lower interest expense. These factors were partially offset by higher manufacturing and logistics costs, higher commodity costs, increased investments in total demand-building programs, unfavorable foreign currency exchange rates and a higher effective tax rate.
Discontinued Operations
In addition to the $49 recognized in the fiscal year ended June 30, 2015, the Company believes it is reasonably possible that it will recognize $11 to $21 in after-tax exit costs and other related expenses in discontinued operations for Clorox Venezuela during fiscal years 2016 through 2019, for a total of $60 to $70 over the entire five-year period. Of this total, the Company believes $0 to $5 will be after-tax cash expenditures. Further significant changes to the exchange rate used for financial reporting purposes, among many other external factors, could have a significant impact on the above estimated costs.
See Notes to Consolidated Financial Statements for more information regarding discontinued operations of Clorox Venezuela.
In the fiscal year ended June 30, 2015, the Company recognized $32 of previously unrecognized tax benefits relating to other discontinued operations upon the expiration of the applicable statute of limitations. Recognition of these previously disclosed tax benefits had no impact on the Company’s cash flows or earnings from continuing operations for the fiscal year ended June 30, 2015.
8
SEGMENT RESULTS FROM CONTINUING OPERATIONS
The following presents the results from continuing operations of the Company’s reportable segments and certain unallocated costs reflected in Corporate (see Notes to Consolidated Financial Statements for a reconciliation of segment results to consolidated results):
Cleaning
| % Change | ||||||||||||||
| 2015 | 2014 | 2013 | 2015 to 2014 |
2014 to 2013 | ||||||||||
| Net sales | $ | 1,824 | $ | 1,776 | $ | 1,783 | 3 | % | - | % | ||||
| Earnings from continuing operations before income taxes | 445 |
428 | 420 | 4 | 2 | |||||||||
Fiscal year 2015 versus fiscal year 2014: Volume, net sales and earnings from continuing operations before income taxes increased by 2%, 3% and 4%, respectively, during fiscal year 2015. Both volume and net sales grew primarily due to higher shipments of Clorox® toilet bowl cleaner and Clorox® disinfecting wipes in Home Care, behind increased merchandising activities. The Professional Products Division also grew volume, which was driven primarily by distribution gains across a number of brands. These increases were partially offset by lower shipments of Clorox® liquid bleach in Laundry, primarily due to the February 2015 price increase. Net sales growth outpaced volume growth primarily due to the benefit of price increase. The increase in earnings from continuing operations before income taxes was driven by the benefit of sales growth and cost savings, partially offset by an increase in demand-building investments.
Fiscal year 2014 versus fiscal year 2013: Net sales were flat and earnings from continuing operations before income taxes increased 2%, while volume decreased 1% during fiscal year 2014. Volume in the Cleaning segment decreased driven by lower shipments due to heightened competitive activity in the disinfecting wipes category, including the distribution loss of Clorox® disinfecting wipes at a major club customer. These decreases were partially offset by higher shipments of cleaning and healthcare products in the professional products business, and higher shipments of Clorox® liquid bleach driven by product innovation. The variance between net sales and volume was primarily due to the benefit of price increases and other smaller items, partially offset by higher trade-promotion spending. The increase in earnings from continuing operations before income taxes was driven by cost savings, primarily related to the Company’s conversion to concentrated bleach in fiscal year 2013; lower performance-based incentive costs; and various manufacturing and other efficiencies. These increases were partially offset by increased commodity costs, primarily resin; incremental demand-building investments; and other individually smaller items.
Household
| % Change | ||||||||||||||
| 2015 | 2014 | 2013 | 2015 to 2014 |
2014 to 2013 | ||||||||||
| Net sales | $ | 1,794 | $ | 1,709 | $ | 1,693 | 5 | % | 1 | % | ||||
| Earnings from continuing operations before income taxes | 375 | 326 | 336 | 15 | (3 | ) | ||||||||
Fiscal year 2015 versus fiscal year 2014: Volume, net sales and earnings from continuing operations before income taxes increased by 2%, 5% and 15%, respectively, during fiscal year 2015. Both volume growth and net sales growth were driven by higher shipments of Kingsford® charcoal products behind increased merchandising activities. Net sales growth outpaced volume growth primarily due to the benefits of price increases on Glad® bags and wraps. The increase in earnings from continuing operations before income taxes was driven by strong sales growth and the benefit of cost savings, partially offset by an increase in demand building investments and manufacturing and logistics costs.
9
Fiscal year 2014 versus fiscal year 2013: Net sales and volume both increased 1%, while earnings from continuing operations before income taxes decreased 3% during fiscal year 2014. The increase in the volume in the Household segment was driven by higher shipments of Kingsford® charcoal products due to strong merchandising activities and improved weather conditions, partially offset by lower shipments of Glad® trash bags, primarily due to a price increase in the second half of fiscal year 2014. The decrease in earnings from continuing operations before income taxes was driven by higher commodity costs, primarily resin, higher manufacturing and logistics costs, including one-time supply chain costs in order to meet strong customer demand for charcoal products, and other individually smaller items. These decreases were partially offset by cost savings, higher net sales and lower performance-based incentive costs.
Lifestyle
| % Change | ||||||||||||||
| 2015 | 2014 | 2013 | 2015 to 2014 |
2014 to 2013 | ||||||||||
| Net sales | $ | 950 | $ | 936 | $ | 929 | 1 | % | 1 | % | ||||
| Earnings from continuing operations before income taxes | 257 | 258 | 259 | - | - | |||||||||
Fiscal year 2015 versus fiscal year 2014: Net sales and volume both increased by 1%, while earnings from continuing operations before income taxes remained flat during fiscal year 2015. Both net sales growth and volume growth were driven by higher shipments of Burt’s Bees® natural personal care products, largely due to innovation in lip and face care products combined with distribution gains. The increase was partially offset by lower shipments of Brita® water-filtration products, primarily due to continuing category softness and increased competition. Flat earnings from continuing operations before income taxes reflected lower commodity costs, cost savings and favorable product mix. These increases were offset by higher manufacturing and logistics costs and demand building investments.
Fiscal year 2014 versus fiscal year 2013: Net sales and volume both increased 1%, while earnings from continuing operations before income taxes remained flat during fiscal year 2014. Volume in the Lifestyle segment increased, driven by higher shipments of Hidden Valley® dry and bottled salad dressings, primarily due to continued category growth and increased merchandising activity, and higher shipments of Burt’s Bees® natural personal care products, driven by product innovation in lip and face care products. These increases were partially offset by lower shipments of Brita® water-filtration products, primarily due to increased private-label competition and category softness, and decreased merchandising activities. Flat earnings from continuing operations before income taxes reflected higher demand-building investments, primarily driven by increased advertising and sales promotion expenses in support of Burt’s Bees® natural personal care products, and other individually smaller items, offset by cost savings, primarily related to various manufacturing and other efficiencies and lower performance-based incentive costs.
International
| % Change | ||||||||||||||
| 2015 | 2014 | 2013 | 2015 to 2014 |
2014 to 2013 | ||||||||||
| Net sales | $ | 1,087 | $ | 1,093 | $ | 1,128 | (1 | ) % | (3 | ) % | ||||
| Earnings from continuing operations before income taxes | 79 | 99 | 95 | (20 | ) | 4 | ||||||||
10
Fiscal year 2015 versus fiscal year 2014: Volume increased 3%, while net sales and earnings from continuing operations before income taxes decreased 1% and 20%, respectively, during fiscal year 2015. Volume grew primarily due to higher shipments in Latin America, Canada, Europe and Asia. Volume growth outpaced net sales growth primarily due to unfavorable foreign currency exchange rates, partially offset by the benefit of price increases and favorable product mix. The decrease in earnings from continuing operations before income taxes was primarily driven by unfavorable foreign currency exchange rates and inflation across multiple countries, primarily in Argentina (see “Argentina” below), which resulted in higher selling and administrative expenses, higher manufacturing and logistics costs and higher commodity costs. These decreases in earnings were partially offset by the benefit of price increases, favorable product mix and cost savings.
Fiscal year 2014 versus fiscal year 2013: Net sales decreased 3%, while volume and earnings from continuing operations before income taxes increased 2% and 4%, respectively, during fiscal year 2014. Volume in the International segment increased driven by higher shipments in Peru, Asia, the Middle East, Europe and Argentina, partially offset by lower shipments in Australia and Colombia. The variance between net sales and volume was primarily due to unfavorable foreign currency exchange rates, partially offset by the benefit of price increases and favorable product mix. While International segment net sales decreased during fiscal year 2014, excluding the negative foreign currency impact of 10%, segment sales grew about 7%. The increase in earnings from continuing operations before income taxes was primarily due to the benefit of price increases; cost savings, primarily related to various manufacturing and other efficiencies; favorable product mix; one-time costs incurred in fiscal year 2013 associated with an IT systems implementation in Latin America and lower performance-based incentive costs. These increases were partially offset by unfavorable foreign currency exchange rates, primarily in Argentina; higher manufacturing and logistics and other supply chain costs and higher selling and administrative costs, both factors mainly driven by continued inflation in Latin America; higher commodity costs, primarily resin; and increased advertising and sales promotion costs, primarily in Latin America. Also impacting fiscal year 2014 results were noncash tax deductible impairment charges on trademark values.
Argentina
The operating environment in Argentina presents business challenges, including price controls on some of the Company’s products, a devaluing currency and inflation. Although Argentina is not currently designated as a highly inflationary economy for accounting purposes, further volatility and declines in the exchange rate are expected. For the fiscal years ended June 30, 2015, 2014 and 2013, the official value of the Argentine peso (ARS) declined 10%, 34% and 16%, respectively, as compared to the U.S. dollar.
Net sales from the Company’s Argentine subsidiary represented approximately 4%, 3% and 4% of the Company’s consolidated net sales for each of the fiscal years ended June 30, 2015, 2014 and 2013, respectively. As such, and notwithstanding any actions the Company may undertake in the market in the event of further devaluations, significant future declines in the Argentine currency as compared to the U.S. dollar in the range of up to 50% or more, for example, could have a material impact on the Company’s total reported net sales and net earnings.
Further devaluations of the Argentine peso could also increase the risk for impairment of intangible assets and goodwill. As of June 30, 2015, using an exchange rate of 9.1 ARS per USD, the Company’s Argentine subsidiary had total assets of $100, including cash and cash equivalents of $35, net receivables of $18, inventories of $19, net property, plant and equipment of $19 and intangible assets excluding goodwill of $4. Goodwill for Argentina is aggregated and assessed for impairment at the Latin America reporting unit level, which is a component of the Company’s International segment. Based on the results of the annual impairment test performed in the fourth quarter of fiscal year 2015, the fair value of the Latin America reporting unit exceeded its recorded value by more than 79% and reflected the Company’s expectations of continued challenges from the Argentina business consistent with the Company’s current long-range projections.
The Company is closely monitoring developments in Argentina and is taking steps intended to mitigate the adverse conditions, but there can be no assurances that these actions will mitigate these conditions.
11
Corporate
| % Change | |||||||||||||||||
| 2015 | 2014 | 2013 | 2015 to 2014 |
2014 to 2013 | |||||||||||||
| Losses from continuing operations before income taxes | $ | (235 | ) | $ | (227 | ) | $ | (258 | ) | 4 | % | (12 | ) % | ||||
Corporate includes certain non-allocated administrative costs, interest income, interest expense and other non-operating income and expenses. Corporate assets include cash and cash equivalents, property and equipment, other investments and deferred taxes.
Fiscal year 2015 versus fiscal year 2014: The increase in losses from continuing operations before income taxes was primarily due to higher performance-based incentive costs as a result of fiscal year financial performance exceeding financial targets, compared to the prior year which reflected lower performance-based incentive costs when the Company’s results fell below financial targets. This factor was partially offset by cost savings, a gain on the sale of real estate assets by a low-income housing partnership and benefits from a change in the Company’s long-term disability plan to bring it more in line with the marketplace.
Fiscal year 2014 versus fiscal year 2013: The decrease in losses from continuing operations before income taxes was primarily due to lower interest expense and lower performance-based incentive costs in fiscal year 2014. These factors were partially offset by one-time costs related to the transition to new IT service providers in fiscal year 2014, higher wages and employee benefit costs in fiscal year 2014 and the gain recorded upon the sale-leaseback of the Company’s Oakland, Calif., general office building in fiscal year 2013.
FINANCIAL POSITION AND LIQUIDITY
Management’s discussion and analysis of the Company’s financial position and liquidity describes its consolidated operating, investing and financing activities from continuing operations, contractual obligations and off-balance sheet arrangements.
The following table summarizes cash activities from continuing operations for the years ended June 30:
| 2015 | 2014 | 2013 | |||||||||
| Net cash provided by operations | $ | 858 | $ | 786 | $ | 780 | |||||
| Net cash used for investing activities | (106 | ) | (137 | ) | (51 | ) | |||||
| Net cash used for financing activities | (696 | ) | (592 | ) | (685 | ) | |||||
The Company’s cash position includes amounts held by foreign subsidiaries and, as a result, the repatriation of certain cash balances from some of the Company’s foreign subsidiaries could result in additional tax costs in excess of tax benefits. Additionally, as of June 30, 2015 the Company’s Argentine subsidiary held cash and cash equivalents of $35, with no government-approved mechanism to convert local currency into U.S. dollars, which restricts the Company's ability to repatriate these funds. However, these cash balances held by foreign subsidiaries are generally available without legal restriction to fund local business operations.
12
In addition, a portion of the Company’s cash balance is held in U.S. dollars by foreign subsidiaries, whose functional currency is their local currency. Such U.S. dollar balances are reported on the foreign subsidiaries’ books, in their functional currency, with the impact from foreign currency exchange rate differences recorded in other income, net. The Company’s cash holdings at June 30 were as follows:
| 2015 | 2014 | 2013 | ||||||
| U.S. dollar balances held by U.S. dollar functional currency subsidiaries and at parent | $ | 221 | $ | 180 | $ | 130 | ||
| Non-U.S. dollar balances held by non-U.S. dollar functional currency subsidiaries | 142 | 132 | 115 | |||||
| U.S. dollar balances held by non-U.S. dollar functional currency subsidiaries | 19 | 12 | 36 | |||||
| Non-U.S. dollar balances held by U.S. dollar functional currency subsidiaries | - | 5 | 18 | |||||
| Total | $ | 382 | $ | 329 | $ | 299 | ||
The Company’s total cash balance was $382 as of June 30, 2015, as compared to $329 as of June 30, 2014. The increase of $53 was primarily attributable to $858 of net cash provided by continuing operations, $495 of net proceeds from the December 2014 long-term debt issuance and $251 of proceeds from the issuance of common stock for employee stock plans. These increases were partially offset by $575 of repayments of long-term debt, $434 of share repurchases, $385 of dividend payments, $125 of capital expenditures and $48 of repayments of commercial paper borrowings.
The Company’s total cash balance was $329 as of June 30, 2014, as compared to $299 as of June 30, 2013. The increase of $30 was primarily attributable to $786 of net cash provided by continuing operations and $96 of proceeds from the issuance of common stock for employee stock plans, partially offset by $368 of dividend payments, $260 of share repurchases, $137 of capital expenditures and $60 of repayments of commercial paper borrowings.
As of June 30, 2015, total current assets exceeded total current liabilities by $24, and as of June 30, 2014, total current liabilities exceeded total current assets by $243. The year-over-year change was primarily attributable to $575 of current maturities of long-term debt, which matured in January 2015, partially offset by current maturities of long-term debt of $300 maturing in November 2015. The Company anticipates that the debt repayment will be made with a combination of debt refinancing and the use of operating cash flows.
Operating Activities
Net cash provided by continuing operations increased to $858 in fiscal year 2015 from $786 in fiscal year 2014. The increase reflects the company’s fiscal year performance, including solid net sales growth and margin expansion. Other contributing factors include lower performance-based incentive payments related to the company's fiscal year 2014 performance and lower tax payments in the current period, as well as the initial funding of the company's non-qualified deferred compensation plan in the year-ago period. These benefits were partially offset by $25 in payments to settle interest-rate hedges related to the company's issuance of long-term debt in December 2014.
Net cash provided by continuing operations increased to $786 in fiscal year 2014 from $780 in fiscal year 2013. The increase was primarily due to favorable changes in working capital and higher earnings, partially offset by higher tax payments and the company’s funding of liabilities under certain nonqualified deferred compensation plans in fiscal year 2014.
13
Investing Activities
Capital expenditures were $125, $137 and $190, respectively, in fiscal years 2015, 2014 and 2013. Capital spending as a percentage of net sales was 2.2%, 2.5% and 3.4% for fiscal years 2015, 2014 and 2013, respectively. The relatively flat fiscal year 2015 capital spending as a percentage of net sales was due to prudent management of capital spending against manufacturing, technology and facility projects which meet growth, efficiency, replacement or compliance requirements. The decrease in fiscal year 2014 capital spending as a percentage of net sales was driven by prior-period investments in the Company’s Pleasanton, Calif., research and office facility and IT systems implementation in Latin America.
In April 2015, a low-income housing partnership, in which the Company was a limited partner, sold its real estate holdings. The real property sale resulted in $15 in cash proceeds from investing activities and a gain of $14 recorded to other income, net, on the consolidated statement of earnings for the year ended June 30, 2015. The sale is also expected to result in approximately $8 of cash income tax payments that will be paid in the first quarter of fiscal year 2016 and reflected as operating activities in the condensed consolidated statement of cash flows for the three months ended September 30, 2015.
In fiscal year 2013, the Company completed sale-leaseback transactions under which it sold its general office building in Oakland, Calif., and former Technical and Data Center in Pleasanton, Calif., to unrelated parties for combined net proceeds of $135. The Company entered into operating lease agreements with the respective buyers for portions of the buildings for up to 15 years, all of which contain renewal options.
Free cash flow
| 2015 | 2014 | 2013 | |||||||||
| Net cash provided by continuing operations | $ | 858 | $ | 786 | $ | 780 | |||||
| Less: capital expenditures | (125 | ) | (137 | ) | (190 | ) | |||||
| Free cash flow | $ | 733 | $ | 649 | $ | 590 | |||||
| Free cash flow as a percentage of net sales | 13.0 | % | 11.8 | % | 10.7 | % | |||||
Free cash flow as a percentage of net sales increased in fiscal year 2015, primarily due to higher net cash provided by continuing operations and lower capital expenditures.
Free cash flow as a percentage of net sales increased in fiscal year 2014, primarily due to lower capital expenditures.
14
Financing Activities
Capital Resources and Liquidity
Net cash used for financing activities was $696 in fiscal year 2015, as compared to $592 in fiscal year 2014. Net cash used for financing activities was higher in fiscal year 2015 due to a net reduction in long-term debt and an increase in share repurchases and dividends paid. These factors were partially offset by an increase in proceeds from the issuance of common stock for employee stock plans.
Net cash used for financing activities was $592 in fiscal year 2014, as compared to $685 in fiscal year 2013. Net cash used for financing activities was higher in fiscal year 2013 due to repayment of company borrowings following the Company’s sale-leaseback transactions under which it sold its general office building in Oakland, Calif., and former Technical and Data Center in Pleasanton, Calif. This factor was partially offset by an increase in share repurchases and higher dividends paid in fiscal year 2014.
Senior Notes and Credit Arrangements
In January 2015, $575 of the Company’s senior notes with an annual fixed interest rate of 5.00% became due and were repaid using the net proceeds from the December 2014 debt issuance and commercial paper borrowings.
In December 2014, under a shelf registration statement filed with the SEC that will expire in December 2017, the Company issued $500 of senior notes with an annual fixed interest rate of 3.50%. Interest on the notes is payable semi-annually in June and December and the notes have a maturity date of December 15, 2024. The notes carry an effective interest rate of 4.10%, which includes the impact from the settlement of interest rate forward contracts in December 2014 (see Notes to Consolidated Financial Statements). The notes rank equally with all of the Company’s existing senior indebtedness.
In March 2013, $500 in senior notes with an annual fixed interest rate of 5.00% became due and were repaid. The repayment was funded in part with commercial paper borrowings and in part with a portion of the proceeds from the sale-leaseback transaction of the Company’s Oakland, Calif., general office building.
In October 2012, $350 in senior notes with an annual fixed interest rate of 5.45% became due and were repaid. The repayment was funded with a portion of the proceeds from the September 2012 issuance of $600 in senior notes with an annual fixed interest rate of 3.05%, payable semi-annually in March and September, and a maturity date of September 15, 2022. The remaining proceeds from the September 2012 issuance were used to repay commercial paper. The September 2012 notes were issued under the Company’s shelf registration statement filed in November 2011 and rank equally with all of the Company’s existing senior indebtedness.
As of June 30, 2015, the Company had a $1,100 revolving credit agreement (the Credit Agreement), which expires in October 2019. The Credit Agreement replaced a prior $1,100 revolving credit agreement in place since May 2012. There were no borrowings under the Credit Agreement as of June 30, 2015 or 2014, and the Company believes that borrowings under the Credit Agreement are and will continue to be available for general corporate purposes. The agreement includes certain restrictive covenants and limitations. The primary restrictive covenant is a maximum ratio of total debt to earnings before interest, taxes, depreciation and amortization and intangible asset impairment (Consolidated EBITDA) for the trailing four quarters (Consolidated Leverage ratio), as defined and described in the Credit Agreement, of 3.50.
15
The following table sets forth the calculation of the Consolidated Leverage ratio as of June 30, using Consolidated EBITDA for the trailing four quarters, as contractually defined:
| 2015 | ||
| Earnings from continuing operations | $ | 606 |
| Add back: | ||
| Interest expense | 100 | |
| Income tax expense | 315 | |
| Depreciation and amortization | 169 | |
| Noncash intangible asset impairment charges | 3 | |
| Deduct: | ||
| Interest income | 4 | |
| Consolidated EBITDA | $ | 1,189 |
| Total debt | $ | 2,191 |
| Consolidated Leverage ratio | 1.84 | |
The Company is in compliance with all restrictive covenants and limitations in the credit agreement as of June 30, 2015, and anticipates being in compliance with all restrictive covenants for the foreseeable future. The Company continues to monitor the financial markets and assess its ability to fully draw on its revolving credit agreement, and currently expects that any drawing on the agreement will be fully funded.
The Company had $29 of foreign and other credit lines as of June 30, 2015; $4 was outstanding and the remainder of $25 was available for borrowing.
Based on the Company’s working capital requirements, anticipated ability to generate positive cash flows from operations in the future, investment-grade credit ratings, demonstrated access to long- and short-term credit markets and current borrowing availability under credit agreements, the Company believes it will have the funds necessary to meet its financing requirements and other fixed obligations as they become due. Should the Company undertake other transactions requiring funds in excess of its current cash levels and available credit lines, it would consider the issuance of additional debt or other securities to finance acquisitions, repurchase shares, refinance debt or fund other activities for general business purposes. The Company’s access to or cost of such additional funds could be adversely affected by any decrease in credit ratings, which were the following as of June 30:
| 2015 | 2014 | ||||||
| Short-term | Long-term | Short-term | Long-term | ||||
| Standard and Poor’s | A-2 | BBB+ | A-2 | BBB+ | |||
| Moody’s | P-2 | Baa1 | P-2 | Baa1 | |||
Share Repurchases and Dividend Payments
On May 13, 2013, the Company’s board of directors terminated the share repurchase programs previously authorized on May 13, 2008, and May 18, 2011, and authorized a new share repurchase program for an aggregate purchase amount of up to $750. This open market share repurchase program is in addition to the Company’s evergreen repurchase program (Evergreen Program), the purpose of which is to offset the impact of stock dilution related to stock-based awards. The Evergreen Program has no authorization limit as to amount or timing of repurchases.
16
Share repurchases under authorized programs were as follows during the fiscal years ended June 30:
| 2015 | 2014 | 2013 | ||||||||||||
| Amount | Shares (000) |
Amount | Shares (000) |
Amount | Shares (000) | |||||||||
| Open-market purchase programs | $ | - | - | $ | - | - | $ | - | - | |||||
| Evergreen Program | 434 | 4,016 | 260 | 3,046 | 128 | 1,500 | ||||||||
| Total | $ | 434 | 4,016 | $ | 260 | 3,046 | $ | 128 | 1,500 | |||||
During fiscal years 2015, 2014 and 2013, the Company declared dividends per share of $2.99, $2.87 and $2.63, respectively. During fiscal years 2015, 2014 and 2013, the Company paid dividends per share of $2.96, $2.84 and $2.56, respectively, equivalent to $385, $368 and $335, respectively.
Contractual Obligations
The Company had contractual obligations as of June 30, 2015, payable or maturing in the following fiscal years:
| 2016 | 2017 | 2018 | 2019 | 2020 | Thereafter | Total | ||||||||||||||
| Long-term debt maturities including interest | ||||||||||||||||||||
| payments | $ | 377 | $ | 72 | $ | 460 | $ | 48 | $ | 47 | $ | 1,542 | $ | 2,546 | ||||||
| Notes and loans payable | 95 | - | - | - | - | - | 95 | |||||||||||||
| Purchase obligations (1) | 176 | 57 | 37 | 30 | 7 | - | 307 | |||||||||||||
| Capital leases | 3 | 3 | 2 | 1 | - | - | 9 | |||||||||||||
| Operating leases | 50 | 46 | 42 | 34 | 29 | 100 | 301 | |||||||||||||
| Payments related to nonqualified postretirement plans (2) | 20 | 21 | 21 | 17 | 18 | 75 | 172 | |||||||||||||
| Venture Agreement net terminal obligation (3) | - | - | - | - | - | 294 | 294 | |||||||||||||
| Total | $ | 721 | $ | 199 | $ | 562 | $ | 130 | $ | 101 | $ | 2,011 | $ | 3,724 | ||||||
| (1) | Purchase obligations are defined as purchase agreements that are enforceable and legally binding and that contain specified or determinable significant terms, including quantity, price and the approximate timing of the transaction. For purchase obligations subject to variable price and/or quantity provisions, an estimate of the price and/or quantity has been made. Examples of the Company’s purchase obligations include contracts to purchase raw materials, commitments to contract manufacturers, commitments for information technology and related services, advertising contracts, capital expenditure agreements, software acquisition and license commitments and service contracts. The raw material contracts included above are entered into during the regular course of business based on expectations of future purchases. Many of these raw material contracts are flexible to allow for changes in the Company’s business and related requirements. If such changes were to occur, the Company believes its exposure could differ from the amounts listed above. Any amounts reflected in the consolidated balance sheets as accounts payable and accrued liabilities are excluded from the table above. |
| (2) | Represents expected payments through 2025. Based on the accounting rules for retirement and postretirement benefit plans, the liabilities reflected in the Company’s consolidated balance sheets differ from these expected future payments (see Notes to Consolidated Financial Statements). |
| (3) | This amount represents the net liability related to the Company’s venture agreement with The Procter and Gamble Company (P&G), as further described in the Notes to Consolidated Financial Statements. Upon termination of the agreement, the Company will purchase P&G’s interest for cash at fair value. As such, the amount of the ultimate settlement of the agreement, which could be impacted by a number of factors including the estimated value of the Glad business at the time of termination, could differ from the current carrying value of the obligation. |
17
As of June 30, 2015, the liability recorded for uncertain tax positions, excluding associated interest and penalties, was approximately $38. During the fiscal year ended June 30, 2015, $32 of gross unrecognized tax benefits relating to other discontinued operations for periods prior to fiscal year 2015 were recognized upon the expiration of the applicable statute of limitations. Recognition of these previously disclosed tax benefits had no impact on the Company’s cash flow or earnings from continuing operations for the fiscal years ended June 30, 2015, 2014 and 2013. Since audit outcomes and the timing of audit settlements are subject to significant uncertainty, liabilities for uncertain tax positions are excluded from the contractual obligations table (see Notes to Consolidated Financial Statements).
Off-Balance Sheet Arrangements
In conjunction with divestitures and other transactions, the Company may provide typical indemnifications (e.g., indemnifications for representations and warranties and retention of previously existing environmental, tax and employee liabilities) that have terms that vary in duration and in the potential amount of the total obligation and, in many circumstances, are not explicitly defined. The Company has not made, nor does it believe that it is probable that it will make, any payments relating to its indemnifications, and believes that any reasonably possible payments would not have a material adverse effect, individually or in the aggregate, on the Company’s consolidated financial statements taken as a whole.
The Company had not recorded any liabilities on the aforementioned indemnifications as of June 30, 2015 and 2014.
As of June 30, 2015, the Company was a party to letters of credit of $11, primarily related to one of its insurance carriers, of which $0 had been drawn upon.
CONTINGENCIES
The Company is involved in certain environmental matters, including response actions at various locations. The Company had a recorded liability of $12 and $14 as of June 30, 2015 and 2014, respectively, for its share of aggregate future remediation costs related to these matters. One matter in Dickinson County, Michigan, for which the Company is jointly and severally liable, accounted for a substantial majority of the recorded liability as of both June 30, 2015 and 2014. The Company has agreed to be liable for 24.3% of the aggregate remediation and associated costs for this matter pursuant to a cost-sharing arrangement with a third party. With the assistance of environmental consultants, the Company maintains an undiscounted liability representing its current best estimate of its share of the capital expenditures, maintenance and other costs that may be incurred over an estimated 30-year remediation period. Currently, the Company cannot accurately predict the timing of future payments that may be made under this obligation. In addition, the Company’s estimated loss exposure is sensitive to a variety of uncertain factors, including the efficacy of remediation efforts, changes in remediation requirements and the future availability of alternative clean-up technologies. Although it is reasonably possible that the Company’s exposure may exceed the amount recorded, any amount of such additional exposures, or range of exposures, is not estimable at this time.
In October 2012, a Brazilian appellate court issued an adverse decision in a lawsuit pending in Brazil against the Company and one of its wholly owned subsidiaries, The Glad Products Company (Glad). The lawsuit, which was initially filed in a Brazilian lower court in 2002 by two Brazilian companies and one Uruguayan company (collectively, Petroplus), relates to joint venture agreements for the distribution of STP auto-care products in Brazil with three companies that became subsidiaries of the Company as a result of the Company’s merger with First Brands Corporation in January 1999 (collectively, Clorox Subsidiaries). The pending lawsuit seeks indemnification for damages and losses for alleged breaches of the joint venture agreements and abuse of economic power by the Company and Glad. Petroplus had previously unsuccessfully raised the same claims and sought damages from the Company and the Clorox Subsidiaries in an International Chamber of Commerce (ICC) arbitration proceeding in Miami, Florida, filed in 2001. The ICC arbitration panel unanimously ruled against Petroplus in a final decision in November 2003 (Final ICC Arbitration Award). The Final ICC Arbitration Award was ratified by the Superior Court of Justice of Brazil in May 2007 (Foreign Judgment), and the United States District Court for the Southern District of Florida subsequently confirmed the Final ICC Arbitration Award and recognized and adopted the Foreign Judgment as a judgment of the United States District Court for the Southern District of Florida (U.S. Judgment). Despite this, in March 2008, a Brazilian lower court ruled against the Company and Glad in the pending lawsuit. The value of the judgment against the Company, including interest and foreign exchange fluctuations as of June 30, 2015, was approximately $32.
18
Among other defenses, because the Final ICC Arbitration Award, the Foreign Judgment and the U.S. Judgment relate to the same claims as those in the pending lawsuit, the Company believes that Petroplus is precluded from re-litigating these claims. Based on the unfavorable appellate court decision, however, the Company believes that it is reasonably possible that a loss could be incurred in this matter in excess of amounts accrued, and that the estimated range of such loss in this matter is from $0 to $26.
The Company continues to believe that its defenses are meritorious, and has appealed the decision to the highest courts of Brazil. In December 2013, in the first stage of the appellate process, the appellate court declined to admit the Company’s appeals to the highest courts. The Company then appealed directly to the highest courts. While in May 2014 the Superior Court of Justice originally agreed to consider the Company’s appeal, in December 2014 the same court declined to admit the appeal based on procedural grounds. The Company successfully appealed that decision and the court agreed to admit the appeal in March 2015. The appeal is currently pending and it is possible that a final decision in this case could be issued as early as the first quarter of fiscal year 2016. Expenses related to this litigation have been, and any potential additional loss would be, reflected in discontinued operations, consistent with the Company’s classification of expenses related to its discontinued Brazil operations.
In a separate action filed in 2004 by Petroplus, in January 2013, a lower Brazilian court nullified the Final ICC Arbitration Award. The Company believes this judgment is inconsistent with the Foreign Judgment and the U.S. Judgment and that it is without merit. The Company appealed this decision, and the lower court decision was overturned by the appellate court in April 2014. Petroplus has appealed this decision to Brazil’s highest court.
Glad and the Clorox Subsidiaries have also filed separate lawsuits against Petroplus alleging misuse of the STP trademark and related matters, which are currently pending before Brazilian courts, and have taken other legal actions against Petroplus, which are pending. Additionally, in November 2013, the Clorox Subsidiaries initiated a new ICC arbitration seeking damages against Petroplus.
The Company is subject to various other lawsuits, claims and loss contingencies relating to issues such as contract disputes, product liability, patents and trademarks, advertising, commercial, administrative, employee and other matters. Based on management’s analysis, it is the opinion of management that the ultimate disposition of these matters, to the extent not previously provided for, will not have a material adverse effect, individually or in the aggregate, on the Company’s consolidated financial statements taken as a whole.
19
QUANTITATIVE AND QUALITATIVE DISCLOSURES ABOUT MARKET RISK
As a multinational company, the Company is exposed to the impact of foreign currency fluctuations, changes in commodity prices, interest-rate risk and other types of market risk.
In the normal course of business, where available at a reasonable cost, the Company manages its exposure to market risk using contractual agreements and a variety of derivative instruments. The Company’s objective in managing its exposure to market risk is to limit the impact of fluctuations on earnings and cash flow through the use of swaps, forward purchases and futures contracts. Derivative contracts are entered into for non-trading purposes with major credit-worthy institutions, thereby decreasing the risk of credit loss.
The Company uses different methodologies, when necessary, to estimate the fair value of its derivative contracts. The estimated fair values of the majority of the Company’s contracts are based on quoted market prices, traded exchange market prices or broker price quotations, and represent the estimated amounts that the Company would pay or receive to terminate the contracts.
Sensitivity Analysis for Derivative Contracts
For fiscal years 2015 and 2014, the Company’s exposure to market risk was estimated using sensitivity analyses, which illustrate the change in the fair value of a derivative financial instrument assuming hypothetical changes in foreign exchange rates, commodity prices or interest rates. The results of the sensitivity analyses for foreign currency derivative contracts, commodity derivative contracts and interest rate contracts are summarized below. Actual changes in foreign exchange rates, commodity prices or interest rates may differ from the hypothetical changes, and any changes in the fair value of the contracts, real or hypothetical, would be partly to fully offset by an inverse change in the value of the underlying hedged items.
The changes in the fair value of derivatives are recorded as either assets or liabilities in the consolidated balance sheets with an offset to net earnings or other comprehensive income, depending on whether or not, for accounting purposes, the derivative is designated and qualified as a cash flow hedge. During the fiscal years ended June 30, 2015, 2014 and 2013, the Company had no hedging instruments designated as fair value hedges. In the event the Company has contracts not designated as hedges for accounting purposes, the Company recognizes the changes in the fair value of these contracts in other income, net.
Foreign Currency Risk
The Company seeks to minimize the impact of certain foreign currency fluctuations by hedging transactional exposures with foreign currency forward contracts. As of June 30, 2015 and 2014, the Company’s foreign currency transactional exposures pertaining to derivative contracts existed with the Canadian, Australian and New Zealand dollars. Based on a hypothetical decrease of 10% in the value of the U.S. dollar against the Canadian, Australian and New Zealand dollars as of June 30, 2015, the estimated fair value of the Company’s then-existing foreign currency derivative contracts would decrease by $12. Based on a hypothetical increase of 10% in the value of the U.S. dollar against the Canadian, Australian and New Zealand dollars as of June 30, 2015, the estimated fair value of the Company’s then-existing foreign currency derivative contracts would increase by $10. Based on a hypothetical decrease of 10% in the value of the U.S. dollar against the Canadian, Australian and New Zealand dollars as of June 30, 2014, the estimated fair value of the Company’s then-existing foreign currency derivative contracts would decrease by $10. Based on a hypothetical increase of 10% in the value of the U.S. dollar against the Canadian, Australian and New Zealand dollars as of June 30, 2014, the estimated fair value of the Company’s then-existing foreign currency derivative contracts would increase by $8.
Commodity Price Risk
The Company is exposed to changes in the price of commodities used as raw materials in the manufacturing of its products. The Company uses various strategies to manage cost exposures on certain raw material purchases with the objective of obtaining more predictable costs for these commodities, including long-term commodity purchase contracts and commodity derivative contracts, where available at a reasonable cost. During fiscal years 2015 and 2014, the Company’s raw materials exposures pertaining to derivative contracts existed with jet fuel, soybean oil and crude oil. Based on a hypothetical decrease or increase of 10% in these commodity prices as of June 30, 2015, and June 30, 2014, the estimated fair value of the Company’s then-existing commodity derivative contracts would decrease or increase by $4 in both fiscal years, with the corresponding impact included in accumulated other comprehensive income.
20
Interest Rate Risk
The Company is exposed to interest rate volatility with regard to existing and anticipated future issuances of debt. Primary exposures related to existing debt include movements in U.S. commercial paper rates. Weighted average interest rates for commercial paper have been less than 1% during fiscal years 2015 and 2014. Assuming average variable rate debt levels during fiscal years 2015 and 2014, a 100 basis point increase in interest rates would increase interest expense from commercial paper by approximately $1 and $3, respectively. Assuming average variable rate debt levels in fiscal years 2015 and 2014, a decrease in interest rates to zero percent would decrease interest expense from commercial paper by $1 in both fiscal years.
The Company is also exposed to interest rate volatility with regard to anticipated future issuances of debt. Primary exposures include movements in U.S. Treasury rates. The Company used interest rate forward contracts to reduce interest rate volatility on fixed rate long-term debt during fiscal year 2015 and 2014. The Company had no outstanding interest rate forward contracts as of June 30, 2015.
RECENTLY ISSUED ACCOUNTING PRONOUNCEMENTS
A summary of recently issued accounting pronouncements is contained in Note 1 of Notes to Consolidated Financial Statements.
CRITICAL ACCOUNTING POLICIES AND ESTIMATES
The methods, estimates, and judgments the Company uses in applying its most critical accounting policies have a significant impact on the results the Company reports in its consolidated financial statements. Specific areas requiring the application of management’s estimates and judgment include, among others, assumptions pertaining to accruals for consumer and trade-promotion programs, stock-based compensation costs, pension and post-employment benefit costs, future cash flows associated with impairment testing of goodwill and other long-lived assets, credit worthiness of customers, uncertain tax positions, tax valuation allowances and legal, environmental and insurance matters. Accordingly, a different financial presentation could result depending on the judgments, estimates or assumptions that are used. The most critical accounting policies are those that are most important to the portrayal of the Company’s financial condition and results, and require the Company to make the most difficult and subjective judgments, often estimating the outcome of future events that are inherently uncertain. The Company’s most critical accounting policies are related to: revenue recognition; valuation of intangible assets and property, plant and equipment; employee benefits, including estimates related to stock-based compensation; and income taxes. The Company’s critical accounting policies have been reviewed with the Audit Committee of the Board of Directors. A summary of the Company’s significant accounting policies is contained in Note 1 of Notes to Consolidated Financial Statements.
Revenue Recognition
Sales are recognized as revenue when the risk of loss and title pass to the customer and when all of the following have occurred: a firm sales arrangement exists, pricing is fixed or determinable and collection is reasonably assured. Sales are recorded net of allowances for returns, trade promotions, coupons and other discounts. The Company routinely commits to one-time or ongoing trade-promotion programs with customers. Programs include shelf-price reductions, end-of-aisle or in-store displays of the Company’s products and graphics and other trade-promotion activities conducted by the customer. Costs related to these programs are recorded as a reduction of sales. The Company’s estimated costs of trade promotions incorporate historical sales and spending trends by customer and category. The determination of these estimated costs requires judgment and may change in the future as a result of changes in customer promotion participation, particularly for new programs and for programs related to the introduction of new products. Final determination of the total cost of a promotion is dependent upon customers providing information about proof of performance and other information related to the promotional event. This process of analyzing and settling trade-promotion programs with customers could impact the Company’s results of operations and trade spending accruals depending on how actual results of the programs compare to original estimates. If the Company’s trade spending accrual estimates as of June 30, 2015 were to differ by 10%, the impact on net sales would be approximately $11.
Valuation of Intangible Assets and Property, Plant and Equipment
The Company tests its goodwill and other indefinite-lived intangible assets for impairment annually in the fiscal fourth quarter unless there are indications during a different interim period that these assets may have become impaired.
21
Goodwill
Consistent with fiscal year 2014, the Company’s reporting units for goodwill impairment testing purposes are its domestic Strategic Business Units (SBUs), Canada, Latin America and AMEA (Asia, Middle East, Europe and Australia), previously referred to as Rest of World. These reporting units are components of the Company’s business that are either operating segments or one level below an operating segment and for which discrete financial information is available that is reviewed by the managers of the respective operating segments. No instances of impairment were identified during the fiscal year 2015 annual impairment review and all of the Company’s reporting units had fair values that significantly exceeded recorded values. However, future changes in the judgments, assumptions and estimates that are used in the impairment testing for goodwill and indefinite-lived intangible assets as described below could result in significantly different estimates of the fair values.
In its evaluation of goodwill impairment, the Company has the option to first assess qualitative factors such as maturity and stability of the reporting unit, magnitude of excess fair value over book value from the prior year’s impairment testing, other reporting unit operating results as well as new events and circumstances impacting the operations at the reporting unit level. If the result of a qualitative test indicates a potential for impairment, a quantitative test is performed. The quantitative test is a two-step process. In the first step, the Company compares the estimated fair value of each reporting unit to its carrying value. In all instances, the estimated fair value exceeded the carrying value of the reporting unit. Had the estimated fair value of any reporting unit been less than its carrying value, the Company would have performed a second step to determine the implied fair value of the reporting unit’s goodwill. If the carrying amount of a reporting unit’s goodwill had exceeded its implied fair value, an impairment charge would have been recorded for the difference between the carrying amount and the implied fair value of the reporting unit’s goodwill.
To determine the fair value of a reporting unit as part of its quantitative test, the Company uses a discounted cash flow (DCF) approach, as it believes that this approach is the most reliable indicator of the fair value of its businesses and the fair value of their future earnings and cash flows. Under this approach, the Company estimates the future cash flows of each reporting unit and discounts these cash flows at a rate of return that reflects their relative risk. The cash flows used in the DCF are consistent with those the Company uses in its internal planning, which gives consideration to actual business trends experienced, and the broader business strategy for the long term. The other key estimates and factors used in the DCF include, but are not limited to, future sales volumes, revenue and expense growth rates, changes in working capital, foreign exchange rates, currency devaluation, inflation and a perpetuity growth rate. Changes in such estimates or the application of alternative assumptions could produce different results.
Trademarks and Other Indefinite-Lived Intangible Assets
For trademarks and other intangible assets with indefinite lives, the Company performs a quantitative analysis to test for impairment. When a quantitative test is performed, the estimated fair value of an asset is compared to its carrying amount. If the carrying amount of such asset exceeds its estimated fair value, an impairment charge is recorded for the difference between the carrying amount and the estimated fair value. The Company uses the income approach to estimate the fair value of its trademarks and other intangible assets with indefinite lives. This approach requires significant judgments in determining both the assets’ estimated cash flows as well as the appropriate discount and foreign exchange rates applied to those cash flows to determine fair value. Changes in such estimates or the use of alternative assumptions could produce different results.
As a result of the effective devaluation of the Venezuelan currency in the third quarter of fiscal year 2014, the Company assessed whether recorded values of intangible assets attributable to Clorox Venezuela and goodwill of the reporting unit, which included Venezuela, were impaired. As a result of its assessment, the Company identified indications of impairment and recorded noncash tax deductible impairment charges on trademark values totaling $4. The Company used the income approach to estimate the fair value of the trademarks. The $4 impairment charge was reflected in the International reportable segment, of which $3 relates to continuing operations and is reflected in other income, net and $1 relates to trademarks held on the books of Clorox Venezuela and is reflected in earnings from discontinued operations, net. Based on the results of the annual impairment test performed in the fourth quarter of fiscal year 2015, there were no additional indications of impairment of assets in Venezuela. There were no instances of impairment identified during fiscal years 2013.
22
Property, Plant and Equipment and Finite-Lived Intangible Assets
Property, plant and equipment and finite-lived intangible assets are reviewed for possible impairment whenever events or changes in circumstances occur that indicate that the carrying amount of an asset (or asset group) may not be recoverable. The Company’s impairment review requires significant management judgment, including estimating the future success of product lines, future sales volumes, revenue and expense growth rates, alternative uses for the assets and estimated proceeds from the disposal of the assets. The Company conducts quarterly reviews of idle and underutilized equipment, and reviews business plans for possible impairment indicators. Impairment occurs when the carrying amount of the asset (or asset group) exceeds its estimated future undiscounted cash flows and the impairment is viewed as other than temporary. When impairment is indicated, an impairment charge is recorded for the difference between the asset’s book value and its estimated fair value. Depending on the asset, estimated fair value may be determined either by use of a DCF model or by reference to estimated selling values of assets in similar condition. The use of different assumptions would increase or decrease the estimated fair value of assets and would increase or decrease any impairment measurement.
Employee Benefits
The Company’s critical accounting policies in this area relate to its stock-based compensation and retirement income programs.
Stock-based Compensation
The Company grants various nonqualified stock-based compensation awards to eligible employees, including stock options, performance units and restricted stock. The stock-based compensation expense and related income tax benefit recognized in the consolidated statement of earnings in fiscal year 2015 were $32 and $12, respectively. As of June 30, 2015, there was $34 of unrecognized compensation costs related to non-vested stock options, restricted stock and performance unit awards, which are expected to be recognized over a weighted average remaining vesting period of one year. The Company estimates the fair value of each stock option award on the date of grant using the Black-Scholes valuation model, which requires management to make estimates regarding expected option life, stock price volatility and other assumptions. Groups of employees that have similar historical exercise behavior are considered separately for valuation purposes. The total number of stock options expected to vest is adjusted by actual and estimated forfeitures. Changes to the actual and estimated forfeitures will result in a cumulative catch-up adjustment in the period of change.
The use of different assumptions in the Black-Scholes valuation model could lead to a different estimate of the fair value of each stock option. The expected volatility is based on implied volatility from publicly traded options on the Company’s stock at the date of grant, historical implied volatility of the Company’s publicly traded options and other factors. If the Company’s assumption for the volatility rate is increased by one percentage point, the fair value of options granted in fiscal year 2015 would have increased by $1. The expected life of the stock options is based on observed historical exercise patterns. If the Company’s assumption for the expected life is increased by one year, the fair value of options granted in fiscal year 2015 would have increased by less than $1.
The Company’s performance unit grants provide for the issuance of common stock to certain managerial staff and executive management if the Company achieves specified performance targets. The performance period is three years and the payout determination is made at the end of the three-year performance period. The fair value of each grant issued is estimated on the date of grant based on the current market price of the stock. The total amount of compensation expense recognized reflects estimated forfeiture rates and the initial assumption that performance goals will be achieved. Compensation expense is adjusted based on management’s assessment of the probability that performance goals will be achieved. If such goals are not met or it is determined that achievement of performance goals is not probable, previously recognized compensation expense is trued up in the current period to reflect the expected payout level. If it is determined that the performance goals will be exceeded, additional compensation expense is recognized, subject to a cap of 150% of target.
23
Retirement Income Plans
The determination of net periodic pension cost is based on actuarial assumptions including a discount rate to reflect the time value of money, the long-term rate of return on plan assets, employee compensation rates and demographic assumptions to determine the probability and timing of benefit payments. The selection of assumptions is based on historical trends and known economic and market conditions at the time of valuation. The expected long-term rate of return assumption is based on an analysis of historical experience of the portfolio and the summation of prospective returns for each asset class in proportion to the fund’s current asset allocation. The actual net periodic pension cost could differ from the expected results because actuarial assumptions and estimates are used. In the calculation of pension expense related to domestic plans for 2015, the Company used a beginning-of-year discount rate assumption of 4.0% and a long-term rate of return on plan assets assumption of 5.3%. The use of a different discount rate or long-term rate of return on domestic plan assets can significantly impact pension expense. For example, as of June 30, 2015, a decrease of 100 basis points in the discount rate would increase pension liability by approximately $39, and decrease fiscal year 2015 pension expense by less than $1. A 100 basis point decrease in the long-term rate of return on plan assets would increase fiscal year 2015 pension expense by $4. At the end of fiscal year 2015, the long-term rate of return is assumed to be 4.3% for the domestic plan assets. This change is a result of the change in the plan’s target investment allocation. The Company also has defined benefit pension plans for eligible international employees, including Canadian and Australian employees, and different assumptions are used in the determination of pension expense for those plans, as appropriate. See Notes to Consolidated Financial Statements for further discussion of pension and other retirement plan obligations.
Income Taxes
The Company’s effective tax rate is based on income by tax jurisdiction, statutory tax rates and tax planning opportunities available to the Company in the various jurisdictions in which the Company operates. Significant judgment is required in determining the Company’s effective tax rate and in evaluating its tax positions.
The Company maintains valuation allowances when it is likely that all or a portion of a deferred tax asset will not be realized. Changes in valuation allowances from period to period are included in the Company’s income tax provision in the period of change. In determining whether a valuation allowance is warranted, the Company takes into account such factors as prior earnings history, expected future earnings, unsettled circumstances that, if unfavorably resolved, would adversely affect the utilization of a deferred tax asset, statutory carry-back and carry-forward periods and tax strategies that could potentially enhance the likelihood of realization of a deferred tax asset. Valuation allowances maintained by the Company relate mostly to deferred tax assets arising from the Company’s currently anticipated inability to use net operating losses in certain foreign countries.
In addition to valuation allowances, the Company provides for uncertain tax positions when such tax positions do not meet certain recognition thresholds or measurement standards. Amounts for uncertain tax positions are adjusted in quarters when new information becomes available or when positions are effectively settled.
United States income taxes and foreign withholding taxes are not provided when foreign earnings are indefinitely reinvested. The Company determines whether its foreign subsidiaries will invest their undistributed earnings indefinitely and reassesses this determination on a periodic basis. A change to the Company’s determination may be warranted based on the Company’s experience as well as plans regarding future international operations and expected remittances. Changes in the Company’s determination would likely require an adjustment to the income tax provision in the quarter in which the determination is made.
24
SUMMARY OF NON-GAAP FINANCIAL MEASURES
The non-GAAP financial measures included in this MD&A and Exhibit 99.3 and the reasons management believes they are useful to investors are described below. These measures should be considered supplemental in nature and are not intended to be a substitute for the related financial information prepared in accordance with U.S. GAAP. In addition, these measures may not be the same as similarly named measures presented by other companies.
Free cash flow is calculated as net cash provided by continuing operations less capital expenditures related to continuing operations. The Company’s management uses this measure and free cash flow as a percentage of net sales to help assess the cash generation ability of the business and funds available for investing activities, such as acquisitions, investing in the business to drive growth and financing activities, including debt payments, dividend payments and share repurchases. Free cash flow does not represent cash available only for discretionary expenditures, since the Company has mandatory debt service requirements and other contractual and non-discretionary expenditures. Refer to “Free cash flow” and “Free cash flow as a percentage of net sales” above for a reconciliation of these non-GAAP measures.
EBIT represents earnings from continuing operations before income taxes, interest income and interest expense. EBIT margin is the ratio of EBIT to net sales. The company's management believes these measures provide useful additional information to investors about trends in the company's operations and are useful for period-over-period comparisons.
Currency-neutral net sales growth represents U.S. GAAP net sales growth excluding the impact of foreign currency exchange rates. The Company’s management believes these measures provide useful additional information to investors about trends in the Company’s core business operations. The following table presents the currency-neutral net sales growth reconciliation for fiscal year 2015:
| 2015 | ||||
| Net sales growth – GAAP | 3 | % | ||
| Less: foreign exchange impact | (2 | ) | ||
| Currency-neutral net sales growth – non-GAAP | 5 | % | ||
Economic profit (EP) is defined by the Company as earnings from continuing operations before income taxes, excluding noncash U.S. GAAP restructuring and intangible asset impairment costs, and interest expense; less an amount of tax based on the effective tax rate and less a charge equal to average capital employed multiplied by the weighted-average cost of capital. EP is a key financial metric the Company’s management uses to evaluate business performance and allocate resources, and is a component in determining management’s incentive compensation. The Company’s management believes EP provides additional perspective to investors about financial returns generated by the business and represents profit generated over and above the cost of capital used by the business to generate that profit. Refer to Exhibit 99.3 for a reconciliation of EP to earnings from continuing operations before income taxes.
25
CAUTIONARY STATEMENT
This Annual Report on Form 10-K (this Report), including the exhibits hereto and the information incorporated by reference herein, contains “forward-looking statements” within the meaning of Section 27A of the Securities Act of 1933, as amended, and Section 21E of the Securities Exchange Act of 1934, as amended, and such forward-looking statements involve risks and uncertainties. Except for historical information, matters discussed below, including statements about future volume, sales, foreign currencies, costs, cost savings, margin, earnings, earnings per share, diluted earnings per share, foreign currency exchange rates, cash flows, plans, objectives, expectations, growth or profitability, are forward-looking statements based on management’s estimates, assumptions and projections. Words such as “could,” “may,” “expects,” “anticipates,” “targets,” “goals,” “projects,” “intends,” “plans,” “believes,” “seeks,” “estimates” and variations on such words, and similar expressions that reflect our current views with respect to future events and financial performance, are intended to identify such forward-looking statements. These forward-looking statements are only predictions, subject to risks and uncertainties, and actual results could differ materially from those discussed below. Important factors that could affect performance and cause results to differ materially from management’s expectations are described in the sections entitled “Risk Factors” and “Management’s Discussion and Analysis of Financial Condition and Results of Operations” in this Report, as updated from time to time in the Company’s Securities and Exchange Commission filings. These factors include, but are not limited to:
| ● | intense competition in the Company’s markets; |
| ● | worldwide, regional and local economic conditions and financial market volatility; |
| ● | the ability of the Company to drive sales growth, increase price and market share, grow its product categories and achieve favorable product and geographic mix; |
| ● | risks related to international operations, including political instability; government-imposed price controls or other regulations; foreign currency exchange rate controls, including periodic changes in such controls, fluctuations and devaluations; labor claims, labor unrest and inflationary pressures, particularly in Argentina; and potential harm and liabilities from the use, storage and transportation of chlorine in certain international markets where chlorine is used in the production of bleach; |
| ● | risks related to the possibility of nationalization, expropriation of assets or other government action in foreign jurisdictions; |
| ● | risks related to the Company’s discontinuation of operations in Venezuela; |
| ● | volatility and increases in commodity costs such as resin, sodium hypochlorite and agricultural commodities, and increases in energy, transportation or other costs; |
| ● | supply disruptions and other risks inherent in reliance on a limited base of suppliers; |
| ● | the ability of the Company to develop and introduce commercially successful products; |
| ● | dependence on key customers and risks related to customer consolidation and ordering patterns; |
| ● | costs resulting from government regulations; |
| ● | the ability of the Company to successfully manage global political, legal, tax and regulatory risks, including changes in regulatory or administrative activity; |
| ● | risks related to reliance on information technology systems, including potential security breaches, cyber-attacks or privacy breaches that result in the unauthorized disclosure of consumer, customer, employee or Company information, or service interruptions; |
| ● | risks relating to acquisitions, new ventures and divestitures, and associated costs, including the potential for asset impairment charges related to, among others, intangible assets and goodwill; |
26
| ● | the success of the Company’s business strategies; |
| ● | the ability of the Company to implement and generate anticipated cost savings and efficiencies; |
| ● | the impact of product liability claims, labor claims and other legal proceedings, including in foreign jurisdictions and the Company’s litigation related to its discontinued operations in Brazil; |
| ● | the Company’s ability to attract and retain key personnel; |
| ● | the Company’s ability to maintain its business reputation and the reputation of its brands; |
| ● | environmental matters, including costs associated with the remediation of past contamination and the handling and/or transportation of hazardous substances; |
| ● | the impact of natural disasters, terrorism and other events beyond the Company’s control; |
| ● | the Company’s ability to maximize, assert and defend its intellectual property rights; |
| ● | any infringement or claimed infringement by the Company of third-party intellectual property rights; |
| ● | the effect of the Company’s indebtedness and credit rating on its operations and financial results; |
| ● | the Company’s ability to maintain an effective system of internal controls; |
| ● | uncertainties relating to tax positions, tax disputes and changes in the Company’s tax rate; |
| ● | the accuracy of the Company’s estimates and assumptions on which its financial statement projections are based; |
| ● | the Company’s ability to pay and declare dividends or repurchase its stock in the future; and |
| ● | the impacts of potential stockholder activism. |
The Company’s forward-looking statements in this Report are based on management’s current views and assumptions regarding future events and speak only as of their dates. The Company undertakes no obligation to publicly update or revise any forward-looking statements, whether as a result of new information, future events or otherwise, except as required by the federal securities laws.
27
MANAGEMENT’S REPORT ON INTERNAL CONTROL OVER FINANCIAL REPORTING
The Company’s management is responsible for establishing and maintaining adequate internal control over financial reporting. The Company’s internal control over financial reporting is a process designed under the supervision of its Chief Executive Officer and Chief Financial Officer to provide reasonable assurance regarding the reliability of financial reporting and the preparation of the Company’s financial statements for external reporting in accordance with accounting principles generally accepted in the United States of America. A company’s internal control over financial reporting includes those policies and procedures that (1) pertain to the maintenance of records that, in reasonable detail, accurately and fairly reflect the transactions and dispositions of the assets of the company; (2) provide reasonable assurance that transactions are recorded as necessary to permit preparation of financial statements in accordance with generally accepted accounting principles, and that receipts and expenditures of the company are being made only in accordance with authorizations of management and directors of the company; and (3) provide reasonable assurance regarding prevention or timely detection of unauthorized acquisition, use or disposition of the company’s assets that could have a material effect on the financial statements.
Because of its inherent limitations, internal control over financial reporting may not prevent or detect misstatements. Also, projections of any evaluation of effectiveness to future periods are subject to the risk that controls may become inadequate because of changes in conditions or that the degree of compliance with the policies or procedures may deteriorate.
Management evaluated the effectiveness of the Company’s internal control over financial reporting using the criteria set forth by the Committee of Sponsoring Organizations of the Treadway Commission (COSO) in Internal Control-Integrated Framework published in 2013. Management, under the supervision and with the participation of the Company’s Chief Executive Officer and Chief Financial Officer, assessed the effectiveness of the Company’s internal control over financial reporting at June 30, 2015, and concluded that it is effective.
The Company’s independent registered public accounting firm, Ernst & Young LLP, has audited the effectiveness of the Company’s internal control over financial reporting as of June 30, 2015.
28
REPORT OF INDEPENDENT REGISTERED PUBLIC ACCOUNTING FIRM
The Board of Directors and Stockholders of The Clorox Company
We have audited the accompanying consolidated balance sheets of The Clorox Company as of June 30, 2015 and 2014, and the related consolidated statements of earnings, comprehensive income, stockholders’ equity and cash flows for each of the three years in the period ended June 30, 2015. Our audits also included the financial statement schedule in Exhibit 99.2. These financial statements and schedule are the responsibility of the Company’s management. Our responsibility is to express an opinion on these financial statements and schedule based on our audits.
We conducted our audits in accordance with the standards of the Public Company Accounting Oversight Board (United States). Those standards require that we plan and perform the audit to obtain reasonable assurance about whether the financial statements are free of material misstatement. An audit includes examining, on a test basis, evidence supporting the amounts and disclosures in the financial statements. An audit also includes assessing the accounting principles used and significant estimates made by management, as well as evaluating the overall financial statement presentation. We believe that our audits provide a reasonable basis for our opinion.
In our opinion, the financial statements referred to above present fairly, in all material respects, the consolidated financial position of The Clorox Company at June 30, 2015 and 2014, and the consolidated results of its operations and its cash flows for each of the three years in the period ended June 30, 2015, in conformity with U.S. generally accepted accounting principles. Also, in our opinion, the related financial statement schedule, when considered in relation to the basic financial statements taken as a whole, presents fairly in all material respects the information set forth therein.
We also have audited, in accordance with the standards of the Public Company Accounting Oversight Board (United States), The Clorox Company’s internal control over financial reporting as of June 30, 2015, based on criteria established in Internal Control-Integrated Framework issued by the Committee of Sponsoring Organizations of the Treadway Commission (2013 framework) and our report dated August 21, 2015 expressed an unqualified opinion thereon.
/s/ Ernst & Young
LLP
San Francisco, CA
August 21, 2015
29
REPORT OF INDEPENDENT REGISTERED PUBLIC ACCOUNTING FIRM
The Board of Directors and Stockholders of The Clorox Company
We have audited The Clorox Company’s internal control over financial reporting as of June 30, 2015, based on criteria established in Internal Control - Integrated Framework issued by the Committee of Sponsoring Organizations of the Treadway Commission (2013 framework) (the COSO criteria). The Clorox Company’s management is responsible for maintaining effective internal control over financial reporting, and for its assessment of the effectiveness of internal control over financial reporting included in the accompanying Management’s Report on Internal Control Over Financial Reporting. Our responsibility is to express an opinion on the company’s internal control over financial reporting based on our audit.
We conducted our audit in accordance with the standards of the Public Company Accounting Oversight Board (United States). Those standards require that we plan and perform the audit to obtain reasonable assurance about whether effective internal control over financial reporting was maintained in all material respects. Our audit included obtaining an understanding of internal control over financial reporting, assessing the risk that a material weakness exists, testing and evaluating the design and operating effectiveness of internal control based on the assessed risk, and performing such other procedures as we considered necessary in the circumstances. We believe that our audit provides a reasonable basis for our opinion.
A company’s internal control over financial reporting is a process designed to provide reasonable assurance regarding the reliability of financial reporting and the preparation of financial statements for external purposes in accordance with generally accepted accounting principles. A company’s internal control over financial reporting includes those policies and procedures that (1) pertain to the maintenance of records that, in reasonable detail, accurately and fairly reflect the transactions and dispositions of the assets of the company; (2) provide reasonable assurance that transactions are recorded as necessary to permit preparation of financial statements in accordance with generally accepted accounting principles, and that receipts and expenditures of the company are being made only in accordance with authorizations of management and directors of the company; and (3) provide reasonable assurance regarding prevention or timely detection of unauthorized acquisition, use, or disposition of the company’s assets that could have a material effect on the financial statements.
Because of its inherent limitations, internal control over financial reporting may not prevent or detect misstatements. Also, projections of any evaluation of effectiveness to future periods are subject to the risk that controls may become inadequate because of changes in conditions, or that the degree of compliance with the policies or procedures may deteriorate.
In our opinion, The Clorox Company maintained, in all material respects, effective internal control over financial reporting as of June 30, 2015, based on the COSO criteria (2013 framework).
We also have audited, in accordance with the standards of the Public Company Accounting Oversight Board (United States), the consolidated balance sheets of The Clorox Company as of June 30, 2015 and 2014, and the related consolidated statements of earnings, comprehensive income, stockholders’ equity, and cash flows for each of the three years in the period ended June 30, 2015 of The Clorox Company and our report dated August 21, 2015 expressed an unqualified opinion thereon.
/s/ Ernst & Young
LLP
San Francisco, CA
August 21, 2015
30
CONSOLIDATED STATEMENTS OF
EARNINGS
The Clorox Company
| Years ended June 30 | ||||||||||||
| Dollars in millions, except per share amounts | 2015 | 2014 | 2013 | |||||||||
| Net sales | $ | 5,655 | $ | 5,514 | $ | 5,533 | ||||||
| Cost of products sold | 3,190 | 3,158 | 3,142 | |||||||||
| Gross profit | 2,465 | 2,356 | 2,391 | |||||||||
| Selling and administrative expenses | 798 | 751 | 793 | |||||||||
| Advertising costs | 523 | 503 | 498 | |||||||||
| Research and development costs | 136 | 125 | 130 | |||||||||
| Interest expense | 100 | 103 | 122 | |||||||||
| Other income, net | (13 | ) | (10 | ) | (4 | ) | ||||||
| Earnings from continuing operations before income taxes | 921 | 884 | 852 | |||||||||
| Income taxes on continuing operations | 315 | 305 | 279 | |||||||||
| Earnings from continuing operations | 606 | 579 | 573 | |||||||||
| Losses from discontinued operations, net of tax | (26 | ) | (21 | ) | (1 | ) | ||||||
| Net earnings | $ | 580 | $ | 558 | $ | 572 | ||||||
| Net earnings (losses) per share | ||||||||||||
| Basic | ||||||||||||
| Continuing operations | $ | 4.65 | $ | 4.47 | $ | 4.37 | ||||||
| Discontinued operations | (0.20 | ) | (0.16 | ) | - | |||||||
| Basic net earnings per share | $ | 4.45 | $ | 4.31 | $ | 4.37 | ||||||
| Diluted | ||||||||||||
| Continuing operations | $ | 4.57 | $ | 4.39 | $ | 4.31 | ||||||
| Discontinued operations | (0.20 | ) | (0.16 | ) | (0.01 | ) | ||||||
| Diluted net earnings per share | $ | 4.37 | $ | 4.23 | $ | 4.30 | ||||||
| Weighted average shares outstanding (in thousands) | ||||||||||||
| Basic | 130,310 | 129,558 | 131,075 | |||||||||
| Diluted | 132,776 | 131,742 | 132,969 | |||||||||
See Notes to Consolidated Financial Statements
31
CONSOLIDATED STATEMENTS OF
COMPREHENSIVE INCOME
The Clorox Company
| Years ended June 30 | ||||||||||||
| Dollars in millions | 2015 | 2014 | 2013 | |||||||||
| Earnings from continuing operations | $ | 606 | $ | 579 | $ | 573 | ||||||
| Losses from discontinued operations, net of tax | (26 | ) | (21 | ) | (1 | ) | ||||||
| Net earnings | 580 | 558 | 572 | |||||||||
| Other comprehensive (losses) income: | ||||||||||||
| Foreign currency adjustments, net of tax | (54 | ) | (37 | ) | (11 | ) | ||||||
| Net unrealized (losses) gains on derivatives, net of tax | (14 | ) | (9 | ) | 3 | |||||||
| Pension and postretirement benefit adjustments, net of tax | (17 | ) | (4 | ) | 37 | |||||||
| Total other comprehensive (losses) income, net of tax | (85 | ) | (50 | ) | 29 | |||||||
| Comprehensive income | $ | 495 | $ | 508 | $ | 601 | ||||||
See Notes to Consolidated Financial Statements
32
CONSOLIDATED BALANCE
SHEETS
The Clorox Company
| As of June 30 | |||||||
| Dollars in millions, except per share amounts | 2015 | 2014 | |||||
| ASSETS | |||||||
| Current assets | |||||||
| Cash and cash equivalents | $ | 382 | $ | 329 | |||
| Receivables, net | 519 | 546 | |||||
| Inventories, net | 385 | 386 | |||||
| Other current assets | 143 | 134 | |||||
| Total current assets | 1,429 | 1,395 | |||||
| Property, plant and equipment, net | 918 | 977 | |||||
| Goodwill | 1,067 | 1,101 | |||||
| Trademarks, net | 535 | 547 | |||||
| Other intangible assets, net | 50 | 64 | |||||
| Other assets | 165 | 174 | |||||
| Total assets | $ | 4,164 | $ | 4,258 | |||
| LIABILITIES AND STOCKHOLDERS’ EQUITY | |||||||
| Current liabilities | |||||||
| Notes and loans payable | $ | 95 | $ | 143 | |||
| Current maturities of long-term debt | 300 | 575 | |||||
| Accounts payable | 431 | 440 | |||||
| Accrued liabilities | 548 | 472 | |||||
| Income taxes payable | 31 | 8 | |||||
| Total current liabilities | 1,405 | 1,638 | |||||
| Long-term debt | 1,796 | 1,595 | |||||
| Other liabilities | 750 | 768 | |||||
| Deferred income taxes | 95 | 103 | |||||
| Total liabilities | 4,046 | 4,104 | |||||
| Commitments and contingencies | |||||||
| Stockholders’ equity | |||||||
| Preferred stock: $1.00 par value; 5,000,000 shares authorized; none | |||||||
| issued or outstanding | - | - | |||||
| Common stock: $1.00 par value; 750,000,000 shares authorized; 158,741,461 | |||||||
| shares issued at June 30, 2015 and 2014; and 128,614,310 and 128,796,228 | |||||||
| shares outstanding at June 30, 2015 and 2014, respectively | 159 | 159 | |||||
| Additional paid-in capital | 775 | 709 | |||||
| Retained earnings | 1,923 | 1,739 | |||||
| Treasury shares, at cost: 30,127,151 and 29,945,233 shares | |||||||
| at June 30, 2015 and 2014, respectively | (2,237 | ) | (2,036 | ) | |||
| Accumulated other comprehensive net loss | (502 | ) | (417 | ) | |||
| Stockholders’ equity | 118 | 154 | |||||
| Total liabilities and stockholders’ equity | $ | 4,164 | $ | 4,258 | |||
See Notes to Consolidated Financial Statements
33
CONSOLIDATED
STATEMENTS OF STOCKHOLDERS’
EQUITY
The Clorox Company
| Dollars in millions | Common Stock | Additional Paid-in Capital |
Retained Earnings |
Treasury Shares |
Accumulated Other Comprehensive Net (Losses) Income |
|||||||||||||||||||||||
| Shares (000) |
Amount | Shares (000) |
Amount | Tota l | ||||||||||||||||||||||||
| Balance at June 30, 2012 | 158,741 | $ | 159 | $ | 633 | $ | 1,350 | (29,179 | ) | $ | (1,881 | ) | $ | (396 | ) | $ | (135 | ) | ||||||||||
| Net earnings | 572 | 572 | ||||||||||||||||||||||||||
| Other comprehensive income | 29 | 29 | ||||||||||||||||||||||||||
| Accrued dividends | (348 | ) | (348 | ) | ||||||||||||||||||||||||
| Stock-based compensation | 35 | 35 | ||||||||||||||||||||||||||
| Other employee stock plan activities | (7 | ) | (13 | ) | 2,304 | 141 | 121 | |||||||||||||||||||||
| Treasury stock purchased | (1,500 | ) | (128 | ) | (128 | ) | ||||||||||||||||||||||
| Balance at June 30, 2013 | 158,741 | 159 | 661 | 1,561 | (28,375 | ) | (1,868 | ) | (367 | ) | 146 | |||||||||||||||||
| Net earnings | 558 | 558 | ||||||||||||||||||||||||||
| Other comprehensive loss | (50 | ) | (50 | ) | ||||||||||||||||||||||||
| Accrued dividends | (374 | ) | (374 | ) | ||||||||||||||||||||||||
| Stock-based compensation | 36 | 36 | ||||||||||||||||||||||||||
| Other employee stock plan activities | 12 | (6 | ) | 1,476 | 92 | 98 | ||||||||||||||||||||||
| Treasury stock purchased | (3,046 | ) | (260 | ) | (260 | ) | ||||||||||||||||||||||
| Balance at June 30, 2014 | 158,741 | 159 | 709 | 1,739 | (29,945 | ) | (2,036 | ) | (417 | ) | 154 | |||||||||||||||||
| Net earnings | 580 | 580 | ||||||||||||||||||||||||||
| Other comprehensive loss | (85 | ) | (85 | ) | ||||||||||||||||||||||||
| Accrued dividends | (391 | ) | (391 | ) | ||||||||||||||||||||||||
| Stock-based compensation | 32 | 32 | ||||||||||||||||||||||||||
| Other employee stock plan activities | 34 | (5 | ) | (4,198 | ) | 233 | 262 | |||||||||||||||||||||
| Treasury stock purchased | 4,016 | (434 | ) | (434 | ) | |||||||||||||||||||||||
| Balance at June 30, 2015 | 158,741 | $ | 159 | $ | 775 | $ | 1,923 | (30,127 | ) | $ | (2,237 | ) | $ | (502 | ) | $ | 118 | |||||||||||
See Notes to Consolidated Financial Statements
34
CONSOLIDATED STATEMENTS OF CASH
FLOWS
The Clorox Company
| Years ended June 30 | |||||||||||||
| Dollars in millions | 2015 | 2014 | 2013 | ||||||||||
| Operating activities: | |||||||||||||
| Net earnings | $ | 580 | $ | 558 | $ | 572 | |||||||
| Deduct: Losses from discontinued operations, net of tax | (26 | ) | (21 | ) | (1 | ) | |||||||
| Earnings from continuing operations | 606 | 579 | 573 | ||||||||||
| Adjustments to reconcile earnings from continuing operations to net cash | |||||||||||||
| provided by continuing operations: | |||||||||||||
| Depreciation and amortization | 169 | 177 | 180 | ||||||||||
| Stock-based compensation | 32 | 36 | 35 | ||||||||||
| Deferred income taxes | (16 | ) | (21 | ) | (8 | ) | |||||||
| Settlement of interest rate forward contracts | (25 | ) | - | - | |||||||||
| Other | (17 | ) | 6 | 20 | |||||||||
| Changes in: | |||||||||||||
| Receivables, net | 6 | 20 | (10 | ) | |||||||||
| Inventories, net | (25 | ) | 1 | (11 | ) | ||||||||
| Other current assets | 6 | 5 | 12 | ||||||||||
| Accounts payable and accrued liabilities | 93 | (12 | ) | (29 | ) | ||||||||
| Income taxes payable | 29 | (5 | ) | 18 | |||||||||
| Net cash provided by continuing operations | 858 | 786 | 780 | ||||||||||
| Net cash provided by (used for) discontinued operations | 16 | (19 | ) | (5 | ) | ||||||||
| Net cash provided by operations | 874 | 767 | 775 | ||||||||||
| Investing activities: | |||||||||||||
| Capital expenditures | (125 | ) | (137 | ) | (190 | ) | |||||||
| Proceeds from sale-leasebacks, net of transaction costs | - | - | 135 | ||||||||||
| Other | 19 | - | 4 | ||||||||||
| Net cash used for investing activities from continuing operations | (106 | ) | (137 | ) | (51 | ) | |||||||
| Net cash used for investing activities by discontinued operations | - | (1 | ) | (4 | ) | ||||||||
| Net cash used for investing activities | (106 | ) | (138 | ) | (55 | ) | |||||||
| Financing activities: | |||||||||||||
| Notes and loans payable, net | (48 | ) | (60 | ) | (98 | ) | |||||||
| Long-term debt borrowings, net of issuance costs | 495 | - | 593 | ||||||||||
| Long-term debt repayments | (575 | ) | - | (850 | ) | ||||||||
| Treasury stock purchased | (434 | ) | (260 | ) | (128 | ) | |||||||
| Cash dividends paid | (385 | ) | (368 | ) | (335 | ) | |||||||
| Issuance of common stock for employee stock plans and other | 251 | 96 | 133 | ||||||||||
| Net cash used for financing activities | (696 | ) | (592 | ) | (685 | ) | |||||||
| Effect of exchange rate changes on cash and cash equivalents | (19 | ) | (7 | ) | (3 | ) | |||||||
| Net increase in cash and cash equivalents | 53 | 30 | 32 | ||||||||||
| Cash and cash equivalents: | |||||||||||||
| Beginning of year | 329 | 299 | 267 | ||||||||||
| End of year | $ | 382 | $ | 329 | $ | 299 | |||||||
| Supplemental cash flow information: | |||||||||||||
| Interest paid | $ | 104 | $ | 76 | $ | 129 | |||||||
| Income taxes paid, net of refunds | 236 | 312 | 263 | ||||||||||
| Noncash financing activities: | |||||||||||||
| Cash dividends declared and accrued, but not paid | 99 | 95 | 93 | ||||||||||
See Notes to Consolidated Financial Statements
35
NOTES TO CONSOLIDATED
FINANCIAL STATEMENTS
The
Clorox Company
(Dollars in
millions, except per share amounts)
NOTE 1. SUMMARY OF SIGNIFICANT ACCOUNTING POLICIES
Nature of Operations and Basis of Presentation
The Company is principally engaged in the production, marketing and sales of consumer products through mass retail outlets, e-commerce channels, distributors and medical supply distributors. The consolidated financial statements include the statements of the Company and its wholly owned and controlled subsidiaries. All significant intercompany transactions and accounts were eliminated in consolidation. Certain prior year reclassifications were made in the consolidated financial statements and related notes to the consolidated financial statements to conform to the current year presentation.
Effective September 22, 2014, the Company’s Venezuela affiliate, Corporación Clorox de Venezuela S.A. (Clorox Venezuela), discontinued its operations. Consequently, the Company reclassified the financial results of Clorox Venezuela as a discontinued operation in the consolidated financial statements for all periods presented herein.
Use of Estimates
The preparation of these consolidated financial statements in conformity with generally accepted accounting principles in the United States of America (U.S. GAAP) requires management to reach opinions as to estimates and assumptions that affect reported amounts and related disclosures. Specific areas requiring management’s opinion on estimates and judgments include assumptions pertaining to accruals for consumer and trade-promotion programs, stock-based compensation costs, pension and post-employment benefit costs, future cash flows associated with impairment testing of goodwill and other long-lived assets, the credit worthiness of customers, uncertain tax positions, tax valuation allowances and legal, environmental and insurance matters. Actual results could materially differ from estimates and assumptions made.
Cash and Cash Equivalents
Cash equivalents consist of highly liquid instruments, time deposits and money market funds with an initial maturity at purchase of three months or less. The fair value of cash and cash equivalents approximates the carrying amount.
The Company’s cash position includes amounts held by foreign subsidiaries and, as a result, the repatriation of certain cash balances from some of the Company’s foreign subsidiaries could result in additional tax costs in the United States and in certain foreign jurisdictions. However, these cash balances are generally available without legal restriction to fund local business operations. In addition, a portion of the Company’s cash balance is held in U.S. dollars by foreign subsidiaries, whose functional currency is their local currency. Such U.S. dollar balances are reported on the foreign subsidiaries’ books, in their functional currency, with the impact from foreign currency exchange rate differences recorded in other income, net. The Company’s cash holdings were as follows as of June 30:
| 2015 | 2014 | ||||
| U.S. dollar balances held by U.S. dollar functional currency subsidiaries and at parent | $ | 221 | $ | 180 | |
| Non-U.S. dollar balances held by non-U.S. dollar functional currency subsidiaries | 142 | 132 | |||
| U.S. dollar balances held by non-U.S. dollar functional currency subsidiaries | 19 | 12 | |||
| Non-U.S. dollar balances held by U.S. dollar functional currency subsidiaries | - | 5 | |||
| Total | $ | 382 | $ | 329 | |
36
NOTE 1. SUMMARY OF SIGNIFICANT ACCOUNTING POLICIES (Continued)
Inventories
Inventories are stated at the lower of cost or market. When necessary, the Company provides allowances to adjust the carrying value of its inventory to the lower of cost or market, including any costs to sell or dispose. Appropriate consideration is given to obsolescence, excessive inventory levels, product deterioration and other factors in evaluating net realizable value for the purposes of determining the lower of cost or market.
Property, Plant and Equipment and Finite-Lived Intangible Assets
Property, plant and equipment and finite-lived intangible assets are stated at cost. Depreciation and amortization expense are calculated by the straight-line method using the estimated useful lives or lives determined by lease contracts for the related assets. The table below provides estimated useful lives of property, plant and equipment by asset classification.
| Estimated Useful Lives | |
| Buildings and leasehold improvements | 10 - 40 years |
| Land improvements | 10 - 30 years |
| Machinery and equipment | 3 - 15 years |
| Computer equipment | 3 - 5 years |
| Capitalized software costs | 3 - 7 years |
Property, plant and equipment and finite-lived intangible assets are reviewed for impairment whenever events or changes in circumstances occur that indicate that the carrying amount of an asset (or asset group) may not be fully recoverable. The risk of impairment is initially assessed based on an estimate of the undiscounted cash flows at the lowest level for which identifiable cash flows exist. Impairment occurs when the book value of the asset exceeds the estimated future undiscounted cash flows generated by the asset. When impairment is indicated, an impairment charge is recorded for the difference between the book value of the asset and its estimated fair market value. Depending on the asset, estimated fair market value may be determined either by use of a discounted cash flow model or by reference to estimated selling values of assets in similar condition.
Capitalization of Software Costs
The Company capitalizes certain qualifying costs incurred in the acquisition and development of software for internal use, including the costs of the software, materials, consultants, interest and payroll and payroll-related costs for employees during the application development stage. Internal and external costs incurred during the preliminary project stage and post implementation-operation stage, mainly training and maintenance costs, are expensed as incurred. Once the application is substantially complete and ready for its intended use, qualifying costs are amortized on a straight-line basis over the software’s useful life.
Impairment Review of Goodwill and Indefinite-Lived Intangible Assets
The Company tests its goodwill, trademarks with indefinite lives and other indefinite-lived intangible assets annually for impairment in the fiscal fourth quarter unless there are indications during a different interim period that these assets may have become impaired.
With respect to goodwill, the Company has the option to first assess qualitative factors such as maturity and stability of the reporting unit, magnitude of excess fair value over book value from the prior year’s impairment testing, other reporting unit specific operating results as well as new events and circumstances impacting the operations at the reporting unit level. If the result of a qualitative test indicates a potential for impairment of a reporting unit, a quantitative test is performed. The quantitative test is a two-step process. In the first step, the Company compares the estimated fair value of the reporting unit to its carrying value. In all instances, the estimated fair value exceeded the carrying value of the reporting unit. Had the estimated fair value of any reporting unit been less than its carrying value, the Company would have performed a second step to determine the implied fair value of the reporting unit’s goodwill. If the carrying amount of a reporting unit’s goodwill had exceeded its implied fair value, an impairment charge would have been recorded for the difference between the carrying amount and the implied fair value of the reporting unit’s goodwill.
37
NOTE 1. SUMMARY OF SIGNIFICANT ACCOUNTING POLICIES (Continued)
To determine the fair value of a reporting unit as part of its quantitative test, the Company uses a discounted cash flow (DCF) approach, as it believes that this approach is the most reliable indicator of the fair value of its businesses and the fair value of their future earnings and cash flows. Under this approach, the Company estimates the future cash flows of each reporting unit and discounts these cash flows at a rate of return that reflects their relative risk. The cash flows used in the DCF are consistent with those the Company uses in its internal planning, which gives consideration to actual business trends experienced, and the broader business strategy for the long term. The other key estimates and factors used in the DCF include, but are not limited to, future sales volumes, revenue and expense growth rates, changes in working capital, foreign exchange rates, currency devaluation, inflation and a perpetuity growth rate. Changes in such estimates or the application of alternative assumptions could produce different results.
For trademarks and other intangible assets with indefinite lives, the Company performs a quantitative analysis to test for impairment and compares the estimated fair value of an asset to its carrying amount. If the carrying amount of such asset exceeds its estimated fair value, an impairment charge is recorded for the difference between the carrying amount and the estimated fair value. The Company uses the income approach to estimate the fair value of its trademarks and other intangible assets with indefinite lives. This approach requires significant judgments in determining both the assets’ estimated cash flows as well as the appropriate discount and foreign exchange rates applied to those cash flows to determine fair value. Changes in such estimates or the use of alternative assumptions could produce different results.
Stock-based Compensation
The Company grants various nonqualified stock-based compensation awards to eligible employees, including stock options and performance units.
For stock options, the Company estimates the fair value of each award on the date of grant using the Black-Scholes valuation model, which requires management to make estimates regarding expected option life, stock price volatility and other assumptions. Groups of employees that have similar historical exercise behavior are considered separately for valuation purposes. The Company estimates stock option forfeitures based on historical data for each employee grouping. The total number of stock options expected to vest is adjusted by actual and estimated forfeitures. Changes to the actual and estimated forfeitures will result in a cumulative catch-up adjustment in the period of change. Compensation expense is recorded by amortizing the grant date fair values on a straight-line basis over the vesting period, adjusted for estimated forfeitures.
The Company’s performance unit grants provide for the issuance of common stock to certain managerial staff and executive management if the Company achieves specified performance targets. The performance period is three years and the payout determination is made at the end of the three-year performance period. The fair value of each grant issued is estimated on the date of grant based on the current market price of the stock. The total amount of compensation expense recognized reflects estimated forfeiture rates and the initial assumption that performance goals will be achieved. Compensation expense is adjusted based on management’s assessment of the probability that performance goals will be achieved. If such goals are not met or it is determined that achievement of performance goals is not probable, previously recognized compensation expense is trued up in the current period to reflect the expected payout level. If it is determined that the performance goals will be exceeded, additional compensation expense is recognized, subject to a cap of 150% of target.
Cash flows resulting from tax deductions in excess of the cumulative compensation cost recognized for stock-based payment arrangements (excess tax benefits) are primarily classified as financing cash inflows.
38
NOTE 1. SUMMARY OF SIGNIFICANT ACCOUNTING POLICIES (Continued)
Employee Benefits
The Company accounts for its defined benefit retirement income and retirement health care plans using actuarial methods. These methods use an attribution approach that generally spreads “plan events” over the service lives or expected lifetime (for frozen plans) of plan participants. Examples of plan events are plan amendments and changes in actuarial assumptions such as the expected return on plan assets, discount rate, rate of compensation increase and certain employee-related factors, such as retirement age and mortality. The principle underlying the attribution approach is that employees render service over their employment period on a relatively “smooth” basis and, therefore, the statement of earnings effects of retirement income and retirement health care plans are recognized in the same pattern. One of the principal assumptions used in the net periodic benefit cost calculation is the expected return on plan assets. The required use of an expected return on plan assets may result in recognized pension expense or income that differs from the actual returns of those plan assets in any given year. Over time, however, the goal is for the expected long-term returns to approximate the actual returns and, therefore, the expectation is that the pattern of income and expense recognition should closely match the pattern of the services provided by the participants. The Company uses a market-related value method for calculating plan assets for purposes of determining the amortization of actuarial gains and losses. The differences between actual and expected returns are recognized in the net periodic benefit cost calculation over the average remaining service period or expected lifetime (for frozen plans) of the plan participants using the corridor approach. Under this approach, only actuarial gains (losses) that exceed 5% of the greater of the projected benefit obligation or the market-related value of assets are amortized to pension expense by the Company. In developing its expected return on plan assets, the Company considers the long-term actual returns relative to the mix of investments that comprise its plan assets and also develops estimates of future investment returns by considering external sources.
The Company recognizes an actuarial-based obligation at the onset of disability for certain benefits provided to individuals after employment, but before retirement, that include medical, dental, vision, life and other benefits.
Environmental Costs
The Company is involved in certain environmental remediation and ongoing compliance activities. Accruals for environmental matters are recorded on a site-by-site basis when it is probable that a liability has been incurred and based upon a reasonable estimate of the liability. The Company’s accruals reflect the anticipated participation of other potentially responsible parties in those instances where it is probable that such parties are legally responsible and financially capable of paying their respective shares of the relevant costs. These accruals are adjusted periodically as assessment and remediation efforts progress or as additional technical or legal information become available. Actual costs to be incurred at identified sites in future periods may vary from the estimates, given the inherent uncertainties in evaluating environmental exposures. The accrual for environmental matters is included in Other liabilities in the Company’s consolidated balance sheets on an undiscounted basis due to uncertainty regarding the timing of future payments.
Revenue Recognition
Sales are recognized as revenue when the risk of loss and title pass to the customer and when all of the following have occurred: a firm sales arrangement exists, pricing is fixed or determinable and collection is reasonably assured. Sales are recorded net of allowances for returns, trade promotions, coupons and other discounts. The Company routinely commits to one-time or ongoing trade-promotion programs with customers and consumer coupon programs that require the Company to estimate and accrue the expected costs of such programs. Programs include shelf price reductions, end-of-aisle or in-store displays of the Company’s products and graphics and other trade-promotion activities conducted by the customer. Coupons are recognized as a liability when distributed based upon expected consumer redemptions. The Company maintains liabilities related to these programs for the estimated expenses incurred, but not paid, at the end of each period. Trade-promotion and coupon redemption costs are recorded as a reduction of sales.
The Company provides an allowance for doubtful accounts based on its historical experience and ongoing assessment of its customers’ credit risk. Receivables were presented net of an allowance for doubtful accounts of $4 and $3 as of June 30, 2015 and 2014, respectively. Receivables, net, included non-customer receivables of $12 and $15 as of June 30, 2015 and 2014, respectively.
39
NOTE 1. SUMMARY OF SIGNIFICANT ACCOUNTING POLICIES (Continued)
Cost of Products Sold
Cost of products sold represents the costs directly related to the manufacture and distribution of the Company’s products and primarily includes raw materials, packaging, contract packer fees, shipping and handling, warehousing, package design, depreciation, amortization, direct and indirect labor and operating costs for the Company’s manufacturing and distribution facilities including salary, benefit costs and incentive compensation, and royalties and amortization related to the Company’s Glad Venture Agreement (see Note 9).
Costs associated with developing and designing new packaging are expensed as incurred and include design, artwork, films and labeling. Expenses for fiscal years ended June 30, 2015, 2014 and 2013 were $11, $12 and $10, respectively, all of which were reflected in cost of products sold or discontinued operations, as appropriate, in the consolidated statements of earnings.
Selling and Administrative Expenses
Selling and administrative expenses represent costs incurred by the Company in generating revenues and managing the business and include market research, commissions and certain administrative expenses. Administrative expenses include salary, benefits, incentive compensation, professional fees and services, software and licensing fees and other operating costs associated with the Company’s non-manufacturing, non-research and development staff, facilities and equipment.
Advertising and Research and Development Costs
The Company expenses advertising and research and development costs in the period incurred.
Income Taxes
The Company uses the asset and liability method to account for income taxes. Deferred tax assets and liabilities are recognized for the anticipated future tax consequences attributable to differences between financial statement amounts and their respective tax bases. Management reviews the Company’s deferred tax assets to determine whether their value can be realized based upon available evidence. A valuation allowance is established when management believes that it is more likely than not that some portion of its deferred tax assets will not be realized. Changes in valuation allowances from period to period are included in the Company’s tax provision in the period of change. In addition to valuation allowances, the Company provides for uncertain tax positions when such tax positions do not meet certain recognition thresholds or measurement standards. Amounts for uncertain tax positions are adjusted in quarters when new information becomes available or when positions are effectively settled.
U.S. income tax expense and foreign withholding taxes are provided on unremitted foreign earnings that are not indefinitely reinvested at the time the earnings are generated. Where foreign earnings are indefinitely reinvested, no provision for U.S. income or foreign withholding taxes is made. When circumstances change and the Company determines that some or all of the undistributed earnings will be remitted in the foreseeable future, the Company accrues an expense in the current period for U.S. income taxes and foreign withholding taxes attributable to the anticipated remittance.
40
NOTE 1. SUMMARY OF SIGNIFICANT ACCOUNTING POLICIES (Continued)
Foreign Currency Transactions and Translation
Local currencies are the functional currencies for substantially all of the Company’s foreign operations. When the transactional currency is different than the functional currency, transaction gains and losses are included as a component of other income, net. In addition, certain assets and liabilities denominated in currencies different than a foreign subsidiary’s functional currency are reported on the subsidiary’s books in its functional currency, with the impact from exchange rate differences recorded in other income, net. Assets and liabilities of foreign operations are translated into U.S. dollars using the exchange rates in effect at the balance sheet date, while income and expenses are translated at the average monthly exchange rates during the year.
Gains and losses on foreign currency translations are reported as a component of other comprehensive income. Deferred taxes are not provided on cumulative translation adjustments where the Company expects earnings of a foreign subsidiary to be indefinitely reinvested. The income tax effect of currency translation adjustments related to foreign subsidiaries and joint ventures for which earnings are not considered indefinitely reinvested is recorded as a component of deferred taxes with an offset to other comprehensive income.
Derivative Instruments
The Company’s use of derivative instruments, principally swaps, futures and forward contracts, is limited to non-trading purposes and is designed to partially manage exposure to changes in commodity prices, interest rates and foreign currencies. The Company’s contracts are hedges for transactions with notional amounts and periods consistent with the related exposures and do not constitute investments independent of these exposures.
The changes in the fair value (i.e., gains or losses) of a derivative instrument are recorded as either assets or liabilities in the consolidated balance sheets with an offset to net earnings or other comprehensive income depending on whether, for accounting purposes, it has been designated and qualifies as an accounting hedge and, if so, on the type of hedging relationship. The criteria used to determine if hedge accounting treatment is appropriate are: (a) formal designation and documentation of the hedging relationship, the risk management objective and hedging strategy at hedge inception; (b) eligibility of hedged items, transactions and corresponding hedging instrument; and (c) effectiveness of the hedging relationship both at inception of the hedge and on an ongoing basis in achieving the hedging objectives. For those derivative instruments designated and qualifying as hedging instruments, the Company must designate the hedging instrument either as a fair value hedge or as a cash flow hedge. The Company designates its commodity forward and future contracts for forecasted purchases of raw materials, interest rate forward contracts for forecasted interest payments, and foreign currency forward contracts for forecasted purchases of inventory as cash flow hedges. During the fiscal years ended June 30, 2015, 2014 and 2013, the Company had no hedging instruments designated as fair value hedges.
For derivative instruments designated and qualifying as cash flow hedges, the effective portion of gains or losses is reported as a component of other comprehensive income and reclassified into earnings in the same period or periods during which the hedged transaction affects earnings. From time to time, the Company may have contracts not designated as hedges for accounting purposes, for which it recognizes changes in the fair value in other income, net. Cash flows from hedging activities are classified as operating activities in the consolidated statements of cash flows.
41
NOTE 1. SUMMARY OF SIGNIFICANT ACCOUNTING POLICIES (Continued)
The Company de-designates cash flow hedge relationships when it determines that the hedge relationships are no longer highly effective or that the forecasted transaction is no longer probable. Upon de-designation of a hedge, the portion of gains or losses on the derivative instrument that was previously accumulated in other comprehensive income remains in accumulated other comprehensive income until the forecasted transaction is recognized in net earnings, or is recognized in net earnings immediately if it is determined that there is any ineffectiveness or the forecasted transaction is no longer probable.
The Company uses different methodologies, when necessary, to estimate the fair value of its derivative contracts. The estimated fair values of the majority of the Company’s contracts are based on quoted market prices, traded exchange market prices, or broker price quotations, and represent the estimated amounts that the Company would pay or receive to terminate the contracts.
Recently Issued Accounting Pronouncements
In April 2015, the Financial Accounting Standards Board (FASB) issued Accounting Standards Update (ASU) No. 2015-03, “Simplifying the Presentation of Debt Issuance Cost,” which requires that debt issuance costs related to a recognized debt liability be presented in the balance sheet as a direct deduction from the carrying amount of that debt liability, consistent with debt discounts. The new guidance is effective for the Company beginning in the first quarter of fiscal year 2017, with early adoption permitted. The Company is currently evaluating the impact that adoption of ASU 2015-03 will have on its consolidated financial statements.
In February 2015, the FASB issued ASU No. 2015-02, “Amendments to the Consolidation Analysis,” which changes the guidance for evaluating whether to consolidate certain legal entities. The amendments modify the evaluation of whether limited partnerships and similar legal entities are variable interest entities ("VIEs") or voting interest entities. The new guidance is effective for the Company beginning in the first quarter of fiscal year 2017, with early adoption permitted. The Company is currently evaluating the impact that adoption of ASU 2015-02 will have on its consolidated financial statements.
In May 2014, the FASB issued ASU No. 2014-09, “Revenue from Contracts with Customers (Topic 606),” which replaces most existing U.S. GAAP revenue recognition guidance and is intended to improve and converge with international standards the financial reporting requirements for revenue from contracts with customers. The core principle of ASU 2014-09 is that an entity should recognize revenue for the transfer of goods or services equal to the amount that it expects to be entitled to receive for those goods or services. ASU 2014-09 also requires additional disclosures about the nature, timing and uncertainty of revenue and cash flows arising from contracts with customers, including information about significant judgments and changes in judgments. The new guidance is effective for the Company beginning in the first quarter of fiscal year 2019, with the option to early adopt in the first quarter of fiscal year 2018. The Company is currently evaluating the impact that adoption of ASU 2014-09 will have on its consolidated financial statements.
In April 2014, the FASB issued ASU No. 2014-08, “Reporting Discontinued Operations and Disclosures of Disposals of Components of an Entity (Topic 205),” which will change the criteria for reporting discontinued operations. The amendments will also require new disclosures about discontinued operations and disposals of components of an entity that do not qualify for discontinued operations reporting. The amendments are effective for the Company for new disposals (or classifications as held for sale) of components of the Company, should they occur, beginning in the first quarter of fiscal year 2016. Early adoption is permitted for disposals (or classifications as held for sale) that have not been previously reported. The Company will adopt this ASU beginning in the first quarter of fiscal year 2016, as required. Adoption of the new standard will not impact the Company’s reporting or disclosures for discontinued operations of Clorox Venezuela or other previously discontinued operations.
42
NOTE 2. DISCONTINUED OPERATIONS
On September 22, 2014, Clorox Venezuela announced that it was discontinuing its operations, effective immediately, and seeking to sell its assets. Since fiscal year 2012, Clorox Venezuela was required to sell more than two thirds of its products at prices frozen by the Venezuelan government. During this same period, Clorox Venezuela experienced successive years of hyperinflation resulting in significant sustained increases in its input costs, including packaging, raw materials, transportation and wages. As a result, Clorox Venezuela had been selling its products at a loss, resulting in ongoing operating losses. Clorox Venezuela repeatedly met with government authorities in an effort to help them understand the rapidly declining state of the business, including the need for immediate, significant and ongoing price increases and other critical remedial actions to address these adverse impacts. Based on the Venezuelan government’s representations, Clorox Venezuela had expected significant price increases would be forthcoming much earlier; however, the price increases subsequently approved were insufficient and would have caused Clorox Venezuela to continue operating at a significant loss into the foreseeable future. As such, Clorox Venezuela was no longer financially viable and was forced to discontinue its operations.
On September 26, 2014, the Company reported that Venezuelan Vice President Jorge Arreaza announced, with endorsement by President Nicolás Maduro, that the Venezuelan government had occupied the Santa Lucía and Guacara production facilities of Clorox Venezuela. On November 6, 2014, the Company reported that the Venezuelan government had published a resolution granting a government-sponsored Special Administrative Board full authority to restart and operate the business of Clorox Venezuela, thereby reaffirming the government's expropriation of Clorox Venezuela’s assets. Further, President Nicolás Maduro announced the government's intention to facilitate the resumed production of bleach and other cleaning products at Clorox Venezuela plants. He also announced his approval of a financial credit to invest in raw materials and production at the plants. These actions by the Venezuelan government were taken without the consent or involvement of Clorox Venezuela, its parent Clorox Spain S.L. (Clorox Spain) or any of their affiliates. Clorox Venezuela, Clorox Spain and their affiliates reserved their rights under all applicable laws and treaties.
With this exit, the financial results of Clorox Venezuela are reflected as discontinued operations in the Company’s consolidated financial statements. The results of Clorox Venezuela have historically been part of the International reportable segment.
Net sales for Clorox Venezuela were $11, $77 and $90 for the fiscal years ended June 30, 2015, 2014 and 2013, respectively.
The following table provides a summary of (losses) gains from discontinued operations for Clorox Venezuela and gains (losses) from discontinued operations other than Clorox Venezuela for the years ended June 30:
| 2015 | 2014 | 2013 | ||||||||||
| Operating (losses) earnings from Clorox Venezuela before income taxes | $ | (6 | ) | $ | (23 | ) | $ | 1 | ||||
| Exit costs and other related expenses for Clorox Venezuela | (78 | ) | - | - | ||||||||
| Total losses from Clorox Venezuela before income taxes | (84 | ) | (23 | ) | 1 | |||||||
| Income tax benefit attributable to Clorox Venezuela | 29 | 6 | - | |||||||||
| Total (losses) gains from Clorox Venezuela, net of tax | (55 | ) | (17 | ) | 1 | |||||||
| Gains (losses) from discontinued operations other than | ||||||||||||
| Clorox Venezuela, net of tax | 29 | (4 | ) | (2 | ) | |||||||
| Losses from discontinued operations, net of tax | $ | (26 | ) | $ | (21 | ) | $ | (1 | ) | |||
Unrelated to Clorox Venezuela, in the fiscal year ended June 30, 2015, $32 of gross unrecognized tax benefits relating to other discontinued operations for periods prior to fiscal year 2015 were recognized upon the expiration of the applicable statute of limitations. Recognition of these previously disclosed tax benefits had no impact on the Company’s cash flow or earnings from continuing operations for the fiscal years ended June 30, 2015, 2014 and 2013. (See Note 17.)
43
NOTE 2. DISCONTINUED OPERATIONS (Continued)
Summary of Operating Losses, Asset Charges and Other Costs
The following provides a breakdown of (losses) gains from discontinued operations for Clorox Venezuela and gains from discontinued operations other than Clorox Venezuela for the fiscal year ended June 30:
| 2015 | ||||
| Operating losses from Clorox Venezuela before income taxes | $ | (6 | ) | |
| Net asset charges: | ||||
| Inventories | (11 | ) | ||
| Property, plant and equipment | (16 | ) | ||
| Trademark and other intangible assets | (6 | ) | ||
| Other assets | (2 | ) | ||
| Other exit and business termination costs: | ||||
| Severance | (3 | ) | ||
| Recognition of deferred foreign currency translation loss | (30 | ) | ||
| Other | (10 | ) | ||
| Total losses from Clorox Venezuela before income taxes | (84 | ) | ||
| Income tax benefit attributable to Clorox Venezuela | 29 | |||
| Total losses from Clorox Venezuela, net of tax | (55 | ) | ||
| Gains from discontinued operations other than | ||||
| Clorox Venezuela, net of tax | 29 | |||
| Losses from discontinued operations, net of tax | $ | (26 | ) | |
Prior to Clorox Venezuela being consolidated under the rules governing the preparation of financial statements in a highly inflationary economy, cumulative translation gains (losses) were included as a component of accumulated other comprehensive net (losses) income. The charge of $30 to discontinued operations in September 2014 represents the recognition of these losses as a result of Clorox Venezuela discontinuing its operations effective September 22, 2014.
Goodwill related to Clorox Venezuela was previously aggregated and assessed for impairment at the Latin America reporting unit level, which is a component of the Company's International segment. In the first quarter of fiscal year 2015, after Clorox Venezuela discontinued its operations, the Company reviewed the relative fair value of its components of the Latin America reporting unit and concluded that no goodwill should be allocated to the Clorox Venezuela component and that there were no indicators of impairment within the remaining Latin America reporting unit. Based on the results of the annual impairment test performed in the fourth quarter of fiscal year 2015, the fair value of the Latin America reporting unit exceeded its recorded value by approximately 79%.
44
NOTE 2. DISCONTINUED OPERATIONS (Continued)
Financial Reporting: Hyperinflation and the Selection of Exchange Rates
Due to a sustained inflationary environment, the financial statements of Clorox Venezuela are consolidated under the rules governing the preparation of financial statements in a highly inflationary economy. As such, Clorox Venezuela’s non-U.S. dollar (non-USD) monetary assets and liabilities were remeasured into U.S. dollars (USD) each reporting period with the resulting gains and losses now reflected in discontinued operations.
Subsequent to Clorox Venezuela discontinuing operations in September 2014, the Venezuelan government has continued to evolve its currency exchange mechanisms; however, these changes have not had a material impact on the Company’s financial results because the balance of net bolivar assets and liabilities on the local books of Clorox Venezuela was $0 as of June 30, 2015. As of June 30, 2014, the local books of Clorox Venezuela carried a net asset position of $42. In addition, as of June 30, 2015 and 2014, the Company held $13 and $17, respectively, of tax asset balances related to Clorox Venezuela in Corporate in the reconciliation of the results of the Company’s reportable segments to consolidated results.
NOTE 3. INVENTORIES
Inventories consisted of the following as of June 30:
| 2015 | 2014 | |||||||
| Finished goods | $ | 316 | $ | 312 | ||||
| Raw materials and packaging | 101 | 108 | ||||||
| Work in process | 3 | 2 | ||||||
| LIFO allowances | (35 | ) | (36 | ) | ||||
| Total | $ | 385 | $ | 386 | ||||
The last-in, first-out (LIFO) method was used to value approximately 38% and 34% of inventories as of June 30, 2015 and 2014, respectively. The carrying values for all other inventories, including inventories of all international businesses, are determined on the first-in, first-out (FIFO) method. The effect on earnings of the liquidation of LIFO layers was a benefit of $0, $2 and $3 for the fiscal years ended June 30, 2015, 2014 and 2013, respectively.
The Company had inventory consigned to others of $2 and $4 as of June 30, 2015 and 2014, respectively.
NOTE 4. OTHER CURRENT ASSETS
Other current assets consisted of the following as of June 30:
| 2015 | 2014 | |||||
| Deferred tax assets | $ | 99 | $ | 81 | ||
| Prepaid expenses | 39 | 42 | ||||
| Other | 5 | 11 | ||||
| Total | $ | 143 | $ | 134 | ||
As of June 30, 2015 and 2014, Other in the table above included $3 and $9 of restricted cash, respectively. As of June 30, 2015 and 2014, the Company had restricted cash of $3 and $3, respectively, held in escrow related to fiscal year 2012 acquisitions. Additionally, as of June 30, 2015 and 2014, restricted cash of $0 and $5, respectively, was held by a foreign subsidiary as a prepayment received for intercompany services.
45
NOTE 5. PROPERTY, PLANT AND EQUIPMENT, NET
The components of property, plant and equipment, net, consisted of the following as of June 30:
| 2015 | 2014 | |||||||
| Machinery and equipment | $ | 1,608 | $ | 1,593 | ||||
| Buildings | 515 | 506 | ||||||
| Capitalized software costs | 371 | 374 | ||||||
| Land and improvements | 122 | 122 | ||||||
| Construction in progress | 65 | 79 | ||||||
| Computer equipment | 76 | 79 | ||||||
| 2,757 | 2,753 | |||||||
| Less: accumulated depreciation and amortization | (1,839 | ) | (1,776 | ) | ||||
| Total | $ | 918 | $ | 977 | ||||
Included in Machinery and equipment above are $12 and $0 of equipment under capital leases as of June 30, 2015 and 2014, respectively. Accumulated depreciation for assets under capital leases was $2 and $0 as of June 30, 2015 and 2014, respectively.
Included in Land and improvements above are $2 and $0 of asset retirement obligations as of June 30, 2015 and 2014, respectively, for two leased properties. The liability of $2 incurred in fiscal year 2015 was recorded in Other liabilities.
Depreciation and amortization expense related to property, plant and equipment, net, was $157, $161 and $162 in fiscal years 2015, 2014 and 2013, respectively, which includes depreciation of assets under capital leases. This also includes amortization of capitalized software of $19, $22 and $21 in fiscal years 2015, 2014 and 2013, respectively.
Non-cash capital expenditures were $18, $0 and $0 in fiscal years 2015, 2014 and 2013, respectively.
46
NOTE 6. GOODWILL, TRADEMARKS AND OTHER INTANGIBLE ASSETS
The changes in the carrying amount of goodwill by reportable segment for the fiscal years ended June 30, 2015 and 2014 were as follows:
| Goodwill | |||||||||||||||||
| Cleaning | Lifestyle | Household | International | Total | |||||||||||||
| Balance June 30, 2013 | $ | 323 | $ | 244 | $ | 85 | $ | 453 | $ | 1,105 | |||||||
| Effect of foreign currency translation | - | - | - | (4 | ) | (4 | ) | ||||||||||
| Balance June 30, 2014 | 323 | 244 | 85 | 449 | 1,101 | ||||||||||||
| Effect of foreign currency translation | - | - | - | (34 | ) | (34 | ) | ||||||||||
| Balance June 30, 2015 | $ | 323 | $ | 244 | $ | 85 | $ | 415 | $ | 1,067 | |||||||
During the fourth quarter of fiscal years 2015, 2014 and 2013, the Company completed its annual impairment tests of goodwill and no instances of impairment were identified.
The changes in the carrying amount of trademarks and other intangible assets for the fiscal years ended June 30, 2015 and 2014 were as follows:
| As of June 30, 2015 | As of June 30, 2014 | |||||||||||||||||
| Gross carrying amount |
Accumulated amortization |
Net carrying amount |
Gross carrying amount |
Accumulated amortization |
Net carrying amount | |||||||||||||
| Trademarks not subject to amortization | $ | 524 | $ | - | $ | 524 | $ | 533 | $ | - | $ | 533 | ||||||
| Trademarks subject to amortization | 33 | 22 | 11 | 36 | 22 | 14 | ||||||||||||
| Other intangible assets: | ||||||||||||||||||
| Technology and product formulae | 137 | 133 | 4 | 139 | 129 | 10 | ||||||||||||
| Other | 188 | 142 | 46 | 194 | 140 | 54 | ||||||||||||
| Total | $ | 882 | $ | 297 | $ | 585 | $ | 902 | $ | 291 | $ | 611 | ||||||
47
NOTE 6. GOODWILL, TRADEMARKS AND OTHER INTANGIBLE ASSETS (Continued)
Amortization expense relating to our intangible assets was $12, $15 and $15 for the years ended June 30, 2015, 2014 and 2013, respectively. Estimated amortization expense for these intangible assets is $8, $8, $7, $7 and $6 for fiscal years 2016, 2017, 2018, 2019 and 2020, respectively.
In the first quarter of fiscal year 2015, the Company recorded impairment of trademarks and other intangible assets of $6 related to the discontinuation of operations in Venezuela. This amount is included as part of losses from discontinued operations, net of tax.
In fiscal year 2014, as a result of the effective devaluation of the Venezuelan currency in the third quarter, the Company assessed whether recorded values of intangible assets attributable to the Venezuela subsidiary and goodwill of the reporting unit that included Venezuela were impaired. As a result of its assessment, the Company identified indications of impairment and recorded noncash tax deductible impairment charges on trademark values totaling $4, which is reflected in the International reportable segment. Of this amount, $3 is related to continuing operations and is reflected in Other income, net and $1 is related to trademarks held on the books of Clorox Venezuela and is reflected in losses from discontinued operations, net. The Company used the income approach to estimate the fair value of the trademarks, and as such, the fair value measurement was classified as Level 3. For a further discussion of Clorox Venezuela’s intangible and other asset balances, see Note 2.
In fiscal year 2014, the Company entered into an exclusivity agreement with a manufacturer. In connection with the agreement, the Company recorded an Other intangible asset valued at $4 that will be amortized over the 7 year term of the agreement. The agreement may be renewed for an additional 3 years at no cost upon mutual consent.
During the fourth quarter of fiscal years 2015, 2014 and 2013, the Company completed its annual impairment tests of indefinite-lived intangible assets and no instances of impairment were identified.
NOTE 7. ACCRUED LIABILITIES
Accrued liabilities consisted of the following as of June 30:
| 2015 | 2014 | |||||
| Compensation and employee benefit costs | $ | 189 | $ | 102 | ||
| Trade and sales promotion | 115 | 113 | ||||
| Dividends | 103 | 100 | ||||
| Royalties | 16 | 11 | ||||
| Insurance | 15 | 18 | ||||
| Interest | 14 | 27 | ||||
| Derivatives | 8 | 17 | ||||
| Other | 88 | 84 | ||||
| Total | $ | 548 | $ | 472 | ||
48
NOTE 8. DEBT
Notes and loans payable, which mature in less than one year, included the following as of June 30:
| 2015 | 2014 | |||||
| Commercial paper | $ | 93 | $ | 141 | ||
| Foreign borrowings | 2 | 2 | ||||
| Total | $ | 95 | $ | 143 | ||
The weighted average interest rates incurred on average outstanding notes and loans payable during the fiscal years ended June 30, 2015, 2014 and 2013, including fees associated with the Company’s undrawn revolving credit facility, were 2.05%, 0.97% and 1.68%, respectively. The weighted average effective interest rates on commercial paper balances as of June 30, 2015 and 2014, were 0.39% and 0.28%, respectively.
Long-term debt, carried at face value net of unamortized discounts or premiums, included the following as of June 30:
| 2015 | 2014 | |||||||
| Senior unsecured notes and debentures: | ||||||||
| 5.00%, $575 due January 2015 | $ | - | $ | 575 | ||||
| 3.55%, $300 due November 2015 | 300 | 300 | ||||||
| 5.95%, $400 due October 2017 | 399 | 399 | ||||||
| 3.80%, $300 due November 2021 | 298 | 298 | ||||||
| 3.05%, $600 due September 2022 | 599 | 598 | ||||||
| 3.50%, $500 due December 2024 | 500 | - | ||||||
| Total | 2,096 | 2,170 | ||||||
| Less: Current maturities of long-term debt | (300 | ) | (575 | ) | ||||
| Long-term debt | $ | 1,796 | $ | 1,595 | ||||
The weighted average interest rates incurred on average outstanding long-term debt during the fiscal years ended June 30, 2015, 2014 and 2013, were 4.44%, 4.56% and 4.76%, respectively. The weighted average effective interest rates on long-term debt balances as of June 30, 2015 and 2014, were 4.31% and 4.56%, respectively.
In January 2015, $575 of the Company’s senior notes with an annual fixed interest rate of 5.00% became due and were repaid using the net proceeds from the December 2014 debt issuance and commercial paper borrowings.
49
NOTE 8. DEBT (Continued)
In December 2014, under a shelf registration statement filed with the SEC that will expire in December 2017, the Company issued $500 of senior notes with an annual fixed interest rate of 3.50%. Interest on the notes is payable semi-annually in June and December and the notes have a maturity date of December 15, 2024. The notes carry an effective interest rate of 4.10%, which includes the impact from the settlement of interest rate forward contracts in December 2014 (see Note 10). The notes rank equally with all of the Company’s existing senior indebtedness.
In March 2013, $500 in senior notes with an annual fixed interest rate of 5.00% became due and were repaid. The repayment was funded in part with commercial paper borrowings and in part with a portion of the proceeds from the sale-leaseback transaction of the Company’s Oakland, Calif., general office building (see Note 9).
In October 2012, $350 in senior notes with an annual fixed interest rate of 5.45% became due and were repaid. The repayment was funded with a portion of the proceeds from the September 2012 issuance of $600 in senior notes with an annual fixed interest rate of 3.05%, payable semi-annually in March and September, and a maturity date of September 15, 2022. The remaining proceeds from the September 2012 issuance were used to repay commercial paper. The September 2012 notes were issued under the Company’s shelf registration statement filed in November 2011 and rank equally with all of the Company’s existing senior indebtedness.
The Company’s borrowing capacity under other financing arrangements as of June 30 was as follows:
| 2015 | 2014 | |||||
| Revolving credit facility | $ | 1,100 | $ | 1,100 | ||
| Foreign credit lines | 11 | 31 | ||||
| Other credit lines | 18 | 13 | ||||
| Total | $ | 1,129 | $ | 1,144 | ||
As of June 30, 2015, the Company had a $1,100 revolving credit agreement (the Credit Agreement), which expires in October 2019. The Credit Agreement replaced a prior $1,100 revolving credit agreement in place since May 2012. There were no borrowings under the Credit Agreement as of June 30, 2015 or 2014, and the Company believes that borrowings under the Credit Agreement are and will continue to be available for general corporate purposes. The agreement includes certain restrictive covenants and limitations, with which the Company was in compliance as of June 30, 2015.
Of the $29 of foreign and other credit lines as of June 30, 2015, $4 was outstanding and the remainder of $25 was available for borrowing. Of the $44 of foreign and other credit lines as of June 30, 2014, $5 was outstanding and the remainder of $39 was available for borrowing. As of June 30, 2014, $7 of the foreign credit lines related to Clorox Venezuela, of which $1 was outstanding.
Long-term debt maturities as of June 30, 2015, are $300, $0, $400, $0, $0 and $1,400 in fiscal years 2016, 2017, 2018, 2019, 2020 and thereafter, respectively.
50
NOTE 9. OTHER LIABILITIES
Other liabilities consisted of the following as of June 30:
| 2015 | 2014 | |||||
| Employee benefit obligations | $ | 299 | $ | 289 | ||
| Venture agreement net terminal obligation | 294 | 290 | ||||
| Taxes | 38 | 76 | ||||
| Other | 119 | 113 | ||||
| Total | $ | 750 | $ | 768 | ||
Venture Agreement
The Company has an agreement with The Procter & Gamble Company (P&G) for its Glad® plastic bags, wraps and containers business. The Company maintains a net terminal obligation liability, which reflects the estimated value of the contractual requirement to repurchase P&G’s interest at the termination of the agreement. As of June 30, 2015 and 2014, P&G had a 20% interest in the venture. The Company pays a royalty to P&G for its interest in the profits, losses and cash flows, as contractually defined, of the Glad® business, which is included in cost of products sold.
The agreement, entered into in 2003, has a 20-year term, with a 10-year renewal option by mutual agreement and can be terminated under certain circumstances, including at P&G’s option upon a change in control of the Company or, at either party’s option, upon the sale of the Glad® business by the Company. Upon termination of the agreement, the Company will purchase P&G’s interest for cash at fair value as established by predetermined valuation procedures. Following termination, the Glad® business will retain the exclusive core intellectual property licenses contributed by P&G on a royalty-free basis for the licensed products marketed.
Deferred Gain on Sale-leaseback Transaction
In December 2012, the Company completed a sale-leaseback transaction under which it sold its general office building in Oakland, Calif. to an unrelated third party for net proceeds of $108 and entered into a 15-year operating lease agreement with renewal options with the buyer for a portion of the building. The Company deferred recognition of the portion of the total gain on the sale that was equivalent to the present value of the lease payments and will continue to amortize such amount to earnings ratably over the lease term. As of June 30, 2015 and 2014, the long-term portion of the deferred gain of $40 and $43, respectively, was included in Other in the table above.
51
NOTE 10. FINANCIAL INSTRUMENTS AND FAIR VALUE MEASUREMENTS
Financial assets and liabilities measured at fair value on a recurring basis in the consolidated balance sheets are required to be classified and disclosed in one of the following three categories of the fair value hierarchy:
Level 1: Quoted market prices
in active markets for identical assets or liabilities.
Level 2: Observable market-based inputs or
unobservable inputs that are corroborated by market data.
Level 3:
Unobservable inputs reflecting the reporting entity’s own assumptions.
As of June 30, 2015 and 2014, the Company’s financial assets and liabilities that were measured at fair value on a recurring basis during the period included derivative financial instruments, which were all classified as Level 2, and trust assets to fund certain of the Company’s nonqualified deferred compensation plans, which were classified as Level 1.
Financial Risk Management and Derivative Instruments
The Company is exposed to certain commodity, interest rate and foreign currency risks related to its ongoing business operations and uses derivative instruments to mitigate its exposure to these risks.
Commodity Price Risk Management
The Company may use commodity exchange traded futures and over-the-counter swap contracts to fix the price of a portion of its forecasted raw material requirements. Contract maturities, which are generally no longer than 2 years, are matched to the length of the raw material purchase contracts. Commodity purchase contracts are measured at fair value using market quotations obtained from commodity derivative dealers.
As of June 30, 2015, the notional amount of commodity derivatives was $47, of which $27 related to jet fuel swaps and $20 related to soybean oil futures. As of June 30, 2014, the notional amount of commodity derivatives was $36, of which $19 related to jet fuel swaps and $17 related to soybean oil futures.
52
NOTE 10. FINANCIAL INSTRUMENTS AND FAIR VALUE MEASUREMENTS (Continued)
Interest Rate Risk Management
The Company may enter into over-the-counter interest rate forward contracts to fix a portion of the benchmark interest rate prior to the anticipated issuance of fixed rate debt. These interest rate forward contracts generally have durations of less than 12 months. The interest rate contracts are measured at fair value using information quoted by U.S. government bond dealers.
As of June 30, 2015 and 2014, the notional amount of interest rate forward contracts was $0 and $288, respectively.
During fiscal year 2015, the Company paid $25 to settle interest rate forward contracts related to the December 2014 issuance of $500 in senior notes. The settlement payments are reflected as operating cash flows in the consolidated statements of cash flows for the fiscal year ended June 30, 2015. The loss is reflected in accumulated other comprehensive net loss on the consolidated balance sheet as of June 30, 2015, and will be amortized into interest expense on the consolidated statements of earnings over the 10-year term of the notes.
Foreign Currency Risk Management
The Company may also enter into certain over-the-counter foreign currency-related derivative contracts to manage a portion of the Company’s forecasted foreign currency exposure associated with the purchase of inventory and certain intercompany transactions. These foreign currency contracts generally have durations of no longer than 16 months. The foreign exchange contracts are measured at fair value using information quoted by foreign exchange dealers.
The notional amounts of outstanding foreign currency forward contracts used by the Company’s subsidiaries in Canada, Australia and New Zealand to hedge forecasted purchases of inventory were $64, $35 and $6, respectively, as of June 30, 2015, and $54, $28 and $5, respectively, as of June 30, 2014.
Counterparty Risk Management
The Company utilizes a variety of financial institutions as counterparties for over-the counter derivative instruments. The Company enters into agreements governing the use of over-the-counter derivative instruments and sets internal limits on the aggregate over-the-counter derivative instrument positions held with each counterparty. Certain terms of these agreements require the Company or the counterparty to post collateral when the fair value of the derivative instruments exceeds contractually defined counterparty liability position limits. Of the $8 and $17 of the derivative instruments reflected in accrued liabilities as of June 30, 2015 and 2014, respectively, $8 and $11, respectively, contained such terms. As of both June 30, 2015 and 2014, neither the Company nor any counterparty was required to post any collateral.
Certain terms of the agreements governing the Company’s over-the-counter derivative instruments require the credit ratings, as assigned by Standard & Poor’s and Moody’s to the Company and its counterparties, to remain at a level equal to or better than the minimum of an investment grade credit rating. If the Company’s credit ratings were to fall below investment grade, the counterparties to the derivative instruments could request full collateralization on derivative instruments in net liability positions.
As of both June 30, 2015 and 2014, the Company and each of its counterparties had been assigned investment grade ratings by both Standard & Poor’s and Moody’s.
Certain of the Company’s exchange-traded futures contracts used for commodity price risk management include requirements for the Company to post collateral in the form of a cash margin account held by the Company’s broker for trades conducted on that exchange. As of June 30, 2015 and June 30, 2014, the Company maintained cash margin balances related to exchange-traded futures contracts of $2 and $1, respectively, which are classified as Other current assets on the consolidated balance sheets.
53
NOTE 10. FINANCIAL INSTRUMENTS AND FAIR VALUE MEASUREMENTS (Continued)
Fair Value of Financial Instruments
The following table summarizes the Company’s assets and liabilities that were measured at fair value in the consolidated balance sheets as of June 30:
| 2015 | 2014 | |||||||||||||||
| Balance
sheet classification |
Fair
value hierarchy level |
Carrying Amount |
Estimated Fair Value |
Carrying Amount |
Estimated Fair Value | |||||||||||
| Assets | ||||||||||||||||
| Investments including money market | Cash and cash | |||||||||||||||
| funds (a) | equivalents | 1 | $ | 212 | $ | 212 | $ | 150 | $ | 150 | ||||||
| Time deposits (a) | Cash
and cash equivalents |
2 | 84 | 84 | 75 | 75 | ||||||||||
| Foreign exchange derivative contracts | Other current assets | 2 | 1 | 1 | - | - | ||||||||||
| Interest rate contracts | Other current assets | 2 | - | - | - | - | ||||||||||
| Commodity purchase derivative contracts | Other current assets | 2 | - | - | 1 | 1 | ||||||||||
| Trust assets for nonqualified deferred | Other assets | 1 | 38 | 38 | 31 | 31 | ||||||||||
| compensation plans | ||||||||||||||||
| $ | 335 | $ | 335 | $ | 257 | $ | 257 | |||||||||
| Liabilities | ||||||||||||||||
| Commodity purchase derivative contracts | Accrued liabilities | 2 | $ | 8 | $ | 8 | $ | 1 | $ | 1 | ||||||
| Interest rate derivative contracts | Accrued liabilities | 2 | - | - | 13 | 13 | ||||||||||
| Foreign exchange derivative contracts | Accrued liabilities | 2 | - | - | 3 | 3 | ||||||||||
| Commodity purchase derivative contracts | Other liabilities | 2 | - | - | - | - | ||||||||||
| Notes and loans payable (b) | Notes and
loans payable |
2 | 95 | 95 | 143 | 143 | ||||||||||
| Long-term debt (c) | Other liabilities | 2 | 2,096 | 2,137 | 2,170 | 2,265 | ||||||||||
| $ | 2,199 | $ | 2,240 | $ | 2,330 | $ | 2,425 | |||||||||
| (a) | Cash equivalents are composed of time deposits and other interest bearing investments including money market funds with original maturity dates of 90 days or less. Cash equivalents are recorded at cost, which approximates fair value. | ||
| (b) | Short-term debt is composed of U.S. commercial paper and/or other similar short-term debts issued by non-U.S. subsidiaries, all of which are recorded at cost, which approximates fair value. | ||
| (c) | Long-term debt, which is recorded at cost, includes the current portion of debt instruments, which approximates fair value. The fair value of long-term debt was determined using secondary market prices quoted by corporate bond dealers, and was classified as Level 2. |
54
NOTE 10. FINANCIAL INSTRUMENTS AND FAIR VALUE MEASUREMENTS (Continued)
Derivatives
The Company designates its commodity forward and future contracts for forecasted purchases of raw materials, interest rate forward contracts for forecasted interest payments, and foreign currency forward contracts for forecasted purchases of inventory as cash flow hedges.
The effects of derivative instruments designated as hedging instruments on other comprehensive net (losses) income and the consolidated statements of earnings and the consolidated statements of comprehensive income were as follows during the fiscal years ended June 30:
| Gains
(losses) recognized in other comprehensive net loss |
Gains (losses)
reclassified from accumulated other comprehensive net loss and recognized in earnings | |||||||||||||||||||||||
| 2015 | 2014 | 2013 | 2015 | 2014 | 2013 | |||||||||||||||||||
| Commodity purchase derivative contracts | $ | (13 | ) | $ | 2 | $ | (1 | ) | $ | (5 | ) | $ | - | $ | - | |||||||||
| Interest rate derivative contracts | (12 | ) | (13 | ) | (1 | ) | (5 | ) | (4 | ) | (3 | ) | ||||||||||||
| Foreign exchange derivative contracts | 7 | (3 | ) | 3 | 3 | 4 | - | |||||||||||||||||
| Total | $ | (18 | ) | $ | (14 | ) | $ | 1 | $ | (7 | ) | $ | - | $ | (3 | ) | ||||||||
The gains (losses) reclassified from accumulated other comprehensive net (losses) income and recognized in earnings during the fiscal years ended June 30, 2015, 2014 and 2013, for commodity purchase and foreign exchange contracts were included in cost of products sold. The losses reclassified from accumulated other comprehensive net (losses) income and recognized in earnings during the fiscal years ended June 30, 2015, 2014 and 2013, for interest rate contracts were included in interest expense.
The estimated amount of the existing net loss in accumulated other comprehensive net (losses) income as of June 30, 2015, which is expected to be reclassified into earnings within the next twelve months, is $13. Gains and losses on derivative instruments representing either hedge ineffectiveness or hedge components excluded from the assessment of effectiveness are recognized in current earnings. During each of the fiscal years ended June 30, 2015, 2014 and 2013, hedge ineffectiveness was not significant.
Trust Assets
The Company has held interests in mutual funds and cash equivalents as part of trust assets related to certain of its nonqualified deferred compensation plans. The trusts represent variable interest entities for which the Company is considered the primary beneficiary, and therefore, trust assets are consolidated and included in Other assets in the consolidated balance sheets. The interests in mutual funds are measured at fair value using quoted market prices. The Company has designated these marketable securities as trading investments. The participants in the deferred compensation plans may select among certain mutual funds in which their compensation deferrals are invested in accordance with the terms of the plans and within the confines of the trusts which hold the marketable securities.
The value of the trust assets related to certain of the Company’s nonqualified deferred compensation plans increased by $7 as compared to June 30, 2014, primarily due to current quarter employees’ contributions to these plans and market returns.
55
NOTE 11. OTHER CONTINGENCIES AND GUARANTEES
Contingencies
The Company is involved in certain environmental matters, including response actions at various locations. The Company had a recorded liability of $12 and $14 as of June 30, 2015 and 2014, respectively, for its share of aggregate future remediation costs related to these matters. One matter in Dickinson County, Michigan, for which the Company is jointly and severally liable, accounted for a substantial majority of the recorded liability as of both June 30, 2015 and 2014. The Company has agreed to be liable for 24.3% of the aggregate remediation and associated costs for this matter pursuant to a cost-sharing arrangement with a third party. With the assistance of environmental consultants, the Company maintains an undiscounted liability representing its current best estimate of its share of the capital expenditures, maintenance and other costs that may be incurred over an estimated 30-year remediation period. Currently, the Company cannot accurately predict the timing of future payments that may be made under this obligation. In addition, the Company’s estimated loss exposure is sensitive to a variety of uncertain factors, including the efficacy of remediation efforts, changes in remediation requirements and the future availability of alternative clean-up technologies. Although it is reasonably possible that the Company’s exposure may exceed the amount recorded, any amount of such additional exposures, or range of exposures, is not estimable at this time.
In October 2012, a Brazilian appellate court issued an adverse decision in a lawsuit pending in Brazil against the Company and one of its wholly owned subsidiaries, The Glad Products Company (Glad). The lawsuit, which was initially filed in a Brazilian lower court in 2002 by two Brazilian companies and one Uruguayan company (collectively, Petroplus), relates to joint venture agreements for the distribution of STP auto-care products in Brazil with three companies that became subsidiaries of the Company as a result of the Company’s merger with First Brands Corporation in January 1999 (collectively, Clorox Subsidiaries). The pending lawsuit seeks indemnification for damages and losses for alleged breaches of the joint venture agreements and abuse of economic power by the Company and Glad. Petroplus had previously unsuccessfully raised the same claims and sought damages from the Company and the Clorox Subsidiaries in an International Chamber of Commerce (ICC) arbitration proceeding in Miami, Florida, filed in 2001. The ICC arbitration panel unanimously ruled against Petroplus in a final decision in November 2003 (Final ICC Arbitration Award). The Final ICC Arbitration Award was ratified by the Superior Court of Justice of Brazil in May 2007 (Foreign Judgment), and the United States District Court for the Southern District of Florida subsequently confirmed the Final ICC Arbitration Award and recognized and adopted the Foreign Judgment as a judgment of the United States District Court for the Southern District of Florida (U.S. Judgment). Despite this, in March 2008, a Brazilian lower court ruled against the Company and Glad in the pending lawsuit. The value of the judgment against the Company, including interest and foreign exchange fluctuations as of June 30, 2015, was approximately $32.
56
NOTE 11. OTHER CONTINGENCIES AND GUARANTEES (Continued)
Among other defenses, because the Final ICC Arbitration Award, the Foreign Judgment and the U.S. Judgment relate to the same claims as those in the pending lawsuit, the Company believes that Petroplus is precluded from re-litigating these claims. Based on the unfavorable appellate court decision, however, the Company believes that it is reasonably possible that a loss could be incurred in this matter in excess of amounts accrued, and that the estimated range of such loss in this matter is from $0 to $26.
The Company continues to believe that its defenses are meritorious, and has appealed the decision to the highest courts of Brazil. In December 2013, in the first stage of the appellate process, the appellate court declined to admit the Company’s appeals to the highest courts. The Company then appealed directly to the highest courts. While in May 2014 the Superior Court of Justice originally agreed to consider the Company’s appeal, in December 2014 the same court declined to admit the appeal based on procedural grounds. The Company successfully appealed that decision and the court agreed to admit the appeal in March 2015. The appeal is currently pending and it is possible that a final decision in this case could be issued as early as the first quarter of fiscal year 2016. Expenses related to this litigation have been, and any potential additional loss would be, reflected in discontinued operations, consistent with the Company’s classification of expenses related to its discontinued Brazil operations.
In a separate action filed in 2004 by Petroplus, in January 2013, a lower Brazilian court nullified the Final ICC Arbitration Award. The Company believes this judgment is inconsistent with the Foreign Judgment and the U.S. Judgment and that it is without merit. The Company appealed this decision, and the lower court decision was overturned by the appellate court in April 2014. Petroplus has appealed this decision to Brazil’s highest court.
Glad and the Clorox Subsidiaries have also filed separate lawsuits against Petroplus alleging misuse of the STP trademark and related matters, which are currently pending before Brazilian courts, and have taken other legal actions against Petroplus, which are pending. Additionally, in November 2013, the Clorox Subsidiaries initiated a new ICC arbitration seeking damages against Petroplus.
The Company is subject to various other lawsuits, claims and loss contingencies relating to issues such as contract disputes, product liability, patents and trademarks, advertising, commercial, administrative, employment claims and other matters. Based on management’s analysis, it is the opinion of management that the ultimate disposition of these matters, to the extent not previously provided for, will not have a material adverse effect, individually or in the aggregate, on the Company’s consolidated financial statements taken as a whole.
Guarantees
In conjunction with divestitures and other transactions, the Company may provide typical indemnifications (e.g., indemnifications for representations and warranties and retention of previously existing environmental, tax and employee liabilities) that have terms that vary in duration and in the potential amount of the total obligation and, in many circumstances, are not explicitly defined. The Company has not made, nor does it believe that it is probable that it will make, any material payments relating to its indemnifications, and believes that any reasonably possible payments would not have a material adverse effect, individually or in the aggregate, on the Company’s consolidated financial statements taken as a whole.
The Company had not recorded any liabilities on the aforementioned indemnifications as of June 30, 2015 and 2014.
As of June 30, 2015, the Company was a party to letters of credit of $11, primarily related to one of its insurance carriers, of which $0 had been drawn upon.
57
NOTE 12. LEASES AND OTHER COMMITMENTS
The Company leases transportation and manufacturing equipment, certain information technology equipment and various manufacturing, warehousing, and office facilities. The majority of the Company’s leases are classified as operating leases, and the Company’s existing contracts will expire by 2027. The Company expects that, in the normal course of business, existing contracts will be renewed or replaced by other leases. Rental expense for all operating leases was $76, $71 and $71 in fiscal years 2015, 2014 and 2013, respectively.
The future minimum annual lease commitments required under the Company’s existing non-cancelable operating and capital lease agreements as of June 30, 2015, were as follows:
| Year | Operating leases |
Capital leases | ||||
| 2016 | $ | 50 |
|
$ | 3 | |
| 2017 | 46 | 3 | ||||
| 2018 | 42 | 2 | ||||
| 2019 | 34 | 1 | ||||
| 2020 | 29 | - | ||||
| Thereafter | 100 | - | ||||
| Total | $ | 301 | $ | 9 | ||
Included within the future minimum lease commitments for operating leases disclosed above are future minimum rental payments required under the Company’s existing non-cancelable lease agreements for the corporate headquarters and primary research and development facility as of June 30, 2015, in the amounts of $6, $7, $7, $7, $7 and $22 in fiscal years 2016, 2017, 2018, 2019, 2020 and thereafter, respectively.
The Company is also a party to certain purchase obligations, which are defined as purchase agreements that are enforceable and legally binding and that contain specified or determinable significant terms, including quantity, price and the approximate timing of the transaction. Examples of the Company’s purchase obligations include contracts to purchase raw materials, commitments to contract manufacturers, commitments for information technology and related services, advertising contracts, capital expenditure agreements, software acquisition and license commitments and service contracts. The Company enters into purchase obligations during the regular course of business based on expectations of future needs. Many of these purchase obligations contracts are short term in nature and are flexible to allow for changes in the Company’s business and related requirements. As of June 30, 2015, the Company’s purchase obligations totaled $176, $57, $37, $30, $7 and $0 for fiscal years 2016, 2017, 2018, 2019, 2020 and thereafter, respectively.
NOTE 13. STOCKHOLDERS’ EQUITY
On May 13, 2013, the Company’s board of directors terminated the share repurchase programs previously authorized on May 13, 2008, and May 18, 2011, and authorized a new share repurchase program for an aggregate purchase amount of up to $750. This open market share repurchase program is in addition to the Company’s evergreen repurchase program (Evergreen Program), the purpose of which is to offset the impact of stock dilution related to stock-based awards. The Evergreen Program has no authorization limit as to amount or timing of repurchases.
58
NOTE 13. STOCKHOLDERS’ EQUITY (Continued)
Share repurchases under authorized programs were as follows during the fiscal years ended June 30:
| 2015 | 2014 | 2013 | |||||||||||||
| Amount | Shares (in 000's) |
Amount | Shares (in 000's) |
Amount | Shares (in 000's) | ||||||||||
| Open-market purchase programs | $ | - | - | $ | - | - | $ | - | - | ||||||
| Evergreen Program | 434 | 4,016 | 260 | 3,046 | 128 | 1,500 | |||||||||
| Total | $ | 434 | 4,016 | $ | 260 | 3,046 | $ | 128 | 1,500 | ||||||
During fiscal years 2015, 2014 and 2013, the Company declared dividends per share of $2.99, $2.87 and $2.63, respectively, and paid dividends per share of $2.96, $2.84 and $2.56, respectively.
Changes in accumulated other comprehensive net (losses) income by component were as follows for the fiscal years ended June 30:
| 2015 | 2014 | 2013 | |||||||||
| Foreign currency adjustments | |||||||||||
| Other comprehensive (loss) income | |||||||||||
| before reclassifications | $ | (92 | ) | $ | (26 | ) | $ | (16 | ) | ||
| Amounts reclassified from accumulated other | |||||||||||
| comprehensive net losses: | |||||||||||
| Recognition of deferred foreign currency | |||||||||||
| translation loss | 30 | - | - | ||||||||
| Income tax benefit (expense) | 8 | (11 | ) | 5 | |||||||
| Foreign currency adjustments, net of tax | $ | (54 | ) | $ | (37 | ) | $ | (11 | ) | ||
| Net unrealized (losses) gains on derivatives | |||||||||||
| Other comprehensive income (loss) | |||||||||||
| before reclassifications | $ | (18 | ) | $ | (15 | ) | $ | 1 | |||
| Amounts reclassified from accumulated other | |||||||||||
| comprehensive net losses | 7 | - | 3 | ||||||||
| Income tax (expense) benefit | (3 | ) | 6 | (1 | ) | ||||||
| Net unrealized (losses) gains on derivatives, net of tax | $ | (14 | ) | $ | (9 | ) | $ | 3 | |||
| Pension and postretirement benefit adjustments | |||||||||||
| Other comprehensive (loss) income | |||||||||||
| before reclassifications | $ | (29 | ) | $ | (16 | ) | $ | 49 | |||
| Amounts reclassified from accumulated other | |||||||||||
| comprehensive net losses | - | 8 | 10 | ||||||||
| Income tax benefit (expense) | 12 | 4 | (22 | ) | |||||||
| Pension and postretirement benefit adjustments, net of tax | $ | (17 | ) | $ | (4 | ) | $ | 37 | |||
| Total changes in other comprehensive (losses) income, net of tax | $ | (85 | ) | $ | (50 | ) | $ | 29 | |||
59
NOTE 13. STOCKHOLDERS’ EQUITY (Continued)
Included in foreign currency adjustments are re-measurement losses on long-term intercompany loans where settlement is not planned or anticipated in the foreseeable future. For the fiscal years ended June 30, 2015, 2014 and 2013, other comprehensive losses on these loans totaled $9, $12 and $1, respectively, and there were no amounts reclassified from accumulated other comprehensive net (losses) income.
Pension and postretirement benefit reclassification adjustments are reflected in cost of products sold and selling and administrative expenses.
NOTE 14. NET EARNINGS PER SHARE (EPS)
The following is the reconciliation of the weighted average number of shares outstanding (in thousands) used to calculate basic net EPS to those used to calculate diluted net EPS:
| 2015 | 2014 | 2013 | |||
| Basic | 130,310 | 129,558 | 131,075 | ||
| Dilutive effect of stock options and other | 2,466 | 2,184 | 1,894 | ||
| Diluted | 132,776 | 131,742 | 132,969 |
During fiscal years 2015, 2014 and 2013, there were approximately zero stock options and restricted stock units that were considered antidilutive and excluded from the diluted net EPS calculation.
NOTE 15. STOCK-BASED COMPENSATION PLANS
In November 2012, the Company’s stockholders voted to approve the amended and restated 2005 Stock Incentive Plan (the Plan). The Plan permits the Company to grant various nonqualified stock-based compensation awards, including stock options, restricted stock, performance units, deferred stock units, stock appreciation rights and other stock-based awards. The primary amendment reflected in the Plan was an increase of approximately 3 million common shares that may be issued for stock-based compensation purposes. Pursuant to the Plan, the Company is authorized to issue up to 7 million common shares. As of June 30, 2015, approximately 7 million common shares were available for grant under the plan.
Compensation cost and the related income tax benefit recognized for stock-based compensation plans were classified as indicated below for the fiscal years ended June 30.
| 2015 | 2014 | 2013 | ||||||
| Cost of products sold | $ | 4 | $ | 4 | $ | 4 | ||
| Selling and administrative expenses | 25 | 29 | 28 | |||||
| Research and development costs | 3 | 3 | 3 | |||||
| Total compensation cost | $ | 32 | $ | 36 | $ | 35 | ||
| Related income tax benefit | $ | 12 | $ | 13 | $ | 13 | ||
Cash received during fiscal years 2015, 2014 and 2013 from stock options exercised under all stock-based payment arrangements was $230, $86 and $121, respectively. The Company issues shares for stock-based compensation plans from treasury stock. The Company may repurchase shares under its Evergreen Program to offset the estimated impact of share dilution related to stock-based awards (see Note 13).
Details regarding the valuation and accounting for stock options, restricted stock awards, performance units and deferred stock units for non-employee directors follow.
60
NOTE 15. STOCK-BASED COMPENSATION PLANS (Continued)
Stock Options
The fair value of each stock option award granted during fiscal years 2015, 2014 and 2013 was estimated on the date of grant using the Black-Scholes valuation model and assumptions noted in the following table:
| 2015 | 2014 | 2013 | |||
| Expected life | 5.6 to 5.8 years | 5.7 years | 5.7 years | ||
| Weighted-average expected life | 5.7 years | 5.7 years | 5.7 years | ||
| Expected volatility | 16.3% to 18.6% | 18.4% to 18.5% | 18.7% to 19.2% | ||
| Weighted-average volatility | 16.6% | 18.5% | 19.1% | ||
| Risk-free interest rate | 1.4% to 2.0% | 1.8% to 1.9% | 0.6% to 0.8% | ||
| Weighted-average risk-free interest rate | 1.9% | 1.8% | 0.7% | ||
| Dividend yield | 2.8% to 3.4% | 3.4% | 3.2%-3.6% | ||
| Weighted-average dividend yield | 3.3% | 3.4% | 3.6% |
The expected life of the stock options is based on observed historical exercise patterns. Groups of employees having similar historical exercise behavior are considered separately for valuation purposes. The Company estimates stock option forfeitures based on historical data for employee groups. The total number of stock options expected to vest is adjusted by actual and estimated forfeitures.
The expected volatility is based on implied volatility from publicly traded options on the Company’s stock at the date of grant, historical implied volatility of the Company’s publicly traded options and other factors. The risk-free interest rate is based on the implied yield on a U.S. Treasury zero-coupon issue with a remaining term equal to the expected term of the option. The dividend yield is based on the projected annual dividend payment per share, divided by the stock price at the date of grant.
Details of the Company’s stock option activities are summarized below:
| Number
of Shares (In thousands) |
Weighted- Average Exercise Price per Share |
Average Remaining Contractual Life |
Aggregate Intrinsic Value | |||||||
| Options outstanding as of June 30, 2014 | 10,368 | $ | 69 | 6 years | $ | 232 | ||||
| Granted | 1,895 | 91 | ||||||||
| Exercised | (3,605 | ) | 64 | |||||||
| Cancelled | (301 | ) | 82 | |||||||
| Options outstanding as of June 30, 2015 | 8,357 | $ | 76 | 7 years | $ | 236 | ||||
| Options vested as of June 30, 2015 | 4,094 | $ | 68 | 5 years | $ | 148 | ||||
The weighted-average fair value per share of each option granted during fiscal years 2015, 2014 and 2013, estimated at the grant date using the Black-Scholes option pricing model was $9.65, $9.69 and $6.96, respectively. The total intrinsic value of options exercised in fiscal years 2015, 2014 and 2013 was $140, $42 and $45, respectively.
Stock option awards outstanding as of June 30, 2015, have been granted at prices that are equal to the market value of the stock on the date of grant. Stock option grants generally vest over four years and expire no later than ten years after the grant date. The Company recognizes compensation expense ratably over the vesting period. As of June 30, 2015, there was $17 of total unrecognized compensation cost related to non-vested options, which is expected to be recognized over a remaining weighted-average vesting period of one year, subject to forfeiture changes.
61
NOTE 15. STOCK-BASED COMPENSATION PLANS (Continued)
Restricted Stock Awards
The fair value of restricted stock awards is estimated on the date of grant based on the market price of the stock and is amortized to compensation expense on a straight-line basis over the related vesting periods, which are generally three to four years. The total number of restricted stock awards expected to vest is adjusted by actual and estimated forfeitures. Restricted stock grants receive dividend distributions earned during the vesting period upon vesting.
As of June 30, 2015, there was $1 of total unrecognized compensation cost related to non-vested restricted stock awards, which is expected to be recognized over a remaining weighted-average vesting period of one year. The total fair value of the shares that vested in each of the fiscal years 2015, 2014 and 2013 was $1. The weighted-average grant-date fair value of awards granted was $95.67, $89.25 and $72.28 per share for fiscal years 2015, 2014 and 2013, respectively.
A summary of the status of the Company’s restricted stock awards is presented below:
| Number
of Shares (In thousands) |
Weighted-Average Grant Date Fair Value per Share | ||||
| Restricted stock awards as of June 30, 2014 | 21 | $ | 81 | ||
| Granted | 10 | 96 | |||
| Vested | (8 | ) | 78 | ||
| Forfeited | (5 | ) | 81 | ||
| Restricted stock awards as of June 30, 2015 | 18 | $ | 91 | ||
Performance Units
The Company’s performance unit grants provide for the issuance of common stock to certain managerial staff and executive management if the Company achieves certain performance targets. The performance period is three years and the final payout determination is made at the end of the three-year performance period. Performance unit grants receive dividends earned during the vesting period upon vesting.
The fair value of each grant issued is estimated on the date of grant based on the current market price of the stock. The total amount of compensation expense recognized reflects actual and estimated forfeitures, and the initial assumption that performance goals will be achieved. Compensation expense is adjusted, as necessary, on a quarterly basis based on management’s assessment of the probability that performance goals will be achieved. If such goals are not met or it is determined that achievement of performance goals is not probable, any previously recognized compensation expense is adjusted in the current period to reflect the expected payout level. If it is determined that the performance goals will be exceeded, additional compensation expense is recognized, subject to a cap of 150% of the grant day target.
The number of shares issued will be dependent upon vesting and the achievement of specified performance targets. As of June 30, 2015, there was $16 in unrecognized compensation cost related to non-vested performance unit grants that is expected to be recognized over a remaining weighted-average performance period of one year. The weighted-average grant-date fair value of awards granted was $89.75, $84.45 and $72.11 per share for fiscal years 2015, 2014 and 2013, respectively.
62
NOTE 15. STOCK-BASED COMPENSATION PLANS (Continued)
A summary of the status of the Company’s performance unit awards is presented below:
| Number
of Shares (In thousands) |
Weighted-Average Grant Date Fair Value per Share | ||||
| Performance unit awards as of June 30, 2014 | 1,221 | $ | 73 | ||
| Granted | 332 | 90 | |||
| Distributed | (349 | ) | 68 | ||
| Forfeited | (81 | ) | 80 | ||
| Performance unit awards as of June 30, 2015 | 1,123 | $ | 79 | ||
| Performance units vested and deferred as of June 30, 2015 | 179 | $ | 58 | ||
The non-vested performance units outstanding as of June 30, 2015 and 2014 were 944,000 and 1,053,000, respectively, and the weighted average grant date fair value was $81.92 and $74.68 per share, respectively. Total shares vested during fiscal year 2015 were 357,000, which had a weighted average grant date fair value per share of $68.15. During fiscal year 2015, $23 of the vested awards was paid by the issuance of shares and $1 of the vested awards was deferred. Deferred shares continue to earn dividends, which are also deferred. The total fair value of shares vested was $24, $0 and $14 during fiscal years 2015, 2014 and 2013, respectively. Upon vesting, the recipients of the grants receive the distribution as shares or, if previously elected by eligible recipients, as deferred stock.
Deferred Stock Units for Nonemployee Directors
Nonemployee directors receive annual grants of deferred stock units under the Company’s director compensation program and can elect to receive all or a portion of their annual retainers and fees in the form of deferred stock units. The deferred stock units receive dividend distributions, which are reinvested as deferred stock units, and are recognized at their fair value on the date of grant. Each deferred stock unit represents the right to receive one share of the Company’s common stock following the completion of a director’s service.
During fiscal year 2015, the Company granted 14,000 deferred stock units, reinvested dividends of 7,000 units and distributed 14,000 shares, which had a weighted-average fair value on grant date of $103.99, $100.59 and $62.82 per share, respectively. As of June 30, 2015, 241,000 units were outstanding, which had a weighted-average fair value on the grant date of $66.26 per share.
NOTE 16. OTHER INCOME, NET
The major components of other income, net, for the fiscal years ended June 30 were:
| 2015 | 2014 | 2013 | |||||||||
| Income from equity investees | $ | (14 | ) | $ | (13 | ) | $ | (12 | ) | ||
| Low income housing partnership gains, net | (13 | ) | - | (2 | ) | ||||||
| Interest income | (4 | ) | (3 | ) | (3 | ) | |||||
| Income from transition and related services | (1 | ) | (1 | ) | (3 | ) | |||||
| Foreign exchange transaction losses, net | 9 | 1 | 8 | ||||||||
| Amortization of trademarks and other intangible assets | 8 | 8 | 9 | ||||||||
| Intangible asset impairment charges | 3 | 3 | - | ||||||||
| Restructuring charges | 2 | - | - | ||||||||
| Insurance and other settlements | - | (5 | ) | - | |||||||
| Other | (3 | ) | - | (1 | ) | ||||||
| Total | $ | (13 | ) | $ | (10 | ) | $ | (4 | ) | ||
63
NOTE 16. OTHER INCOME, NET (Continued)
Investment in Low-Income Housing Partnerships
The Company owns, directly or indirectly, limited partnership interests in low-income housing partnerships, which are accounted for using the equity method of accounting. The Company’s investment balance as of June 30, 2015 and 2014, was $0 and $4, respectively. These partnerships are considered to be variable interest entities; however, the Company does not consolidate them because it does not have the power to direct the partnerships’ activities that significantly impact their economic performance. The purpose of the partnerships is to develop and operate low-income housing rental properties. The general partners, who typically hold 1% of the partnership interests, are third parties unrelated to the Company and its affiliates, and are responsible for controlling and managing the business and financial operations of the partnerships. As a limited partner, the Company is not responsible for any of the liabilities and obligations of the partnerships nor do the partnerships or their creditors have any recourse to the Company other than for the capital requirements. All available tax benefits from low-income housing tax credits provided by the partnerships were claimed as of fiscal year 2012. The risk that previously claimed low-income housing tax credits might be recaptured or otherwise retroactively invalidated is considered remote.
In April 2015, a low-income housing partnership, in which the Company was a limited partner, sold its real estate holdings. The real property sale resulted in $15 in cash proceeds from investing activities and a gain of $14 recorded to Other income, net, on the consolidated statement of earnings for the year ended June 30, 2015.
NOTE 17. INCOME TAXES
The provision for income taxes on continuing operations, by tax jurisdiction, consisted of the following as of June 30:
| 2015 | 2014 | 2013 | |||||||||
| Current | |||||||||||
| Federal | $ | 265 | $ | 247 | $ | 245 | |||||
| State | 28 | 34 | 23 | ||||||||
| Foreign | 38 | 45 | 19 | ||||||||
| Total current | 331 | 326 | 287 | ||||||||
| Deferred | |||||||||||
| Federal | (13 | ) | (19 | ) | (1 | ) | |||||
| State | (1 | ) | 2 | (2 | ) | ||||||
| Foreign | (2 | ) | (4 | ) | (5 | ) | |||||
| Total deferred | (16 | ) | (21 | ) | (8 | ) | |||||
| Total | $ | 315 | $ | 305 | $ | 279 | |||||
The components of earnings from continuing operations before income taxes, by tax jurisdiction, consisted of the following as of June 30:
| 2015 | 2014 | 2013 | ||||||
| United States | $ | 829 | $ | 754 | $ | 724 | ||
| Foreign | 92 | 130 | 128 | |||||
| Total | $ | 921 | $ | 884 | $ | 852 | ||
64
NOTE 17. INCOME TAXES (Continued)
A reconciliation of the statutory federal income tax rate to the Company’s effective tax rate on continuing operations follows as of June 30:
| 2015 | 2014 | 2013 | |||||||||
| Statutory federal tax rate | 35.0 | % | 35.0 | % | 35.0 | % | |||||
| State taxes (net of federal tax benefits) | 2.1 | 2.6 | 1.7 | ||||||||
| Tax differential on foreign earnings | (0.3 | ) | (0.3 | ) | (2.9 | ) | |||||
| Domestic manufacturing deduction | (2.1 | ) | (2.3 | ) | (2.3 | ) | |||||
| Change in valuation allowance | 0.6 | 0.6 | 0.7 | ||||||||
| Other differences | (1.1 | ) | (1.0 | ) | 0.5 | ||||||
| Effective tax rate | 34.2 | % | 34.6 | % | 32.7 | % | |||||
The lower effective tax rate for fiscal year 2015 compared to fiscal year 2014 was primarily due to higher uncertain tax position releases, partially offset by higher tax on foreign earnings.
Applicable U.S. income taxes and foreign withholding taxes have not been provided on approximately $204 of undistributed earnings of certain foreign subsidiaries as of June 30, 2015, because these earnings are considered indefinitely reinvested. The estimated net federal income tax liability that could arise if these earnings were not indefinitely reinvested is approximately $54. Applicable U.S. income and foreign withholding taxes are provided on these earnings in the periods in which they are no longer considered indefinitely reinvested.
Tax benefits resulting from stock-based payment arrangements that are in excess of the tax benefits recorded in net earnings over the vesting period of those arrangements (excess tax benefits) are recorded as increases to additional paid-in capital. Excess tax benefits of approximately $42, $11, and $11, were realized and recorded to additional paid-in capital for fiscal years 2015, 2014 and 2013, respectively.
The components of net deferred tax assets (liabilities) as of June 30 are shown below:
| 2015 | 2014 | ||||||
| Deferred tax assets | |||||||
| Compensation and benefit programs | $ | 191 | $ | 171 | |||
| Basis difference related to Venture Agreement | 30 | 30 | |||||
| Accruals and reserves | 43 | 53 | |||||
| Inventory costs | 19 | 20 | |||||
| Net operating loss and tax credit carryforwards | 41 | 37 | |||||
| Other | 61 | 63 | |||||
| Subtotal | 385 | 374 | |||||
| Valuation allowance | (34 | ) | (51 | ) | |||
| Total deferred tax assets | 351 | 323 | |||||
| Deferred tax liabilities | |||||||
| Fixed and intangible assets | (277 | ) | (269 | ) | |||
| Low-income housing partnerships | (22 | ) | (24 | ) | |||
| Unremitted foreign earnings | (7 | ) | (8 | ) | |||
| Other | (24 | ) | (26 | ) | |||
| Total deferred tax liabilities | (330 | ) | (327 | ) | |||
| Net deferred tax assets (liabilities) | $ | 21 | $ | (4 | ) | ||
65
NOTE 17. INCOME TAXES (Continued)
The Company periodically reviews its deferred tax assets for recoverability. A valuation allowance is established when the Company believes that it is more likely than not that some portion of its deferred tax assets will not be realized. Valuation allowances have been provided to reduce deferred tax assets to amounts considered recoverable. Details of the valuation allowance were as follows as of June 30:
| 2015 | 2014 | ||||||
| Valuation allowance at beginning of year | $ | (51 | ) | $ | (36 | ) | |
| Net decrease/(increase) for other foreign deferred tax assets | 15 | (12 | ) | ||||
| Net decrease/(increase) for foreign net operating loss carryforwards and tax credits | 2 | (3 | ) | ||||
| Valuation allowance at end of year | $ | (34 | ) | $ | (51 | ) | |
As of June 30, 2015, the Company had foreign tax credit carryforwards of $24 for U.S. income tax purposes with expiration dates between fiscal years 2023 and 2025. Tax credit carryforwards in foreign jurisdictions of $18 have expiration dates in fiscal year 2016. Tax benefits from foreign net operating loss carryforwards of $13 have expiration dates between fiscal years 2016 and 2025. Tax benefits from foreign net operating loss carryforwards of $10 may be carried forward indefinitely.
The Company files income tax returns in the U.S. federal and various state, local and foreign jurisdictions. The federal statute of limitations has expired for all tax years through June 30, 2011. Various income tax returns in state and foreign jurisdictions are currently in the process of examination.
The Company recognizes interest and penalties related to uncertain tax positions as a component of income tax expense. As of June 30, 2015 and 2014, the total balance of accrued interest and penalties related to uncertain tax positions was $10 and $11, respectively. Interest and penalties related to uncertain tax positions included in income tax expense resulted in a net benefit of $1, a net expense of $3, and a net expense of $1 in fiscal years 2015, 2014 and 2013, respectively.
The following is a reconciliation of the beginning and ending amounts of the Company’s gross unrecognized tax benefits:
| 2015 | 2014 | 2013 | |||||||||
| Unrecognized tax benefits at beginning of year | $ | 71 | $ | 69 | $ | 80 | |||||
| Gross increases - tax positions in prior periods | 3 | 3 | 3 | ||||||||
| Gross decreases - tax positions in prior periods | (8 | ) | (5 | ) | (19 | ) | |||||
| Gross increases - current period tax positions | 6 | 7 | 7 | ||||||||
| Gross decreases - current period tax positions | - | - | - | ||||||||
| Lapse of applicable statute of limitations | (34 | ) | (1 | ) | (2 | ) | |||||
| Settlements | - | (2 | ) | - | |||||||
| Unrecognized tax benefits at end of year | $ | 38 | $ | 71 | $ | 69 | |||||
66
NOTE 17. INCOME TAXES (Continued)
Included in the balance of unrecognized tax benefits as of June 30, 2015, 2014 and 2013, are potential benefits of $27, $58 and $56, respectively, which if recognized, would affect net earnings. During the fiscal year ended June 30, 2015, $32 of gross unrecognized tax benefits relating to other discontinued operations for periods prior to fiscal year 2015 were recognized upon the expiration of the applicable statute of limitations. Recognition of these previously disclosed tax benefits had no impact on the Company’s cash flow or earnings from continuing operations for the fiscal years ended June 30, 2015, 2014 and 2013.
NOTE 18. EMPLOYEE BENEFIT PLANS
Retirement Income Plans
Effective July 1, 2011, and as part of a set of long-term, cost-neutral enhancements to the Company’s overall employee benefit plans, the domestic qualified retirement income pension plan was frozen for service accrual and eligibility purposes for most participants, however, interest credits have continued to accrue on participant balances. As of June 30, 2015 and 2014, the benefits of the domestic qualified plan are based on either employee years of service and compensation or a stated dollar amount per year of service. The Company is the sole contributor to the plan in amounts deemed necessary to provide benefits and to the extent deductible for federal income tax purposes. Assets of the plan consist primarily of investments in cash equivalents and common collective trusts.
The Company did not make any contributions to its domestic qualified retirement income plan during fiscal years 2015, 2014 and 2013. The Company’s funding policy for its qualified plans is to contribute amounts sufficient to meet minimum funding requirements as set forth in employee benefit tax laws plus additional amounts as the Company may determine to be appropriate. Subsequent to June 30, 2015, the Company made a $15 discretionary contribution to the pension plan.
Contributions made to the domestic nonqualified retirement income plans were $13, $13 and $11 in fiscal years 2015, 2014 and 2013, respectively. Contributions made to the foreign retirement income plans were $1, $2 and $1 in fiscal years 2015, 2014 and 2013, respectively.
Retirement Health Care Plans
The Company provides certain health care benefits for employees who meet age, participation and length of service requirements at retirement. The plans pay stated percentages of covered expenses after annual deductibles have been met or stated reimbursements up to a specified dollar subsidy amount. Benefits paid take into consideration payments by Medicare for the domestic plan. The plans are funded as claims are paid, and the Company has the right to modify or terminate certain plans.
The assumed domestic health care cost trend rate used in measuring the accumulated postretirement benefit obligation was 7.1% for medical and 7.2% for prescription drugs for fiscal year 2015. These rates have been assumed to gradually decrease each year until an assumed ultimate trend of 4.5% is reached in 2028. The health care cost trend rate assumption has a minimal effect on the amounts reported due primarily to the existence of benefit cap provisions in the Company’s domestic plan. As such, the effect of a hypothetical 100 basis point increase or decrease in the assumed domestic health care cost trend rate on the total service and interest cost components as well as the postretirement benefit obligation would have been immaterial for each of the fiscal years ended June 30, 2015, 2014 and 2013.
67
Financial Information Related to Retirement Income and Retirement Health Care
Summarized information for the Company’s retirement income and retirement health care plans as of and for the fiscal years ended June 30 is as follows:
| Retirement Income |
Retirement Health Care | |||||||||||||||
| 2015 | 2014 | 2015 | 2014 | |||||||||||||
| Change in benefit obligations: | ||||||||||||||||
| Projected benefit obligation as of beginning of year | $ | 641 | $ | 612 | $ | 49 | $ | 51 | ||||||||
| Service cost | 2 | 3 | - | 1 | ||||||||||||
| Interest cost | 25 | 27 | 2 | 2 | ||||||||||||
| Actuarial loss (gain) | 14 | 47 | - | (2 | ) | |||||||||||
| Plan amendments | - | - | (1 | ) | (2 | ) | ||||||||||
| Translation and other adjustments | (5 | ) | (6 | ) | (2 | ) | - | |||||||||
| Benefits paid | (38 | ) | (42 | ) | (3 | ) | (1 | ) | ||||||||
| Projected benefit obligation as of end of year | 639 | 641 | 45 | 49 | ||||||||||||
| Change in plan assets: | ||||||||||||||||
| Fair value of assets as of beginning of year | $ | 432 | $ | 408 | $ | - | $ | - | ||||||||
| Actual return on plan assets | 6 | 51 | - | - | ||||||||||||
| Employer contributions to nonqualified plans | 13 | 15 | 3 | 1 | ||||||||||||
| Benefits paid | (38 | ) | (42 | ) | (3 | ) | (1 | ) | ||||||||
| Translation adjustment | (4 | ) | - | - | - | |||||||||||
| Fair value of plan assets as of end of year | 409 | 432 | - | - | ||||||||||||
| Accrued benefit cost, net funded status | $ | (230 | ) | $ | (209 | ) | $ | (45 | ) | $ | (49 | ) | ||||
| Amount recognized in the balance sheets consists of: | ||||||||||||||||
| Pension benefit assets | $ | 2 | $ | 2 | $ | - | $ | - | ||||||||
| Current accrued benefit liability | (16 | ) | (14 | ) | (3 | ) | (4 | ) | ||||||||
| Non-current accrued benefit liability | (216 | ) | (197 | ) | (42 | ) | (45 | ) | ||||||||
| Accrued benefit cost, net | $ | (230 | ) | $ | (209 | ) | $ | (45 | ) | $ | (49 | ) | ||||
| Pension Plans | Other Retirement Plans | |||||||||||
| 2015 | 2014 | 2015 | 2014 | |||||||||
| Projected benefit obligation | $ | 538 | $ | 538 | $ | 80 | $ | 78 | ||||
| Accumulated benefit obligation | 538 | 538 | 80 | 78 | ||||||||
| Fair value of plan assets | 385 | 405 | - | - | ||||||||
68
| Retirement Income | Retirement Health Care | ||||||||||||||||||||||
| 2015 | 2014 | 2013 | 2015 | 2014 | 2013 | ||||||||||||||||||
| Service cost | $ | 2 | $ | 3 | $ | 4 | $ | - | $ | 1 | $ | 1 | |||||||||||
| Interest cost | 25 | 27 | 24 | 2 | 2 | 2 | |||||||||||||||||
| Expected return on plan assets | (20 | ) | (25 | ) | (29 | ) | - | - | - | ||||||||||||||
| Amortization of unrecognized items | 12 | 11 | 12 | 2 | (4 | ) | (2 | ) | |||||||||||||||
| Total | $ | 19 | $ | 16 | $ | 11 | $ | 4 | $ | (1 | ) | $ | 1 | ||||||||||
| Retirement Income |
Retirement Health Care | |||||||
| Net actuarial loss (gain) | $ | 264 | $ | (17 | ) | |||
| Prior service benefit | - | (7 | ) | |||||
| Net deferred income tax (assets) liabilities | (98 | ) | 8 | |||||
| Accumulated other comprehensive loss (income) | $ | 166 | $ | (16 | ) | |||
| Retirement Income |
Retirement Health Care | |||||||
| Net actuarial loss (gain) as of beginning of year | $ | 247 | $ | (29 | ) | |||
| Amortization during the year | (12 | ) | 13 | |||||
| Loss (gain) during the year | 29 | (1 | ) | |||||
| Net actuarial loss (gain) as of end of year | $ | 264 | $ | (17 | ) | |||
| Retirement Income | Retirement Health Care | |||||||||||
| 2015 | 2014 | 2015 | 2014 | |||||||||
| Discount rate | 4.20 | % | 4.05 | % | 4.16 | % | 4.00 | % | ||||
| Rate of compensation increase | 3.37 | % | 4.46 | % | n/a | n/a | ||||||
NOTE 18. EMPLOYEE BENEFIT PLANS (Continued)
Weighted-average assumptions used to estimate the net periodic pension and other postretirement benefit costs as of June 30 were as follows:
| Retirement Income | |||||||||
| 2015 | 2014 | 2013 | |||||||
| Discount rate | 4.05 | % | 4.39 | % | 3.87 | % | |||
| Rate of compensation increase | 4.46 | % | 3.44 | % | 3.71 | % | |||
| Expected return on plan assets | 5.28 | % | 6.61 | % | 7.50 | % | |||
| Retirement Health Care | |||||||||
| 2015 | 2014 | 2013 | |||||||
| Discount rate | 4.00 | % | 4.33 | % | 3.86 | % | |||
The expected long-term rate of return assumption is based on an analysis of historical experience of the portfolio and the summation of prospective returns for each asset class in proportion to the fund’s current asset allocation.
Expected benefit payments for the Company’s pension and other postretirement plans as of June 30, 2015, were as follows:
| Retirement Income |
Retirement Health Care | |||||
| 2016 | $ | 41 | $ | 4 | ||
| 2017 | 42 | 3 | ||||
| 2018 | 43 | 3 | ||||
| 2019 | 40 | 3 | ||||
| 2020 | 41 | 3 | ||||
| Fiscal years 2021 through 2025 | 210 | 12 | ||||
Expected benefit payments are based on the same assumptions used to measure the benefit obligations and include estimated future employee service.
The target allocations and weighted average asset allocations by asset category of the investment portfolio for the Company’s domestic retirement income plans as of June 30 were:
| % Target Allocation | % of Plan Assets | |||||||||||
| 2015 | 2014 | 2015 | 2014 | |||||||||
| U.S. equity | 11 | % | 11 | % | 11 | % | 11 | % | ||||
| International equity | 12 | 12 | 12 | 12 | ||||||||
| Fixed income | 74 | 74 | 74 | 74 | ||||||||
| Other | 3 | 3 | 3 | 3 | ||||||||
| Total | 100 | % | 100 | % | 100 | % | 100 | % | ||||
The target asset allocation is determined based on the optimal balance between risk and return and, at times, may be adjusted to achieve the plan’s overall investment objective to generate sufficient resources to pay current and projected plan obligations over the life of the domestic qualified retirement income plan.
70
| 2015 | |||||||||
| Level 1 | Level 2 | Total | |||||||
| Cash equivalents | $ | 3 | $ | - | $ | 3 | |||
| Common collective trusts | |||||||||
| Bond funds | - | 295 | 295 | ||||||
| International equity funds | - | 59 | 59 | ||||||
| Domestic equity funds | - | 41 | 41 | ||||||
| Real estate fund | - | 11 | 11 | ||||||
| Total common collective trusts | - | 406 | 406 | ||||||
| Total assets at fair value | $ | 3 | $ | 406 | $ | 409 | |||
| 2014 | |||||||||
| Level 1 | Level 2 | Total | |||||||
| Cash equivalents | $ | 3 | $ | - | $ | 3 | |||
| Common collective trusts | |||||||||
| Bond funds | - | 309 | 309 | ||||||
| International equity funds | - | 64 | 64 | ||||||
| Domestic equity funds | - | 44 | 44 | ||||||
| Real estate fund | - | 12 | 12 | ||||||
| Total common collective trusts | - | 429 | 429 | ||||||
| Total assets at fair value | $ | 3 | $ | 429 | $ | 432 | |||
| ● | Cleaning consists of laundry, home care and professional products marketed and sold in the United States. Products within this segment include laundry additives, including bleach products under the Clorox® brand and Clorox 2® stain fighter and color booster; home care products, primarily under the Clorox®, Formula 409®, Liquid-Plumr®, Pine-Sol®, S.O.S® and Tilex® brands; naturally derived products under the Green Works® brand; and professional cleaning and disinfecting products under the Clorox®, Dispatch®, Aplicare®, HealthLink® and Clorox Healthcare® brands. |
| NOTE 19. SEGMENT REPORTING (Continued) |
| ● | Household consists of charcoal, cat litter and plastic bags, wraps and container products marketed and sold in the United States. Products within this segment include plastic bags, wraps and containers under the Glad® brand; cat litter products under the Fresh Step®, Scoop Away® and Ever Clean® brands; and charcoal products under the Kingsford® and Match Light® brands. |
| ● | Lifestyle consists of food products, water-filtration systems and filters, and natural personal care products marketed and sold in the United States. Products within this segment include dressings and sauces, primarily under the Hidden Valley®, KC Masterpiece® and Soy Vay® brands; water-filtration systems and filters under the Brita® brand; and natural personal care products under the Burt’s Bees® brand. |
| ● | International consists of products sold outside the United States. Products within this segment include laundry, home care, water-filtration, charcoal and cat litter products, dressings and sauces, plastic bags, wraps and containers and natural personal care products, primarily under the Clorox®, Glad®, PinoLuz®, Ayudin®, Limpido®, Clorinda®, Poett®, Mistolin®, Lestoil®, Bon Bril®, Brita®, Green Works®, Pine-Sol®, Agua Jane®, Chux®, Kingsford®, Fresh Step®, Scoop Away®, Ever Clean®, KC Masterpiece®, Hidden Valley® and Burt’s Bees® brands. |
Certain non-allocated administrative costs, interest income, interest expense and various other non-operating income and expenses are reflected in Corporate. Corporate assets include cash and cash equivalents, property and equipment, other investments and deferred taxes.
| Year | Cleaning | Household | Lifestyle | International | Corporate | Company | |||||||||||||||
| Net sales | 2015 | $ | 1,824 | $ | 1,794 | $ | 950 | $ | 1,087 | $ | - | $ | 5,655 | ||||||||
| 2014 | 1,776 | 1,709 | 936 | 1,093 | - | 5,514 | |||||||||||||||
| 2013 | 1,783 | 1,693 | 929 | 1,128 | - | 5,533 | |||||||||||||||
| Earnings (losses) from continuing | |||||||||||||||||||||
| operations before income taxes | 2015 | 445 | 375 | 257 | 79 | (235 | ) | 921 | |||||||||||||
| 2014 | 428 | 326 | 258 | 99 | (227 | ) | 884 | ||||||||||||||
| 2013 | 420 | 336 | 259 | 95 | (258 | ) | 852 | ||||||||||||||
| Income from equity investees | 2015 | - | - | - | 14 | - | 14 | ||||||||||||||
| 2014 | - | - | - | 13 | - | 13 | |||||||||||||||
| 2013 | - | - | - | 12 | - | 12 | |||||||||||||||
| Total assets | 2015 | 876 | 725 | 860 | 1,057 | 646 | 4,164 | ||||||||||||||
| 2014 | 887 | 745 | 869 | 1,190 | 567 | 4,258 | |||||||||||||||
| Capital expenditures | 2015 | 35 | 50 | 11 | 25 | 4 | 125 | ||||||||||||||
| 2014 | 37 | 53 | 11 | 31 | 5 | 137 | |||||||||||||||
| 2013 | 57 | 72 | 19 | 24 | 18 | 190 | |||||||||||||||
| Depreciation and amortization | 2015 | 52 | 67 | 19 | 24 | 7 | 169 | ||||||||||||||
| 2014 | 49 | 67 | 19 | 25 | 17 | 177 | |||||||||||||||
| 2013 | 52 | 69 | 19 | 26 | 14 | 180 | |||||||||||||||
| Significant noncash charges included | |||||||||||||||||||||
| in earnings from continuing | |||||||||||||||||||||
| operations before income taxes: | |||||||||||||||||||||
| Share-based compensation | 2015 | 8 | 7 | 4 | 1 | 12 | 32 | ||||||||||||||
| 2014 | 11 | 9 | 5 | 1 | 10 | 36 | |||||||||||||||
| 2013 | 10 | 9 | 5 | 1 | 10 | 35 | |||||||||||||||
72
NOTE 19. SEGMENT REPORTING (Continued)
All intersegment sales are eliminated and are not included in the Company’s reportable segments’ net sales.
Net sales to the Company’s largest customer, Walmart Stores, Inc. and its affiliates, were 26%, 27% and 27% of consolidated net sales for each of the fiscal years ended June 30, 2015, 2014 and 2013, respectively, and occurred in each of the Company’s reportable segments. No other customers accounted for more than 10% of consolidated net sales in any of these fiscal years. During fiscal years 2015, 2014 and 2013, the Company’s five largest customers accounted for 45% of its consolidated net sales for each of the three fiscal years.
Three of the Company’s product lines have accounted for 10% or more of consolidated net sales during each of the past three fiscal years. In fiscal years 2015, 2014 and 2013, sales of liquid bleach represented approximately 14%, 13% and 14% of the Company’s consolidated net sales, respectively, approximately 26% of net sales in the Cleaning segment for each such years, and approximately 27%, 28% and 28% of net sales in the International segment, respectively. Sales of trash bags represented approximately 14%, 13% and 13% of the Company’s consolidated net sales in each of the fiscal years 2015, 2014 and 2013, respectively, approximately 38%, 36% and 37% of net sales in the Household segment, respectively, and approximately 8%, 8% and 10% of net sales in the International segment, respectively. Sales of charcoal represented approximately 11%, 11% and 10% of the Company’s consolidated net sales and approximately 34%, 34% and 32% of net sales in the Household segment in fiscal years 2015, 2014 and 2013, respectively.
Net sales and property, plant and equipment, net, by geographic area as of and for the fiscal years ended June 30 were as follows:
| Fiscal Year |
United States |
Foreign | Total Company | ||||||||
| Net sales | 2015 | $ | 4,609 | $ | 1,046 | $ | 5,655 | ||||
| 2014 | 4,466 | 1,048 | 5,514 | ||||||||
| 2013 | 4,448 | 1,085 | 5,533 | ||||||||
| Property, plant and equipment, net | 2015 | $ | 801 | $ | 117 | $ | 918 | ||||
| 2014 | 825 | 152 | 977 | ||||||||
NOTE 20. RELATED PARTY TRANSACTIONS
The Company holds various equity investments with ownership percentages of up to 50% in a number of consumer products businesses, most of which operate outside the United States. The Company has no ongoing capital commitments, loan requirements, guarantees or any other types of arrangements under the terms of its agreements that would require any future cash contributions or disbursements arising out of an equity investment.
Transactions with the Company’s equity investees typically represent payments for contract manufacturing and purchases of raw materials. Payments to related parties, including equity investees, for such transactions during the fiscal years ended June 30, 2015, 2014 and 2013 were $55, $57 and $50, respectively. Receipts from and ending accounts receivable and payable balances related to the Company’s related parties were not significant during or as of the end of each of the fiscal years presented.
73
NOTE 21. UNAUDITED QUARTERLY DATA
| Quarters Ended | ||||||||||||||||||||
| September 30 | December 31 | March 31 | June 30 | Total Year | ||||||||||||||||
| Fiscal year ended June 30, 2015 | ||||||||||||||||||||
| Net sales | $ | 1,352 | $ | 1,345 | $ | 1,401 | $ | 1,557 | $ | 5,655 | ||||||||||
| Cost of products sold | $ | 774 | $ | 773 | $ | 796 | $ | 847 | $ | 3,190 | ||||||||||
| Earnings from continuing operations | $ | 145 | $ | 128 | $ | 144 | $ | 189 | $ | 606 | ||||||||||
| (Losses) earnings from discontinued operations, | ||||||||||||||||||||
| net of tax | $ | (55 | ) | $ | (3 | ) | $ | 30 | $ | 2 | $ | (26 | ) | |||||||
| Net earnings | $ | 90 | $ | 125 | $ | 174 | $ | 191 | $ | 580 | ||||||||||
| Per common share: | ||||||||||||||||||||
| Basic | ||||||||||||||||||||
| Continuing operations | $ | 1.12 | $ | 0.98 | $ | 1.09 | $ | 1.46 | $ | 4.65 | ||||||||||
| Discontinued operations | (0.42 | ) | (0.02 | ) | 0.22 | 0.02 | (0.20 | ) | ||||||||||||
| Basic net earnings per share | $ | 0.70 | $ | 0.96 | $ | 1.31 | $ | 1.48 | $ | 4.45 | ||||||||||
| Diluted | ||||||||||||||||||||
| Continuing operations | $ | 1.10 | $ | 0.97 | $ | 1.08 | $ | 1.44 | $ | 4.57 | ||||||||||
| Discontinued operations | (0.42 | ) | (0.02 | ) | 0.22 | 0.02 | (0.20 | ) | ||||||||||||
| Diluted net earnings per share | $ | 0.68 | $ | 0.95 | $ | 1.30 | $ | 1.46 | $ | 4.37 | ||||||||||
| Dividends declared per common share | $ | 0.74 | $ | 0.74 | $ | 0.74 | $ | 0.77 | $ | 2.99 | ||||||||||
| Market price (NYSE) | ||||||||||||||||||||
| High | $ | 112.70 | $ | 112.65 | $ | 106.36 | $ | 98.31 | $ | 112.70 | ||||||||||
| Low | 103.77 | 102.95 | 95.19 | 86.03 | 86.03 | |||||||||||||||
| Year-end | 104.02 | |||||||||||||||||||
| Fiscal year ended June 30, 2014 | ||||||||||||||||||||
| Net sales | $ | 1,343 | $ | 1,308 | $ | 1,366 | $ | 1,497 | $ | 5,514 | ||||||||||
| Cost of products sold | $ | 759 | $ | 753 | $ | 791 | $ | 855 | $ | 3,158 | ||||||||||
| Earnings from continuing operations | $ | 139 | $ | 118 | $ | 151 | $ | 171 | $ | 579 | ||||||||||
| Losses from discontinued operations, | ||||||||||||||||||||
| net of tax | $ | (3 | ) | $ | (3 | ) | $ | (14 | ) | $ | (1 | ) | $ | (21 | ) | |||||
| Net earnings | $ | 136 | $ | 115 | $ | 137 | $ | 170 | $ | 558 | ||||||||||
| Per common share: | ||||||||||||||||||||
| Basic | ||||||||||||||||||||
| Continuing operations | $ | 1.07 | $ | 0.91 | $ | 1.16 | $ | 1.32 | $ | 4.47 | ||||||||||
| Discontinued operations | (0.03 | ) | (0.02 | ) | (0.11 | ) | - | (0.16 | ) | |||||||||||
| Basic net earnings per share | $ | 1.04 | $ | 0.89 | $ | 1.05 | $ | 1.32 | $ | 4.31 | ||||||||||
| Diluted | ||||||||||||||||||||
| Continuing operations | $ | 1.05 | $ | 0.90 | $ | 1.14 | $ | 1.30 | $ | 4.39 | ||||||||||
| Discontinued operations | (0.02 | ) | (0.03 | ) | (0.10 | ) | (0.01 | ) | (0.16 | ) | ||||||||||
| Diluted net earnings per share | $ | 1.03 | $ | 0.87 | $ | 1.04 | $ | 1.29 | $ | 4.23 | ||||||||||
| Dividends declared per common share | $ | 0.71 | $ | 0.71 | $ | 0.71 | $ | 0.74 | $ | 2.87 | ||||||||||
| Market price (NYSE) | ||||||||||||||||||||
| High | $ | 87.60 | $ | 96.76 | $ | 92.75 | $ | 93.43 | $ | 96.76 | ||||||||||
| Low | 81.25 | 80.20 | 83.70 | 86.56 | 80.20 | |||||||||||||||
| Year-end | 91.40 | |||||||||||||||||||
74
FIVE-YEAR FINANCIAL SUMMARY
The Clorox
Company
| Years ended June 30 | ||||||||||||||||||
| Dollars in millions, except per share data | 2015 | 2014 | 2013 | 2012 | 2011 (1)(2) | |||||||||||||
| OPERATIONS | ||||||||||||||||||
| Net sales | $ | 5,655 | $ | 5,514 | $ | 5,533 | $ | 5,379 | $ | 5,144 | ||||||||
| Gross profit | 2,465 | 2,356 | 2,391 | 2,272 | 2,232 | |||||||||||||
| Earnings from continuing operations | $ | 606 | $ | 579 | $ | 573 | $ | 535 | $ | 268 | ||||||||
| (Losses) earnings from discontinued operations, | ||||||||||||||||||
| net of tax | (26 | ) | (21 | ) | (1 | ) | 6 | 289 | ||||||||||
| Net earnings | $ | 580 | $ | 558 | $ | 572 | $ | 541 | $ | 557 | ||||||||
| COMMON STOCK | ||||||||||||||||||
| Earnings per share | ||||||||||||||||||
| Continuing operations | ||||||||||||||||||
| Basic | $ | 4.65 | $ | 4.47 | $ | 4.37 | $ | 4.09 | $ | 1.96 | ||||||||
| Diluted | 4.57 | 4.39 | 4.31 | 4.05 | 1.94 | |||||||||||||
| Dividends declared per share | $ | 2.99 | $ | 2.87 | $ | 2.63 | $ | 2.44 | $ | 2.25 | ||||||||
| As of June 30 | ||||||||||||||||||
| Dollars in millions | 2015 | 2014 | 2013 | 2012 | 2011 (1)(2) | |||||||||||||
| OTHER DATA | ||||||||||||||||||
| Total assets | $ | 4,164 | $ | 4,258 | $ | 4,311 | $ | 4,355 | $ | 4,163 | ||||||||
| Long-term debt | 1,796 | 1,595 | 2,170 | 1,571 | 2,125 | |||||||||||||
| (1) | In November 2010, the Company completed the sale of its global auto care businesses pursuant to the terms of a Purchase and Sale Agreement and received cash consideration of $755. Included in earnings from discontinued operations for the fiscal year ended June 30, 2011, is an after-tax gain on the transaction of $247. |
| (2) | Earnings from continuing operations and net earnings included the $258 noncash goodwill impairment charge recognized in fiscal year 2011 related to the Burt’s Bees® business. Diluted net earnings per share from continuing operations included the impact of $1.86 from this noncash goodwill impairment charge. |
75